an analysis of the number of voters per voting...
TRANSCRIPT

A Report for The Board of Elections in the City of New York
An Analysis of the Number of Voters per Voting Machine
21 August 2006 Engagement: 221001231
NYC BOE Voters Per Machine Report v-34.2 Final.doc Page 1

The Board of Elections in the City of New York 21 August 2006
Table of Contents 1.0 Introduction ..................................................................................................2
1.1 Voting Device Replacement Mandate ....................................................................... 2 1.2 Report Objectives ...................................................................................................... 2 1.3 Voting Device Technologies ...................................................................................... 2 1.4 Report Methodology .................................................................................................. 3
1.4.1 Overall Approach................................................................................................... 3 1.4.2 Methods of Calculation.......................................................................................... 3
1.4.2.1 For Pollsite Optical Scan Technology ......................................................... 4 1.4.2.2 For Direct Recording Electronic (DREs) ..................................................... 4
1.5 Parameters to Voting Machine Capacities ................................................................ 4 1.6 Limited Report Scope ................................................................................................ 5
2.0 Survey of Other Jurisdictions .....................................................................6 2.1 Survey Methodology.................................................................................................. 6 2.2 Published Data .......................................................................................................... 6 2.3 Telephone Survey ..................................................................................................... 7 2.4 Average Number of Registered Voters Based on Survey ......................................... 8
2.4.1 Average Registered Voters per Optical Scan Voting Machine.............................. 8 2.4.2 Average Registered Voters per Paging Touch Screen DRE................................. 9 2.4.3 Average Registered Voters per Full-Face Paper Overlay DRE ............................ 9 2.4.4 Average Registered Voters per Full-Face Touch Screen DRE ........................... 10
2.5 Survey Key Findings................................................................................................ 10 2.6 Survey Data Assumptions ....................................................................................... 10
3.0 Estimation of Machines Required in NYC ................................................11 3.1 Current NYC Data & Average Registered Voters per Lever Machine ..................... 12 3.2 Pollsite Optical Scan Machines ............................................................................... 12
3.2.1 Calculation of Optical Scan Machines Required in NYC..................................... 12 3.2.2 Key Assumptions................................................................................................. 13
3.3 Full-Face Paper Ballot Overlay DRE Machines....................................................... 13 3.3.1 Key Assumptions................................................................................................. 15
3.4 Full-Face Touch Screen DRE Machines ................................................................. 15 3.4.1 Key Assumptions................................................................................................. 16
3.5 Summary of Machines Required ............................................................................. 17 4.0 Determination of the Maximums...............................................................18
4.1 Introduction.............................................................................................................. 18 4.2 Pollsite Optical Scan Machines ............................................................................... 18 4.3 Full-Face Paper Ballot Overlay DRE Machines....................................................... 19 4.4 Full-Face Touch Screen DRE Machines ................................................................. 19
5.0 Summary.....................................................................................................19 5.1 Summary of Survey of Average Number of Registered Voter per Machine ............ 19 5.2 Summary of Analysis Results.................................................................................. 19 5.3 Final Observations................................................................................................... 20
5.3.1 NYC Average Number of Voters Per ED is Lower Than Other Jurisdictions ...... 20 5.3.2 NYC ED & Pollsite Configuration Optimized for Current Lever Machines........... 20
6.0 Appendix A – Voting Machine Pollsite Calculations for NYC.................21
NYC BOE Voters Per Machine Report v-34.2 Final.doc Page 1

The Board of Elections in the City of New York 21 August 2006
1.0 Introduction
1.1 Voting Device Replacement Mandate In accordance with the Help America Vote Act (HAVA) and New York State Election Law, the current mechanical full-face lever voting machines used in New York City and elsewhere in New York State, will no longer be permitted for elections conducted in 2007. They will need to be replaced with newer voting technology devices. Current New York State Election Law, however, stipulates that counties must allocate voting machines such that no more than a maximum of 800 registered voters (maximum) are allocated for each voting machine. There are different voting system technologies allowed under New York Election Law with differing processing capacities. Further, the City of New York is interested in determining how many machines, given their differing capacities, it would need to acquire to operate elections efficiently using each of the allowed voting system technologies.
1.2 Report Objectives The objectives of this report are to:
Estimate Number of Machines for NYC - Estimate the number of machines that will likely be required to accomplish full replacement of the lever machines in NYC. To estimate how many machines are needed for NYC, it will be necessary to estimate rates of voting per type of machine and apply that to NYC voting population and configuration.
Estimate Maximum Registered Voters Per Machine for NYS - Estimate the maximum number of registered voters per machine by type of machine that would be reasonable for New York State. Given that lever voting machines will no longer be permitted in New York State and given that full-face DREs but not other types of DREs will be permitted in NYS, what should the maximum number of registered voters (by type of technology) be for NYS?
1.3 Voting Device Technologies In order to understand the implications of the replacement of current voting machines in terms of the number of devices required and the maximum number of registered voters per machine, it is first necessary to understand the types of voting technologies.
New York State Election Law permits replacement of current lever machines with either of two major pollsite voting technologies:
Pollsite Optical Scan Systems
Direct Recording Electronic (DRE) Systems.
The Federal Election Assistance Commission (EAC) defines these technologies as follows1:
1. Pollsite Optical Scan Voting Systems: System by which votes are recorded by means of marks made in voting response fields designated on one or both faces of a ballot card [paper] or series of cards. An optical scan system reads and tabulates ballots, usually paper ballots, by scanning the ballot and interpreting the contents. Also known as
1 EAC Voluntary Voting System Guidelines: Volume I – Voting System Performances Guidelines. Appendix A – Glossary
NYC BOE Voters Per Machine Report v-34.2 Final.doc Page 2

The Board of Elections in the City of New York 21 August 2006
marksense. A pollsite optical scan system also produces a tabulation of the voting data stored in a removable memory component and in printed hardcopy. Pollsite optical scan systems are allowed in New York by New York State Election Law.
2. Direct-Recording Electronic (DRE) Voting Systems: An electronic voting system that utilizes electronic components for the functions of ballot presentation, vote capture, vote recording, and tabulation which are logically and physically integrated into a single unit. A DRE produces a tabulation of the voting data stored in a removable memory component and in printed hardcopy. There are three types of DRE Voting Systems:
Full-Face Paper Ballot Overlay DRE Machines – These devices rely on pushbutton technology, the front face of the machine is a large printed sheet of paper displaying the entire ballot on its full-face. Next to or under the sheet are electronic push buttons that correspond to the contest or issue in the overlaying printed ballot face. The voter presses the button to make a selection.
Full-Face Touch Screen DRE Systems – Instead of a printed ballot sheet, there is a large electronic touch screen on which all the contests and issues are displayed on its full-face. The voter touches a selection directly on the screen and their choice is then recorded.
Paging Touch Screen DRE Systems – In these devices the electronic touch screen is does not display a full-face ballot. The screen is much smaller and the voter has to page or scroll though multiple screens as they make their choices. Note that the use of paging DREs is not an option in New York State as State Election Law has been widely interpreted to require DRE systems to display a full-face, where the entire ballot is displayed at once on a single face.
1.4 Report Methodology In order to estimate the number of machines required by NYC and estimate appropriate maximum number of registered voters per machine, we developed an overall approach.
1.4.1 Overall Approach To accomplish this approach, we performed the following:
1. Survey of Other Jurisdictions - Gathered and analyzed empirical evidence from other jurisdictions on the type and number of voting machines used by them.
2. Estimated Machines Required in NYC - Performed a calculation (by type of voting machine technology) using information specific to the City of New York to determine estimates of the number of machines (by type of machine technology) that will be needed to replace current NYC’s lever machines.
3. Determination of Maximums - Determined a reasonable maximum number of registered voters per machines by type of machine given the number of machines required by NYC.
1.4.2 Methods of Calculation We used two general methods of calculation corresponding to the two main technologies, one approach for pollsite optical scan technology and another approach for Direct Recording Electronic (DRE) technology.
NYC BOE Voters Per Machine Report v-34.2 Final.doc Page 3

The Board of Elections in the City of New York 21 August 2006
1.4.2.1 For Pollsite Optical Scan Technology 1. We gathered empirical data about how many registered voters per machine, on average,
are actually operated in other large jurisdictions (on average 1,400 registered voters per scanner)
2. Using the configuration of pollsites in New York City with respect to number of voters and number of election districts (EDs) per pollsite, we applied the average from other jurisdictions to NYC.
3. We then calculated the number of scanners that would be required for NYC.
1.4.2.2 For Direct Recording Electronic (DREs) 1. We started with the current maximum number of registered voters per machine in NYS
(800 per machine)
Factored in a 50% turnout (400 actual voters per machine)
Divided that number into a 15 hour day to determine how many minutes voters are currently provided (2 minutes, 16 seconds per actual voter)
Adjusted the number of minutes for the new technology (added about 1 minute for the VVPAT) (3 minutes, 15 seconds/voter)
Divided that number of minutes into the 15 hour day to determine how many voters can be accommodated (277 actual voters per machine)
And factored in a 50% turnout (554 registered voters per machine)
2. We decided that it would be useful to gather empirical data about how many registered voters per machine (by type of machine) are actually operated in other large jurisdictions, to see if our calculated projection of 554 voters per machine is supported by the empirical data.
3. Finally, once we determined that our projection was supported by the survey data, we used the configuration of Election Districts and pollsites in New York City to calculate the number of full-face ballot overlay DREs, and the number of full-face touch screen DREs that would be required. Note that this calculation needed to be based upon the number of registered voters per Election Districts (precincts) for ballot overlay DREs and on number of registered voters per pollsites for touch screen DREs.
1.5 Parameters to Voting Machine Capacities There are numerous parameters (factors) that can affect the number of voters that can be processed using a given voting system technology. This report makes assumption for NYC for the first five (5) of these factors. We indicate notes about each of the other factors as shown.
These factors include:
1. Duration of Election Day - The number of hours polls are open on Election Day (varies by jurisdiction). For New York City this is 15 hours.
2. Voter Turn-out – The greater the voter turn-out, the more voters need to be processed within the Election Day duration and the deployed pollsite voting systems. Predicting turn-out is not an exact science. We assumed through-out a 50% voter turn-out.
3. Voter Wait Time Tolerance - The acceptable wait time for voting for a given population. We calculated the actual vote time in NYC to average 2 minutes and 15 seconds.
NYC BOE Voters Per Machine Report v-34.2 Final.doc Page 4

The Board of Elections in the City of New York 21 August 2006
4. Voters Per Election District - The number of registered voters per precinct (Election District). We used voter registration numbers for 2004 (4,494,421) and assumed 6,100 EDs (737 Registered Voters per ED).
5. Pollsite/ Election District Configuration - The configuration of Election Districts (precincts) to polling sites (the more Election Districts per pollsite, the greater opportunity to leverage multiple ED machine capabilities and device availability – i.e. go to next available machine in a bank teller line). We assumed the current BOE in NYC configuration.
6. Machine ED Capacity - The degree to which pollsite voting system can support more than one Election District (precinct). We estimated these by type of machine.
7. Degree & Type of Disability Voting - The degree to which disability voting occurs on the same or different machines than regular voting and the degree to which audio ballots are used. The degree & type of disability voting is unknown at this time, since it has not specifically occurred in NYC in the past (no special Ballot Marking Device or voting machine designed for it).
8. Under-voting Alert - For optical scan, whether the alert for under-voting is disabled (to speed processing). It is believed that most of the survey jurisdictions that use pollsite optical scan systems disable the under-voting alert since many voters routinely and purposely under-vote. It is believed that New York State Election Law requires the use of the under-vote alert. Therefore, projections derived from data gathered from jurisdictions where the alert is disabled will be low. Scanning times can be expected to be longer in New York State.
9. Ballot Contest Size - The number of races, candidates and propositions on the ballot for a given election. Ballot contest size varies by type and year of election. No assumptions were made about ballot size other than that future ballot sizes would not vary from past ballot sizes.
10. Capacity to Store Votes - The capacity of pollsite voting systems in terms of votes cast. Optical scan machines have limitations on the number of paper ballots that can be store (bin size) and DRE technologies have electronic storage limitations. It was assumed that these limitations were not exceeded in this analysis.
1.6 Limited Report Scope This report is intended to estimate the number of voting machines by type of machine that will be required by NYC for 2007 and to determine a reasonable maximum number of registered voters per machines (by machine type).
The number of machines required by NYC is only one of the factors that need to be considered when selecting new voting machines. Other factors that should affect the selection which are not considered in this report include:
Ease of Use by Voters
Ease of Use by Pollworkers
Ease of Administration by BOE in NYC
Long-term cost of operation
Vendor Viability
Maintenance and warranty
NYC BOE Voters Per Machine Report v-34.2 Final.doc Page 5

The Board of Elections in the City of New York 21 August 2006
Change Management Impact
The reader is cautioned to not extrapolate from the results of this report that one type of technology is more suitable or less costly than another. Such conclusions are not warranted and are beyond the scope of this report.
2.0 Survey of Other Jurisdictions
2.1 Survey Methodology To determine how many voting machines are actually used, by type of machine, in other jurisdictions, we did the following:
Examined published data on the subject and the assumptions and quality of that data.
Conducted telephone interviews with most of the 30 largest election jurisdictions in the US.
Conducted telephone interviews with other election jurisdictions known to use full-face technologies since few of the largest jurisdictions do so.
Analyzed the results of the published and surveyed data
Estimated the average number of registered voters per machine by type of machine based on the data
2.2 Published Data We found that the most directly useful information was available on the Election Assistance Commission Website: http://www.eac.gov/ under 2004 Election Day Survey Results. The Introduction to this report states that:
“In the fall of 2004, the U.S. Election Assistance Commission (EAC) distributed the first-ever Election Day Survey, requesting voting and elections information from election officials throughout the country. Collecting this information is part of EAC's mission to provide resources and guidance to policy makers and election officials as we work together to make sure every vote is counted fairly and accurately.
The 2004 Election Day Survey is the largest and most comprehensive survey on election administration ever conducted by a U.S. governmental organization, and we thank the nation's secretaries of state and state and local elections officials for their cooperation and contribution.”
The report was developed by Election Data Services, Inc. (EDS), a Washington, DC-based consulting firm that specializes in a variety of election administration issues, along with redistricting and the Census. The published data, however, is for all counties in the United States. For this analysis, we concentrated on the data for the largest 20-30 counties in the US which would be more reflective of conditions in the City of New York. This data for the 30 largest counties in the country represented 20% of the registered voters in the US in 2004.
Data for the largest 20-30 counties, however, was not publicly available, so Gartner contacted EDS and acquired that data in its raw form for this report. We found that some of the data was missing (e.g., the county involved had not reported the data to EDS), some data was skewed (Los Angeles County reported its central count optical scan as pollsite optical scan equipment), and there were other small discrepancies which we worked with EDS to resolve. Finally, almost all of the largest counties do not use full-face DRE devices, so we examined data from additional jurisdictions that use these technologies.
NYC BOE Voters Per Machine Report v-34.2 Final.doc Page 6

The Board of Elections in the City of New York 21 August 2006
2.3 Telephone Survey We identified a knowledgeable contact for each of the largest counties and conducted telephone interviews with them primarily to:
Obtain the missing data
Understand why there would be significant differences in the number of voting devices per registered voters in jurisdictions using the same type of voting devices.
Finally, we re-compiled the data and analyzed the results.
The counties that were examined are as follows: Rank out of Top 30 Counties
County / Jurisdiction
Registered Voters
Early Voting
Device Type Number of Machines
Average Number of Reg. Voters per Machine
Largest Counties with Optical Scan Machines
2 Suburban Cook County 1,378,159 Yes Optical scan 2,100 656
4 Maricopa County 1,552,421 Yes Optical scan 1,275 1,218
5 San Diego County 1,513,300 Yes Optical scan 1,750 865
7 Wayne County 1,412,388 No Optical scan 1,160 1,218
12 King County 1,082,406 No Optical scan 525 2,062
23 Oakland County 889,642 Yes Optical scan 600 1,483
22 State of Wisconsin 4,179,774 No Optical scan 3,563 1,173
9 Dallas County 1,231,291 Yes Optical scan 485 2,539
Largest Counties with Paging DRE Machines
3 Harris County 1,937,072 Yes Paging DRE 10,000 194
6 Orange County 1,495,824 Yes Paging DRE 9,000 166
14 Miami-Dade County 1,058,801 Yes Paging DRE 7,200 147
15 Broward County 1,058,069 Yes Paging DRE 6,000 176
16 Cuyahoga County 1,005,807 No Paging DRE 5,407 186
18 Allegheny County 918,877 No Paging DRE 4,700 196
22 Bexar County 908,466 Yes Paging DRE 2,317 392
24 Santa Clara County 865,271 Yes Paging DRE 5,500 157
25 Franklin County 845,720 No Paging DRE 2,818 300
26 Riverside County 769,328 Yes Paging DRE 3,747 205
30 Palm Beach County 729,575 Yes Paging DRE 4,900 149
31 San Bernardino County 727138 Yes Paging DRE 4,000 182
Counties with Full-Face Paper Overlay Machines (** County is not in the top 30)
13 Philadelphia County, PA 1,062,439 No Full-Face DRE 3,536 300
** Delaware State 550,110 No Full-Face DRE 1,242 443
** Clark County, NV 684,313 Yes Full-Face DRE 2,926 234
** Ocean County, NJ 353,085 No Full-Face DRE 704 502
** Bergen County, NJ 522,750 No Full-Face DRE 1,200 436
** Montgomery County, PA 564,958 No Full-Face DRE 1,050 538
NYC BOE Voters Per Machine Report v-34.2 Final.doc Page 7

The Board of Elections in the City of New York 21 August 2006
Rank out of Top 30 Counties
County / Jurisdiction
Registered Voters
Early Voting
Device Type Number of Average Machines Number of
Reg. Voters per Machine
** City of Denver, CO 382,710 Yes Full-Face DRE 1,184 323
** Orleans County, LA 320,253 Yes Full-Face DRE 894 358
** Jefferson County, LA 287,300 Yes Full-Face DRE 728 395
** East Baton Rouge County
262,784 Yes
Full-Face DRE 680 386
Counties with Insufficient Data on Data Not Applicable
1 Los Angeles County 3,972,738 InkaVote - Unique Technology, not included in survey sample
10 New York County 1,110,217 Lever, New York, not included in survey sample
11 Queens County 1,092,384 Lever, New York, not included in survey sample
8 King County (Brooklyn) 1,082,406 Lever, New York, not included in survey sample
17 Suffolk County 933,561 Lever, New York, not included in survey sample
19 Tarrant County 918,656 Mixed Technology Systems, not included in survey sample
20 Middlesex County 915,575 Mixed Technology Systems, not included in survey sample
21 Nassau County 914,553 Lever, New York, not included in survey sample
27 Milwaukee County 754,413 Optical Scan Included in Wisconsin Data
28 Alameda County 742,258 In the middle of equipment procurement, could not verify data
29 St. Louis County 736,709 Mixed Technology Systems, not included in survey sample
2.4 Average Number of Registered Voters Based on Survey Based on the data collected from the counties, Gartner was able to determine the average number of registered voters per voting device in all these counties. Note that other factors such as the number of precincts and pollsites, voter turn-out and machine capacity are all used in determining the number of machines required by a jurisdiction, however the average ratio of registered voters to machines gives us a consistent measure to use across all the counties and enables us to objectively examine how devices are deployed in these counties.
2.4.1 Average Registered Voters per Optical Scan Voting Machine The following table displays the data findings from the largest counties in the country that use pollsite optical scan systems.
Rank out of Largest Counties
County / Jurisdiction
Number of Precincts
Registered Voters
Device Type Total Units Average # of
Machines Per
Precinct
Average Voter Reg.
Per Machine
2 Suburban Cook County 2,400 1,378,159 Optical scan 2,100 1 656
4 Maricopa County 1,058 1,552,421 Optical scan 1,275 1 1,218
5 San Diego County 1,864 1,513,300 Optical scan 1,750 1 865
7 Wayne County 1,160 1,412,388 Optical scan 1,160 1 1,218
12 King County 540 1,082,406 Optical scan 525 1 2,062
23 Oakland County 581 889,642 Optical scan 600 1 1,483
22 State of Wisconsin 3,563 4,179,774 Optical scan 3,563 1 1,173
9 Dallas County 672 1,231,291 Optical scan 485 1 2,539
AVERAGE 1 1,402
NYC BOE Voters Per Machine Report v-34.2 Final.doc Page 8

The Board of Elections in the City of New York 21 August 2006
The counties listed above have an average of one optical scan machine for every 1,402 registered voters or a ratio of about 1:1,400.
2.4.2 Average Registered Voters per Paging Touch Screen DRE Rank out of largest Counties
County / Jurisdiction Number of
Precincts
Registered Voters
Device Type
Total Units Average # of Machines Per
Precinct
Average Voter Reg.
Per Machine
3 Harris County 885 1,937,072 DRE Paging 10,000 11 194
6 Orange County 2,055 1,495,824 DRE Paging 9,000 4 166
14 Miami-Dade County 749 1,058,801 DRE Paging 7,200 10 147
15 Broward County 777 1,058,069 DRE Paging 6,000 8 176
16 Cuyahoga County 1,451 1,005,807 DRE Paging 5,407 4 186
18 Allegheny County 1,314 918,877 DRE Paging 4,700 4 196
22 Bexar County 619 908,466 DRE Paging 2,317 4 392
24 Santa Clara County 1,029 865,271 DRE Paging 5,500 5 157
25 Franklin County 828 845,720 DRE Paging 2,818 3 300
26 Riverside County 872 769,328 DRE Paging 3,747 4 205
30 Palm Beach County 692 729,575 DRE Paging 4,900 7 149
31 San Bernardino County 819 727138 DRE Paging 4,000 5 182
AVERAGE 6 204
The counties listed above have an average of one paging DRE machine for every 204 registered voters or a ratio of about 1:200.
2.4.3 Average Registered Voters per Full-Face Paper Overlay DRE County / Jurisdiction Number
of Precincts
Registered Voters
Device Model Total Units
Average # of
Machines Per
Precinct
Average Voter Reg. Per Machine
Philadelphia County, PA 1,681 1,062,439 Danaher ELECTronic 1242 3,536 2.10 300
Delaware State 437 550,110 Danaher ELECTronic 1242 1,242 2.84 443
Clark County, NV 1,042 684,313 Sequoia AVC Advantage 2,926 2.81 234
Ocean County, NJ 346 353,085 Sequoia AVC Advantage 704 2.03 502
Bergen County, NJ 557 522,750 Sequoia AVC Advantage 1,200 2.15 436
Montgomery County, PA 400 564,958 Sequoia AVC Advantage 1,050 2.63 538
City of Denver, CO 420 382,710 Sequoia AVC Advantage 1,184 2.82 323
Orleans County, LA 442 320,253 Sequoia AVC Advantage 894 2.02 358
Jefferson County, LA 267 287,300 Sequoia AVC Advantage 687 2.58 395
E. Baton Rouge County, LA 300 262,784 Sequoia AVC Advantage 680 2.27 386
AVERAGE 2 394
The counties listed above have an average of one full-face paper overlay DRE machine for every 394 registered voters or a ratio of about 1:400.
NYC BOE Voters Per Machine Report v-34.2 Final.doc Page 9

The Board of Elections in the City of New York 21 August 2006
2.4.4 Average Registered Voters per Full-Face Touch Screen DRE There are no statistics for the use of full-face touch screen DRE machines. This is because these machines have not been used in any jurisdiction as of the time the survey was conducted.
2.5 Survey Key Findings Based on the results of the County surveys above, the following key findings were determined:
Average Number of Registered Voters Per Machine – For the jurisdictions surveyed the results show the following:
Type of Machine Survey Average Number of Registered Voters Per Machine (rounded)
Full-Face Paper Ballot Overlay DRE 1:400 Full-Face Touch Screen DRE N/A – Not used elsewhere in the Country Paging DRE Not permitted in New York State Pollsite Optical Scan 1:1,400
Multiple ED Capability: Note that full-face touch screen DRE machines have the capability of storing and bringing up different ballot types, therefore a single machine can serve multiple EDs if they are located in a single pollsite (as opposed to printed ballot overlay DREs which can only serve one ED due to the static nature of the printed face ballot). This factor may reduce the number of full-face touch screen DRE machines required at a pollsite over that currently required for lever machines.
Average Voter Machine Time Utilization – Survey results indicate that on average, optical scan machines are approximately six times as fast as paging touch-screen DRE machines and about three times as fast as full-face DRE machines in processing voters on Election Day. Most of the voter’s time is spent filling-out the paper ballot and not interacting with the optical scanner so that time at the scanner is minimal. Still, this is true when the under-vote alert is disabled. Employing the under-vote alert in New York State would likely significantly increase the amount of time required for each voter to complete his or her session at the scanner.
Average Number of Machines Per Precinct – One optical scan machine is typically deployed to a single precinct. The survey shows that on average two full-face printed DRE machines are typically deployed to a single precinct.
2.6 Survey Data Assumptions Conclusions drawn from the survey data should be placed within the context of the known limitations of the data as listed below.
1) Data Collected from Other Jurisdictions was Average Number of Voters per Machine – Data regarding the maximum number of voters per machine is inconsistent across the counties surveyed. Some may have legislation that controls the maximum number. The most consistent measure available was the average number of registered voters per machine. The “average” number of machines per registered voter should not necessarily become the “maximum” number of registered voters per machine.
NYC BOE Voters Per Machine Report v-34.2 Final.doc Page 10

The Board of Elections in the City of New York 21 August 2006
2) Early Voting – Some of the jurisdictions surveyed conduct early voting. Early voting reduces the number of actual voters using machines at pollsites on Election Day and thus potentially increases the average number of voters per machine1. The absence of early voting in NYC means that the actual average number of registered voters per machine may be less than that which is calculated. See the table in Section 2.3 for the list of jurisdictions that conduct early voting.
3) Distribution of Voting Machines to Pollsites – Jurisdictions varied in their method for determining the number of machines to deploy at pollsites. They generally do not do so based on an average number of voters per machine but rather on their prior experience with each pollsite and the type of technology they deploy. Some precincts have historically high or low turn-out while others have high or low early voting, etc. Use of historical data by precinct helps them determine the number of machines to deploy to each pollsite.
4) Under Voting Alert for Optical Scan – Some jurisdictions turn off the feature that alerts voters of under votes on optical scan systems. If this feature is turned on, it increases the time required for a voter to complete the voting process because the paper ballot will get rejected more often since many voters deliberately under-vote. Once alerted, the voter has the option to complete his or her selection or to scan the ballot again knowing that they have under-voted on some contests. It is believed that many of the jurisdictions surveyed had turned-off the under-voting alert.
5) Accessible Devices for Optical Scan Solution – DRE voting devices are designed to enable the disabled to vote independently and with privacy. Optical scan technology machines read and count marked paper ballots but do not themselves assist the disabled to vote independently and with privacy. Accordingly, other devices such as ballot marking devices or phone systems are deployed specifically to assist the disabled in precincts in which optical scan machines are the mode of vote counting. These devices do not present the ballot to the voter in full-face format as New York State Law is widely interpreted to require. Thus, when optical scan machine counts are examined, they do not include counts of these additional machines for voters with disabilities. HAVA requires that at least one machine accessible to voters with disabilities be provided at each pollsite, if the machines are ordered before the end of 2006. If the machines are ordered after 2006, each machine must be accessible to voters with disabilities.
6) Voter Verifiable Paper Audit Trail (VVPAT) – VVPAT on Full-face DRE (required in New York State) is not deployed elsewhere in the country. Accordingly, the impact this will have on voting time (the assumption of 1 minute) is an estimate. There is no data upon which this can be determined at this time.
3.0 Estimation of Machines Required in NYC Based on the different ratios of the average registered voters to voting machines and taking into consideration the number of registered voters, the number of pollsites and the number of Election Districts (EDs) in New York City as of June 2006, estimations by type of technology can be made of the number of voting machines required for NYC.
1 Early voting was distributed fairly evenly across types of technology in this survey, so that its existence does not appear to favor the numbers for one or another technology. Because the percentage of early voting is not consistent across the jurisdictions, and because its use does not appear to favor one or another technology, the potential effect of early voting is not factored into the data used in this report.
NYC BOE Voters Per Machine Report v-34.2 Final.doc Page 11
The Board of Elections in the City of New York 21 August 2006
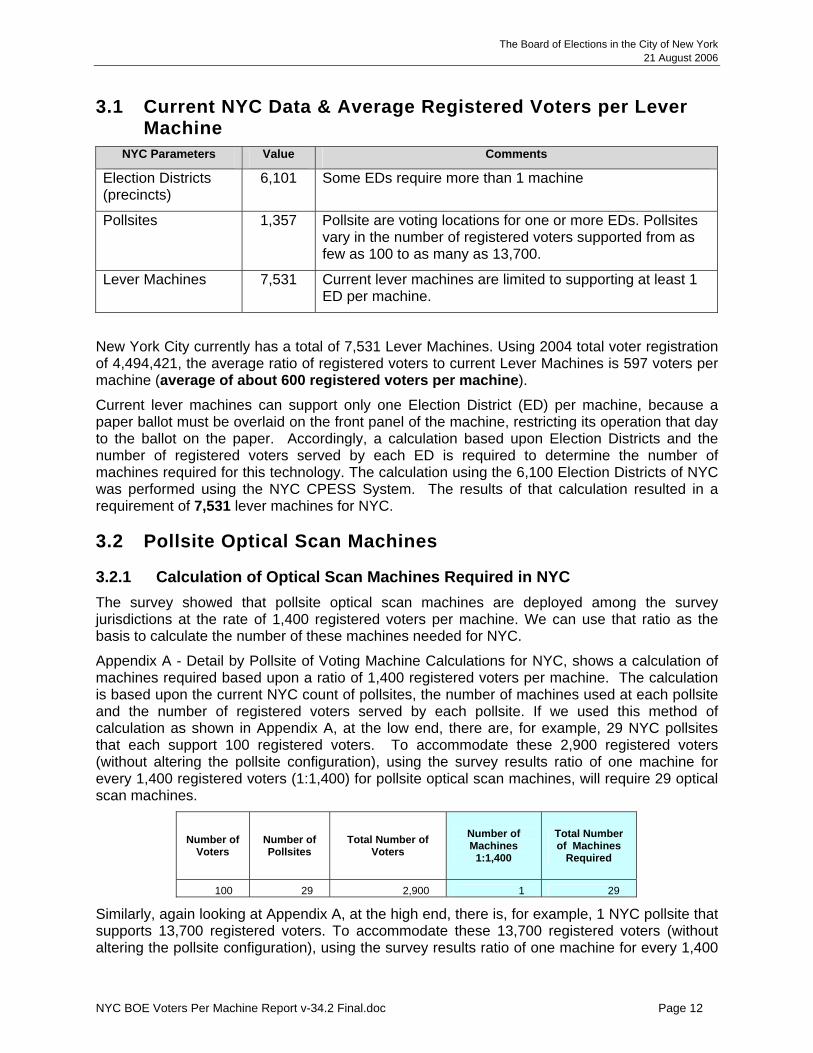
3.1 Current NYC Data & Average Registered Voters per Lever Machine
NYC Parameters Value Comments
Election Districts (precincts)
6,101 Some EDs require more than 1 machine
Pollsites 1,357 Pollsite are voting locations for one or more EDs. Pollsites vary in the number of registered voters supported from as few as 100 to as many as 13,700.
Lever Machines 7,531 Current lever machines are limited to supporting at least 1 ED per machine.
New York City currently has a total of 7,531 Lever Machines. Using 2004 total voter registration of 4,494,421, the average ratio of registered voters to current Lever Machines is 597 voters per machine (average of about 600 registered voters per machine).
Current lever machines can support only one Election District (ED) per machine, because a paper ballot must be overlaid on the front panel of the machine, restricting its operation that day to the ballot on the paper. Accordingly, a calculation based upon Election Districts and the number of registered voters served by each ED is required to determine the number of machines required for this technology. The calculation using the 6,100 Election Districts of NYC was performed using the NYC CPESS System. The results of that calculation resulted in a requirement of 7,531 lever machines for NYC.
3.2 Pollsite Optical Scan Machines
3.2.1 Calculation of Optical Scan Machines Required in NYC The survey showed that pollsite optical scan machines are deployed among the survey jurisdictions at the rate of 1,400 registered voters per machine. We can use that ratio as the basis to calculate the number of these machines needed for NYC.
Appendix A - Detail by Pollsite of Voting Machine Calculations for NYC, shows a calculation of machines required based upon a ratio of 1,400 registered voters per machine. The calculation is based upon the current NYC count of pollsites, the number of machines used at each pollsite and the number of registered voters served by each pollsite. If we used this method of calculation as shown in Appendix A, at the low end, there are, for example, 29 NYC pollsites that each support 100 registered voters. To accommodate these 2,900 registered voters (without altering the pollsite configuration), using the survey results ratio of one machine for every 1,400 registered voters (1:1,400) for pollsite optical scan machines, will require 29 optical scan machines.
Number of Voters
Number of Pollsites
Total Number of Voters
Number of Machines
1:1,400
Total Number of Machines
Required
100 29 2,900 1 29
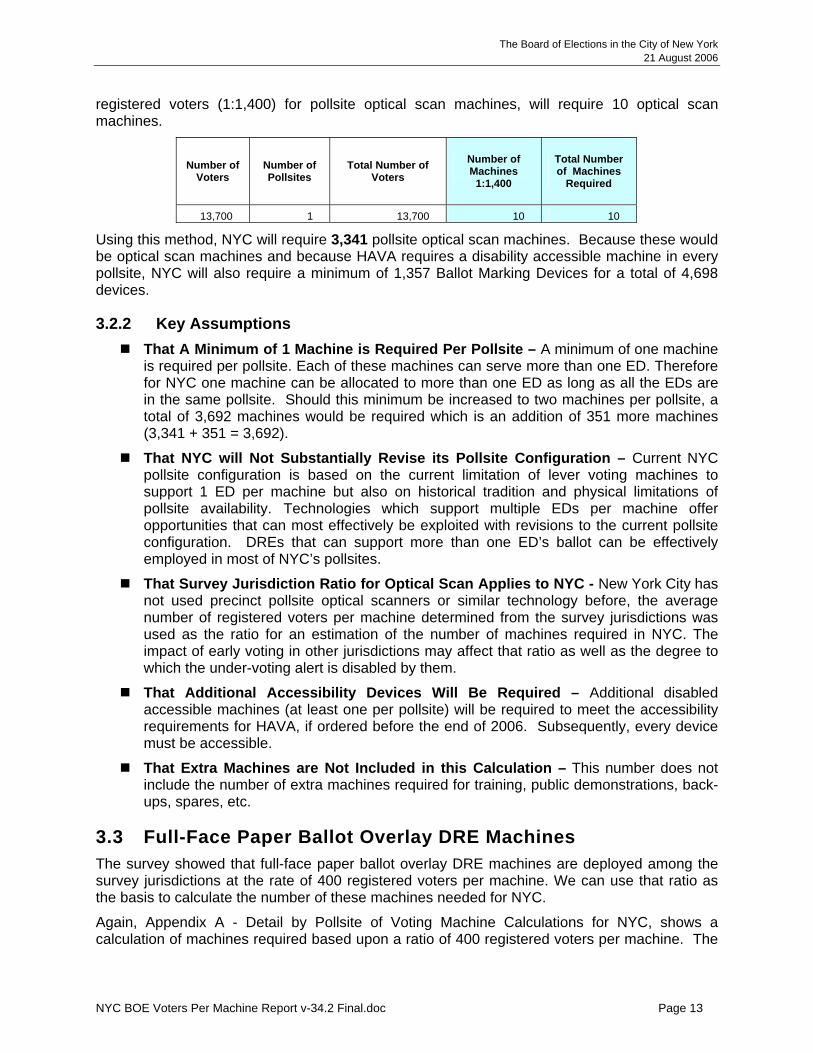
Similarly, again looking at Appendix A, at the high end, there is, for example, 1 NYC pollsite that supports 13,700 registered voters. To accommodate these 13,700 registered voters (without altering the pollsite configuration), using the survey results ratio of one machine for every 1,400
NYC BOE Voters Per Machine Report v-34.2 Final.doc Page 12
The Board of Elections in the City of New York 21 August 2006
registered voters (1:1,400) for pollsite optical scan machines, will require 10 optical scan machines.
Number of Voters
Number of Pollsites
Total Number of Voters
Number of Machines
1:1,400
Total Number of Machines
Required
13,700 1 13,700 10 10
Using this method, NYC will require 3,341 pollsite optical scan machines. Because these would be optical scan machines and because HAVA requires a disability accessible machine in every pollsite, NYC will also require a minimum of 1,357 Ballot Marking Devices for a total of 4,698 devices.
3.2.2 Key Assumptions That A Minimum of 1 Machine is Required Per Pollsite – A minimum of one machine
is required per pollsite. Each of these machines can serve more than one ED. Therefore for NYC one machine can be allocated to more than one ED as long as all the EDs are in the same pollsite. Should this minimum be increased to two machines per pollsite, a total of 3,692 machines would be required which is an addition of 351 more machines (3,341 + 351 = 3,692).
That NYC will Not Substantially Revise its Pollsite Configuration – Current NYC pollsite configuration is based on the current limitation of lever voting machines to support 1 ED per machine but also on historical tradition and physical limitations of pollsite availability. Technologies which support multiple EDs per machine offer opportunities that can most effectively be exploited with revisions to the current pollsite configuration. DREs that can support more than one ED’s ballot can be effectively employed in most of NYC’s pollsites.
That Survey Jurisdiction Ratio for Optical Scan Applies to NYC - New York City has not used precinct pollsite optical scanners or similar technology before, the average number of registered voters per machine determined from the survey jurisdictions was used as the ratio for an estimation of the number of machines required in NYC. The impact of early voting in other jurisdictions may affect that ratio as well as the degree to which the under-voting alert is disabled by them.
That Additional Accessibility Devices Will Be Required – Additional disabled accessible machines (at least one per pollsite) will be required to meet the accessibility requirements for HAVA, if ordered before the end of 2006. Subsequently, every device must be accessible.
That Extra Machines are Not Included in this Calculation – This number does not include the number of extra machines required for training, public demonstrations, back-ups, spares, etc.
3.3 Full-Face Paper Ballot Overlay DRE Machines The survey showed that full-face paper ballot overlay DRE machines are deployed among the survey jurisdictions at the rate of 400 registered voters per machine. We can use that ratio as the basis to calculate the number of these machines needed for NYC.
Again, Appendix A - Detail by Pollsite of Voting Machine Calculations for NYC, shows a calculation of machines required based upon a ratio of 400 registered voters per machine. The
NYC BOE Voters Per Machine Report v-34.2 Final.doc Page 13

The Board of Elections in the City of New York 21 August 2006
calculation is based upon the current NYC count of pollsites, the number of machines used at each pollsite and the number of registered voters served by each pollsite. If we used this method of calculation as shown in Appendix A, at the low end, there are, for example, 29 NYC pollsite that each support 100 registered voters. To accommodate these 2,900 registered voters (without altering the pollsite configuration), using the survey results ratio of one machine for every 400 registered voters (1:400) for paper ballot overlay DRE machines, 29 such DRE machines would be required.
Number of Voters
Number of Pollsites
Total Number of Voters
Number of Machines 1:400
Total Number of Machines
Required
100 29 2,900 1 29
Similarly, again looking at Appendix A, at the high end, there is, for example, 1 NYC pollsite that supports 13,700 registered voters. To accommodate these 13,700 registered voters (without altering the pollsite configuration), using the survey results ratio of one machine for every 400 registered voters (1:400) for paper ballot overlay DRE machines, will require 35 such DRE machines. Using this method, NYC would require 9,921 paper ballot overlay DRE machines.
Number of Voters
Number of Pollsites
Total Number of Voters
Number of Machines 1:400
Total Number of achines Required
13,700 1 13,700 35 35
Full-face paper ballot overlay DRE machines, however, like current lever machines, can only support one Election District (ED) per machine, because a paper ballot must be overlaid on the front panel of the machine, restricting its operation that day to the ballot on the paper. Thus, a calculation based upon pollsites though useful for calculations for other voting system technologies, is not valid for full-face paper ballot overlay DRE machines. Instead, a calculation based upon Election Districts and the number of registered voters served by each ED is required for the calculation of number of machines required for this technology. Further, we decided to not use 400 registered voters per machine (based upon the survey) but instead, decided to determine how many voters could actually vote using this technology based upon our experience with lever voting machines.
The current average time per registered voter needed to vote using full-face lever machines in New York City is:
2 minutes and 16 seconds
This was calculated as follows:
A maximum of 1 machine for every 800 registered voters
A 15 hour Election Day (15*60*60) = 54,000 seconds
54,000/800 = 68 seconds per registered voter
If we assume a 50% voter turn out of registered voters, we would double this time for the actual voter as follows.
68 seconds*2 = 2 min 16 seconds per actual voter
We then assumed:
NYC BOE Voters Per Machine Report v-34.2 Final.doc Page 14

The Board of Elections in the City of New York 21 August 2006
About 1 additional minute per voter for the review of the required voter verifiable paper record.
This results in an estimated average time required to vote using full-face touch screen DRE technology in New York City of:
3 min. and 15 seconds
Based on this average voting time of 3 min. and 15 seconds per actual voter and assuming the following:
A 15 hour Election Day (15*60*60) = 54,000 seconds
3 min 15 seconds per voter = 195 seconds
54,000 /195 = 277 actual voters per machine
If we assume a 50% voter turn out of registered voters, we would double the voters per machine to represent registered voters per machine.
277*2 = 554 registered voters per machine (maximum)
If we use 554 registered voters per machine (ratio of 1:554) and we apply the assumption of using the current actual distribution of machines to the 6,100 EDs, we can use the NYC CPESS System to perform the calculation. The result of this calculation is a requirement of 10,331 paper ballot overlay DRE machines for NYC.
3.3.1 Key Assumptions That A Minimum of 1 Machine per ED is Required – A minimum of one machine is
required per ED. Should this minimum be increased to two machines per ED (for redundancy), a total of 12,269 would be required which is an addition of 1,938 more machines though this does not seem likely.
That Extra Machines are Not Included in this Calculation – This number does not include the number of extra machines required for training, public demonstrations, back-ups, spares, etc.
That 1 Minute will be Required for VVPAT – The assumption is that about 1 minute will be required due to the Voter Verifiable Paper Audit Trail that is required in New York State. There is no jurisdiction known that requires VVPAT on Full-face DRE machines, so this estimate, though perhaps reasonable, is conjecture.
3.4 Full-Face Touch Screen DRE Machines There were no full-face touch screen DRE machines in use by any of the surveyed jurisdictions. Accordingly, we were unable to extrapolate the number of machines required for NYC of this type of technology from the survey data.
We have thus assumed that the time to vote on a full-face touch screen DRE machine would be similar to that required to vote on today’s full-face paper overlay lever machines with the exception that the now required printed voter verifiable paper record would add time to the voting process (as voters may spend time reviewing it before casting their ballot).
The current average time per registered voter needed to vote using full-face lever machines in New York City is:
2 minutes and 16 seconds
NYC BOE Voters Per Machine Report v-34.2 Final.doc Page 15

The Board of Elections in the City of New York 21 August 2006
The calculation in the prior section yielded:
2 min 16 seconds per actual voter
We then assumed:
About 1 additional minute per voter for the review of the required voter verifiable paper record.
This results in an estimated average time required to vote using full-face touch screen DRE technology in New York City of:
3 min. and 15 seconds
Based on this average voting time of 3 min. and 15 seconds per actual voter and assuming the following, we again have:
A 15 hour Election Day (15*60*60) = 54,000 seconds
3 min 15 seconds per voter = 195 seconds
54,000 /195 = 277 actual voters per machine
If we assume a 50% voter turn out of registered voters, we would double the voters per machine to represent total registered voters per machine.
277*2 = 554 registered voters per machine (maximum)
If we use 554 registered voters per machine (ratio of 1:554) and we apply the same assumption of using the current actual distribution of machines to pollsites, the calculation is as follows (See Appendix A - Detail by Pollsite of Voting Machine Calculations for NYC for full calculation):
At the low end, there are, for example, 29 NYC pollsite that each support 100 registered voters. To accommodate these 2,900 registered voters (without altering the pollsite configuration), using the survey results ratio of one machine for every 554 registered voters (1:554) for full-face touch screen DRE machines, will require 29 such DRE machines.
Number of Voters
Number of Pollsites
Total Number of Voters
Number of Machines 1:554
Total Number of Machines
Required
100 29 2,900 1 29
At the high end, there is, for example, 1 NYC pollsite that supports 13,700 registered voters. To accommodate these 13,700 registered voters (without altering the pollsite configuration), using the survey results ratio of one machine for every 554 registered voters (1:554) for full-face touch screen DRE machines, will require 25 such DRE machines.
Number of
Voters Number of Pollsites
Total Number of Voters
Number of Machines 1:554
Total Number of Machines
Required
13,700 1 13,700 25 25
Using this method, NYC will require 7,486 full-face touch screen DRE machines.
3.4.1 Key Assumptions That NYC will Not Substantially Revise its Pollsite Configuration – Current NYC
pollsite configuration is based on the current limitation of lever voting machines to
NYC BOE Voters Per Machine Report v-34.2 Final.doc Page 16

The Board of Elections in the City of New York 21 August 2006
support 1 ED per machine but also on historical tradition and physical limitations of pollsite availability. DREs that can provide more than one ED’s ballot can be effectively employed in most of NYC’s pollsites.
That A Minimum of 1 Machines is Required Per Pollsite – A minimum of one machine is required per pollsite. The reason the number is lower for these machines is because one machine can serve more than one ED. Therefore for NYC one machine can be allocated to more than one ED as long as all the EDs are in the same pollsite. Should this minimum be increased to two machines per pollsite (for redundancy), a total of 7,571 would be required which is an addition of 85 more machines.
That Extra Machines are Not Included in this Calculation – This number does not include the number of extra machines required for training, public demonstrations, back-ups, spares, etc.
That 1 Minute will be Required for VVPAT – The assumption is that about 1 minute will be required due to the Voter Verifiable Paper Audit Trail that is required in New York State. There is no jurisdiction known that requires VVPAT on Full-face DRE machines, so this estimate, though perhaps reasonable, is conjecture.
3.5 Summary of Machines Required The summary of the survey of average registered voters per machine, the number of machines required by NYC by type and the average number of registered voters per machine for NYC are shown below:
Type of Machine Survey Average # of Registered Voters Per Machine
NYC Registered
Voters (2004)
NYC Maximum
Registered Voters Per Machine
NYC Number of Machines
Required
NYC Average # of
Registered Voters Per Machine
Lever Machines in NYC N/A 4,494,421 800 7,531 597 Pollsite Optical Scan, + accessible devices
1,400 4,494,421 1,400 3,341 + 1,362
1,345
Full-face Paper Ballot Overlay DRE (per ED)
400 4,494,421 554 10,3111 435
Full-face Touch Screen DRE
N/A 4,494,421 554 7,4862 600
Note that the table above shows average number of registered voters per machine and not maximum number of registered voters per machine.
Note that pollsite optical scan technology would require the addition of one disability accessible device for each pollsite for a total of 4,698 devices (3,341+1,362=4,698).
The results above indicate that the average number of registered voters for each type of technology for which there are comparable numbers, the required number of machines for NYC results in an average registered voters per machine that is similar to that shown to be used by other jurisdictions (in the survey) for that type of machine. Specifically, the survey jurisdiction ratio for optical scan was 1,400: 1 while NYC’s average would be 1,345:1. Again, for full-face
1 Minimum of 1 per Election District (precinct) 2 Minimum of 1 per pollsite
NYC BOE Voters Per Machine Report v-34.2 Final.doc Page 17

The Board of Elections in the City of New York 21 August 2006
paper ballot overlay, the survey jurisdiction ratio was 400:1, while the NYC average would be 435:1.
4.0 Determination of the Maximums
4.1 Introduction Given the average number of machines by type of technology that is being used in other jurisdictions as shown in the survey and the number of machines that would be required by type of technology in NYC to replace its current lever machines, what should be the maximum number of registered voters per machine? Maximum number of machines would be the legal limit of registered voters per machine that would be allowed. If there were more than that number of registered machines in a given Election District (precinct), then an additional machine would be required to be added to that ED. The notion behind a maximum is to ensure that voters are not unduly delayed waiting for other voters in the course of Election Day.
Currently, there is a maximum number of registered voters per machine stipulated in New York State Election Law (800) while we have seen that on average there are 597 registered voters per lever machine in NYC. This would indicate that:
NYC operates within the state requirements
NYC average is well below (600 vs 800) the maximum.
On Election Day, there are “peaks and valleys” of usage by voters depending upon the time of day, the weather, traffic and other variables outside of the control of election staff. Thus there will always be times when voters are waiting, but on the whole, there should be some insurance that waits will not be over long durations throughout the day and that on the whole, voting can be accomplished expeditiously. If we make the assumption that on the whole elections are conducted expeditiously by the survey jurisdictions, than a maximum that is at, or somewhat higher than, the average by type of technology should be a reasonable maximum for New York.
4.2 Pollsite Optical Scan Machines In accordance with the above analysis, we find that optical scan technology among the survey jurisdictions operates at 1,400 registered voters per pollsite optical scan machine. This is an average of 36 seconds of machine use per register voter (72 seconds for each actual voter assuming a 50% turnout).
Consider what is involved.
The voter submits his or her ballot for scanning
If there on no over-vote or under-vote conditions, the scanner can read the ballot in as little as 3 or 4 seconds.
If under-voting is turned off (which it frequently is, though not likely to be permitted in NYS), it will have little or no effect on the time to vote.
The remainder of the time required may be consumed by over-vote conditions and the necessity for the voter to correct or spoil the ballot and submit his or her vote again.
Accordingly, a maximum of 1,400 registered voters per pollsite optical scan machine would appear to be a reasonable limit.
NYC BOE Voters Per Machine Report v-34.2 Final.doc Page 18

The Board of Elections in the City of New York 21 August 2006
4.3 Full-Face Paper Ballot Overlay DRE Machines Our analysis showed that based upon the requirement that there be 1 full-face paper ballot overlay DRE per Election District (ED), that 10,311 machines would be required to replace the current lever machines. This is an average of 435 registered voters per machine. The jurisdiction survey indicated that jurisdictions with this type of technology average 400 registered voters per machine, but these jurisdictions have not implemented a voter verifiable paper audit. Based upon our prior calculations, this technology will allow 4 min and 32 second per registered voter, meaning that each actual voter will have 2 minutes and 16 seconds. If about 1 additional minute is added for the voter verifiable audit, each actual voter will have, on average, 3 minutes and 15 seconds in which to vote. This is the same time duration as was established for full-face touch screen DRE machines and thus the same number of registered voters (554) can be accommodated per machine. This implies that the same maximum number of voters per machine should be applied to paper ballot overlay DRE as would be applied to touch screen DRE.
Reducing the maximum number of voters per device by half, e.g., from 800 to 400 does not double the number of machines required (7,000 to 14,000) because the number of machines required is influenced more by the number of pollsites and EDs in the City.
4.4 Full-Face Touch Screen DRE Machines Full face touch screen DRE machine technology would require 7,486 machines for NYC under the current configuration of pollsites and EDs. This results in a ratio of 554 registered voters per machine. A reasonable maximum then would be 554 registered voters per machine for this technology.
5.0 Summary
5.1 Summary of Survey of Average Number of Registered Voter per Machine
In order to understand how other jurisdictions have deployed similar voting machines, Gartner did a national survey of the 30 largest counties in the country to determine the average number of registered voters per voting machine by type of machine technology. This was done by reviewing published information and validating this data by conducting a telephone survey with these jurisdictions.
For the jurisdictions surveyed the results show the following:
Type of Machine Average Number of Registered Voters Per Machine
Pollsite Optical Scan 1,400:1 Full-Face Printed Ballot Overlay DRE 400:1 Full-Face Touch Screen DRE N/A – Not used else where in the Country
5.2 Summary of Analysis Results The table below shows the estimated number of machines required by type of machine and by different measures used. This estimated number does not include the number of back up machines, number of machines for training demonstration, etc.
NYC BOE Voters Per Machine Report v-34.2 Final.doc Page 19

The Board of Elections in the City of New York 21 August 2006
Type of Machine Survey Average # of Registered Voters Per Machine
NYC Registered
Voters (2004)
NYC Number of Machines
Required
NYC Average # of
Registered Voters Per Machine
NYC Maximum # of Reg.
Voters Per Machine
Lever Machines in NYC N/A 4,494,421 7,531 597 800 Pollsite Optical Scan, + accessible devices
1,400:1 4,494,421 3,341 + 1,3621
1,345 1,400
Full-Face Paper DRE 400:1 4,494,421 10,3112 435 554 Full-Face Touch Screen DRE
N/A 4,494,421 7,4863 600 554
5.3 Final Observations
5.3.1 NYC Average Number of Voters Per ED is Lower Than Other Jurisdictions We observed that most of the jurisdictions had an average number of registered voters per precinct that was higher than the average number of voter per Election District in NYC. Some of the NYC Election Districts had as few as 100 registered voters. This would indicate that consolidation of some EDs would provide more efficient election operations and better use of new voting system technology.
5.3.2 NYC ED & Pollsite Configuration Optimized for Current Lever Machines Though we have determined the maximum number of registered voters per machine advisable for NYC by type of machine, it is clear from this analysis that there are inter-relationships between the maximum number of machines by type of machine and other pollsite configuration parameters. We have calculated the maximum assuming that the present NYC pollsite election configuration (number of EDs per pollsite, number of pollsite, space per pollsite) will be unchanged (either because they cannot be changed or because they cannot be changed in time for the 2007 elections).
The closer replacement machines are technologically to current lever machines, the easier the transition will be and the closer the number of machines will be to present counts. As the choice of technology moves away from the current technology without a change to the current pollsite configuration, the less appropriate the current pollsite configuration becomes. As that move occurs (from lever machines to full-face paper ballot overlay DRE to full-face touch screen DRE to pollsite optical scan), without re-configuration of pollsites, the more the advantages of these alternative technologies will be under-realized.
1 Minimum of 1 accessible device per pollsites, 1,362 pollsites 2 Minimum of 1 per Election District 3 Minimum of 1 per pollsite
NYC BOE Voters Per Machine Report v-34.2 Final.doc Page 20

The Board of Elections in the City of New York 21 August 2006
6.0 Appendix A – Voting Machine Pollsite Calculations for NYC
Number of Voters
Number of
Pollsites
Total Number of
Voters
Number of Machines
1:400
Total Number of Machines Required
Number of Machines
1:1400
Total Number of Machines Required
Number of Machines
1:800
Total Number of Machines Required
Number of Machines
1:554
Total Number of Machines Required
100 29 2,900 1 29 1 29 1 29 1 29 200 11 2,200 1 11 1 11 1 11 1 11 300 5 1,500 1 5 1 5 1 5 1 5 400 11 4,400 1 11 1 11 1 11 1 11 500 29 14,500 2 58 1 29 1 29 1 29 600 35 21,000 2 70 1 35 1 35 2 70 700 42 29,400 2 84 1 42 1 42 2 84 800 27 21,600 2 54 1 27 1 27 2 54 900 26 23,400 3 78 1 26 2 52 2 52
1,000 25 25,000 3 75 1 25 2 50 2 50 1,100 16 17,600 3 48 1 16 2 32 2 32 1,200 32 38,400 3 96 1 32 2 64 3 96 1,300 35 45,500 4 140 1 35 2 70 3 105 1,400 28 39,200 4 112 1 28 2 56 3 84 1,500 37 55,500 4 148 2 74 2 74 3 111 1,600 29 46,400 4 116 2 58 2 58 3 87 1,700 31 52,700 5 155 2 62 3 93 4 124 1,800 36 64,800 5 180 2 72 3 108 4 144 1,900 34 64,600 5 170 2 68 3 102 4 136 2,000 42 84,000 5 210 2 84 3 126 4 168 2,100 37 77,700 6 222 2 74 3 111 4 148 2,200 33 72,600 6 198 2 66 3 99 4 132 2,300 31 71,300 6 186 2 62 3 93 5 155 2,400 35 84,000 6 210 2 70 3 105 5 175 2,500 26 65,000 7 182 2 52 4 104 5 130 2,600 23 59,800 7 161 2 46 4 92 5 115 2,700 29 78,300 7 203 2 58 4 116 5 145 2,800 25 70,000 7 175 2 50 4 100 6 150 2,900 37 107,300 8 296 3 111 4 148 6 222 3,000 20 60,000 8 160 3 60 4 80 6 120 3,100 18 55,800 8 144 3 54 4 72 6 108 3,200 17 54,400 8 136 3 51 4 68 6 102 3,300 22 72,600 9 198 3 66 5 110 6 132 3,400 25 85,000 9 225 3 75 5 125 7 175 3,500 24 84,000 9 216 3 72 5 120 7 168 3,600 22 79,200 9 198 3 66 5 110 7 154 3,700 14 51,800 10 140 3 42 5 70 7 98 3,800 22 83,600 10 220 3 66 5 110 7 154 3,900 18 70,200 10 180 3 54 5 90 8 144 4,000 14 56,000 10 140 3 42 5 70 8 112 4,100 19 77,900 11 209 3 57 6 114 8 152 4,200 20 84,000 11 220 3 60 6 120 8 160
NYC BOE Voters Per Machine Report v-34.2 Final.doc Page 21

The Board of Elections in the City of New York 21 August 2006
Number of Voters
Number of
Pollsites
Total Number of
Voters
Total Total Total Total Number of Number of Number of Number of Machines
1:400
Number of Machines Required
Machines 1:1400
Number of Machines Required
Machines 1:800
Number of Number of Machines Machines Machines 1:554 Required Required
4,300 20 86,000 11 220 4 80 6 120 8 160 4,400 9 39,600 11 99 4 36 6 54 8 72 4,500 12 54,000 12 144 4 48 6 72 9 108 4,600 13 59,800 12 156 4 52 6 78 9 117 4,700 13 61,100 12 156 4 52 6 78 9 117 4,800 16 76,800 12 192 4 64 6 96 9 144 4,900 12 58,800 13 156 4 48 7 84 9 108 5,000 15 75,000 13 195 4 60 7 105 10 150 5,100 9 45,900 13 117 4 36 7 63 10 90 5,200 21 109,200 13 273 4 84 7 147 10 210 5,300 6 31,800 14 84 4 24 7 42 10 60 5,400 5 27,000 14 70 4 20 7 35 10 50 5,500 9 49,500 14 126 4 36 7 63 10 90 5,600 5 28,000 14 70 4 20 7 35 11 55 5,700 7 39,900 15 105 5 35 8 56 11 77 5,800 6 34,800 15 90 5 30 8 48 11 66 5,900 12 70,800 15 180 5 60 8 96 11 132 6,000 6 36,000 15 90 5 30 8 48 11 66 6,100 4 24,400 16 64 5 20 8 32 12 48 6,200 5 31,000 16 80 5 25 8 40 12 60 6,300 6 37,800 16 96 5 30 8 48 12 72 6,400 7 44,800 16 112 5 35 8 56 12 84 6,500 3 19,500 17 51 5 15 9 27 12 36 6,600 5 33,000 17 85 5 25 9 45 12 60 6,700 4 26,800 17 68 5 20 9 36 13 52 6,800 4 27,200 17 68 5 20 9 36 13 52 7,000 2 14,000 18 36 5 10 9 18 13 26 7,100 1 7,100 18 18 6 6 9 9 13 13 7,300 2 14,600 19 38 6 12 10 20 14 28 7,400 2 14,800 19 38 6 12 10 20 14 28 7,500 1 7,500 19 19 6 6 10 10 14 14 7,600 1 7,600 19 19 6 6 10 10 14 14 7,700 2 15,400 20 40 6 12 10 20 14 28 7,800 3 23,400 20 60 6 18 10 30 15 45 7,900 2 15,800 20 40 6 12 10 20 15 30 8,000 1 8,000 20 20 6 6 10 10 15 15 8,100 2 16,200 21 42 6 12 11 22 15 30 8,400 1 8,400 21 21 6 6 11 11 16 16 8,500 3 25,500 22 66 7 21 11 33 16 48 8,600 1 8,600 22 22 7 7 11 11 16 16 9,800 1 9,800 25 25 7 7 13 13 18 18
10,000 1 10,000 25 25 8 8 13 13 19 19 10,200 1 10,200 26 26 8 8 13 13 19 19 10,800 1 10,800 27 27 8 8 14 14 20 20 11,200 1 11,200 28 28 8 8 14 14 21 21
NYC BOE Voters Per Machine Report v-34.2 Final.doc Page 22

The Board of Elections in the City of New York 21 August 2006
Number of Voters
Number of
Pollsites
Total Number of
Voters
Total Total Total Total Number of Number of Number of Number of Machines
1:400
Number of Machines Required
Machines 1:1400
Number of Machines Required
Machines 1:800
Number of Number of Machines Machines Machines 1:554 Required Required
11,400 1 11,400 29 29 9 9 15 15 21 21 12,300 1 12,300 31 31 9 9 16 16 23 23 13,700 1 13,700 35 35 10 10 18 18 25 25
1,357 3,759,900 9,921 3,341 5,301 0 7,486
NYC BOE Voters Per Machine Report v-34.2 Final.doc Page 23