an analysis of strategies by netflix in the television...
TRANSCRIPT

BSc(B) 6. semester Author:
Gabor Kovacs Student No.: 201208049
Thesis Supervisor:
Jos Jansen
An Analysis of Strategies by Netflix in the
Television Market
Department of Business Administration
Aarhus University
May 2015
Characters: 77593
2 | P a g e
Executive Summary
Over the last few years, as both technological advancements and new consumer trends of the late
20th
and early 21th century have rapidly evolved, the television industry has gone through a vast
amount of changes. More specifically, these changes have enabled the emergence of online video
streaming as a viable industry. From limited choices, consumers now have a wide range of available
services, even the ability to control their programing, and industry incumbents face new challenges.
As a consequence, the innovation of Online Video Streaming services is therefore considered to be
disruptive in nature to the established offline television industry.
The purpose of this thesis is to explore, from an economic perspective, the development of both the
online and the offline US television industry, investigate the threat of online services to the standard
television services, and their respective future expectations. The main focus of this paper is on the
professionally produced television services of the Pay TV and Over-The-Top industries.
As a consequence, these abovementioned changes are raising questions like; what is happening to
the television industry exactly and what the consequences of these changes are with respect to the
industry structure and incumbents. Therefore, this thesis investigates the disruptive nature of the
Online Video Streaming innovations and analyzes what effects it is expected to have on the
prevailing industry structure. In doing so, the thesis first identifies the relevant markets and
describes how they have evolved over the years. In order to understand the evolution and dynamics
of disruptive innovations, the paper will use Netflix, the unchallenged leader of Online Video
Streaming services, as a case in point. As Netflix has successfully entered the television industry by
creatively combining complementary technologies in order to create a new operating model, it
provides an excellent case study for the analysis of disruptive innovation.
Although the available data to carry out an empirical study was insufficient, a number of scholarly
works provide the foundation for this thesis. Using a qualitative analysis, both in a New Industrial
Organization and Strategic Management context, the paper discusses the type of disruptive
innovation at hand, the dimensions of industry convergence and the expected implications of these
changes on the industry structure. As the research reveals that both the consumer adaptation and the
social-cultural trends are increasingly in favour of the online services, it finds that the strategic
interactions point toward industry convergence. To understand the implications of these, Michael E.
Porter’s “Five Forces” model provides the framework for the remainder part of the analysis, which

3 | P a g e
is carried out in an ex ante perspective – hypothesizing a fully converged future industry. Finally,
the thesis provides a brief overview of how consumers are expected to experience these
abovementioned changes.
In the conclusion, this thesis summarizes all influencing factors that play an important role in the
turnout of industry changes as well as the hypothesized consequences of those for both the industry
players and consumers. It is important, though, to mention that the findings of this paper are rather
hypothesized than fully experienced. This is because carrying out an analysis, which resulted in
fully experienced changes, would require knowing the outcomes (ex post). However, the nature of
both the disruptive innovation and the industry convergence theories does not support such a study
to be carried out at this point.

4 | P a g e
Table of Content
Abstract
Table of Content
List of Figures and Tables
1. Introduction 6
1.1 Problem Statement 7
1.2 Literature Review 7
1.3 Methodology 9
1.4 Delimitation 10
1.5 Definitions 10
2. Market Description 12
2.1 Market History 12
2.2 Industry Characteristics 13
2.2.1 Pay TV Industry 13
2.2.2 Over-The-Top Industry 15
2.2.3 Sources of Interdependence 16
2.3 Market Analysis 16
2.4 Netflix – Company Description 20
3. Analysis 22
3.1 Strategic Overview 22
3.2 Market Evolution 25
3.3 The Disruptive Innovation 27
3.4 The Dimensions of Convergence 28
3.5 The Implications of Changes on Industry Structure 29
4. Consumer Welfare 34
5. Conclusion 35
6. Bibliography 36

5 | P a g e
List of Figures and Tables
Table 1. Average Time Spent per Day with Major Media by US Adults, 2010-2013 18
Figure 1. - OTT Service Subscriptions (2012-2014) 15
Figure 2. - US Revenue Growth of Netflix (2005-2011) 17
Figure 3. - Internet Use, 1995-2014 19
Figure 4. - US Pay TV Subscriber growth (2007-2016) 25
Figure 5. - US Pay TV Penetration (2010-2014) 25
Figure 6. - US Pay TV + OTT Industry Growth (2008-2012) 26
Figure 7. - Consumers’ use of Over-The-Top Video Services (2012-2013) 26

6 | P a g e
1. Introduction
Since the first commercially traded television set and the first broadcasted television programs, TV
has formed an increasingly important part of the American people’s lives. As a result, the US
television industry - television industry as of services provided through the use of some network
solutions/infrastructure and not including the physical product - has been developing for decades at
an increasing pace and has evolved to be a huge industry stacking up billions of dollars from
advertising, subscription- and licensing fees. In 2010, this industry made up more than 1% of the
U.S. GDP (Waterman & Ji, 2012). However, among the various technological developments, which
have led this industry to its current position, one development – particularly the development of the
Internet – has the tendency to motivate questions about where the future of this industry is headed
for. Even though the improvements of the Internet have enabled the further development of digital
products and services, many of which have the ability to lower costs and improve efficiency, it also
has the power to restructure economic activities and create new market opportunities that can be
disruptive to existing ones. Examples of this disruptive tendency often use the music or newspaper
industry, however now, the Pay TV industry seems to be the next possible victim of technological
disruption.
In the early days, watching television meant that the programming was predetermined and
broadcasted on a pre-set schedule, not to mention that the use of a television set was necessary.
However those times have changed and these changes have been mainly driven by changing
consumer demands and the advent of the Internet. New trends have started to emerge such like
“Cutting-the-Cord”, where consumers are cancelling their expensive traditional TV subscriptions
and substitute them with cheaper substitutes or “Shaving-the-Cord”, where customers are choosing
cheaper TV-packages and supplementing them with other online video content. These new trends
have given turmoil to the rapid rise of a new market, the “Over-The-Top” (OTT) market, which has
quickly gained significant popularity over the past decade. Not to mention with the widespread use
of internet-enabled mobile devices, television is now everywhere. Every device has practically
become a “television”. As the online video streaming services or the Over-the-Top Video market is
gaining larger and larger market share, it is commonly believed that the future of traditional
television is seriously threatened. Although competition is growing rapidly, offline television still
dominates the market today.

7 | P a g e
As the practices and economics of the US television industry are in the process of being redefined,
this paper will discuss the evolution and state of the industry and analyze what effects the growth of
the OTT market is expected to have on it. As Netflix continues to be the unchallenged leader of the
OTT industry (Sandvine, 2013), analyzing the industry using Netflix provides a great opportunity to
see and most importantly understand what challenges the Pay TV industry is facing, what the
incumbents are doing in order to fight off the new competition and to see whether consumers are
benefiting this changes or not.
1.1. Problem Statement
This thesis aims to analyze how the arrival of the online video streaming services (OTT market),
such as those of Netflix, has impacted the television industry, as a whole, and what implications
they have on consumer welfare. In doing so, the thesis will first look at how the Pay-Tv and OTT
markets have evolved over the years providing a general overview of the television industry, as a
whole. Next it will consider what strategies Netflix has been employing, what responses the
competition has had and what implications these strategies have for the industry. Finally, consumer
welfare will be considered so that a conclusion could be developed in terms of what direction the
industry has been developing.
The thesis will answer the following research questions:
RQ1: Does/Will the OTT industry disrupt the Pay-Tv industry?
RQ2: What consequences does the OTT industry have for the Pay-Tv industry?
RQ3: Are consumers benefiting or not from these new developments?
1.2. Literature Review
Over time, the theory of disruptive innovation established by Clayton Christensen, in 1997, has
often been used to explain the implications of all disruptive innovations; however, Markides (2006)
and McGahan (2004) argue that even though different disruptive innovations share many
similarities, there are differences between them. Therefore, understanding what kind of disruptive
innovation, at hand, we are looking at is the key to successfully determine what its implications are
for the market. Markides (2006) defines two finer categories of disruptive innovation – namely

8 | P a g e
business-model innovation and radical innovations. In this framework, business-model innovation
happens when the existing product or service and the way it is provided to the consumers are being
redefined, and radical innovations represent new-to-the-world products/services. As Markides
(2006) explains, business-model innovations usually broaden the market size by either attracting
completely new customers and/or by encouraging existing customers to spend more. If successful,
the growth of these new business-models over time increases the attention of established players so
much that they cannot afford not to respond to these new “players”.
Radical Innovations on the other hand create new-to-the-world products/services that disrupt
prevailing value propositions, consumer habits and undermine the competences and the core assets,
which the industry is built on (Markides, 2006).
The reasons and implications of disruptive innovations have been further broadened by several
other authors as well. For example Yoffie (1997) explains that market entry is more likely to
happen through creative combinations of complementary technologies and with digital convergence
these new technologies can have important implications for industry structures (Dowling, Lechner,
Thielmann, 1998).
While disruptive innovations often create difficulties for established incumbents, as the competitive
environment changes, Markides (2006) and Charitou & Markides (2003) recognize that these
strategic innovations are not necessarily destined to make traditional ways of competing totally
obsolete. However, to avoid losing market position, incumbents must find ways to cope with these
changes. The big question then becomes what implications these strategic movements have for the
industry structures.
Although online media services represent a relatively new industry segment, several scholars
discuss the economic and competitive advantages of the Internet. For example, digital information
goods and the Internet provided delivery system offer significant competitive advantages over other
media, for marginal costs are being lowered to insignificant levels and bundling can create
remarkable “economies of aggregation” (Shapiro & Varian, 1999; Bakos & Brynjolfsson, 2000).
Furthermore, the most important value of these online services lies in their capacity to provide
enhanced services for both consumers and suppliers. While there are several economic advantages
of online market efficiency; some argue that improved product features made available through

9 | P a g e
electronic markets can have more significant impact on consumer welfare gains (Brynjolfsson,
Smith and Hu, 2002).
1.3. Methodology
In this paper we present the effects of the online video streaming industry on the television industry,
as a whole, both in a New Industrial Organization and in a Strategic Management context. This
means that the different actors of the industry at hand are no longer passive, but active decision
makers, who make rational profit-maximizing strategy choices. As a consequence of these strategic
interactions, the market structure is believed to be influenced and therefore changed. However
rather being a quantitative analysis, this research will instead focus on the qualitative perspective of
the industrial changes.
In this perspective, the definition of the television industry will need a more precise definition,
where the focus of the research will be on the Pay TV and the Over-The-Top (video) sub-industries.
The reason of researching these specific sub-industries and the interaction of the two is that as a
result of a relatively recent innovation, the competition between the entities of these sub-industries
is seemingly intensifying at an increasing speed and therefore industry boarders are disappearing.
The introduction of innovations often have disruptive impacts on one or even several industry(-ies).
While it is believed that industries are always in some sort of a change (McGahan, 2004), it is
important to understand what type of change is taking place so that the consequences could be
better predicted. In order to achieve a better understanding, the paper will first present the
competing industries and assess some of the influencing factors with the framework of PEST
analysis. Following this, the next section will first consider the relevant theories of disruptive
innovation, industry convergence and then the analysis part will attempt to map out and classify the
theorized changes. To achieve this, the framework of the “Five Forces” model by Michael E. Porter
(1980; 2001; Porter & Heppelmann, 2014) will be used, for it provides a great opportunity to
identify what trajectories the proposed changes are taking, provided that it can be used in both ex
post and ex ante perspectives. The remainder of this study will then discuss consumer surplus, from
a theoretical perspective, using the abovementioned theoretical frameworks of disruptive innovation
and industry convergence.

10 | P a g e
1.4. Delimitations
It is noteworthy to mention that the home entertainment industry is a huge domain consisting of
several smaller sub-domains/sub-industries, for example newspaper, video games, television and
even content production. Even though most of these sub-industries are considered to be in
competition with one another on some level, this paper only focuses on the television industry.
Since the television industry also contains several sub-industries, a further simplification is added,
which means that only the Pay TV and OTT industries will be considered.
To further reduce the complexity caused by the influence of international markets, the thesis limits
its geographical bounds to the United States.
The motivating factor of why this thesis takes on a qualitative approach instead of an empirical
analysis is that although disruptive innovation and convergence theories do hypothesis the potential
outcomes of these changes, these theories are rather impossible to be tested ex ante - before
knowing the actual outcomes of the changes. In addition, the availability of useful, relevant data –
for example prices, industry revenues and size - and the complexity of the analyzed industries have
presented further difficulties.
1.5. Definitions
Linear TV
The version of television broadcasting, where consumers has no control over the content being
broadcasted is called linear broadcasting. The programming of linear broadcasting is based on a
pre-set schedule, where everybody is watching the same content at the same time. No alteration of
the programming is available for the consumers (www.itvdictionary.com, 2015).
Pay TV
The Pay TV industry includes television service provider, which provide video programing
available to consumers in different subscription packages. Customers usually have to pay their

11 | P a g e
network providers a certain additional subscription fee on top of their basic access fees in order to
receive specific additional channels/content (www.itvdictionary.com, 2015).
Video-on-Demand (VoD)
VoD typically requires a media device, for example a Digital Video Recorder (DVR), with which
the consumer can adjust the programming. Generally available functions are pausing, rewinding,
fast forwarding and recording programs so that they could be watched later. Formats of VoD
include free VoD (included in the package), subscription VoD (SVoD), which requires an extra
monthly fee usually for the unlimited use of VoD services, and Pay-per-View VoD (PPV VoD)
(www.itvdictionary.com, 2015).
Over-The-Top (OTT, Over-The-Top Video, Over-The-Internet Video)
This term refers to services, which are available over a network, but they are separate from those of
what your network provider offers (www.itvdictionary.com, 2015). Netflix is a good example, as it
requires internet connection provided by the network operator, but the service is offered by a third
party. In general the “Over-The-Top” category includes several different services - for example
music/video streaming, peer-to-peer services – however, this study will only focus on the video
streaming segment. More specifically, the video streaming segment that is perceived closest to the
Pay TV services and therefore personal video production – like Youtube – or video piracy will not
form part of this research.

12 | P a g e
2. Market Description
2.1. Market History
The typically known television or linear television in the US began to gain popularity soon after the
World War II. or early 1950s, when the sales of TV sets started to increase (Parsons, 2008) and the
programming started to expand from mainly broadcastings to original dramas and shows such as
Disneyland and The Mickey Mouse Club. Cable Television started to gain more interest and by the
1960s, where most of the viewers received their television broadcasts through an antenna system
called Community Antenna Television (CATV). Throughout the 1980s and mid-1990s direct
satellite television (DBS) began to take off, the number of cable networks significantly increased,
viewership exploded and Videocassette recorders (VCRs) became widely available for the public
(Stephens, 2000). By 1996, penetration of the US television market reached 66.7 percent of
American households and a revenue of approximately $25.7 billion (Parsons, 2008). As competition
was growing and DBS services started to take away subscribers, the latter half of the 1990s brought
major technological developments. Of those developments the most important was digitalization,
when for example cable operating companies started to upgrade their distribution networks from
analog to digital (Parsons, 2008). This upgrade opened up the way to provide high-speed internet
access, high definition and advanced digital video services, such as High Definition video content,
Video-on-Demand (VoD) and Subscription Video-on-Demand (SVoD).
As for anybody born in the early 1990s or before, television services were completely different than
what we have nowadays. Until VCRs became widely available and Video-on-Demand was possible,
television broadcasting was based on a pre-set schedule. Shows, movies and TV-series were
scheduled to specific time-slots and if you missed an episode of your favourite TV-show or a movie
that you wanted to see on TV then you literally missed it. It was quite rare that TV channels
repeated their program, at least not soon after they played it. This has all changed with the Video
Home Systems (VHSs) gaining more popularity and dominating the 1990s. Video rental stores
started to show up and grow into huge chains like Blockbuster and recording of TV programs
straight from the television became possible. Although VHS was still number one at the end of the
20th
century, the new millennium brought some more, important technological advancement. As the
21st century started, DVDs started to take over the market of VHS (Feldt), digital video recorders

13 | P a g e
(DVRs) started to give more control to subscribers with their VoD functionalities and as the internet
gained more and more popularity, content became a matter of just a few clicks. The spread of high-
speed internet and increasing use of mobile devices made it possible to first download programs and
then later on also to stream entertainment content (Parsons, 2008). The ways of consuming home
entertainment have been vastly altered. With instant video streaming, access to different high-end
mobile devices and internet connectivity everywhere, consumers can now enjoy whatever they
want, wherever and whenever they want it.
The size of the US television market in 1992 consisted of approximately 58 million subscribers
(Parsons, 2008), 98 percent of which was served by cable companies (NCTA). Although the
number of subscriptions has significantly increased over the last 20 years, the growth of cable
subscriptions has significantly slowed down. As of 2013, the Pay TV market (which includes
service provided by cable, satellite and telecommunication (telco) companies providing TV
services, but not online streaming) in the US has ended the year with a little over 100 million
subscribers according to research firm SNL Kagan (Lee – Bloomberg, 2014), and only 53 percent
of it was cable’s market share (NCTA). On the other hand, other forms of home entertainment
closely related to the video and television market, for example online streaming or video rental,
have also gained significant popularity in the meantime.
2.2. Industry Characteristics
As mentioned before, the television industry and all in all the home entertainment industry has
changed significantly in the last few decades. From a few channels available, the market quickly
became saturated and now consumers have numerous ways to gain access to some kind of home
entertainment. Since the built up of this industry is rather complicated, the following segment
attempts to explain or simplify the actual relationships and competitive conditions prevailing so that
a better understanding could be attained.
2.2.1. Pay TV Industry
In general, the Pay TV industry is served by several interconnected players serving the different
parts of the US media value chain. In fact the US media industry is based on a three-tiered system

14 | P a g e
(Sheffer, 2014) regulated by the Federal Communications Commission (FCC). Content is provided
(first tier) by the different production companies (e.g.: film studios) to the different
networks/stations or other companies (e.g.: Fox News Channel), which aggregate the content and
broadcast (second tier) their programming. The third tier of the system includes the distribution
companies, who are cable (e.g.: Comcast), satellite (e.g.: Dish Network) and telco (e.g.: Verizon)
companies (Sheffer, 2014). These distribution companies most often provide TV, internet and
phone services either individually or in some sort of a bundle (for example TV+Internet or
TV+Internet+Phone) (Sheehy, 2013). The TV service is usually available in form of a package deal
including several different TV channels and possibly other services as well, such as VoD. This third
tier represents the Pay TV industry, whose main competitors are grouped into the aforementioned
cable, satellite and telco groups, which differentiation is based on the technology these companies
rely on for providing their services.
Satellite service providers have a major advantage over the cable companies, when it comes to
providing services to people living in remote areas that cannot obtain any cable service (Digital
Landing, 2012), but even though that satellite and telco companies can have larger coverage areas
(for instance according to the KVH Industries satellite coverage maps, one of the largest satellite
provider’s services, Dish Network, is available at least throughout the “main” 48 states) or that
satellite providers can offer programming, which would not be possible to obtain by cable
companies, cable services are the most popular. As mentioned above, in 2013 cable providers
dominated the Pay TV market with 53% share of the subscribers, whereas the satellite and telco
companies had the remaining 34% and 11% of subscribers respectively (NCTA).
It is noteworthy to mention that this data only refers to the Pay TV industry of the USA and does
not count for the subscribers and market shares of other forms of video entertainments available for
the American consumers, such as video rental or free-TV.
Major Players
In 2008, the top four players of the US Pay TV industry were Comcast, DirecTV, Dish Network and
Time Warner Cable with 23,8%, 17,4%, 13,5% and 12,9% respective market shares (Statista,
2015). This means that, in 2008, 67,6% of the total Pay TV market was served by the four major
incumbents alone. Over time however, the presence of new players have somewhat diluted this

15 | P a g e
Figure 1
Source: Parks Associates, 2014
concentration level. In 2014, the same four incumbents’ estimated combined market share was
approximately 65,3% (Statista, 2015).
2.2.2. Over-The-Top Industry
As a result of the widespread use of internet and not to mention the improved attributes of the
service (speed and reliability), consumers today have much more control over their content then
before. Today OTT services provide access for consumers to most of the same digital content what
traditional TV provides (Naseem et al., 2014), but the provided service is significantly different.
Although the OTT industry shares some similarities with the Pay TV industry, especially with the
IPTV services provided by telco companies, it is not correct to list these services under the Pay TV
services. While both industries occupy the same position in the aforementioned three-tiered system,
these two industries have different business models, “delivery systems”, content and costs, just to
mention a few (Narang, 2013). The most important difference, though, is that while Pay TV
companies use their own networks or infrastructure to delivery their services, most OTT providers
have no ownership over the network or infrastructure (Sheehy, 2013; Sheffer, 2015). Content is
delivered through the Internet using a network managed by another company. Therefore all of the
operating costs of OTT service providers are mostly related to providing their core service, whereas
Pay TV providers have significant costs
related to their infrastructure as well.
Major Players
As the OTT market is a relatively new
market, which is in its growth period, it is
hard to find exact estimates on market
shares. On the other hand, all research and
also Graph 1 show that the most important
players are Hulu, Hulu Plus, Amazon Prime
and finally Netflix, who clearly dominates
the market (Sheffer, 2015).

16 | P a g e
2.2.3. Source of Interdependence
Revenue in the television industry as a whole is generated by multiple methods, but the primary
revenue sources that are mainly related both to the Pay TV and OTT industry are subscription fees,
license agreements and advertising fees. As the players are often dependent on each other, the
competition is somewhat complex.
The main product of any television service is the provided content. If we look away from the aspect
of programming/scheduling or rather the availability, content is the most important dimension that
draws in the audience. If a company does not have any content, it has to create or license some.
Companies that own content often syndicate their programs to their competition for reruns (Auletta,
2014), to earn some extra revenue, and this is where the players become interdependent. Everybody
is a competitor to everybody, but every competitor is also a potential revenue source.
The example of Netflix airing prior seasons of the popular television show, Breaking Bad,
illustrates this interdependence very well. Not only did the content owners gain a new source of
revenue by syndicating the prior seasons to Netflix, but they also gained increased ratings and
viewership for the current seasons (Auletta, 2014).
2.3. Market Analysis
Regardless of which industry we talk about, analyzing its fundamental attractiveness provides us
with valuable information, such as how competitive the industry is or where potential risk lies. This
section will analyze the television industry, as a whole, using PEST analysis. By doing so, we will
be able to identify what factors are the most relevant in terms of changing and influencing the
industry in the future. The reason for now using Michael E. Porter’s “Five Forces” analysis here and
only relying on the PEST analysis is that at this point finding out what influence external factors
have on the market evolution is more important than assessing the level of competitiveness.
PEST
Political/Legal
One of the most important legislation regarding the television industry was the Federal
Communication Commission’s Telecommunication Act of 1996, which opened up the

17 | P a g e
Figure 2 - US Revenue Growth of Netflix (2005-2011)
Source: Trefis, 2012
communication business for everyone, promoting competition in all telecommunications markets
(Economides, 1998).
Considering that content is the main product of the television industry, intellectual property rights
form a substantial part of both competition and source of revenues for all participants. Content
licensing has always been and will remain a significant part of the home entertainment industry.
Although the Pay TV industry has been established for quite a while and licensing agreements have
been employed for a long time, the OTT industry is a new segment of the television industry. As
relationships between entities are also relatively new, obtaining licensing agreements were initially
difficult. In the beginning, the film industry and content providers feared that streaming represented
a potential risk in the form of digital piracy, and therefore licensing deals were very limited and
hard to obtain for OTT providers (Auletta, 2014). Content providers then started to realize (in
around 2007-2009) that this potential threat was less significant and OTT players, most significantly
Netflix, provided a new source of revenue (Auletta, 2014).
As audience shifts away from traditional TV and the OTT market gains more and more popularity,
a new issue has started to rise. This issue was the net-neutrality, as of whether the internet should
remain free from competition. The question of whether access to all content on the internet should
be enabled or not, without favoring any, has been the latest concern of the FCC. Although the
decision has been reached, while writing this paper, net-neutrality will not be further considered in
this thesis.
Economical
Considering the economic factors influencing the US television market, predicting the actual effects
of the different factors can be
troublesome. For example an
increasing unemployment
rate and a slowing economy
could in many cases suggest
that the industry performance
will decreasing, but for the
consumers of the television
industry, the situation is
different, for people are

18 | P a g e
Table 1
Source: eMarketer, 2013
expected to have more time at their disposal (as a result of unemployment) and to spend a
significant amount of this time in front of their “TV sets”. However, the decrease of disposable
income could result in either switching the expensive television services to cheaper ones or simply
cutting the cords completely. The complexity of determining the effects can be seen for instance in
2008 and 2009 when the US economy has experienced -0,3% and -2,8% Real GDP decreases
(OECD), and the level of unemployment reached 5,8% and 9,3% (OECD) respectively. In the
meantime, Netflix has shown significant growth regardless of the economic situation (as Figure 2
shows above). On the other hand, the Pay TV Advertising revenues have experienced a slight step
back in 2009 (Statista, 2015).
Social-Cultural
New trends, like the growing use of mobile devices and the increasing popularity of Binge
Watching, indicate that people are more inclined to have the control in their own hands and watch
video content when and where they want to (Ooyala, 2015). The Cord-Cutting and Cord-Shaving
trends point toward that people seem to be getting dissatisfied with high cable fees and in general
with the old concept of linear television (Plunkett Research Ltd., 2014). Furthermore, the changes in
content consumption preferences are not just related to the actual timing and location of access, but
also to the amount of access people can get to the content. People prefer to get access to their
favourite videos and TV shows all at once. This behavior change can be most significantly observed
with the episodes and seasons of the favourite TV series, as people seem to prefer watching several
episodes at once, rather than watching them
one-by-one with few weeks of waiting time
in-between them.
What is also really interesting to see is how
the average time spent per day on major
media has evolved over time. According to
the findings of the research firm, eMarketer,
adults spent on average 5 hours and 16
minutes a day using some sort of digital
medium (not TV) in 2013, compared to 3
hours and 11 minutes from three years
before. Although other mediums have

19 | P a g e
Figure 3
suffered bigger or smaller losses over the observed period, TV has still managed to gain some more
popularity, yet not too significant. The most striking change can be observed with regards to the
usage of mobile devices. In 2010, American adults used mobile devices for 24 minutes on average
per day, which usage has experienced a dramatic growth of about 587% in the following three
years, averaging in 2 hours 21 minutes a day in 2013. Concluding upon the above mentioned socio-
cultural changes, one could assume that digital mobile devices seem to hold significant future
potential and social trends represent a key influencing factor of the entertainment industry.
Technological
As mentioned before, the new millennium has brought several technological improvements, which
have opened up the door to new opportunities. Probably the most important stepping stone of all
was the improved accessibility and speed of the Internet (OECD), for it has completely changed the
way people live today. Of course, much of these changes have a lot to do with the improvements of
mobile devices as well. Today it is completely normal to have internet connection no matter where
we are and not just smartphones, but tablets, personal computers and other smart devices with
internet connectivity and high-resolution screens represent a huge part of our lives. We are living in
a world where everybody wants
everything right away. Life is happening
much faster than 10-20 year ago. With
the proliferation of the internet (Figure
3), digitalization and the increased usage
of internet connected mobile devices;
the consumption of media content has
been elevated to new heights. As
platforms, delivery methods and
consumption evolves quickly, media
companies are forced to adopt fast or
else they may face serious consequences
(Plunkett Research, 2014).

20 | P a g e
2.4. Netflix – Company Description
Netflix was founded in California, USA, by a former high-school math teacher, Reed Hastings, and
his former colleague, Marc Randolph, in 1997 (Auletta, 2014). The initial idea of renting and
selling DVDs over the internet reportedly come to Hastings, when he received a $40 fine for
returning an overdue videotape, the Apollo 13 (Founding Universe). The initial strategy, which was
based on a pair of emerging technologies (DVD and the internet) and relied on the U.S. Postal
Service, was a service, where the consumer could rent movies online and receive them with the post
next day (Auletta, 2014). In 1999, a subscription system was launched that allowed customers to
rent an unlimited number of DVDs, one at a time, for a low monthly subscription fee (Netflix). In
2000, the company only had a few hundred thousand subscribers and it was not making any profit,
so Hastings then went to make an alliance with the video-rental giant, Blockbuster, and offered
them to sell 49% of Netflix, but Blockbuster was not interested (Auletta, 2014). However, Hastings
did not give up. The company first turned profitable and went public in 2002. The subscriber base
and the available DVD titles were continuously growing throughout the years, when in 2007,
management saw a new opportunity rising. Online streaming was added to the available services,
which allowed subscribers to instantly watch video content on their web-enabled devices (Netflix).
Although digital piracy was a huge concern for the film industry in the beginning and therefore
licensing deals were achieved at a reserved pace, this new service had truly started to grow the
company. Between 2007 and the end of 2009, the subscription base of Netflix increased with
approximately 4,5 million members (Auletta, 2014). Having its ups and downs in the last few years,
Netflix has become the leading streaming company around the world. It has entered the business of
original program production, has become the first internet TV-network winning the Primetime
Emmy Award and has reached more than fifty million subscribers globally (Netflix).
Netflix – The “Product”
As earlier mentioned, Netflix provides DVD and Blu-Ray rental and online streaming services.
Customers can sign up for different subscription plans that provide thousands of movies and TV
shows with unlimited access provided that they have internet-connected devices. Revenue is purely
generated through subscription fees, since Netflix does not sell advertisement and therefore its
content is ad-free. Subscription plans differ in terms of which of the above mentioned services the

21 | P a g e
particular customer wishes to subscribe for and the “size” of the subscription, which is the number
of discs that can be rented at one time or basically how many screens/logins a customer gets for the
streaming account.
The main selling point of the Netflix streaming service is that it offers a highly similar experience to
TV, but unlike linear programing, streaming is based on an À la carte programing (Lang, 2013).
The À la carte programing allows consumers to pick and choose what content they would like to
watch and enjoy it whenever they want it.

22 | P a g e
3. Analysis
3.1. Strategic Overview
As we have seen above, Netflix was founded in 1997 with the vision of revolutionizing the industry
of video renting. The initial service was DVD rental over the internet, mailed to the customer and
was available in one of three packages, priced differently. However, the founding father of Netflix,
Reed Hastings, became more convinced over time that the future of television lies in streaming
videos over the internet. Netflix introduced streaming as a free service bundled with its core service
in 2007. At that time, the online video streaming was a relatively new phenomenon and people were
not so familiar with this new service, but the market was nascent. Besides the fact that the market
had not been ready to totally adapt to streaming, Netflix had also had a very limited selection of
available videos for this particular market (Rangan, 2012). Even though the OTT market had only a
very few players at the time, the Pay TV market was already in a much more mature state, so
looking at the television industry of the US all together in 2007, the industry was already highly
competitive. At the time of starting the streaming service, the subscription base of Netflix was
approximately 7,5 million, but by the end of 2009 it has reached more than 12 million (Auletta,
2014). As a result of the online television market rapidly gaining popularity, the four major TV
networks joined the market in 2008. NBC and Fox (later joined by ABC) launched Hulu.com, CBS
launched tv.com in 2008 and a number of other players have entered the market since (Waterman,
Sherman, & Ji, 2012). Major Pay TV operators and their MVPDs joined the online television
market in 2010, which is most widely known as the “TV Everywhere” (TVE) movement
(Waterman & Sherman, 2013).
As streaming services were stimulating for the US video market growth, Netflix took advantage of
the technological advancements and upcoming consumer trends. By providing an advertisement
free a la carte service instead of the traditional bundling and making its streaming service available
on internet connected mobile devices, Netflix targeted a completely different market segment than
what the traditional operators focused on. Therefore, the product differentiation strategy formed a
major concern for Netflix, where the main aim was to provide a much more personal experience
than what Pay TV operators were offering. It enabled the consumers to cherry-pick their content
and watch it when and where they wanted it. Furthermore, it also cut away from the traditional “one

23 | P a g e
episode per week” offerings by making entire seasons of popular television series available all at
once and therefore catering to yet another trend, the trend of binge watching (Business Insider,
2014). Another crucial product differentiation of Netflix’s streaming services has been its
personalization feature. In order to provide an outstanding customer experience, Netflix has
engineered an in-house recommendation system, Cinematch, which uses the customer’s past
viewing behavior to suggest new content for them, and as we will see it later, it has proved to
provide a significant competitive advantage.
Rather than trying to break into the Pay TV market and steal market shares away from the
incumbents, Netflix began offering its streaming services at a low price, more like a complimentary
product. In the beginning, the streaming service was a free “add-on” service, but it had some
limitations. Customers were only able to stream content for a limited number of hours, which was
based on their actual subscription. For example a customer, who subscribed for a “three-DVD-at-a-
time” plan for $16.99 per month, could have streamed videos for 17 hours per month (Liedtke,
2008). However, this limitation was removed for all except the cheapest plan in 2008 (Liedtke,
2008), which was a defensive response to the aforementioned threat of new entrants. Later on, as
the market was growing fast enough, streaming became a stand-alone service and got priced, yet it
was still priced relatively low (compared to Pay TV services). Besides the low subscription prices,
Netflix offered new customers a one-month free trial (with limits on available library) and refused
to tie customers into long-term agreements.
It is noteworthy to mention that the reason why Netflix was able to provide its streaming services at
low subscription prices is, because it managed to leverage the technology provided opportunities
and was able to bypass the need for a national infrastructure. This has given an enormous advantage
for Netflix over the Pay TV operators, for its entire operating expenses are mostly related to its core
services.
Seeing that the streaming industry was rapidly expanding, incumbents of the Pay TV industry have
also entered the competition and extended their services with similar offerings under the TVE
movement. As an offensive move to the gains of the OTT market, they started to provide a la carte
aggregations of subsets of their online video programming and introduced second and third screen
options to enable the use of mobile devices (Ooyala, 2015). However, these services were only

24 | P a g e
available for monthly subscribers of some MVPDs in order to avoid cannibalization of their main
products.
Besides the form of service availability, content forms a significant part of the competition. In order
to be successful on the television market, the company has to have desirable content to offer to its
customers; otherwise it is facing some major disadvantages. Given that broadcasting networks and
the Pay TV industry had had a long standing relationship with content producers and owners, this
area initially provided those incumbents with a strong position in the negotiations over for licensing
deals. Not to mention that the vertical integration of several distribution companies acquiring
production firms, for example the merger of Comcast and NBC Universal (Goldfarb, 2010), had
potentially further increased these incumbents’ negotiation power (Dowling, Lechner & Thielmann,
1998). Although networks reached agreements to syndicate some of their television shows for
limited periods to Netflix, they refused to sell the current seasons. This put Netflix in a position,
where it largely depends on the film and television studios and other network license agreements
(Auletta, 2014). Not to mention that rising production and licensing costs did not help the situation.
This situation was similar to what HBO was facing several years ago, when it was being squeezed
by the system and so it started developing its own content (The New York Times, 2014). Just like
what HBO did at that time, Netflix also entered the business of original programming, which turned
out to be a great success. Using its data mining and predictive analytics algorithms (the earlier
mentioned Cinematch system), Netflix managed to produce success television-quality shows such
as “House of Cards” and “Orange is the New Black” winning several Emmys and diminishing its
dependency on content owners.
Despite of the fact that it is widely possible now for consumers to enjoy television-quality shows
through the services of OTT providers, it is interesting to see that Pay TV operators still have an
important advantage over OTT services. According to MediaPost (Ooyala, 2015), 43% of US
consumers still subscribe for their Pay TV services, because of the Live Sports content only
available there. As the economics of appointment viewing greatly differs from what is currently
viable for OTT operators, bundling more broadcasting of Live Events could be an option for Pay
TV operators to retain their subscriber bases.

25 | P a g e
Source: IHS Screen Digest Research 2013, from Telecom Tech News, 2013
Figure 4 - U.S. Pay TV Subscriber growth (2007-2016)
Figure 5
3.2. Market Evolution
In 2007, the US Pay TV industry
reached close to 100 million
subscribers and continued to grow
at a slow pace until 2012, when it
first experienced lower growth than
the year before (IHS Screen Digest
Research). According to the
research firm SNL Kagan, the Pay
TV industry only managed to add
46000 subscribers in 2012,
compared to its gains of 280 000 in 2011, and increased its subscription base to approximately
100,428 million subscribers up from 100,38 million (Szalai, 2013). This means that the industry
growth between 2011 and 2012 was merely 0,048%, followed by the first ever negative growth of
the industry in 2013 (Zach Equity Research). Another way to look at the situation is to consider the
rate of penetration and see how the potential market has developed over the same time period.
Considering the mentioned
growth problem, the potential
market of a given industry will
always have a limitation
within its geographical limits,
which would be reached at
100% of penetration in the
given situation. Therefore, the
eventual development of the
potential market size together
with penetration rates provides important insights. According to the U.S Census Bureau (O’Neill,
2014), the number of households in the United States increased from 113,3 million in 2005 to 122,5
million in 2013, and from an 88% penetration to a 86% respectively (Dixon, 2013) resulting in a
decline of the US Pay TV penetration rate. This tells us that the slowing growth of industry is not
caused by a shrinking market size, for the potential market has in fact increased over the observed
period.

26 | P a g e
Figure 6 - US Pay TV + OTT Industry
Growth (2008-2012)
Source: IDATE, 2013
Figure 7
Source: Nielsen, 2013
A potential reason for the decline in both subscriptions and penetration rate of the Pay TV industry
is that American consumers have started cutting their expensive Pay TV services and either
substituting them with much cheaper Over-The-Top services, like the services of Netflix and
Amazon Prime, or spending their time and money on other substitute solutions.
The Over-The-Top video industry has been a relatively new segment of the television industry,
starting in the early 2000s, and since then the industry has been experiencing significant growth. As
we can see from Figure 6 from the research company IDATE, which only considers two of the top
players of the OTT market, these services reached approximately 20 million subscribers by 2010,
which increased more than 10 million reaching over 30 million subscribers by the end of 2012.
Figure 7 shows how the subscription growth has been distributed among some of the top service
providers of this market between 2012 and 2013. By 2013, the OTT industry reached more than
41.5 million subscribers in the US (Strategy Analytics, 2014), resulting in a more than 30% growth
rate just between 2012 and 2013.
It is, however, important to mention that the Pay TV and the OTT industries are different industries
and the above information provided by Figure 6 can be misleading, especially if one would try to
estimate market shares based on subscriber bases. The reason for that is that many Pay TV
customers use streaming as a complimentary product or subscribe for more than one streaming
services. According to a Nielsen report (Zumberge, 2015), the percentage of households in the US
that subscribed for more than one OTT service in 2015 is approximately 13%.

27 | P a g e
The implications of this information are manifold. Firstly, we can see these OTT services as both
complimentary and supplementary products not just for the linear TV services, but also for each
other. Secondly, beside the fact that these services have the tendency to increase the overall market
size of the television market, as a whole, they do not have radical effects on the Pay TV industry, at
least not until now. Logical reasoning therefore suggests that the targeted customer segments of
OTT services are greatly different from those of the Pay TV industry. Thirdly, as the growth of the
Pay TV seems to stagnate at best, yet the OTT market is experiencing incredible popularity, it can
be expected that the OTT industry will possibly represent a potential threat to the Pay TV industry
in the future.
3.3. The Disruptive Innovation
If we take a closer look at what really happened to the television industry, we can see that the
innovation that took place, when Netflix started its streaming service, was the “introduction” of an
innovative business-model. Netflix did not invent television watching or watching films and
television shows. But by using unmanaged networks to deliver content, it redefined how content is
delivered to the consumers and by providing content in an a la carte system without any
advertisement, consumer have become enabled to have total control over their content in a different
way than before. The innovativeness of the new Netflix business-model is further increased, if we
take into consideration that Netflix also supports a wide range of mobile devices, set top boxes and
gaming consoles to enable users to reach its services.
What makes OTT services interesting at the individual level is that these services provide customers
with a cheap and alternative way of consuming content. Not to mention that the interactive
platform, through which the service is provided, is superior compared to traditional television
platforms and therefore it increases the value-added feature of the service. As core activities –
namely programing, broadcasting and even advertising – become threatened, while core assets –
content – remain valuable, the challenge then becomes to find new ways to create value, while
relationships with customers are changing (McGahan, 2004).

28 | P a g e
3.4. The Dimensions of Convergence
What is interesting to see is that the OTT and Pay TV markets are essentially two different markets.
Although both of them rely on the same basic assets, their provided services and main target
markets differ. However, the more television is trying to cater for the needs of the individual users
and the more online video streaming moves towards mass communication, convergence of the two
industries becomes inevitable (Dowling, Lechner, Thielmann, 1998). Industry boundaries start to
disappear and the two markets will overlap. However, this convergence does not mean that linear
TV will necessarily become obsolete; but it certainly reflects that the industry structure will change.
The Technological Dimension
By making content available on computers or through different websites the service is simply
delivered through a different platform. This means that the innovation that took place in the
television industry simply transfers the existing functionalities to a new platform and does not
create new functions.
The Need Dimension
In light of the earlier findings on influencing factors of the television industry, this new business-
model seems to be in line with the most current social-cultural trends. Furthermore, the increased
use of personal computers and internet-connected devices as tools for both work and entertainment
applications indicates that consumers are willing to accept the new forms of need fulfillment.
The Industry and Firm Dimension
The fact that the FCC and the Department of Justice have carried out investigations in terms of
whether TV Everywhere services provided by MVPDs represented anticompetitive measures
(Waterman, Sherman and Ji, 2012) is an example of convergence that is happening on an industrial
level. This ultimately means that the difference between the prevailing industry cultures and
regulations are diminishing and that the result of this convergence will potentially be a unified
market.
The Form of Convergence between the OTT and Pay TV Industries
Although the OTT market was initially providing rather a complimentary service to meet a larger or
new set of consumer needs together with the Pay TV industry, the rapid growth of this industry has

29 | P a g e
led to a new dimension. As Pay TV incumbents are entering the online video stream market and
OTT players are vertically integrating themselves to become more competitive, the services of these
two industries are becoming more and more interchangeable in terms of fulfilling certain consumer
needs. Therefore the two industries seem to converge in a competitive way, which often results in a
single new industry emerging from the two.
3.5. The Implications of Changes on the Industry Structure
In the following part, the discussion of implications will be structured by using Porter’s Five Forces
framework (Porter, 1980; 2001; Porter & Heppelmann, 2014). The analyzed industry in this
framework will be the newly formed industry and to identify the changes, the former Pay TV
industry will form the baseline of comparison.
Threat of Substitute Products
The most direct competitors in the television industry are: Linear TV, on demand, streaming, and
video rental/purchase.
Indirect competitors are radio, music, video games, “printed” media (Here printed media refers to
books and articles, but the consumption of these could easily be in digital format) and other
activities such as socializing.
There is not just a huge range of available substitute products and services for home entertainment,
but many of them have also become more easily available thanks to the technological developments
of the last decades. Most specifically, digitalization and the proliferation of the Internet have made
it extremely easy for customers to search for and obtain the available products and services of
basically all industries. Regarding the Pay TV industry, this change has had the most significant
effect on the switching costs. When changing from for example cable to satellite services, the
process can incur costs of changing the network and installing new equipment; however, with
cutting the cord and switching to OTT services consumers are able to avoid these costs and enjoy
highly similar alternatives for much cheaper prices. Porter’s “threat of substitutes” force becomes a
major concern, when through some sort of price competition consumers start to prefer the substitute
products (Greco, 2015).

30 | P a g e
As OTT services have the potential to significantly improve the price-performance trade-off of the
television industry, the threat of outside substitutes – indirect competition- reduces in importance.
However, this is not true within the television industry. With better price-performance features than
linear television, coping with online video streaming services becomes the number one priority for
industry incumbents.
Threat of New Entrants
Customer Switching Costs
Considering the technical aspect of the new services, if we assume that consumers potentially own
personal computers and use adequate broadband services for other personal activities then OTT
services are expected to lower the switching costs for customers. Although these services do require
consumers to adapt to new procedures and systems, the need for acquiring and setting up new
transmitting devices – namely the set-top-boxes, which are used by Pay TV providers – becomes
redundant.
On the other hand, exclusive license agreements do put a significant trade-off pressure on
consumers. This is because the most valuable asset of the industry is content and therefore upon
changing service provider, consumers potentially face an increased switching cost in terms of
content that they value.
Incumbency Advantages Independent of Size
Incumbents of the industry often possess advantages that are not available to new entrants. In case
of the television industry, these advantages stem from the legal side of the industry, since content
ownership requires long-term licensing agreements. Furthermore, vertical integration – like the
merger of a distributor and of a content production company, Comcast and NBCUniversal (Reuters,
2011) - leads to favourable relationships that limit the threat of entry.
Capital Requirements
With OTT services becoming stronger competitors in the fight for content licensing, the cost of
acquiring new distribution rights is increasing; however on the other hand, these services also make
31 | P a g e
the need of building their own infrastructure redundant and in general reduce all costs related to
physical assets. As a consequence, these players face smaller losses upon exiting the market.
Summing Up
Although the new market seems to alter some of the previous features, it is hard to say whether the
threat of new entrants becomes more or less relevant. In general, if potential returns are attractive on
the long run, the chance of new players entering will always increase.
While the current increased industry growth created by the OTT market is a tempting situation for
entry, for it enables the improvement of market positions without necessarily hurting incumbent, it
is hard to see how long this growth will last and whether the newly emerged market will be able to
sustain the attained market size.
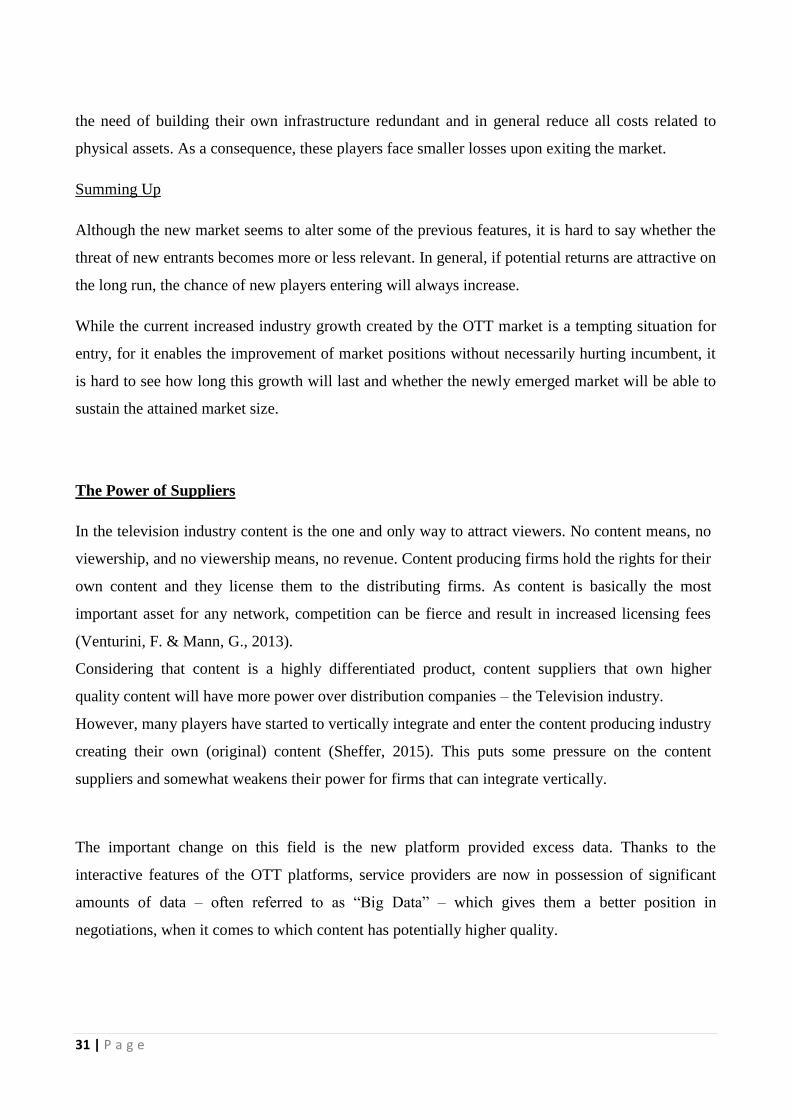
The Power of Suppliers
In the television industry content is the one and only way to attract viewers. No content means, no
viewership, and no viewership means, no revenue. Content producing firms hold the rights for their
own content and they license them to the distributing firms. As content is basically the most
important asset for any network, competition can be fierce and result in increased licensing fees
(Venturini, F. & Mann, G., 2013).
Considering that content is a highly differentiated product, content suppliers that own higher
quality content will have more power over distribution companies – the Television industry.
However, many players have started to vertically integrate and enter the content producing industry
creating their own (original) content (Sheffer, 2015). This puts some pressure on the content
suppliers and somewhat weakens their power for firms that can integrate vertically.
The important change on this field is the new platform provided excess data. Thanks to the
interactive features of the OTT platforms, service providers are now in possession of significant
amounts of data – often referred to as “Big Data” – which gives them a better position in
negotiations, when it comes to which content has potentially higher quality.

32 | P a g e
The perfect example of this advantage is the Netflix original, “House of Cards” television show,
which initially had troubles of finding investors; however, Netflix leveraging its “Big Data”
estimated that the show will gain significant popularity and ordered the first two seasons without
even requesting a pilot version. “House of Cards” later on became the first non-traditional television
show ever winning the Emmy Awards (Auletta, 2014).
The Bargaining Power of Buyers
The bargaining power of buyers only becomes significant, when there are major buyers (Greco,
2015), whose buying behavior can have critical effects. Since buyers of television services are the
individual end-consumers, the bargaining power of buyers becomes less significant. However, as
the revenue earning power of any company in the television industry depends on its viewership, one
could argue that the importance of this force increases. Since no matter what form of revenue
stream a company has, if it starts losing its viewers or subscribers, revenues from paid
subscriptions, advertising or license fees for own content will shrink as well. Therefore the
bargaining power of buyers is originally significant.
It is generally believed that the spread of the Internet shifts some of the power to the consumers’
hand by reducing their searching and switching costs. This coupled with trends, like the increasing
popularity of binge watching, have resulted in weakened customer loyalty in the television industry.
As OTT services provide cheaper and considerably better ways to watch movies and TV, the
bargaining power further increases at the expense of industry profits.
Rivalry among competitors
Leading Pay TV providers in the television industry are often diversified into other parts of the
industry, not to mention that they offer other services besides their Pay TV services. These
companies are threatened less by new entrants. However, during the last two decades the rivalry on
the television industry has shifted. The old way of watching television was based on a one-way
system, where customers basically just received their programing. Thanks to the technological
improvements, consumers now have the chance to use two-way systems and choose their
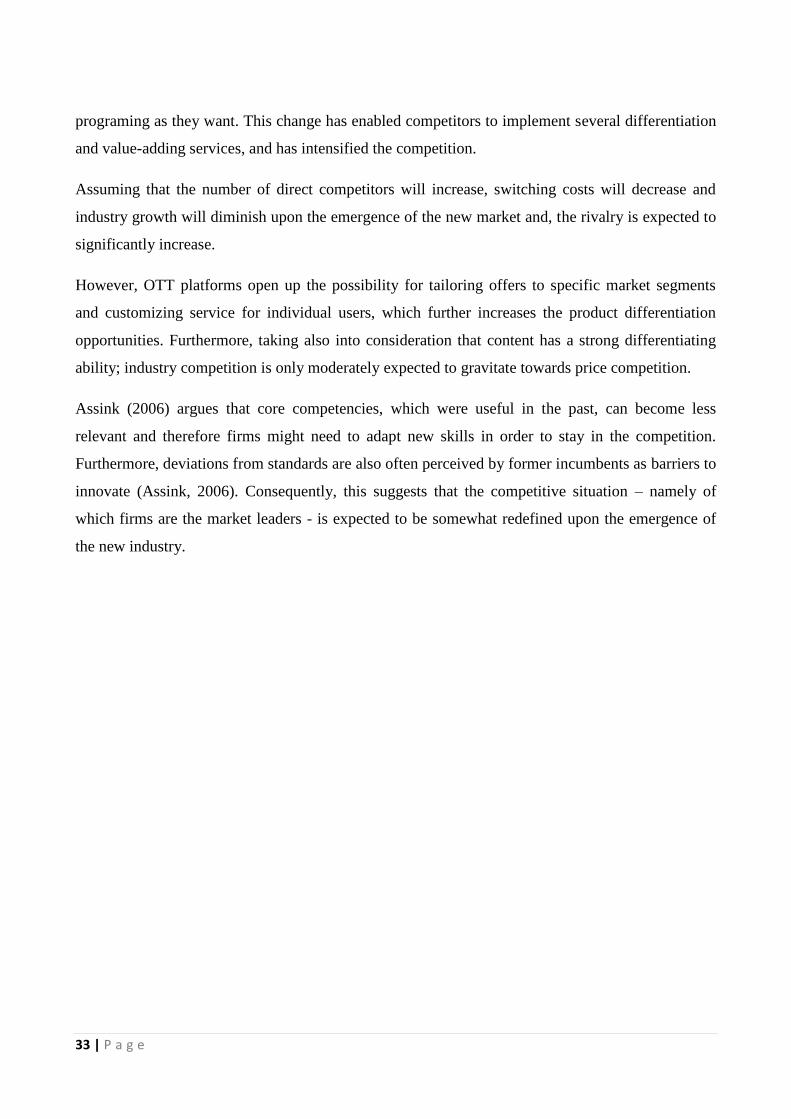
33 | P a g e
programing as they want. This change has enabled competitors to implement several differentiation
and value-adding services, and has intensified the competition.
Assuming that the number of direct competitors will increase, switching costs will decrease and
industry growth will diminish upon the emergence of the new market and, the rivalry is expected to
significantly increase.
However, OTT platforms open up the possibility for tailoring offers to specific market segments
and customizing service for individual users, which further increases the product differentiation
opportunities. Furthermore, taking also into consideration that content has a strong differentiating
ability; industry competition is only moderately expected to gravitate towards price competition.
Assink (2006) argues that core competencies, which were useful in the past, can become less
relevant and therefore firms might need to adapt new skills in order to stay in the competition.
Furthermore, deviations from standards are also often perceived by former incumbents as barriers to
innovate (Assink, 2006). Consequently, this suggests that the competitive situation – namely of
which firms are the market leaders - is expected to be somewhat redefined upon the emergence of
the new industry.

34 | P a g e
4. Consumer Welfare
As economic theory suggests (Papies and Clement, 2008), demand for a particular (media)
product/service is mainly influenced by price, perceived utility, tastes and income. However, the
most important factor with regards to calculating consumer surplus is the change in prices. If we
assume that the above hypothesized changes take place leaving everything, but prices, stay the same
from the consumers perspective, the result will be an altered consumer surplus. On the other hand,
this assumption would fail to capture the OTT market provided value of services compared to the
Pay TV services, as Christensen (1997) argues that disruptive innovations often create new market
values. As Markides (2006) explains, business-model disruptors more often than not offer different
product attributes than what traditional business models emphasize, and therefore they appeal to
new markets. These new markets are less important for established incumbents or did not even exist
before. By providing these new products/services to the previously underserved market, disruptive
innovation tends to create value, which is inherently positive for consumers. Over time, however,
these new business models can grow and evolve to such an extent that they can hurt established
incumbents, and while it often happens that these new models offer cheaper and superior
performance with the new attributes, they can take on established customers as well (Charitou and
Markides, 2003).
Furthermore, as Picard (2000) argues, industry convergence in communication does not create
radical changes. The primary result of the OTT and Pay TV industries, however, leads to increased
opportunities and enhanced features for consumers. By enabling consumers to do what they are
already doing in a faster, more efficient and more flexible way, convergence creates value for
consumers. In addition, empirical findings show (Brynjolfsson, Smith and Hu, 2002) that enhanced
product features provided by the electronic market can also significantly improve consumer
welfare.
Therefore, if we assume that everything stays the same from the consumers’ point of view, except
the fact that product attributes improve, the effect of disruptive innovations and industry
convergence – in general and also with regards to the television industry - on consumer surplus will
be positive.

35 | P a g e
5. Conclusion
As outlined in the problem formulation, the main purpose of this research was to identify how the
arrival of the online video streaming services (OTT market) has affected the television industry and
what implications they have on consumer welfare. The thesis therefore sought out to investigate
how the US television market has evolved and
First of all, the analysis indicated that there have been significant alterations in two of the most
influential factors – namely the technological and social-cultural aspects - of the industry, which
have led to significant changes. As a result of new technological improvements, customers have
developed new desirable values. Consequently a new industry, the OTT industry, has emerged to
serve this newly formed market.
Using Netflix, the leading service provider of the Online Video Streaming industry, the study found
that transformation, what the US television industry is going through, is a result of both the
abovementioned changes in consumer trends and of a disruptive innovation - more specifically, the
business-model innovation of Netflix. Furthermore, the analysis of past strategic interactions has
suggested that the Pay TV and OTT industries are developing in a way that competitive
convergence of the two markets is increasingly expected. Consequently, these changes should
ultimately lead to the transformation of industry structures and to an altered competitive
environment. However, it is important to note again that the findings of this study are only
theoretical/hypothesized, as empirical analysis was not supported by the nature of the theoretical
framework.
Through the theoretical framework of disruptive innovation and industry convergence, the study
also discussed that the changing media landscape should not just lead to better services for
customers, but also to lower prices. Therefore, consumers are expected to benefit from the above
discussed developments in the long-run.
To conclude, the study indicates that the US television industry – namely the Pay TV industry –
seems to be affected by the combination of the prevailing consumer trends and the OTT industry,
and therefore industry structures are transforming. These changes, however, in favour of the
consumers, as they are promoting both newly formed and established consumer values.

36 | P a g e
6. Bibliography
Assink, M. (2006). Inhibitors of disruptive innovation capability: a conceptual model.European
Journal of Innovation Management, 9(2), 215-233. doi:10.1108/14601060610663587
Auletta, Ken (2014, February 3). Outside the Box - Netflix and the Future of Television. Accessed
on 03 April 2015, Retrieved from http://www.newyorker.com/magazine/2014/02/03/outside-the-
box-2
Bakos, Y., & Brynjolfsson, E. (2000). Bundling and Competition on the Internet.Marketing
Science, 19(1), 63-82. doi:10.1287/mksc.19.1.63.15182
Brynjolfsson, E., Smith, M. D., & Hu, Y. J. (2002). Consumer Surplus in the Digital Economy:
Estimating the Value of Increased Product Variety. Sloan School of Management.
Business Insider (2014, September 12). Netflix: the revolution that changed the US TV landscape -
Business Insider. Accessed on 03 April 2015, Retrieved from http://www.businessinsider.com/afp-
netflix-the-revolution-that-changed-the-us-tv-landscape-2014-9#ixzz3XemztkUS
Charitou, C.D. & Markides, C.C. (2003). Responses to Diruptive Strategic Innovation. MIT Sloan
Management Review, Winter 2003, Vol. 44 Issue 2, p.55-63.
Christensen, C. M. (1997). The Innovator's Dilemma: When New Technologies Cause Great Firms
to Fail. Harward Business School Press.
Digital Landing. (2012, August 3). 20 Questions and 20 Answers: Cable vs Satellite TV » Digital
Landing. Accessed on 03 April 2015, Retrieved from http://www.digitallanding.com/20-questions-
cable-vs-satellite-tv/
Dixon, C. (2013, October 24). Wait, we forgot housing starts! Pay-TV penetration in decline
ScreenMedia. Accessed on 03 April 2015, Retrieved from http://www.nscreenmedia.com/wait-we-
forgot-housing-starts-pay-tv-penetration-in-decline/
Dowling, M., Lechner, C., & Thielmann, B. (1998). Convergence - Innovation and Change of
Market Structures between Television and Online Services. Electronic Markets, 8(4), 31-35.
doi:10.1080/10196789800000053
Economides, N. (1998, September). The Telecommunications Act of 1996 and its Impact.
Accessed on 03 April 2015, Retrieved from http://www.stern.nyu.edu/networks/telco96.html
EMarketer. (2013, August 1). Digital Set to Surpass TV in Time Spent with US Media - eMarketer.
Accessed on 03 April 2015, Retrieved from http://www.emarketer.com/Article/Digital-Set-
Surpass-TV-Time-Spent-with-US-Media/1010096
Feldt, Mark (n.d.). The History of The VHS Movie Industry. Accessed on 03 April 2015, Retrieved
from https://entertainment-industry.knoji.com/the-history-of-the-vhs-movie-industry/

37 | P a g e
Founding Universe. (n.d.). History of Netflix, Inc. – FundingUniverse. Accessed on 03 April 2015,
Retrieved from http://www.fundinguniverse.com/company-histories/netflix-inc-history/
Greco, Albert N. (2015). The economics of the publishing and information industries: The search
for yield in a disintermediated world.
Goldfarb, C. B. (2010, February 2). The Proposed Comcast-NBC Universal Combination: How It
Might Affect the Video Market. Accessed on 26 April, 2015, Retrieved from
http://www.carseywolf.ucsb.edu/files/CRS-Comcast-excerpt.pdf
IDATE. (2013, March 28). Pay-TV vs SVoD « DigiWorld by IDATE Blog. Accessed on 03 April
2015, Retrieved from http://blog.idate.fr/pay-tv-vs-svod/
KVH Industries, INC. (n.d.). United States Coverage: DISH Network. Accessed on 03 April 2015,
Retrieved from http://www.kvh.com/Pages/Satellite-Coverage-Maps/Satellite-Coverage-
Maps/TracVision-Maps/North-America/DISH-Network-US-Marine.aspx
Lang, B. (2013, September 25). Netflix, A La Carte Cable Favored by Majority of Customers,
Study Finds. Accessed on 03 April 2015, Retrieved from http://www.thewrap.com/majority-of-
customers-want-a-la-carte-cable-study-finds/
Lee, E. - Bloomberg (2014, March 19). TV Subscriptions Fall for First Time as Viewers Cut the
Cord - Bloomberg Business. Accessed on 03 April 2015, Retrieved from
http://www.bloomberg.com/news/articles/2014-03-19/u-s-pay-tv-subscriptions-fall-for-first-time-
as-streaming-gains
LIEDTKE, M. (2008, January 13). Netflix Expands Internet Viewing Option. Accessed on 03 April
2015, Retrieved from http://web.archive.org/web/20080115195018/http://www.sfgate.com/cgi-
bin/article.cgi?f=/n/a/2008/01/13/financial/f090113S93.DTL
MarketingCharts.com. (n.d.). US Pay-TV Penetration Rates, 2010-2014. Accessed on 03 April
2015, Retrieved from http://www.marketingcharts.com/television/us-pay-tv-penetration-2010-
2014-45625/
Markides, C. (2006). Disruptive Innovation: In Need of Better Theory. Journal of Product
Innovation Management, 23, 19-25. doi:10.1111/j.1540-5885.2005.00177.x
McGahan, A. M. (2004, October). How Industries Change - HBR., Accessed on 03 April 2015,
Retrieved from https://hbr.org/2004/10/how-industries-change
Narang, N. (2013, April 19). #2 Concept Series : What is the Difference between OTT and IPTV.
Accessed on 03 April 2015, Retrieved from www.mediaentertainmentinfo.com/2013/04/2-concept-
series-what-is-the-difference-between-ott-and-iptv.html/
NCTA - Then & Now: Pay TV Competition - Cable Industry Data | NCTA. (2015, February 28).
Accessed on 03 April 2015, Retrieved from https://www.ncta.com/industry-data
38 | P a g e
Naseem, A., Tehrani, P., Nayak, S., Kasnavi, A., & Chew, D. (2014, November 2). Cutting the
Cord. Accessed on 03 April 2015, Retrieved from
https://ikhlaqsidhu.files.wordpress.com/2015/01/cut_the_cord.pdf
Netflix - A brief history of the company that revolutionized watching of movies and TV shows.
(n.d.). Accessed on 03 April 2015, Retrieved from
https://pr.netflix.com/WebClient/loginPageSalesNetWorksAction.do?contentGroupId=10477
New York Times - Carter, Bill (2014, January 22). Strong Finish to 2013 for Netflix as Profit and
Subscriptions Soar. Accessed on 03 April 2015, Retrieved from
http://www.nytimes.com/2014/01/23/business/media/growth-of-netflix-subscribers-surpasses-
analysts-expectations.html?_r=0
Nielsen. (2013, September 18). “Binging” is the New Viewing for Over-The-Top Streamers.
Accessed on 03 April 2015, Retrieved from
http://www.nielsen.com/us/en/insights/news/2013/binging-is-the-new-viewing-for-over-the-top-
streamers.html
OECD
- Internet access (indicator). doi: 10.1787/69c2b997-en (Accessed on 03 April 2015)
- Wireless mobile broadband subscriptions (indicator). doi: 10.1787/1277ddc6-en
(Accessed on 03 April 2015)
- Real GDP forecast (indicator). doi: 10.1787/1f84150b-en (Accessed on 03 April 2015)
- Employment rate (indicator). doi: 10.1787/1de68a9b-en (Accessed on 03 April 2015)
- Unemployment rate (indicator). doi: 10.1787/997c8750-en (Accessed on 03 April 2015)
O'Neill, Jim (2014, September 2). Pay-TV penetration numbers continue to decline in US.
Accessed on 03 April 2015, Retrieved from http://www.ooyala.com/videomind/blog/report-pay-tv-
penetration-numbers-continue-decline-us
Ooyala. (2015). 2015 State of the Broadcast Industry. Accessed on 03 April 2015, Retrieved from
http://go.ooyala.com/rs/OOYALA/images/Ooyala-State-Of-The-Broadcast-Industry.pdf
Papies, D., & Clement, M. (2008). Adoption of New Movie Distribution Services on the
Internet. Journal of Media Economics, (21), 131-157. doi:10.1080/08997760802300530
Parks Associates. (2014, May 1). New consumer research proves Amazon gaining traction in
connected home technology market. Accessed on 03 April 2015, Retrieved from
http://www.parksassociates.com/blog/article/pr-may2014-amazon-netflix
Parsons, Patrick (2008). Blue skies: A history of cable television. Philadelphia: Temple University
Press.

39 | P a g e
Pew Research Center. (2014, February 27). 25th Web Anniversary | Pew Research Center's
Internet & American Life Project. Accessed on 27 April 2015,Retrieved from
http://www.pewinternet.org/2014/02/27/the-web-at-25-in-the-u-s/
Picard, R. G. (2000). Changing business models of online content services: Their implications for
multimedia and other content producers. The International Journal on Media Management, 2(11),
60-68. doi:10.1080/14241270009389923
Plunkett Research, Ltd. (2014, November 11). Entertainment, Media, Publishing & Broadcasting
Business Trends Analysis. Accessed on 03 April 2015, Retrieved from
http://www.plunkettresearch.com/trends-analysis/enertainment-media-publishing-business-market/
Porter, M. E. (1980). Competitive strategy: Techniques for analyzing industries and competitors.
New York: Free Press.
Porter, M. E. (2001) "Strategy and the Internet," Harvard Business Review, March 2001: 62-78
Porter, M. E., & Heppelmann, J. E. (2014, November). How Smart, Connected Products Are
Transforming Competition - HBR. Accessed on 03 April 2015, Retrieved from
https://hbr.org/2014/11/how-smart-connected-products-are-transforming-competition
PricewaterhouseCoopers. (2005, January). Big Bets for the U.S. Cable Industry. Accessed on 03
April 2015, Retrieved from http://www.pwc.com/us/en/technology-innovation-
center/assets/mso_wb-x.pdf
Rangan, K. (2012, April 2). Netflix Wasn’t All Wrong. Accessed on 03 April 2015, Retrieved from
http://www.strategy-business.com/article/cs00003?pg=all
Reuters. (2011, January 29). Comcast completes NBC Universal merger| Reuters. Retrieved from
http://www.reuters.com/article/2011/01/29/us-comcast-nbc-idUSTRE70S2WZ20110129
Sandvine Intelligent Broadband Networks. (2013). Global Internet Phenomena Report 1H 2013.
Accessed on 03 April 2015, Retrieved from https://www.sandvine.com/downloads/general/global-
internet-phenomena/2013/sandvine-global-internet-phenomena-report-1h-2013.pdf
Shapiro, C., & Varian, H. R. (1999). Information rules: A strategic guide to the network economy.
Boston, MA: Harvard Business School Press.
Sheehy, A. (2013, October 2). Does Netflix Have a Better, or Worse Business Model than
Comcast? Accessed on 03 April 2015, Retrieved from
www.generatorresearch.com/tekcarta/analysis-insight/does-netflix-have-a-better-or-worse-business-
model-than-comcast/
Sheffer Ray. (2015, March 9). Cost is main reason for vertical integration in media industry -
Market Realist. Accessed on 03 April 2015, Retrieved from http://marketrealist.com/2015/03/cost-
main-reason-vertical-integration-media-industry/

40 | P a g e
Sheffer, Ray (2015, March 9). The US media industry: A three-tiered system - Market Realist.
Accessed on 03 April 2015, Retrieved from http://marketrealist.com/2015/03/us-media-industry-
three-tiered-system/
Statista 2015
- Time Warner Cable's pay TV market share in the United States from 2008 to 2021.
Retrieved April 25, 2015, from www.statista.com.esc-
web.lib.cbs.dk/statistics/251361/time-warner-cable--pay-tv-market-share/
- Dish Network's pay TV market share in the United States from 2008 to 2020.
Retrieved April 25, 2015, from www.statista.com.esc-
web.lib.cbs.dk/statistics/251747/dish-networks-pay-tv-market-share/
- DirecTV's pay TV market share in the United States from 2008 to 2020.
Retrieved April 25, 2015, from http://www.statista.com.esc-
web.lib.cbs.dk/statistics/251741/directvs-pay-tv-market-share/
- Comcast's pay TV market share in the United States from 2008 to 2020.
Retrieved April 25, 2015, from http://www.statista.com.esc-
web.lib.cbs.dk/statistics/251691/comcasts-pay-tv-market-share/
- Pay TV Ad Revenue in the United States from 2007 to 2016 (in billion U.S. dollars).
Retrieved April 25, 2015, from http://www.statista.com.esc-
web.lib.cbs.dk/statistics/251891/pay-tv-advertising-revenue-in-the-us/
Strategic Analytics. (2014, September 2). North American SVOD Subscriptions to Grow to 73.4
million by year-end 2018. Accessed on 03 April 2015, Retrieved from
http://blogs.strategyanalytics.com/DMS/?tag=/US
Szalai, Georg (2013, November 3). U.S. Pay-TV Industry Sub Growth Hits Low in 2012 -
Hollywood Reporter. Accessed on 03 April 2015, Retrieved from
http://www.hollywoodreporter.com/news/us-pay-tv-industry-growth-427390
Telecom Tech News. (2013, January 22). Will TV Everywhere reverse the trend for Pay-TV? -
Telecom Tech News. Accessed on 03 April 2015, Retrieved from
http://www.telecomstechnews.com/news/2013/jan/22/will-tv-everywhere-reverse-the-trend-for-pay-
tv/
Stephens, Mitchell (2000). History of Television. Accessed on 03 April 2015, Retrieved from
https://www.nyu.edu/classes/stephens/History%20of%20Television%20page.htm
The Interactive Television Dictionary and Business Index. (2015). The iTV Dictionary and
Business Index™. Accessed on 03 April 2015, Retrieved from http://www.itvdictionary.com
The New York Times (2014, April 25). Netflix vs. Amazon, and the New Economics of
Television. Accessed on 03 April 2015, Retrieved from
http://www.nytimes.com/2014/04/27/upshot/netflix-vs-amazon-and-the-new-economics-of-
television.html?abt=0002&abg=1&_r=0

41 | P a g e
Trefis. (2012, October 16). The U.S. Netflix Story: Evolving Competition Threatens Growth --
Trefis. Accessed on 03 April 2015, Retrieved from
http://www.trefis.com/stock/nflx/articles/146469/the-u-s-netflix-story-evolving-competition-
threatens-growth/2012-10-16
Venturini, Francesco & Mann, Gavin (2013, December). The future of broadcasting: Leveraging
innovation for competitive advantage | Accenture Outlook. Accessed on 03 April 2015, Retrieved
from http://www.accenture.com/us-en/outlook/Pages/outlook-online-2013-future-of-broadcasting-
leveraging-innovation-for-competitive-advantage-media.aspx
Waterman, D., and Ji, S.W. 2012. “Online vs. Offline in the U.S.: Are the Media Shrinking?” The
Information Society 28, 5.
Waterman and Sherman (2013) "Technology and Competition in U.S. Television: Online vs.
Offline"
Waterman, Sherman and Ji (2012) "The Economics of Online Television: Industry Development,
Aggregation, and 'TV Everywhere'," Telecommunications Policy 37: 725-736.
Zach Equity Research. (2014, March 20). Distressing Times for U.S. Pay-TV Industry - March 20,
2014 - Zacks.com. Accessed on 03 April 2015, Retrieved from
http://www.zacks.com/stock/news/127114/distressing-times-for-us-paytv-industry
Zumberge, M. (2015, March 11). Nielsen Report Sheds Light on U.S. SVOD Audience | Variety.
Accessed on 03 April 2015, Retrieved from http://variety.com/2015/digital/news/nielsen-report-
sheds-light-on-u-s-svod-audience-1201450317/
Yoffie, D. B. (1996). Competing in the Age of Digital Convergence. California Management
Review, 38(4), p.31-53.