amus 12-03-13 emerging markets debt - benefits …...2012/04/02 · 1 amus 12-03-13 emerging...
TRANSCRIPT

1
AM
US 12-03-13
Emerging Markets Debt:Myths and Realities amid a Multi-speed World
One on one presentation. Not for further distribution.
Peter Marber, Chief business strategist, Emerging markets debt and currencies (New York)
AM
US 12-03-13
Investment industry is often shaped by “lottery psychology” or an “overconfidence bias”
Lotteries are generally a bad bet– Odds are stacked against buyers but we buy anyway– Why? The “overconfidence bias”– Leads to the “escalating commitment”
Investment portfolios are often built like a series of lottery tickets– Odds of good performance are really small– Too much risk, not enough return
Traditional benchmarks feed the psychology– Belief that high volatility assets lead to good investment returns
One on one presentation. Not for further distribution. 2
The information above is provided by and represents the opinions of HSBC Global Asset Management and are subject to change.

2
AM
US 12-03-13
The collective wisdom of investing is also filled with many myths
Question: How many of these statements are true?– Stocks outperform bonds– High beta stocks outperform low beta stocksHigh beta stocks outperform low beta stocks– Emerging market stocks outperform emerging markets
bonds and currencies– Emerging market stocks are the best way to capture fast
GDP growth
One on one presentation. Not for further distribution. 3
The information above is provided by and represents the opinions of HSBC Global Asset Management and are subject to change.
AM
US 12-03-13
Many investors tend to build portfolios filled with risk that yield little return
What price do we pay for return?– Volatility!– Many investors pay more than they need to as part ofMany investors pay more than they need to as part of
the overconfidence effect– Few investors look to risk-adjusted statistics in
determining asset allocation
There is little statistical correlation between an asset’s volatility and it’s return over time– Many investors think higher volatile assets have higher
returns– So do many managers, too
One on one presentation. Not for further distribution. 4
– Few investors look at correlation analysis, volatility, tracking error, drawdown analysis, Information ratio or Sharpe ratio
The information above is provided by and represents the opinions of HSBC Global Asset Management and are subject to change.

3
AM
US 12-03-13
Separating Fact from Fiction
One on one presentation. Not for further distribution.
AM
US 12-03-13
Risk/return – where should you have been over the past 10+ years?
Fixed Income Index Annualized Volatility Annualized returns
EM Local Currency* JPM GBI-EM Global Div 11.91% 12.12%
EM H d C D bt JPM EMBIG 9 70% 10 37%
Equity Index Annualized Volatility Annualized returns
EM Equity MSCI EM 24.72% 5.48%
EM Hard Currency Debt JPM EMBIG 9.70% 10.37%
Global Bonds JPM Global Bonds 6.20% 6.80%
US Bonds JPM US Aggregate 3.85% 6.65%
Canadian Bonds DEX Universe Bond 3.55% 6.93%
Europe Bonds JPM Europe Aggregate 11.94% 7.05%
High Yield Bonds ML US High Yield 10.84% 6.82%
One on one presentation. Not for further distribution. 6
Past performance is not representative of future results. For index descriptions, please see disclosure at end of this presentation.Annualized Returns and Volatility from January 2000- December 2011. *Annualized Returns and Volatility for EM Local Currency from January 2003- December 2011
q y
Europe Equity Euro Stoxx 50 20.24% -6.01%
Global Equity MSCI World 17.02% -1.50%
US Equity S&P 500 16.34% -1.36%
Canadian Equity S&P/TSX Composite 15.75% 5.27%

4
AM
US 12-03-13
The missing ingredient: adding EM bonds to traditional “global bonds” January 2000 – December 2011
100% “Global”
80% “Global” 10% EM Local 10% EM Ext.
80% “Global” 10% Active TR 10% Active Ext.
Cumulative Return: 121.3%
Annualized Return: 6.80%
Cumulative Return: 132.6%
Annualized Return: 7.3%Cumulative Return: 154.7%
Annualized Return: 8 1%
One on one presentation. Not for further distribution. 7
ua ed etu 6 80%
Volatility: 6.20%
Return/Volatility: 1.10
Annualized Return: 7.3%
Volatility: 6.00%
Return/Volatility: 1.21
Annualized Return: 8.1%
Volatility: 5.70%
Return/Volatility: 1.41
“Global” – JPM GABI; EM Local - JP Morgan ELMI+ Index; EM Ext – JPM EMBI Global; Active TR – HSBC EMD Total Return Composite; Active Ext. – HSBC EMD Core Composite
Source :Bloomberg, HSBC Global Asset Management. Data as of 31 December 2011. Returns are shown gross of fees in USD. Past performance is not indicative of future performance. Return data is supplemental to the GIPS® compliant performance details in the Appendix. Indices are unmanaged and are not subject to fees and expenses typically associated with managed accounts or investment funds. Investments cannot be made directly in an index. The table shows the hypothetical performance an investor would have obtained had it invested in the manner shown and does not represent the results that any investor actually attained. The information presented is based, in part on hypothetical assumptions. Please see important disclosure at the end of this presentation concerning the impact of investment advisory fees and expenses on performance and benchmark definitions.
AM
US 12-03-13
What does a typical “global bond” portfolio look like?
About 90% US dollar, Euro, and Yen– Very concentrated
About 10% rest of World (Sterling, etc).About 10% rest of World (Sterling, etc).– Very little in EM bonds– EM often not even thought of as a separate allocation
No forward bias– Where will the world be in 2020?– Look at current yields
One on one presentation. Not for further distribution. 8
The information above is provided by and represents the opinions of HSBC Global Asset Management as based on the JP Morgan Global Aggregate Bond Index and is subject to change.

5
AM
US 12-03-13
40
50
60
Europe
Emerging Markets
Emerging market fundamentals continue to improve
60%
80%
100%
f Wor
ld2005-2010: world economy led by emerging marketsShifting center of gravity of the world economy
tribu
tion
to W
orld
gr
owth
(%
)
0
10
20
30
2 4 6 8
Japan
US0%
20%
40%
1980 1985 1990 1995 2000 2005 2010 2015
% o
f
Advanced Economies (USD) Advanced Economies (PPP)Emerging Economies (USD) Emerging Economies (PPP)
Source: World Economic Outlook, IMF, September 2011 Source: UBS, December 2010
Gross Public Debt: Emerging vs. Advanced As % of GDP (%)
80
100
120EMBI Global Credit Quality
80%
100%
Ave
rage
rela
tive
cont
Nom
inal
GD
P g
Average real GDP Y-0-Y growth (%)
One on one presentation. Not for further distribution. 9
Data as of 30 November 2011, since 31 December 1999. Source: HSBC Global Asset Management, Bloomberg, JP Morgan.
0
20
40
60
2001 2003 2005 2007 2009 2011 2013
Emerging Countries Advanced Economies
Source: IMF World Economic Outlook, September 2011, HSBC Global Asset Management. Emerging economies as classified by the IMF
0%
20%
40%
60%
2000 2001 2002 2003 2004 2005 2006 2007 2008 2009 2010 2011
IG BB B Residual
Any forecast, projection or target contained in this presentation is for information purposes only and is not guaranteed in any way. HSBC accepts no liability for any failure to meet such forecasts, projections or targets. Past performance is not indicative o future performance.
AM
US 12-03-13
8 distinct investable sectors – a broad opportunity setEmerging markets debt makes up approximately 12% of global bond market– Universe is expected to expand by approximately 10% per annum
External (hard currency) markets Local markets
Quasi-Sovereign StructuredCorporateSovereign Local FX Local Rates Corporate Inflation-
Linked
Local Debt Ratings
External Debt Ratings
Country Fundamentals
ValuationExternal Markets Local Markets
Sovereign Quasi-Sovereign Corporate Structured FX Rates Corporate Inflation-
LinkedAA- AA- Qatar + + +AA A Chil
HSBC products try to analyze the full range of investment opportunities– Looking for best risk-adjusted returns
One on one presentation. Not for further distribution. 10
Representative overview of the investment process, which may differ by product, client mandate or market conditions. The example shown is provided for informational purposes only and should not be deemed to be a recommendation to buy any specific securities. The information is provided to demonstrate the investment methodology underlying various investment scenarios and was not selected on the basis of any gain or loss and is provided for discussion purposes only. Any forecast, projection or target contained in this presentation is for information purposes only and is not guaranteed in any way. HSBC accepts no liability for any failure to meet such forecasts, projections or targets.
AA- A+ Chile + - -A+ A South Korea + - +A+ A- Malaysia -A A- Poland - +A+ BBB+ Mexico + + + + -A+ BBB+ South Africa + + -
6
AM
US 12-03-13
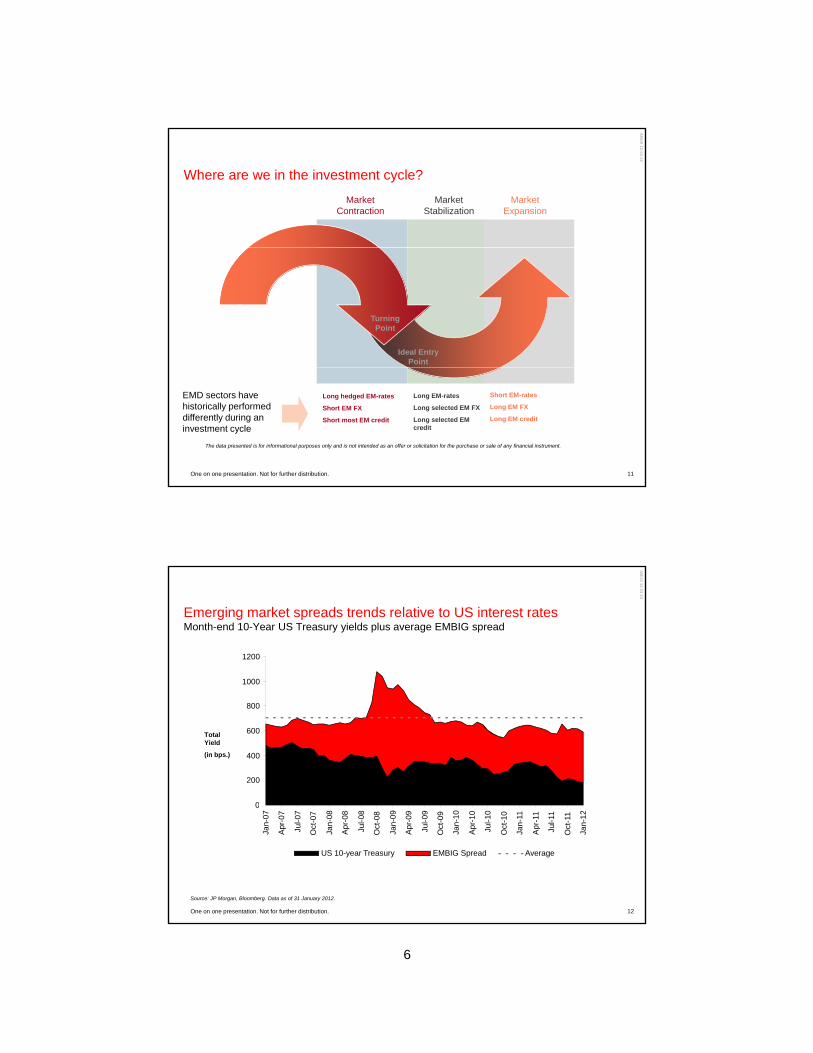
Where are we in the investment cycle?
MarketContraction
MarketStabilization
MarketExpansion
TurningPoint
Ideal EntryPoint
One on one presentation. Not for further distribution. 11
EMD sectors have historically performed differently during an investment cycle
Long hedged EM-rates
Short EM FX
Short most EM credit
Long EM-rates
Long selected EM FX
Long selected EM credit
Short EM-rates
Long EM FX
Long EM credit
The data presented is for informational purposes only and is not intended as an offer or solicitation for the purchase or sale of any financial instrument.
AM
US 12-03-13
Emerging market spreads trends relative to US interest ratesMonth-end 10-Year US Treasury yields plus average EMBIG spread
1000
1200
Total Yield
(in bps.)
0
200
400
600
800
One on one presentation. Not for further distribution. 12
Source: JP Morgan, Bloomberg. Data as of 31 January 2012.
0
Jan-
07
Apr
-07
Jul-0
7
Oct
-07
Jan-
08
Apr
-08
Jul-0
8
Oct
-08
Jan-
09
Apr
-09
Jul-0
9
Oct
-09
Jan-
10
Apr
-10
Jul-1
0
Oct
-10
Jan-
11
Apr
-11
Jul-1
1
Oct
-11
Jan-
12
US 10-year Treasury EMBIG Spread Average

7
AM
US 12-03-13
Emerging market bonds and currencies, like other markets, being held hostage by Eurozone crisis
One on one presentation. Not for further distribution. 13
Source: Bloomberg, as of 22 February 2012. The data presented is for informational purposes only and is not intended as an offer or solicitation for the purchase or sale of any financial instrument or investment strategy.
AM
US 12-03-13
Current GDP vs. PPP highlights potentially overvalued and undervalued currencies
Emerging markets theoretically undervalued?Industrialized economies vs. emerging economies
G G % f G G % fGDP ($ million)
PPP ($ million)
GDP% of PPP
GDP ($ million)
PPP ($ million)
GDP% of PPP
United States 15,060 15,060 100.0% India 1,843 4,470 41.23%United Kingdom 2,481 2,254 110.07% China 6,988 11,316 61.75%
Germany 3,629 3,089 117.48% Poland 532 767 69.36%
Canada 1,759 1,391 126.46% South Africa 422 555 76.04%
Japan 5,855 4,396 133.19% Mexico 1,185 1,659 71.43%
Sweden 572 380 150.53% Korea 1,164 1,556 74.81%
A stralia 1 507 920 163 80% T rke 763 1 055 72 32%
One on one presentation. Not for further distribution. 14
Australia 1,507 920 163.80% Turkey 763 1,055 72.32%
Denmark 349 209 166.99% Russia 1,885 2,376 79.34%
Switzerland 666 341 195.31% Brazil 2,518 2,309 109.05%
Source: IMF. Data as of October 2011 (latest available data). PPP – Purchasing Power Parity. Any forecast, projection or target contained in this presentation is for educational purposes. Data is provided for illustrative purposes only and is not intended as an offer or solicitation for the purchase or sale of any financial instrument or investment strategy. Past performance is not indicative of future performance.

8
AM
US 12-03-13
Conclusions
Solid fundamentals in emerging markets vs. slow growth in advanced economies– Most investor portfolios are concentrated in advanced economies,
ti l l b dparticularly bonds
Emerging markets debt – credit and currency – still offer value– Low yields in Dollars, Yen, and Euro may persist– Hard currency bonds could replace some Canadian government bonds to
boost yields– Local currency bonds could replace non-Canadian government bonds in
portfolios, offering higher yields and currency appreciation potential
Investors need to reassess risk reward and allocations amid the
One on one presentation. Not for further distribution. 15
Investors need to reassess risk, reward and allocations amid the reconfiguring world
The information above is provided by and represents the opinions of HSBC Global Asset Management and are subject to change.
AM
US 12-03-13
Appendix
One on one presentation. Not for further distribution.

9
AM
US 12-03-13
Emerging Markets Debt – Core GIPS® reportComposite Emerging Markets Debt Report To December 31, 2011Inception Date September 30, 1998 Reporting Currency US DollarBenchmark JP Morgan Emerging Markets Bond Index
GlobalReturn Type Gross
One on one presentation. Not for further distribution. 17
Past performance is not indicative of future performance. Returns greater than one year are annualized. Please see important disclosure at the end of this presentation concerning the impact of investment advisory fees and expenses on performance and for benchmark definitions.
AM
US 12-03-13
Emerging Markets Debt – Core GIPS® reportHSBC Global Asset Management (the Firm) claims compliance with the Global Investment Performance Standards (GIPS®) and has prepared and presented this report in compliance with the GIPS standards. The Firm has been independently verified for the periods 1 January 2006 through 31 December 2010. The resultant verification report is available upon request. Verification assesses whether (1) the firm has complied with all the composite construction requirements of the GIPS standards on a firm-wide basis and (2) the firm's policies and procedures are designed to calculate and present performance in compliance with the GIPS standards. Verification does not ensure the accuracy of any specific composite presentation.
The composite creation date is 31/08/2006
A complete list and description of all Firm composites, as well as additional information regarding policies for calculating and reporting returns, is available on request from the contact shown on the document or presentation to which this report is attached.
Prior to 2011 HSBC Global Asset Management maintained eight distinct GIPS Firms. The Firms were defined by legal business entity. All existing group Firms were thereafter amalgamated into a single global Firm definition. Historical performance shown prior to January 1, 2006 reflects the performance of a legacy Firm composite.
HSBC Global Asset Management (the Firm) consists of discretionary accounts and sub-accounts managed as discrete mandates within specified local HSBC Global Asset Management entities. The Firm comprises the following: HSBC Global Asset Management (Deutschland) GmbH, HSBC Global Asset Management (Hong Kong) Limited, HSBC Global Asset Management (USA) Inc., HSBC Global Asset Management (France), HSBC Global Asset Management (Canada) Limited, and HSBC Global Asset Management (UK) Limited. The Firm excludes portfolios and funds managed by the Alternative Investments teams, LDI products, French regulated employee (FCPE) schemes, and private client accounts as these products operate under a materially different philosophy and process and /or regulatory environment.
The Emerging Markets Debt composite consists of only actual, fee paying, fully discretionary accounts managed by HSBC Global Asset Management (USA) Inc. The underlying strategy may invest in investment grade, non-investment grade, and unrated emerging markets fixed income securities and other financial instruments either issued or guaranteed by governments, government agencie, supranational bodies of emerging markets countries, or emerging market companies, primarily denominated in US dollars. Investment results are measured versus the JP Morgan EMBI Global Index.
Performance returns are calculated gross of investment management fees and other non-trading related expenses.
The performance presented in this composite report is calculated net of unreclaimable withholding taxes.
Form ADV, Custody fees, performance fees. Please refer to Part 2A of HSBC Global Asset Management (USA) Inc's Form ADV for additional information on advisory fees. Actual client fees may be less. Annual custody fees are not included. Fees are negotiable at the discretion of HSBC Global Asset Management (USA) Inc.
Warnings: The historical performance presented in these reports should not be seen as an indication of future performance; The value of your investment and any income from it can go down as well as up. Where overseas securities are held the rate of exchange may cause the value of the investment to go down as well as up. Investors should also be aware that other performance calculation methods may produce different results, and that the results for specific portfolios and for different periods may vary from the returns presented in these reports; Comparisons of investment returns should consider qualitative circumstances and should be made only to portfolios with generally similar investment objectives. In the USA, this information is intended for use solely in one-on-one presentations
Significant Event - Benchmark Structural Change In May 2008, Brazil's credit rating was elevated to investment grade causing the JPM EMBI Global Index average rating to also become investment grade. Brazil comprises 15% of the JPM index and has a significant impact in the Emerging Market space. Due to this change, a portfolio was removed from the composite because its has a client specific benchmark that is comprised of only non investment grade EMD countries and as such the portfolio's benchmark no longer reflects the investment strategy represented by the composite The impact of
One on one presentation. Not for further distribution. 18
benchmark that is comprised of only non-investment grade EMD countries and as such the portfolio s benchmark no longer reflects the investment strategy represented by the composite. The impact of this change in the benchmark had a dramatic effect throughout the 3rd & 4th quarters of 2008 as the investment grade component of EMD considerably outperformed the below investment grade component. To coincide with the timing of this event, the HSBC Global Asset Management GIPS Composite Committee recommended removal of the account from the composite from 1 June 2008. The HSBC Global Asset Management Executive Committee approved this move on 24 March 2009.
Significant Event - Atlantic Advisors - Atlantic Advisors was acquired by HSBC Investments (USA) Inc. in June 2005. The members of Atlantic Advisors are now the global emerging markets fixed income team at HSBC Global Asset Management (USA) Inc. (formerly Halbis Capital Management (USA) Inc.). The composite performance results represent historical composite returns produced by the global emerging markets fixed income team while employed at the previous advisor linked, pursuant to GIPS Guidelines, with the performance results produced by the global emerging markets fixed income team since joining the firm.
Exchange Rates - The exchange rates used by accounts in this composite may be different than those used by the benchmark.
The management process for accounts in this composite uses leverage and short sales instruments as a source of potential return. The firm also may employ the following derivative instruments both for hedging and return enhancement purposes; Options on Securities & Securities Indices, Currency transactions, Repurchase agreements, Interest rate swaps, caps, floors, and collars, and Forward contracts on securities or currencies. The firm also reserves the right to use new derivative techniques and instruments that may be developed in the future.
Usage of Pre 2000 data The performance for periods presented prior to 1 January 2000 is not GIPS compliant as not all funds managed by the Firm have been allocated to composites for these periods. All funds which are eligible for inclusion in this composite have been included in the performance shown.

10
AM
US 12-03-13
Emerging Markets Debt – Local Debt GIPS® reportComposite Emerging Markets Debt – Local DebtReport To December 31, 2011Inception Date July 31, 2007 Reporting Currency US DollarBenchmark Customized Benchmark Return Type Gross
One on one presentation. Not for further distribution. 19
As of 01 January 2011 the Emerging Markets Local Debt Benchmark changed from the JPM GBI-EM GD to a custom blended 50% JPM GBI-EM GD/ 50% JPM EMLI+. Past performance is not indicative of future performance. Returns greater than one year are annualized. Please see important disclosure at the end of this presentation concerning the impact of investment advisory fees and expenses on performance and for benchmark definitions.
AM
US 12-03-13
Emerging Markets Debt – Local Debt GIPS® reportHSBC Global Asset Management (the Firm) claims compliance with the Global Investment Performance Standards (GIPS®) and has prepared and presented this report in compliance with the GIPS standards. The Firm has been independently verified for the periods 1 January 2006 through 31 December 2010. The resultant verification report is available upon request. Verification assesses whether (1) the firm has complied with all the composite construction requirements of the GIPS standards on a firm-wide basis and (2) the firm's policies and procedures are designed to calculate and present performance in compliance with the GIPS standards. Verification does not ensure the accuracy of any specific composite presentation. The composite creation date is 29/04/2008 A complete list and description of all Firm composites, as well as additional information regarding policies for calculating and reporting returns, is available on request from the contact shown on the document or presentation to which this report is attached. Prior to 2011 HSBC Global Asset Management maintained eight distinct GIPS Firms. The Firms were defined by legal business entity. All existing group Firms were thereafter amalgamated into a single global Firm definition. Historical performance shown prior to January 1, 2006 reflects the performance of a legacy Firm composite. HSBC Global Asset Management (the Firm) consists of discretionary accounts and sub-accounts managed as discrete mandates within specified local HSBC Global Asset Management entities. The Firm g ( ) y g p gcomprises the following: HSBC Global Asset Management (Deutschland) GmbH, HSBC Global Asset Management (Hong Kong) Limited, HSBC Global Asset Management (USA) Inc., HSBC Global Asset Management (France), HSBC Global Asset Management (Canada) Limited, and HSBC Global Asset Management (UK) Limited. The Firm excludes portfolios and funds managed by the Alternative Investments teams, LDI products, French regulated employee (FCPE) schemes, and private client accounts as these products operate under a materially different philosophy and process and /or regulatory environment.The Emerging Markets Debt - Local Debt composite consists of only actual, fee paying, fully discretionary accounts managed by HSBC Global Asset Management (USA) Inc. The underlying strategy may invest in emerging markets fixed income securities and other financial instruments issued primarily by governments, their agencies, local authorities and corporate entities primarily denominated in local currencies, and emerging market foreign exchange. The base currency of the composite is USD. Investment results are measured versus a blended benchmark 50% JP Morgan GBI-EM Global Diversified Unhedged Index and 50% JP Morgan Emerging Local Markets ELMI Plus Index.Performance returns are calculated gross of investment management fees and other non-trading related expenses. The performance presented in this composite report is calculated net of unreclaimable withholding taxes. Form ADV, Custody fees, performance fees. Please refer to Part 2A of HSBC Global Asset Management (USA) Inc's Form ADV for additional information on advisory fees. Actual client fees may be less. Annual custody fees are not included. Fees are negotiable at the discretion of HSBC Global Asset Management (USA) Inc. Warnings: The historical performance presented in these reports should not be seen as an indication of future performance; The value of your investment and any income from it can go down as well as up. Where overseas securities are held the rate of exchange may cause the value of the investment to go down as well as up. Investors should also be aware that other performance calculation methods may produce different results, and that the results for specific portfolios and for different periods may vary from the returns presented in these reports; Comparisons of investment returns should consider qualitative circumstances and should be made only to portfolios with generally similar investment objectives. In the USA, this information is intended for use solely in one-on-one presentations The JP Morgan GBI - EM Global Diversified is a definitive local emerging markets debt benchmark that tracks local currency government bonds issued by emerging markets. It limits the weights of those index countries with larger debt stocks and redistributes those weights to countries with smaller weights. The maximum weight to a country is capped at 10%. the excess is redistributed to those countries that have a market capitalization of less than 10%. The portion that is redistributed is based on the market capitalization of each country, which preserves the relative size of each market within the index. Countries to be included must be classified as having a low or middle per capita income by the World Bank for at least two consecutive years based on data lagged one year
One on one presentation. Not for further distribution. 20
Countries to be included must be classified as having a low or middle per capita income by the World Bank for at least two consecutive years, based on data lagged one year. The JPMorgan Emerging Local Markets ELMI Plus Index tracks US Dollar total returns for local-currency-denominated money market instruments in 25 emerging markets. This includes coverage of the following: Argentina, Brazil, Chile, China, Czech Republic, Egypt, Greece, Hong Kong, Hungary, India, Indonesia, Israel, Korea, Malaysia, Mexico, Philippines, Poland, Russia, Singapore, Slovak Republic, South Africa, Taiwan, Thailand, Turkey and Venezuela. As of January 1, 2011, the benchmark for the Emerging Market Debt - Local Debt Composite changed from JP Morgan GBI-EM Global Diversified Composite Unhedged Index to a blend of 50% JP Morgan GBI-EM Global Diversified Composite Unhedged Index and 50% JP Morgan Emerging Local Markets ELMI Plus rebalanced monthly. The reason for the change is due to the strategy's investment/ holdings to fixed income instruments and currencies in the Emerging Markets. Composite Name Change In December 2008, the EMD - Local Debt Composite changed its from EMD - Local Currency. Significant Event - Atlantic Advisors - Atlantic Advisors was acquired by HSBC Investments (USA) Inc. in June 2005. The members of Atlantic Advisors are now the global emerging markets fixed income team at HSBC Global Asset Management (USA) Inc. (formerly Halbis Capital Management (USA) Inc.). The composite performance results represent historical composite returns produced by the global emerging markets fixed income team while employed at the previous advisor linked, pursuant to GIPS Guidelines, with the performance results produced by the global emerging markets fixed income team since joining the firm. Exchange Rates - The exchange rates used by accounts in this composite may be different than those used by the benchmark. The management process for accounts in this composite uses leverage and short sales instruments as a source of potential return. The firm also may employ the following derivative instruments both for hedging and return enhancement purposes; Options on Securities & Securities Indices, Currency transactions, Repurchase agreements, Interest rate swaps, caps, floors, and collars, and Forward contracts on securities or currencies. The firm also reserves the right to use new derivative techniques and instruments that may be developed in the future.

11
AM
US 12-03-13
Emerging Markets Debt – Total Return GIPS® reportComposite Emerging Markets Debt – Total ReturnReport To December 31, 2011Inception Date October 31, 1998 Reporting Currency US DollarBenchmark Merrill Lynch 3 Month Constant Maturity Return Type Gross
One on one presentation. Not for further distribution. 21
Past performance is not indicative of future performance. Returns greater than one year are annualized. Please see important disclosure at the end of this presentation concerning the impact of investment advisory fees and expenses on performance and for benchmark definitions.
AM
US 12-03-13
Emerging Markets Debt – Total Return GIPS® reportHSBC Global Asset Management (the Firm) claims compliance with the Global Investment Performance Standards (GIPS®) and has prepared and presented this report in compliance with the GIPS standards. The Firm has been independently verified for the periods 1 January 2006 through 31 December 2010. The resultant verification report is available upon request. Verification assesses whether (1) the firm has complied with all the composite construction requirements of the GIPS standards on a firm-wide basis and (2) the firm's policies and procedures are designed to calculate and present performance in compliance with the GIPS standards. Verification does not ensure the accuracy of any specific composite presentation.
The composite creation date is 31/08/2006
A complete list and description of all Firm composites, as well as additional information regarding policies for calculating and reporting returns, is available on request from the contact shown on the document or presentation to which this report is attached.
Prior to 2011 HSBC Global Asset Management maintained eight distinct GIPS Firms. The Firms were defined by legal business entity. All existing group Firms were thereafter amalgamated into a single global Firm definition. Historical performance shown prior to January 1, 2006 reflects the performance of a legacy Firm composite.
HSBC Global Asset Management (the Firm) consists of discretionary accounts and sub-accounts managed as discrete mandates within specified local HSBC Global Asset Management entities. The Firm comprises the following: HSBC Global Asset Management (Deutschland) GmbH, HSBC Global Asset Management (Hong Kong) Limited, HSBC Global Asset Management (USA) Inc., HSBC Global Asset Management (France), HSBC Global Asset Management (Canada) Limited, and HSBC Global Asset Management (UK) Limited. The Firm excludes portfolios and funds managed by the Alternative Investments teams, LDI products, French regulated employee (FCPE) schemes, and private client accounts as these products operate under a materially different philosophy and process and /or regulatory environment.
The Emerging Markets Debt - Total Return composite consists of only actual, fee paying, fully discretionary accounts managed by HSBC Global Asset Management (USA) Inc. The underlying strategy is not constrained by benchmark and may hold long and short positions in emerging market fixed income, equities, currencies, and other financial instruments. Given the strategy’s absolute return orientation, cash may be actively used as a defensive tactic to protect principal. The base currency of the composite is USD. Investment results are measured against the Merrill Lynch 3 month LIBOR Constant Maturity Index.
Performance returns are calculated gross of investment management fees and other non-trading related expenses.
The performance presented in this composite report is calculated net of unreclaimable withholding taxes.
Form ADV, Custody fees, performance fees. Please refer to Part 2A of HSBC Global Asset Management (USA) Inc's Form ADV for additional information on advisory fees. Actual client fees may be less. Annual custody fees are not included. Fees are negotiable at the discretion of HSBC Global Asset Management (USA) Inc.
Warnings: The historical performance presented in these reports should not be seen as an indication of future performance; The value of your investment and any income from it can go down as well as up. Where overseas securities are held the rate of exchange may cause the value of the investment to go down as well as up. Investors should also be aware that other performance calculation methods may produce different results, and that the results for specific portfolios and for different periods may vary from the returns presented in these reports; Comparisons of investment returns should consider qualitative circumstances and should be made only to portfolios with generally similar investment objectives. In the USA, this information is intended for use solely in one-on-one presentations
Significant Event - Atlantic Advisors - Atlantic Advisors was acquired by HSBC Investments (USA) Inc. in June 2005. The members of Atlantic Advisors are now the global emerging markets fixed income team at HSBC Global Asset Management (USA) Inc (formerly Halbis Capital Management (USA) Inc ) The composite performance results represent historical composite returns produced by the global
One on one presentation. Not for further distribution. 22
team at HSBC Global Asset Management (USA) Inc. (formerly Halbis Capital Management (USA) Inc.). The composite performance results represent historical composite returns produced by the global emerging markets fixed income team while employed at the previous advisor linked, pursuant to GIPS Guidelines, with the performance results produced by the global emerging markets fixed income team since joining the firm.
Exchange Rates - The exchange rates used by accounts in this composite may be different than those used by the benchmark.
The management process for accounts in this composite uses leverage and short sales instruments as a source of potential return. The firm also may employ the following derivative instruments both for hedging and return enhancement purposes; Options on Securities & Securities Indices, Currency transactions, Repurchase agreements, Interest rate swaps, caps, floors, and collars, and Forward contracts on securities or currencies. The firm also reserves the right to use new derivative techniques and instruments that may be developed in the future.
Usage of Pre 2000 data The performance for periods presented prior to 1 January 2000 is not GIPS compliant as not all funds managed by the Firm have been allocated to composites for these periods. All funds which are eligible for inclusion in this composite have been included in the performance shown.

12
AM
US 12-03-13
Index definitionsThe JP Morgan EMBI-Global Index includes USD-denominated Brady bonds, Eurobonds, and traded loans issued by sovereign and quasi-sovereign entities, and is a traditional market-capitalization weighted index. The JP Morgan GBI-EM Global Diversified Index consists of just 15 countries; our team actually analyze over 50 individual countries. Furthermore, this benchmark consists of only local bonds (rates), while our team also allocates a significant portion of the portfolio to currencies (FX).The JP Morgan ELMI+ Index is an emerging markets currency (FX) benchmark; the index contains more countries and also brings in the currency aspect of the market, which is an important component of our strategy.The JP Morgan Corporate Emerging Markets Bond Diversified Index measures the performance of corporate bonds issued in emerging markets.The JP Morgan US Investment Grade Corporate is a broad measure of the performance of securities in the investment grade corporate bond market. J.P. Morgan Global Aggregate Bond Index (JPM GABI) consists of the JPM GABI US, a U.S. dollar denominated, investment-grade index spanning asset classes from developed to emerging markets, and the JPM GABI extends the U.S. index to also include multi-currency, investment-grade instruments.Morgan Stanley Capital International Europe Australasia and Far East Index ("MSCI EAFE") is a free float-adjusted market capitalization index that is designed to measure the equity market performance of developed markets, excluding the US & Canada. The MSCI EAFE Index consists of the following 22 developed market country indices: Australia, Austria, Belgium, Denmark, Finland, France, Germany, Greece, Hong Kong, Ireland, Israel, Italy, Japan, the Netherlands, New Zealand, Norway, Portugal, Singapore, Spain, Sweden, Switzerland, and the United Kingdom. Morgan Stanley Capital International Emerging Markets Index (“MSCI EM”)is a free float-adjusted market capitalization index that is designed to measure equity market performance of emerging markets. The MSCI Emerging Markets Index consists of the following 21 emerging market country indices: Brazil, Chile, China, Colombia, Czech Republic, Egypt, Hungary,India, Indonesia, Korea, Malaysia, Mexico, Morocco, Peru, Philippines, Poland, Russia, South Africa, Taiwan, Thailand, and Turkey.S&P 500 Index is widely regarded as a gauge of the U.S. equities market. It includes 500 leading companies in leading industries of the U.S. economy.Barclays Capital U.S. Aggregate Bond Index is a broad-based benchmark that measures the investment grade, U.S. dollar-denominated, fixed-rate taxable bond market, including Treasuries, government-related and corporate securities. MBS (agency fixed-rate and hybrid ARM passthroughs), ABS, and CMBS.MSCI is a leading provider of investment decision support tools to investors globally, including asset managers, banks, hedge funds and pension funds. Their products and services include indices, portfolio risk and performance analytics, and governance tools. The MSCI Global Equity Indices are the most widely used benchmarks for cross border equity funds. MSCI calculates over 120,000 equity and REIT indices daily, including the well-known MSCI EAFE (Europe, Australasia, and Far East), MSCI World, MSCI ACWI IMI (All Country World Investable Market Index) and MSCI Emerging Markets Indices. In addition to benchmarking and performance measurement, MSCI indices are increasingly being integrated into other areas of our clients' investment processes such as research and asset allocation, and are frequently used as the basis of derivative financial products.
The EURO STOXX 50 (Price) Index is a free-float market capitalization-weighted index of 50 European blue-chip stocks from those countries participating in the EMU. Each component's weight is capped at 10% of the index's total free float market capitalization The index was developed with a base value of 1000 as of December 31 1991
One on one presentation. Not for further distribution. 23
weight is capped at 10% of the index s total free float market capitalization. The index was developed with a base value of 1000 as of December 31, 1991.
The Nikkei-225 Stock Average is a price-weighted average of 225 top-rated Japanese companies listed in the First Section of the Tokyo Stock Exchange.The Nikkei Stock Average was first published on May 16, 1949, where the average price was ¥176.21 with a divisor of 225.
The Bank of America Merrill Lynch Municipal Master Index measures the performance of municipal bonds and accounts for price changes and interest income. It acts as a broad benchmark for the US municipal debt market.
The Barclays Capital Euro Aggregate Bond Index offers exposure to Euro denominated investment grade bonds publicly issued in the Eurobond and Euro zonedomestic markets. Only bonds with a minimum remaining time to maturity of one year are included in the index.
These indices are presented to provide you with an understanding of their historic long-term performance, and are not presented to illustrate the performance of any security or trading strategy. All indices are unmanaged. Index returns do not reflect any fees, expenses or sales charges associated with mutual fund investing. Investors cannot invest directly in an index.
AM
US 12-03-13
Firm disclosure
This information is intended for institutional / qualified investors only.
The presentation is proprietary to HSBC Global Asset Management and may not be disclosed to any third party or used for any other purpose without prior written consent.
The material contained in this presentation has been prepared by HSBC Global Asset Management for informational purposes only and is not a solicitation or an offer to buy any security or instrument or to participate in any trading or investment strategy. The data is based on sources believed to be reliable however, we have not independently verified such information and make no guarantee representation or warranty and accept no responsibility or liability as to its accuracy or completeness All opinions and assumptionssuch information and make no guarantee, representation or warranty and accept no responsibility or liability as to its accuracy or completeness. All opinions and assumptions included in this presentation are based upon current market conditions as of the date of this presentation and are subject to change without notice. The investment capabilities presented in this document may not be registered and/or authorised for sale in Canada. Past performance is not indicative of future performance. All investments involve risk including the loss of principal. Any portfolio characteristics shown herein, including position sizes and sector allocations among others, are generally averages and are for illustrative purposes only and do not reflect the investments of an actual portfolio unless otherwise noted. The investment guidelines of an actual portfolio may permit or restrict investments that are materially different in size, nature and risk from those shown. This information is not intended to provide professional advice and should not be relied upon in that regard. You are advised to obtain appropriate professional advice where necessary and should consult your investment representative before considering a specific transaction.
Investments in emerging markets are by their nature higher risk and potentially more volatile than those inherent in established markets. Economies in emerging markets generally are heavily dependent upon international trade and, accordingly, have been and may continue to be affected adversely by trade barriers, exchange controls, managed adjustments in relative currency values and other protectionist measures imposed or negotiated by the countries with which they trade. These economies also have been and may continue to be affected adversely by economic conditions in the countries in which they trade.
HSBC Global Asset Management is a group of companies in many countries and territories throughout the world that are engaged in investment advisory and fund management activities, which are ultimately owned by HSBC Holdings plc.
Statistical information pertaining to personnel, as well as assets, may be aggregated in reference to the above-mentioned group of companies including satellite affiliates unless indicated otherwise. Funds under advice (other than direct management) may comprise assets managed by affiliates of HSBC Global Asset Management, which provide advice in the form of portfolio construction sector allocations and / or stock list recommendations
One on one presentation. Not for further distribution. 24
in the form of portfolio construction, sector allocations and / or stock list recommendations.
The client service relationship is typically maintained in the country where the client is located while, assets are either managed locally or distributed to another affiliated company which offers asset management capability in the area of specialty or within in the geographic region(s) closest to the market within the mandate.
HSBC Global Asset Management (Canada) Limited is the manager and primary investment advisor for the HSBC Mutual Funds. HSBC Investment Funds (Canada) Inc. is the principal distributor of the HSBC Mutual Funds. HSBC Mutual Funds are also distributed through authorized dealers. Commissions, trailing commissions, management fees and expenses all may be associated with mutual fund investments. Please read the prospectus before investing. Mutual Funds are not guaranteed or covered by the Canada Deposit Insurance Corporation, HSBC Bank Canada, or any other deposit insurer. Their values change frequently and past performance may not be repeated.
HSBC Global Asset Management (Canada) Limited is a subsidiary of HSBC Bank Canada and provides services in all provinces of Canada except Prince Edward Island.
HSBC Global Asset Management (USA) Inc. ("AMUS") is an investment adviser registered with the US Securities and Exchange Commission. CA#M1203110 (04/12)