ambev - relatório 20f (inglês)
DESCRIPTION
O Formulário 20-F é uma adequação do nosso Relatório Anual à lei norte-americana de Mercados e Capitais.Todas as empresas sediadas em países fora dos Estados Unidos - e com ações na bolsa daquele país, caso da Ambev - devem publicar o 20-F.Os papéis da Ambev começaram a ser negociados na Bolsa de Nova York em 15 de setembro do ano 2000, depois da autorização concedida pela Comissão de Valores Mobiliários dos Estados Unidos (Securities Exchange Comission).TRANSCRIPT
i
T
UNITED STATES
SECURITIES AND EXCHANGE COMMISSION
WASHINGTON, D.C. 20549
FORM 20-F
(Mark One)
REGISTRATION STATEMENT PURSUANT TO SECTION 12(b) OR (g) OF THE SECURITIES EXCHANGE ACT OF 1934
OR
ANNUAL REPORT PURSUANT TO SECTION 13 OR 15(d) OF THE SECURITIES EXCHANGE ACT OF 1934
For the fiscal year ended December 31, 2010
OR
TRANSITION REPORT PURSUANT TO SECTION 13 OR 15(d) OF THE SECURITIES EXCHANGE ACT OF 1934
OR
SHELL COMPANY REPORT PURSUANT TO SECTION 13 OR 15(d) OF THE SECURITIES EXCHANGE ACT OF 1934
OR
COMPANHIA DE BEBIDAS DAS AMÉRICAS – AMBEV
(Exact name of Registrant as specified in its charter)
American Beverage Company – Ambev
(Translation of Registrant‟s name into English)
Federative Republic of Brazil (Jurisdiction of incorporation or organisation)
Rua Dr. Renato Paes de Barros, 1017, 4º andar 04530-001 São Paulo, SP, Brazil
(Address of principal executive offices) Nelson José Jamel, Chief Financial and Investor Relations Officer
Address: Rua Dr. Renato Paes de Barros, 1017, 4º andar, 04530-001, São Paulo, SP, Brazil
Telephone No.: +55 (11) 2122-1508
e-mail: [email protected] (Name, Telephone, E-mail and/or Facsimile number and Address of Company Contact Person)
Securities registered or to be registered pursuant to Section 12(b) of the Act.
Title of each class Name of each exchange on which registered
American Depositary Shares, evidenced by American Depositary
Receipts, each representing 1 (one) Common Share
Common Shares, no par value*
New York Stock Exchange
American Depositary Shares, evidenced by American Depositary
Receipts, each representing 1 (one) Preferred Share
Preferred Shares, no par value*
New York Stock Exchange
* Not for trading, but in connection with the registration of American Depositary Shares, pursuant to the requirements of the Securities and Exchange Commission.
Securities registered or to be registered pursuant to Section 12(g) of the Act.
None
ii
(Title of Class)
Securities for which there is a reporting obligation pursuant to Section 15(d) of the Act.
Title of each class Name of each exchange on which registered
R$300,000,000 9.500% Notes due 2017
of Ambev International Finance Co. Ltd.
guaranteed by Companhia de Bebidas
das Américas - Ambev
Guaranty of the R$300,000,000 9.500% Notes due 2017 of
Ambev International Finance Co. Ltda. by Companhia de
Bebidas das Américas - Ambev
Not applicable
Not applicable
(Title of Class)
Indicate the number of outstanding shares of each of the issuer‟s classes of capital or common stock as of the close of the
period covered by the annual report.
1,743,888,690 Common Shares
1,360,472,350 Preferred Shares
Indicate by check mark if the registrant is a well-known seasoned issuer, as defined in Rule 405 of the Securities Act.
Yes No
If this report is an annual or transition report, indicate by check mark if the registrant is not required to file reports
pursuant to Section 13 or 15(d) of the Securities Exchange Act of 1934.
Yes No
Note – Checking the box above will not relieve any registrant required to file reports pursuant to Section 13 or 15(d) of the
Securities Exchange Act of 1934 from their obligations under those Sections.
Indicate by check mark whether the registrant (1) has filed all reports required to be filed by Section 13 or 15(d) of the
Securities Exchange Act of 1934 during the preceding 12 months (or for such shorter period that the registrant was
required to file such reports), and (2) has been subject to such filing requirements for the past 90 days.
Yes No
Indicate by check mark whether the registrant is a large accelerated filer, an accelerated filer, or a non-accelerated filer.
See definition of “accelerated filer and large accelerated filer” in Rule 12b-2 of the Exchange Act. (Check one):
Large accelerated filer Accelerated filer Non-accelerated filer
Indicate by check mark which basis of accounting the registrant has used to prepare the financial statements included in
this filing:
U.S. GAAP International Financial Reporting Standards as issued
by the International Accounting Standards Board
Other
If “Other” has been checked in response to the previous question, indicate by check mark which financial statement item
the registrant has elected to follow. N/A
Item 17 Item 18
If this is an annual report, indicate by check mark whether the registrant is a shell company (as defined in
Rule 12b-2 of the Exchange Act).
Yes No
(APPLICABLE ONLY TO ISSUERS INVOLVED IN BANKRUPTCY PROCEEDINGS DURING THE PAST FIVE
YEARS)
Indicate by check mark whether the registrant has filed all documents and reports required to be filed by Sections 12, 13
or 15(d) of the Securities Exchange Act of 1934 subsequent to the distribution of securities under a plan confirmed by a
court. N/A
Yes No
i
TABLE OF CONTENTS
Page
INTRODUCTION ........................................................................................................................................................ ii PRESENTATION OF FINANCIAL INFORMATION ............................................................................................... ii CURRENCY TRANSLATION .................................................................................................................................... ii TRADEMARKS ........................................................................................................................................................... ii CAUTIONARY STATEMENT REGARDING FORWARD-LOOKING INFORMATION ..................................... ii PART I .......................................................................................................................................................................... 1 ITEM 1. IDENTITY OF DIRECTORS, SENIOR MANAGEMENT AND ADVISERS ............................... 1 ITEM 2. OFFER STATISTICS AND EXPECTED TIMETABLE ................................................................. 2 ITEM 3. KEY INFORMATION ..................................................................................................................... 3 ITEM 4. INFORMATION ON THE COMPANY ........................................................................................ 21 ITEM 5. OPERATING AND FINANCIAL REVIEW AND PROSPECTS ................................................. 43 ITEM 6. DIRECTORS, SENIOR MANAGEMENT AND EMPLOYEES .................................................. 67 ITEM 7. MAJOR SHAREHOLDERS AND RELATED PARTY TRANSACTIONS ................................. 81 ITEM 8. FINANCIAL INFORMATION ...................................................................................................... 89 ITEM 9. THE OFFER AND LISTING ......................................................................................................... 97 ITEM 10. ADDITIONAL INFORMATION ................................................................................................. 103 ITEM 11. QUANTITATIVE AND QUALITATIVE DISCLOSURES ABOUT MARKET RISK ............. 124 ITEM 12. DESCRIPTION OF SECURITIES OTHER THAN EQUITY SECURITIES .............................. 131 ITEM 13. DEFAULT, DIVIDENDS ARREARAGES AND DELINQUENCIES ....................................... 133 ITEM 14. MATERIAL MODIFICATIONS TO THE RIGHTS OF SECURITY HOLDERS AND
USE OF PROCEEDS.................................................................................................................... 134 ITEM 15. CONTROLS AND PROCEDURES ............................................................................................. 135 ITEM 16A. AUDIT COMMITTEE FINANCIAL EXPERT ........................................................................... 137 ITEM 16B. CODE OF BUSINESS CONDUCT .............................................................................................. 138 ITEM 16C. PRINCIPAL ACCOUNTANT FEES AND SERVICES .............................................................. 139 ITEM 16D. EXEMPTIONS FROM THE LISTING STANDARDS FOR AUDIT COMMITTEES .............. 141 ITEM 16E. PURCHASES OF EQUITY SECURITIES BY THE ISSUER AND AFFILIATED
PURCHASERS ............................................................................................................................. 142 ITEM 16F. CHANGE IN REGISTRANT’S CERTIFYING ACCOUNTANT ............................................... 145 ITEM 16G. CORPORATE GOVERNANCE .................................................................................................. 146 ITEM 17. FINANCIAL STATEMENTS ...................................................................................................... F-1 ITEM 18. FINANCIAL STATEMENTS ...................................................................................................... 252 ITEM 19 EXHIBITS .................................................................................................................................... 253
ii
INTRODUCTION
This annual report on Form 20-F relates to the two classes of registered American Depositary Shares
(―ADSs‖) of Companhia de Bebidas das Américas - AMBEV evidenced by American Depositary Receipts
(―ADRs‖) representing one preferred share of Ambev and ADSs evidenced by ADRs representing one common
share of Ambev.
In this annual report, except as otherwise indicated or as the context otherwise requires, the ―Company‖,
―Ambev‖, ―we‖, ―us‖ and ―our‖ refers to Companhia de Bebidas das Américas - Ambev and its subsidiaries.
PRESENTATION OF FINANCIAL INFORMATION
We prepare our consolidated financial statements in accordance with International Financial Reporting
Standards (―IFRS‖) as issued by the International Accounting Standards Board (―IASB‖). The
company first adopted IFRS for the annual consolidated financial statements for the year ended December 31, 2008.
Through to and including our financial statements for the year ended December 31, 2007, we prepared our
consolidated financial statements in accordance with accounting practices adopted in Brazil (―Brazilian GAAP‖).
The effects of the transition to IFRS (from financial statements prepared in accordance with Brazilian GAAP) on the
Company’s financial statements for the year ended December 31, 2007, its results of operations and its cash flows
for that year, are detailed in note 4 to our consolidated annual financial statements included in the Company’s 2008
annual report. Following the Company’s adoption of IFRS, as issued by the IASB, the Company is no longer
required to reconcile its financial statements prepared in accordance with IFRS to US generally accepted accounting
principles (―U.S. GAAP‖).
Percentages and some amounts in this annual report have been rounded for ease of presentation. Any
discrepancies between totals and the sums of the amounts listed are due to rounding.
CURRENCY TRANSLATION
In this annual report, references to ―Real‖, ―Reais‖ or ―R$‖ are to the legal currency of Brazil, references to
―U.S. dollar‖ or ―U.S.$‖ are to the legal currency of the United States and references to ―Canadian dollar‖ or ―C$‖
are to the legal currency of Canada. We have translated some of the Brazilian currency amounts contained in this
annual report into U.S. dollars. We have also translated some amounts from U.S. dollars and Canadian dollars into
Reais. All financial information relating to us that is presented in U.S. dollars in this annual report has been
translated from Reais at the period-end exchange rate or average exchange rate prevailing during the period, as
published by the Central Bank of Brazil (―Central Bank‖), unless the context otherwise requires. The exchange rate
on December 31, 2010 was R$1.67 to U.S.$1.00, as published by the Central Bank. The U.S. dollar equivalent
information presented in this annual report is provided solely for the convenience of the readers of this annual report
and should not be construed as implying that the Brazilian currency amounts represent, or could have been or could
be converted into, U.S. dollars at such rates or at any rate. See ―Key Information—Exchange Rate Information—
Exchange Controls‖ for more detailed information regarding the translation of Reais into U.S. dollars.
TRADEMARKS
This annual report includes the names of our products which constitute trademarks or trade names which we
own or which are owned by others and are licensed to us for our use. This annual report also contains other brand
names, trade names, trademarks or service marks of other companies, and these brand names, trade names,
trademarks or service marks are the property of those other companies.
CAUTIONARY STATEMENT REGARDING
FORWARD-LOOKING INFORMATION
This annual report includes forward-looking statements, within the meaning of Section 27A of the U.S.
Securities Act of 1933, as amended, or Securities Act, and Section 21E of the U.S. Securities Exchange Act of 1934,
iii
as amended, or Exchange Act, principally in Items 3 through 5 and Item 11 of this annual report. We have based
these forward-looking statements largely on our current expectations and projections about future events, industry
and financial trends affecting our business.
This annual report includes such as statements as ―will likely result‖, ―are expected to‖, ―will continue‖, ―is
anticipated‖, ―estimate‖, ―project‖, ―may‖ or similar expressions that are forward-looking statements. These
statements are subject to certain risks and uncertainties. Actual results may differ materially from those suggested by
these statements due to, among others, the risks or uncertainties listed below. See also ―Item 3. Key Information—
H. Risk Factors‖ for further discussion of risks and uncertainties that could impact our business.
These forward-looking statements are not guarantees of future performance. Rather, they are based on current
views and assumptions and involve known and unknown risks, uncertainties and other factors, many of which are
outside our control and are difficult to predict, that may cause actual results or developments to differ materially
from any future results or developments expressed or implied by the forward-looking statements. Factors that could
cause actual results to differ materially from those contemplated by the forward-looking statements include, among
others:
▪greater than expected costs (including taxes) and expenses;
▪the risk of unexpected consequences resulting from acquisitions;
▪our expectations with respect to expansion, projected asset divestitures, premium growth, accretion to
reported earnings, working capital improvements and investment income or cash flow projections;
▪lower than expected revenue;
▪greater than expected customer losses and business disruptions;
▪limitations on our ability to contain costs and expenses;
▪local, regional, national and international economic conditions, including the risks of a global recession or
a recession in one or more of our key markets, and the impact they may have on us and our customers
and our assessment of that impact;
▪the monetary and interest rate policies of central banks;
▪continued availability of financing;
▪market risks, such as interest rate risk, foreign exchange rate risk, commodity risk, asset price risk, equity
market risk, inflation or deflation;
▪our ability to continue to introduce competitive new products and services on a timely, cost-effective
basis;
▪the effects of competition and consolidation in the markets in which we operate, which may be influenced
by regulation, deregulation or enforcement policies;
▪changes in pricing environments and volatility in commodity prices;
▪regional or general changes in asset valuations;
▪tax consequences of restructuring;
▪changes in consumer spending;
▪the outcome of pending and future litigation and governmental proceedings;
▪changes in government policies;
▪changes in applicable laws, regulations and taxes in jurisdictions in which we operate including the laws
and regulations governing our operations, as well as actions or decisions of courts and regulators;
▪natural and other disasters;
▪any inability to economically hedge certain risks;
iv
▪inadequate impairment provisions and loss reserves;
▪technological changes;
▪our success in managing the risks involved in the foregoing.
▪Governmental intervention, resulting in changes to the economic, tax or regulatory environment in Brazil
or other countries in which we operate;
▪the declaration or payment of dividends; and
▪the utilization of Ambev’s subsidiaries’ income tax loss carry forwards.
Our statements regarding market risks, including interest rate risk, foreign exchange rate risk, commodity
risk, asset price risk, equity market risk, inflation and deflation, are subject to uncertainty. For example, certain
market risk disclosures are dependent on choices about key model characteristics and assumptions and are subject to
various limitations. By their nature, certain of the market risk disclosures are only estimates and, as a result, actual
future gains and losses could differ materially from those that have been estimated.
We caution that the forward-looking statements in this Form 20-F are further qualified by the risk factors
disclosed in ―Item 3. Key Information—H. Risk Factors‖ that could cause actual results to differ materially from
those in the forward-looking statements. Subject to our obligations under Brazilian and U.S. law in relation to
disclosure and ongoing information, we undertake no obligation to update publicly or revise any forward-looking
statements, whether as a result of new information, future events or otherwise.

1
PART I
ITEM 1. IDENTITY OF DIRECTORS, SENIOR MANAGEMENT AND ADVISERS
Not Applicable.

2
ITEM 2. OFFER STATISTICS AND EXPECTED TIMETABLE
Not Applicable.
3
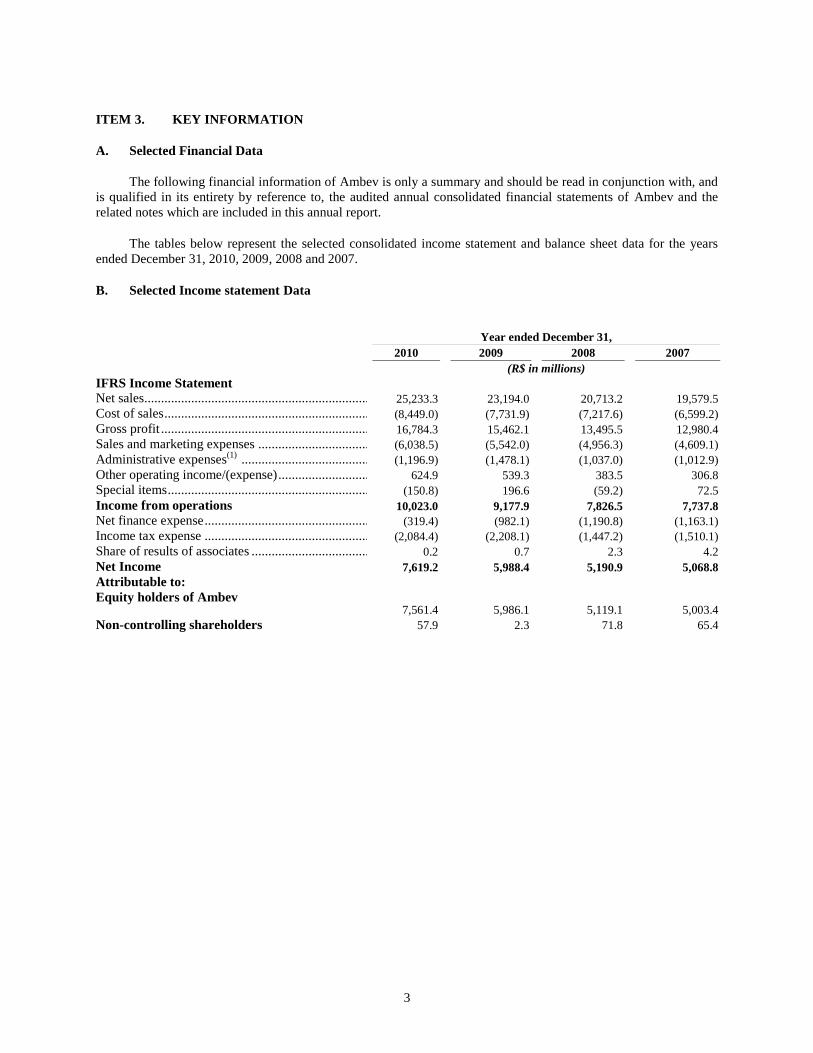
ITEM 3. KEY INFORMATION
A. Selected Financial Data
The following financial information of Ambev is only a summary and should be read in conjunction with, and
is qualified in its entirety by reference to, the audited annual consolidated financial statements of Ambev and the
related notes which are included in this annual report.
The tables below represent the selected consolidated income statement and balance sheet data for the years
ended December 31, 2010, 2009, 2008 and 2007.
B. Selected Income statement Data
Year ended December 31,
2010 2009 2008 2007
(R$ in millions)
IFRS Income Statement
Net sales.................................................................... 25,233.3 23,194.0 20,713.2 19,579.5
Cost of sales .............................................................. (8,449.0) (7,731.9) (7,217.6) (6,599.2)
Gross profit ............................................................... 16,784.3 15,462.1 13,495.5 12,980.4
Sales and marketing expenses .................................. (6,038.5) (5,542.0) (4,956.3) (4,609.1)
Administrative expenses(1)
....................................... (1,196.9) (1,478.1) (1,037.0) (1,012.9)
Other operating income/(expense) ............................ 624.9 539.3 383.5 306.8
Special items ............................................................. (150.8) 196.6 (59.2) 72.5
Income from operations 10,023.0 9,177.9 7,826.5 7,737.8
Net finance expense .................................................. (319.4) (982.1) (1,190.8) (1,163.1)
Income tax expense .................................................. (2,084.4) (2,208.1) (1,447.2) (1,510.1)
Share of results of associates .................................... 0.2 0.7 2.3 4.2
Net Income 7,619.2 5,988.4 5,190.9 5,068.8
Attributable to:
Equity holders of Ambev
7,561.4 5,986.1 5,119.1 5,003.4
Non-controlling shareholders 57.9 2.3 71.8 65.4
4
Year ended December 31
2010
.
2009
(restated)
(*)
2008
(restated)
(*)
2007
(restated)
(*)
(In R$ except number of shares)
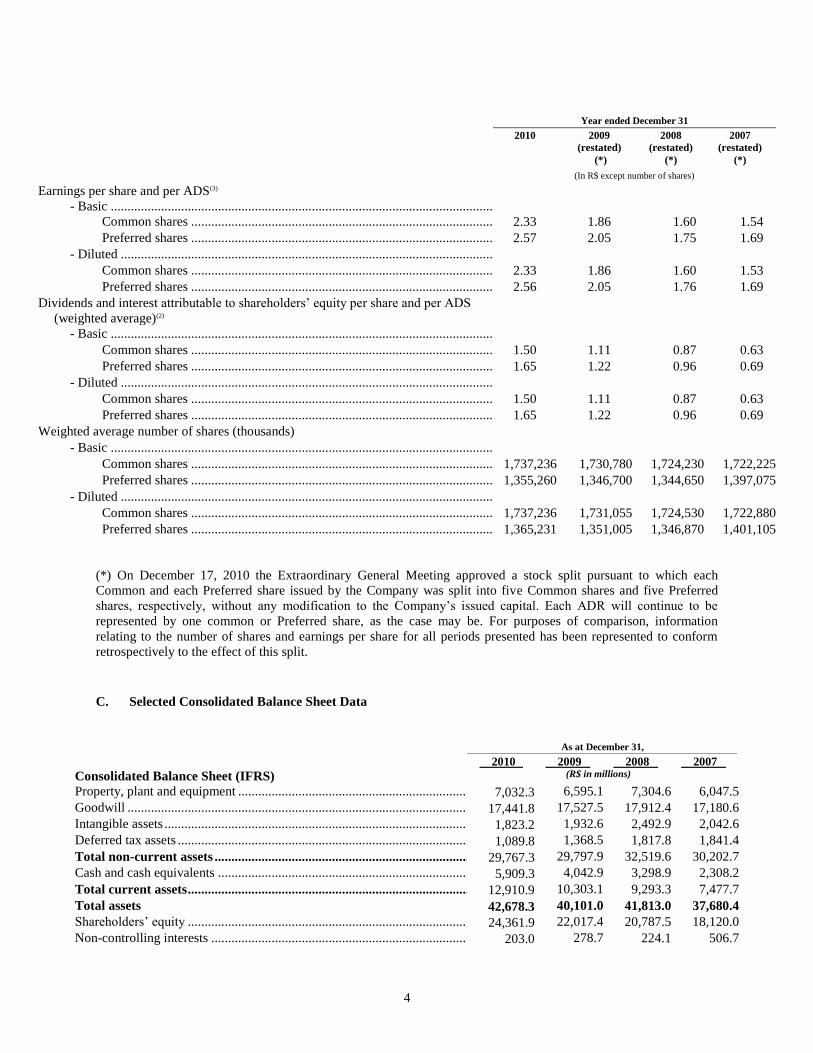
Earnings per share and per ADS(3)
- Basic ...........................................................................................................................................
Common shares ................................................................................................................... 2.33 1.86 1.60 1.54
Preferred shares ................................................................................................................... 2.57 2.05 1.75 1.69
- Diluted ........................................................................................................................................
Common shares ................................................................................................................... 2.33 1.86 1.60 1.53
Preferred shares ................................................................................................................... 2.56 2.05 1.76 1.69
Dividends and interest attributable to shareholders’ equity per share and per ADS
(weighted average)(2)
- Basic ...........................................................................................................................................
Common shares ................................................................................................................... 1.50 1.11 0.87 0.63
Preferred shares ................................................................................................................... 1.65 1.22 0.96 0.69
- Diluted ........................................................................................................................................ Common shares ................................................................................................................... 1.50 1.11 0.87 0.63
Preferred shares ................................................................................................................... 1.65 1.22 0.96 0.69
Weighted average number of shares (thousands)
- Basic ...........................................................................................................................................
Common shares ................................................................................................................... 1,737,236 1,730,780 1,724,230 1,722,225
Preferred shares ................................................................................................................... 1,355,260 1,346,700 1,344,650 1,397,075
- Diluted ........................................................................................................................................
Common shares ................................................................................................................... 1,737,236 1,731,055 1,724,530 1,722,880
Preferred shares ................................................................................................................... 1,365,231 1,351,005 1,346,870 1,401,105 (*) On December 17, 2010 the Extraordinary General Meeting approved a stock split pursuant to which each
Common and each Preferred share issued by the Company was split into five Common shares and five Preferred
shares, respectively, without any modification to the Company’s issued capital. Each ADR will continue to be
represented by one common or Preferred share, as the case may be. For purposes of comparison, information
relating to the number of shares and earnings per share for all periods presented has been represented to conform
retrospectively to the effect of this split.
C. Selected Consolidated Balance Sheet Data
As at December 31, 2010 . 2009 . 2008 . 2007 .
Consolidated Balance Sheet (IFRS) (R$ in millions)
Property, plant and equipment .............................................................................................................. 7,032.3 6,595.1 7,304.6 6,047.5
Goodwill ............................................................................................................................................... 17,441.8 17,527.5 17,912.4 17,180.6
Intangible assets .................................................................................................................................... 1,823.2 1,932.6 2,492.9 2,042.6
Deferred tax assets ................................................................................................................................ 1,089.8 1,368.5 1,817.8 1,841.4
Total non-current assets ..................................................................................................................... 29,767.3 29,797.9 32,519.6 30,202.7
Cash and cash equivalents .................................................................................................................... 5,909.3 4,042.9 3,298.9 2,308.2
Total current assets ............................................................................................................................. 12,910.9 10,303.1 9,293.3 7,477.7
Total assets 42,678.3 40,101.0 41,813.0 37,680.4
Shareholders’ equity ............................................................................................................................. 24,361.9 22,017.4 20,787.5 18,120.0
Non-controlling interests ...................................................................................................................... 203.0 278.7 224.1 506.7
5
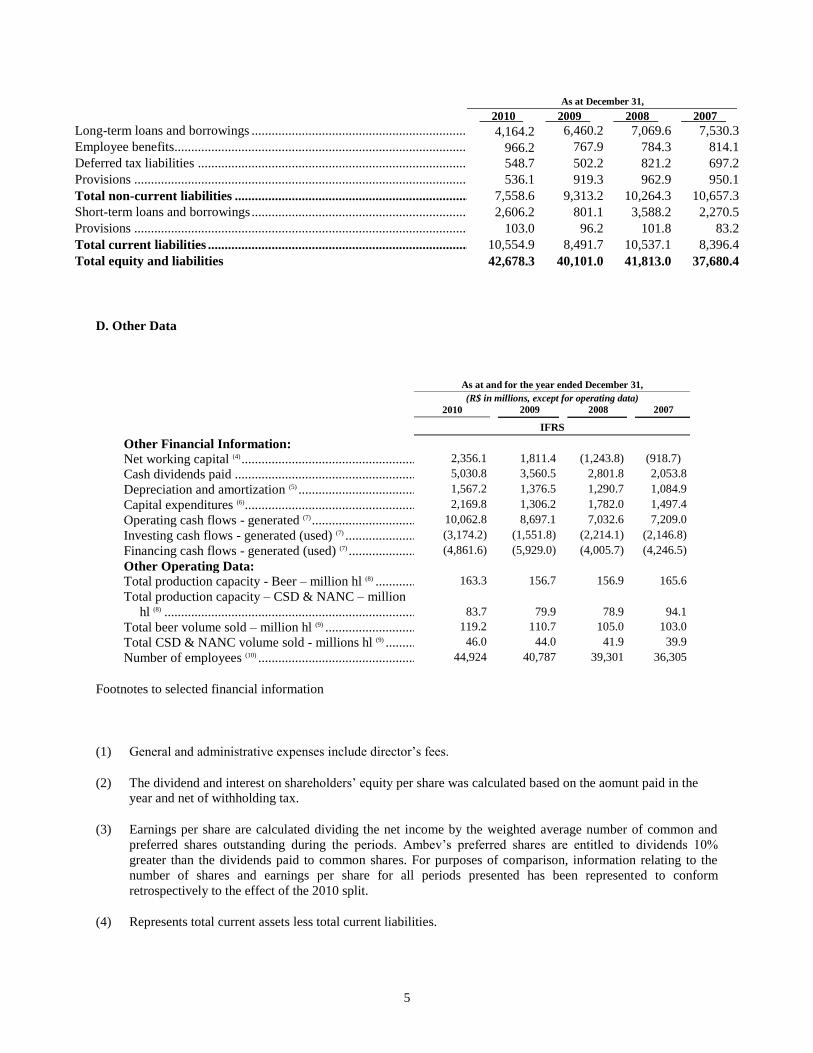
As at December 31,
2010 . 2009 . 2008 . 2007 .
Long-term loans and borrowings .......................................................................................................... 4,164.2 6,460.2 7,069.6 7,530.3
Employee benefits................................................................................................................................. 966.2 767.9 784.3 814.1
Deferred tax liabilities .......................................................................................................................... 548.7 502.2 821.2 697.2
Provisions ............................................................................................................................................. 536.1 919.3 962.9 950.1
Total non-current liabilities ............................................................................................................... 7,558.6 9,313.2 10,264.3 10,657.3
Short-term loans and borrowings .......................................................................................................... 2,606.2 801.1 3,588.2 2,270.5
Provisions ............................................................................................................................................. 103.0 96.2 101.8 83.2
Total current liabilities ....................................................................................................................... 10,554.9 8,491.7 10,537.1 8,396.4
Total equity and liabilities 42,678.3 40,101.0 41,813.0 37,680.4
D. Other Data
As at and for the year ended December 31,
(R$ in millions, except for operating data)
2010 2009
2008
2007
IFRS
Other Financial Information:
Net working capital (4) ............................................................................................. 2,356.1 1,811.4 (1,243.8) (918.7)
Cash dividends paid ............................................................................................... 5,030.8 3,560.5 2,801.8 2,053.8
Depreciation and amortization (5) ............................................................................ 1,567.2 1,376.5 1,290.7 1,084.9
Capital expenditures (6) ............................................................................................ 2,169.8 1,306.2 1,782.0 1,497.4
Operating cash flows - generated (7) ........................................................................ 10,062.8 8,697.1 7,032.6 7,209.0
Investing cash flows - generated (used) (7) .............................................................. (3,174.2) (1,551.8) (2,214.1) (2,146.8)
Financing cash flows - generated (used) (7) ............................................................. (4,861.6) (5,929.0) (4,005.7) (4,246.5)
Other Operating Data:
Total production capacity - Beer – million hl (8) ..................................................... 163.3 156.7 156.9 165.6
Total production capacity – CSD & NANC – million
hl (8) .................................................................................................................... 83.7 79.9 78.9 94.1
Total beer volume sold – million hl (9) .................................................................... 119.2 110.7 105.0 103.0
Total CSD & NANC volume sold - millions hl (9) .................................................. 46.0 44.0 41.9 39.9
Number of employees (10) ........................................................................................ 44,924 40,787 39,301 36,305
Footnotes to selected financial information
(1) General and administrative expenses include director’s fees.
(2) The dividend and interest on shareholders’ equity per share was calculated based on the aomunt paid in the
year and net of withholding tax.
(3) Earnings per share are calculated dividing the net income by the weighted average number of common and
preferred shares outstanding during the periods. Ambev’s preferred shares are entitled to dividends 10%
greater than the dividends paid to common shares. For purposes of comparison, information relating to the
number of shares and earnings per share for all periods presented has been represented to conform
retrospectively to the effect of the 2010 split.
(4) Represents total current assets less total current liabilities.
6
(5) Includes depreciation of property, plant and equipment, amortization of intangible assets and impairment
losses related to these assets.
(6) Represents cash expenditures for property, plant and equipment.
(7) Operating, Investing and Financing cash flows data is derived from our Consolidated Cash Flow Statements.
(8) Represents available production capacity at year end of Ambev and its subsidiaries; capacity can vary from
year to year depending on mix; hl is the abbreviation for hectoliters; CSD & NANC is the abbreviation for
Carbonated Soft Drinks and Non-Alcoholic and Non-Carbonated Soft Drinks.
(9) Represents full-year volumes of AmBev and its subsidiaries.
(10) Includes all production and non-production-related employees of AmBev and its subsidiaries.
E. Dividends
Dividend Policy
The timing, frequency and amount of future dividend payments, if any, will depend upon various factors the
Board of Directors of Ambev considers relevant, including the earnings and the financial condition of Ambev.
Ambev’s bylaws provide for a mandatory dividend of 35% of its adjusted annual net income, if any, as determined
under Brazilian GAAP in the parent company financial statements, which differ from IFRS, and as determined
under Brazilian Corporate Law (―adjusted income‖). Brazilian companies are permitted to pay limited amounts of
interest attributable to capital to shareholders, referred to as interest on shareholders’ equity, and treat such payments
as an expense for Brazilian income and social contribution tax purposes. This notional interest distribution is treated
for accounting purposes as a deduction from shareholders' equity in a manner similar to a dividend. The benefit from
the tax deductible interest on own equity is recognized in income. The mandatory dividend includes amounts paid as
interest on shareholders’ equity. However, payment of such interest on shareholders’ equity is subject (including
ADSs) to pay Brazilian withholding income tax, whereas no such payment is required in connection with dividends
paid. For further information on this matter see ―Additional Information—Taxation—Brazilian Tax Considerations‖.
Adjusted income not distributed as dividends or as interest on shareholders’ equity may be capitalized, used to
absorb losses or otherwise appropriated as allowed under Brazilian Corporate Law or our bylaws; therefore, any
adjusted income may no longer be available to be paid as dividends. Ambev may also not pay dividends to its
shareholders in any particular fiscal year, upon the determination by the Board of Directors that such distribution
would be inadvisable in view of Ambev’s financial condition. Any such dividends not distributed would be allocated
to a special reserve account for future payment to shareholders, unless it is used to offset subsequent losses. For
further information on this matter see ―Risk Factors—Risks Relating to our Securities—Ambev shareholders may
not receive any dividends‖. Any dividends or interest on shareholders’ equity payable on Ambev’s preferred shares
must be 10% greater than those payable on Ambev’s common shares. See ―Additional Information—Memorandum
and Articles of Association—Dividends and Reserves—Dividend Preference of Preferred Shares‖.
For further information on Brazilian Corporate Law provisions relating to required reserves and payment of
dividends or interest on shareholders’ equity, as well as specific rules applicable to the payment of dividends by
Ambev, see ―Additional Information—Memorandum and Articles of Association—Dividends and Reserves‖.
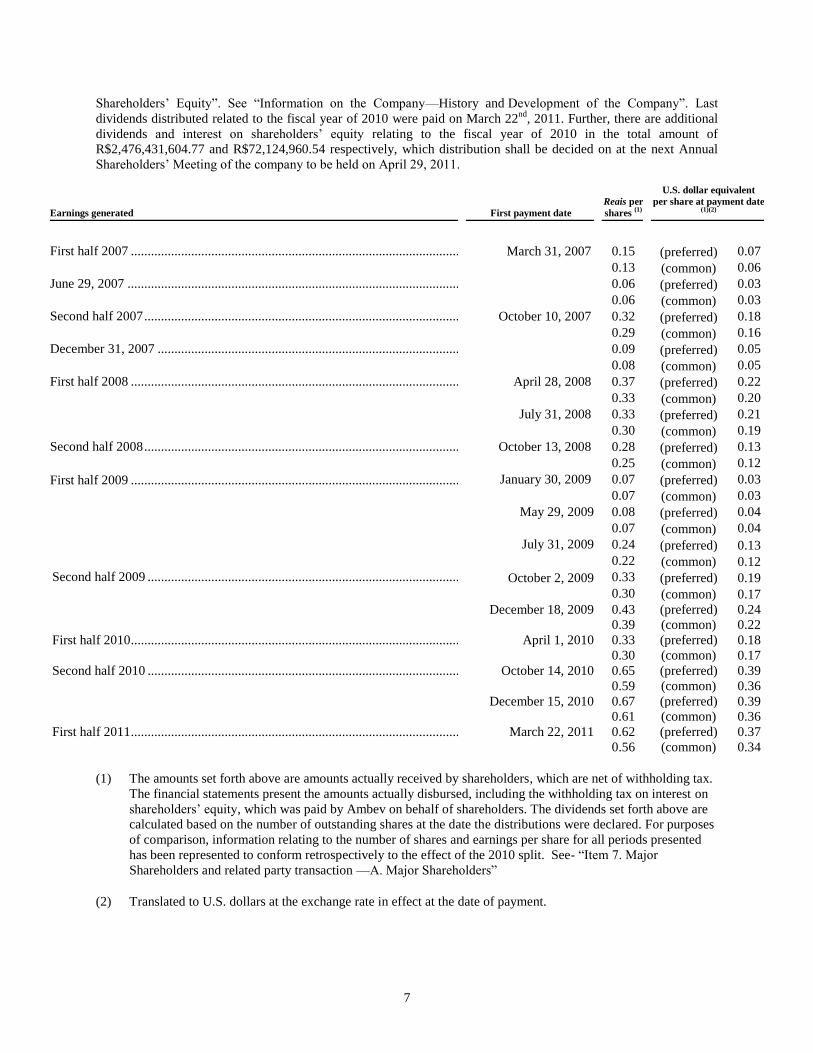
Ambev - Dividends and Interest on shareholders’ equity
The following table shows the cash dividends paid by Ambev to its preferred and common shareholders since
the first half of 2007 in Reais and in U.S. dollars (translated from Reais at the commercial exchange rate as of the
date of payment). The amounts include interest on shareholders’ equity, net of withholding tax. See ―Additional
Information—Memorandum and Articles of Association—Dividends and Reserves—Interest Attributable to
7
Shareholders’ Equity‖. See ―Information on the Company—History and Development of the Company‖. Last
dividends distributed related to the fiscal year of 2010 were paid on March 22nd
, 2011. Further, there are additional
dividends and interest on shareholders’ equity relating to the fiscal year of 2010 in the total amount of
R$2,476,431,604.77 and R$72,124,960.54 respectively, which distribution shall be decided on at the next Annual
Shareholders’ Meeting of the company to be held on April 29, 2011.
Earnings generated
First payment date
Reais per shares
(1)
U.S. dollar equivalent per share at payment date
(1)(2)
First half 2007 ..................................................................................................... March 31, 2007 0.15 (preferred) 0.07
0.13 (common) 0.06
June 29, 2007 ......................................................................................................
0.06 (preferred) 0.03
0.06 (common) 0.03
Second half 2007 ................................................................................................. October 10, 2007 0.32 (preferred) 0.18
0.29 (common) 0.16
December 31, 2007 .............................................................................................
0.09 (preferred) 0.05
0.08 (common) 0.05
First half 2008 ..................................................................................................... April 28, 2008 0.37 (preferred) 0.22
0.33 (common) 0.20
July 31, 2008 0.33 (preferred) 0.21
0.30 (common) 0.19
Second half 2008 ................................................................................................. October 13, 2008 0.28 (preferred) 0.13
0.25 (common) 0.12
First half 2009 ..................................................................................................... January 30, 2009 0.07 (preferred) 0.03
0.07 (common) 0.03
May 29, 2009 0.08 (preferred) 0.04
0.07 (common) 0.04
July 31, 2009 0.24 (preferred) 0.13
0.22 (common) 0.12
Second half 2009 ................................................................................................... October 2, 2009 0.33 (preferred) 0.19
0.30 (common) 0.17
December 18, 2009 0.43 (preferred) 0.24
0.39 (common) 0.22
First half 2010 ........................................................................................................ April 1, 2010 0.33 (preferred) 0.18
0.30 (common) 0.17
Second half 2010 ................................................................................................... October 14, 2010 0.65 (preferred) 0.39
0.59 (common) 0.36
December 15, 2010 0.67 (preferred) 0.39
0.61 (common) 0.36
First half 2011 ........................................................................................................ March 22, 2011 0.62 (preferred) 0.37
0.56 (common) 0.34
(1) The amounts set forth above are amounts actually received by shareholders, which are net of withholding tax.
The financial statements present the amounts actually disbursed, including the withholding tax on interest on
shareholders’ equity, which was paid by Ambev on behalf of shareholders. The dividends set forth above are
calculated based on the number of outstanding shares at the date the distributions were declared. For purposes
of comparison, information relating to the number of shares and earnings per share for all periods presented
has been represented to conform retrospectively to the effect of the 2010 split. See- ―Item 7. Major
Shareholders and related party transaction —A. Major Shareholders‖
(2) Translated to U.S. dollars at the exchange rate in effect at the date of payment.
8
F. Exchange Rate Information
Prior to March 4, 2005, there were two principal legal foreign exchange markets in Brazil: (i) the commercial
rate exchange market, and (ii) the floating rate exchange market.
Most trade and financial foreign exchange transactions were carried out on the commercial rate exchange
market. These included the purchase or sale of shares or payment of dividends or interest with respect to
shares. Foreign currencies could only be purchased in the commercial exchange market through a Brazilian
bank authorized to buy and sell currency in these markets. In both markets, rates were freely negotiated.
Resolution No. 3,265 by the Conselho Monetário Nacional (National Monetary Council), or CMN, dated
March 4, 2005, consolidated the foreign exchange markets into one single foreign exchange market, effective
as of March 14, 2005. All foreign exchange transactions are now carried out through institutions authorized to
operate in the consolidated market and are subject to registration with the electronic registration system of the
Central Bank of Brazil, or Central Bank. Foreign exchange rates continue to be freely negotiated, but may be
influenced by Central Bank intervention.
Since 1999, the Central Bank has allowed the real/U.S. dollar exchange rate to float freely, and during that
period, the real/U.S. dollar exchange rate has fluctuated considerably. In the past, the Central Bank has
intervened occasionally to control unstable movements in foreign exchange rates. We cannot predict whether
the Central Bank or the Brazilian federal government will continue to let the real float freely or will intervene
in the exchange rate market through a currency band system or otherwise. The real may depreciate or
appreciate against the U.S. dollar substantially in the future. See "Item 3H. —Risk Factors—Risks Relating to
Brazil."
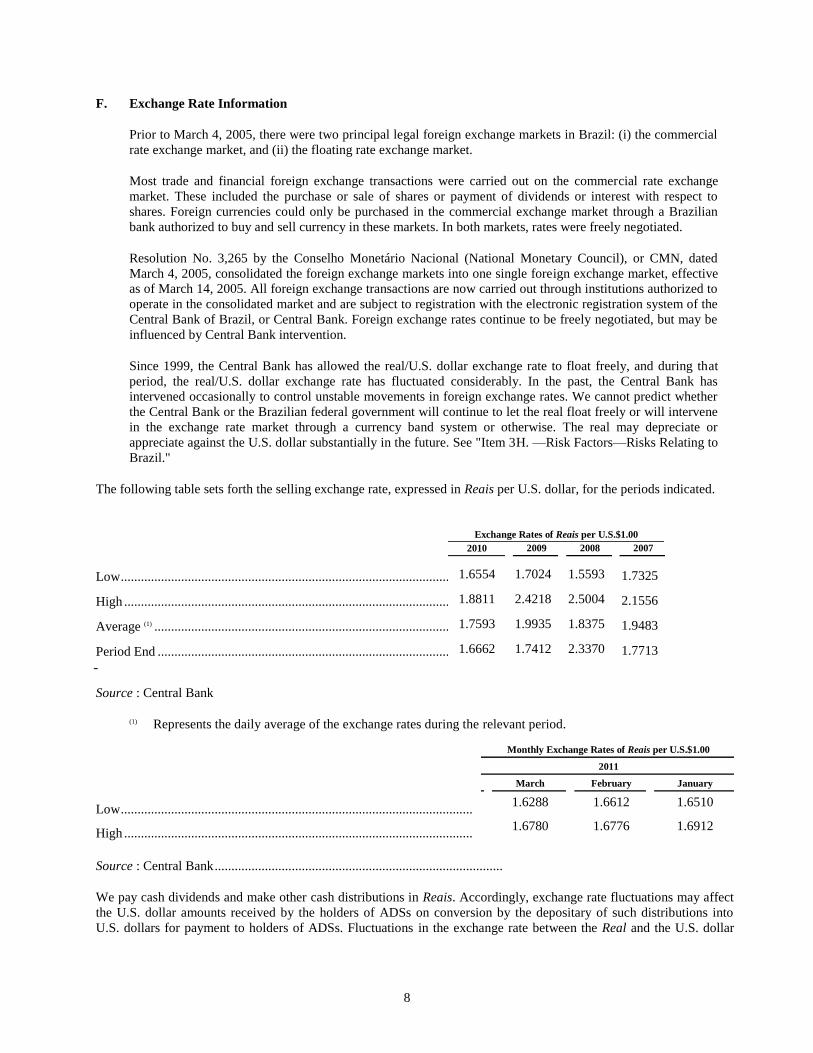
The following table sets forth the selling exchange rate, expressed in Reais per U.S. dollar, for the periods indicated.
Exchange Rates of Reais per U.S.$1.00
2010 2009
2008
2007
Low .................................................................................................................................... 1.6554 1.7024 1.5593 1.7325
High ................................................................................................................................... 1.8811 2.4218 2.5004 2.1556
Average (1) .......................................................................................................................... 1.7593 1.9935 1.8375 1.9483
Period End ......................................................................................................................... 1.6662 1.7412 2.3370 1.7713
Source : Central Bank
(1) Represents the daily average of the exchange rates during the relevant period.
Monthly Exchange Rates of Reais per U.S.$1.00
2011
March
February
January
Low ............................................................................................................................................. 1.6288 1.6612 1.6510
High ............................................................................................................................................ 1.6780 1.6776 1.6912
Source : Central Bank ......................................................................................
We pay cash dividends and make other cash distributions in Reais. Accordingly, exchange rate fluctuations may affect
the U.S. dollar amounts received by the holders of ADSs on conversion by the depositary of such distributions into
U.S. dollars for payment to holders of ADSs. Fluctuations in the exchange rate between the Real and the U.S. dollar
9
may also affect the U.S. dollar equivalent of Real price of our shares on the Brazilian Stock Exchange
(―BM&FBOVESPA‖). For further information on this matter see ―Risk Factors—Risks Relating to Our Shares‖.
G. Exchange Controls
There are no restrictions on ownership of the ADSs or the preferred shares or common shares by individuals
or legal entities domiciled outside of Brazil.
The right to convert dividend payments, interest on shareholders’ equity payments and proceeds from the sale
of preferred shares or common shares into foreign currency and to remit such amounts outside Brazil is subject to
exchange control restrictions and foreign investment legislation which generally requires, among other things, that
relevant investments be registered with the Central Bank. Restrictions on the remittance of foreign capital abroad
could hinder or prevent Banco Bradesco S.A. (the ―custodian‖) or holders who have exchanged Ambev’s ADSs for
shares of Ambev, from converting dividend distributions, interest on shareholders’ equity or the proceeds from any
sale of shares of Ambev into U.S. dollars and remitting such U.S. dollars abroad. Holders of Ambev ADSs could be
adversely affected by delays in or refusal to grant any required governmental approval for conversions of Real
payments and remittances abroad.
Under Brazilian law relating to foreign investment in the Brazilian capital markets (―Foreign Investment
Regulations‖), foreign investors registered with the CVM and acting through authorized custody accounts managed
by local agents may buy and sell shares on Brazilian stock exchanges without obtaining separate certificates of
registration for each transaction. Foreign investors may register their investment under Law No. 4,131/62, as
amended, or Resolution No. 2,689/00 of the National Monetary Council, as amended (―Law No. 4,131‖ and
―Resolution No. 2,689‖).
Under Resolution No. 2,689, foreign investors may invest in almost all financial assets and engage in almost
all transactions available in the Brazilian financial and capital markets, provided that certain requirements are
fulfilled. In accordance with Resolution No. 2,689, the definition of a foreign investor includes individuals, legal
entities, mutual funds and other collective investment entities, domiciled or headquartered abroad.
In order to become a Resolution No. 2,689 investor, a foreign investor must:
▪Appoint at least one representative in Brazil, with powers to perform actions relating to its investment;
▪Appoint an authorized custodian in Brazil for its investments, which must be a financial institution or
entity duly authorized by the Central Bank or CVM;
▪Complete the appropriate foreign investor registration form;
▪Register as a foreign investor with the CVM; and
▪Register its foreign investment with the Central Bank.
In addition, an investor operating under the provisions of Resolution No. 2,689 must be registered with the
Brazilian internal revenue service (Secretaria da Receita Federal), pursuant to its Regulatory Instruction No. 1,005
of February 8, 2010, as amended and Regulatory Instruction No. 1,054 of June 10, 2010, as amended.
Pursuant to the registration obtained by Ambev with the Central Bank in the name of The Bank of New York
Mellon (formerly The Bank of New York) with respect to the Ambev ADSs to be maintained by the custodian on
behalf of The Bank of New York Mellon, the custodian and The Bank of New York Mellon will be able to convert
dividends and other distributions with respect to the Ambev shares represented by Ambev ADSs into foreign
currency and remit the proceeds outside of Brazil. In the event that a holder of Ambev ADSs exchanges such ADSs
for Ambev shares, such holder will be entitled to continue to rely on The Bank of New York Mellon’s registration
for only five business days after such exchange. After that, such holder must seek to obtain its own registration
pursuant to Law No. 4,131 or Resolution No. 2,689. Thereafter, unless any such holder has registered its investment
with the Central Bank, such holder may not convert into foreign currency and remit outside Brazil the proceeds from
the disposition of, or distributions with respect to, such Ambev shares.
10
Under current legislation, the Brazilian government may impose temporary restrictions on remittances of
foreign capital abroad in the event of a serious imbalance or an anticipated serious imbalance of Brazil’s balance of
payments. For approximately six months in 1989 and early 1990, the Brazilian government froze all dividend and
capital repatriations held by the Central Bank that were owed to foreign equity investors in order to conserve
Brazil’s foreign currency reserves. These amounts were subsequently released in accordance with Brazilian
government directives. We cannot assure you that the Brazilian government will not impose similar restrictions on
foreign repatriations in the future. See ―Risk Factors—Risks Relating to Brazil and Other Countries in Which We
Operate‖ and ―Risk Factors—Risks Relating to Our Shares‖.
H. Risk Factors
Before making an investment decision, you should consider all of the information set forth in this annual
report. In particular, you should consider the special features applicable to an investment in Brazil and applicable to
an investment in Ambev, including those set forth below. In general, investing in the securities of issuers in
emerging market countries, such as Brazil, involves a higher degree of risk than investing in the securities of issuers
in the United States.
For purposes of this section, when we state that a risk, uncertainty or problem may, could or would have an
―adverse effect‖ on us, we mean that the risk, uncertainty or problem may, could or would have an adverse effect on
our business, financial condition, liquidity, results of our operations or prospects, except as otherwise indicated or as
the context may otherwise require. You should view similar expressions in this section as having a similar meaning.
Risks Relating To Brazil and other Countries in Which We Operate
Economic uncertainty and volatility in Brazil may adversely affect our business
Our most significant market is Brazil, which has periodically experienced extremely high rates of inflation.
Inflation, along with governmental measures to fight inflation and public speculation about possible future
measures, has had significant negative effects on the Brazilian economy. The annual rates of inflation, as measured
by the National Consumer Price Index (Índice Nacional de Preços ao Consumidor), have reached in the past a
hyper-inflationary peak of 2,489.1% in 1993. Brazilian inflation, as measured by the same index, was 2.8% in 2006,
5.2% in 2007, 6.5% in 2008, 4.1% in 2009 and 6.5% in 2010. Brazil may experience high levels of inflation in the
future. There can be no assurance that recent lower levels of inflation will continue. Future governmental actions,
including actions to adjust the value of the Real, may trigger increases in inflation. We cannot assure you that
inflation will not affect our business in the future. In addition, any Brazilian government’s actions to maintain
economic stability, as well as public speculation about possible future actions, may contribute significantly to
economic uncertainty in Brazil and may heighten volatility in the Brazilian securities markets and securities issued
abroad by Brazilian issuers. It is also difficult to assess the impact that turmoil in the credit markets will have in the
Brazilian economy, and as a result on our future operations and financial results.
The Brazilian currency has devalued frequently during the last four decades. Throughout this period, the
Brazilian government has implemented various economic plans and utilized a number of exchange rate policies,
including sudden devaluations and periodic mini-devaluations, during which the frequency of adjustments has
ranged from daily to monthly, floating exchange rate systems, exchange controls and dual exchange rate markets.
There have been significant fluctuations in the exchange rates between Brazilian currency and the U.S. dollar and
other currencies. For example, the Real/U.S. dollar exchange rate depreciated from R$2.3204 per U.S.$1.00 at
December 31, 2001 to R$3.5333 at December 31, 2002. The exchange rate reached R$3.9552 per U.S.$1.00 in
October 2002. From 2002 through 2007 however, through late 2008 the Real appreciated against the U.S. dollar.
The Real appreciated by 9.5% in 2006, resulting in an exchange rate of R$2.1380 per U.S.$1.00 as of December 31,
2006, and a further 20.7% appreciation in 2007, resulting in an exchange rate of R$1.7713 per U.S.$1.00 as of
December 31, 2007.
During 2008, as a result of financial market volatility, the Real depreciated by 24.2%, resulting in an
exchange rate of R$2.3370 per U.S.$1.00 as of December 31, 2008. In 2009, the Real experienced appreciated by
34.2%, resulting in an exchange rate of R$1.7412 per U.S.$1.00 as of December 31, 2009. In 2010, the Real
appreciated by 4.5% resulting in an exchange rate of R$1.6662 per U.S. $1.00 as of December 31, 2010.
11
Devaluation of the Real relative to the U.S. dollar would create additional inflationary pressures in Brazil by
generally increasing the price of imported products and requiring recessionary governmental policies to curb
aggregate demand. On the other hand, further appreciation of the Real against the U.S. dollar may lead to a
deterioration of the current account and the balance of payments, as well as dampen export-driven growth. The
potential impact of the floating exchange rate and measures of the Brazilian government aimed at stabilizing the
Real is uncertain. In addition, a substantial increase in inflation may weaken investor confidence in Brazil,
impacting our ability to finance our operations through the international capital markets.
Devaluation of the Real relative to the U.S. dollar may adversely affect our financial performance
Most of our sales are in Reais; however, a significant portion of our debt is denominated in or indexed to U.S.
dollars. In addition, a significant portion of our cost of sales, in particular those related to packaging such as cans
and PET bottles, as well as sugar, hops and malt are also denominated in or linked to U.S. dollars. Therefore, any
devaluation of the Real may increase our financial expenses and operating costs and could affect our ability to meet
our foreign currency obligations. Although our current policy is to hedge substantially all of our U.S. dollar-
denominated debt and cost of sales against changes in foreign exchange rates, we cannot assure you that such
hedging will be possible at all times in the future.
Volatility in commodities prices may adversely affect our financial performance
A significant portion of our cost of sales is comprised of commodities such as aluminum, sugar, hops and
barley, the prices of which fluctuated significantly in 2010. An increase in commodities prices directly affects our
operating costs. Although our current policy is to mitigate our exposure risks to commodity prices whenever
financial instruments are available, we can not assure that such hedging will be possible at all times in the future.
Commodity
High Price
Low Price
Avg. 2010
Fluctuation
Aluminum (US$/Ton) ................................................... 2,461 1,826 2,173 34.8%
Sugar (Cents/Pounds) .................................................... 34.77 13.00 22.28 167.5%
Corn (R$/Bag) ............................................................... 28.67 17.70 21.50 62.0%
Wheat (Cents/Bushel) ................................................... 841 425 582 97.7%
PET (US$/Ton) ............................................................. 1,480 1,146 1,265 29.1%
Increases in taxes levied on beverage products in Brazil and unfair competition arising from tax evasion
may adversely affect our results and profitability
Increases in Brazil’s already high levels of taxation could adversely affect our profitability. Increases in taxes
on beverage products usually result in higher beverage prices for consumers. Higher beverage prices generally result
in lower levels of consumption and, therefore, lower net sales. Lower net sales result in lower margins because some
of our costs are fixed and thus do not vary significantly based on the level of production. We cannot assure you that
the government will not increase current tax levels, at both state and/or federal levels, and that this will not impact
our business. In November 2008 the Brazilian Congress approved certain changes (effective January 1, 2009) to the
taxable basis and tax rates of the Imposto Sobre Produtos Industrializados (the Brazilian federal excise tax (―IPI‖))
and the PIS/COFINS (Brazilian social contribution sales taxes). Under the previous system, these taxes were paid as
a fixed R$/hectoliter rate by all taxpayers. The new system establishes that higher priced brands pay higher taxes per
hectoliter than lower priced ones. The increase in Ambev’s IPI and PIS/COFINS tax burden is dependent on
Ambev’s price, packaging and brand mix. No assurance can be given that the Brazilian government will not
consider further tax increases in the future.
In addition, the Brazilian beverage industry experiences unfair competition arising from tax evasion, which is
primarily due to the high level of taxes on beverage products in Brazil. An increase in taxes may lead to an increase
in tax evasion, which could result in unfair pricing practices in the industry. The federal government issued
regulations requiring the mandatory installation of production (volume) control systems in all Brazilian beer and
carbonated soft drinks (―CSD‖) factories in order to assist governments fight tax evasion in the beverage industry.
We cannot assure you that these regulations will have the intended impact.
12
The Brazilian government has exercised, and continues to exercise, significant influence over the
Brazilian economy; Brazilian economic and political conditions have a direct impact on our business
The Brazilian economy has been characterized by significant involvement on the part of the Brazilian
government, which often changes monetary, credit and other policies to influence Brazil’s economy. The Brazilian
government’s actions to control inflation and affect other policies have often involved wage and price controls, the
Central Bank’s base interest rates, as well as other measures, such as the freezing of bank accounts, which occurred
in 1990.
Actions taken by the Brazilian government concerning the economy may have important effects on Brazilian
corporations and other entities, including Ambev, and on market conditions and prices of Brazilian securities. Our
financial condition and results of operations may be adversely affected by the following factors and the Brazilian
government’s response to the following factors:
▪Devaluations and other exchange rate movements;
▪Inflation;
▪Exchange control policies;
▪Social instability;
▪Price instability;
▪Energy shortages;
▪Interest rates;
▪Liquidity of domestic capital and lending markets;
▪Tax policy; and
▪Other political, diplomatic, social and economic developments in or affecting Brazil.
Latin America South operations are subject to substantial risks relating to its business and operations
in Argentina and other countries in which it operates
We own over 99% of the total share capital of Quilmes International (Bermuda) Ltd. (―QIB‖), the net
revenues from which in 2010 corresponded to 15.3% of Ambev’s consolidated results. QIB is a holding company
with operating subsidiaries in Argentina and other South American countries. As a result, QIB’s financial condition
and results of operations may be adversely affected by the political instability, fluctuations in the economy and
governmental actions concerning the economy of Argentina and the other countries in which its subsidiaries operate
and, consequently, affect our consolidated results. For example, Argentina has recently experienced political and
economic instability. Commercial and financial activities were virtually paralyzed in 2002, further aggravating the
economic recession that precipitated the financial crisis. A widespread recession followed in 2002, including a
10.9% decrease in real GDP, high unemployment and high inflation, which have led to a reduction of disposable
income and of real wages and resulted in changes in consumer behavior across all class sectors of the Argentine
population. Argentina began to stabilize in 2003 and has continued to show signs of stability since 2004, with real
GDP growth at 8.5% for 2006, 8.7% for 2007 and 7% for 2008, a -3.0% decrease in 2009 and growth of 9.1% in
2010. The unemployment rate reached 7.3% during the fourth quarter of 2010, compared to 8.4% during the same
period of 2009.
Notwithstanding the current continued stabilization, the Argentine economic and social situation has rapidly
deteriorated in the past, and may quickly deteriorate in the future; we cannot assure you that the Argentine economy
will continue its sustained growth. The devaluation of the Argentine peso, inflation and deteriorating
macroeconomic conditions in Argentina could have, and may continue to have, a material adverse effect on our
Latin America South operations and their results.
13
U.S. investors may not be able to effect service of process upon, or to enforce judgments against us
We are organized under the laws of the Federative Republic of Brazil. Substantially all of our directors and
executive officers and the experts named in this annual report are residents of countries other than the United States.
All or a substantial portion of the assets of such non-U.S. residents and of Ambev are located outside the United
States. Therefore, it may not be possible for investors to effect service of process within the United States upon such
persons or Ambev, or to enforce against them judgments obtained in U.S. courts based upon civil liability provisions
of the Federal securities laws of the United States or otherwise.
Risks Relating To Ambev and its Subsidiaries
We are subject to Brazilian and other antitrust regulations
We have a substantial share of the beer market in Brazil and thus we are subject to constant monitoring by
Brazilian antitrust authorities. In addition, in connection with the combination of Brahma and Antarctica upon the
creation of Ambev in 1999, we entered into a performance agreement with the Brazilian antitrust authorities, which
requires us to comply with a number of restrictions. We are also party to other antitrust legal proceedings. For
further information on this matter see ―Financial Information—Consolidated Financial Statements and Other
Financial Information—Legal Proceedings—Antitrust matters‖. We cannot assure you that Brazilian antitrust
regulation will not affect our business in the future.
Ambev’s participation in the Argentine beer market increased substantially following the acquisition of our
interest in Quinsa. Our operation in Argentina is subject to constant monitoring by Argentinean antitrust authorities.
For further information on this matter see ―Information on the Company—History and Development of the
Company—Interest in Quinsa‖. We cannot assure you that Argentinean antitrust regulation will not affect our
business in Argentina in the future, and therefore, impact the benefits that Ambev anticipates will be generated from
this investment.
We are subject to regulation on alcoholic and CSD beverages in the countries in which we operate
Our business is regulated by federal, state, provincial and local laws and regulations regarding such matters as
licensing requirements, marketing practices and related matters. We may be subject to claims that we have not
complied with existing laws and regulations, which could result in fines and penalties. Recently, the federal
government as well as certain Brazilian states and municipalities in which we operate have enacted legislation
restricting the hours of operations of certain points of sale, prohibiting the sale of alcoholic beverages at highway
points of sale and prohibiting the sale of CSDs in schools. In addition, the Brazilian Congress is evaluating proposed
regulation imposing higienic seals on beverage cans, as well as regulation on the consumption, sales and marketing
of alcoholic beverages, including beer which, if enacted, may impose restrictions on the advertisement of alcoholic
beverage products on television during specified times of the day and the hours of operation of certain points of sale,
among other things. These restrictions may adversely impact our results of operations. For further information,
please refer to ―Information on the Company—Business Overview—Regulation‖.
In addition, there is a global trend of increasing regulatory restrictions with respect to the sale of alcoholic and
CSD beverages. Compliance with such regulatory restrictions can be costly and may affect earnings in the countries
in which we operate.
Our results of operations are affected by fluctuations in exchange rates
We have historically reported our consolidated results in Brazilian Reais. In 2010, we derived approximately
32.0% of our revenue from operating companies that have functional currencies that are not Brazilian Reais (that is,
in most cases, the local currency of the respective operating company). Consequently, any change in exchange rates
between our operating companies’ functional currencies and the Brazilian Reais will affect our consolidated income
statement and balance sheet. Decreases in the value of our operating companies’ functional currencies against the
Brazilian Reais will tend to reduce those operating companies’ contributions in terms of our financial condition and
results of operations.
14
In addition to currency translation risk, we incur currency transaction risks whenever one of our operating
companies enters into transactions using currencies other than their respective functional currencies, including
purchase or sale transactions and the issuance or incurrence of debt. Although we have hedge policies in place to
manage commodity price and foreign currency risks to mitigate our exposure to currencies other than our operating
companies’ functional currencies, there can be no assurance that such policies will be able to successfully hedge
against the effects of such foreign exchange exposure, particularly over the long-term.
Competition could lead to a reduction of our margins, increase costs and adversely affect our
profitability
Globally, brewers compete mainly on the basis of brand image, price, quality, distribution networks and
customer service. Consolidation has significantly increased the capital base and geographic reach of our competitors
in some of the markets in which we operate, and competition is expected to increase further as the trend towards
consolidation among companies in the beer industry continues.
Competition may divert consumers and customers from our products. Competition in our various markets
could cause us to reduce pricing, increase capital investment, increase marketing and other expenditures, prevent us
from increasing prices to recover higher costs, and thereby cause us to reduce margins or lose market share. Any of
the foregoing could have a material adverse effect on our business, financial condition and results of operations.
Innovation faces inherent risks, and the new products we introduce may not be successful.
Additionally, the unfair pricing practices in some markets and the lack of transparency, or even certain illicit
practices, such as tax evasion and corruption, may skew the competitive environment, with material adverse effects
on our profitability or ability to operate.
The ability of our subsidiaries to distribute cash upstream may be subject to various conditions and
limitations
Our foreign subsidiaries’ ability to distribute cash (to be used, among other things, to meet our financial
obligations) through dividends, intercompany advances, management fees and other payments is, to a large extent,
dependent on the availability of cash flows at the level of such domestic and foreign subsidiaries and may be
restricted by applicable laws and accounting principles. In particular, 32% (R$8,086.8 million) of our total revenue
of R$ 25,233.3 million in 2010 came from our foreign subsidiaries. In addition to the above, some of our
subsidiaries are subject to laws restricting their ability to pay dividends or the amount of dividends they may pay.
If we are not able to obtain sufficient cash flows from our foreign subsidiaries, this could negatively impact
our business, results of operations and financial condition.
We rely on the reputation of our brands
Our success depends on our ability to maintain and enhance the image and reputation of our existing products
and to develop a favorable image and reputation for new products. The image and reputation of our products may be
reduced in the future; concerns about product quality, even when unfounded, could tarnish the image and reputation
of our products. An event, or series of events, that materially damages the reputation of one or more of our brands
could have an adverse effect on the value of that brand and subsequent revenues from that brand or business.
Restoring the image and reputation of our products may be costly and may not be possible. Moreover, our
marketing efforts are subject to restrictions on the permissible advertising style, media and messages used. In a
number of countries, for example, television is a prohibited medium for advertising alcoholic products, and in other
countries, television advertising, while permitted, is carefully regulated. Any additional restrictions in such
countries, or the introduction of similar restrictions in other countries, may constrain our brand building potential
and thus reduce the value of our brands and related revenues.
Negative publicity may harm our business
15
Media coverage, and publicity generally, can exert significant influence on consumer behavior and actions. If
the social acceptability of beer or soft drinks were to decline significantly, sales of our products could materially
decrease. In recent years, there has been increased public and political attention directed at the alcoholic beverage
and soft drink industries. This attention is a result of public concern over alcohol-related problems, including drunk
driving, underage drinking and health consequences resulting from the misuse of beer (for example, alcoholism and
obesity), as well as soft-drink related problems, including health consequences resulting from the excessive
consumption of soft drinks (for example, obesity). Negative publicity regarding alcohol or soft drink consumption,
publication of studies that indicate a significant health risk from consumption of alcohol or soft drinks, or changes in
consumer perceptions in relation to alcohol or soft drinks generally could adversely affect the sale and consumption
of our products and could harm our business, results of operations, cash flows or financial condition as consumers
and customers change their purchasing patterns.
Key brand names are used by us, our subsidiaries, associates and joint ventures, and licensed to third-party
brewers. To the extent that we, one of our subsidiaries, associates, joint ventures or licensees are subject to negative
publicity, and the negative publicity causes consumers and customers to change their purchasing patterns, it could
have a material adverse effect on our business, results of operations, cash flows or financial condition. As we
continue to expand our operations into emerging and growth markets, there is a greater risk that we may be subject
to negative publicity, in particular in relation to labor rights and local work conditions. Negative publicity that
materially damages the reputation of one or more of our brands could have an adverse effect on the value of that
brand and subsequent revenues from that brand or business, which could adversely impact our business, results of
operations, cash flows and financial condition.
Demand for our products may be adversely affected by changes in consumer preferences and tastes
We depend on our ability to satisfy consumer preferences and tastes. Consumer preferences and tastes can
change in unpredictable ways due to a variety of factors, such as changes in demographics, consumer health
concerns about obesity, product attributes and ingredients, changes in travel, vacation or leisure activity patterns,
weather, negative publicity resulting from regulatory action or litigation against us or comparable companies or a
downturn in economic conditions. Consumers also may begin to prefer the products of competitors or may generally
reduce their demand for products in the category. Failure by us to anticipate or respond adequately to changes in
consumer preferences and tastes could adversely impact our business, results of operations and financial condition.
Seasonal consumption cycles and adverse weather conditions may result in fluctuations in demand for
our products
Seasonal consumption cycles and adverse weather conditions in the markets in which we operate may have an
impact on our operations. This is particularly true in the summer months, when unseasonably cool or wet weather
can affect sales volumes.
If any of our products is defective or found to contain contaminants, we may be subject to product
recalls or other liabilities
We take precautions to ensure that our beverage products are free from contaminants and that our packaging
materials (such as bottles, crowns, cans and other containers) are free of defects. Such precautions include
quality-control programs for primary materials, the production process and our final products. We have established
procedures to correct problems detected.
In the event that contamination or a defect does occur in the future, it may lead to business interruptions,
product recalls or liability, each of which could have an adverse effect on our business, reputation, prospects,
financial condition and results of operations.
Although we maintain insurance policies against certain product liability (but not product recall) risks, we
may not be able to enforce our rights in respect of these policies, and, in the event that contamination or a defect
occurs, any amounts that we recover may not be sufficient to offset any damage we may suffer, which could
adversely impact our business, results of operations and financial condition.
16
We may not be able to protect our intellectual property rights
Our future success depends significantly on our ability to protect our current and future brands and products
and to defend our intellectual property rights, including trademarks, patents, domain names, trade secrets and know-
how. We have been granted numerous trademark registrations covering our brands and products and have filed, and
expect to continue to file, trademark and patent applications seeking to protect newly developed brands and
products. We cannot be sure that trademark and patent registrations will be issued with respect to any of our
applications. There is also a risk that we could, by omission, fail to renew a trademark or patent on a timely basis or
that our competitors will challenge, invalidate or circumvent any existing or future trademarks and patents issued to,
or licensed by, us.
Although we have put in place appropriate actions to protect our portfolio of intellectual property rights
(including trademark registration and domain names), we cannot be certain that the steps we have taken will be
sufficient or that third parties will not infringe upon or misappropriate proprietary rights. If we are unable to protect
our proprietary rights against infringement or misappropriation, it could have a material adverse effect on our
business, results of operations, cash flows or financial condition, and in particular, on our ability to develop our
business.
We rely on key third parties, including key suppliers, and the termination or modification of the
arrangements with such third parties could negatively affect our business
We rely on key third-party suppliers, including third-party suppliers for a range of raw materials for beer and
soft drinks, and for packaging material, including aluminum cans, glass, kegs and PET bottles. We seek to limit our
exposure to market fluctuations in these supplies by entering into medium- and long-term fixed-price arrangements.
We have a limited number of suppliers of aluminum cans, glass and PET bottles. Consolidation of the aluminum can
industry, glass and PET bottle industry in certain markets in which we operate has reduced local supply alternatives
and increased the risk of disruption to aluminum can, glass and PET bottle supplies. Although we generally have
other suppliers of raw materials and packaging materials, the termination of or material change to arrangements with
certain key suppliers, disagreements with suppliers as to payment or other terms, or the failure of a key supplier to
meet our contractual obligations or otherwise deliver materials consistent with current usage would or may require
us to make purchases from alternative suppliers, in each case at potentially higher prices than those agreed with this
supplier, and this could have a material impact on our production, distribution and sale of beer and have a material
adverse effect on our business, results of operations, cash flows or financial condition.
For certain packaging supplies, raw materials and commodities, we rely on a small number of important
suppliers. If these suppliers became unable to continue to meet our requirements, and we are unable to develop
alternative sources of supply, our operations and financial results could be adversely affected.
We are exposed to the risk of litigation
We are now and may in the future be party to legal proceedings and claims (including labor, tax and alcohol-
related claims) and significant damages may be asserted against us. See ―Financial Information—Consolidated
Financial Statements and other Financial Information—Legal Proceedings‖ and note 31 to our audited consolidated
financial statements as of December 31, 2010 and 2009 for a description of certain material contingencies of the
Company.
Our operations are subject to environmental regulations, which could expose us to significant
compliance costs and litigation relating to environmental issues
Our operations are subject to environmental regulations by national, state and local agencies, including, in
certain cases, regulations that impose liability without regard to fault. These regulations can result in liability which
might adversely affect our operations. The environmental regulatory climate in the markets in which we operate is
becoming stricter, with greater emphasis on enforcement.

17
While we have budgeted for future capital and operating expenditures to maintain compliance with
environmental laws and regulations, there can be no assurance that we will not incur substantial environmental
liability or that applicable environmental laws and regulations will not change or become more stringent in the
future.
Information technology failures could disrupt our operations
We increasingly rely on information technology systems to process, transmit, and store electronic information.
A significant portion of the communication between our personnel, customers, and suppliers depends on information
technology. As with all large systems, our information systems may be vulnerable to a variety of interruptions due to
events beyond our control, including, but not limited to, natural disasters, terrorist attacks, telecommunications
failures, computer viruses, hackers or other security issues. These or other similar interruptions could disrupt our
operations, cash flows or financial condition.
We depend on information technology to enable us to operate efficiently and interface with customers, as well
as to maintain in-house management and control. The concentration of processes in shared services centers means
that any disruption could impact a large portion of our business. If we do not allocate, and effectively manage, the
resources necessary to build and sustain the proper technology infrastructure, we could be subject to transaction
errors, processing inefficiencies, loss of customers, business disruptions, or the loss of or damage to intellectual
property through security breach. As with all information technology systems, our system could also be penetrated
by outside parties intent on extracting information, corrupting information or disrupting business processes. Such
interruptions could disrupt our business and could have a material adverse effect on our business, results of
operations, cash flows or financial condition.
Natural and other disasters could disrupt our operations
Our business and operating results could be negatively impacted by social, technical or physical risks such as
earthquakes, hurricanes, flooding, fire, power loss, loss of water supply, telecommunications and information
technology system failures, political instability, military conflict and uncertainties arising from terrorist attacks,
including a global economic slowdown, the economic consequences of any military action and associated political
instability.
Our insurance coverage may not be sufficient
The cost of some of our insurance policies could increase in the future. In addition, some types of losses, such
as losses resulting from wars, acts of terrorism, or natural disasters, generally are not insured because they are either
uninsurable or it is not economically practical to obtain insurance. Moreover, insurers recently have become more
reluctant to insure against these types of events. Should an uninsured loss or a loss in excess of insured limits occur,
this could adversely impact our business, results of operations and financial condition.
Risks Relating to our Shares
The relative volatility and illiquidity of securities of Brazilian companies may substantially limit your
ability to sell our securities at the price and time you desire
Investing in securities of companies in emerging markets, such as Brazil, involves greater risk than investing
in securities of companies from more developed countries and such investments are generally considered speculative
in nature.
Brazilian investments, such as investments in our securities, are subject to economic and political risks,
involving, among others:
▪Changes in the regulatory, tax, economic and political environment that may affect the ability of investors
to receive payment, in whole or in part, in respect of their investments; and
▪Restrictions on foreign investment and on repatriation of capital invested.
18
The Brazilian securities markets are substantially smaller, less liquid, more concentrated and more volatile
than major U.S. and European securities markets, and are not as highly regulated or supervised as these markets.
The relatively small market capitalization and illiquidity of the Brazilian securities markets may substantially limit
your ability to sell the securities at the price and time you desire.
Deterioration in economic and market conditions in other emerging market countries may adversely
affect the market price of Ambev‟s securities
Economic and market conditions in other emerging market countries, especially those in Latin America,
influence the market for securities issued by Brazilian companies and investors’ perception of economic conditions
in Brazil. Past economic crises in emerging markets, such as in Southeast Asia, Russia and Argentina, triggered
securities market volatility in Brazil and other emerging market countries’ securities markets. In the recent past,
Argentina, Venezuela, Uruguay and Paraguay experienced a significant economic downturn. The market value of
our securities may therefore be adversely affected by events occurring outside of Brazil, especially in other
emerging market countries.
Our controlling shareholders are able to determine the outcome of many corporate actions without the
approval of non-controlling shareholders
The controlling shareholders of Ambev, Interbrew International B.V. and AmBrew S.A., which are both
subsidiaries of Anheuser-Busch InBev N.V./S.A. (―A-B InBev‖) and Fundação Antonio e Helena Zerrenner
Instituição Nacional de Beneficência (―Fundação Zerrenner‖), together hold approximately 91.1% of Ambev’s
common shares (excluding treasury shares) as of December 31, 2010.
A-B InBev indirectly holds shares of Ambev common stock that represent approximately 74.0% of the total
voting power of Ambev’s capital stock (excluding treasury shares) as of December 31, 2010. A-B InBev thus has
control over Ambev, even though (i) A-B InBev remains subject to the Ambev shareholders’ agreement with
Fundação Zerrenner and (ii) A-B InBev is jointly controlled by Messrs. Lemann, Sicupira and Telles and
Interbrew’s former controlling shareholders. For further information on these matters see ―Information on the
Company—InBev-Ambev Transactions‖ and ―Major Shareholders and Related Party Transactions—Major
Shareholders—Ambev Shareholders’ Agreement‖.
The controlling shareholders are able to elect the majority of the members of the Board of Directors of Ambev
and generally determine the outcome of other actions requiring the approval of Ambev’s shareholders. Under
Brazilian Corporate Law, the protections afforded to non-controlling security holders and the fiduciary duties of
directors may, in some respects, be less comprehensive than in the United States or other jurisdictions.
Ambev shareholders may not receive any dividends
According to our bylaws, Ambev must generally pay its shareholders 35% of its annual adjusted net income
as presented in the parent company (individual) financial statements prepared under Brazilian GAAP (which for
individual financial statements differ from IFRS). The main sources for these dividends are cash flows from
Ambev’s operations and dividends from Ambev’s operating subsidiaries. The adjusted income may be capitalized,
used to absorb losses or otherwise appropriated as allowed under Brazilian GAAP and Brazilian Corporate Law;
therefore, adjusted income may not be available to be paid as dividends in a certain year. Ambev might not pay
dividends to its shareholders in any particular fiscal year, upon the determination of the Board of Directors that such
distributions would be inadvisable in view of Ambev’s financial condition. While the law does not establish the
circumstances rendering the payment of dividends inadvisable, it is generally agreed that a company need not pay
dividends if such payment threatens the existence of the company as a going concern or harms its normal course of
operations. Any dividends not distributed would be allocated to a special reserve account for future payment to
shareholders, unless it is used to offset subsequent losses or as otherwise provided for in our bylaws.
It is possible, therefore, that shareholders of Ambev will not receive dividends in any particular fiscal year.
19
Controls and restrictions on foreign currency remittances could harm the ability of Ambev to transfer
dividend payments abroad
Brazilian law provides that whenever there is a serious imbalance in Brazil’s balance of payments or reasons
to foresee a serious imbalance, the Brazilian government may impose temporary restrictions on the remittance to
foreign investors of the proceeds of their investments in Brazil. For example, for approximately six months in 1989
and early 1990 the Brazilian government froze all dividend and capital repatriations that were owed to foreign equity
investors and held by the Central Bank in order to conserve Brazil’s foreign currency reserves. These amounts were
subsequently released in accordance with Brazilian government directives. Similar measures could be taken by the
Brazilian government in the future.
As a result, the Brazilian government may in the future restrict companies such as Ambev from paying
amounts denominated in foreign currencies or require that any such payments be made in Brazilian Reais. The
likelihood that the Brazilian government would impose such restrictions may be affected by the extent of Brazil’s
foreign currency reserves, the availability of foreign currency in the foreign exchange markets on the date a payment
is due, the size of Brazil’s debt service burden relative to the economy as a whole, Brazil’s policy toward the
International Monetary Fund and other factors. We cannot assure you that the Central Bank will not modify its
policies or that the Brazilian government will not institute restrictions or delays on payments by Brazilian issuers in
respect of securities issued in the international capital markets to date. For further information on this matter see ―—
Exchange Controls‖.
If you exchange the Ambev ADSs for Ambev shares, you risk losing some foreign currency remittance
and Brazilian tax advantages
The Ambev ADSs benefit from the foreign capital registration that The Bank of New York Mellon (as
depositary) has in Brazil, which permits The Bank of New York (Mellon) to convert dividends and other
distributions with respect to the Ambev shares into foreign currency and remit the proceeds abroad. If you exchange
your Ambev ADSs for Ambev shares, you will be entitled to rely on The Bank of New York Mellon’s foreign
capital registration for only five business days from the date of exchange. After this five-day period, you will not be
able to remit abroad non-Brazilian currency unless you obtain your own foreign capital registration. In addition,
gains with respect to Ambev shares will be subject to less favorable tax treatment unless you obtain your own
certificate of foreign capital registration or you obtain your own registration with the Central Bank pursuant to
Resolution No. 2,689. For a more complete description of Brazilian restrictions on foreign investments and the
foreign investment regulations, see ―Additional Information—Memorandum and Articles of Association—
Restrictions on Foreign Investment‖ and ―Key Information—Exchange Rate Information—Exchange Controls‖. For
a more complete description of Brazilian tax regulations, see ―Additional Information—Taxation—Brazilian Tax
Considerations‖.
Ambev ADSs have fewer and less well-defined shareholders‟ rights as compared to shareholders‟ rights
of similar U.S. companies
Ambev’s corporate affairs are governed by Ambev’s bylaws and Brazilian Corporate Law, which may differ
from the legal principles that would apply to Ambev if the company was incorporated in a jurisdiction in the United
States, such as Delaware or New York, or in other jurisdictions outside of Brazil. In addition, your rights or the
rights of holders of the Ambev shares and ADSs under Brazilian Corporate Law to protect your interests relative to
actions taken by Ambev’s Board of Directors or controlling shareholders may be fewer and less well-defined than
under the laws of those other jurisdictions outside of Brazil.
Although Brazilian law imposes restrictions on insider trading and price manipulation, the Brazilian securities
markets may not be as highly regulated and supervised as the U.S. securities markets or markets in other
jurisdictions. In addition, rules and policies against self-dealing and regarding the preservation of shareholder
interests may be less well-defined and enforced in Brazil than in the United States, potentially causing disadvantages
to holders of the Ambev shares and ADSs. Corporate disclosures may be less complete or informative than what
may be expected of a U.S. public company.
20
Some entitlements are not available to U.S. holders of Ambev shares and ADSs
Due to various Brazilian and United States laws and regulations, United States holders of Ambev shares or
ADSs may not be entitled to all of the rights possessed by Brazilian holders of Ambev shares. For instance, U.S.
holders of Ambev shares may not be able to exercise any preemptive or preferential rights relating to their shares
unless a registration statement under the Securities Act is effective with respect to such rights or an exemption from
the registration requirements thereunder is available.
Holders of preferred shares have limited voting rights
Of our two classes of shares outstanding, only our common shares have full voting rights. Our preferred
shares will be entitled to unlimited voting rights only in certain limited circumstances, such as in the event that we
fail to pay statutory dividends for a period of three consecutive years. As a result, holders of our preferred shares
generally will not be able to influence any corporate decision requiring a shareholder vote, including the declaration
of dividends. See ―Additional information—Voting Rights‖.
Holders of ADSs are not entitled to attend shareholders‟ meetings and may only vote through the
depositary
Under Brazilian law, only shareholders registered as such in our corporate books may attend shareholders’
meetings. All shares underlying the ADSs are registered in the name of the depositary. A holder of ADSs is entitled
to instruct the depositary as to how to vote the common shares represented by ADSs, in accordance with procedures
provided for in the deposit agreement, but a holder of ADSs will not be able to vote the underlying common shares
directly at a shareholders’ meeting or to appoint a proxy to do so.
Future equity issuances may dilute the holdings of current shareholders or ADS holders and could
materially affect the market price of our shares or ADSs
We may in the future decide to offer additional equity to raise capital or for other purposes. Any such
additional offering could reduce the proportionate ownership and voting interests of holders of our shares and ADSs,
as well as our earnings per share or ADS and net asset value per share or ADS, and any offerings by us or our main
shareholders could have an adverse effect on the market price of our shares and ADSs.
As a “foreign private issuer” in the United States, we are exempt from a number of rules under the U.S.
securities laws and are permitted to file less information with the SEC
As a ―foreign private issuer,‖ we are exempt from certain rules under the U.S. Securities Exchange Act of
1934, as amended (the ―Exchange Act‖), that impose certain disclosure obligations and procedural requirements for
proxy solicitations under Section 14 of the Exchange Act. In addition, our officers, directors and principal
shareholders are exempt from the reporting and ―short-swing‖ profit recovery provisions under Section 16 of the
Exchange Act. Moreover, we are not required to file periodic reports and financial statements with the SEC as
frequently or as promptly as U.S. companies whose securities are registered under the Exchange Act. Accordingly,
there may be less publicly available information concerning us than there is for U.S. public companies.
21
ITEM 4. INFORMATION ON THE COMPANY
Ambev’s principal executive offices are located at Rua Dr. Renato Paes de Barros, 1017, 4th floor, CEP
04530-001, São Paulo, SP, Brazil, tel.: (5511) 2122-1415, e-mail: [email protected].
A. History and Development of the Company
Overview
Companhia de Bebidas das Américas—Ambev is the successor of Companhia Cervejaria Brahma (―Brahma‖)
and Companhia Antarctica Paulista Indústria Brasileira de Bebidas e Conexos (―Antarctica‖), two of the oldest
brewers in Brazil. Antarctica was founded in 1885. Brahma was founded in 1888 as Villiger & Cia. The Brahma
brand was registered on September 6, 1888, and in 1904 Villiger & Cia. changed its name to Companhia Cervejaria
Brahma. Ambev, a Brazilian sociedade anônima, was incorporated as Aditus Participações S.A. (―Aditus‖) on
September 14, 1998. Ambev is a publicly held corporation incorporated under the laws of the Federative Republic of
Brazil.
In 1994, Brahma started its international expansion into Latin America, starting beer operations in Argentina,
Paraguay and Venezuela.
In 1997, Brahma acquired the exclusive rights to produce, sell and distribute Pepsi CSD products in
northeastern Brazil and in 1999, obtained the exclusive rights to produce, sell and distribute Pepsi CSD products
throughout Brazil. In October 2000, Ambev entered into a new franchise agreement with PepsiCo which terminated
the Brahma franchise agreement and granted us exclusive bottler and distributor rights for Pepsi CSD products in
Brazil. In January 2002, we expanded our partnership with PepsiCo to include the production, sale and distribution
of Gatorade. Our PepsiCo franchise agreement for Brazil expires in 2017, automatically extended for additional ten-
year terms. In addition, certain of our subsidiaries have franchise agreements for Pepsi products in Argentina,
Bolivia, Uruguay, Peru and the Dominican Republic.
In January 2003, Ambev completed a two-step business combination with Quinsa, through which Ambev
acquired an initial 40.5% economic interest and joint control of Quinsa along with Beverages Associates (BAC)
Corp. (―BAC‖), the former controlling shareholder of Quinsa, establishing a leading presence in the beer markets of
Argentina, Bolivia, Paraguay and Uruguay, while agreeing on the terms for Ambev to acquire full control of Quinsa
from BAC in the future. In April 2006, Ambev acquired BAC’s shares in Quinsa, increasing its equity interest to
approximately 91% of its total share capital and started to fully consolidate Quinsa upon the closing of the
transaction in August 2006.
During 2003 and the first quarter of 2004, Ambev expanded its presence in the north of Latin America
through a series of acquisitions by which it established a foothold in several beverage markets, such as Central
America, Peru, Ecuador and the Dominican Republic.
In August 2004, Ambev and Interbrew (as it was then denominated), a Belgian brewer, completed a business
combination that involved the merger of an indirect holding company of Labatt, one of the leading brewers in
Canada, into Ambev. At the same time, controlling shareholders of Ambev completed the contribution of all shares
of an indirect holding company which owned a controlling stake in Ambev to Interbrew in exchange for newly
issued shares of Interbrew. After this transaction, Interbrew changed its company name to InBev (and, since 2008, to
A-B InBev) and became the majority shareholder of Ambev through subsidiaries and holding companies.
The Brahma-Antarctica Combination—Creation of Ambev and Brazilian Antitrust Approval
Creation of Ambev
Brahma was a company controlled by Messrs. Jorge Paulo Lemann, Marcel Herrmann Telles and Carlos
Alberto da Veiga Sicupira through certain holding companies (the ―Braco Group‖), who collectively held a 55.1%
22
voting stake in Brahma prior to the Brahma-Antarctica transaction. The remaining shares of Brahma were publicly
held.
Antarctica was controlled by Fundação Zerrenner, which held an 88.1% voting interest in Antarctica before
the Brahma-Antarctica transaction took place. The remaining shares of Antarctica were publicly held.
The creation of Ambev consisted of the combination of Brahma and Antarctica and was carried out over the
course of 1999 and 2000. The combination first resulted in Ambev becoming the owner of 55.1% of Brahma’s
voting shares and 88.1% of Antarctica’s voting shares, while the Braco Group and Fundação Zerrenner each owned,
respectively, 76% and 24% of Ambev’s voting shares. Subsequently both Antarctica’s (September 1999) and
Brahma’s (September 2000) minority shareholders exchanged their shares in Antarctica and Brahma for Ambev
shares, causing both companies to become wholly-owned subsidiaries of Ambev.
Brazilian Antitrust Approval – Creation of Ambev
The transfer of control of Brahma and Antarctica to Ambev through the controlling shareholders’ contribution
resulted in a market share for Ambev as of that date in excess of 70% of the Brazilian beer market and 20% of the
Brazilian CSDs market. Brazilian antitrust authorities therefore reviewed the transaction to determine whether it
would negatively impact competitive conditions in the relevant markets, or whether it would negatively affect
consumers.
The Conselho Administrativo de Defesa Econômica (―CADE‖), an independent agency of the Brazilian
Ministry of Justice, is the principal Brazilian antitrust authority. In April 2000, CADE approved the controlling
shareholders’ contribution subject to certain restrictions set forth in a performance agreement that Ambev entered
into with CADE. CADE imposed no restrictions in connection with CSDs or other beverages produced by Ambev.
On July 28, 2008, CADE decided that all obligations under the agreement had been considered fulfilled.
Acquisition of Quinsa and Argentinean Antitrust approval
In January 2003, Ambev consummated the acquisition of an interest in Quinsa, an indirect holding company
of Cervecería y Maltería Quilmes S.A.I.C.A. y G., the largest Argentine brewer, and in Quilmes International
(Bermuda) Ltd. (―QIB‖), Quinsa’s subsidiary which is the holding company for all Quinsa’s operating subsidiaries.
Quinsa then owned an 85% interest in QIB. This transaction involved an initial acquisition of 37.5% of the total
capital of Quinsa and 8.6% of the shares of QIB, resulting in a total ownership of 40.5% of Quinsa’s economic
interest. During 2003, we acquired additional Quinsa Class B shares in the open market, increasing our total
economic interest in Quinsa to 49.7% as of December 31, 2003. During 2004 and 2005, Quinsa conducted certain
share repurchases pursuant to its share buyback program, increasing our total economic interest in Quinsa to
approximately 59.2% as of December 31, 2005.
The acquisition of Ambev’s interest in Quinsa was approved with certain restrictions by the Comisión
Nacional de Defensa de la Competencia (―CNDC‖), the Argentine antitrust authority, related to the divestiture of
certain brands and industrial assets. The sale of the brands and the plant was concluded in December 2006.
Furthermore, in January 2007, the Llavallol malting plant was leased to Tai Pai Malting for a period of 10 years. The
CNDC formally approved the fulfillment of the conditions set forth above in December 2006.
In April 2006, Ambev agreed to acquire BAC’s remaining shares in Quinsa. Upon the closing of the
transaction, which took place on August 8, 2006, Ambev’s equity interest in Quinsa increased to approximately 91%
of its total share capital.
On December 28, 2007, Ambev launched a voluntary offer to purchase the outstanding shares that were not
owned by Ambev or its subsidiaries and on February 12, 2008, when the voluntary offer to purchase expired,
Ambev’s voting interest in Quinsa increased to 99.56% and its economic interest increased to 99.26%. During 2008,
Ambev, through its subsidiary Dunvegan S.A., continued to purchase Class A and Class B shares from Quinsa’s
23
minority shareholders, increasing its voting interest in Quinsa to approximately 99.83% and its economic interest to
approximately 99.81%.
Expansion into the North of Latin America
Starting in late 2002, we extended our presence in Latin America through a series of transactions in the north
of the region.
In October 2002, Ambev and The Central America Bottling Corporation (―CabCorp‖), PepsiCo’s anchor
bottler in Central America, agreed to establish a 50/50 joint venture company – Ambev Centroamerica – to
collaborate in, among other things, the production, importation, distribution, marketing and sale of Ambev’s
products, especially beer, in Guatemala and other Central American countries.
In October 2003, we agreed to purchase, through our Peruvian subsidiary Ambev Perú, certain production and
distribution assets from Embotelladora Rivera, including two CSDs bottling plants. Among the assets acquired were
the franchise for Pepsi products in Lima and northern Peru. In October 2009, the Company through its subsidiary
Monthiers S.A., increased its equity in Ambev Perú from 85.62% to 100%.
In December 2003, we acquired an 80% interest in Cervecería Suramericana, and renamed it Compañía
Cervecera Ambev Ecuador S.A. (―Ambev Ecuador‖). In 2007 we acquired the remaining 20%.
In February 2004, Ambev acquired a 66% stake in Embotelladora Dominicana, C. por A. (currently Ambev
Dominicana), the Pepsi bottler in the Dominican Republic. Ambev then started a beer business in 2005 after the
construction of a brewery. In August 2009, the Company, through its subsidiary Monthiers SA, increased its equity
interest in Ambev Dominicana to 100%.
In March 2009, Quinsa acquired from SAB Miller plc, 100% of the share capital of Bebidas y Aguas
Gaseosas Occidente S.R.L., becoming the exclusive bottler of Pepsi in Bolivia.
The InBev-Ambev Transactions
The ―InBev-Ambev transactions‖ consisted of two transactions negotiated simultaneously: (i) in the first
transaction, the Braco Group exchanged its Ambev shares for shares in Interbrew S.A./N.V. (―Interbrew‖); and
(ii) in the second transaction, Ambev issued shares to Interbrew in exchange for Interbrew’s 100% stake in Labatt.
Exchange of Shares between Braco Group and Interbrew Founding Families
In March 2004, various entities controlled by the Braco Group entered into an agreement (the ―Contribution
and Subscription Agreement‖) with Interbrew and various entities representing the interests of the Interbrew
Founding Families to exchange their controlling interest in Ambev for newly issued voting shares of Interbrew,
which represented 24.7% of Interbrew’s voting shares.
Upon closing of this transaction in August 2004, (i) the Braco Group received approximately 44% of the
voting interest in the Stichting, which thereupon owned approximately 56% of Interbrew’s common shares, and
(ii) Interbrew received approximately a 53% voting interest and a 22% economic interest in Ambev. Such voting
interest was subject to the pre-existing Ambev Shareholders’ Agreement, as amended in connection with the InBev-
Ambev transactions. In addition, Interbrew was renamed InBev.
Acquisition of Labatt
Pursuant to the Incorporação Agreement, Labatt Brewing Canada Holding Ltd. (―Mergeco‖) was merged into
Ambev by means of an incorporação under Brazilian law. Mergeco held 99.9% of the capital stock of Labatt
Holding ApS (―Labatt ApS‖), a corporation organized under the laws of Denmark, and Labatt ApS owned all the
capital stock of Labatt. Upon completion of the incorporação, Ambev held 99.9% of the capital stock of Labatt
24
ApS, and, indirectly, of Labatt. As consideration for the acquisition of Labatt, Ambev issued Ambev common and
preferred shares to Interbrew.
With the consummation of this transaction in August 2004, (i) Labatt became a wholly-owned subsidiary of
Ambev, and (ii) Interbrew increased its stake in Ambev to approximately 68% of common shares and 34% of
preferred shares.
Ownership structure of InBev and Ambev upon consummation of the InBev-Ambev transactions
InBev
Upon closing the InBev-Ambev transactions, 56% of InBev’s voting shares were owned by the Stichting, 1%
was owned by the InBev Foundations, 17% were owned directly by entities and individuals associated with the
Interbrew Founding Families and the remaining 26% constituted the public float.
The Braco Group became the holder of 44% of the Stichting’s voting interests, while the Interbrew Founding
Families held the remaining 56% of the Stichting’s voting interests. In addition, the Braco Group and entities
representing the interests of the Interbrew Founding Families entered into a shareholders’ agreement (the ―InBev
Shareholders’ Agreement‖) providing for, among other things, joint and equal influence over the exercise of the
Stichting voting rights in InBev.
Ambev
Upon closing the InBev-Ambev transactions, InBev became the owner of approximately 68% of Ambev’s
voting shares, Fundação Zerrenner retained approximately 16% of such shares, and the remaining shares were held
by the public.
Mandatory Tender Offer
Pursuant to Brazilian Corporate Law, the entity then denominated InBev was required to conduct, following
the consummation of the InBev-Ambev transactions, a mandatory tender offer (the ―MTO‖) for all remaining
outstanding common shares of Ambev. The MTO was completed in March 2005, and InBev (as it was then
denominated) increased its stake in Ambev to approximately an 81% voting interest and a 56% economic interest.
Fundação Zerrenner did not tender its Ambev shares in the MTO.
Lakeport Acquisition
On February 1, 2007, Ambev announced that its subsidiary Labatt entered into a Support Agreement with
Lakeport Brewing Income Fund (―Lakeport‖). The transaction was concluded on March 29, 2007, when the holders
of trust units tendered their units and all of the conditions of the offer were satisfied. Subsequent to the compulsory
acquisition of the non-tendered units, Lakeport became wholly-owned by Labatt and has been fully integrated into
Labatt’s business. The Competition Bureau concluded in January 2009 that there was insufficient evidence to
establish that the transaction was likely to substantially lessen or prevent competition.
Cintra Acquisition
On April 17, 2007, Ambev closed the acquisition of 100% of Goldensand – Comércio e Serviços Lda.
(―Goldensand‖), the controlling shareholder of Cervejarias Cintra Indústria e Comércio Ltda. (―Cintra‖), a local
brewer with presence in the Southeast of Brazil. We subsequently acquired 100% of the capital stock of Obrinvest—
Obras e Investimentos, S.A. which owned the Cintra brands. On May 21, 2008, Ambev sold to Schincariol
Participações e Representações S.A. (―Schincariol‖) the Cintra brands and distribution assets. Following the sale of
the brands, the corporate name of Cintra was changed to Londrina Bebidas Ltda. (―Londrina‖), on June 20, 2008. In
July 2008, CADE issued its unrestricted approval of the Cintra acquisition and on April 28, 2009, in order to
simplify Ambev’s corporate structure, our subsidiary Goldensand was merged into Ambev. There were no changes
to Ambev’s capital stock.
25
Acquisition of Bebidas y Aguas Gaseosas Occidente S.R.L.
On March, 2009, the subsidiary Quilmes Industrial Société Anonyme (―Quinsa‖) acquired from SAB Miller
plc 100% of the share capital of Bebidas y Aguas Gaseosas Occidente S.R.L., the exclusive bottler of Pepsi in
Bolivia.
Business combination with Cervecería Regional
We operated in Venezuela until September 2010. In October 2010, we effected a business combination
between Ambev and Cervecería Regional aimed at creating a stronger and more dynamic player in South America’s
second largest beer market. Cervecería Regional’s controlling shareholders now own an 85% interest in the
combined venture and Ambev owns the remaining 15%. As a result, we no longer consolidate our interest in the
operational results of the Venezuelan investment.
The combined venture is the second largest brewer in the Venezuelan market after Cervecería Polar.
B. Business Overview
Description of the Company
We are the largest brewer in Latin America in terms of sales volumes and the fourth largest beer producer in
the world, according to our estimates. We produce, distribute and sell beer, CSDs and other non-alcoholic and non-
carbonated products in 14 countries across the Americas. We are PepsiCo’s largest bottler in the world.
We conduct our operations through three business units:
▪Latin America North, which includes (i) our operations in Brazil, where we operate two divisions:
(i) beer sales (―Beer Brazil‖) and (ii) carbonated soft drinks and non-alcoholic non-carbonated sales
(―CSD & NANC Brazil‖); and (ii) our Hispanic Latin America Operations, Excluding Latin America
South (―HILA-Ex‖), which includes our operations in the Dominican Republic, Venezuela, Ecuador,
Guatemala (which also serves El Salvador and Nicaragua) and Peru.
▪Latin America South, which includes our operations in Argentina, Bolivia, Paraguay, Uruguay and Chile.
▪Canada, represented by Labatt’s operations, which includes domestic sales in Canada.
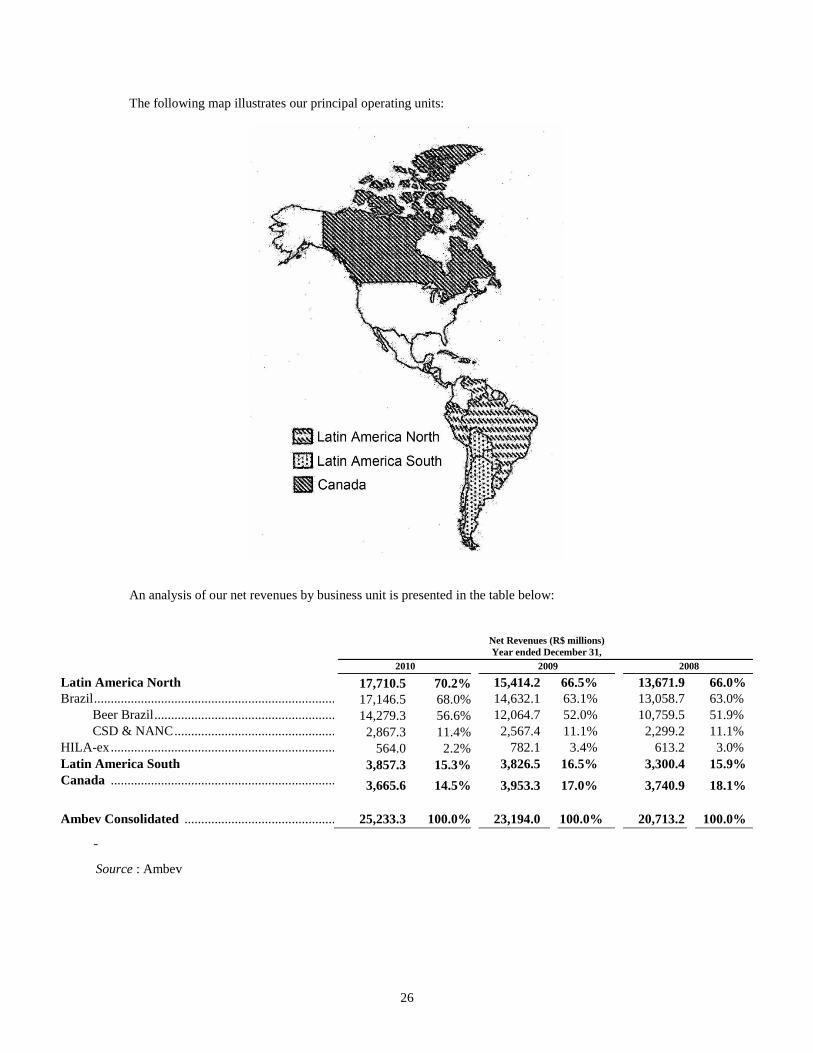
26
The following map illustrates our principal operating units:
An analysis of our net revenues by business unit is presented in the table below:
Net Revenues (R$ millions)
Year ended December 31,
2010 2009 2008
Latin America North 17,710.5 70.2% 15,414.2 66.5% 13,671.9 66.0% Brazil .............................................................................................................................................. 17,146.5 68.0% 14,632.1 63.1% 13,058.7 63.0%
Beer Brazil ............................................................................................................................ 14,279.3 56.6% 12,064.7 52.0% 10,759.5 51.9% CSD & NANC ...................................................................................................................... 2,867.3 11.4% 2,567.4 11.1% 2,299.2 11.1%
HILA-ex ......................................................................................................................................... 564.0 2.2% 782.1 3.4% 613.2 3.0% Latin America South 3,857.3 15.3% 3,826.5 16.5% 3,300.4 15.9% Canada ......................................................................................................................................... 3,665.6 14.5% 3,953.3 17.0% 3,740.9 18.1%
Ambev Consolidated ................................................................................................................... 25,233.3 100.0% 23,194.0 100.0% 20,713.2 100.0%
Source : Ambev
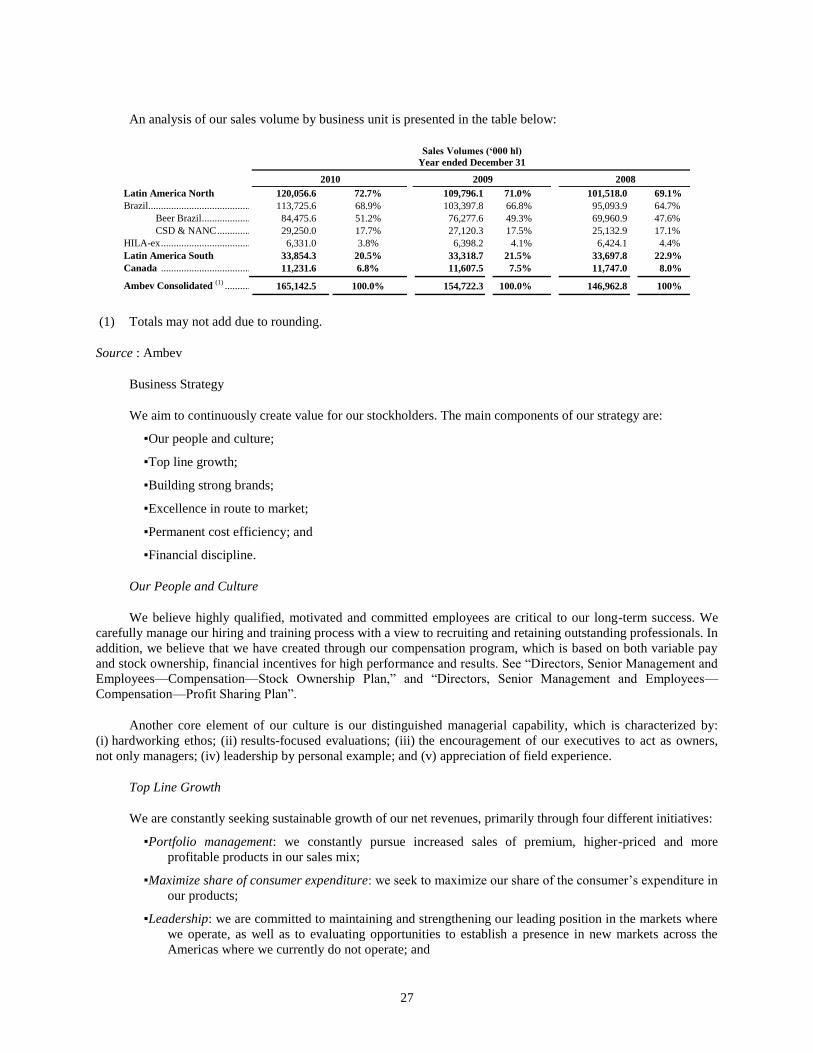
27
An analysis of our sales volume by business unit is presented in the table below:
Sales Volumes („000 hl)
Year ended December 31
2010 2009 2008
Latin America North 120,056.6 72.7% 109,796.1 71.0% 101,518.0 69.1%
Brazil................................................................................................................................................... 113,725.6 68.9% 103,397.8 66.8% 95,093.9 64.7%
Beer Brazil .............................................................................................................................. 84,475.6 51.2% 76,277.6 49.3% 69,960.9 47.6%
CSD & NANC ........................................................................................................................ 29,250.0 17.7% 27,120.3 17.5% 25,132.9 17.1%
HILA-ex .............................................................................................................................................. 6,331.0 3.8% 6,398.2 4.1% 6,424.1 4.4%
Latin America South 33,854.3 20.5% 33,318.7 21.5% 33,697.8 22.9%
Canada .............................................................................................................................................. 11,231.6 6.8% 11,607.5 7.5% 11,747.0 8.0% Ambev Consolidated
(1) ..................................................................................................................... 165,142.5 100.0% 154,722.3 100.0% 146,962.8 100%
(1) Totals may not add due to rounding.
Source : Ambev
Business Strategy
We aim to continuously create value for our stockholders. The main components of our strategy are:
▪Our people and culture;
▪Top line growth;
▪Building strong brands;
▪Excellence in route to market;
▪Permanent cost efficiency; and
▪Financial discipline.
Our People and Culture
We believe highly qualified, motivated and committed employees are critical to our long-term success. We
carefully manage our hiring and training process with a view to recruiting and retaining outstanding professionals. In
addition, we believe that we have created through our compensation program, which is based on both variable pay
and stock ownership, financial incentives for high performance and results. See ―Directors, Senior Management and
Employees—Compensation—Stock Ownership Plan,‖ and ―Directors, Senior Management and Employees—
Compensation—Profit Sharing Plan‖.
Another core element of our culture is our distinguished managerial capability, which is characterized by:
(i) hardworking ethos; (ii) results-focused evaluations; (iii) the encouragement of our executives to act as owners,
not only managers; (iv) leadership by personal example; and (v) appreciation of field experience.
Top Line Growth
We are constantly seeking sustainable growth of our net revenues, primarily through four different initiatives:
▪Portfolio management: we constantly pursue increased sales of premium, higher-priced and more
profitable products in our sales mix;
▪Maximize share of consumer expenditure: we seek to maximize our share of the consumer’s expenditure in
our products;
▪Leadership: we are committed to maintaining and strengthening our leading position in the markets where
we operate, as well as to evaluating opportunities to establish a presence in new markets across the
Americas where we currently do not operate; and
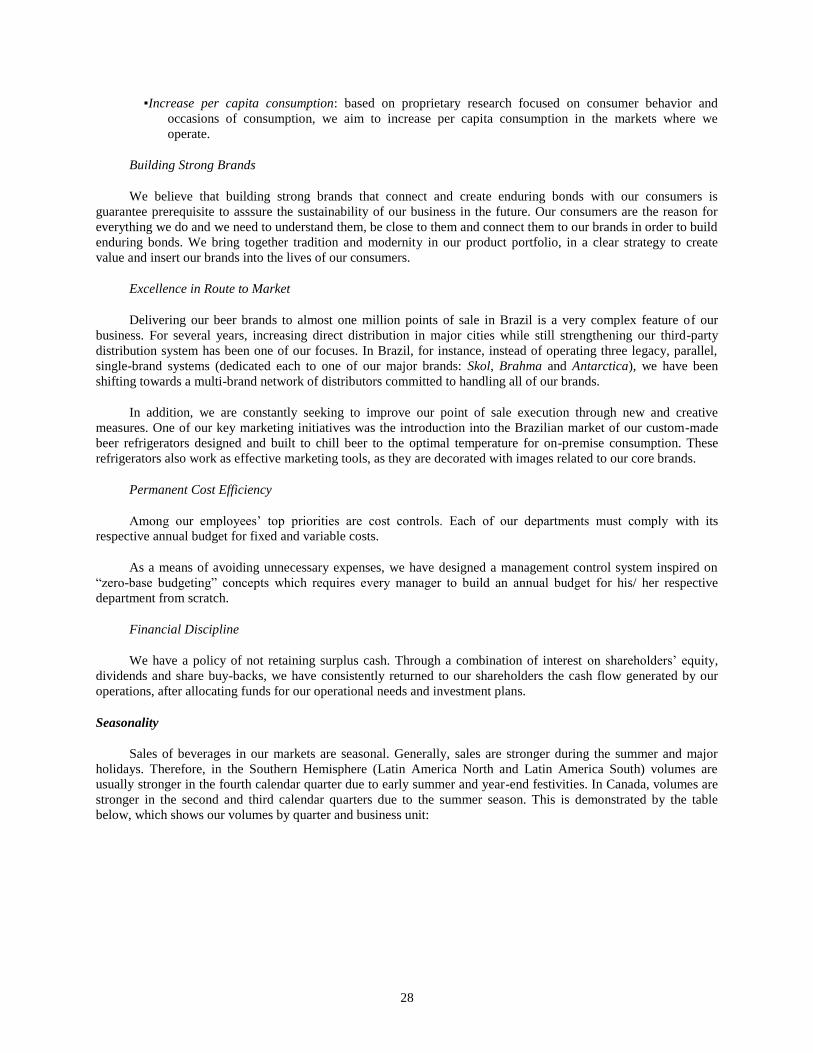
28
▪Increase per capita consumption: based on proprietary research focused on consumer behavior and
occasions of consumption, we aim to increase per capita consumption in the markets where we
operate.
Building Strong Brands
We believe that building strong brands that connect and create enduring bonds with our consumers is
guarantee prerequisite to asssure the sustainability of our business in the future. Our consumers are the reason for
everything we do and we need to understand them, be close to them and connect them to our brands in order to build
enduring bonds. We bring together tradition and modernity in our product portfolio, in a clear strategy to create
value and insert our brands into the lives of our consumers.
Excellence in Route to Market
Delivering our beer brands to almost one million points of sale in Brazil is a very complex feature of our
business. For several years, increasing direct distribution in major cities while still strengthening our third-party
distribution system has been one of our focuses. In Brazil, for instance, instead of operating three legacy, parallel,
single-brand systems (dedicated each to one of our major brands: Skol, Brahma and Antarctica), we have been
shifting towards a multi-brand network of distributors committed to handling all of our brands.
In addition, we are constantly seeking to improve our point of sale execution through new and creative
measures. One of our key marketing initiatives was the introduction into the Brazilian market of our custom-made
beer refrigerators designed and built to chill beer to the optimal temperature for on-premise consumption. These
refrigerators also work as effective marketing tools, as they are decorated with images related to our core brands.
Permanent Cost Efficiency
Among our employees’ top priorities are cost controls. Each of our departments must comply with its
respective annual budget for fixed and variable costs.
As a means of avoiding unnecessary expenses, we have designed a management control system inspired on
―zero-base budgeting‖ concepts which requires every manager to build an annual budget for his/ her respective
department from scratch.
Financial Discipline
We have a policy of not retaining surplus cash. Through a combination of interest on shareholders’ equity,
dividends and share buy-backs, we have consistently returned to our shareholders the cash flow generated by our
operations, after allocating funds for our operational needs and investment plans.
Seasonality
Sales of beverages in our markets are seasonal. Generally, sales are stronger during the summer and major
holidays. Therefore, in the Southern Hemisphere (Latin America North and Latin America South) volumes are
usually stronger in the fourth calendar quarter due to early summer and year-end festivities. In Canada, volumes are
stronger in the second and third calendar quarters due to the summer season. This is demonstrated by the table
below, which shows our volumes by quarter and business unit:
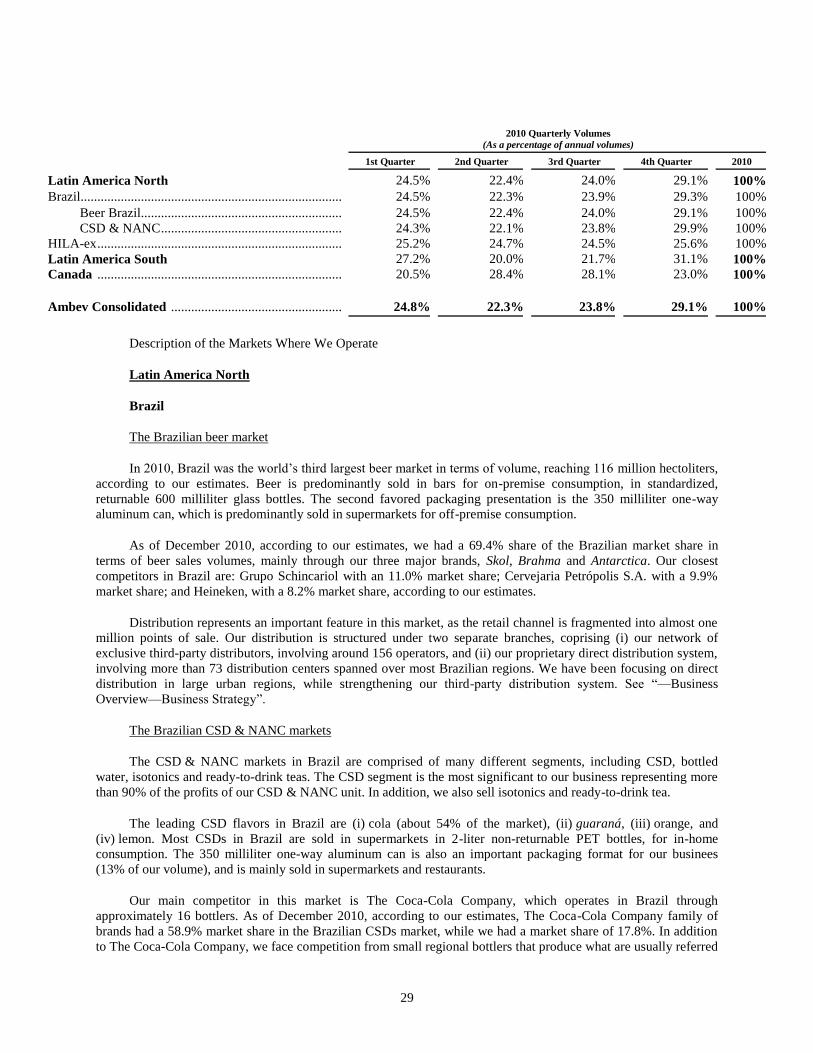
29
2010 Quarterly Volumes
(As a percentage of annual volumes)
1st Quarter
2nd Quarter
3rd Quarter
4th Quarter
2010
Latin America North 24.5% 22.4% 24.0% 29.1% 100% Brazil................................................................................................................ 24.5% 22.3% 23.9% 29.3% 100%
Beer Brazil.............................................................................................. 24.5% 22.4% 24.0% 29.1% 100%
CSD & NANC ........................................................................................ 24.3% 22.1% 23.8% 29.9% 100%
HILA-ex ........................................................................................................... 25.2% 24.7% 24.5% 25.6% 100%
Latin America South 27.2% 20.0% 21.7% 31.1% 100%
Canada ........................................................................................................... 20.5% 28.4% 28.1% 23.0% 100%
Ambev Consolidated ..................................................................................... 24.8% 22.3% 23.8% 29.1% 100%
Description of the Markets Where We Operate
Latin America North
Brazil
The Brazilian beer market
In 2010, Brazil was the world’s third largest beer market in terms of volume, reaching 116 million hectoliters,
according to our estimates. Beer is predominantly sold in bars for on-premise consumption, in standardized,
returnable 600 milliliter glass bottles. The second favored packaging presentation is the 350 milliliter one-way
aluminum can, which is predominantly sold in supermarkets for off-premise consumption.
As of December 2010, according to our estimates, we had a 69.4% share of the Brazilian market share in
terms of beer sales volumes, mainly through our three major brands, Skol, Brahma and Antarctica. Our closest
competitors in Brazil are: Grupo Schincariol with an 11.0% market share; Cervejaria Petrópolis S.A. with a 9.9%
market share; and Heineken, with a 8.2% market share, according to our estimates.
Distribution represents an important feature in this market, as the retail channel is fragmented into almost one
million points of sale. Our distribution is structured under two separate branches, coprising (i) our network of
exclusive third-party distributors, involving around 156 operators, and (ii) our proprietary direct distribution system,
involving more than 73 distribution centers spanned over most Brazilian regions. We have been focusing on direct
distribution in large urban regions, while strengthening our third-party distribution system. See ―—Business
Overview—Business Strategy‖.
The Brazilian CSD & NANC markets
The CSD & NANC markets in Brazil are comprised of many different segments, including CSD, bottled
water, isotonics and ready-to-drink teas. The CSD segment is the most significant to our business representing more
than 90% of the profits of our CSD & NANC unit. In addition, we also sell isotonics and ready-to-drink tea.
The leading CSD flavors in Brazil are (i) cola (about 54% of the market), (ii) guaraná, (iii) orange, and
(iv) lemon. Most CSDs in Brazil are sold in supermarkets in 2-liter non-returnable PET bottles, for in-home
consumption. The 350 milliliter one-way aluminum can is also an important packaging format for our businees
(13% of our volume), and is mainly sold in supermarkets and restaurants.
Our main competitor in this market is The Coca-Cola Company, which operates in Brazil through
approximately 16 bottlers. As of December 2010, according to our estimates, The Coca-Cola Company family of
brands had a 58.9% market share in the Brazilian CSDs market, while we had a market share of 17.8%. In addition
to The Coca-Cola Company, we face competition from small regional bottlers that produce what are usually referred
30
to as ―B Brands‖. The B Brands compete mainly on price, usually being sold at a significantly lower price than our
products.
Our main CSD brands are Guaraná Antarctica, the leader in the ―non-cola‖ flavor segment, and Pepsi Cola,
which is sold under the exclusive production and bottling agreements with PepsiCo. Our CSD portfolio also includes
such brands as Gatorade in the isotonics market, H2OH! in the flavored water market, and Lipton Ice Tea in the
ready-to-drink tea market, which are also sold under license from PepsiCo.
Our CSD & NANC products are sold through the same distribution system used for beer.
Hila-Ex
Central America (including Guatemala, El Salvador and Nicaragua)
The Central American Beer Market
In El Salvador, the main packaging presentation is the returnable one liter glass bottle. Our main competitor in
El Salvador is a local subsidiary of SAB Miller, the market leader,.
In Guatemala, the main packaging presentations are the returnable, 12 oz. and one liter glass bottles. Our main
competitor in Guatemala is Cerveceria Centro Americana, the market leader. Cerveceria Centro Americana is a
private company held by local investors.
In Nicaragua, the main packaging presentation is the returnable, one liter glass bottle. Our main competitor in
Nicaragua is the market leader, which is a joint venture between Guatemala’s Cerveceria Centro Americana and
Florida Ice & Farm Co, an investor group from Costa Rica. .
In all three of these markets, beer is predominantly sold in returnable bottles through small retailers. We sell
our Brahva, Brahva Beats and Extra brands, which are distributed through CabCorp’s distribution system, jointly
with CabCorp’s CSDs portfolio. According to our estimates, the beer market annual sales volume in such markets
was 2.7 million hectoliters in 2010.
The Dominican Republic
The Dominican Beer Market
According to our estimates, the annual sales volume of the Dominican beer market was 3.9 million hectoliters
in 2010. The main packaging presentation is the returnable, 650 milliliter glass bottle, which is predominantly sold
in small retail stores. Currently, the market leader is Cerveceria Nacional Dominicana, which is owned by local
investors and competes with our Brahma, Brahma Light, Brahma Ice, Quilmes, Stella Artois and, Budweiser brands.
We sell beer in the Dominican Republic through the same distribution system used in the CSD business.
The Dominican CSD Market
According to our estimates, the annual sales volume of the Dominican CSD market was 3.8 million hectoliters
in 2010. The main packaging presentation is the returnable, half-liter bottle (glass/PET), which is predominantly
sold in small retail stores. We share the leadership with The Coca-Cola Company, represented by its local bottler;
the third player is Ajegroup which adopts a low price strategy.
Our main brands are Red Rock, Pepsi-Cola and Seven UP (all of which are marketed under an exclusive
bottling agreement with PepsiCo). Our distribution system in the Dominican Republic is comprised of direct
distribution operations and third-party distributors.
31
Ecuador
The Ecuadorian Beer Market
According to our estimates, the annual sales volume of the Ecuadorian beer market was 3.1 million hectoliters
in 2010. The main packaging presentation is the returnable, 578-milliliter glass bottle, predominantly sold in small
retail stores. The market leader is SABMiller.
Our main brands in Ecuador are Brahma and Zenda, and our distribution system in Ecuador is comprised of
direct distribution operations in Guayaquil and third-party distributors around the country.
Peru
The Peruvian Beer Market
According to our estimates, the annual sales volume of the Peruvian beer market was 12.7 million hectoliters
in 2010. The main packaging presentation is the returnable, 630-milliliter glass bottle, which is predominantly sold
in small retail stores. The market leader is SABMiller though we also face competition from local group, Ajegroup.
The main brands that we sell in Peru are Brahma and Zenda and the distribution system used for our beer
business is also used for our CSD sales, and is comprised of direct distribution operations and third-party
distributors.
The Peruvian CSD Market
The main packaging presentation is the 3-liter one-way PET bottle and 0.5-liter one-way PET bottle, which
are predominantly sold in small retail stores. The market leader is The Coca-Cola Company, represented by its local
network of bottlers. We also face competition from Ajegroup and other regional brands, which compete mainly on
price, usually being sold significantly below than the market average.
The main brands that we sell in Peru are Pepsi-Cola, Seven UP, Concordia and Triple Kola, all sold under an
exclusive bottling agreement with PepsiCo.
The distribution system in Peru is comprised of direct distribution operations and third-party distributors.
Latin America South
Argentina
Argentina is one of our most important regions, second only to Brazil in terms of volume while being the third
largest market in terms of operating income (excluding depreciation and amortization), after Brazil and Canada.
We serve more than 350,000 points of sale throughout Argentina both directly and through our exclusive third
party distributors.
The Argentine beer market
According to our estimates, the annual sales volume of the Argentine beer market was 17.2 million hectoliters
in 2010. With a population of approximately 40 million, Argentina is Latin America South’s largest and most
important beer market.
Beer consumption in Argentina has grown in recent years reaching a per capita consumption of 44.0 liters in
2010, similar to the 44.0 liters registered in 2009. In recent years, beer has gained share versus wine and became the
number one alcoholic beverage in Argentina from 2000, according to our estimates.
32
Approximately 28.2% of our beer volumes is distributed directly by us and 71.8% is distributed through
exclusive third-party distributors. Our main package presentation in Argentina is the one liter returnable glass
bottles, which accounts for approximately 92.2% of our sales.
According to our estimates, on-premise consumption represented approximately 15.0% of beer volumes in
2010, and supermarkets sales representing approximately 10.8% of beer volumes. The main channels of volume
consumption in Argentina are through kiosks and small grocery stores.
Our most important brands in Argentina are Quilmes Cristal, Brahma and Andes. We are the leading beer
producers in Argentina with approximately 76.0% market share, according to our estimates. Our main competitor in
Argentina is CCU which held an approximate 20.3% market share in 2010 according to our estimates.
The Argentine CSD market
According to our estimates, in 2010, annual sales volume of the the Argentine CSD market was 44.4 million
hectoliters. Per capita consumption declined from 119.1 in 2009 to 110.7 in 2010, while 2008 reflected a total
consumption of 130.9 liters. Approximately 41.9% of our CSD volume is distributed directly by us and 58.1% is
distributed through exclusive third-party distributors. Approximately 87.9% of our sales are through non-returnable
bottles.
We are the exclusive Pepsi bottlers in Argentina and our most important brand is Pepsi. We are second to The Coca
Cola Company with around 22% market share, according to our estimates.
Bolivia
The Bolivian Beer market
According to our estimates, the annual sales volume of the Bolivian beer market was 3.7 million hectoliters in
2010. The Bolivian market is strongly influenced by macroeconomic trends and governmental, regulatory and fiscal
policies.
Approximately 2% of our beer volumes is directly distributed by us and 98% is distributed through exclusive
third-party distributors. Our main package presentation in Bolivia is the 620ml returnable glass bottles, which
accounts for approximately 80.3% of our sales.
Our most important brands in Bolivia are Paceña, Taquiña and Huari.
The Bolivian CSD market
In March 2009, Latin America South, through Quinsa, acquired from SAB Miller plc, 100% of Bebidas y
Aguas Gaseosas Occidente S.R.L., becoming the exclusive bottler of Pepsi in Bolivia.
According to our estimates, in 2010, the annual sales volume of the Bolivian CSD market was 44.4 million
hectoliters. Per capita consumption increased slightly from 45.1 liters in 2009 to 46.2 liters in 2010, while 2008
reflected a total of consumption of 44 liters per capita. Approximately 69% of our CSD volume is directly
distributed by us and 31% is distributed through exclusive third-party distributors 94.6% of our sales are through
non-returnable bottles.
Chile
According to our estimates, the annual sales volume of the Chilean beer market was 6.3 million hectoliters in
2010.
Quinsa originally entered the Chilean market with the expectation that it would be participating in a growing
market but this growth did not occur as expected, and from 1998 until 2002, consumption decreased on a per capita
33
basis. However, consumption has increased every year since 2002. Since the Chilean brewer CCU entered the
Argentine market, our presence in Chile has taken on a strategic significance, since we are both competing in each
other’s principal market.
Our most important brands in Chile are Brahma, Becker and Báltica.
Paraguay
According to our estimates, the annual sales volume of the Paraguayan beer market was 2.4 million hectoliters
in 2010.
The market for beer in Paraguay has traditionally distinguished itself from those in the southern cone
countries in certain respects because (i) beer has not faced significant competition from wine as an alternative
alcoholic beverage (ii) the domestic beer market has faced significant competition from imported beer, which
accounted for a far higher market share in Paraguay than in neighboring countries, and (iii) the seasonality of our
products is lower due to warmer conditions throughout the year.
Approximately 51% of our beer volumes is directly distributed by us and 49% is distributed through exclusive
third-party distributors. Our main package presentation in Paraguay is the returnable glass bottles, which accounts
for approximately 70% of our sales.
Our most important brands in Paraguay are Brahma and Pilsen. From March 2009 we also became the
exclusive distributors of the Budweiser brand in Paraguay.
Uruguay
The Uruguayan beer market
According to our estimates, the annual sales volume of the Uruguayan beer market was 0.9 million hectoliters
in 2010. Latin America South manages both beer and CSD businesses out of the facility in Uruguay.
Due to a crisis in Uruguay’s economy in 2003 beer market volumes in Uruguay declined by 10% to
0.5 million. Since then, improvements in the economy have resulted in a significant increase in market volumes
through 2010.
Approximately 26% of our beer volumes is directly distributed by us and 74% is distributed through exclusive
third-party distributors. Our main package presentation in Uruguay is the returnable glass bottles, which accounts for
approximately 90% of our sales.
Our most important brands in Uruguay are Pilsen and Patricia.
The Uruguayan CSD market
According to our estimates, in 2010, the annual sales volume of the Uruguayan CSD market was 3.8 million
hectoliters. The market growth in 2010 was a result of a recovery in the economy and also of higher market
investments coming from the A-brands. Per capita consumption reached 113 liters in 2010 according to our
estimates.
We serve more than 32,000 points of sale in all Uruguay, including 7,200 in Montevideo. Approximately 46%
of our CSD volume is directly distributed and 54% is distributed through exclusive third-party distributors. 74% of
our sales are through non-returnable bottles. Our most important brand in Uruguay is Pepsi, with The Coca-Cola
Company being our main competitor.
34
Canada - Labatt
Our Canada business unit is represented by the Labatt operations, which sells domestic and A-B InBev beer
brands, as well as Brahma in Canada and exports Canadian brands to the United States.
According to our estimates, the annual sales volume in the beer market in Canada was 22.5 million hectoliters
in 2010, of which Labatt had a volume share of approximately 41%. The main packaging presentation in that
country is the returnable,341-milliliter glass bottle, which is predominantly sold in privately owned and government
owned retail stores. Our main competitor in Canada is Molson, which has an estimated market share of 41%. We
also compete with smaller local brewers, such as Sleeman Breweries Ltd. (―Sleeman‖) and Moosehead Breweries
Ltd.
Our main brands in Canada are Budweiser and Bud Light (brewed and sold under license from A-B InBev’s
subsidiary Anheuser-Busch, Inc.) (―Anheuser-Busch‖), Labatt Blue, Alexander Keith’s and Kokanee. Our
distribution system is structured in different ways across the country:
Distribution in Ontario
In Ontario, the province with the largest beer consumption in Canada, we own together with Molson and
Sleeman a distribution and retail company named Brewers Retail Inc., a company incorporated in 1927, the retail
component of which carries out business as The Beer Store (―TBS‖). TBS and the Liquor Control Board of Ontario,
a chain of liquor stores owned by the government of the Province of Ontario (―LCBO‖), own the exclusive rights to
sell beer for off-premise consumption in Ontario. TBS also has the exclusive rights to supply domestic-produced
beer to the LCBO.
Domestic brewers are entitled to hire the distribution and retail services of TBS, which charges a one-off
listing fee for the registration of each stock keeping unit in its portfolio, plus a fee for service for each case delivered
to the LCBO or sold in its proprietary stores. TBS also serves points of sale in Ontario where beer is consumed on
the premises. Any brewer can sell its products directly to points of sale where beer is consumed on the premises.
TBS has been the primary distribution and sales channel for beer in Ontario for 80 years. TBS operates on a
cost recovery model under which it charges volume-based fees for services it provides to the brewers. TBS receives
no retail margin or profit on its sales of beer inventory. The nature of TBS’s business requires compliance with laws
and regulations and oversight by the Province of Ontario. The Liquor Control Act and the Liquor License Act are
administered by the Minister of Consumer and Business Services, which maintains control of the beverage alcohol
sectors through the Liquor Control Board of Ontario and the Alcohol and Gaming Commission of Ontario.
Control of TBS is governed by a shareholders agreement among Labatt, Molson and Sleeman.
Distribution in Quebec
Quebec is the province in Canada with the second largest beer consumption. In this province there are no
exclusive rights for the sales of beer, and both the on-premise and off-premise sales channels are mostly comprised
of privately owned stores. The SAQ, a government-operated liquor store, sells a select few beer brands that are not
available in the private retail system.
We (as well as our competitors) sell our products in Quebec through a direct sales system.
Distribution in the Western Provinces
Molson and Labatt are each a shareholder in Brewers Distributors Limited (―BDL‖), which operates a
distribution network for beer in the four western provinces of British Columbia, Alberta, Manitoba and
Saskatchewan, The Yukon and the Northwest Territories. In Alberta, some volume is also sold through a third-party
wholesaler. In these Western Provincial markets there are both private (Alberta, British Columbia) and government-
controlled retail stores (British Columbia, Manitoba, Saskatchewan).
35
Distribution in the Atlantic Provinces
We distribute and sell our products in the Atlantic Provinces (including New Brunswick, Newfoundland,
Nova Scotia and Prince Edward Island) through (i) distribution and retail networks controlled by the government in
the provinces of Nova Scotia, New Brunswick and Prince Edward Island; and (ii) private distributors in
Newfoundland.
Exports to the United States
As a result of the U.S. antitrust review of the transaction involving InBev and Anheuser-Busch, in February
2009, InBev’s subsidiary InBev USA, LLC ceased to act as the exclusive importer of Labatt branded beer in the
U.S. for Labatt. At that time, KPS Capital Partners, LP (―KPS‖) received from Labatt the perpetual license to brew
Labatt branded beer in the United States or Canada solely for sale for consumption in the United States and use to
the relevant trademarks and intellectual property to do so. Further, Labatt agreed to continue to brew and supply the
Labatt branded beer for KPS on a provisional basis for no more than three years, after which KPS will be
responsible for production. Separately, in order to ensure that Ambev is adequately compensated, A-B InBev also
agreed to indemnify Ambev in connection with certain events related to the perpetual license. See ―—Related Party
Transactions—Ambev and A-B InBev—Indemnification Agreement‖.
Beer and CSD Production Process
Beer production involves several raw material and production stages. The main ingredient in beer is malt,
which is produced by germinating and roasting barley in a process called ―malting‖. Malt is mixed with water, hops
and adjuncts (corn syrup, grits or rice, for instance) in the proportions necessary to obtain the desired taste. The
resulting mixture is called ―wort‖. Wort is fermented with selected yeasts to produce beer, which is then filtered and
packaged. In addition to these inputs, delivery of the product to consumers requires packaging materials such as
bottles, aluminum or steel cans, labels and crown caps.
CSDs are produced by mixing water, flavored concentrate and sugar or sweetener. Water is processed to
eliminate mineral salts and filtered to eliminate impurities. Purified water is combined with processed sugar or, in
the case of diet CSDs, with artificial sweeteners and concentrate. Carbon dioxide gas is injected into the mixture to
produce carbonation. Immediately following carbonation, the mixture is packaged. In addition to these inputs,
delivery of the product to consumers requires packaging materials such as PET bottles, aluminum or steel cans,
labels and plastic closures.
For information on our production facilities, see ―— Property, Plant and Equipment‖.
Sources and Availability of Raw Materials
Beer
The main raw materials used in our production are malting barley, malt, grits, corn syrup, rice, hops and
water.
Barley and malt
Malt is widely available and our requirements are met by domestic and international suppliers as well as our
own malting facilities. In the case of our beer operations in Brazil, around 80% of our malt needs are supplied by our
own malting facilities located in the south of Brazil, Argentina and Uruguay.
For the rest of our needs, our most significant malt suppliers are Canada Malting, Soufflet, Agromalte and
Avangard. Market prices for malt are volatile, and depend on the quality and the level of production of the barley
crop across the world, as well as on the intensity of demand.
36
We purchase barley for our malting facilities directly from farmers resident in Brazil, Argentina and Uruguay.
Barley prices depend on the quality of the barley crop and on the prices for wheat on the main boards of trade across
the world. We enter into future contracts or financials instruments to avoid the impact of short-term volatility in
barley and malt prices on our production costs. See ―Quantitative and Qualitative Disclosure about Market Risk‖.
Hops
There are two types of hops used in our beer production: hops used to give beer its distinctive bitter flavor,
which we generally import from the United States, and hops used to give beer its distinctive aroma, which we
generally import from Europe. The supply of hops is concentrated into a few international companies, namely the
Barth-Haas Group, Yakima Chief, Inc., Hopsteiner and HVG Hopfenverwertungsgenossenschaft.
Adjuncts
Corn syrup is purchased from corn producers and Cargill. Corn is purchased to produce gritz in-house in some
plants and gritz and rice are purchased in other plants from local suppliers and are generally widely available.
Water
Water represents a small portion of our raw material costs. We obtain our water requirements from several
sources, such as: lakes and reservoirs, deep wells located near our breweries, rivers adjoining our plants and public
utility companies. We monitor the quality, taste and composition of the water we use, and treat it to remove
impurities and to comply with our high quality standards and applicable regulations. As a result of advances in
technology, we have continuously reduced our water consumption per-hectoliter produced. We do not foresee any
shortage in our current water supply.
CSDs
The main raw materials used in our production are: concentrate (including guaraná extract), sugar, sweetener,
water and carbon dioxide gas. Most of these materials are obtained from local suppliers.
Guaraná fruit
We have a 1,070 hectare farm that provides us with 20 tons of guaraná seeds (berries) per year, or about 8%
of our requirements, with the remainder purchased directly from independent farmers in the Amazon region as well
as other guaraná available regions in Brasil.
Concentrates
We have a concentrate facility in the north of Brazil which produces the concentrates to meet our
requirements for the production of our proprietary brand Guaraná Antarctica among others. The concentrate for
Pepsi CSD products is purchased from PepsiCo.
Sugar
Sugar is widely available and is purchased locally by each of our operations. We enter into derivative
instruments to avoid the impact of short-term volatility in sugar prices on our production costs. See ―Quantitative
and Qualitative Disclosure about Market Risk‖.
Other
We buy all of the fruit juice, pulp and concentrate that we use in the manufacture of our fruit-flavored CSDs.
37
Packaging
Packaging costs are comprised of the cost of glass and PET bottles, aluminum and steel cans, plastic film
(shrink and stretch), paper labels, plastic closures, metal crowns and paperboard. We enter into derivative
instruments to mitigate the risks of short-term volatility in aluminum prices on our production costs; for further
information on this matter see ―Quantitative and Qualitative Disclosures About Market Risk‖. For other materials,
we usually set a fixed price for the period in accordance with the prevailing macroeconomic conditions.
In April 2008 we started operating a glass bottle producing facility in Rio de Janeiro. The new unit has a
yearly production capacity of 120 thousand tons of glass, or approximately 600 million bottles.
Our main aluminum can suppliers are Rexam, Latapack Ball, Metallic and Crown-Cork. Our main glass
bottles suppliers are St. Gobain Emballage, Owens-Illinois Glass Containers and Companhia Industrial de Vidro,
and part of our glass bottles needs are being produced internally at our Rio de Janeiro glass bottle facility. We obtain
the labels for our beer and CSD primarily from local suppliers; in Brazil, the majority of our requirements are met
by a printing house that belongs to Fundação Zerrenner and is operated by us pursuant to a lease agreement. Plastic
closures are principally purchased from Alcoa Alumínio and Crown-Cork. PET pre-forms are principally purchased
from Plastpak. Crown caps are sourced locally by each of our operations. In Brazil and some of our HILA-ex
operations, a significant part of our crown caps requirements are met by our facility in the north of Brazil.
Regulation
All our operations are subject to local governmental regulation and supervision, including (i) labor laws;
(ii) social security laws; (iii) public health, consumer protection and environmental laws; (iv) securities laws; and
(v) antitrust laws. In addition, regulations exist to (i) ensure healthy and safe conditions in facilities for the
production, bottling, and distribution of beverages and (ii) place restrictions on beer consumption.
Environmental laws in the countries where we operate are mostly related to (i) the conformity of our operating
procedures with environmental standards regarding, among other issues, the emission of gas and liquid effluents and
(ii) the disposal of one-way packaging.
Governmental restrictions on beer consumption in the markets where we operate vary from one country to
another, and in some instances, from one local region to another. The most relevant restrictions are:
▪Each country has a minimum legal drinking age that is established by the government; the beer legal
drinking age varies from 18 to 21 years;
▪Some local and federal governments require that retail stores own special licenses for the sale of alcohol;
this is the case in some regions of Argentina and Canada;
▪Some local governments in Canada establish a minimum price for beer sales, which is named Social
Reference Price (―SRP‖). There is a specific SRP for each different packaging presentation. The SRP
may vary from one province to another;
▪Beer sales in the off-premise channel in the Canadian provinces of New Brunswick, Newfoundland, Nova
Scotia, Prince Edward Island and Saskatchewan are restricted to specific government-owned stores;
and
▪Beer sales in the off-premise channel in Canada in the Province of Ontario are restricted to two chains of
retail stores. One of them is the LCBO, which is government owned, and the other is TBS, jointly
owned by Labatt, Molson and Sleeman. The Alcohol and Gaming Commission of Ontario regulates the
alcohol industry.
Many governments also impose restrictions on beer advertisement, which may affect, among other issues,
(i) the media channels used, (ii) the contents of advertising campaigns, and (iii) the time and places where beer can
be advertised.
38
Marketing
Ambev’s marketing initiatives are concentrated in off-trade and on-trade initiatives. Off-trade initiatives
comprise mass media vehicles, such as television, radio, magazines and internet websites. On-trade initiatives
includes banners, and all types of enhancements to the point of sale, such as branded coolers and decorated furniture.
Licenses
Ambev has long-term agreements with PepsiCo whereby Ambev has been granted the exclusive right to
bottle, sell and distribute certain brands of PepsiCo’s portfolio of CSDs in Brazil, including Pepsi-Cola, Seven Up
and Gatorade. The agreements will expire on December 31, 2017. See ―Additional Information—Material
Contracts‖. Ambev also has agreements with PepsiCo to manufacture, package, sell, distribute and market some of
its brands in the Dominican Republic and in some regions of Peru, including the north and the Lima regions.
Through our Latin America South operations, we are also PepsiCo’s bottler for Argentina, Uruguay and, as of
March 2009, for Bolivia. In 2010, sales volumes of PepsiCo products represented 37.2% of our total CSD & NANC
sales volumes in Brazil, nearly 90% of our total CSD & NANC sales volumes in the Dominican Republic, all of our
CSD & NANC sales volumes in Peru and Uruguay and nearly all of our CSD & NANC sales volumes in Argentina.
Effective January 1998, Labatt entered into long-term licensing agreements with Anheuser-Busch whereby
Labatt was granted the exclusive right and license to manufacture, package, sell, distribute and market some of
Anheuser-Busch’s brands, including the Budweiser and Bud Light brands, in Canada, including the right to use
Anheuser-Busch’s trademarks for those purposes. The agreements expire in January 2098 and are renewable by
either party for a second term of 100 years. In 2010, the Anheuser-Busch brands sold by Labatt represented 54% of
Labatt’s total sales volumes. According to Ambev’s estimates, the Budweiser brand is currently the largest selling
brand in terms of volume in Canada.
Ambev and A-B InBev are also parties to a 10-year cross-licensing agreement which began in 2005, through
which Ambev is allowed to produce, package, market and distribute beer under the brands Stella Artois and Beck’s
in Latin America (except Argentina and Cuba) on an exclusive basis, and A-B InBev is allowed to produce,
package, market and distribute beer under the brand Brahma in Europe, Asia, Africa, Cuba and the United States on
an exclusive basis. Labatt and A-B InBev have an arrangement through which Labatt distributes certain A-B InBev
beer brands in Canada, and the Latin America South zone and A-B InBev have an arrangement through which it
distributes Stella Artois in Argentina. In addition, under the Indemnification Agreement between Ambev and A-B
InBev, dated November 13, 2008 – See ―—Related Party Transactions—Ambev and A-B InBev—Indemnification
Agreement‖ – A-B InBev agreed to transfer the distribution in the U.S. of the non-Labatt branded beer to the
Anheuser-Busch distribution network.
Taxation
Beer
Taxation on beer in the countries where we operate is comprised of different taxes specific to each
jurisdiction, such as an excise tax and a value-added tax. The amount of sales taxes charged on our beer products in
2010 represented as a percentage of gross sales was: 29.7% in Brazil; 22% in Canada; 16.2% in Central America;
34.8% in Ecuador; 44.2% in Peru; 59.4% in the Dominican Republic; 26.1% in Argentina; 33.5% in Bolivia; 25.4%
in Chile; 16.0% in Paraguay; and 25.8% in Uruguay.
CSD & NANC
Taxation on CSD & NANC in the countries where we operate is comprised of taxes specific to each
jurisdiction, such as an excise tax and a value-added tax. The amount of taxes charged on our CSD & NANC
products in 2010 represented as a percentage of gross sales: 24.6% in Brazil; 13.4% in the Dominican Republic;
28.1% in Peru; between 24.7% and 26.5% in Argentina (the final % depends on the type and flavor of the beverage);
28.5% in Bolivia and 34.5% in Uruguay.
39
Brazilian Tax Changes
In November 2008 the Brazilian Congress approved certain changes (effective January 1, 2009) to the taxable
basis and tax rates of the IPI and the PIS/COFINS. Under the previous system, these taxes were paid as a fixed rate
per hectoliter by all taxpayers. The new system provided that higher priced brands pay higher taxes per hectoliter
than lower priced brands based on a reference price to consumer table. In 2011, the Brazilian government, through a
market survey of prices of beverage products in Brazil, updated the abovementioned reference price table, effective
as of April 4th
, 2011. As a result, the actual increase in Ambev’s federal excise tax and PIS/COFINS tax burden --
which according to the new system, is dependent on Ambev’s packaging and brand mix -- is of approximately 13%,
for beer and non alcoholic beverages on average.
C. Organizational Structure
The controlling shareholders of Ambev, Interbrew International B.V. and AmBrew S.A., which are both
subsidiaries of A-B InBev and Fundação Zerrenner, together hold approximately 91.1% of Ambev’s common
shares, as of December 31, 2010. A-B InBev indirectly holds shares of Ambev common stock that represent
approximately 74.0% of the total voting power of Ambev’s capital stock. A-B InBev thus has control over Ambev,
even though (i) A-B InBev remains subject to the Ambev Shareholders’ Agreement with Fundação Zerrenner, and
(ii) A-B InBev is jointly controlled by Messrs. Lemann, Sicupira and Telles and Interbrew’s former controlling
shareholders. For further information on these matters see ―—Ambev Shareholders’ Agreement‖ and ―Information
on the Company—InBev-Ambev Transactions‖.
Ambev conducts the bulk of its operations in Brazil directly. It also indirectly controls Labatt, the operations
of HILA-ex and Latin America South. The following chart illustrates the ownership structure of Ambev’s principal
subsidiaries as of December 31, 2010 for total share capital owned.
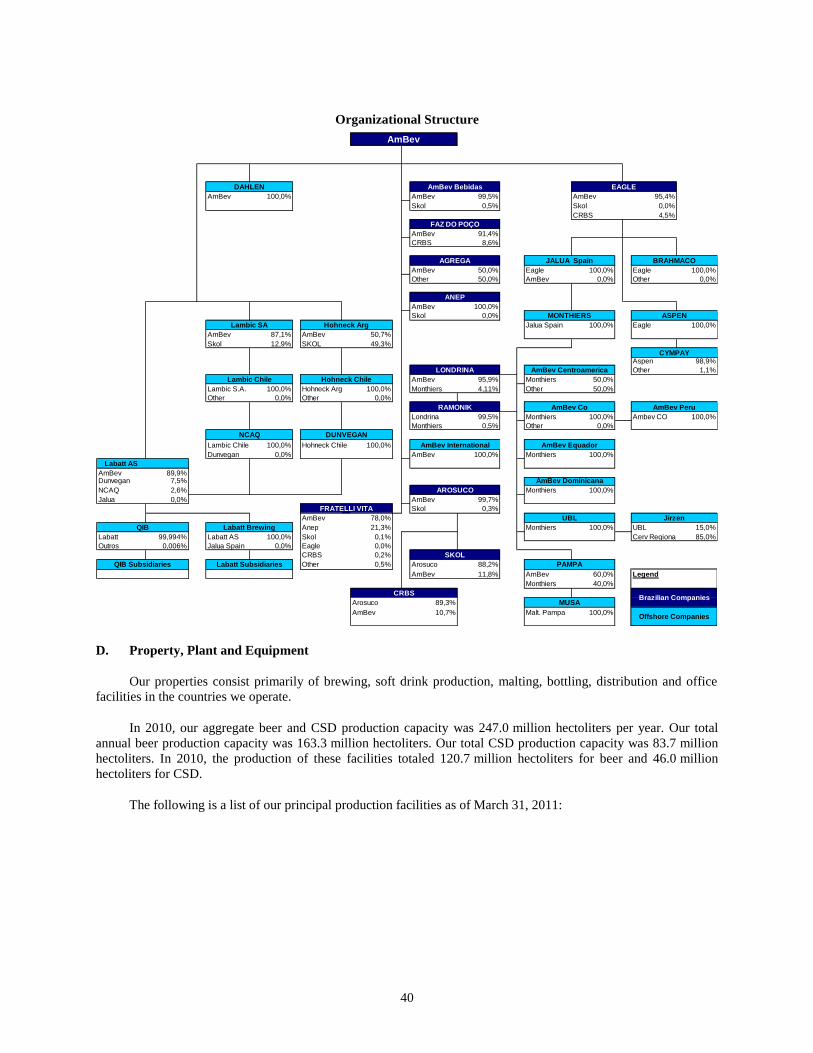
40
Organizational Structure
AmBev 100,0% AmBev 99,5% AmBev 95,4%
Skol 0,5% Skol 0,0%
CRBS 4,5%
AmBev 91,4%
CRBS 8,6%
AmBev 50,0% Eagle 100,0% Eagle 100,0%
Other 50,0% AmBev 0,0% Other 0,0%
AmBev 100,0%
Skol 0,0%
Jalua Spain 100,0% Eagle 100,0%
AmBev 87,1% AmBev 50,7%
Skol 12,9% SKOL 49,3%
Aspen 98,9%
Other 1,1%
AmBev 95,9% Monthiers 50,0%
Lambic S.A. 100,0% Hohneck Arg 100,0% Monthiers 4,11% Other 50,0%
Other 0,0% Other 0,0%
Londrina 99,5% Monthiers 100,0% Ambev CO 100,0%
Monthiers 0,5% Other 0,0%
Lambic Chile 100,0% Hohneck Chile 100,0%
Dunvegan 0,0% AmBev 100,0% Monthiers 100,0%
Labatt AS
AmBev 89,9%Dunvegan 7,5%
NCAQ 2,6% Monthiers 100,0%
Jalua 0,0% AmBev 99,7%
Skol 0,3%
AmBev 78,0%
Anep 21,3% Monthiers 100,0% UBL 15,0%
Labatt 99,994% Labatt AS 100,0% Skol 0,1% Cerv Regional 85,0%
Outros 0,006% Jalua Spain 0,0% Eagle 0,0%
CRBS 0,2%
Other 0,5% Arosuco 88,2%
AmBev 11,8% AmBev 60,0% Legend
Monthiers 40,0%
Arosuco 89,3%
AmBev 10,7% Malt. Pampa 100,0%
CRBS
AmBev International
MONTHIERS ASPEN
AmBev Co
SKOL
PAMPA
Hohneck Arg
DUNVEGAN
AmBev Bebidas
AROSUCO
CYMPAY
JALUA Spain
Jirzen
Brazilian Companies
Offshore Companies
AmBev Peru
AmBev Centroamerica
Labatt Subsidiaries
Lambic SA
Lambic Chile
UBL
AmBev Dominicana
Hohneck Chile
Labatt Brewing
RAMONIK
AmBev Equador
LONDRINA
FAZ DO POÇO
AGREGA
NCAQ
QIB
QIB Subsidiaries
FRATELLI VITA
MUSA
DAHLEN EAGLE
ANEP
AmBev
BRAHMACO
D. Property, Plant and Equipment
Our properties consist primarily of brewing, soft drink production, malting, bottling, distribution and office
facilities in the countries we operate.
In 2010, our aggregate beer and CSD production capacity was 247.0 million hectoliters per year. Our total
annual beer production capacity was 163.3 million hectoliters. Our total CSD production capacity was 83.7 million
hectoliters. In 2010, the production of these facilities totaled 120.7 million hectoliters for beer and 46.0 million
hectoliters for CSD.
The following is a list of our principal production facilities as of March 31, 2011:
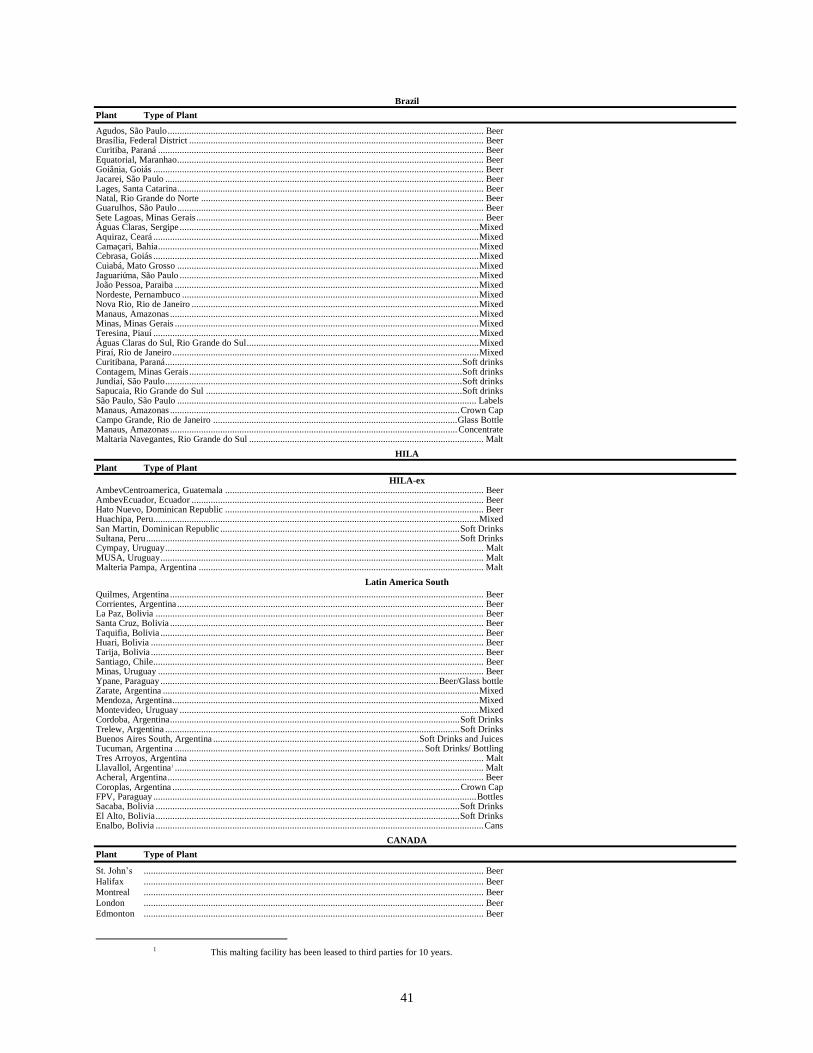
41
Brazil
Plant Type of Plant
Agudos, São Paulo .................................................................................................................................... Beer Brasília, Federal District ........................................................................................................................... Beer Curitiba, Paraná ........................................................................................................................................ Beer Equatorial, Maranhao ................................................................................................................................ Beer Goiânia, Goiás .......................................................................................................................................... Beer Jacarei, São Paulo ..................................................................................................................................... Beer Lages, Santa Catarina................................................................................................................................ Beer Natal, Rio Grande do Norte ...................................................................................................................... Beer Guarulhos, São Paulo ................................................................................................................................ Beer Sete Lagoas, Minas Gerais ........................................................................................................................ Beer Águas Claras, Sergipe ............................................................................................................................. Mixed Aquiraz, Ceará ........................................................................................................................................ Mixed Camaçari, Bahia ...................................................................................................................................... Mixed Cebrasa, Goiás ........................................................................................................................................ Mixed Cuiabá, Mato Grosso .............................................................................................................................. Mixed Jaguariứna, São Paulo ............................................................................................................................. Mixed João Pessoa, Paraiba ............................................................................................................................... Mixed Nordeste, Pernambuco ............................................................................................................................ Mixed Nova Rio, Rio de Janeiro ........................................................................................................................ Mixed Manaus, Amazonas ................................................................................................................................. Mixed Minas, Minas Gerais ............................................................................................................................... Mixed Teresina, Piauí ........................................................................................................................................ Mixed Águas Claras do Sul, Rio Grande do Sul ................................................................................................. Mixed Piraí, Rio de Janeiro ................................................................................................................................ Mixed Curitibana, Paraná ............................................................................................................................ Soft drinks Contagem, Minas Gerais .................................................................................................................. Soft drinks Jundiaí, São Paulo ............................................................................................................................ Soft drinks Sapucaia, Rio Grande do Sul ........................................................................................................... Soft drinks São Paulo, São Paulo ............................................................................................................................. Labels Manaus, Amazonas ......................................................................................................................... Crown Cap Campo Grande, Rio de Janeiro ...................................................................................................... Glass Bottle Manaus, Amazonas ........................................................................................................................ Concentrate Maltaria Navegantes, Rio Grande do Sul .................................................................................................. Malt
HILA
Plant Type of Plant
HILA-ex AmbevCentroamerica, Guatemala ............................................................................................................ Beer AmbevEcuador, Ecuador .......................................................................................................................... Beer Hato Nuevo, Dominican Republic ............................................................................................................ Beer Huachipa, Peru........................................................................................................................................ Mixed San Martin, Dominican Republic .................................................................................................... Soft Drinks Sultana, Peru ................................................................................................................................... Soft Drinks Cympay, Uruguay ..................................................................................................................................... Malt MUSA, Uruguay ....................................................................................................................................... Malt Malteria Pampa, Argentina ....................................................................................................................... Malt
Latin America South
Quilmes, Argentina ................................................................................................................................... Beer Corrientes, Argentina ................................................................................................................................ Beer La Paz, Bolivia ......................................................................................................................................... Beer Santa Cruz, Bolivia ................................................................................................................................... Beer Taquifia, Bolivia ....................................................................................................................................... Beer Huari, Bolivia ........................................................................................................................................... Beer Tarija, Bolivia ........................................................................................................................................... Beer Santiago, Chile.......................................................................................................................................... Beer Minas, Uruguay ........................................................................................................................................ Beer Ypane, Paraguay .................................................................................................................... Beer/Glass bottle Zarate, Argentina .................................................................................................................................... Mixed Mendoza, Argentina ................................................................................................................................ Mixed Montevideo, Uruguay ............................................................................................................................. Mixed Cordoba, Argentina ......................................................................................................................... Soft Drinks Trelew, Argentina ........................................................................................................................... Soft Drinks Buenos Aires South, Argentina ...................................................................................... Soft Drinks and Juices Tucuman, Argentina ........................................................................................................ Soft Drinks/ Bottling Tres Arroyos, Argentina ........................................................................................................................... Malt Llavallol, Argentina1 ................................................................................................................................. Malt Acheral, Argentina .................................................................................................................................... Beer Coroplas, Argentina ........................................................................................................................ Crown Cap FPV, Paraguay ....................................................................................................................................... Bottles Sacaba, Bolivia ............................................................................................................................... Soft Drinks El Alto, Bolivia ............................................................................................................................... Soft Drinks Enalbo, Bolivia ......................................................................................................................................... Cans
CANADA
Plant Type of Plant
St. John’s .............................................................................................................................................. Beer
Halifax .............................................................................................................................................. Beer
Montreal .............................................................................................................................................. Beer
London .............................................................................................................................................. Beer
Edmonton .............................................................................................................................................. Beer
1 This malting facility has been leased to third parties for 10 years.

42
Creston .............................................................................................................................................. Beer
Please see “Liquidity and Capital Resources-Secured Debt” for more information about encumbrances on
our plants and equipment.
43
ITEM 5. OPERATING AND FINANCIAL REVIEW AND PROSPECTS
A. Operating Results
Introduction
The following management’s discussion and analysis of financial condition and results of operations should
be read in conjunction with our audited financial statements included in this annual report. This annual report
contains forward-looking statements that involve risks and uncertainties. Our actual results may differ materially
from those discussed in the forward-looking statements as a result of various factors including, without limitation,
those set forth in ―Cautionary Statement Regarding Forward-Looking Information‖ and the matters set forth in this
annual report generally.
We have prepared our audited consolidated financial statements as of December 31, 2010, 2009 and 2008 and
for the years then ended in Reais in accordance with IFRS as promulgated by the IASB.
The financial information and related discussion and analysis contained in this Item are in accordance with
IFRS as issued by the IASB. The amounts are in million Reais, unless otherwise stated.
Critical Accounting Policies
The SEC has defined a critical accounting policy as a policy for which there is a choice among alternatives
available, and for which choosing a legitimate alternative would yield materially different results. We believe that
the following are our critical accounting policies. We consider an accounting policy to be critical if it is important to
our financial condition and results of operations and requires significant or complex judgments and estimates on the
part of our management.
The preparation of financial statements in conformity with IFRS requires us to use estimates and adopt
assumptions that affect the reported amounts of assets and liabilities, revenues and expenses and accounting
disclosures. Actual results may differ from those estimated under different variables, assumptions or conditions.
Note 3 to our audited consolidated financial statements includes a summary of the significant accounting policies
applied in the preparation of these financial statements. In order to provide an understanding about how management
forms its judgments about future events, including the variables and assumptions underlying the estimates, and the
sensitivity of those judgments to different variables and conditions, we have included below a brief discussion of our
more significant accounting policies.
Accounting for Business Combinations and Impairment of Goodwill and Intangible Assets
We have made acquisitions that generated a significant amount of goodwill and other intangible assets,
including from the acquisition of Labatt and of Quinsa.
Under IFRS, goodwill is calculated as the difference between the purchase consideration and the fair value of
the net assets acquired. IFRS 3, ―Business Combinations‖ does not permit that goodwill and intangible assets with
indefinite useful lives be amortized but that they should be tested annually for impairment. Our intangible assets
with definite useful lives are amortized over the estimated useful lives of these assets.
We exercise significant judgment in the process of identifying tangible and intangible assets and liabilities,
valuing such assets and liabilities and in determining their remaining useful lives. We generally engage third-party
valuation firms to assist in valuing the acquired assets and liabilities. The valuation of these assets and liabilities is
based on the assumptions and criteria which include in some cases estimates of future cash flows discounted at the
appropriate rates. The use of different assumptions used for valuations purposes including estimates of future cash
flows or discount rates may result in different estimates of value of assets acquired and liabilities assumed.
44
We test our goodwill and other long-lived assets for impairment annually and whenever events and
circumstances indicate that the undiscounted cash flows estimated to be generated by those assets are less than the
carrying amount of those items. Our cash flow estimates are based on historical results adjusted to reflect our best
estimate of future market and operating conditions. Our estimates of fair values used to determine the resulting
impairment loss, if any, represent our best estimate based on forecasted cash flows, industry trends and reference to
market rates and transactions. Impairments can also occur when we decide to dispose of assets.
Pension and other Post-Retirement Benefits
Post-employment benefits include pension benefits, dental and health care. The Company manages defined
benefit and defined contribution plans for employees of its companies located in Brazil, the Dominican Republic,
Argentina, Bolivia and Canada. Usually, pension plans are funded by payments made both by the Company and its
employees, taking into account the recommendations of independent actuaries. Ambev maintains funded and
unfunded plans.
Defined contribution plans
Contributions to these plans are recognized as expenses in the period in which they are incurred.
Defined benefit plans
For defined benefit plans, expenses are assessed separately for each plan using the projected unit credit
method. The projected unit credit method takes into account each period of service as giving rise to an additional
unit of benefit to measure each unit separately. Under this method, the cost of providing pensions is charged to the
income statement during the period of service of the employee. The amounts charged to the income statement
consist of current service cost, interest cost, the expected return of any plan assets, past service costs and the effect
of any settlements and curtailments. The obligations of the plan recognized in the balance sheet are measured at the
current value of the estimated future cash outflows using a discount rate equivalent to the bond rates with maturity
terms similar to those of the obligation, less any past service cost not yet recognized and the fair value of any plan
assets. Past service costs result from the introduction of a new plan or changes to an existing plan. These are
recognized in the income statement over the period the benefit vests. Actuarial gains and losses consist of the effects
of differences between the previous actuarial assumptions compared to the actual results and the effects of changes
in actuarial assumptions. Actuarial gains and losses are fully recognized in equity.
Where the calculated amount of a defined benefit plan liability is negative (an asset), Ambev recognizes such
pension asset to the extent of any unrecognized past service costs plus any economic benefits available to Ambev
either from refunds or reductions in future contributions.
Other post-employment obligations
The Company and its subsidiaries provide health care benefits, reimbursement of expenses with drugs and
other benefits to certain retirees who retired in the past. These benefits are not granted to new retirees. The expected
costs of these benefits are recognized over the period of employment, using an accounting methodology similar to
that for defined benefit plans.
Contingencies
The preparation of our financial statements requires our management to make estimates and assumptions
regarding contingencies which affect the valuation of assets and liabilities at the date of the financial statements and
the revenues and expenses during the reported period.
We disclose material contingent liabilities unless the possibility of any loss arising is considered remote, and
material contingent assets where the inflow of economic benefits is probable. We discuss our material contingencies
in Notes 27 and 31 to our financial statements.
45
Under IFRS, we record a provision for a loss contingency when it is probable that a future event will confirm
that a liability has been incurred at the date of the financial statements, and the amount of the loss can be reasonably
estimated. In particular, given the uncertain nature of Brazilian tax legislation, the assessment of potential tax
liabilities requires significant management judgment. By their nature contingencies will only be resolved when one
or more future events occur or fail to occur – and typically those events may occur a number of years in the future.
Total provisions including contingencies, restructuring and other provisions related to such matters, recorded
in our balance sheet as of December 31, 2010, 2009 and 2008 totaled R$639.1 million, R$1,015.5 million and
R$1,064.7 million, respectively. For further details, see Note 27 of our Consolidated Financial Statements.
Deferred and Current Income Taxes
We recognize deferred tax effects of tax loss carryforwards and temporary differences between the financial
statement carrying amounts and the tax basis of our assets and liabilities. We estimate our income taxes based on
regulations in the various jurisdictions where we conduct business. This requires us to estimate our actual current tax
exposure and to assess temporary differences that result from different treatment of certain items for tax and
accounting purposes. These differences result in deferred tax assets and liabilities, which we record on our balance
sheet. We regularly review the deferred tax assets for recoverability and will only recognize these if we believe that
it is probable that there will be sufficient taxable profit against any temporary differences that can be utilized, based
on historical taxable income, projected future taxable income, and the expected timing of the reversals of existing
temporary differences.
The carrying amount of a deferred tax asset is reviewed at each balance sheet date. We reduce the carrying
amount of a deferred tax asset to the extent that it is no longer probable that sufficient taxable profit will be available
to allow the benefit of part or all of that deferred tax asset to be utilized. Any such reduction is reversed to the extent
that it becomes probable that sufficient taxable profit will be available.
Accounting for Derivatives
Ambev uses derivative financial instruments in order to mitigate against risks related to foreign currency,
interest rates and commodity prices. Ambev’s financial risk management policy forbids the use of derivative
financial instruments for speculative purposes. Derivative instruments that, although contracted for hedging
purposes, do not meet all hedge accounting criteria defined in International Accounting Standard (―IAS‖) 39
Financial Instruments: Recognition and Measurement are recognized at fair value in the income statement.
Derivative financial instruments are recognized initially at fair value. Fair value is the amount for which the
asset could be realized and the liability settled, between knowledgeable parties, in an arm’s length transaction. The
fair value of derivative financial instruments may be obtained from quoted market prices or from pricing models that
take into account current market rates.
Subsequent to initial recognition, derivative financial instruments are remeasured taking into account their fair
value on the financial statements date. Depending on the type of instrument, whether cash flow hedging or fair value
hedging, the changes in their fair value are recognized in the income statement or in equity.
The concepts of cash flow, net investment hedge accounting and fair value hedge are applied to all instruments
that meet the hedge accounting requirements defined in IAS 39, e.g., the maintenance of the documentation required
and the effectiveness of the hedge.
Cash flow hedge accounting: When a derivative financial instrument hedges the exposure in cash flows of a
recognized asset or liability, the foreign currency risk of a firm commitment or a highly probable forecasted
transaction, the effective part of any resulting gain or loss on the derivative financial instrument is recognized
directly in equity (hedging reserves). When the firm commitment in foreign currency or the forecasted transaction
results in the recognition of a non financial asset or a non financial liability, the cumulative gain or loss is removed
from equity and included in the initial measurement of the asset or liability. When the hedge relates to financial
46
assets or liabilities, the cumulative gain or loss on the hedging instrument is reclassified from equity into the income
statement in the same period during which the hedged risk affects the income statement (e.g. when the variable
interest expense is recognized). The ineffective part of any gain or loss is recognized immediately in the income
statement. When a hedging instrument or hedge relationship is terminated but the hedged transaction is still expected
to occur, the cumulative gain or loss (at that point) remains in equity and is reclassified in accordance with the above
policy when the hedged transaction occurs. If the hedged transaction is no longer probable, the cumulative gain or
loss recognized in equity is recognized into the income statement immediately.
Net investment hedge accounting: When a foreign currency liability hedges a net investment in a foreign
operation, exchange differences arising on the translation of the liability to the functional currency are recognized
directly in other comprehensive income (translation reserves).
When a derivative financial instrument hedges a net investment in a foreign operation, the portion of the gain
or the loss on the hedging instrument that is determined to be an effective hedge is recognized directly in other
comprehensive income (translation reserves), while the ineffective portion is reported in the income statement.
Investments in equity instruments or derivatives linked to and to be settled by delivery of an equity instrument
are stated at cost when such equity instrument does not have a quoted market price in an active market and for which
other methods of reasonably estimating fair value are clearly inappropriate or unworkable.
Fair value hedge accounting: When a derivative financial instrument hedges the variability in fair value of a
recognized asset or liability, any resulting gain or loss on the hedging instrument is recognized in the income
statement. The hedged item is also stated at fair value in respect of the risk being hedged, with any gain or loss being
recognized in the income statement. The Company will discontinue fair value hedge accounting when the object of
coverage expires, is sold, terminated or exercised.
Should these instruments be settled only on their respective maturity dates, any effect between the market
value and estimated yield curve of the instruments would be totally eliminated. Had we adopted the same criterion to
recognize our financial liabilities at market value, we would have recorded an additional loss, before income taxes,
of R$(266.5) million on December 31, 2010 (as compared to gain of R$144.1 million on December 31, 2009 and
losses of R$(268.8) million on December 31, 2008), as follows:
Financial Liabilities Book Value Market Value Difference
(R$ in thousands)
Working Capital Reais (Labatt) ............................................. 1,189,615 1,300,941 (111,326)
Syndicated Facility (CAD) ..................................................... 300,817 300,817 -
TBS (CAD) (i) ....................................................................... 157,899 168,150 (10,251)
International financing (other currencies) .............................. 453,912 453,912 -
Agro-industrial credit ............................................................. 100,000 100,000 -
BNDES/FINEP/EGF .............................................................. 1.130,124 1,130,124 -
Bond 2011 .............................................................................. 884,257 894,608 (10,351)
Bond 2013 .............................................................................. 886,676 980,614 (93,938)
Bond 2017 .............................................................................. 284,771 300,675 (15,904)
Debentures ............................................................................. 1,247,477 1,272,179 (24,702)
Tax incentives ........................................................................ 120,784 120,784 -
Financial Leasing ................................................................... 14,110 -
6,770,442 7,036,914 (266,472)
Total ......................................................................................
(i) The Beer Store’s debt in Canadian dollars. The figures shown are proportionally consolidated by Labatt
Canada.
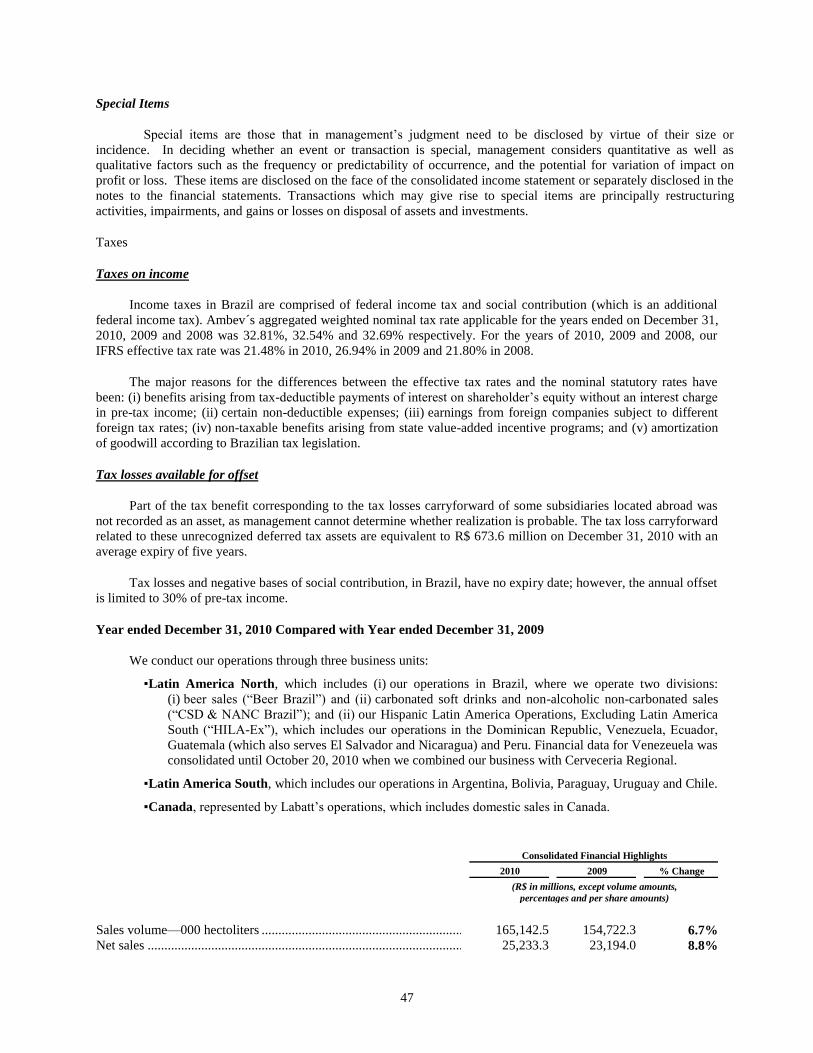
47
Special Items
Special items are those that in management’s judgment need to be disclosed by virtue of their size or
incidence. In deciding whether an event or transaction is special, management considers quantitative as well as
qualitative factors such as the frequency or predictability of occurrence, and the potential for variation of impact on
profit or loss. These items are disclosed on the face of the consolidated income statement or separately disclosed in the
notes to the financial statements. Transactions which may give rise to special items are principally restructuring
activities, impairments, and gains or losses on disposal of assets and investments.
Taxes
Taxes on income
Income taxes in Brazil are comprised of federal income tax and social contribution (which is an additional
federal income tax). Ambev´s aggregated weighted nominal tax rate applicable for the years ended on December 31,
2010, 2009 and 2008 was 32.81%, 32.54% and 32.69% respectively. For the years of 2010, 2009 and 2008, our
IFRS effective tax rate was 21.48% in 2010, 26.94% in 2009 and 21.80% in 2008.
The major reasons for the differences between the effective tax rates and the nominal statutory rates have
been: (i) benefits arising from tax-deductible payments of interest on shareholder’s equity without an interest charge
in pre-tax income; (ii) certain non-deductible expenses; (iii) earnings from foreign companies subject to different
foreign tax rates; (iv) non-taxable benefits arising from state value-added incentive programs; and (v) amortization
of goodwill according to Brazilian tax legislation.
Tax losses available for offset
Part of the tax benefit corresponding to the tax losses carryforward of some subsidiaries located abroad was
not recorded as an asset, as management cannot determine whether realization is probable. The tax loss carryforward
related to these unrecognized deferred tax assets are equivalent to R$ 673.6 million on December 31, 2010 with an
average expiry of five years.
Tax losses and negative bases of social contribution, in Brazil, have no expiry date; however, the annual offset
is limited to 30% of pre-tax income.
Year ended December 31, 2010 Compared with Year ended December 31, 2009
We conduct our operations through three business units:
▪Latin America North, which includes (i) our operations in Brazil, where we operate two divisions:
(i) beer sales (―Beer Brazil‖) and (ii) carbonated soft drinks and non-alcoholic non-carbonated sales
(―CSD & NANC Brazil‖); and (ii) our Hispanic Latin America Operations, Excluding Latin America
South (―HILA-Ex‖), which includes our operations in the Dominican Republic, Venezuela, Ecuador,
Guatemala (which also serves El Salvador and Nicaragua) and Peru. Financial data for Venezeuela was
consolidated until October 20, 2010 when we combined our business with Cerveceria Regional.
▪Latin America South, which includes our operations in Argentina, Bolivia, Paraguay, Uruguay and Chile.
▪Canada, represented by Labatt’s operations, which includes domestic sales in Canada.
Consolidated Financial Highlights
2010
2009
% Change
(R$ in millions, except volume amounts,
percentages and per share amounts)
Sales volume—000 hectoliters .......................................................................................................... 165,142.5 154,722.3 6.7% Net sales ............................................................................................................................................ 25,233.3 23,194.0 8.8%
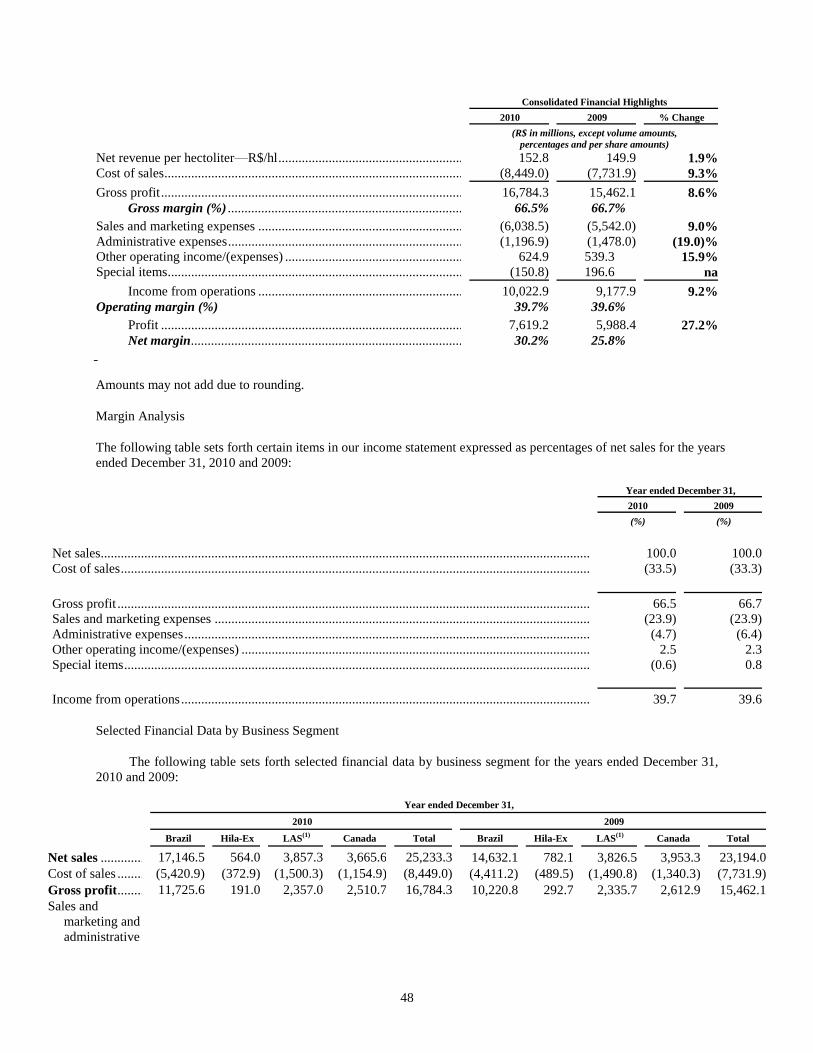
48
Consolidated Financial Highlights
2010
2009
% Change
(R$ in millions, except volume amounts,
percentages and per share amounts) Net revenue per hectoliter—R$/hl ..................................................................................................... 152.8 149.9 1.9% Cost of sales ....................................................................................................................................... (8,449.0) (7,731.9) 9.3%
Gross profit ........................................................................................................................................ 16,784.3 15,462.1 8.6% Gross margin (%) .................................................................................................................... 66.5% 66.7%
Sales and marketing expenses ........................................................................................................... (6,038.5) (5,542.0) 9.0% Administrative expenses .................................................................................................................... (1,196.9) (1,478.0) (19.0)% Other operating income/(expenses) ................................................................................................... 624.9 539.3 15.9% Special items ...................................................................................................................................... (150.8) 196.6 na
Income from operations ........................................................................................................... 10,022.9 9,177.9 9.2% Operating margin (%) 39.7% 39.6%
Profit ........................................................................................................................................ 7,619.2 5,988.4 27.2% Net margin ............................................................................................................................... 30.2% 25.8%
Amounts may not add due to rounding.
Margin Analysis
The following table sets forth certain items in our income statement expressed as percentages of net sales for the years
ended December 31, 2010 and 2009:
Year ended December 31,
2010
2009
(%) (%)
Net sales.................................................................................................................................................... 100.0 100.0 Cost of sales .............................................................................................................................................. (33.5) (33.3)
Gross profit ............................................................................................................................................... 66.5 66.7 Sales and marketing expenses .................................................................................................................. (23.9) (23.9) Administrative expenses ........................................................................................................................... (4.7) (6.4) Other operating income/(expenses) .......................................................................................................... 2.5 2.3 Special items ............................................................................................................................................. (0.6) 0.8
Income from operations ............................................................................................................................ 39.7 39.6
Selected Financial Data by Business Segment
The following table sets forth selected financial data by business segment for the years ended December 31,
2010 and 2009:
Year ended December 31,
2010
2009
Brazil
Hila-Ex
LAS(1)
Canada
Total
Brazil
Hila-Ex
LAS(1)
Canada
Total
Net sales ........................... 17,146.5 564.0 3,857.3 3,665.6 25,233.3 14,632.1 782.1 3,826.5 3,953.3 23,194.0 Cost of sales ...................... (5,420.9) (372.9) (1,500.3) (1,154.9) (8,449.0) (4,411.2) (489.5) (1,490.8) (1,340.3) (7,731.9) Gross profit ...................... 11,725.6 191.0 2,357.0 2,510.7 16,784.3 10,220.8 292.7 2,335.7 2,612.9 15,462.1 Sales and
marketing and
administrative
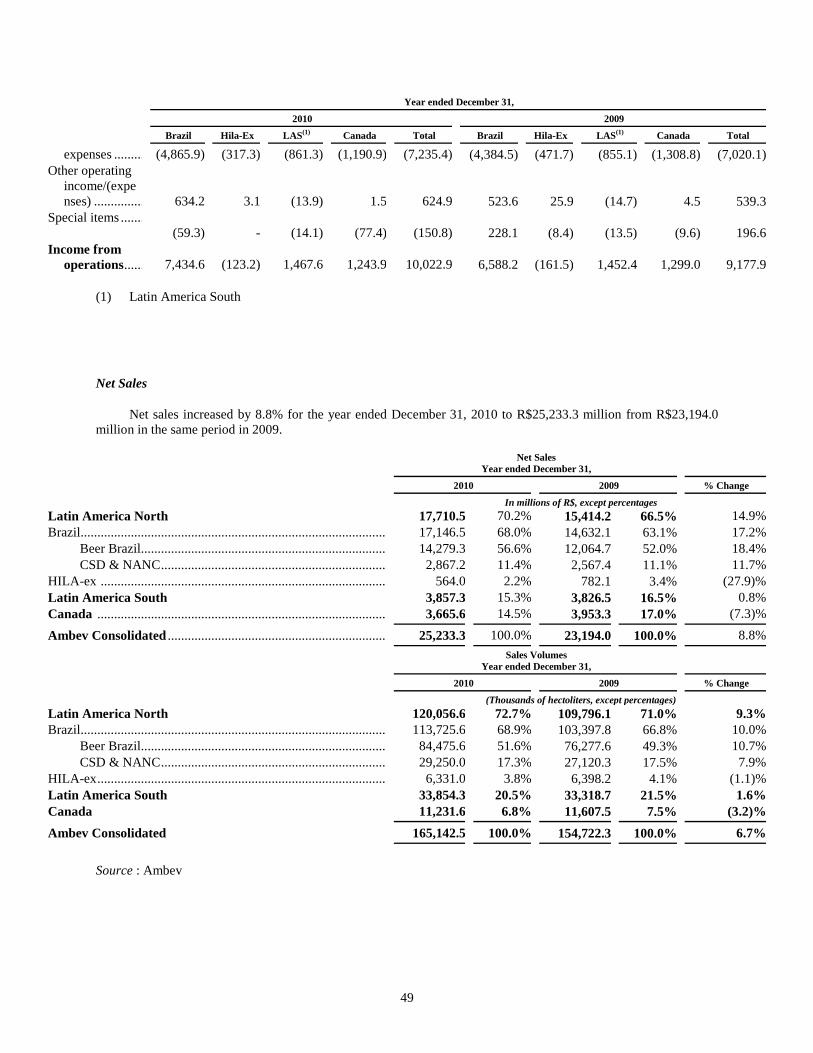
49
Year ended December 31,
2010
2009
Brazil
Hila-Ex
LAS(1)
Canada
Total
Brazil
Hila-Ex
LAS(1)
Canada
Total
expenses ....................... (4,865.9) (317.3) (861.3) (1,190.9) (7,235.4) (4,384.5) (471.7) (855.1) (1,308.8) (7,020.1) Other operating
income/(expe
nses) .............................
634.2
3.1
(13.9)
1.5
624.9
523.6
25.9
(14.7)
4.5
539.3 Special items .....................
(59.3)
-
(14.1)
(77.4)
(150.8)
228.1
(8.4)
(13.5)
(9.6)
196.6 Income from
operations ....................
7,434.6
(123.2)
1,467.6
1,243.9
10,022.9
6,588.2
(161.5)
1,452.4
1,299.0
9,177.9
(1) Latin America South
Net Sales
Net sales increased by 8.8% for the year ended December 31, 2010 to R$25,233.3 million from R$23,194.0
million in the same period in 2009.
Net Sales Year ended December 31,
2010
2009
% Change
In millions of R$, except percentages Latin America North 17,710.5 70.2% 15,414.2 66.5% 14.9% Brazil........................................................................................................................ 17,146.5 68.0% 14,632.1 63.1% 17.2%
Beer Brazil...................................................................................................... 14,279.3 56.6% 12,064.7 52.0% 18.4% CSD & NANC ................................................................................................ 2,867.2 11.4% 2,567.4 11.1% 11.7%
HILA-ex .................................................................................................................. 564.0 2.2% 782.1 3.4% (27.9)% Latin America South 3,857.3 15.3% 3,826.5 16.5% 0.8% Canada ................................................................................................................... 3,665.6 14.5% 3,953.3 17.0% (7.3)%
Ambev Consolidated .............................................................................................. 25,233.3 100.0% 23,194.0 100.0% 8.8%
Sales Volumes Year ended December 31,
2010
2009
% Change
(Thousands of hectoliters, except percentages) Latin America North 120,056.6 72.7% 109,796.1 71.0% 9.3% Brazil........................................................................................................................ 113,725.6 68.9% 103,397.8 66.8% 10.0%
Beer Brazil...................................................................................................... 84,475.6 51.6% 76,277.6 49.3% 10.7% CSD & NANC ................................................................................................ 29,250.0 17.3% 27,120.3 17.5% 7.9%
HILA-ex ................................................................................................................... 6,331.0 3.8% 6,398.2 4.1% (1.1)% Latin America South 33,854.3 20.5% 33,318.7 21.5% 1.6% Canada 11,231.6 6.8% 11,607.5 7.5% (3.2)%
Ambev Consolidated 165,142.5 100.0% 154,722.3 100.0% 6.7%
Source : Ambev
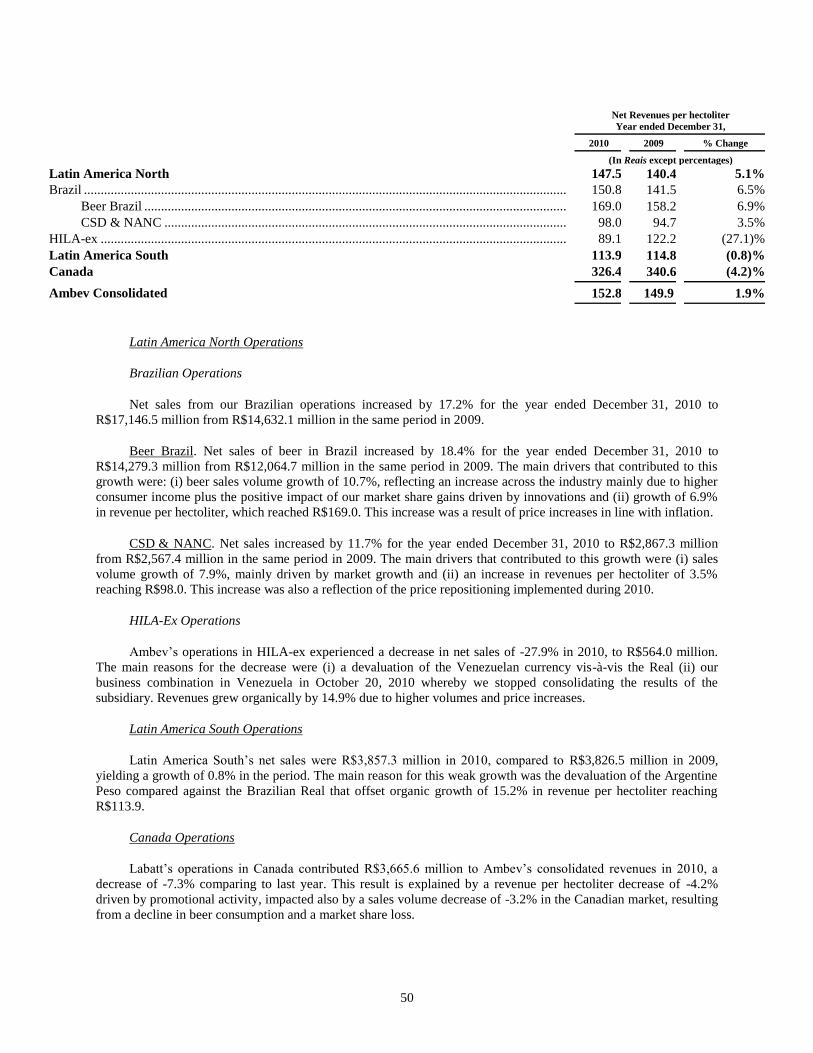
50
Net Revenues per hectoliter
Year ended December 31,
2010
2009
% Change
(In Reais except percentages) Latin America North 147.5 140.4 5.1% Brazil ............................................................................................................................................................... 150.8 141.5 6.5%
Beer Brazil ............................................................................................................................................. 169.0 158.2 6.9% CSD & NANC ....................................................................................................................................... 98.0 94.7 3.5%
HILA-ex .......................................................................................................................................................... 89.1 122.2 (27.1)% Latin America South 113.9 114.8 (0.8)% Canada 326.4 340.6 (4.2)%
Ambev Consolidated 152.8 149.9 1.9%
Latin America North Operations
Brazilian Operations
Net sales from our Brazilian operations increased by 17.2% for the year ended December 31, 2010 to
R$17,146.5 million from R$14,632.1 million in the same period in 2009.
Beer Brazil. Net sales of beer in Brazil increased by 18.4% for the year ended December 31, 2010 to
R$14,279.3 million from R$12,064.7 million in the same period in 2009. The main drivers that contributed to this
growth were: (i) beer sales volume growth of 10.7%, reflecting an increase across the industry mainly due to higher
consumer income plus the positive impact of our market share gains driven by innovations and (ii) growth of 6.9%
in revenue per hectoliter, which reached R$169.0. This increase was a result of price increases in line with inflation.
CSD & NANC. Net sales increased by 11.7% for the year ended December 31, 2010 to R$2,867.3 million
from R$2,567.4 million in the same period in 2009. The main drivers that contributed to this growth were (i) sales
volume growth of 7.9%, mainly driven by market growth and (ii) an increase in revenues per hectoliter of 3.5%
reaching R$98.0. This increase was also a reflection of the price repositioning implemented during 2010.
HILA-Ex Operations
Ambev’s operations in HILA-ex experienced a decrease in net sales of -27.9% in 2010, to R$564.0 million.
The main reasons for the decrease were (i) a devaluation of the Venezuelan currency vis-à-vis the Real (ii) our
business combination in Venezuela in October 20, 2010 whereby we stopped consolidating the results of the
subsidiary. Revenues grew organically by 14.9% due to higher volumes and price increases.
Latin America South Operations
Latin America South’s net sales were R$3,857.3 million in 2010, compared to R$3,826.5 million in 2009,
yielding a growth of 0.8% in the period. The main reason for this weak growth was the devaluation of the Argentine
Peso compared against the Brazilian Real that offset organic growth of 15.2% in revenue per hectoliter reaching
R$113.9.
Canada Operations
Labatt’s operations in Canada contributed R$3,665.6 million to Ambev’s consolidated revenues in 2010, a
decrease of -7.3% comparing to last year. This result is explained by a revenue per hectoliter decrease of -4.2%
driven by promotional activity, impacted also by a sales volume decrease of -3.2% in the Canadian market, resulting
from a decline in beer consumption and a market share loss.
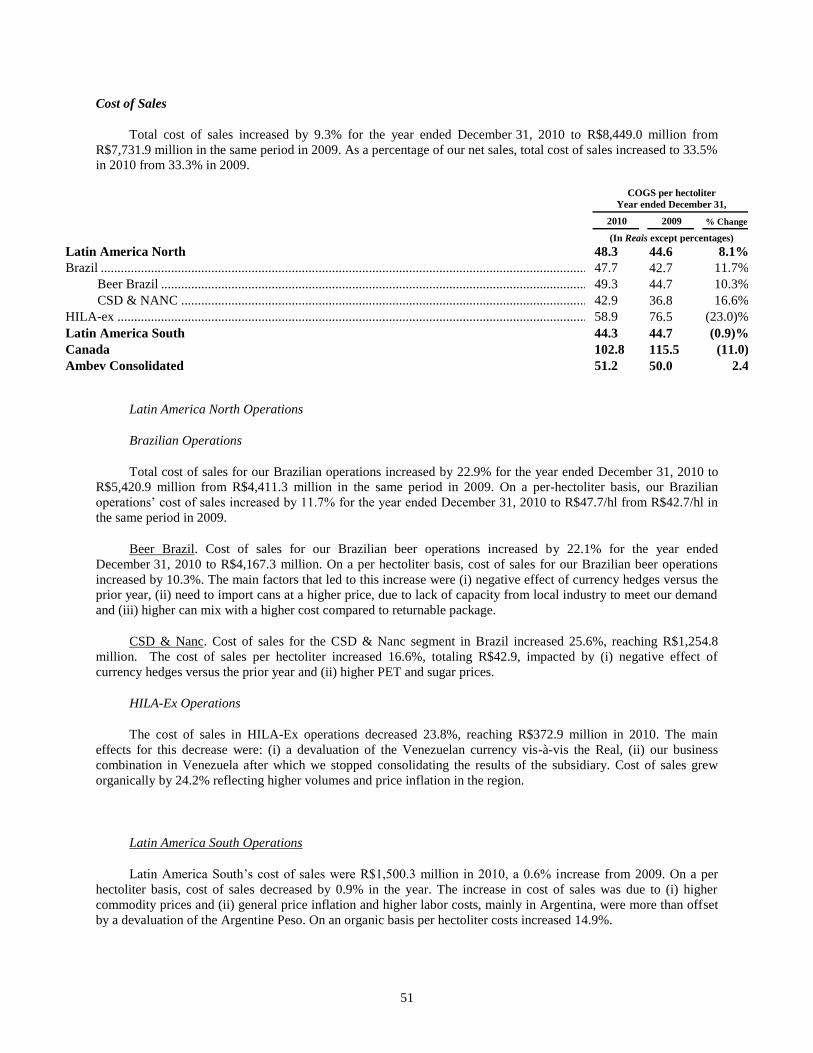
51
Cost of Sales
Total cost of sales increased by 9.3% for the year ended December 31, 2010 to R$8,449.0 million from
R$7,731.9 million in the same period in 2009. As a percentage of our net sales, total cost of sales increased to 33.5%
in 2010 from 33.3% in 2009.
COGS per hectoliter
Year ended December 31,
2010
2009
% Change
(In Reais except percentages) Latin America North 48.3 44.6 8.1% Brazil ............................................................................................................................................................... 47.7 42.7 11.7%
Beer Brazil ............................................................................................................................................. 49.3 44.7 10.3% CSD & NANC ....................................................................................................................................... 42.9 36.8 16.6%
HILA-ex .......................................................................................................................................................... 58.9 76.5 (23.0)% Latin America South 44.3 44.7 (0.9)% Canada 102.8 115.5 (11.0) Ambev Consolidated 51.2 50.0 2.4
Latin America North Operations
Brazilian Operations
Total cost of sales for our Brazilian operations increased by 22.9% for the year ended December 31, 2010 to
R$5,420.9 million from R$4,411.3 million in the same period in 2009. On a per-hectoliter basis, our Brazilian
operations’ cost of sales increased by 11.7% for the year ended December 31, 2010 to R$47.7/hl from R$42.7/hl in
the same period in 2009.
Beer Brazil. Cost of sales for our Brazilian beer operations increased by 22.1% for the year ended
December 31, 2010 to R$4,167.3 million. On a per hectoliter basis, cost of sales for our Brazilian beer operations
increased by 10.3%. The main factors that led to this increase were (i) negative effect of currency hedges versus the
prior year, (ii) need to import cans at a higher price, due to lack of capacity from local industry to meet our demand
and (iii) higher can mix with a higher cost compared to returnable package.
CSD & Nanc. Cost of sales for the CSD & Nanc segment in Brazil increased 25.6%, reaching R$1,254.8
million. The cost of sales per hectoliter increased 16.6%, totaling R$42.9, impacted by (i) negative effect of
currency hedges versus the prior year and (ii) higher PET and sugar prices.
HILA-Ex Operations
The cost of sales in HILA-Ex operations decreased 23.8%, reaching R$372.9 million in 2010. The main
effects for this decrease were: (i) a devaluation of the Venezuelan currency vis-à-vis the Real, (ii) our business
combination in Venezuela after which we stopped consolidating the results of the subsidiary. Cost of sales grew
organically by 24.2% reflecting higher volumes and price inflation in the region.
Latin America South Operations
Latin America South’s cost of sales were R$1,500.3 million in 2010, a 0.6% increase from 2009. On a per
hectoliter basis, cost of sales decreased by 0.9% in the year. The increase in cost of sales was due to (i) higher
commodity prices and (ii) general price inflation and higher labor costs, mainly in Argentina, were more than offset
by a devaluation of the Argentine Peso. On an organic basis per hectoliter costs increased 14.9%.
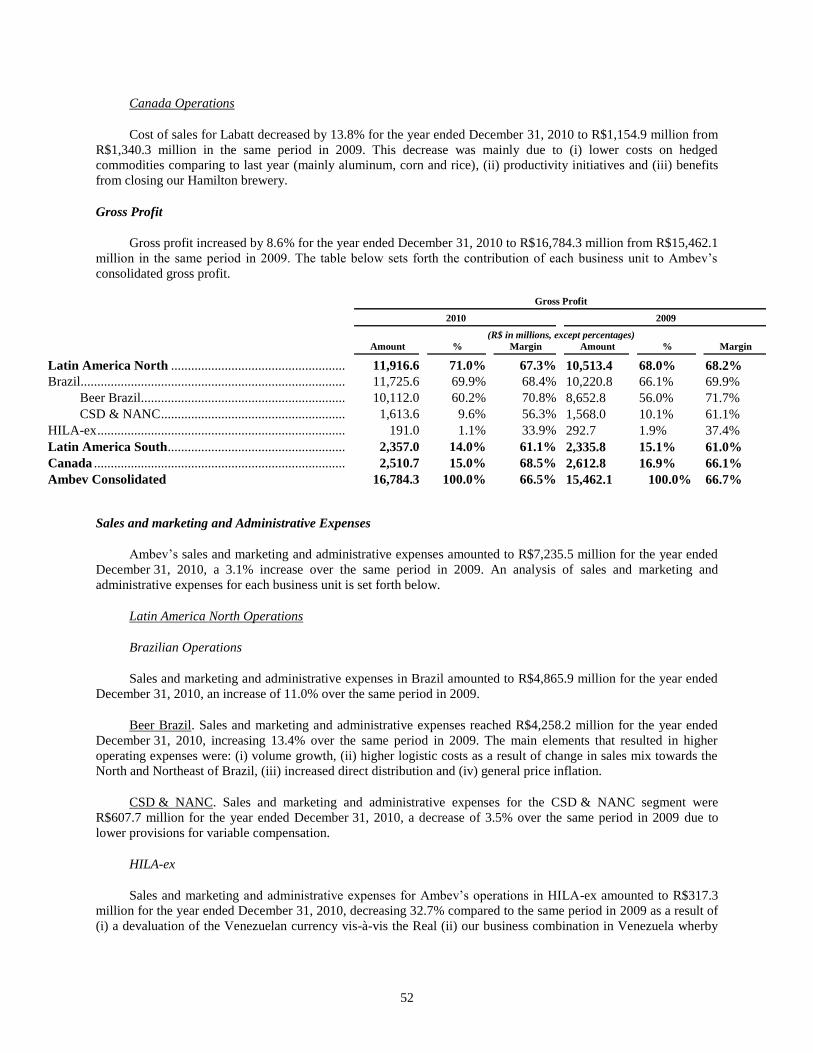
52
Canada Operations
Cost of sales for Labatt decreased by 13.8% for the year ended December 31, 2010 to R$1,154.9 million from
R$1,340.3 million in the same period in 2009. This decrease was mainly due to (i) lower costs on hedged
commodities comparing to last year (mainly aluminum, corn and rice), (ii) productivity initiatives and (iii) benefits
from closing our Hamilton brewery.
Gross Profit
Gross profit increased by 8.6% for the year ended December 31, 2010 to R$16,784.3 million from R$15,462.1
million in the same period in 2009. The table below sets forth the contribution of each business unit to Ambev’s
consolidated gross profit.
Gross Profit
2010
2009
(R$ in millions, except percentages)
Amount
%
Margin
Amount
%
Margin
Latin America North ....................................................................................... 11,916.6 71.0% 67.3% 10,513.4 68.0% 68.2% Brazil.................................................................................................................. 11,725.6 69.9% 68.4% 10,220.8 66.1% 69.9%
Beer Brazil................................................................................................ 10,112.0 60.2% 70.8% 8,652.8 56.0% 71.7% CSD & NANC .......................................................................................... 1,613.6 9.6% 56.3% 1,568.0 10.1% 61.1%
HILA-ex ............................................................................................................. 191.0 1.1% 33.9% 292.7 1.9% 37.4% Latin America South........................................................................................ 2,357.0 14.0% 61.1% 2,335.8 15.1% 61.0% Canada .............................................................................................................. 2,510.7 15.0% 68.5% 2,612.8 16.9% 66.1% Ambev Consolidated 16,784.3 100.0% 66.5% 15,462.1 100.0% 66.7%
Sales and marketing and Administrative Expenses
Ambev’s sales and marketing and administrative expenses amounted to R$7,235.5 million for the year ended
December 31, 2010, a 3.1% increase over the same period in 2009. An analysis of sales and marketing and
administrative expenses for each business unit is set forth below.
Latin America North Operations
Brazilian Operations
Sales and marketing and administrative expenses in Brazil amounted to R$4,865.9 million for the year ended
December 31, 2010, an increase of 11.0% over the same period in 2009.
Beer Brazil. Sales and marketing and administrative expenses reached R$4,258.2 million for the year ended
December 31, 2010, increasing 13.4% over the same period in 2009. The main elements that resulted in higher
operating expenses were: (i) volume growth, (ii) higher logistic costs as a result of change in sales mix towards the
North and Northeast of Brazil, (iii) increased direct distribution and (iv) general price inflation.
CSD & NANC. Sales and marketing and administrative expenses for the CSD & NANC segment were
R$607.7 million for the year ended December 31, 2010, a decrease of 3.5% over the same period in 2009 due to
lower provisions for variable compensation.
HILA-ex
Sales and marketing and administrative expenses for Ambev’s operations in HILA-ex amounted to R$317.3
million for the year ended December 31, 2010, decreasing 32.7% compared to the same period in 2009 as a result of
(i) a devaluation of the Venezuelan currency vis-à-vis the Real (ii) our business combination in Venezuela wherby
53
we stopped consolidating the results of the subsidiary. Organically, grew 10.8% a result of higher volumes and
general price inflation in the region.
Latin America South Operations
Sales and marketing and administrative expenses totaled R$861.3 million for the year ended December 31,
2010, increasing 0.7% over the same period in 2009. The increase of 16.2% was due to higher transportation and
labor costs caused by high inflation in Argentina, additional marketing spend to support the launch of innovations,
and higher personnel related costs which were mostly offset by the devaluation of the Argentine Peso.
Canada Operations
Labatt’s sales and marketing and administrative expenses was R$1,190.9 million for the year ended
December 31, 2010, a decrease of 9.0% as compared to 2009 due to lower sales volume and reduced variable
compensation expense.
Other Operating Income (Expense)
Other operating income in 2010 represented a net gain of R$ 624.9 million compared to R$539.3 million in
2009. The result is composed of (i) a gain of R$415.1 million related to government grants as a result of fiscal
incentives granted by some Brazilian States with respect to value added taxes on sales (ICMS) (ii) a gain of R$52.3
million related to tax credits recovered from previous years and (iii) a gain of R$155.1 million due to gains on net
present value adjustment of long term fiscal incentives financing.
Special items
Special items were an expense of R$150.8 million in 2010 explained by (i) merger and acquisition expenses
and losses related to the transaction with Cervecería Regional in Venezuela; and (ii) Labatt Hamilton brewery
closure expenses, compared to a R$196.6 million special item income in 2009, primarily due to gains from the
perpetual license of the Labatt brands in the United States.
Income from operations
Income from operations increased by 9.2% for the year ended December 31, 2010 to R$10,022.9 million from
R$9,177.9 million in the same period in 2009, primarily as a result of higher gross profit partially compensated by
higher sales and marketing and administrative expenses.
Net Finance Cost
Our financial result was an expense of R$319.4 million, compared to an expense in 2009 of R$982.1 million.
This result is explained primarily by: (i) higher interest income due to higher average cash and cash equivalents and
short term investments compared to 2009, (ii) lower interest expense due to the retirement of certain debt that
matured during the period and was not renewed.
Ambev’s total indebtedness decreased R$490.8 million compared to 2009, while its cash and cash equivalents and
short term investments increased R$2.880.0 million, reflecting the Company’s strong cash generation in 2010. As a
result, Ambev’s net debt decreased by R$3,370.8 million.
Income Tax Expense
Our consolidated income tax and social contribution for the year ended December 31, 2010 was a charge of
R$2,084.4 million, 5.6% lower than R$2,208.1 million charge in 2009. Our effective income tax rate for the year
ended December 31, 2010 was 21.5%, against 26.9% in 2009. The main reasons behind our tax rate decrease during
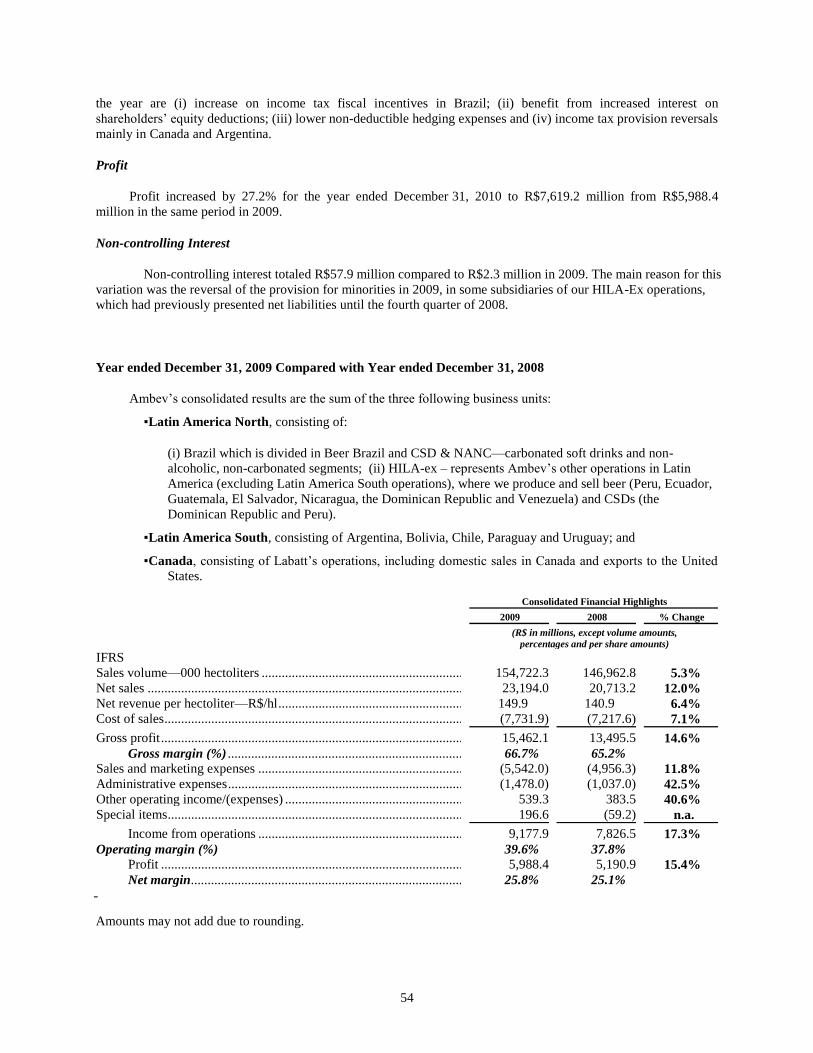
54
the year are (i) increase on income tax fiscal incentives in Brazil; (ii) benefit from increased interest on
shareholders’ equity deductions; (iii) lower non-deductible hedging expenses and (iv) income tax provision reversals
mainly in Canada and Argentina.
Profit
Profit increased by 27.2% for the year ended December 31, 2010 to R$7,619.2 million from R$5,988.4
million in the same period in 2009.
Non-controlling Interest
Non-controlling interest totaled R$57.9 million compared to R$2.3 million in 2009. The main reason for this
variation was the reversal of the provision for minorities in 2009, in some subsidiaries of our HILA-Ex operations,
which had previously presented net liabilities until the fourth quarter of 2008.
Year ended December 31, 2009 Compared with Year ended December 31, 2008
Ambev’s consolidated results are the sum of the three following business units:
▪Latin America North, consisting of:
(i) Brazil which is divided in Beer Brazil and CSD & NANC—carbonated soft drinks and non-
alcoholic, non-carbonated segments; (ii) HILA-ex – represents Ambev’s other operations in Latin
America (excluding Latin America South operations), where we produce and sell beer (Peru, Ecuador,
Guatemala, El Salvador, Nicaragua, the Dominican Republic and Venezuela) and CSDs (the
Dominican Republic and Peru).
▪Latin America South, consisting of Argentina, Bolivia, Chile, Paraguay and Uruguay; and
▪Canada, consisting of Labatt’s operations, including domestic sales in Canada and exports to the United
States.
Consolidated Financial Highlights
2009
2008
% Change
(R$ in millions, except volume amounts,
percentages and per share amounts) IFRS
Sales volume—000 hectoliters .......................................................................................................... 154,722.3 146,962.8 5.3% Net sales ............................................................................................................................................ 23,194.0 20,713.2 12.0% Net revenue per hectoliter—R$/hl ..................................................................................................... 149.9 140.9 6.4% Cost of sales ....................................................................................................................................... (7,731.9) (7,217.6) 7.1%
Gross profit ........................................................................................................................................ 15,462.1 13,495.5 14.6% Gross margin (%) .................................................................................................................... 66.7% 65.2%
Sales and marketing expenses ........................................................................................................... (5,542.0) (4,956.3) 11.8% Administrative expenses .................................................................................................................... (1,478.0) (1,037.0) 42.5% Other operating income/(expenses) ................................................................................................... 539.3 383.5 40.6% Special items ...................................................................................................................................... 196.6 (59.2) n.a.
Income from operations ........................................................................................................... 9,177.9 7,826.5 17.3% Operating margin (%) 39.6% 37.8%
Profit ........................................................................................................................................ 5,988.4 5,190.9 15.4% Net margin ............................................................................................................................... 25.8% 25.1%
Amounts may not add due to rounding.
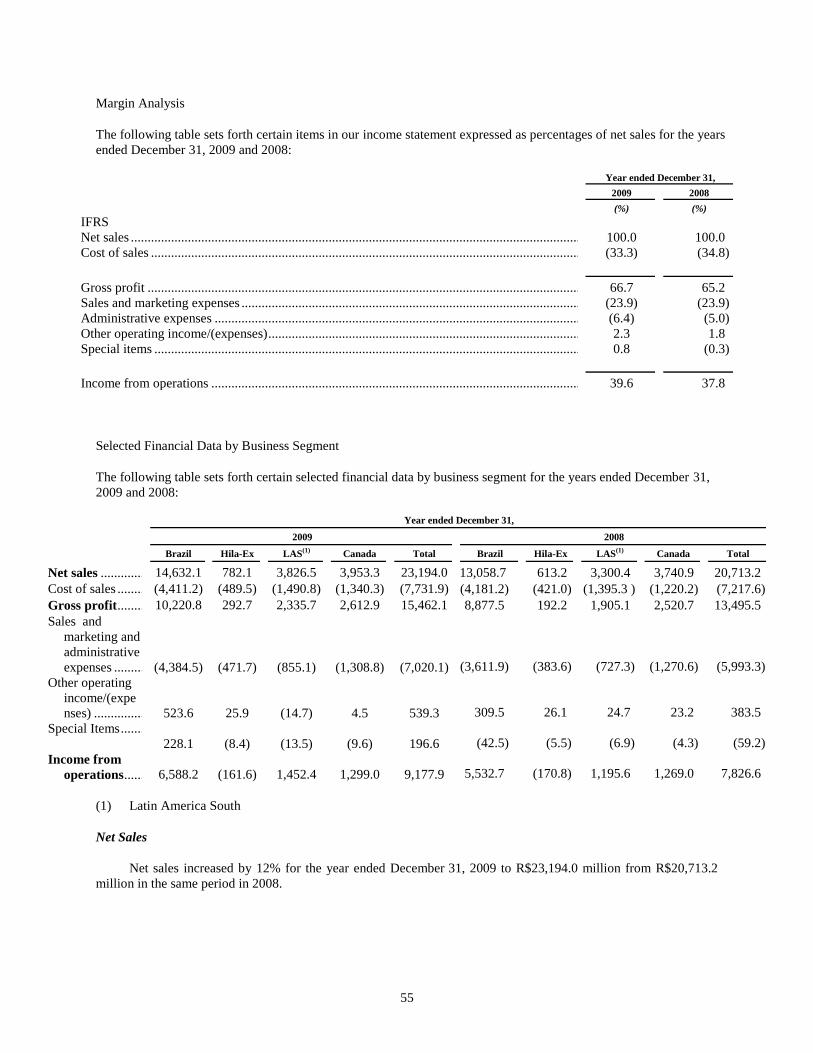
55
Margin Analysis
The following table sets forth certain items in our income statement expressed as percentages of net sales for the years
ended December 31, 2009 and 2008:
Year ended December 31,
2009
2008
(%) (%) IFRS
Net sales ................................................................................................................................................... 100.0 100.0 Cost of sales ............................................................................................................................................. (33.3) (34.8)
Gross profit .............................................................................................................................................. 66.7 65.2 Sales and marketing expenses .................................................................................................................. (23.9) (23.9) Administrative expenses .......................................................................................................................... (6.4) (5.0) Other operating income/(expenses) .......................................................................................................... 2.3 1.8 Special items ............................................................................................................................................ 0.8 (0.3)
Income from operations ........................................................................................................................... 39.6 37.8
Selected Financial Data by Business Segment
The following table sets forth certain selected financial data by business segment for the years ended December 31,
2009 and 2008:
Year ended December 31,
2009
2008
Brazil
Hila-Ex
LAS(1)
Canada
Total
Brazil
Hila-Ex
LAS(1)
Canada
Total
Net sales ........................... 14,632.1 782.1 3,826.5 3,953.3 23,194.0 13,058.7 613.2 3,300.4 3,740.9 20,713.2 Cost of sales ...................... (4,411.2) (489.5) (1,490.8) (1,340.3) (7,731.9) (4,181.2) (421.0) (1,395.3 ) (1,220.2) (7,217.6) Gross profit ...................... 10,220.8 292.7 2,335.7 2,612.9 15,462.1 8,877.5 192.2 1,905.1 2,520.7 13,495.5 Sales and
marketing and
administrative
expenses .......................
(4,384.5)
(471.7)
(855.1)
(1,308.8)
(7,020.1) (3,611.9) (383.6) (727.3) (1,270.6) (5,993.3) Other operating
income/(expe
nses) .............................
523.6
25.9
(14.7)
4.5
539.3 309.5 26.1 24.7 23.2 383.5 Special Items .....................
228.1
(8.4)
(13.5)
(9.6)
196.6 (42.5) (5.5) (6.9) (4.3) (59.2) Income from
operations ....................
6,588.2
(161.6)
1,452.4
1,299.0
9,177.9 5,532.7 (170.8) 1,195.6 1,269.0 7,826.6
(1) Latin America South
Net Sales
Net sales increased by 12% for the year ended December 31, 2009 to R$23,194.0 million from R$20,713.2
million in the same period in 2008.
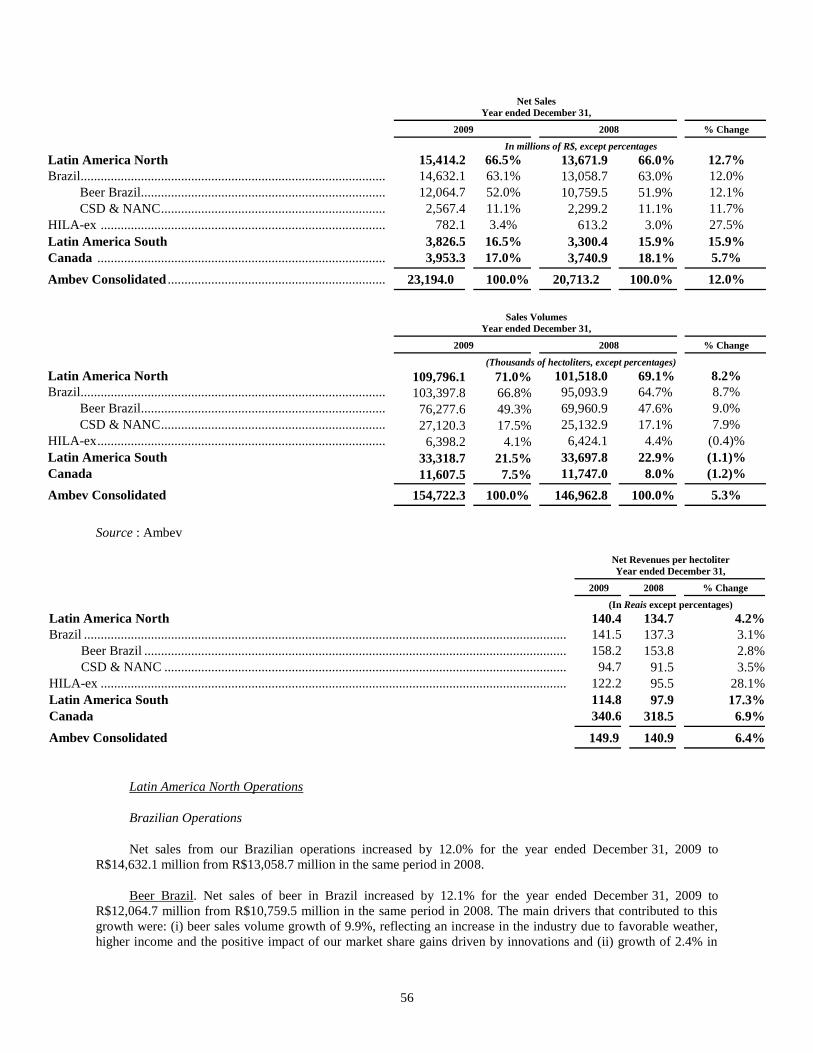
56
Net Sales Year ended December 31,
2009
2008
% Change
In millions of R$, except percentages Latin America North 15,414.2 66.5% 13,671.9 66.0% 12.7% Brazil........................................................................................................................ 14,632.1 63.1% 13,058.7 63.0% 12.0%
Beer Brazil...................................................................................................... 12,064.7 52.0% 10,759.5 51.9% 12.1% CSD & NANC ................................................................................................ 2,567.4 11.1% 2,299.2 11.1% 11.7%
HILA-ex .................................................................................................................. 782.1 3.4% 613.2 3.0% 27.5% Latin America South 3,826.5 16.5% 3,300.4 15.9% 15.9% Canada ................................................................................................................... 3,953.3 17.0% 3,740.9 18.1% 5.7%
Ambev Consolidated .............................................................................................. 23,194.0 100.0% 20,713.2 100.0% 12.0%
Sales Volumes Year ended December 31,
2009
2008
% Change
(Thousands of hectoliters, except percentages) Latin America North 109,796.1 71.0% 101,518.0 69.1% 8.2% Brazil........................................................................................................................ 103,397.8 66.8% 95,093.9 64.7% 8.7%
Beer Brazil...................................................................................................... 76,277.6 49.3% 69,960.9 47.6% 9.0% CSD & NANC ................................................................................................ 27,120.3 17.5% 25,132.9 17.1% 7.9%
HILA-ex ................................................................................................................... 6,398.2 4.1% 6,424.1 4.4% (0.4)% Latin America South 33,318.7 21.5% 33,697.8 22.9% (1.1)% Canada 11,607.5 7.5% 11,747.0 8.0% (1.2)%
Ambev Consolidated 154,722.3 100.0% 146,962.8 100.0% 5.3%
Source : Ambev
Net Revenues per hectoliter
Year ended December 31,
2009
2008
% Change
(In Reais except percentages) Latin America North 140.4 134.7 4.2% Brazil ............................................................................................................................................................... 141.5 137.3 3.1%
Beer Brazil ............................................................................................................................................. 158.2 153.8 2.8% CSD & NANC ....................................................................................................................................... 94.7 91.5 3.5%
HILA-ex .......................................................................................................................................................... 122.2 95.5 28.1% Latin America South 114.8 97.9 17.3% Canada 340.6 318.5 6.9%
Ambev Consolidated 149.9 140.9 6.4%
Latin America North Operations
Brazilian Operations
Net sales from our Brazilian operations increased by 12.0% for the year ended December 31, 2009 to
R$14,632.1 million from R$13,058.7 million in the same period in 2008.
Beer Brazil. Net sales of beer in Brazil increased by 12.1% for the year ended December 31, 2009 to
R$12,064.7 million from R$10,759.5 million in the same period in 2008. The main drivers that contributed to this
growth were: (i) beer sales volume growth of 9.9%, reflecting an increase in the industry due to favorable weather,
higher income and the positive impact of our market share gains driven by innovations and (ii) growth of 2.4% in
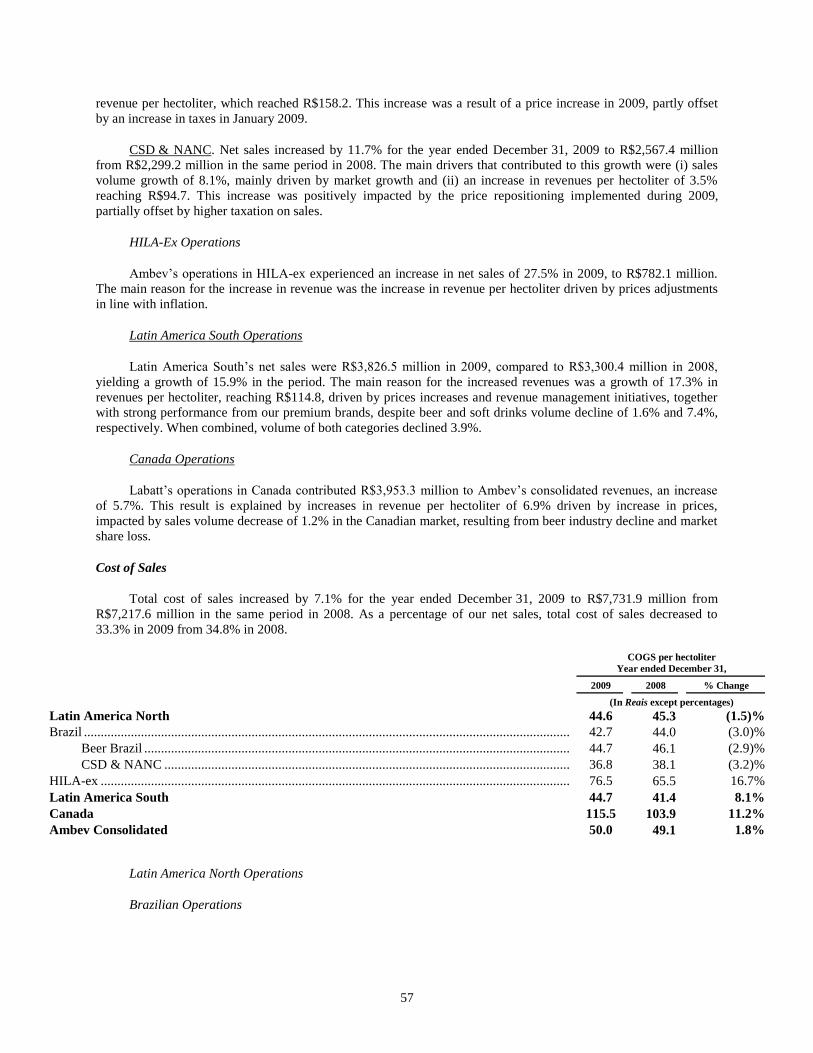
57
revenue per hectoliter, which reached R$158.2. This increase was a result of a price increase in 2009, partly offset
by an increase in taxes in January 2009.
CSD & NANC. Net sales increased by 11.7% for the year ended December 31, 2009 to R$2,567.4 million
from R$2,299.2 million in the same period in 2008. The main drivers that contributed to this growth were (i) sales
volume growth of 8.1%, mainly driven by market growth and (ii) an increase in revenues per hectoliter of 3.5%
reaching R$94.7. This increase was positively impacted by the price repositioning implemented during 2009,
partially offset by higher taxation on sales.
HILA-Ex Operations
Ambev’s operations in HILA-ex experienced an increase in net sales of 27.5% in 2009, to R$782.1 million.
The main reason for the increase in revenue was the increase in revenue per hectoliter driven by prices adjustments
in line with inflation.
Latin America South Operations
Latin America South’s net sales were R$3,826.5 million in 2009, compared to R$3,300.4 million in 2008,
yielding a growth of 15.9% in the period. The main reason for the increased revenues was a growth of 17.3% in
revenues per hectoliter, reaching R$114.8, driven by prices increases and revenue management initiatives, together
with strong performance from our premium brands, despite beer and soft drinks volume decline of 1.6% and 7.4%,
respectively. When combined, volume of both categories declined 3.9%.
Canada Operations
Labatt’s operations in Canada contributed R$3,953.3 million to Ambev’s consolidated revenues, an increase
of 5.7%. This result is explained by increases in revenue per hectoliter of 6.9% driven by increase in prices,
impacted by sales volume decrease of 1.2% in the Canadian market, resulting from beer industry decline and market
share loss.
Cost of Sales
Total cost of sales increased by 7.1% for the year ended December 31, 2009 to R$7,731.9 million from
R$7,217.6 million in the same period in 2008. As a percentage of our net sales, total cost of sales decreased to
33.3% in 2009 from 34.8% in 2008.
COGS per hectoliter
Year ended December 31,
2009
2008
% Change
(In Reais except percentages) Latin America North 44.6 45.3 (1.5)% Brazil ............................................................................................................................................................... 42.7 44.0 (3.0)%
Beer Brazil ............................................................................................................................................. 44.7 46.1 (2.9)% CSD & NANC ....................................................................................................................................... 36.8 38.1 (3.2)%
HILA-ex .......................................................................................................................................................... 76.5 65.5 16.7% Latin America South 44.7 41.4 8.1% Canada 115.5 103.9 11.2% Ambev Consolidated 50.0 49.1 1.8%
Latin America North Operations
Brazilian Operations
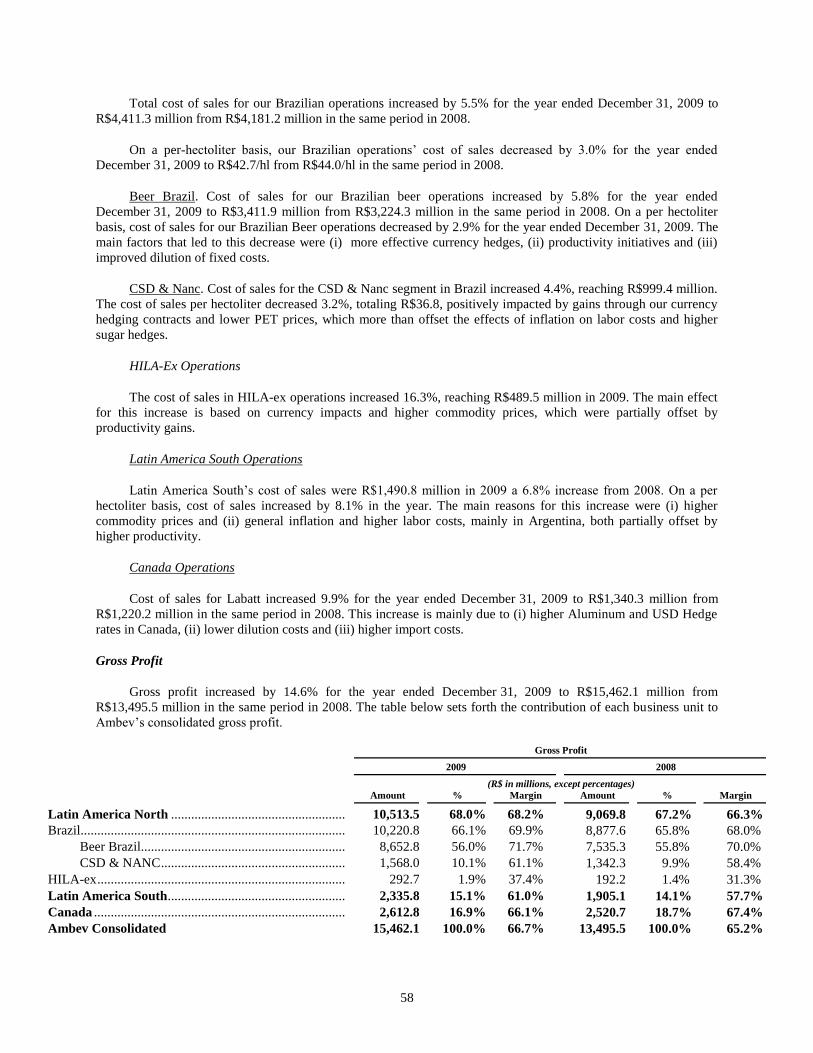
58
Total cost of sales for our Brazilian operations increased by 5.5% for the year ended December 31, 2009 to
R$4,411.3 million from R$4,181.2 million in the same period in 2008.
On a per-hectoliter basis, our Brazilian operations’ cost of sales decreased by 3.0% for the year ended
December 31, 2009 to R$42.7/hl from R$44.0/hl in the same period in 2008.
Beer Brazil. Cost of sales for our Brazilian beer operations increased by 5.8% for the year ended
December 31, 2009 to R$3,411.9 million from R$3,224.3 million in the same period in 2008. On a per hectoliter
basis, cost of sales for our Brazilian Beer operations decreased by 2.9% for the year ended December 31, 2009. The
main factors that led to this decrease were (i) more effective currency hedges, (ii) productivity initiatives and (iii)
improved dilution of fixed costs.
CSD & Nanc. Cost of sales for the CSD & Nanc segment in Brazil increased 4.4%, reaching R$999.4 million.
The cost of sales per hectoliter decreased 3.2%, totaling R$36.8, positively impacted by gains through our currency
hedging contracts and lower PET prices, which more than offset the effects of inflation on labor costs and higher
sugar hedges.
HILA-Ex Operations
The cost of sales in HILA-ex operations increased 16.3%, reaching R$489.5 million in 2009. The main effect
for this increase is based on currency impacts and higher commodity prices, which were partially offset by
productivity gains.
Latin America South Operations
Latin America South’s cost of sales were R$1,490.8 million in 2009 a 6.8% increase from 2008. On a per
hectoliter basis, cost of sales increased by 8.1% in the year. The main reasons for this increase were (i) higher
commodity prices and (ii) general inflation and higher labor costs, mainly in Argentina, both partially offset by
higher productivity.
Canada Operations
Cost of sales for Labatt increased 9.9% for the year ended December 31, 2009 to R$1,340.3 million from
R$1,220.2 million in the same period in 2008. This increase is mainly due to (i) higher Aluminum and USD Hedge
rates in Canada, (ii) lower dilution costs and (iii) higher import costs.
Gross Profit
Gross profit increased by 14.6% for the year ended December 31, 2009 to R$15,462.1 million from
R$13,495.5 million in the same period in 2008. The table below sets forth the contribution of each business unit to
Ambev’s consolidated gross profit.
Gross Profit
2009
2008
(R$ in millions, except percentages)
Amount
%
Margin
Amount
%
Margin
Latin America North ....................................................................................... 10,513.5 68.0% 68.2% 9,069.8 67.2% 66.3% Brazil.................................................................................................................. 10,220.8 66.1% 69.9% 8,877.6 65.8% 68.0%
Beer Brazil................................................................................................ 8,652.8 56.0% 71.7% 7,535.3 55.8% 70.0% CSD & NANC .......................................................................................... 1,568.0 10.1% 61.1% 1,342.3 9.9% 58.4%
HILA-ex ............................................................................................................. 292.7 1.9% 37.4% 192.2 1.4% 31.3% Latin America South........................................................................................ 2,335.8 15.1% 61.0% 1,905.1 14.1% 57.7% Canada .............................................................................................................. 2,612.8 16.9% 66.1% 2,520.7 18.7% 67.4% Ambev Consolidated 15,462.1 100.0% 66.7% 13,495.5 100.0% 65.2%
59
Sales and marketing and Administrative Expenses
Ambev’s sales and marketing and administrative expenses amounted to R$7,020.1 million for the year ended
December 31, 2009, a 17.1% increase over the same period in 2008. An analysis of sales and marketing and
administrative expenses at each business unit is set forth below.
Latin America North Operations
Brazilian Operations
Sales and marketing and administrative expenses in Brazil amounted to R$4,384.5 million for the year ended
December 31, 2009, an increase of 21.4% over the same period in 2008.
Beer Brazil. Sales and marketing and administrative expenses reached R$3,754.4 million for the year ended
December 31, 2009, increasing 21.3% over the same period in 2008. The main elements that resulted in higher
operating expenses were: (i) volume growth, (ii) higher accruals for variable compensation, (iii) market investments
to support the launch of innovations throughout the year and (iv) general inflation.
CSD & NANC. Sales and marketing and administrative expenses for the CSD & NANC segment were
R$630.0 million for the year ended December 31, 2009, an increase of 22.0% over the same period in 2008. The
main elements that generated higher operating expenses were inflation, higher accruals for variable compensation
and market investments.
HILA-ex
Sales and marketing and administrative expenses for Ambev’s operations in HILA-ex amounted to R$471.7
million for the year ended December 31, 2009, increasing 23.0% compared to the same period in 2008 primarily as a
result of general inflation, mainly in Venezuela, which were partially offset by gains on fixed costs.
Latin America South Operations
Sales and marketing and administrative expenses totaled R$855.1 million for the year ended December 31,
2009, increasing 17.6% over the same period in 2008. This increase is mostly explained by higher transportation and
labor costs caused by inflation, additional marketing spend to support the launch of innovations, and higher
personnel related costs.
Canada Operations
Labatt’s sales and marketing and administrative expenses was R$1,308.8 million for the year ended
December 31, 2009, an increase of 3.0% as compared to 2008. In Canadian dollars, sales and marketing and
administrative expenses were almost flat against 2008, as a result of focus on fixed cost reduction as a way to reduce
pressure on cost on year's result.
Other Operating Income (Expense)
Other operating income in 2009 represented a net gain of R$539.3 million compared to R$383.5 million in
2008.
The breakdown of the main items is provided below:
(i) gain of R$303.7 million related to government grants as a result of fiscal incentives granted by some
Brazilian States with respect to a value added tax in sales (ICMS); and
(ii) gain of R$127.2 million related to tax credits recovered from previous years.
60
Special items
Special items totaled R$196.6 million income in 2009, compared to R$59.2 million special item expenses in
2008, primarily due to gains from the perpetual license of the Labatt brands in the United States.
Income from operations
Income from operations increased by 17.3% for the year ended December 31, 2009 to R$9,177.9 million from
R$7,826.5 million in the same period in 2008, primarily as a result of higher gross profit which was partly offset by
higher sales and marketing expenses.
Net Finance Cost
Our financial result was an expense of R$982.1 million, compared to an expense in 2008 of R$1,190.8
million. This results is explained by: (i) lower net interest expenses due to the retirement of certain debt that matured
during the period and was not renewed, (ii) losses with respect to derivative instruments, which relate to the results
of our ongoing hedging policy and (iii) higher other financial expenses.
Ambev’s total indebtedness decreased R$3,396.6 million compared to 2008, while its cash and cash
equivalents increased R$744.3 million, highlighting the Company’s strong cash generation in 2009. As a result,
there was a decrease of R$4,140.9 million in Ambev’s net debt.
Income Tax Expense
Our consolidated income tax and social contribution for the year ended December 31, 2009 was a charge of
R$2,208.1 million, up 52.5% from R$1,447.2 million in 2008. At our weighted nominal tax rate of 32.5%, income
tax for the year ended December 31, 2009 would have amounted to R$2,540.6 million. Our effective income tax
rate in the year ended December 31, 2009 was 26.9%, against 21.8% in 2008. The main reasons behind our tax rate
increase during the year are some hedge expenses that are non-deductible and tax deferred liabilities over earnings
of foreign subsidiaries, plus a higher EBT, which is taxable at a full rate.
Profit
Profit increased by 15.4% for the year ended December 31, 2009 to R$5,988.4 million from R$5,190.9
million in the same period in 2008.
Non-controlling Interest
Non-controlling interest totaled R$2.3 million compared to R$71.8 million in 2008. The main reason for this variation
was the reversal of the provision for minorities, in some subsidiaries of our HILA-Ex operations, which had previously
presented net liabilities until the fourth quarter of 2008.
B. Liquidity and Capital Resources
Liquidity and Capital Resources
The information in this section refers to the years 2010 and 2009. Our primary sources of liquidity have
historically been cash flows from operating activities and borrowings. Our material cash requirements have included
the following:
▪Debt service;
▪Capital expenditures;
▪Share buyback program;
▪Payments of dividends and interest on shareholders’ equity;
61
▪Increases in ownership of our consolidated subsidiaries or companies in which we have equity
investments; and
▪Investments in companies participating in the brewing, CSD and malting industries.
Our cash and cash equivalents and current investment securities net of bank overdrafts at December 31, 2010
and 2009 were R$6,977.6 million and R$4,097.6 million, respectively.
We believe that cash flows from operating activities, available cash and cash equivalents and short-term
investments, along with our derivative instruments and our access to borrowing facilities, will be sufficient to fund
our capital expenditures, debt service and dividend payments going forward.
Cash Flows
Operating Activities
Our cash flows from operating activities increased 15.7% to R$10,062.8 million for the year ended
December 31, 2010, compared to R$8,697.1 million for the same period in 2009. This increase was due primarily to
an increase of R$1,039.6 million in cash generated from operations, and a increase of R$638.8 million in the income
taxes paid during the year, partly offset by a decrease of R$312.6 million in interest paid during the year.
Investing Activities
Cash flows used in our investing activities for the year ended December 31, 2010 totaled R$3.174,2 million,
compared to R$1,551.8 million for the same period in 2009. The increase of cash used in investing activity was due
primarily to the acquisition of Brazilian government bonds (fixed rate) of R$1.067,5, investments in capacity
expansion, new plants and new distribution centers totaling R$2,286.8, an increase of R$848.0 million comparing to
2009.
Financing Activities
Cash flows used in financing activities for the year ended December 31, 2010 amounted to R$4,861.6 million
compared to R$5,929.0 million for the same period in 2009. The decrease of R$1,067.4 million was principally due
to an increase in dividends paid of R$1.470,3 million compared to 2009, partially offset by lower debt repayments
in 2010 compared to 2009. This reduction of R$2,527.0 million is explained by: (i) promissory note issued on April
15, 2008 of R$1,500.0 million, matured in April 13, 2009 and (ii) debenture issued on July 1
, 2006 of R$817.1
million, matured in July 1, 2009.
As of December 31, 2010, our outstanding debt totaled R$6,770.4 million of which R$2,606.2 million was
short-term debt, including current-portion of long term debt. Our debt consisted of R$ 3,974.2 million of local
currency-denominated debt and R$ 2,796.2 million of foreign currency-denominated debt.
The table below shows the profile of our debt instruments:
Ambev Profile as of December 31, 2010
(R$ million)
Debt Instruments 2011 2012 2013 2014 2015 Thereafter Total
U.S Dollar Denominated Debt Fixed Rate
Notional Amount (884.3)
(886.7)
(1,770.9)
Average Pay Rate 10.50%
8.75%
9.62%
BNDES Currency Basket Debt Float. Rate
Currency Basket Debt Floating Rate
(23.62)
(26.42)
(26.42)
(21.58)
(98.0)
62
UMBNDES + Average Pay Rate 1.81% 1.81% 1.81% 1.81%
1.81%
International Debt
Reais Denominated Debt Fixed Rate
(716.6)
(473.1)
(1,189.6)
Average Pay Rate 15.88% 12.13%
14.39%
International Debt
CAN Denominated Debt Float Rate – BA
(300.8)
(300.8)
BA + Average Pay Rate
0.35%
0.35%
International Debt
CAN Denominated Debt Fixed Rate (157.9)
(157.9)
Average Pay Rate 7.50%
7.50%
International Debt
Other Latin America Currency Fixed Rate
(108.82)
(49.30)
(5.40)
(1.17)
(10.79)
(175.5)
Average Pay Rate 12.4% 8.9% 7.75% 7.75%
7.75% 10.97%
International Debt
USD Denominated Debt Fixed Rate
(230.10)
(99.97)
(330.1)
Average Pay Rate 5.96% 7.38%
6.39%
Reais Denominated Debt Float. Rate - TJLP
Notional Amount
(202.11)
(130.40)
(249.07)
(163.35)
(9.68)
(754.6)
TJLP + Average Pay Rate 2.03% 2.03% 2.03% 2.03%
2.03% 2.03%
Reais Debt - ICMS Fixed Rate
Notional Amount
(9.58)
(21.91)
(22.37)
(15.51)
(14.21)
(37.21)
(120.8)
Average Pay Rate 2.69% 2.69% 2.69% 2.69% 2.69% 2.69% 2.69%
Reais Debt - Debentures Floating Rate – CDI
Notional Amount
(1,247.48)
(1,247.4)
Average Pay Rate % CDI
102.50%
102.50%
Reais Debt - Fixed Rate
Notional Amount (273.29) (66.67)
(284.77) (624.7)
Average Pay Rate 10.37% 10.47% 0.00% 0.00% 0.00% 9.50% 9.99%
Total Debt
(2,606.2)
(2,416.0)
(1,189.9)
(201.6)
(14.2)
(342.4)
(6,770.4)
Borrowings
Most of our borrowings are for general use, based upon strategic capital structure considerations. Although
seasonal factors affect the business, they have little effect on our borrowing requirements. We accrue interest based
on different interest rates, the most significant of which are: (i) fixed, for the 2011 bonds, 2013 bonds, 2017 bonds
and Labatt’s Brazilian Real Loan; (ii) Currency Basket (―UMBNDES‖) and Taxa de Juros de Longo Prazo
(―TJLP‖) for BNDES loans; (iii) CDI for debentures; and (iv) Banker’s Acceptance (BA) for Labatt’s C$
denominated debt. For further information, see Note 23 of our Consolidated Financial Statements. The following
tables set forth our net debt consolidated position as of December 31, 2010 and 2009:
Net Debt Consolidated Position
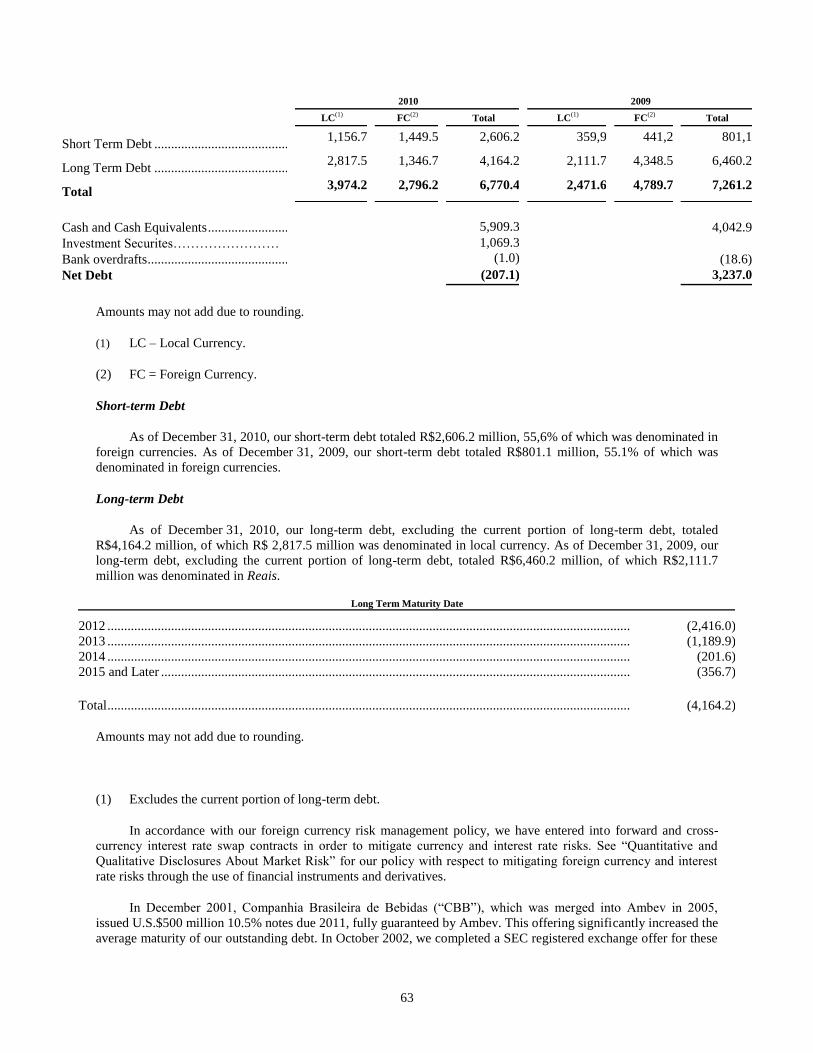
63
2010
2009
LC(1)
FC(2)
Total
LC(1)
FC(2)
Total
Short Term Debt ......................................................................................... 1,156.7 1,449.5 2,606.2 359,9 441,2 801,1
Long Term Debt ......................................................................................... 2,817.5 1,346.7 4,164.2 2,111.7 4,348.5 6,460.2
Total 3,974.2 2,796.2 6,770.4 2,471.6 4,789.7 7,261.2
Cash and Cash Equivalents ......................................................................... 5,909.3 4,042.9
Investment Securites……………………
Bank overdrafts ...........................................................................................
1,069.3
(1.0) (18.6)
Net Debt (207.1) 3,237.0
Amounts may not add due to rounding.
(1) LC – Local Currency.
(2) FC = Foreign Currency.
Short-term Debt
As of December 31, 2010, our short-term debt totaled R$2,606.2 million, 55,6% of which was denominated in
foreign currencies. As of December 31, 2009, our short-term debt totaled R$801.1 million, 55.1% of which was
denominated in foreign currencies.
Long-term Debt
As of December 31, 2010, our long-term debt, excluding the current portion of long-term debt, totaled
R$4,164.2 million, of which R$ 2,817.5 million was denominated in local currency. As of December 31, 2009, our
long-term debt, excluding the current portion of long-term debt, totaled R$6,460.2 million, of which R$2,111.7
million was denominated in Reais.
Long Term Maturity Date
2012 ............................................................................................................................................................ (2,416.0)
2013 ............................................................................................................................................................ (1,189.9)
2014 ............................................................................................................................................................ (201.6)
2015 and Later ............................................................................................................................................ (356.7)
Total ............................................................................................................................................................ (4,164.2)
Amounts may not add due to rounding.
(1) Excludes the current portion of long-term debt.
In accordance with our foreign currency risk management policy, we have entered into forward and cross-
currency interest rate swap contracts in order to mitigate currency and interest rate risks. See ―Quantitative and
Qualitative Disclosures About Market Risk‖ for our policy with respect to mitigating foreign currency and interest
rate risks through the use of financial instruments and derivatives.
In December 2001, Companhia Brasileira de Bebidas (―CBB‖), which was merged into Ambev in 2005,
issued U.S.$500 million 10.5% notes due 2011, fully guaranteed by Ambev. This offering significantly increased the
average maturity of our outstanding debt. In October 2002, we completed a SEC registered exchange offer for these
64
notes. These notes contain certain covenants and events of default which, if triggered, cause accelerated
amortization. In September 2003, CBB issued U.S.$500 million 8.75% notes due 2013, fully guaranteed by Ambev.
These notes also contain certain covenants and events of default which, if triggered, cause accelerated amortization.
In September 2004, we completed a SEC-registered exchange offer for these notes. In both cases, the proceeds of
the notes issued were used principally to repay short-term debt, but also to finance part of Ambev’s capital
expenditure program, and also for general corporate purposes. In May 2005, upon the completion of the merger of
CBB into Ambev, Ambev became the successor to CBB under the indentures governing both the 2011 notes and the
2013 notes. Neither of these notes have any financial covenants that might limit Ambev’s ability to take on
additional debt.
On June 8, 2006, our Board of Directors approved a public offering of debentures denominated in Reais in the
Brazilian market of up to R$2,600 million. The issuance was registered with the CVM for a final amount of
R$2,065 million. Proceeds of this issuance, which closed in August 2006, were fully used to finance the purchase of
shares in Quinsa from BAC. See ―History and Development of the Company—Interest on Quinsa‖ and ―Capital
Investment Program‖.
On July 24, 2007, our 100% owned finance subsidiary, Ambev International issued R$300 million in bonds
with a fixed interest of 9.500% per annum and a maturity date of July 24, 2017 (the ―2017 bonds‖) to qualified
institutional buyers pursuant to Rule 144A under the Securities Act, and outside the United States to non–U.S.
persons in reliance on Regulation S, fully guaranteed by Ambev. The bonds are unsecured and unsubordinated
obligations of Ambev International and are fully and unconditionally guaranteed by Ambev. The guarantee ranks
equally in right of payment with all of Ambev’s other unsecured and unsubordinated debt obligations (except for
statutorily preferred credits set forth in Brazilian bankruptcy laws). The bonds are denominated in Brazilian Reais,
but both principal and interest are paid in U.S. dollars at the prevailing exchange rate at the applicable payment date.
Interest is paid semiannually in arrears, starting January 24, 2008. The net proceeds of the offering were used for the
repayment of short-term debt and for general corporate purposes by Ambev and its subsidiaries. In February 2009,
we completed a SEC-registered exchange offer for these notes.
As of December 31, 2010, our local currency long-term debt borrowings consisted primarily of the debentures
issued for the purchase of shares in Quinsa and the 2017 bonds. Long-term local currency also includes long-term
plant expansion and other loans from governmental agencies including the Brazilian Economic and Social
Development Bank - BNDES, and BNDES programs, including the Fund for Financing the Acquisition of Industrial
Machinery and Equipment (―FINAME‖), and the Financing and Endeavours (―FINEM‖).
A substantial portion of the financings incurred by Latin America South’s subsidiaries in Argentina is
denominated in U.S. dollars. The devaluation of the Argentine Peso and the economic crisis in Argentina, mainly in
2002, restricted the ability of these subsidiaries to generate sufficient cash flows to meet the obligations falling due
on the dates originally determined for liabilities denominated in foreign currency. The management of Latin
America South renegotiated the maturity terms with financial institutions.
Secured Debt
Certain loans, provided by BNDES, are secured by some of our facilities and some of our equipment (mainly
coolers).
Sales Tax Deferrals and Other Tax Credits
We currently participate in several programs by which a portion of payments of ICMS tax due from sales
generated by specific production facilities are forgiven (tax waivers) or deferred (financing) for periods of on
average six years from their original due date. In return of such programs, we are committed to meet certain
operational requirements including, depending on the state, production volume and employment targets, among
others. The total amount deferred (financing) as of December 31, 2010 was R$657.3 million with a current portion
of R$79.4 million, and R$577.9 million as non current. Percentages deferred typically range from 50% to 90% over
the life of the program. Balances deferred generally accrue interest and are partially inflation indexed, with
adjustments generally set at 60% to 80% of a general price index. The grants (tax waivers) are received over the
65
lives of the respective programs. In the years ended December 31, 2010 and 2009, we recorded R$361.2 million and
R$263.4 million, respectively, of tax credits as gains on tax incentive programs.
The State of São Paulo has challenged in the Brazilian Supreme Court state laws upon which certain of the
above benefits have been granted, on the basis that they constitute tax benefits created without certain approvals
required under Brazilian tax laws and regulations, which would render such state laws unconstitutional. Although
the Brazilian Supreme Court has already declared part of Pará state’s benefit law unconstitutional, almost every state
has specific legislation on this topic and even the State of Pará may still grant benefits which were not covered
by the decision. In this sense, insofar as the tax benefits are granted based on valid state legislation and the
operational requirements are met, most companies apply for and use these benefits when granted. Furthermore, since
2007 , we received tax assessments from the State of São Paulo in the aggregate amount of approximately
R$ 96.7 million (updated as of December 30, 2010), challenging the legality of tax credits arising from an existing
tax incentive of the Company in the State of Santa Catarina. We have treated this proceeding as a possible (but not
probable) loss. Such estimate is based on reasonable assumptions and assessments of external counsel but should we
lose such proceedings the expected net impact on our income statement would be an expense for this amount.
Moreover, we cannot rule out the possibility of other Brazilian states issuing similar tax assessments related to the
Company’s tax incentives.
Further, in 2010, the Metallurgical Worker’s Union filed 9 actions (ADIs) challenging the constitutionality of
the import benefit laws offered by some States. That may directly impact our import tax benefits and indirectly
impact our industrial tax benefits.
Capital Investment Program
In 2010, consolidated capital expenditures on property, plant and equipment and intangibles totaled R$2,286.8
million consisting of R$1,849.4 million in Latin America North, R$316.8 million related to investments in the Latin
America South’s operations and R$120.6 million related to investments in Canada. These expenditures primarily
included investments in capacity expansion, quality controls, automation, modernization and replacement of
packaging lines, innovations, warehousing for direct distribution, coolers, expenditures for the replacement of
bottles and crates, market assets from former dealers, and continued investments in information technology.
In 2009, consolidated capital expenditures on property, plant and equipment and intangibles totaled R$1,439.7
million consisting of R$1,006.0 million in Latin America North, R$311.8 million related to investments in the Latin
America South’s operations and R$121.8 million related to investments in Canada. These expenditures primarily
included investments in capacity expansion, quality controls, automation, modernization and replacement of
packaging lines, innovations, warehousing for direct distribution, coolers, expenditures for the replacement of
bottles and crates, market assets from former dealers, and continued investments in information technology.
C. Research and Development
We maintain a research and development center in the city of Guarulhos, State of São Paulo, in order to assure
continuous product innovation and yearly increases in efficiency.
D. Trend Information
For detailed information regarding the latest trends in our business, please refer to ―Year ended December 31,
2010 Compared with Year ended December 31, 2009.‖
E. Off-balance Sheet Arrangements
We have a number of off-balance sheet items which have been disclosed elsewhere in this annual report,
under Item 4.B (―Sources and Availability of Raw Materials‖) on page 35, under Item 4.B (―Packaging‖) on page 37
and under Item 17, Note 30 (―Collateral and contractual commitments with suppliers, advances from customers and
other‖) on page F-98. Off-balance sheet items include future commitments with suppliers of R$13,670 million as of
December 31, 2010, as set forth in the table below:
66
Contractual Obligations with Suppliers
(R$ in
thousand)
Purchase commitments with respect to property, plant and
equipment .......................................................................................................
887,347.0
Purchase commitments with respect to foreign currency .................................... 375,911.0
Purchase commitments with respect to raw materials ......................................... 571,521.0
Purchase commitments with respect to packaging materials ............................... 11,700,025.0
Other purchase commitments .............................................................................. 135,247.0
F. Commitments and contingencies (tabular disclosure of contractual obligation)
The following table and discussion provide additional disclosure regarding our material contractual
obligations and commercial commitments as of December 31, 2010:
Payments due by period
Contractual Obligations
Total
Less than 1 year
1-3 years
3-5 years
More than
5 years
(in millions of Reais) Long-term debt* ................................................................................................. (7,959) (3,081) (4,110) (325) (442)
Sales tax deferrals ............................................................................................... (657,328) (79,420) (87,864) (85,379) (404,665)
Total contractual cash commitments................................................................... (665,287) (82,501) (91,974) (85,704) (405,107)
* The long-term debt amounts presented above differ from the amounts presented in the financial statements in
that they include the Company’s best estimates on future interest payable (not yet accrued) in order to better
reflect the Company’s future cash flow position.
The above table does not reflect contractual commitments discussed in ―Off-Balance Sheet Arrangements‖.
We are subject to numerous commitments and contingencies with respect to tax, labor, distributors and other
claims. To the extent that we believe it is probable that these contingencies will be realized, they have been recorded
in the balance sheet. We have estimated the total exposures of possible (but not probable) losses, which are not
recorded as liabilities, to be R$7,611.8 million as of December 31, 2010. These are not considered commitments.
Our estimates are based on reasonable assumptions and assessment of external legal counsel, but should the worst
case scenario develop, subjecting us to losses in all cases, our expected net impact on the income statement would be
an expense for this amount.
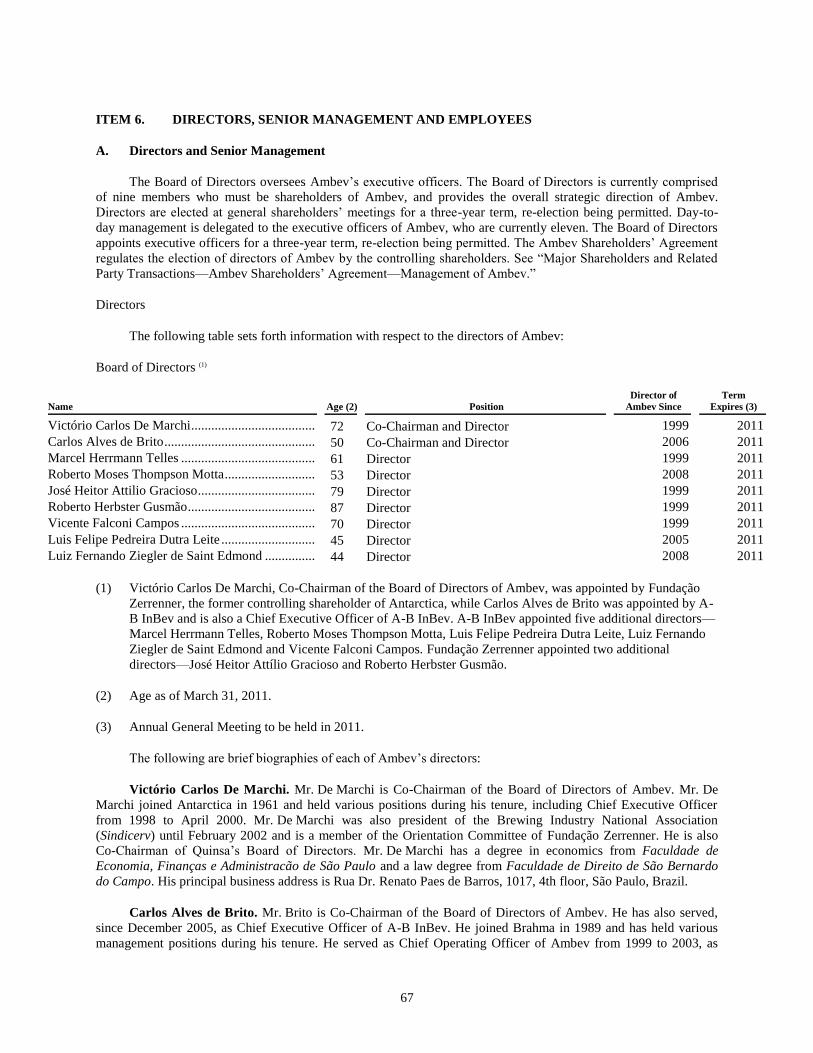
67
ITEM 6. DIRECTORS, SENIOR MANAGEMENT AND EMPLOYEES
A. Directors and Senior Management
The Board of Directors oversees Ambev’s executive officers. The Board of Directors is currently comprised
of nine members who must be shareholders of Ambev, and provides the overall strategic direction of Ambev.
Directors are elected at general shareholders’ meetings for a three-year term, re-election being permitted. Day-to-
day management is delegated to the executive officers of Ambev, who are currently eleven. The Board of Directors
appoints executive officers for a three-year term, re-election being permitted. The Ambev Shareholders’ Agreement
regulates the election of directors of Ambev by the controlling shareholders. See ―Major Shareholders and Related
Party Transactions—Ambev Shareholders’ Agreement—Management of Ambev.‖
Directors
The following table sets forth information with respect to the directors of Ambev:
Board of Directors (1)
Name
Age (2)
Position
Director of Ambev Since
Term Expires (3)
Victório Carlos De Marchi ..................................... 72 Co-Chairman and Director 1999 2011 Carlos Alves de Brito ............................................. 50 Co-Chairman and Director 2006 2011 Marcel Herrmann Telles ........................................ 61 Director 1999 2011 Roberto Moses Thompson Motta ........................... 53 Director 2008 2011 José Heitor Attilio Gracioso ................................... 79 Director 1999 2011 Roberto Herbster Gusmão ...................................... 87 Director 1999 2011 Vicente Falconi Campos ........................................ 70 Director 1999 2011 Luis Felipe Pedreira Dutra Leite ............................ 45 Director 2005 2011 Luiz Fernando Ziegler de Saint Edmond ............... 44 Director 2008 2011
(1) Victório Carlos De Marchi, Co-Chairman of the Board of Directors of Ambev, was appointed by Fundação
Zerrenner, the former controlling shareholder of Antarctica, while Carlos Alves de Brito was appointed by A-
B InBev and is also a Chief Executive Officer of A-B InBev. A-B InBev appointed five additional directors—
Marcel Herrmann Telles, Roberto Moses Thompson Motta, Luis Felipe Pedreira Dutra Leite, Luiz Fernando
Ziegler de Saint Edmond and Vicente Falconi Campos. Fundação Zerrenner appointed two additional
directors—José Heitor Attílio Gracioso and Roberto Herbster Gusmão.
(2) Age as of March 31, 2011.
(3) Annual General Meeting to be held in 2011.
The following are brief biographies of each of Ambev’s directors:
Victório Carlos De Marchi. Mr. De Marchi is Co-Chairman of the Board of Directors of Ambev. Mr. De
Marchi joined Antarctica in 1961 and held various positions during his tenure, including Chief Executive Officer
from 1998 to April 2000. Mr. De Marchi was also president of the Brewing Industry National Association
(Sindicerv) until February 2002 and is a member of the Orientation Committee of Fundação Zerrenner. He is also
Co-Chairman of Quinsa’s Board of Directors. Mr. De Marchi has a degree in economics from Faculdade de
Economia, Finanças e Administracão de São Paulo and a law degree from Faculdade de Direito de São Bernardo
do Campo. His principal business address is Rua Dr. Renato Paes de Barros, 1017, 4th floor, São Paulo, Brazil.
Carlos Alves de Brito. Mr. Brito is Co-Chairman of the Board of Directors of Ambev. He has also served,
since December 2005, as Chief Executive Officer of A-B InBev. He joined Brahma in 1989 and has held various
management positions during his tenure. He served as Chief Operating Officer of Ambev from 1999 to 2003, as
68
Chief Executive Officer for Latin America in 2004 and as Chief Executive Officer for North America in 2005.
Mr. Brito holds a degree in mechanical engineering from the Universidade Federal do Rio de Janeiro and an MBA
from Stanford University. His principal business address is Brouwerijplein 1, 3000, city of Leuven, Belgium.
Marcel Herrmann Telles. Mr. Telles is a member of the Board of Directors of Ambev. He served as Chief
Executive Officer of Brahma from 1989 to 1999. Currently, he is also a member of the Board of Directors of A-B
InBev. Mr. Telles has a degree in economics from Universidade Federal do Rio de Janeiro and attended the
Owners/Presidents Management Program at Harvard Business School. His principal business address is
Redingstrasse 4, 4th floor, CH-9000, St. Gallen, Switzerland.
Roberto Moses Thompson Motta. Mr. Thompson is a member of the Board of Directors of Ambev. He is
also a board member of A-B InBev and Lojas Americanas S.A. He holds a degree in engineering from Pontifícia
Universidade Católica do Rio de Janeiro, and an MBA from the Wharton School of the University of Pennsylvania.
His principal business address is 600, Third Avenue, 37th floor, New York, USA.
José Heitor Attílio Gracioso. Mr. Gracioso is a member of the Board of Directors of Ambev. Mr. Gracioso
joined Antarctica in 1946 and held various positions during his tenure. In 1994, Mr. Gracioso was elected to
Antarctica’s Board of Directors and, in 1999, he was elected Chairman of the Board of Directors, a position held
until April 2000. He holds a degree in marketing from Escola Superior de Propaganda de São Paulo, a degree in
business administration from Fundação Getulio Vargas and a degree in law from Faculdade de Direito de São
Bernardo do Campo. His principal business address is Av. Brig. Faria Lima, 3900, 11th floor, São Paulo, Brazil.
Roberto Herbster Gusmão. Mr. Gusmão is a member of the Board of Directors of Ambev. He was
previously Vice-Chairman of the Board of Directors of Antarctica from 1998 until April 2000. Mr. Gusmão was
Chief Executive Officer of Cervejaria Antarctica-Niger S.A. from 1968 to 1982, and from 1986 to 1997. He was the
Brazilian Minister for Trade and Industry from 1985 to 1986 and Chief Executive Officer of Banco de
Desenvolvimento do Estado de São Paulo from 1982 to 1983. Mr. Gusmão was also a professor and founder of
undergraduate and graduate programs at Fundação Getulio Vargas from 1954 to 1969. Mr. Gusmão has a law
degree from Faculdade de Direito da Universidade de Minas Gerais. His principal business address is Av. Brig.
Faria Lima, 3900, 11th floor, São Paulo, Brazil.
Vicente Falconi Campos. Mr. Campos is a member of the Board of Directors of Ambev. He is also a member
of the Institutional Council of Instituto de Desenvolvimento Gerencial (―INDG‖) and is a member of the Board of
Directors of Sadia. Mr. Campos is also a consultant for the Brazilian government and Brazilian and multinational
companies such as Grupo Gerdau, Grupo Votorantim and Mercedes-Benz. He holds a degree in Mining and Metal
Engineering from Universidade Federal de Minas Gerais, and M.Sc. and Ph.D. degrees from the Colorado School
of Mines. His principal business address is Av. do Contorno, 7962, 10th floor, Belo Horizonte, Brazil.
Luis Felipe Pedreira Dutra Leite. Mr. Dutra is a member of the Board of Directors of Ambev. He has also
served, since January 2005, as Chief Financial Officer of A-B InBev. He joined Brahma in 1990 and has held
numerous positions during his tenure, including that of Chief Financial Officer and Investor Relations Officer of
Ambev. Mr. Dutra holds a degree in economics from Universidade Cândido Mendes and an MBA in financial
management from Universidade de São Paulo. His principal business address is Brouwerijplein 1, 3000, city of
Leuven, Belgium.
Luiz Fernando Ziegler de Saint Edmond. Mr. Edmond is a member of the Board of Directors of Ambev.
He has also served, since January 2009, as Zone President for A-B InBev’s operations in North America. He joined
the Company in 1990 in the first group of trainees of Brahma and held various positions in the Distribution,
Commercial and Direct Distribution Departments. He was Sales Officer from 2002 to 2004 and Chief Executive
Officer for Latin America from 2005 to 2008. Mr. Edmond has an engineering degree from Universidade Federal
do Rio de Janeiro. His principal business address is One Busch Place, St. Louis, Missouri, USA.
Executive Officers
The following table sets forth information with respect to the executive officers of Ambev:
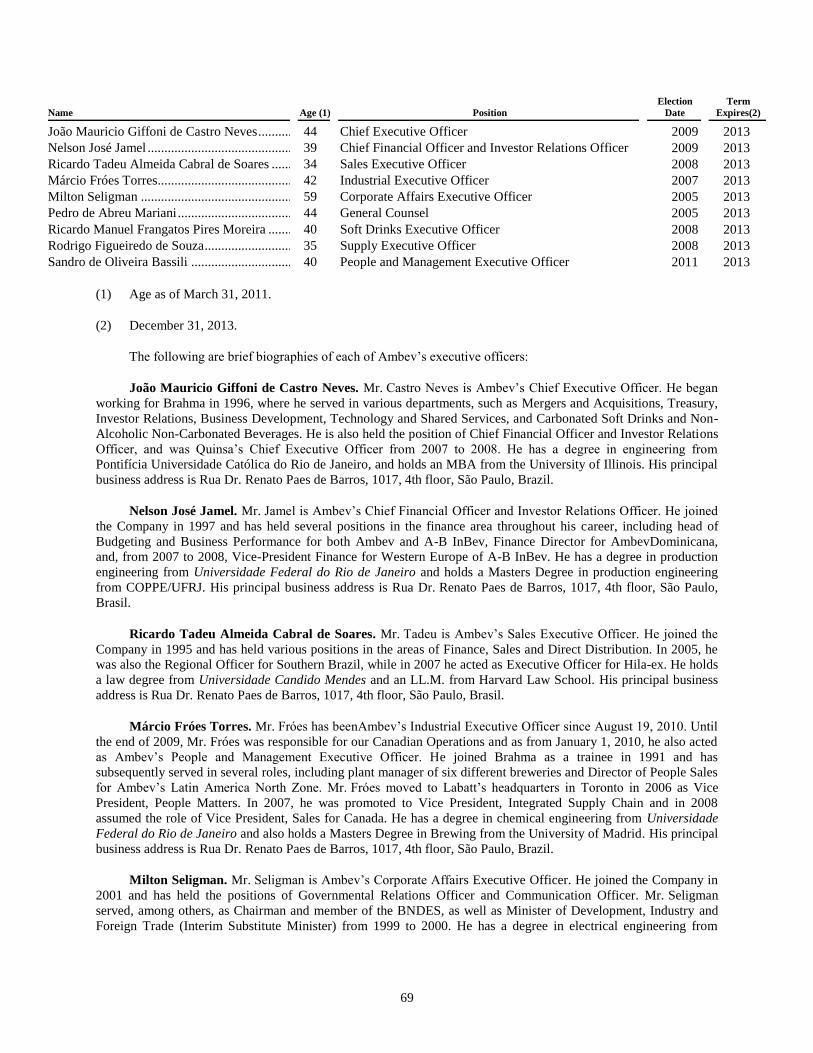
69
Name
Age (1)
Position
Election
Date
Term Expires(2)
João Mauricio Giffoni de Castro Neves .............. 44 Chief Executive Officer 2009 2013 Nelson José Jamel ............................................... 39 Chief Financial Officer and Investor Relations Officer 2009 2013 Ricardo Tadeu Almeida Cabral de Soares .......... 34 Sales Executive Officer 2008 2013 Márcio Fróes Torres ............................................ 42 Industrial Executive Officer 2007 2013 Milton Seligman ................................................. 59 Corporate Affairs Executive Officer 2005 2013 Pedro de Abreu Mariani ...................................... 44 General Counsel 2005 2013 Ricardo Manuel Frangatos Pires Moreira ........... 40 Soft Drinks Executive Officer 2008 2013 Rodrigo Figueiredo de Souza .............................. 35 Supply Executive Officer 2008 2013 Sandro de Oliveira Bassili .................................. 40 People and Management Executive Officer 2011 2013
(1) Age as of March 31, 2011.
(2) December 31, 2013.
The following are brief biographies of each of Ambev’s executive officers:
João Mauricio Giffoni de Castro Neves. Mr. Castro Neves is Ambev’s Chief Executive Officer. He began
working for Brahma in 1996, where he served in various departments, such as Mergers and Acquisitions, Treasury,
Investor Relations, Business Development, Technology and Shared Services, and Carbonated Soft Drinks and Non-
Alcoholic Non-Carbonated Beverages. He is also held the position of Chief Financial Officer and Investor Relations
Officer, and was Quinsa’s Chief Executive Officer from 2007 to 2008. He has a degree in engineering from
Pontifícia Universidade Católica do Rio de Janeiro, and holds an MBA from the University of Illinois. His principal
business address is Rua Dr. Renato Paes de Barros, 1017, 4th floor, São Paulo, Brazil.
Nelson José Jamel. Mr. Jamel is Ambev’s Chief Financial Officer and Investor Relations Officer. He joined
the Company in 1997 and has held several positions in the finance area throughout his career, including head of
Budgeting and Business Performance for both Ambev and A-B InBev, Finance Director for AmbevDominicana,
and, from 2007 to 2008, Vice-President Finance for Western Europe of A-B InBev. He has a degree in production
engineering from Universidade Federal do Rio de Janeiro and holds a Masters Degree in production engineering
from COPPE/UFRJ. His principal business address is Rua Dr. Renato Paes de Barros, 1017, 4th floor, São Paulo,
Brasil.
Ricardo Tadeu Almeida Cabral de Soares. Mr. Tadeu is Ambev’s Sales Executive Officer. He joined the
Company in 1995 and has held various positions in the areas of Finance, Sales and Direct Distribution. In 2005, he
was also the Regional Officer for Southern Brazil, while in 2007 he acted as Executive Officer for Hila-ex. He holds
a law degree from Universidade Candido Mendes and an LL.M. from Harvard Law School. His principal business
address is Rua Dr. Renato Paes de Barros, 1017, 4th floor, São Paulo, Brasil.
Márcio Fróes Torres. Mr. Fróes has beenAmbev’s Industrial Executive Officer since August 19, 2010. Until
the end of 2009, Mr. Fróes was responsible for our Canadian Operations and as from January 1, 2010, he also acted
as Ambev’s People and Management Executive Officer. He joined Brahma as a trainee in 1991 and has
subsequently served in several roles, including plant manager of six different breweries and Director of People Sales
for Ambev’s Latin America North Zone. Mr. Fróes moved to Labatt’s headquarters in Toronto in 2006 as Vice
President, People Matters. In 2007, he was promoted to Vice President, Integrated Supply Chain and in 2008
assumed the role of Vice President, Sales for Canada. He has a degree in chemical engineering from Universidade
Federal do Rio de Janeiro and also holds a Masters Degree in Brewing from the University of Madrid. His principal
business address is Rua Dr. Renato Paes de Barros, 1017, 4th floor, São Paulo, Brazil.
Milton Seligman. Mr. Seligman is Ambev’s Corporate Affairs Executive Officer. He joined the Company in
2001 and has held the positions of Governmental Relations Officer and Communication Officer. Mr. Seligman
served, among others, as Chairman and member of the BNDES, as well as Minister of Development, Industry and
Foreign Trade (Interim Substitute Minister) from 1999 to 2000. He has a degree in electrical engineering from
70
Universidade Federal de Santa Maria. His principal business address is Rua Dr. Renato Paes de Barros, 1017, 4th
floor, São Paulo, Brazil.
Pedro de Abreu Mariani. Mr. Mariani is the General Counsel of Ambev. He joined the Company in 2004.
He holds a law degree from Pontifícia Universidade Católica do Rio de Janeiro and an LL.M. from the London
School of Economics and Political Science. His principal business address is Rua Dr. Renato Paes de Barros, 1017,
4th floor, São Paulo, Brazil.
Ricardo Manuel Frangatos Pires Moreira. Mr. Moreira is Ambev’s Soft Drinks Executive Officer. He
joined the Company in 1995 and has held various positions in the Sales, Logistics and Direct Distribution
departments. He was also the Regional Officer for Northern Brazil (2003), Ambev’s Supply Executive Officer
(2005) and Executive Officer for Hispanic Latin America (Hila ex) until December, 2010. He has a degree in
mechanical engineering from Universidade Federal do Rio de Janeiro. His principal business address is Rua
Dr. Renato Paes de Barros, 1017, 4th floor, São Paulo, Brazil.
Rodrigo Figueiredo de Souza. Mr. Figueiredo is Ambev’s Supply Executive Officer. He joined Brahma as a
trainee in 1997 and has held various positions in the Sales, Finance and Supply departments. He was also Regional
Supply Officer for Midwestern Brazil. He has a degree in civil engineering from Universidade de São Paulo. He
also holds a post-graduate degree in finance from Fundação Getulio Vargas. His principal business address is Rua
Dr. Renato Paes de Barros, 1017, 4th floor, São Paulo, Brazil.
Sandro de Oliveira Bassili. Mr. Bassili is Ambev’s People and Management Executive Officer. He has
worked during 17 years in Ambev’s Sales Department, assuming the positions of Director of the Off Trade Channel
and Director of Trade Marketing in Brazil. He has also worked as Corporative Social Responsibility Manager. He
has a degree in economics from Universidade Estadual do Rio de Janeiro. His principal business address is Rua
Dr. Renato Paes de Barros, 1017, 4th floor, São Paulo, Brazil.
B. Compensation
The aggregate remuneration of all members of the Board of Directors and Executive Officers of Ambev in
2010 for services in all capacities amounted to R$57.5 million (fixed and varieable remuneration and share-based
payment), as presented below.
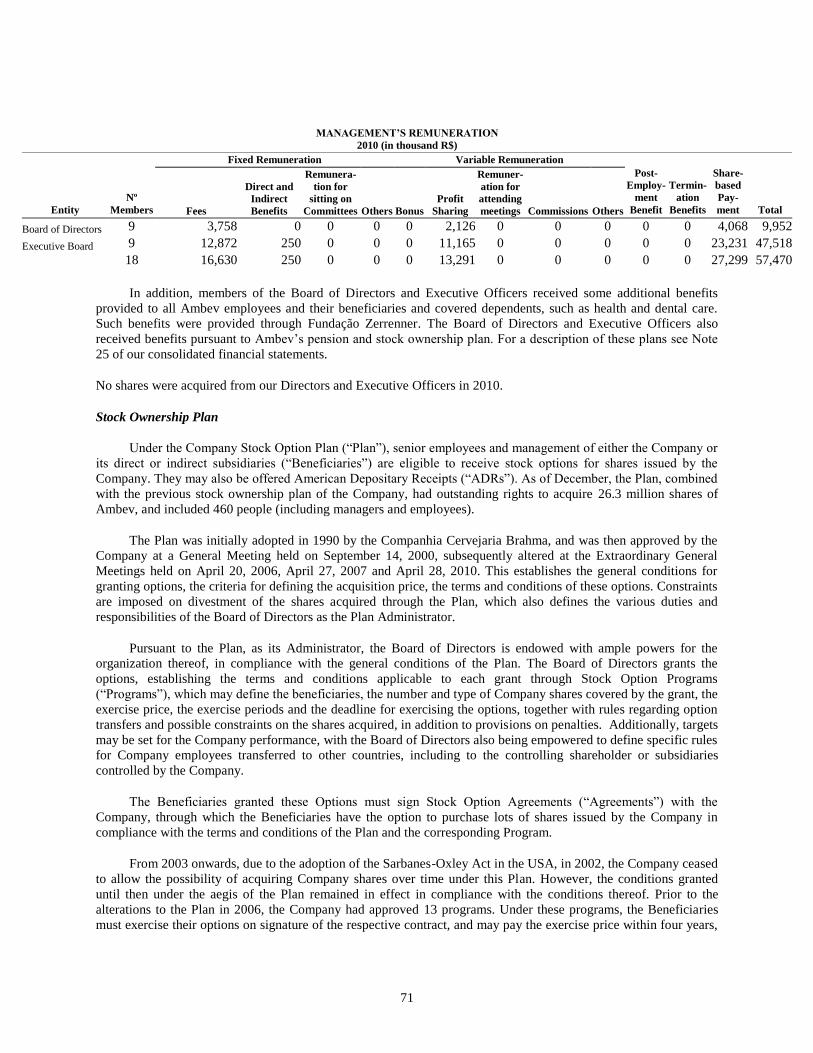
71
MANAGEMENT‟S REMUNERATION
2010 (in thousand R$)
Entity
Nº
Members
Fixed Remuneration Variable Remuneration
Post-
Employ-
ment
Benefit
Termin-
ation
Benefits
Share-
based
Pay-
ment Total Fees
Direct and
Indirect
Benefits
Remunera-
tion for
sitting on
Committees Others Bonus
Profit
Sharing
Remuner-
ation for
attending
meetings Commissions Others
Board of Directors 9 3,758 0 0 0 0 2,126 0 0 0 0 0 4,068 9,952
Executive Board 9 12,872 250 0 0 0 11,165 0 0 0 0 0 23,231 47,518
18 16,630 250 0 0 0 13,291 0 0 0 0 0 27,299 57,470
In addition, members of the Board of Directors and Executive Officers received some additional benefits
provided to all Ambev employees and their beneficiaries and covered dependents, such as health and dental care.
Such benefits were provided through Fundação Zerrenner. The Board of Directors and Executive Officers also
received benefits pursuant to Ambev’s pension and stock ownership plan. For a description of these plans see Note
25 of our consolidated financial statements.
No shares were acquired from our Directors and Executive Officers in 2010.
Stock Ownership Plan
Under the Company Stock Option Plan (―Plan‖), senior employees and management of either the Company or
its direct or indirect subsidiaries (―Beneficiaries‖) are eligible to receive stock options for shares issued by the
Company. They may also be offered American Depositary Receipts (―ADRs‖). As of December, the Plan, combined
with the previous stock ownership plan of the Company, had outstanding rights to acquire 26.3 million shares of
Ambev, and included 460 people (including managers and employees).
The Plan was initially adopted in 1990 by the Companhia Cervejaria Brahma, and was then approved by the
Company at a General Meeting held on September 14, 2000, subsequently altered at the Extraordinary General
Meetings held on April 20, 2006, April 27, 2007 and April 28, 2010. This establishes the general conditions for
granting options, the criteria for defining the acquisition price, the terms and conditions of these options. Constraints
are imposed on divestment of the shares acquired through the Plan, which also defines the various duties and
responsibilities of the Board of Directors as the Plan Administrator.
Pursuant to the Plan, as its Administrator, the Board of Directors is endowed with ample powers for the
organization thereof, in compliance with the general conditions of the Plan. The Board of Directors grants the
options, establishing the terms and conditions applicable to each grant through Stock Option Programs
(―Programs‖), which may define the beneficiaries, the number and type of Company shares covered by the grant, the
exercise price, the exercise periods and the deadline for exercising the options, together with rules regarding option
transfers and possible constraints on the shares acquired, in addition to provisions on penalties. Additionally, targets
may be set for the Company performance, with the Board of Directors also being empowered to define specific rules
for Company employees transferred to other countries, including to the controlling shareholder or subsidiaries
controlled by the Company.
The Beneficiaries granted these Options must sign Stock Option Agreements (―Agreements‖) with the
Company, through which the Beneficiaries have the option to purchase lots of shares issued by the Company in
compliance with the terms and conditions of the Plan and the corresponding Program.
From 2003 onwards, due to the adoption of the Sarbanes-Oxley Act in the USA, in 2002, the Company ceased
to allow the possibility of acquiring Company shares over time under this Plan. However, the conditions granted
until then under the aegis of the Plan remained in effect in compliance with the conditions thereof. Prior to the
alterations to the Plan in 2006, the Company had approved 13 programs. Under these programs, the Beneficiaries
must exercise their options on signature of the respective contract, and may pay the exercise price within four years,
72
open to extension for a further three years, with an initial payment of at least 10% with annual interest falling due on
the outstanding balance at 8% in addition to restatement by the IGP-M.
After the alterations to the Plan in 2006, the Company began to work with a new stock options model. Under
this model, six programs were approved respectively at Board of Directors Meetings held on April 25, 2006 (―2006
Program‖), May 8, 2007 (―2007 Program‖), February 27, 2008 (―2008 Program‖), February 26, 2009 (―2009
Program‖), July 30, 2009 (―2009.2 Program‖) and March 1, 2010 (―2010 Program‖).
In compliance with the conditions for the 2006, 2007, 2008, 2009, 2009.2 and 2010 Programs, the
Beneficiaries may decide to allocate 50%, 75% or 100% of the amounts received as profit sharing during the year, to
the immediate exercise of options, thus acquiring the corresponding preferred shares issued by the Company.
Should the Beneficiary decide to allocate its remuneration regarding profits sharing for the acquisition of stocks
through this program, the first lot must necessarily be exercised at 50%, corresponding to Lot A of the options. In
terms of the remaining 50% of the profit sharing, the Beneficiary may decide between exercising Lot B1 (equivalent
to the remaining 50% of the share in the profits) or Lot B2 (equivalent to 25% of the share in the profits). The
Beneficiary may also decide not to exercise any Lot B.In addition, Participants under the Plan who used 50% of
their bonus to acquire the Lot A Shares and use 25% or 50% of their remaining net bonus in the purchase of our
preferred shares or ADSs (the ―Lot B shares‖) are entitled to a number of options (the ―Options‖) calculated by
dividing the amount invested in the Lot B shares (before tax) by the exercise price of the Lot A shares, and then
multiplying the product of such division by 2.3 (in the case that the participant invests 25%) or 4.6 (in the case that
the participant invests 50%). The exercise price of the Lot B shares corresponds to the price of Lot A shares with a
ten percent discount. The exercise price of the Options corresponds to the price of Lot A shares, being deducted the
value of the dividends and interest on shareholders’ equity effectively paid out by the Company on the
corresponding shares during the period between granting the options and the corresponding exercise thereof. Lot B
shares are subject to a five-year lock-up. The vesting of the Options is subject to the following conditions being met:
• The Participant shall hold the Lot A shares for at least three years and Lot B shares for at least five years;
and
• The Company shall meet certain performance measures.The right to exercise the Options is forfeited in
certain circumstances, such as resignation or dismissal prior to the vesting of the Options. The Options
expire if not exercised within five years from vesting (i.e., ten years from the date the Lot B shares are
acquired).
In 2010, the Plan was amended and the Company began to work with a new stock options model, which
is comprised of two grants: (i) under the first type, the Beneficiary may decide to allocate 30%, 40%, 60% or 100%
of the amounts received as profit sharing during the year, to the immediate exercise of options, thus acquiring the
corresponding preferred shares issued by the Company, whereas a substantial part of the shares acquired are subject
to a 5-year lock up period, as from the corresponding grant date, during which the Beneficiary must remain working
for the Company or any other company within its group; (ii) under the second type, the Beneficiary may exercise
the options granted only after a period of 5 years as from the corresponding grant date. Further, the vesting of such
options are not subject to performance measures, however, the right to exercise such options may be forfeited in
certain circumstance, such as resignation or dismissal prior to the vesting of the options. Under this model, two
programs were approved respectively at Board of Directors Meetings held on August 19, 2010 (―2010.2 Program‖)
– contemplating both grants --, and November 30, 2010 (―2010.3 Program‖) – contemplating one type of grant.
Additionally, on December 22, 2010, the Board os Directors approved the creation of stock option programs
for employees retreating abroad who waive, in relation to their existing stock options under the programs created by
the Company since 2005, to the right to deduct, from the exercise price, the dividends paid by the Company between
the grant date and the exercise date.
A-B InBev Exceptional Stock Option Grants
On November 25, 2008, A-B InBev’s board of directors approved a grant of 28 million stock options to
several executives, including approximately 7 million options granted to Ambev executives. Each option gives the
grantee the right to purchase one existing common share of A-B InBev at an exercise price of EUR 10.32, which
corresponded to the fair value of A-B InBev share at the time of granting of the options. Half of the options has a
73
duration of 10 years as from granting and will become exercisable on January 1, 2014. The other half has a duration
of 15 years as from granting and will become exercisable on January 1, 2019. The exercise of the options is subject,
among other things, to the condition that a performance test will be met by A-B InBev, namely if A-B InBev’s net
debt/EBITDA ratio falls below 2.5 before December 31, 2013. Specific forfeiture rules apply in case of employment
terminations. Such grant was confirmed on April 28, 2009, by A-B InBev’s annual general shareholders’ meeting.
On April 30, 2009, A-B InBev granted approximately 4.9 million stock options to approximately 50
executives of the A-B InBev Group, including approximately 1.8 million options granted to Ambev executives.
Each option gives the grantee the right to purchase one existing common share of A-B InBev at an exercise price of
EUR 21.94, which corresponded to the fair value of A-B InBev shares at the time of granting. The options have a
duration of 10 years as from granting and will become exercisable on 1 January 2014. The exercise of the options is
subject, among other things, to the condition that a performance test will be met by A-B InBev. This performance
test will be met if A-B InBev’s net debt/EBITDA ratio falls below 2.5 before 31 December 2013. Specific forfeiture
rules apply in the case of employment termination. Such grant was authorized by A-B InBev’s 2009 annual general
shareholders’ meeting.
On December 18, 2009, A-B InBev granted approximately 1,582,592 options to executives of A-B InBev,
including 97,711 options granted to Ambev executives. Each option gives the grantee the right to purchase one
existing common share of A-B InBev at an exercise price of EUR 35.90 and become exercisable after five years, on
18 December 2014.
Ambev Pension Plan
Ambev’s pension plans for employees in Brazil are administered by the IAPP. IAPP operates both a defined
benefit pension plan (closed to new participants since May 1998) and a defined contribution plan, which
supplements benefits that the Brazilian government social security system provides to our employees. IAPP was
established solely for the benefit of our employees and its assets are held independently. IAPP is managed by the
IAPP Council Board (Conselho Deliberativo), which has three members, two of which are appointed by Ambev,
and one member represents the employees and retired employees. The IAPP Executive Board (Diretoria Executiva),
has three members, all of which are appointed by the IAPP Council Board. IAPP also has a Fiscal Council with
three members, two of which are appointed by Ambev and one member represents the employees and retired
employees.
Any employee after being hired may opt to join the defined contribution plan. When pension plans members
leave Ambev, before retirement, but having contributed at least three years to the IAPP plan, they have some options
such as: (a) have their contributions refunded, (b) transfer their contributions to a bank or insurance company,
(c) keep their investment in IAPP to be paid in installments, and (d) keep contributing to IAPP for future retirement
under the existing terms. In the event the employee leaves the Company prior to completing three years as a
participant, such employee will only be entitled to refund his/her contributions to the plan.
Prior to May 1998, when the defined contribution plan was launched, there was only a defined benefit plan.
At the time of adoption of the defined contribution plan, active participants were given the option either to remain in
the defined benefit plan, or transfer their accumulated benefits to the defined contribution plan. The defined
contribution plan covers substantially all new employees.
As of December 31, 2010, we had 4,202 participants in our pension plans, including 775 participants in the
defined benefit plan, 3,427 participants in the defined contribution plan, and 1,250 retired or assisted participants.
The Plan assets are comprised mainly of equity securities, government and corporate bonds and properties.
All benefits are calculated and paid in inflation-indexed Reais.
Labatt provides pension plan benefits in the defined contribution model and in the defined benefit model to its
employees, as well as certain post-retirement benefits.
74
As at December 31, 2010, the Company recorded liabilities for pension plan benefits, as described in Note 24
to our financial statements.
Profit-Sharing Plan
Employees’ performance-based variable bonuses are determined on an annual basis taking into account the
achievement of corporate, department or business-unit and individual goals, established by the Board of Directors.
The distribution of these bonuses is subject to a three-tier system in which Ambev must first achieve
performance targets approved by the Board of Directors. Following that, each department or business unit must
achieve its targets. In addition, a ranking system is in place, meaning that not all employees will receive bonus
payments.
For employees involved in operations, we have a collective award for production sites and distribution centers
with outstanding performances. The bonus award at the distribution centers and production sites is based on a
ranking between the different distribution centers and production sites (as the case may be), which based on their
relative ranking may or may not receive the bonus.
We provisioned R$229.0 million under these programs amounted for the year ended December 31, 2010 and
R$439.0 million for the year ended December 31, 2009 and R$109.9 million for the year ended December 31, 2008.
C. Board Practices
During 2010 management held individual and group meetings with shareholders, investors and analysts to talk
about the performance of our business and our opportunities for growth both in the short-term as well as in the
future. We also participated in conferences and road shows in Brazil, the United States and Mexico. We hosted
quarterly conference calls, transmitted simultaneously on the Internet, to clarify financial and operating results as
well as answered questions from the investment community.
Audit Committee (Conselho Fiscal)
At Ambev’s general and extraordinary shareholders’ meeting held in April 2005, we approved an amendment
to our bylaws to make the Conselho Fiscal a permanent body. The following members were appointed to the
Conselho Fiscal at Ambev’s general and extraordinary meeting held on April 28, 2010, for a term expiring upon the
general shareholders’ meeting of 2011: Álvaro Antônio Cardoso de Souza, Celso Clemente Giacometti and Ivan de
Castro Esteves, and, as alternates, respectively, Ary Waddington, Emanuel Sotelino Schifferle and Eurípedes de
Freitas. All of them are ―independent‖ members as per Rule 10I(c)(v) of the Sarbanes-Oxley Act of 2002.
The responsibilities of the Conselho Fiscal include supervision of management, performing analyses and
rendering opinions regarding Ambev’s financial statements and performing other duties in accordance with
Brazilian Corporate Law and its charter. None of the members of the Conselho Fiscal is also a member of the Board
of Directors or of any Committee thereof.
In addition, we have relied on the exemption provided for under Rule 10A-3(c)(3) of the Sarbanes-Oxley Act
of 2002, which enables us to have the Conselho Fiscal perform the duties of an audit committee for the purposes of
such Act, to the extent permitted by Brazilian law. We do not believe that reliance on this exemption would
materially adversely affect the ability of our Conselho Fiscal to act independently and to satisfy the other
requirements of such Act.
The Board of Directors
Most of the Board members have been in office for several years, with current members’ term lasting until the
general shareholders’ meeting of 2011. The Board members use their extensive knowledge of the business to ensure
that Ambev reaches its long-term goals and maintains its short-term competitiveness. Moreover, the Board of
75
Directors ensures that Ambev pursues its short-term business goals without compromising our long-term growth,
while at the same time ensuring that Ambev’s corporate values are practiced.
The Company’s Co-Chairmen of the Board of Directors and the Chief Executive Officer are separate
positions held by different people. The Board of Directors is supported in its decision-making by the following
committees:
Operations and Finance Committee
The Operations and Finance Committee is the main link between the policies and decisions made by the
Board of Directors and Ambev’s management team. The Operations and Finance Committee’s responsibilities are:
▪To present medium and long-term planning proposals to the Board of Directors;
▪To propose and monitor Ambev’s annual performance targets and the budgets needed to attain the
projected goals;
▪To monitor the Company’s standing through analysis of its results, market developments and permanent
internal and external benchmarking;
▪To analyze and propose uniform best practice rules;
▪To monitor the performance of the Company’s trademarks and innovation strategies;
▪To opine in matters involving recruiting programs, variable compensation and the spreading of the
Company’s culture; and
▪To analyze, monitor and propose to the Board of Directors suggestions regarding legal, tax and relevant
regulatory matters.
▪To analyze and monitor the Company’s annual investment plan;
▪To analyze and monitor growth opportunities;
▪To analyze and monitor the Company’s capital structure and cash flow; and
▪To analyze and monitor the management of the Company’s financial risk, as well as budgetary and
treasury policy.
Current members of the Committee are Messrs. Victório Carlos De Marchi (Chairman), Luis Felipe Pedreira
Dutra Leite, Marcel Herrmann Telles, Roberto Moses Thompson Motta and Carlos Alves de Brito. Throughout the
year, the Operations and Finance Committee holds at least six meetings. The members of the Committee are elected
by the Board of Directors.
Compliance Committee
The Compliance Committee’s responsibilities (which as from July 30, 2009 also comprise those of the former
Special Committee) are to assist the Board of Directors in the following matters:
▪Related party transactions;
▪Any general conflict of interest situations;
▪Compliance, by the Company, with legal, regulatory and statutory provisions concerning related party
transactions;
▪Monitoring and analysis of the internal controls of the Company;
▪Monitoring and analysis of the fiscal profile of the Company;
▪Compliance, by the Company, with legal, regulatory and statutory provisions concerning antitrust matters;
and
▪Other matters the Board of Directors may consider relevant and in the interest of the Company.

76
Current members of the Compliance Committee are Messrs. Victório Carlos De Marchi (Chairman), José
Heitor Attilio Gracioso and Bolívar Moura Rocha. The president of the Conselho Fiscal also participates in the
Compliance Committee meetings.
Differences Between the United States and the Brazilian Corporate Governance Practices
The SEC approved in November 2003 the new corporate governance rules established by the NYSE.
According to these rules, foreign private issuers that are listed on the NYSE must disclose the significant differences
between their corporate governance practices and those required by the NYSE´s regulations for U.S. companies.
In Brazil, the CVM has provided guidance to the market with a set of recommendations on differentiated
corporate governance practices which are not required but recommended. Additionally, the BM&FBOVESPA and
the IBGC-Brazilian Institute of Corporate Governance have developed guidelines to for corporate governance best
practices.
The principal differences between the NYSE corporate governance standards and our corporate governance
practices are as follows:
Independence of Directors and Independence Tests
NYSE corporate governance standards require listed companies to have a majority of independent directors
and set forth the principles by which a listed company can determine whether a director is independent. ―Controlled
companies‖ such as Ambev need not comply with this requirement.
The Brazilian Corporate Law requires that our directors be elected by our shareholders at a general
shareholders’ meeting, cumulative voting being applicable if requested by 5% of the common shareholders.
Moreover, provided certain statutory thresholds are met, the Brazilian Corporate Law grants common shareholders
and/or preferred shareholders the right to elect a director if they so require in the general shareholders’ meeting
called for the election of the Board of Directors. Currently, all of our directors are appointed by our controlling
shareholders; minority shareholders are represented through one seat in our Conselho Fiscal.
The Brazilian Corporate Law and the CVM establish rules in relation to certain qualification requirements and
restrictions, compensation, duties and responsibilities of a company’s executives and directors.
Executive Sessions
NYSE corporate governance standards require non-management directors of a listed company to meet at
regularly scheduled executive sessions without management.
According to the Brazilian Corporate Law, up to one-third of the members of the Board of Directors can also
hold management positions. However, none of our directors holds a management position at this time and,
accordingly, we believe we would be in compliance with this NYSE corporate governance standard.
Nominating/Corporate Governance and Compensation Committees
NYSE corporate governance standards require that a listed company have a nominating/corporate governance
committee and a compensation committee each composed entirely of independent directors with a written charter
that addresses certain duties. ―Controlled companies‖ such as Ambev need not comply with this requirement.
In addition, we are not required under the Brazilian Corporate Law to have, and accordingly we do not have, a
nominating committee, corporate governance committee or compensation committee. According to the Brazilian
Corporate Law, Board committees may not have any specific authority or mandate since the role of the full Board of
Directors may not be delegated. The role of the corporate governance committee is generally performed by either
our Board of Directors or our executive officers. With respect to compensation, under the Brazilian Corporate Law,
the shareholders determine the total or individual compensation of a company’s directors and executive officers,
77
including benefits and allowances at a general shareholders meeting. In our case, the shareholders have approved the
total compensation limit, with the Board of Directors being responsible for the allocation among directors and
executive officers.
Audit Committee and Audit Committee Additional Requirements
NYSE corporate governance standards require that a listed company have an audit committee composed of a
minimum of three independent members that satisfy the independence requirements of Rule 10A-3 under the
Securities Exchange Act of 1934, as amended (the ―Exchange Act‖), with a written charter that addresses certain
duties.
We maintain a permanent Conselho Fiscal, which is a body contemplated by the Brazilian Corporate Law that
operates independently from our management and from our registered independent public accounting firm. Its
principal function is to examine the annual and quarterly financial statements and provide a formal report to our
shareholders. We are relying on the exemption provided by Rule 10A-3(c)(3) and believe that our reliance on this
exemption will not materially affect the ability of the Conselho Fiscal to act independently and to satisfy the other
requirements of Rule 10A-3.
Shareholder Approval of Equity Compensation Plans
NYSE corporate governance standards require that shareholders of a listed company must be given the
opportunity to vote on all equity compensation plans and material revisions thereto, subject to certain exceptions.
Our existing stock ownership plan was amended and restated by the general shareholders’ meeting held on
April 28, 2010.
Corporate Governance Guidelines
NYSE corporate governance standards require that a listed company must adopt and disclose corporate
governance guidelines that address certain minimum specified standards, which include, director qualification
standards, director responsibilities, director access to management and independent advisors, director compensation,
director orientation and continuing education, management succession and annual performance evaluation of the
Board.
We believe the corporate governance guidelines applicable to us under the Brazilian Corporate Law are
consistent with the guidelines established by the NYSE. We have adopted and observe our Manual on Disclosure
and Use of Information and Policies for Trading with Securities issued by Ambev which deals with the public
disclosure of all relevant information as per CVM’s guidelines, as well as with rules relating to transactions
involving the dealing by our management and controlling shareholders in our securities.
Code of Business Conduct
NYSE corporate governance standards require that a listed company must adopt and disclose a code of
business conduct and ethics for directors, officers and employees and promptly disclose any waivers of the code for
directors or officers.
We have adopted a Code of Business Conduct that applies to all directors, officers and employees. There are
no waivers to our Code of Business Conduct.
Certification Requirements
NYSE corporate governance standards require that each listed company’s chief executive officer certify to the
NYSE each year that he or she is not aware of any violation by the company of the NYSE corporate governance
standards.
78
As required by Section 303A.12(b) of the NYSE corporate governance standards, our Chief Executive Officer
will promptly notify the NYSE in writing after our executive officer becomes aware of any material non-compliance
with any applicable provisions of the NYSE corporate governance standards.
D. Employees
As of December 31, 2010, Ambev and its subsidiaries had 44,924 employees, approximately 53% of whom
were engaged in production, 44% of whom were engaged in sales and distribution and 3% of whom were engaged in
administration.
The following table sets forth the number of Ambev and its subsidiaries´employees of as of the end of the
years indicated:
Employees as of December 31,
2010
2009
44,924 40,787
The following table shows the geographical distribution of Ambev’s employees as of December 31, 2010:
Geographical Distribution of Ambev Employees as of December 31, 2010
Location
Number of Employees
Latin America North 32,097
Brazil ........................................................................................................................................ 28,064
Dominican Republic ................................................................................................................. 1,655
Peru .......................................................................................................................................... 1,327
Venezuela ................................................................................................................................. 641
Ecuador .................................................................................................................................... 263
Guatemala ................................................................................................................................ 147
Latin America South 8,040
Argentina .................................................................................................................................. 5,046
Paraguay ................................................................................................................................... 664
Bolivia ...................................................................................................................................... 1,310
Uruguay .................................................................................................................................... 602
Chile ......................................................................................................................................... 418
Canada 4,787
Total 44,924
Industrial Relations
All of Ambev’s employees in Brazil are represented by labor unions, but only less than approximately 10% of
its employees in Brazil are actually members of labor unions. The number of administrative and distribution
employees who are members of labor unions is not significant. Salary negotiations are conducted annually between
the workers’ unions and Ambev. Collective bargaining agreements are negotiated separately for each facility or
distribution center. Ambev’s collective bargaining agreements have a term of one year, and Ambev usually enters
into new collective bargaining agreements on or prior to the expiration of the existing agreements. We conduct
salary negotiations with labor unions in accordance with local law for our employees located in our HILA-ex, Latin
America South and Canadian operations.
79
Health and Severance Benefits
In addition to wages, Ambev’s employees receive additional benefits. Some of these benefits are mandatory
under Brazilian law, some are provided for in collective bargaining agreements, and others are voluntarily granted.
The benefits packages of Ambev’s employees in Brazil consist of benefits provided both by Ambev directly and
through Fundação Zerrenner, which provides medical, dental, educational and social assistance to current and retired
employees of Ambev and their beneficiaries and covered dependents, either for free or at a reduced cost. Ambev
may voluntarily contribute up to 10% of its consolidated net income, as determined in accordance with Brazilian
Corporate Law and Ambev’s bylaws, to support Fundação Zerrenner in this regard.
Ambev is required to contribute 8% of each Brazilian employee’s gross pay to an account maintained in the
employee’s name in the Government Severance Indemnity Fund (―FGTS‖). Under Brazilian law, Ambev is also
required to pay termination benefits to Brazilian employees dismissed without cause, equal to 40% (plus 10% to the
Brazilian Government) of the accumulated contributions made by Ambev to the FGTS during the employee’s period
of service.
We provide health and benefits in accordance with local law for our employees located in our HILA-ex, Latin
America South and Canadian operations.
E. Share Ownership
The following table shows the amount, type and percentage of class of our equity securities held by members
of our Board of Directors and by executive officers as of December 31, 2010:
Name
Amount and Percentage of Common Shares
Amount and Percentage of Preferred Shares
Victório Carlos De Marchi (1) .............................................................................................. * * Carlos Alves de Brito (2) ...................................................................................................... * * Marcel Herrmann Telles (3) ................................................................................................. * * Roberto Moses Thompson Motta ....................................................................................... * * José Heitor Attílio Gracioso (4) ............................................................................................ * * Roberto Herbster Gusmão (5) ............................................................................................... * * Vicente Falconi Campos .................................................................................................... * * Luis Felipe Pedreira Dutra Leite ........................................................................................ * *
Luiz Fernando Ziegler de Saint Edmond ............................................................................ * *
João Mauricio Giffoni de Castro Neves ............................................................................. * *
Nelson José Jamel .............................................................................................................. * *
Ricardo Tadeu Almeida Cabral de Soares .......................................................................... * *
Milton Seligman ................................................................................................................. * *
Pedro de Abreu Mariani ..................................................................................................... * * Ricardo Manuel Frangatos Pires Moreira ........................................................................... * * Rodrigo Figueiredo de Souza ............................................................................................. * * Márcio Fróes Torres ........................................................................................................... * * Sandro de Oliveira Bassili .................................................................................................. * *
* Indicates that the individual holds less than 1% of the class of securities.
(1) Mr. De Marchi is a trustee of Fundação Zerrenner. For information regarding the shareholding of Fundação
Zerrenner, see ―Major Shareholders and Related Party Transactions—Ambev’s Major Shareholders‖.
(2) Mr. Brito is a trustee of Fundação Zerrenner. For information regarding the shareholding of Fundação
Zerrenner, see ―Major Shareholders and Related Party Transactions—Ambev’s Major Shareholders‖.
80
(3) Does not include shares owned through interest in A-B InBev. Mr. Telles is part of the controlling group of A-
B InBev, and is also an intervening party to the Ambev Shareholders’ Agreement. See ―Major Shareholders
and Related Party Transactions—Major Shareholders—Ambev Shareholders’ Agreement‖. Mr. Telles is also
a trustee of Fundação Zerrenner. For information regarding the shareholdings of Fundação Zerrenner, see
―Major Shareholders and Related Party Transactions—Major Shareholders—Ambev’s Major Shareholders‖.
(4) Mr. Gracioso is a trustee of Fundação Zerrenner. For information regarding the shareholding of Fundação
Zerrenner, see ―Major Shareholders and Related Party Transactions—Major Shareholders—Ambev’s Major
Shareholders‖.
(5) Mr. Gusmão is a trustee of Fundação Zerrenner. For information regarding the shareholding of Fundação
Zerrenner, see ―Major Shareholders and Related Party Transactions—Major Shareholders—Ambev’s Major
Shareholders‖.
81
ITEM 7. MAJOR SHAREHOLDERS AND RELATED PARTY TRANSACTIONS
A. Major Shareholders
Introduction
On June 29, 2007 at an Extraordinary Shareholders Meeting, shareholders approved a reverse stock split of
our common and preferred shares at a ratio of 1/100. As a result, each ADS represents one common or preferred
share, as the case may be. In this sense, the number of the Company’s shares was amended to 345,054,728 common
shares and 279,362,507 preferred shares at that time.
On December 17, 2010 at an Extraordinary General Meeting, shareholders approved a stock split, pursuant to
which each common and each preferred share issued by the Company was split into five common shares and five
preferred shares, respectively, without any modification to the amount of the Company’s capital stock. Each ADR
shall continue to be represented by one common or preferred share, as case may be.
As of December 31, 2010, Ambev had 1,743,364,345 common voting shares and 1,359,864,475 preferred
shares outstanding (excluding treasury shares). Ambev has registered two classes of ADSs pursuant to the Securities
Act: ADSs evidenced by ADRs representing one preferred share, and ADSs evidenced by ADRs representing one
common share. As of December 31, 2010, there were 274,126,178 preferred ADSs outstanding (representing
274,126,178 preferred shares) and 4,262,685 common ADSs outstanding (representing 4,262,685 common shares).
Ambev ADRs are issuable by The Bank of New York Mellon pursuant to deposit agreements for common and
preferred shares.
Control
The controlling shareholders of Ambev, Interbrew International B.V. and AmBrew S.A., which are both
subsidiaries of A-B InBev and Fundação Zerrenner, together hold approximately 91.1% of Ambev’s common shares
(excluding treasury shares), as of December 31, 2010.
A-B InBev indirectly holds shares of Ambev common stock that represent approximately 74.0% (as of
December 31, 2010) of the total voting power of Ambev’s capital stock (excluding treasury shares). A-B InBev thus
has control over Ambev, even though (i) A-B InBev remains subject to the Ambev Shareholders’ Agreement with
Fundação Zerrenner, and (ii) A-B InBev is jointly controlled by Messrs. Lemann, Sicupira and Telles and
Interbrew’s former controlling shareholders. For further information on these matters see ―—Ambev Shareholders’
Agreement‖ and ―Information on the Company—InBev-Ambev Transactions‖.
Share Buyback
In 2010, we acquired 94,995 preferred and 26,150 common shares in connection with preemptive rights
related to stock ownership plans, at a total cost of R$2.8 million.
In 2009, we acquired 207,403 preferred and 40,374 common shares in connection with preemptive rights
related to stock ownership plans, at a total cost of R$15.5 million.
In accordance with CVM rules, share buyback programs may be conducted through the issuance of put and
call options (provided that the volume of such options issued multiplied by their respective strike prices does not
exceed the limit established for the plan), and the amount of shares to be kept in treasury may not exceed the
equivalent to 10% of the free float of each class of shares. The following table summarizes the share buyback
programs approved by our Board of Directors in 2006, 2007 and 2008, and the number of shares purchased under
each such program until February 26, 2009. For a further description of the programs, see ―—Purchases of Equity
Securities by the Issuer and Affiliated Purchasers‖.
82
Approval Date
Shares Repurchased (restated)(*)
Amount Repurchased (R$ in thousands )
Date program was
finalized
February 22, 2006 ......................................................................... (preferred) 20,805,950 373,008 August 8, 2006
(common) 1,068,595 17,095
August 8, 2006 .............................................................................. (preferred) 30,112,220 586,932 November 14, 2006
(common) 792,865 13,554
November 14, 2006 ....................................................................... (preferred) 41,695,715 870,161 February 5, 2007
(common) 2,173,470 40,666
February 5, 2007 ........................................................................... (preferred) 35,057,230 796,504 May 8, 2007
(common) 6,573,050 140,534
May 8, 2007 .................................................................................. (preferred) 34,739,325 924,414 August 20, 2007
(common) 356,225 9,185
August 20, 2007 ............................................................................ (preferred) 15,860,785 415,094 December 12, 2007
(common) 2,100,905 55,323
December 12, 2007 ....................................................................... (preferred) 15,727,745 394,125 March 3, 2008
(common) 3,621,965 87,710
March 3, 2008 ............................................................................... (preferred) 9,768,925 269,190 February 26, 2009
(common) 1,933,415 48,482
Total
222,388,385 5,041,977
(*) On December 17, 2010 the Extraordinary General Meeting approved a stock split pursuant to which each
common and each Preferred share issued by the Company was split into five Common shares and five Preferred
shares, respectively, without any modification to the Company’s issued capital. Each ADR will continue to be
represented by one common or Preferred share, as the case may be. For purposes of comparison, information
relating to the number of shares and earnings per share for all periods presented has been represented to conform
retrospectively to the effect of this split.
Ambev‟s Major Shareholders
The following table sets forth information as of December 31, 2010 with respect to any person known to
Ambev to be the beneficial owner of 5% or more of Ambev’s outstanding shares:
Amount and Percentage
of Common Shares
Amount and Percentage
of Preferred Shares
The Bank of New–York – ADR Department (1) ...................................................................... 4,262,685 0.2% 274,126,178 20.1% Interbrew International B.V. .................................................................................................. 1,138,695,075 65.3% 515,806,725 37.9% AmBrew S.A. ......................................................................................................................... 151,760,510 8.7% 98,389,010 7.2% Fundação Zerrenner (2) ............................................................................................................ 297,810,410 17,1% — — Caixa de Previdência dos Funcionários do Banco do Brasil – PREVI ................................... 20,274,065 1.1% 93,213,585 6.8%
(1) Represents the number of shares held in the form of ADSs. The Bank of New York Mellon is the depositary
of Ambev shares in accordance with the deposit agreement entered into with Ambev and the owners of
Ambev ADSs.
(2) Messrs. Telles, Brito, Dutra, De Marchi, Gracioso and Gusmão, directors of Ambev, are also trustees of
Fundação Zerrenner.
For a description of our major shareholders’ voting rights, see ―—Ambev Shareholders’ Agreement‖.
Ambev Shareholders‟ Agreement
A-B InBev (through AmBrew S.A. and InterBrew International B.V.), Fundação Zerrenner, as well as Ambev
and Jorge Paulo Lemann, Marcel Telles and Carlos Alberto Sicupira, the latter four as intervening parties, are part of
83
a shareholders’ agreement (the ―Ambev Shareholders’ Agreement‖) with respect to the voting of the shares of
Ambev and the voting by Ambev of the shares of its subsidiaries, among other matters.
The Ambev Shareholders’ Agreement was originally signed in July 1999 and amended in March 2004.
The following discussion relates to the Ambev Shareholders’ Agreement, as modified by the amendment.
Management of Ambev
Although each common share of Ambev entitles shareholders to one vote in connection with the election of
Ambev’s Board of Directors, Ambev’s controlling shareholders, Fundação Zerrenner, AmBrew S.A. and Interbrew
International B.V., have the ability to elect the majority of Ambev’s directors. Because the election of any director
by minority (non-controlling) shareholders would require, under Law 6,404/76, at the time of execution of the
Ambev Shareholders’ Agreement, the adoption of a cumulative vote procedure, the provisions of the Ambev
Shareholders’ Agreement on the management of Ambev were based on the assumption that no directors will be
elected by minority shareholders of Ambev.
Due to the changes introduced by Law No. 10,303/01, the majority of common shareholders holding at least
15% of voting capital and the majority of preferred shareholders holding at least 10% of Ambev’s total capital (in
both cases excluding shares held by controlling shareholders) may separately elect one member of the Board of
Directors and its alternate member. Additionally, if neither the common shareholders nor the preferred shareholders
achieve such quorum as mentioned above, they can jointly appoint by a majority vote one member of the Board of
Directors and its alternate member provided they represent, together, a quorum of at least 10% of Ambev’s total
capital. In order to exercise these rights, any of these shareholders must prove that it has uninterruptedly held the
corresponding shares for at least three months prior to the shareholders’ meeting, where the election of the Board of
Directors shall take place.
If such prerogative is exercised collectively with the adoption of a cumulative voting procedure, and as a
result the number of directors so elected is equal or higher than the directors elected by the controlling shareholders,
the controlling shareholders are entitled to elect the same number of members plus one, irrespective of the number
of directors provided for in the bylaws.
Presently, under the Ambev Shareholders’ Agreement, as amended, each of Fundação Zerrenner, AmBrew
S.A. and Interbrew International B.V. will have representation on the Board of Directors of Ambev and its
subsidiaries and, in addition to the members and respective alternates they are entitled to appoint, each of Fundação
Zerrenner, on the one hand, and AmBrew S.A. and Interbrew International B.V., on the other, may appoint up to two
observers to attend Ambev’s board meetings, without voting rights. The boards of directors of Ambev and its
subsidiaries will each be comprised of at least three and no more than 15 regular members and the same number of
alternates, with a term of office of three years and reelection being permitted.
Fundação Zerrenner will have the right to appoint four directors and their respective alternates to the boards of
directors of Ambev and its subsidiaries, so long as it maintains ownership of common shares that Fundação
Zerrenner held as of July 1, 1999, when the Ambev Shareholders’ Agreement was entered into (adjusted for share
dividends, splits and reverse stock splits). At that time, Fundação Zerrenner held 459,521,728 common shares,
which has since been adjusted for the five-for-one stock split that took effect in October 2000, the share dividend
that took effect in May 2005, as well as the reverse stock split of June 2007. Fundação Zerrenner appointed three of
our directors. Fundação Zerrenner is not allowed under the Ambev Shareholders’ Agreement to appoint more than
four directors in the event that its holding of Ambev common shares increases. Fundação Zerrenner will always be
entitled to appoint at least one director as long as it holds a minimum of 10% of Ambev’s voting shares. AmBrew
S.A. and Interbrew International B.V. have the right to appoint members and its alternates to the boards of directors
of Ambev and its subsidiaries, in a number proportionate to the number of members appointed by Fundação
Zerrenner. Such proportion is based on the ratio between Fundação Zerrenner’s holding and the joint holding of
AmBrew S.A. and Interbrew International B.V. in the voting capital of Ambev.
84
The Ambev Shareholders’ Agreement provides that Ambev will have two Co-Chairmen with identical rights
and duties, one appointed by Fundação Zerrenner and the other jointly by AmBrew S.A. and Interbrew International
B.V. In the event of a deadlock, neither of the Co-Chairmen has a deciding vote on matters submitted to the Board
of Directors of Ambev.
Each of Fundação Zerrenner, AmBrew S.A. and Interbrew International B.V., may remove a director that it
has appointed to the Board of Directors of Ambev or its subsidiaries, and each also has the right to appoint the
respective replacement or a new alternate, if the originally appointed alternate is confirmed for the vacant position.
The Ambev Shareholders’ Agreement establishes that the shareholders may, by consensus, establish
committees within Ambev’s Board of Directors, with the purpose of looking into specific matters, which analyses
require that their members have specific technical knowledge. The Operations and Finance Committee and the
Compliance Committee are currently active. See ―Directors, Senior Management and Employees—Board
Practices‖.
Preliminary Meetings and Exercise of Voting Right
On matters submitted to a vote of the shareholders or their representatives in the Board of Directors of Ambev
or its subsidiaries, Fundação Zerrenner, AmBrew S.A. and Interbrew International B.V. have agreed to endeavor
first to reach a consensus with respect to voting their common shares of each of Ambev and its subsidiaries, and
have agreed on the manner to direct their representatives to vote on the matter being submitted. The Ambev
Shareholders’ Agreement provides that the parties shall hold a preliminary meeting in advance of all meetings of
shareholders or boards of directors of Ambev or of its subsidiaries, with the purpose of discussing and determining a
consensus position to be taken by the parties in such meetings.
If the parties fail to reach a consensus with respect to a particular matter, the position to be adopted by all
parties to the agreement will be determined by the group holding the greatest number of Ambev voting common
shares, which currently is constituted of AmBrew S.A. and Interbrew International B.V. However, this rule does not
apply in connection with the election of members of Board of Directors, as described above under ―Management of
Ambev‖, and with respect to matters which require unanimous approval by Fundação Zerrenner, AmBrew S.A. and
Interbrew International B.V., as follows:
▪Any amendment to the bylaws of Ambev and/or any of its subsidiaries with the purpose of amending:
(i) the corporate purposes, (ii) the term of duration, and/or (iii) the composition, powers and duties of
the management bodies;
▪Approval of the annual investment budget of Ambev and/or any of its subsidiaries when the amount of the
investments exceed 8.7% of net sales of Ambev foreseen for the same fiscal year;
▪Designation, dismissal and substitution of the Chief Executive Officer of Ambev;
▪Approval of or amendment to the compensation policy for the Board of Directors and of the executive
officers of Ambev, as well as of its subsidiaries;
▪Approval of stock ownership plans for the directors, executive officers and key employees of Ambev
and/or its subsidiaries;
▪Change in the dividend policy of Ambev and/or any of its subsidiaries;
▪Increases in the capital of Ambev and/or any of its subsidiaries, with or without preemptive rights, through
subscription, creation of a new class of shares, or changes in the characteristics of the existing shares,
as well as decreases of capital, issuances of debentures (whether or not convertible into shares),
warrants, and the creation of founders’ shares by Ambev and/or any of its subsidiaries except when
such legal businesses are carried out between Ambev and its subsidiaries or between the subsidiaries;
▪Amalgamations, spin-offs, transformations, mergers, acquisitions, and divestments involving Ambev
and/or any of its subsidiaries, in the latter case (a) when such operation involves a company that is not
a subsidiary, directly or indirectly, of Ambev and (b) provided that the transaction in question results in
85
the reduction in the average dividend paid by Ambev in the past five years, adjusted by the IGP-M
published by Fundação Getulio Vargas as of the date of payment;
▪The creation, acquisition, assignment, transfer, establishment of an encumbrance on and/or disposal of
shares, quotas and/or any securities issued by any of Ambev’s subsidiaries, under any title or form,
except in the benefit of Ambev and/or another subsidiary;
▪The incurrence by Ambev and/or any of its subsidiaries of a debt transaction that results in a net
debt/equity ratio greater than 1.5;
▪The execution, amendment, termination, renewal or cancellation of any contracts, agreements or the like
involving the registered or deposited trademarks of Ambev or its subsidiaries;
▪The extension of loans or the offer of guarantees of any kind by Ambev and/or any of its subsidiaries to
any third parties in an amount greater than 1% of Ambev’s shareholders’ equity as set forth in the last
audited balance sheet prepared in accordance with Brazilian GAAP, except in favor of employees of
Ambev and its subsidiaries, or in favor of the subsidiaries themselves;
▪Election of members of committees of Ambev’s Board of Directors;
▪Cancellation of the registration of Ambev and/or any of its subsidiaries as publicly traded companies;
▪Petition for an arrangement with creditors (―recuperação judicial‖) or acknowledgment of bankruptcy by
Ambev and/or any of its subsidiaries;
▪Liquidation or dissolution of Ambev and/or any of its subsidiaries; and
▪Appointment of the external auditors of Ambev and/or any of its subsidiaries.
The Ambev Shareholders’ Agreement provides that whenever the parties fail to reach a consensus in a
preliminary meeting as to any matter listed above, they will exercise their voting rights so as not to approve such
matter. The Ambev Shareholders’ Agreement provides that any votes cast by Fundação Zerrenner, AmBrew S.A.
and Interbrew International B.V., or by any of the directors appointed by each of them, in violation of the provisions
of the agreement will be deemed null, void and ineffective.
Transfer of Shares
The Ambev Shareholders’ Agreement contains the following provisions concerning the transfer of shares:
▪Fundação Zerrenner, AmBrew S.A. and Interbrew International B.V. have agreed (i) not to dispose,
directly or indirectly, of their shares, during the term of the agreement, through private trades, on the
stock market or on the over-the-counter market, including by way of tender offers, either voluntary or
mandatory, except as provided for in Section VI of the Ambev Shareholders’ Agreement, and (ii) not
to create any type of encumbrance on their shares, without the prior written consent of Fundação
Zerrenner, in the case of AmBrew S.A. and Interbrew International B.V., and without the prior written
consent of AmBrew S.A. and Interbrew International B.V., in the case of Fundação Zerrenner;
▪In the event that the shares of Ambev owned by Fundação Zerrenner, on the one hand, and by AmBrew
S.A. and Interbrew International B.V., on the other hand, become subject to seizure, attachment,
judicial surety or any other restrictive measure, and such restriction is not removed or waived within
30 days after its imposition, the shares subject to the restriction shall be automatically deemed offered
for sale to the other party. This offer will remain open for 30 days, and the price for the Ambev shares
will be the lesser of either (i) the book value of the Ambev shares, as per the latest audited balance
sheet of Ambev, prepared in accordance with Brazilian GAAP, and adjusted by the IGP-M inflation
index or (ii) the average quoted market price of the Ambev shares on stock exchanges in the 20 days
prior to the petition for removal or waiver of the restriction. If the obligations in respect of such
restriction exceed the above price, the party whose shares have been subject to the restriction will be
liable for the difference that the other party may be required to deposit in order to acquire the shares. If
the obligations in respect of such restriction were lower than the price for the Ambev shares as
described above, then the party whose shares have been subject to the restriction will be entitled to
86
receive the difference between the price for the Ambev shares and the obligations in respect of such
restriction; and
▪If any of Fundação Zerrenner, on the one hand, and AmBrew S.A. and Interbrew International B.V., on the
other hand, intends to dispose of subscription rights relating to Ambev shares that it holds, it must first
offer such rights to the other party, who will then be required to exercise its right of first refusal to
subscribe the new shares to be issued, within 10 days.
The Shareholders’ Agreement provides that any transfer of shares or subscription rights or creation of
encumbrances in which the aforementioned provisions on rights of first refusal are not observed will be deemed
null, void and ineffective. Ambev’s management is also prohibited from reflecting any such events in its corporate
books, as permitted by the Brazilian Corporate Law.
Specific Performance
Obligations of the parties under the Ambev Shareholders’ Agreement will be subject not only to specific
performance but will also bind third parties to the terms of the agreement, in effect declaring null and void any
action taken in breach to it so long as rights and obligations of third parties stem from the agreement.
B. Related Party Transactions
Material Related Party Transactions
Ambev and Affiliated Entities
We engage in (i) the purchase and sale of raw material with affiliated entities and (ii) intercompany loans and
guarantees, which effects are eliminated in our consolidated financial statements, with the exception of entities
under common control (which are consolidated), as described in Note 32 to our financial statements. Pursuant to the
legal, regulatory and statutory provisions concerning related party transactions, the transactions described below
were carried out on an arm's lenght basis.
Ambev and Fundação Zerrenner
Medical, Dental and Social Assistance
One of the activities of Fundação Zerrenner, as described in its bylaws, is to provide medical and dental
assistance to employees and executive officers (including dependants) of Ambev and its subsidiaries.
Purchase of Labels from Fundação Zerrenner
In April 2002, CBB (which has subsequently merged into Ambev) and Fundação Zerrenner executed an
agreement for the production by Fundação Zerrenner of labels using materials supplied by Ambev. The prices varied
in accordance with the order, and were determined under arm’s length conditions.
Ambev has entered into a lease agreement with Fundação Zerrenner, pursuant to which Ambev leased and is
operating Fundação Zerrenner’s assets used to produce our labels. We began operating such assets in June 2008.
Leasing
The Fundação Zerrenner leases to Ambev two commercial properties, with a total annual payment of R$ 6.4
million with maturity in January 28, 2013.
87
Ambev and Employees
Before January 1, 2003, Ambev had deferred payment stock option plans. See ―Directors, Senior Management
and Employees—Employees—Stock Ownership Plan‖. Such option was removed from the stock ownership plans
subsequent to the enactment of the Sarbanes-Oxley Act. Nevertheless, deferred payment for the stock ownership
plans granted prior to 2003 were grandfathered and may be requested. The current Stock Ownership Plan is the
result of a revised text approved in Ambev’s Extraordinary General Meeting of April 28, 2010
A-B InBev and Labatt
In August 2004, in connection with the consummation of the merger of an indirect holding company of Labatt
into Ambev, Labatt and InBev (as it was then denominated) entered into a cross-services agreement with a view to:
▪terminating the then-existing services agreement among those entities before the Incorporação;
▪Labatt providing to InBev, on an hourly basis, certain administrative services such as tax support services,
internal audit services and legal services; and
▪InBev providing to Labatt, on an hourly basis, administrative services such as internal audit services, legal
advice and IT support.
Transfer Pricing
In August 2004, InBev (as it was then denominated), Ambev and Labatt entered into agreements relating to
the transfer prices and policy for all beer product transfers between InBev and the Labatt companies. The companies
confirmed that the Interbrew Transfer Pricing Policy will continue to be the transfer pricing policy in effect between
the InBev companies and the Labatt companies for beer product transfers between and among them, except as
provided for in the agreement.
Ambev and A-B InBev
Licensing agreements
In March 2005, Ambev and InBev (as it was then denominated) entered into a cross-license agreement
through which Ambev is allowed to produce, package, market and distribute beer under the brands Stella Artois and
Beck’s in Latin America (except Argentina and Cuba), on an exclusive basis, and A-B InBev is allowed to produce,
package, market and distribute beer under the brand Brahma in Europe, Asia, Africa, Cuba and the United States on
an exclusive basis. Ambev has agreed not to directly or indirectly produce, package, market, distribute, sell or resell
(or have an interest in any of these), any other European premium branded beer in Latin America, and A-B InBev
has agreed to be bound by the same restrictions relating to any other Latin American premium branded beer in
Europe, Asia, Africa, Cuba and the United States. No royalties will be due in the first year, but royalties will be
increased annually by 1.75% of net sales up to 7%, which will be the amount of royalties due after the fourth year.
Since March 2005, A-B InBev has been distributing Brahma beer in the United States and in a number of European
countries such as the United Kingdom, France, the Benelux, Ukraine and Russia. We announced the launch of Stella
Artois in Brazil in June 2005. Labatt and A-B InBev have an arrangement through which Labatt distributes certain
A-B InBev beer brands in Canada, and Latin America South and A-B InBev have an arrangement through which it
distributes Stella Artois in Argentina.
Labatt distributes Budweiser branded beers in Canada under license from A-B InBev, and Cervecería
Paraguay (Cervepar) signed in April 2009 a distribution agreement with A-B InBev to distribute Budweiser in
Paraguay. Ambev also has A-B InBev’s subsidiary Metal Container Corp. as one of its can suppliers.
Special goodwill reserve
As a result of the merger of InBev Brasil into Ambev in July 2005, Ambev acquired tax benefits resulting
from the partial amortization of the special premium reserve pursuant to article 7 of CVM’s Normative Ruling
No. 319/99. Such amortization will be carried out within the next ten years following the merger. As permitted by
88
Normative Ruling No. 319/99, the Protocol and Justification of the Merger, entered into between Ambev, InBev
Brasil and InBev(as it was then denominated) on July 7, 2005, established that 70% of the goodwill premium, which
corresponded to the tax benefit resulting from the amortization of the tax goodwill derived from the merger, would
be capitalized in the Company to the benefit of its controlling shareholder, with the remaining 30% being capitalized
in the Company without the issuance of new shares to the benefit of all shareholders. Since 2005 pursuant to the
Protocol and Justification of the Merger, the Company has carried out, with shareholders approval, capital increases
through the partial capitalization of the goodwill premium reserve. Accordingly, Interbrew International B.V. and
AmBrew S/A, which are subsidiaries of A-B InBev, have subscribed shares corresponding to 70% of the goodwill
premium reserve (and Ambev minority shareholders subscribed shares pursuant to preferred subscription right under
Brazilian law) and the remaining 30% of the tax benefit was capitalized without issuance of new shares to the
benefit of all shareholders. The Protocol and Justification of the Merger also provides, among other matters, that A-
B InBev shall indemnify Ambev for any undisclosed liabilities of InBev Brasil.
Indemnification Agreement
In the context of the Department of Justice’s antitrust review of A-B’s acquisition by InBev (as it was then
denominated), Ambev and InBev entered on November 13, 2008 into an indemnification agreement pursuant to
which InBev agreed to indemnify Ambev under certain circumstances arising from the perpetual license of Labatt
branded beer to KPS for consumption in the U.S. and the interim supply of Labatt branded beer to KPS for
consumption in the U.S.
A-B InBev and Intra-group Companies
In January 2005, InBev (as it was then denominated) and certain intra-group companies executed an
International Intra-Group Data Protection Agreement pursuant to which they agreed to provide adequate safeguards
with respect to the protection of privacy and fundamental rights and freedoms of individuals in the transfer of
personal information.
89
ITEM 8. FINANCIAL INFORMATION
A. Consolidated Financial Statements and Other Financial Information
Consolidated Financial Statements
See “Financial Statements”.
Legal Proceedings
We are subject to numerous claims with respect to tax, labor, distributors and other matters. To the extent that
we believe these contingencies will probably be realized, they have been recorded in the balance sheet. We have
estimated the total exposures of possible (but not probable) losses, which are not recorded as liabilities, to be R$7.17
million as of December 31, 2010. Our estimates are based on reasonable assumptions and assessment of external
legal counsel, but should the worst case scenario develop, subjecting us to losses in all cases classified as possible
(but not probable), our net impact on our results of operations would be an expense for this amount. Except as set
forth herein, there are no legal proceedings to which we are a party, or to which any of our properties are subject
which, either individually or in the aggregate, may have a material adverse effect on our results of operations,
liquidity or financial condition. For more information, please see Notes 27 and 31 of our consolidated financial
statements.
Tax Matters
As of December 31, 2010, the Company and its subsidiaries had several tax claims pending, including judicial
and administrative proceedings. Most of these claims relate to ICMS (Imposto sobre Circulação de Mercadorias e
Serviços, which is a state value-added tax levied on goods and services), the IPI excise tax, and income tax and
social contributions. As at December 31, 2010, we have made provisions of R$310 million in connection with those
tax proceedings for which we believe there is a probable chance of loss.
Among the pending tax claims, there are claims filed by Ambev against Brazilian tax authorities alleging that
certain taxes are unconstitutional. Such tax proceedings include claims for income taxes, ICMS, IPI and revenue
taxes. As these claims are contingent on obtaining favorable judicial decisions, the corresponding assets which
might arise in the future are only recorded once it becomes certain that we will receive the amounts previously paid
or deposited.
As of December 31, 2010, there were also tax proceedings with a total estimated possible risk of loss of R$6.1
billion.
In order to carry out certain activities, including obtaining BNDES financings, obtaining certain tax incentives
or registering the sale of real estate, Ambev, in common with other Brazilian companies, is required to obtain federal
and state tax and social security good standing certificates, which are normally valid for six months. In
circumstances in which such certificates are not issued by the competent authority on the basis of the existence of
tax claims that we believe are without merit or need further information, we have sought court injunctions
requesting such certificates to be issued. As of December 31, 2010, we had court bonds (cartas de fiança) issued in
connection with such injunctions in the amount of approximately R$270 million. Court bonds are a means provided
for by Brazilian law to guarantee amounts under dispute in a given litigation, including the request for injunctive
relief. In the event that we lose the litigation, the court bond will be used to pay the amounts owed by us and we will
have to reimburse the financial institution that issued such court bond.
Value Added Tax, Excise Tax and Taxes on Net Sales
During 1999, legislation came into effect requiring Brazilian companies to pay PIS and COFINS not only on
sales and services net sales, but also on financial income. We have not been paying PIS and COFINS as required by
90
such law, as we have obtained injunctions permitting the non-payment of these additional taxes on the basis that
such legislation is unconstitutional. In November 2005, a leading case unrelated to Ambev was adjudicated by the
Brazilian Supreme Court in favor of taxpayers. As of December 31, 2010, we had provisions in connection with
cases still pending in the amount of R$58 million.
We are currently parties to legal proceedings with the State of Rio de Janeiro where we are challenging such
State’s attempt to assess ICMS with respect to irrevocable discounts granted by the Company in January 1996 and
February 1998. These proceedings are currently before the Superior Court of Justice and the Brazilian Supreme
Court, and involve the amount of approximately R$293 million as of December 31, 2010, which we have treated as
a possible loss. Such estimate is based on reasonable assumptions and assessments of management, but should our
position not prevail the expected net impact on our income statement would be an expense for this amount.
We received tax assessments from the State of São Paulo in the amount of approximately R$97 million
(updated December 31, 2010), challenging the legality of tax credits arising from an existing tax incentive of the
Company in the State of Santa Catarina. We have treated this proceeding as a possible loss. Such estimate is based
on reasonable assumptions and advice of external counsel but should our position not prevail the expected net
impact on our income statement would be an expense for this amount. Moreover, we cannot rule out the possibility
of other Brazilian states issuing similar tax assessments related to the Company’s tax incentive granted by the State
of Santa Catarina.
The State of São Paulo has also challenged in the Brazilian Supreme Court laws enacted by other Brazilian
states upon which certain of the above benefits have been granted, on the basis that they constitute tax benefits
created without certain approvals required under Brazilian tax laws and regulations, which would render such state
laws unconstitutional. Although the Brazilian Supreme Court, in a case unrelated to Ambev, has already declared
part of Pará state’s benefit law unconstitutional, almost every state has specific legislation on this topic and even the
State of Pará may still grant benefits which were not covered in the decision. In this sense, insofar as the tax benefits
are granted based on valid state legislation and the operational requirements are met, most companies apply for and
use these benefits when granted.
Between 2000 and 2004, certain third-party distributors of Londrina (Cintra, as it was then denominated)
obtained preliminary injunctions permitting the non-payment of IPI. These preliminary injunctions were revoked
between 2002 and 2005, and as a result, tax authorities assessed Cintra for the payment of IPI during the period in
which IPI was not collected by the third-party distributors. As of December 31, 2010, Londrina had a provision of
R$17 million with respect to such claims. We believe R$184 million is considered as a possible loss.
Income Tax and Social Contribution
Beginning in 1997, an amendment to the tax laws confirmed the deductibility of interest on shareholders’
equity for social contribution and income tax purposes. Brahma, which has since been succeeded in a series of
corporate restructuring transactions by Ambev, filed a lawsuit with the Federal Courts of the State of Rio de Janeiro
requesting the recovery of social contribution taxes previously paid in 1996. The Federal Court granted Brahma an
injunction recognizing the deductibility of payment of interest on shareholders’ equity and, as a result, allowed
Brahma to suspend the payment of social contribution in 1999 up to the amount not deducted in 1996
(approximately R$51.6 million as of December 31, 2010). Notwithstanding the aforesaid suspension of social
contribution’s payment, the tax authority filed an administrative proceeding against Brahma claiming the payment of
such amount. Brahma presented its defense and is waiting for a final decision by the administrative court.
Meanwhile, in April 2001, the Federal Appellate Court reversed the Federal Court’s injunction. Though we appealed
to the Brazilian Supreme Court in April 2002, our appeal was denied. The provision made in connection with this
case was reversed in 2009 as external counsel established that even if Ambev loses the administrative proceeding,
the tax authority would not be entitled to collect the respective amounts, due to the fact that the tax authority has
indirectly consented, in a different proceeding, to the deductibility of payment of interest on shareholders’ equity
made by Ambev in 1996.
Profits generated abroad
91
During the first quarter 2005, certain of our subsidiaries received a number of assessments from Brazilian
federal tax authorities relating to profits obtained by subsidiaries domiciled abroad, in the total amount, at that time,
of approximately R$2.9 billion. In December 2008, the Administrative Court handed down a decision on one of the
tax assessments relating to earnings of our foreign subsidiaries. This decision was partially favorable to Ambev, and
we can still appeal. Based on the advice of external counsel, we have not recorded any provision in connection
therewith. After this decision, we estimate the total exposures of possible losses in relation to these assessments to
be approximately R$3.0 billion at December 31, 2010.
Income Tax – Tax Loss Offset
The Company and certain of its subsidiaries received a number of assessments from Brazilian federal tax
authorities relating to the use of income tax losses in company mergers. Based on the advice of external counsel, we
have not recorded any provision in connection therewith.
We estimated the total exposures of possible losses in relation to these assessments to be approximately of
R$372.3 million, at December 31, 2010.
Labatt Tax Matters
Labatt was assessed by the Canada Revenue Agency ("CRA") for the interest rate used in certain related-party
debts and related-party transactions, and other transactions existing prior to the merger of Labatt into Ambev. These
issues have been settled in April 2010 with CRA at C$123 million of the estimated exposure of C$218 million at
December 31, 2009. Part of the amount settled, corresponding to transactions made before to the merge of Labatt
into Ambev, was reimbursed by A-B InBev.
In relation to the same issue, Labatt received another tax assessment on its valuations of intercompany
transactions amounting to C$153 million. The company is appealing this tax assessment. In the event Labatt would
be required to pay these amounts, the totality will be reimbursed by A-B InBev.
Tax Amnesty and Refinancing Program
We enrolled in the Tax Amnesty and Refinancing Program, introduced by Federal Law 11,941/09, for some
of its current tax lawsuits. Under this program, we will pay R$374.8 million in 180 monthly installments.
Accordingly, we reclassified R$336.9 million of noncurrent liabilities and R$37.9 million of current liabilities, from
―Provisions‖ to ―Other taxes, charges and contributions‖.
Labor Matters
As of December 31, 2010, the Company and its subsidiaries are involved in approximately 4,440 legal
proceedings with former and current employees, mainly relating to overtime, dismissals, severance, health and
safety premiums, supplementary retirement benefits and other matters, all of which are awaiting judicial resolution.
We have made provisions totaling R$224.3 million as of December 31, 2010. In Brazil, where the Company is
involved in 4,176 legal proceedings, it is not unusual for a company to be a defendant in a large number of labor
claims.
As of December 31, 2010, we had approximately 13 claims made by the Brazilian National Institute for Social
Security with an aggregate exposure of R$74 million. These claims are classified as having a possible chance of loss
and claim, among other things, that the Company should have paid social security contributions in relation to bonus
payments and payments to third-party service providers.
Civil Claims
As of December 31, 2010 we had 4,846 civil claims pending in Brazil, including distributors and product-
related claims. We are the plaintiff in 1,634 and the defendant in 3,212 of these claims. We have established
92
provisions totaling R$39.8 million for the Company and its subsidiaries as of December 31, 2010 in connection with
civil claims.
We are a party to a tortious interference claim brought by our competitor Schincariol whereby
Schincariol seeks damages in the range of R$100 million from Ambev, claiming that Ambev signed up entertainer
Zeca Pagodinho while he was still contractually bound with Schincariol. On July 20, 2007, the lower courts of the
State of São Paulo denied Schincariol’s claim, and Schincariol filed an appeal on August 24, 2007. Based on the
advice of external counsel, we have not recorded a provision in connection with such proceeding.
Subscription Warrants
In 2002, Ambev decided to request a ruling from the CVM in connection with a dispute between Ambev and
some of its warrant holders regarding the criteria used in the calculation of the strike price of certain Ambev
warrants. In March and April 2003, the CVM ruled that the criteria used by Ambev to calculate the strike price were
correct. In response to the CVM’s final decision and seeking to reverse it, some of the warrant holders filed separate
lawsuits before the courts of São Paulo and Rio de Janeiro.
Although the warrants expired without being exercised, the warrant holders claim that the strike price should
be reduced to take into account the strike price of certain stock options granted by Ambev under its Stock
Ownership Program, as well as for the strike price of other warrants issued in 1993 by Brahma.
We have been notified of seven claims from 12 holders arguing that they would be entitled to those rights.
One of them was ruled favorably to Ambev by the appellate court of the State of São Paulo. Another one is still
awaiting final rulings by the same court. A third one was settled. Of the four other claims, one is awaiting a first
instance decision and three were ruled against Ambev in the appellate court of the State of Rio de Janeiro. We have
appealed to the Superior Court of Justice with respect to the final decisions issued by the appellate court of the state
of Rio de Janeiro, but the appeals were denied by the Reporting Judge of the Superior Court of Justice on February
4, 2010. On February 12, 2010, we appealed with respect to these decisions and a final decision will be ruled by a
group of judges from the same court. On March 23, 2010, the first judge of this group (which is the previously
mentioned Reporting Judge) has already confirmed his vote against our appeal. The warrant holders whose claim
was denied by the appellate court of the State of São Paulo have also appealed to the Superior Court of Justice.
In the event the plaintiffs prevail in the above six pending proceedings, we believe that the corresponding
economic dilution for the existing shareholders would be the difference between the market value of the shares at
the time they are issued and the value ultimately established in liquidation proceedings as being the subscription
price pursuant to the exercise of the warrants. We believe which are the warrants object of those six proceedings
represented, on December 31, 2010, 27,684,596 preferred and 6,881,719 common shares that would be issued at a
value substantially below fair market value, should claimants ultimately prevail.
We have filed counterclaims to six of these lawsuits. One of those counterclaims is still awaiting final ruling
by the appellate court of the State of São Paulo. Of the five other counterclaims, one was settled, three were ruled
against us in the appellate court of the State of Rio de Janeiro, and one was ruled against us in the appellate court of
the State of São Paulo. We have already appealed to the Superior Court of Justice with respect to the final decisions
issued by the appellate courts of the states of Rio de Janeiro and São Paulo, except for one of the rulings rendered by
the appellate courts of the state of Rio de Janeiro, which, therefore, is a final decision. Our appeals concerning the
decisions issued by the appellate court of the State of Rio de Janeiro were denied by the Reporting Judge of the
Superior Court of Justice and, as a result of that, we have recently appealed with respect to such decisions. Final
decisions on these cases should be ruled by a group of judges from the same court. The first judge of this group
(which is the previously mentioned Reporting Judge) has already confirmed his vote against our appeal.
Based on advice from external counsel, our chances of receiving unfavorable final decisions are possible and
therefore we have not established a provision in our financial statements. . As these disputes are based on whether
we should receive as a subscription price a lower price than the price that we consider correct, a provision of
amounts with respect to these proceedings would only be applicable with respect to legal fees and past dividends.

93
Distributors and product-related claims
Numerous claims have been filed in Brazil against us by former distributors whose contracts were terminated.
Most claims are still under review by first instance and state Appellate Courts, and a few are currently being
reviewed by the Superior Court of Justice.
Ambev has established provisions in the amount of R$28.3 million in connection with these claims as of
December 31, 2010, based on the advice of external legal counsel.
Antitrust matters
Investigations
We currently have a number of antitrust investigations pending against us before Brazilian antitrust
authorities.
Tô Contigo
On July 22, 2009, CADE issued its ruling in connection with a proceeding initiated in 2004 as a result of a
complaint filed by Schincariol which had, as its main purpose, the investigation of Ambev’s conduct in the market,
in particular Ambev’s customer loyalty program known as ―Tô Contigo‖ and which is similar to airline frequent
flyer and other mileage programs.
During its investigation, the SDE concluded that the program should be considered anticompetitive unless
certain adjustments were made. These adjustments have already been substantially incorporated into the current
version of the program. The SDE opinion did not threaten any fines and recommended that the other accusations be
dismissed. After the SDE opinion, the proceeding was sent to CADE, which issued a ruling that, among other things,
imposed a fine in the amount of R$352.7 million.
Ambev has challanged CADE’s decision before the federal courts, which have ordered the suspension of the
fine and other parts of the decision upon our posting of a guarantee. Ambev has already rendered a court bond (carta
de fiança) for this purpose and the decision was partially suspended.
On March 29, 2011, and following a determination included in the abovementioned CADE decision, the SDE
initiated investigations to determine wheter individuals should also be held responsible for the Tô Contigo practices,
including Bernardo Pinto Paiva currently Zone President of LAS and Ricardo Tadeu Almeida Cabral de Soares,
currently Sales Executive Officer of Ambev.
Kaiser
On April 2, 2007, Cervejaria Kaiser, which is currently the third largest beer producer in Brazil and a part of
the Femsa Group, filed a complaint with Brazilian antitrust authorities alleging that Ambev’s cooler programmes
and exclusivity agreements constituted anti-competitive practices, and also that Ambev launched two counter brands
(Puerto del Sol and Puerto del Mar) in connection with the entry of Kaiser’s product Sol Pilsen in 2006. On
December 9, 2008, the SDE registered two administrative proceedings to investigate the alleged practices. Our
preliminary responses were filed before SDE on February 18, 2009.
630ml Bottle
On April 3, 2008, the Brazilian Association of Carbonated Soft Drinks Manufacturers, the Brazilian
Association of Beverages, which is composed of Schincariol and Petrópolis –two large competitors in Brazil, and
Cervejaria Imperial (a small Brazilian beverage company), filed complaints with Brazilian antitrust authorities
challenging our 630ml returnable bottle launched under the Skol brand in the State of Rio de Janeiro and under the
Bohemia brand in the State of Rio Grande do Sul. On April 17, 2008, Cervejarias Kaiser also filed a complaint with
the Brazilian antitrust authorities challenging the Skol bottle. These competitors claim that we should be prevented
94
from launching the new exclusive 630ml bottle and should be compelled to continue to use the standard 600ml
returnable bottle used by all other producers. On May 27, 2008, SDE issued an injunction prohibiting the use of the
new 630ml bottle by Ambev. Due to an appeal filed by Ambev against the SDE injunction, on July 23, 2008 CADE
decided to allow the use of the 630ml bottle by Ambev in the states of Rio de Janeiro and Rio Grande do Sul, as
long as Ambev maintains a system to change the 630ml bottles acquired by its competitors for 600ml bottles. On
November 3, 2010, CADE unanimously approved an agreement with Ambev on the subject-matter, pursuant to
which Ambev will cease, until August 1, 2011, the use of exclusive 630ml returnable bottles and shall maintain a
system to change such bottles with competitors and points of sale until February 1, 2012. No financial contributions
were made by Ambev in connection therewith.
1L Bottle
On August 20, 2009, the Brazilian Association of Beverages filed a complaint with the Brazilian antitrust
authorities challenging our new proprietary one litre returnable bottle launched under its main brands. The
Association claims that Ambev’s new 1L bottle would cause the standard 600ml bottle exchange system to cease to
exist, therefore artificially increasing the costs of competitors and restricting their access to the points of sale. In
response, on 14 September 2009, Ambev submitted preliminary clarifications to the SDE arguing for the economic
rationality and the benefits to the consumer deriving from the one litre format. On October 28, 2009, SDE decided to
initiate an Administrative Proceeding against us to further investigate the issue. In its note initiating the proceedings,
the SDE stated that although it believes that market producers are in principle free to decide whether or not to
participate in a standard bottle exchange system, it wanted to further investigate whether the manner pursuant to
which Ambev was allegedly introducing the one litre bottle could potentially create lock-in effects. On December
24, 2010, SDE issued its opinion recommending the dismissal of the case stating that: (i) Ambev is free to decide
whether or not it participates in common bottle exchange system, (ii) Ambev is not required to help competitors, and
(iii) innovation moves -- including new bottles -- are pro-competitive. The case shall be now be decided by CADE.
Others
In April 2007, the Brazilian Association of Carbonated Soft Drinks Manufacturers filed a complaint with the
Brazilian antitrust authorities alleging that Ambev engaged in the following anticompetitive practices: (i) predatory
prices, (ii) restriction of competitors’ access to shelf space in supermarkets; (iii) exclusivity agreements with
strategic points of sales; and (iv) adoption of a proprietary reusable glass bottle. In August 2009, SDE initiated a
preliminary inquiry to investigate these alleged practices. The case is still under the analysis of SDE which will
decide whether or not to initiate an administrative proceeding to further investigate the Company.
In July 2007, CADE forwarded to SDE for further investigation a complaint issued by Globalbev Bebidas e
Alimentos Ltda. alleging that Ambev was restricting competitors’ access to the shelf space in supermarkets. In
August 2009, SDE initiated a preliminary inquiry to investigate this supposed anticompetitive practice. The case is
still under the analysis of SDE which will decide whether or not to initiate an administrative proceeding to further
investigate the Company.
After the approval of the acquisition of Cintra in 2008, SDE initiated an administrative proceeding to
investigate the closing in 2009 of a Cintra plant in the City of Mogi-Mirim, in the State of São Paulo. The SDE
wants to investigate whether, after the acquisition, the industrial capacity of Cintra was reduced, contrary to
information provided by Ambev to SDE during the report of the Cintra acquisition. Ambev already informed SDE
about the rationale for the closure of the Mogi-Mirim plant and that the overall capacity of Cintra has increased
substantially after its acquisition by Ambev.
CVM
Caixa de Previdência dos Funcionários do Banco do Brasil - PREVI, a Brazilian pension fund which is one
of our largest minority shareholders, filed an administrative complaint against Ambev with the CVM in April 2004
alleging abuse of position by Ambev’s controlling shareholders and breach of fiduciary duty by Ambev’s directors
in connection with the approval of the InBev-Ambev Transactions, appropriation of commercial opportunity and
inadequate disclosure. The complaint requested, among other things, that the CVM render an opinion contesting the
legality of the transactions and intervene to prevent the closing of the Incorporação. The CVM ruled in December
95
2004 that (i) there was no basis to conclude that there had been an abuse of position by the controlling shareholders
or conflict of interests in relation to them, and (ii) that there was no indication of an appropriation of a commercial
opportunity by the directors of Ambev, without prejudice to any further investigation that the staff of the CVM
might conduct, as appropriate. Moreover, the CVM expressed its opinion that one director involved in the InBev-
Ambev Transactions could not have intervened in the Ambev board resolutions related thereto, recommending
further investigations by the staff. The CVM recommended also that the staff investigate the performance of duty of
care of other directors during the decision process and the adequacy of the disclosure proceeding of the transactions
by Ambev’s officers. The CVM requested certain information related to the InBev-Ambev Transactions and, on
May 6, 2009, Ambev was informed that the CVM had initiated formal complaints against certain Ambev directors
and officers regarding the aforementioned investigations, including Marcel Herrmann Telles, Jorge Paulo Lemann,
Carlos Alberto da Veiga Sicupira and Felipe Dutra. Ambev’s directors and officers presented their defenses
on August 17, 2009. On March 8, 2010, the CVM published its official decision accepting settlement proposals
pursuant to which the regulatory inquiry was closed without a decision on the merits, subject to the payment of: (i)
R$0.3 million by each of Messrs. Lemann and Telles; (ii) R$3.0 million by Mr. Sicupira; (iii) R$0.4 million by Mr.
Dutra; and (iv) R$1.0 million in aggregate by other members of the Board of Directors of Ambev. The settlement
did not entail the recognition of any wrongdoing on the part of any person involved, whether express or implied, nor
did it amount to an admission as to any of the alleged facts described in the regulatory inquiry.
The CVM also initiated an administrative proceeding in October 2008 in which it alleges that certain
shareholders, members of the board of directors and officers of Ambev (including Marcel Herrmann Telles, Jorge
Paulo Lemann, Carlos Alberto da Veiga Sicupira and Felipe Dutra) violated Brazilian Corporate Law and CVM
rules, relating to (i) the potential use of privileged information in relation to the trading of Ambev shares between
May 2003 and March 2004, (ii) the way certain information regarding Ambev was disclosed to the Brazilian market
in March 2004 and (iii) alleged violation of Ambev’s Stock Ownership Program. On June 25, 2009, the CVM
published its official decision accepting a settlement proposal with Mr. Dutra pursuant to which the regulatory
inquiry was closed without a decision on the merits, subject to the payment of R$0.3 million. In addition, on March
8, 2010, the CVM published its official decision accepting settlement proposals with Messrs. Lemann, Telles and
Sicupira pursuant to which the regulatory inquiry was closed without a decision on the merits, subject to the
payment of R$5 million by each of them. The settlements did not entail any admission of wrongdoing by the
individuals involved, whether express or implied, or of any of the alleged facts described in the regulatory inquiry.
The proceedings have continued with respect to Fundação Antonio e Helena Zerrenner, a shareholder of Ambev
unrelated to AB-InBev, which filed a settlement proposal in April 2010.
Environmental matters
Riachuelo
We are challenging certain eviction orders received on November, 2009 from the Government of the City of
Buenos Aires and on October, 2010 from the Autoridad de Cuenca Matanza Riachuelo ("Acumar", an
environmental authority), which are aimed at ordering the removal of all existing construction allegedly preventing
the construction of a towpath along the riverside of the Riachuelo River, in the city of Buenos Aires. In the event we
are unable to successfully defend our property rights against these eviction orders, the operations of our soft drinks
plant and distribution center located in Pompeya, City of Buenos Aires, by the riverside of the Riachuelo River, may
be severely jeopardized.
The Government of the City of Buenos Aires and Acumar argue that the eviction orders issued against all
owners of real estate whose properties lie along the riverside of the Riachuelo River (including Ambev) are based on
a resolution issued by the Argentine Supreme Court of Justice in an environmental complaint initiated by certain
neighbors residing in the Riachuelo Basin against the State of Argentina, the Province of Buenos Aires, the City of
Buenos Aires and more than forty corporate entities (including us). In this complaint, the Argentine Supreme Court
of Justice has resolved that the State of Argentina, the Province of Buenos Aires and the City of Buenos Aires
remain primarily responsible for the remediation of environment, and further resolved that Acumar would be
responsible for the implementation of a Remediation Plan for the Riachuelo Basin.
Others
96
In August 2003, Oliveira Comércio de Sucatas filed a complaint with the Public Attorney of the city of
Pedreira, in the State of São Paulo, alleging that CBB, a predecessor of Ambev, was using the waste disposal site of
the city as a disposal for toxic garbage. In September 2003, we presented our response with all the evidences we
had. This case is still in the discovery phase.
The Public Attorney of the State of Rio de Janeiro has requested on December 12, 2003 the initiation of a civil
investigation to investigate anonymous reports of pollution allegedly caused by Nova Rio, Ambev’s beer plant
located in the state of Rio de Janeiro. Currently this investigation is in the discovery phase. Ambev expects this
investigation to be dismissed as it has presented several expert opinions, including one from the State environmental
agency, showing lack of environmental damages. Simultaneously, the police of Rio de Janeiro have requested the
initiation of a criminal investigation on June 2, 2003 to investigate the author of the alleged crime, which is also in
the discovery phase. Ambev expects this investigation will be dismissed concurrently with the civil investigation
mentioned above.
On April 17, 2007, the Public Prosecutor of Viamão, State of Rio Grande do Sul requested the initiation of a
civil and criminal investigations on reports made by local population of pollution around the plant. Ambev reached a
settlement with the Public Prosecutor of Viamão on June 12, 2007. In February 2009 the investigation was
suspended for a period of three years in order to be certified that the settlement was entirely accomplished by
Ambev.
Suit against Brazilian Beer Industry
On 28 October 2008, the Brazilian Federal Prosecutor’s Office (Ministério Público Federal) filed a suit for
damages against Ambev and two other brewing companies claiming total damages of approximately R$2.8 billion
(of which approximately R$2.1 billion are claimed against Ambev). The public prosecutor alleges that: (i) alcohol
causes serious damage to individual and public health, and that beer is the most consumed alcoholic beverage in
Brazil; (ii) defendants have approximately 90% of the national beer market share and are responsible for heavy
investments in advertising; and (iii) the advertising campaigns increase not only the market share of the defendants
but also the total consumption of alcohol and, hence, damage to society and encourage underage consumption.
Shortly after the above lawsuit was filed, a consumer-protection association applied to be admitted as a
joint-plaintiff. The association has made further requests in addition to the ones made by the Public Prosecutor,
including the claim for ―collective moral damages‖ in an amount to be ascertained by the court; however, it suggests
that it should be equal to the initial request of R$2.8 billion (therefore, it doubles the initial amount involved). The
court has admitted the association as joint-plaintiff and has agreed to hear the new claims. Based on the advice of
external counsel, we believe that our chances of loss are remote and therefore have not made any provision with
respect to such claim.
Dividend Policy
For information regarding our dividend policy, see ―Key Information—Selected Financial Data—
Dividends—Dividend Policy‖.
Significant Changes
Except as otherwise disclosed in our annual financial statements and in this annual report, there have been no
significant changes in our business, financial conditions or results since December 31, 2010.
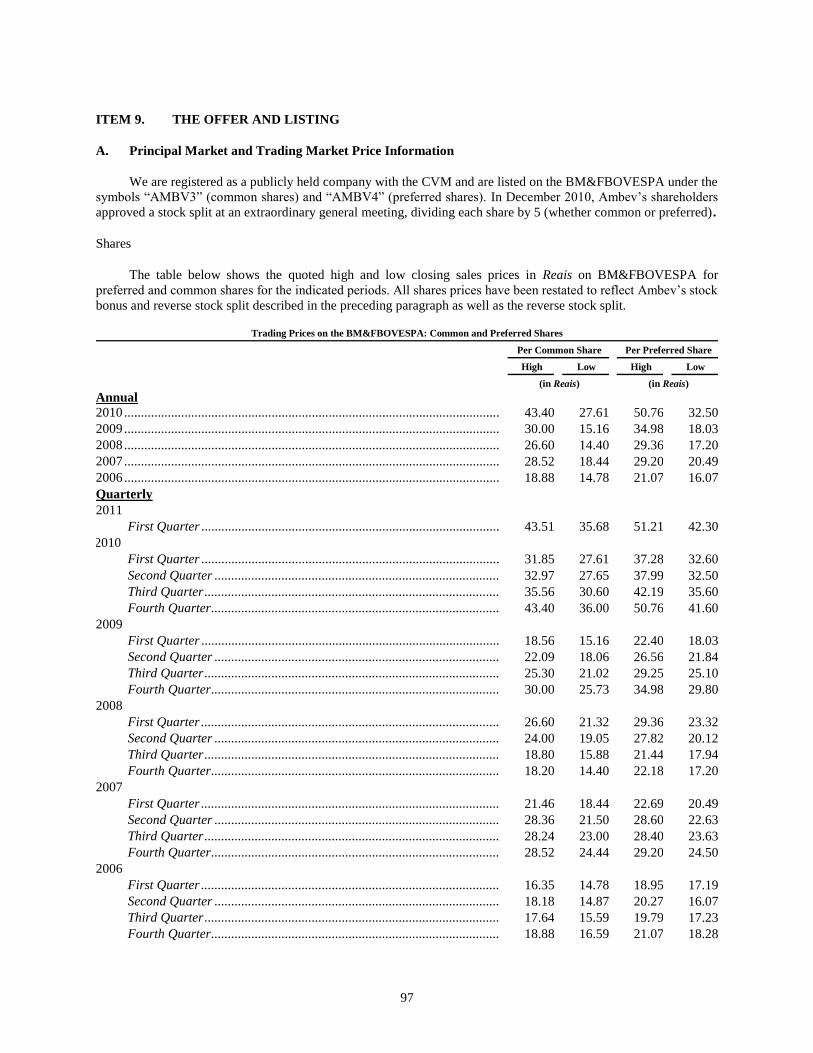
97
ITEM 9. THE OFFER AND LISTING
A. Principal Market and Trading Market Price Information
We are registered as a publicly held company with the CVM and are listed on the BM&FBOVESPA under the
symbols ―AMBV3‖ (common shares) and ―AMBV4‖ (preferred shares). In December 2010, Ambev’s shareholders
approved a stock split at an extraordinary general meeting, dividing each share by 5 (whether common or preferred).
Shares
The table below shows the quoted high and low closing sales prices in Reais on BM&FBOVESPA for
preferred and common shares for the indicated periods. All shares prices have been restated to reflect Ambev’s stock
bonus and reverse stock split described in the preceding paragraph as well as the reverse stock split.
Trading Prices on the BM&FBOVESPA: Common and Preferred Shares
Per Common Share
Per Preferred Share
High
Low
High
Low
(in Reais) (in Reais) Annual
2010 .................................................................................................................................................. 43.40 27.61 50.76 32.50
2009 .................................................................................................................................................. 30.00 15.16 34.98 18.03
2008 .................................................................................................................................................. 26.60 14.40 29.36 17.20
2007 .................................................................................................................................................. 28.52 18.44 29.20 20.49
2006 .................................................................................................................................................. 18.88 14.78 21.07 16.07
Quarterly
2011
First Quarter ........................................................................................................................... 43.51 35.68 51.21 42.30
20102012010
First Quarter ........................................................................................................................... 31.85 27.61 37.28 32.60
Second Quarter ....................................................................................................................... 32.97 27.65 37.99 32.50
Third Quarter .......................................................................................................................... 35.56 30.60 42.19 35.60
Fourth Quarter ........................................................................................................................ 43.40 36.00 50.76 41.60
2009
First Quarter ........................................................................................................................... 18.56 15.16 22.40 18.03
Second Quarter ....................................................................................................................... 22.09 18.06 26.56 21.84
Third Quarter .......................................................................................................................... 25.30 21.02 29.25 25.10
Fourth Quarter ........................................................................................................................ 30.00 25.73 34.98 29.80
2008
First Quarter ........................................................................................................................... 26.60 21.32 29.36 23.32
Second Quarter ....................................................................................................................... 24.00 19.05 27.82 20.12
Third Quarter .......................................................................................................................... 18.80 15.88 21.44 17.94
Fourth Quarter ........................................................................................................................ 18.20 14.40 22.18 17.20
2007
First Quarter ........................................................................................................................... 21.46 18.44 22.69 20.49
Second Quarter ....................................................................................................................... 28.36 21.50 28.60 22.63
Third Quarter .......................................................................................................................... 28.24 23.00 28.40 23.63
Fourth Quarter ........................................................................................................................ 28.52 24.44 29.20 24.50
2006
First Quarter ........................................................................................................................... 16.35 14.78 18.95 17.19
Second Quarter ....................................................................................................................... 18.18 14.87 20.27 16.07
Third Quarter .......................................................................................................................... 17.64 15.59 19.79 17.23
Fourth Quarter ........................................................................................................................ 18.88 16.59 21.07 18.28
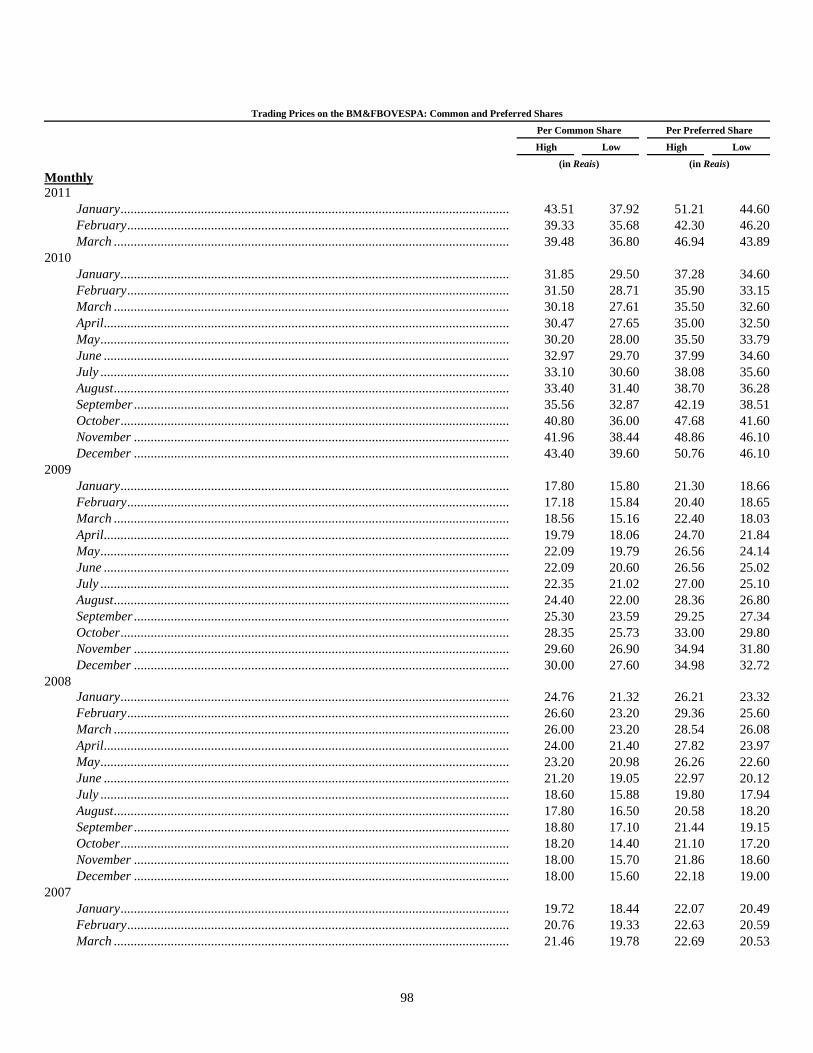
98
Trading Prices on the BM&FBOVESPA: Common and Preferred Shares
Per Common Share
Per Preferred Share
High
Low
High
Low
(in Reais) (in Reais) Monthly
2011
January .................................................................................................................................... 43.51 37.92 51.21 44.60
February .................................................................................................................................. 39.33 35.68 42.30 46.20
March ...................................................................................................................................... 39.48 36.80 46.94 43.89
2010
January .................................................................................................................................... 31.85 29.50 37.28 34.60
February .................................................................................................................................. 31.50 28.71 35.90 33.15
March ...................................................................................................................................... 30.18 27.61 35.50 32.60
April ......................................................................................................................................... 30.47 27.65 35.00 32.50
May .......................................................................................................................................... 30.20 28.00 35.50 33.79
June ......................................................................................................................................... 32.97 29.70 37.99 34.60
July .......................................................................................................................................... 33.10 30.60 38.08 35.60
August ...................................................................................................................................... 33.40 31.40 38.70 36.28
September ................................................................................................................................ 35.56 32.87 42.19 38.51
October .................................................................................................................................... 40.80 36.00 47.68 41.60
November ................................................................................................................................ 41.96 38.44 48.86 46.10
December ................................................................................................................................ 43.40 39.60 50.76 46.10
2009
January .................................................................................................................................... 17.80 15.80 21.30 18.66
February .................................................................................................................................. 17.18 15.84 20.40 18.65
March ...................................................................................................................................... 18.56 15.16 22.40 18.03
April ......................................................................................................................................... 19.79 18.06 24.70 21.84
May .......................................................................................................................................... 22.09 19.79 26.56 24.14
June ......................................................................................................................................... 22.09 20.60 26.56 25.02
July .......................................................................................................................................... 22.35 21.02 27.00 25.10
August ...................................................................................................................................... 24.40 22.00 28.36 26.80
September ................................................................................................................................ 25.30 23.59 29.25 27.34
October .................................................................................................................................... 28.35 25.73 33.00 29.80
November ................................................................................................................................ 29.60 26.90 34.94 31.80
December ................................................................................................................................ 30.00 27.60 34.98 32.72
2008
January .................................................................................................................................... 24.76 21.32 26.21 23.32
February .................................................................................................................................. 26.60 23.20 29.36 25.60
March ...................................................................................................................................... 26.00 23.20 28.54 26.08
April ......................................................................................................................................... 24.00 21.40 27.82 23.97
May .......................................................................................................................................... 23.20 20.98 26.26 22.60
June ......................................................................................................................................... 21.20 19.05 22.97 20.12
July .......................................................................................................................................... 18.60 15.88 19.80 17.94
August ...................................................................................................................................... 17.80 16.50 20.58 18.20
September ................................................................................................................................ 18.80 17.10 21.44 19.15
October .................................................................................................................................... 18.20 14.40 21.10 17.20
November ................................................................................................................................ 18.00 15.70 21.86 18.60
December ................................................................................................................................ 18.00 15.60 22.18 19.00
2007
January .................................................................................................................................... 19.72 18.44 22.07 20.49
February .................................................................................................................................. 20.76 19.33 22.63 20.59
March ...................................................................................................................................... 21.46 19.78 22.69 20.53

99
Trading Prices on the BM&FBOVESPA: Common and Preferred Shares
Per Common Share
Per Preferred Share
High
Low
High
Low
(in Reais) (in Reais) April ......................................................................................................................................... 23.62 21.50 24.41 22.63
May .......................................................................................................................................... 26.42 23.80 26.70 24.30
June ......................................................................................................................................... 28.36 26.40 28.60 26.26
July .......................................................................................................................................... 28.24 26.40 28.40 25.90
August ...................................................................................................................................... 27.00 23.00 27.20 23.63
September ................................................................................................................................ 27.16 25.34 27.10 25.46
October .................................................................................................................................... 28.40 27.10 29.20 27.00
November ................................................................................................................................ 28.52 24.44 28.60 24.50
December ................................................................................................................................ 26.40 24.49 27.60 25.40
ADRs
Ambev has registered two classes of ADSs pursuant to the Securities Exchange Act: ADSs evidenced by
ADRs representing one preferred share, and ADSs evidenced by ADRs representing one common share. The ADSs
have been listed on the New York Stock Exchange since September 2000 and trade under the symbols ―ABV.c‖
(ADSs representing Ambev common shares) and ―ABV‖ (ADSs representing Ambev preferred shares).
As of December 31, 2010 there were 28 registered holders of our common ADSs, with 4,262,685 ADSs
outstanding. As of December 31, 2010, there were 24 registered holders of our preferred ADSs, with 274,126,178
ADSs outstanding.
The information presented in the table below represents, for the indicated periods, the reported high and low
closing sales prices of ADRs quoted in U.S. dollars on the New York Stock Exchange. All shares prices have been
restated to reflect Ambev’s stock bonus and the reverse stock split described above.
Trading Prices on the New York Stock Exchange: ADRs Representing Common and Preferred Shares
Per Common Share ADR
Per Preferred Share ADR
High
Low
High
Low
( in U.S.$ ) ( in U.S.$ ) Annual
2010 .......................................................................................................................................... 26.30 15.40 31.12 17.82
2009 .......................................................................................................................................... 17.40 6.21 20.44 7.42
2008 .......................................................................................................................................... 15.95 6.01 17.64 7.30
2007 .......................................................................................................................................... 16.00 8.53 16.50 9.55
2006 .......................................................................................................................................... 8.81 6.32 9.83 6.80
2005 .......................................................................................................................................... 8.75 4.29 8.09 4.20
2004 .......................................................................................................................................... 8.68 3.42 4.90 2.80
2003 .......................................................................................................................................... 3.43 1.99 4.41 2.25
2002 .......................................................................................................................................... 3.13 1.70 3.72 1.85
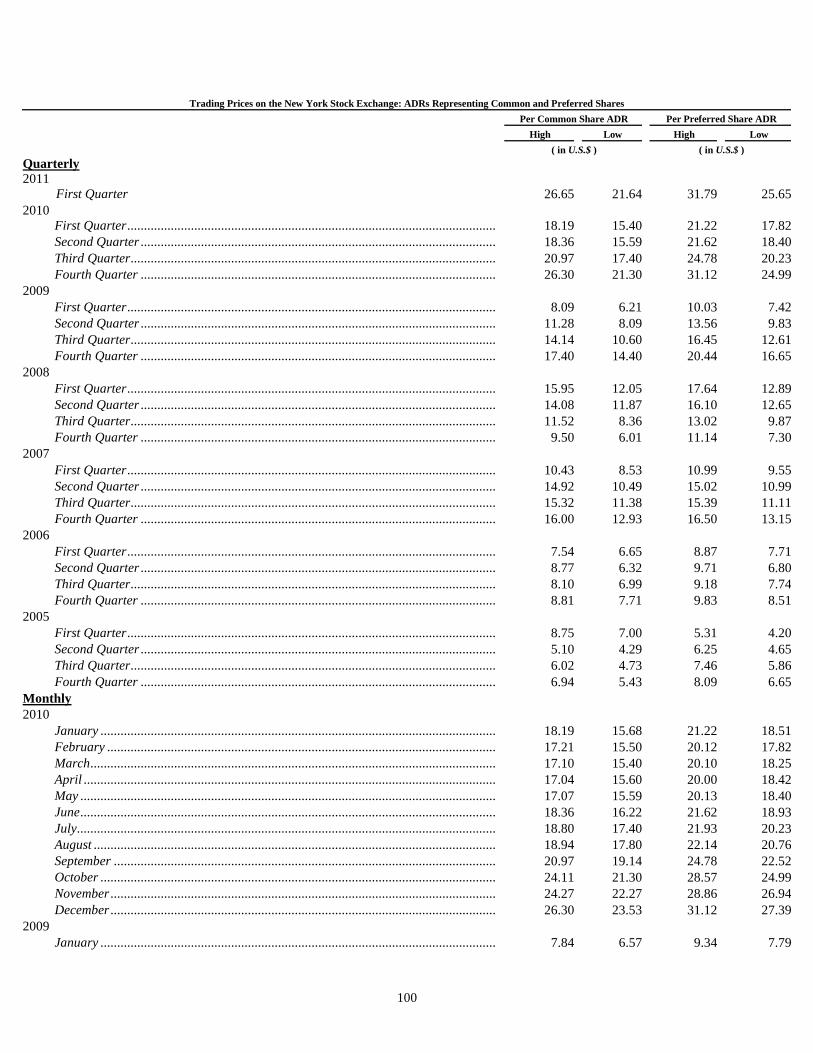
100
Trading Prices on the New York Stock Exchange: ADRs Representing Common and Preferred Shares
Per Common Share ADR
Per Preferred Share ADR
High
Low
High
Low
( in U.S.$ ) ( in U.S.$ ) Quarterly
2011
First Quarter 26.65 21.64 31.79 25.65
2010 First Quarter ................................................................................................................... 18.19 15.40 21.22 17.82
Second Quarter ............................................................................................................... 18.36 15.59 21.62 18.40
Third Quarter .................................................................................................................. 20.97 17.40 24.78 20.23
Fourth Quarter ............................................................................................................... 26.30 21.30 31.12 24.99
2009
First Quarter ................................................................................................................... 8.09 6.21 10.03 7.42
Second Quarter ............................................................................................................... 11.28 8.09 13.56 9.83
Third Quarter .................................................................................................................. 14.14 10.60 16.45 12.61
Fourth Quarter ............................................................................................................... 17.40 14.40 20.44 16.65
2008
First Quarter ................................................................................................................... 15.95 12.05 17.64 12.89
Second Quarter ............................................................................................................... 14.08 11.87 16.10 12.65
Third Quarter .................................................................................................................. 11.52 8.36 13.02 9.87
Fourth Quarter ............................................................................................................... 9.50 6.01 11.14 7.30
2007
First Quarter ................................................................................................................... 10.43 8.53 10.99 9.55
Second Quarter ............................................................................................................... 14.92 10.49 15.02 10.99
Third Quarter .................................................................................................................. 15.32 11.38 15.39 11.11
Fourth Quarter ............................................................................................................... 16.00 12.93 16.50 13.15
2006
First Quarter ................................................................................................................... 7.54 6.65 8.87 7.71
Second Quarter ............................................................................................................... 8.77 6.32 9.71 6.80
Third Quarter .................................................................................................................. 8.10 6.99 9.18 7.74
Fourth Quarter ............................................................................................................... 8.81 7.71 9.83 8.51
2005
First Quarter ................................................................................................................... 8.75 7.00 5.31 4.20
Second Quarter ............................................................................................................... 5.10 4.29 6.25 4.65
Third Quarter .................................................................................................................. 6.02 4.73 7.46 5.86
Fourth Quarter ............................................................................................................... 6.94 5.43 8.09 6.65
Monthly
2010
January ........................................................................................................................... 18.19 15.68 21.22 18.51
February ......................................................................................................................... 17.21 15.50 20.12 17.82
March .............................................................................................................................. 17.10 15.40 20.10 18.25
April ................................................................................................................................ 17.04 15.60 20.00 18.42
May ................................................................................................................................. 17.07 15.59 20.13 18.40
June ................................................................................................................................. 18.36 16.22 21.62 18.93
July .................................................................................................................................. 18.80 17.40 21.93 20.23
August ............................................................................................................................. 18.94 17.80 22.14 20.76
September ....................................................................................................................... 20.97 19.14 24.78 22.52
October ........................................................................................................................... 24.11 21.30 28.57 24.99
November ........................................................................................................................ 24.27 22.27 28.86 26.94
December ........................................................................................................................ 26.30 23.53 31.12 27.39
2009
January ........................................................................................................................... 7.84 6.57 9.34 7.79
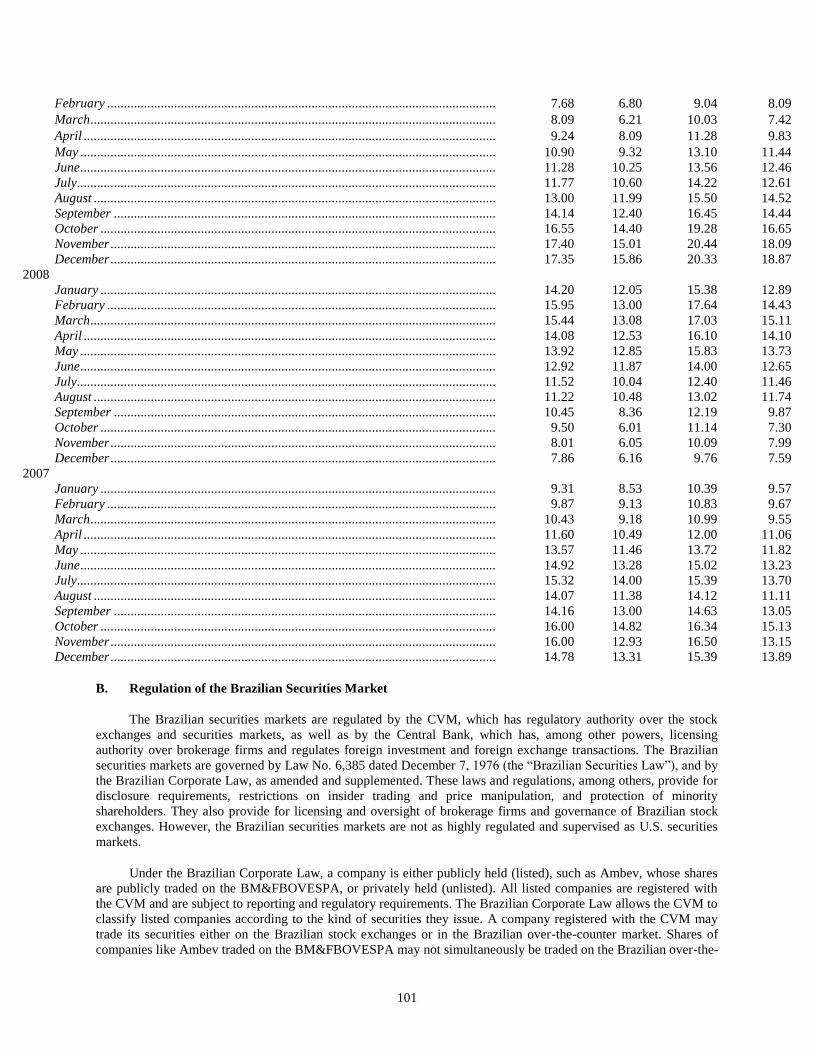
101
February ......................................................................................................................... 7.68 6.80 9.04 8.09
March .............................................................................................................................. 8.09 6.21 10.03 7.42
April ................................................................................................................................ 9.24 8.09 11.28 9.83
May ................................................................................................................................. 10.90 9.32 13.10 11.44
June ................................................................................................................................. 11.28 10.25 13.56 12.46
July .................................................................................................................................. 11.77 10.60 14.22 12.61
August ............................................................................................................................. 13.00 11.99 15.50 14.52
September ....................................................................................................................... 14.14 12.40 16.45 14.44
October ........................................................................................................................... 16.55 14.40 19.28 16.65
November ........................................................................................................................ 17.40 15.01 20.44 18.09
December ........................................................................................................................ 17.35 15.86 20.33 18.87
2008
January ........................................................................................................................... 14.20 12.05 15.38 12.89
February ......................................................................................................................... 15.95 13.00 17.64 14.43
March .............................................................................................................................. 15.44 13.08 17.03 15.11
April ................................................................................................................................ 14.08 12.53 16.10 14.10
May ................................................................................................................................. 13.92 12.85 15.83 13.73
June ................................................................................................................................. 12.92 11.87 14.00 12.65
July .................................................................................................................................. 11.52 10.04 12.40 11.46
August ............................................................................................................................. 11.22 10.48 13.02 11.74
September ....................................................................................................................... 10.45 8.36 12.19 9.87
October ........................................................................................................................... 9.50 6.01 11.14 7.30
November ........................................................................................................................ 8.01 6.05 10.09 7.99
December ........................................................................................................................ 7.86 6.16 9.76 7.59
2007 January ........................................................................................................................... 9.31 8.53 10.39 9.57
February ......................................................................................................................... 9.87 9.13 10.83 9.67
March .............................................................................................................................. 10.43 9.18 10.99 9.55
April ................................................................................................................................ 11.60 10.49 12.00 11.06
May ................................................................................................................................. 13.57 11.46 13.72 11.82
June ................................................................................................................................. 14.92 13.28 15.02 13.23
July .................................................................................................................................. 15.32 14.00 15.39 13.70
August ............................................................................................................................. 14.07 11.38 14.12 11.11
September ....................................................................................................................... 14.16 13.00 14.63 13.05
October ........................................................................................................................... 16.00 14.82 16.34 15.13
November ........................................................................................................................ 16.00 12.93 16.50 13.15
December ........................................................................................................................ 14.78 13.31 15.39 13.89
B. Regulation of the Brazilian Securities Market
The Brazilian securities markets are regulated by the CVM, which has regulatory authority over the stock
exchanges and securities markets, as well as by the Central Bank, which has, among other powers, licensing
authority over brokerage firms and regulates foreign investment and foreign exchange transactions. The Brazilian
securities markets are governed by Law No. 6,385 dated December 7, 1976 (the ―Brazilian Securities Law‖), and by
the Brazilian Corporate Law, as amended and supplemented. These laws and regulations, among others, provide for
disclosure requirements, restrictions on insider trading and price manipulation, and protection of minority
shareholders. They also provide for licensing and oversight of brokerage firms and governance of Brazilian stock
exchanges. However, the Brazilian securities markets are not as highly regulated and supervised as U.S. securities
markets.
Under the Brazilian Corporate Law, a company is either publicly held (listed), such as Ambev, whose shares
are publicly traded on the BM&FBOVESPA, or privately held (unlisted). All listed companies are registered with
the CVM and are subject to reporting and regulatory requirements. The Brazilian Corporate Law allows the CVM to
classify listed companies according to the kind of securities they issue. A company registered with the CVM may
trade its securities either on the Brazilian stock exchanges or in the Brazilian over-the-counter market. Shares of
companies like Ambev traded on the BM&FBOVESPA may not simultaneously be traded on the Brazilian over-the-
102
counter market. The shares of a listed company, including Ambev, may also be traded privately subject to several
limitations. To be listed on the BM&FBOVESPA, a company must apply for registration with the CVM and the
BM&FBOVESPA.
The trading of securities on the Brazilian stock exchanges may be halted at the request of a company in
anticipation of a material announcement. Companies are sometimes required by law to request such suspension.
Trading may also be suspended on the initiative of a Brazilian stock exchange or the CVM, among other reasons,
based on or due to a belief that a company has provided inadequate information regarding a significant event or has
provided inadequate responses to inquiries by the CVM or a stock exchange.
Trading on the Brazilian Stock Exchanges
BM&FBOVESPA is the only Brazilian stock exchange on which private equity and private debt may be
traded.
BM&FBOVESPA trading sessions are from 10:00 a.m. to 5:00 p.m., São Paulo time. During daylight saving
time in the United States, the sessions are held from 9:00 a.m. to 4:00 p.m., São Paulo time (closing call is from 4:55
p.m. to 5:00 p.m.). Equity trading is executed fully electronically through an order-driven trading system called
Megabolsa. Additionally, the home broker system through the Internet has been established allowing retail investors
to transmit orders directly to the BM&FBOVESPA. BM&FBOVESPA also permits trading from 5:45 p.m. to 7:00
p.m. on an online system connected to Megabolsa and Internet brokers called the After Market. The After Market
session is restricted to certain stocks that were traded through the electronic system. Trading on the After Market is
subject to regulatory limits on price volatility and on the volume of shares transacted through Internet brokers. CVM
has discretionary authority to suspend trading in shares of a particular issuer under specific circumstances. Securities
listed on the BM&FBOVESPA may also be traded off the exchange under specific circumstances, but such trading
is very limited.
Settlement of transactions is effected three business days after the trade date, without adjustment for inflation.
Delivery of and payment for shares are made through the facilities of separate clearinghouses for each exchange,
which maintain accounts for the member brokerage firms. The seller is ordinarily required to deliver the shares to
the exchange on the second business day following the trade date. The clearing house for BM&FBOVESPA is
Companhia Brasileira de Liquidação e Custódia (―CBLC‖), which is owned, among others, by BM&FBOVESPA.
In order to better control volatility, BM&FBOVESPA has adopted a ―circuit breaker‖ mechanism pursuant to
which trading sessions may be suspended for a period of 30 minutes or one hour whenever the index of the stock
exchange falls 10% or 15%, respectively, compared to the previous day’s closing index. If the market falls more
than 15% compared to the previous day no more pauses are taken. The ―circuit breaker‖ is not allowed to be started
during the last 30 minutes of the trading session.
Although the Brazilian equity market is Latin America’s largest in terms of market capitalization, it is smaller,
more volatile and less liquid than the major U.S. and European securities markets. As of December 31, 2008, the
aggregate market capitalization of all the companies listed on BM&FBOVESPA was equivalent to approximately
R$1.4 trillion. Although all of the outstanding shares of a listed company are actually available for trading by the
public, in most cases fewer than half of the listed shares are actually traded by the public because the remainder of a
listed company’s shares are usually held by small groups of controlling persons, by governmental entities or by one
principal shareholder. For this reason, data showing the total market capitalization of Brazilian stock exchanges tend
to overstate the liquidity of the Brazilian equity securities market.
There is also significantly greater concentration in the Brazilian securities markets. During the year ended
December 31, 2010, the ten most actively traded issues represented approximately 53.05% of the total value of
shares traded on BM&FBOVESPA, comparable to the 54.11% of total value in 2009.
Trading on Brazilian stock exchanges by non-residents of Brazil is subject to limitations under Brazilian
foreign investment legislation. See ―Key Information—Exchange Rate Information—Exchange Controls‖ and
―Additional Information—Memorandum and Articles of Association—Restrictions on Foreign Investment‖.
103
ITEM 10. ADDITIONAL INFORMATION
A. Memorandum and Articles of Association
Set forth below is a brief summary of the material provisions concerning our preferred shares, common
shares, bylaws and the Brazilian Corporate Law. In Brazil, the principal governing document of a corporation is the
company’s bylaws (―Estatuto Social―). This description is qualified in its entirety by reference to the Brazilian
Corporate Law and our bylaws. An English translation of our bylaws has been filed with the SEC as an exhibit to
this annual report. A copy of our bylaws (together with an English translation) is also available for inspection at the
principal office of the depositary and at our website (www.Ambev-ir.com). Information on the trading market for
our preferred shares is set forth under ―The Offer and Listing—Principal Market and Trading Market Price
Information‖ and information on ownership of our shares is set forth under ―Major Shareholders and Related Party
Transactions—Major Shareholders‖.
Our capital stock is comprised of preferred shares and common shares, all without par value. At December 31,
2010, there were 1,359,864,475 total preferred shares outstanding and 1,743,364,345 total common shares
outstanding, excluding the shares held in treasury. We are authorized to increase our capital up to 3,500,000,000
shares upon the decision of our Board of Directors, without the need to amend our bylaws. There are no other
classes or series of preferred shares outstanding.
Each common share entitles the holder thereof to one vote at meetings of our shareholders. Holders of
common shares are not entitled to any preference relating to our dividends or other distributions or any preference
upon our liquidation.
Each preferred share is non-voting, may not be converted into a common share, and is entitled to:
(i) priority in the reimbursement of capital in case of company’s liquidation; and
(ii) the right to receive dividends in an amount per share at least 10% higher than the amount per share
paid to holders of common shares.
See ―Voting Rights‖ for more information regarding the voting rights of our preferred shares.
Although Law No. 10,303/01 amended the Brazilian Corporate Law to establish that the number of non-
voting shares or shares with limited voting rights, such as our preferred shares, may not exceed half (50%) of the
total number of issued shares, since Ambev was incorporated prior to the enactment of Law No. 10,303/01, it is still
allowed by law to have non-voting shares up to two-thirds of the total number of its shares.
The current members of our Board of Directors were elected by the controlling shareholders of our common
shares. Board members, regardless of the shareholder they represent, owe fiduciary duties towards the Company and
all of its shareholders. At the same time, any director appointed by shareholders bound by a shareholders’ agreement
is also bound by the terms of such agreement. For further information on this matter see ―Major Shareholders and
Related Party Transactions—Major Shareholders—Ambev Shareholders’ Agreement‖.
General
Our registered name is Companhia de Bebidas das Américas—Ambev and our registered office is in São
Paulo, SP, Brazil. Our registration number with the São Paulo Commercial Registry is 35,300,157,770. Ambev’s
principal corporate purposes include the production and sale of beer, CSDs and other beverages. A more detailed
description of Ambev’s purposes can be found in Chapter I, Article 3 of Ambev’s bylaws.
Board of Directors
104
In accordance with the Brazilian Corporate Law, any matters subject to the approval of our Board of Directors
can be approved by the affirmative vote of a majority of our Board members present at the relevant meeting, except
as provided in Ambev’s Shareholders’ Agreement.
According to the general principles of the Brazilian Corporate Law, if a director or an executive officer has a
conflict of interest with a company in connection with any proposed transaction, the director or executive officer
may not vote in any decision of the Board of Directors or of the board of executive officers regarding such
transaction and must disclose the nature and extent of the conflicting interest for transcription in the minutes of the
meeting. In any case, a director or an executive officer may not transact any business with such company, including
any borrowings, except on reasonable or fair terms and conditions that are identical to the terms and conditions
prevailing in the market or offered by third parties. Any transaction in which a director may have an interest can
only be approved if carried out on an arm’s length basis.
Our bylaws and the Brazilian Corporate Law require that our directors be shareholders of the Company.
Ownership of one share is sufficient to satisfy this condition.
Dividends and Reserves
The discussion below summarizes the main provisions of the Brazilian Corporate Law regarding the
establishment of reserves by corporations and rules with respect to the distribution of dividends, including
provisions regarding the interest on shareholders’ equity.
Calculation of Distributable Amounts
At each Annual Shareholders’ meeting, our Board of Directors is required to propose how the Company’s net
earnings for the preceding fiscal year are to be allocated. For purposes of the Brazilian Corporate Law, a company’s
net income after income taxes and social contribution taxes for such fiscal year, net of any accumulated losses from
prior fiscal years and amounts allocated to employees’ and management’s participation in earnings represents its
―adjusted income‖ for such fiscal year. In accordance with the Brazilian Corporate Law, an amount equal to such
―adjusted income‖ (which we will refer to as the ―distributable amount‖) will be available for distribution to
shareholders in any particular year. Such distributable amount is subject to:
▪Reductions that may be caused by amounts contributed for the purpose of meeting the charges of the
assistance foundation (in our case, Fundação Zerrenner) for employees and management of the
Company and its controlled companies, with due regard for the rules established by the Board of
Directors to this effect. Up to 10% of the distributable amount may be contributed under this concept;
▪Reductions caused by amounts allocated to the ―Legal Reserve‖ or contingency reserves. See ―—
Reserves‖; and
▪Increases caused by reversals of reserves constituted in prior years.
Mandatory Dividend
Ambev is required by its bylaws to distribute to shareholders as dividends in respect to each fiscal year ending
on December 31 an amount not less than 35% of the distributable amount (mandatory dividend). In addition to the
mandatory dividend, the Board of Directors may recommend payment of additional dividends to shareholders. The
limit for dividend payment is the distributable amount plus the balance available in our statutory ―Investment
Reserve‖, to which we allocate distributable amounts from previous fiscal years not paid as dividends. See ―—
Reserves‖. Furthermore, dividend payments may be implemented in advance, during the fiscal year to which it is
related, upon the decision of the Board of Directors. Any amount paid as a dividend in advance will be considered
by the end of the fiscal year as part of the mandatory dividend owed to shareholders.
In addition, the mandatory dividend, either the full amount or a portion thereof, may not be paid in any given
year should the Board of Directors consider that such payment is incompatible with the company’s financial
situation, subject to shareholder approval. While the law does not establish the circumstances in which payment of
the mandatory dividend is ―incompatible‖ with a company’s financial situation, it is generally agreed that a company

105
is allowed not to pay the mandatory dividend if such payment threatens the existence of the company as a going
concern or harms its normal course of operations. Our Conselho Fiscal must opine on the non-payment of
mandatory dividends, and the Company’s management is supposed to provide to the CVM, no later than five
business days after such a decision is taken, a report explaining the reasons considered by the Board of Directors.
Any postponed payment of mandatory dividends must be allocated as a special reserve. Any remaining
balance of such reserve not absorbed by losses in subsequent fiscal years must be paid to shareholders as soon as the
Company’s financial situation allows.
Dividend Preference of Preferred Shares
Pursuant to Ambev’s bylaws, preferred shares are entitled to dividends 10% greater than the dividends to be
paid to common shares.
Payment of Dividends
Under Brazilian Corporate Law any holder of record of shares at the time of a dividend declaration is entitled
to receive dividends, which are generally required to be paid within 60 days following the date of such declaration,
unless a shareholders’ resolution sets forth another date of payment, which, in either case, must occur prior to the
end of the fiscal year in which such dividends were declared. Ambev’s bylaws do not provide for a time frame for
payment of dividends. The mandatory dividend is satisfied through payments made in the form of dividends and
interest on shareholders’ equity, which is equivalent, from an economic perspective, to a dividend, but is usually a
tax maximizing way to distribute earnings to our shareholders, as it is deductible for income tax purposes up to a
certain limit established in Brazilian tax laws (see ―—Interest on shareholders’ equity‖). Shareholders have a three-
year period from the dividend payment date to claim the payment of dividends, after which we have no liability for
such payment.
Shareholders who are not residents of Brazil must register their investment with the Central Bank in order for
dividends, sales proceeds or other amounts to be eligible for remittance in foreign currency outside of Brazil. The
preferred and common shares underlying our ADSs are deposited with the Brazilian custodian, Banco Bradesco
S.A., which acts on behalf of and as agent for the depositary of the ADSs (The Bank of New York Mellon), which is
registered with the Central Bank as the fiduciary owner of such Ambev shares. Payments of cash dividends and
distributions, if any, on common and preferred shares will be made in Reais to the custodian on behalf of the
depositary. The custodian will then convert such proceeds into U.S. dollars and will deliver such U.S. dollars to the
depositary for distribution to the holders of ADSs. In the event that the custodian is unable to immediately convert
the dividends in Reais into U.S. dollars, holders of the preferred and common ADSs may be adversely affected by
devaluations or other exchange rate fluctuations before such dividends can be converted and remitted. Fluctuations
in the exchange rate between the Real and the U.S. dollar may also affect the U.S. dollar equivalent of the Real price
of the preferred and common shares on the BM&FBOVESPA.
Interest on shareholders’ equity
Brazilian companies are permitted to distribute earnings to shareholders under the concept of interest on
shareholders’ equity calculated using the Company’s net equity multiplied by the TJLP. The TJLP is the official
interest rate defined by the Central Bank and used as reference in long-term loans provided by the BNDES.
The amounts paid as interest on shareholders’ equity are deductible for Ambev’s income tax and social
contribution on net profits purposes. This deduction is limited to the greater of (i) 50% of the net income (after
social contribution on net profits, and before taking the interest on shareholders’ equity or income tax into account);
or (ii) 50% of retained earnings plus any earnings reserves as of the initial date of the period in respect of which the
payment is made.
Interest on shareholders’ equity is treated similarly to dividends for purposes of income distribution. The only
significant difference is that a 15% withholding tax is due by non-exempt shareholders, resident or not in Brazil,
upon receipt of such interest payment, which tax is collected by the Company on behalf of its shareholders when the
106
distribution is implemented. If the shareholder is not a Brazilian resident, and is resident or domiciled in a tax-haven
jurisdiction according to Brazilian tax legislation, the withholding tax is due at a 25% rate. According to Brazilian
tax legislation, in the case of payments of interest on shareholders’ equity, a shareholder’s country or location should
be deemed a tax-haven jurisdiction when (a) such country or location does not tax income, (b) such country or
location taxes income at a rate lower than 20%, or (c) the laws of such country or location do not allow access to
information related to shareholding composition, to the ownership of investments, or to the identification of the
beneficial owner of earnings that are attributed to non-residents. The Brazilian Revenue Service periodically issues
an exhaustive list naming tax haven jurisdictions.
The amount shareholders receive as interest on shareholders’ equity net of taxes is deducted from the
mandatory dividend owed to shareholders.
Reserves
General
The Brazilian Corporate Law provides that all discretionary allocations of ―adjusted income‖, including the
Unrealized Income Reserve and the Investment Reserve, are subject to shareholder approval and may be added to
capital (except for the amounts allocated to the Unrealized Income Reserve) or distributed as dividends in
subsequent years. In the case of Tax Incentive Reserve and the Legal Reserve, they are also subject to shareholder
approval; however, the use of their respective balances is restricted to being added to capital or the absorption of
losses. They cannot be used as a source for income distribution to shareholders.
Legal Reserve
Under Brazilian Corporate Law, corporations are required to maintain a ―Legal Reserve‖ to which they must
allocate 5% of their ―adjusted income‖ for each fiscal year until the balance of the reserve equals 20% of their paid-
in capital. However, corporations are not required to make any allocations to their legal reserve in a fiscal year in
which the Legal Reserve, when added to other established capital reserves, exceeds 30% of their paid-in capital.
Accumulated losses, if any, may be charged against the Legal Reserve. Other than that, the Legal Reserve can only
be used to increase a company’s capital.
Ambev’s Legal Reserve added to other established capital reserves exceeds 30% of our paid-in capital.
Contingency Reserve
Under the Brazilian Corporate Law, a portion of our ―adjusted income‖ may also be discretionally allocated to
a ―contingency reserve‖ for an anticipated loss that is deemed probable in future years. Any amount so allocated in a
prior year must be either reversed in the fiscal year in which the loss was anticipated if such loss does not in fact
occur or is not charged off in the event that the anticipated loss occurs.
Investment Reserve
Under Brazilian Corporate Law, a portion of a corporation’s ―adjusted income‖ may be allocated for
discretionary appropriations for plant expansion and other fixed or working capital investment projects, including
share buyback programs.
Pursuant to the Brazilian Corporate Law and to the Company’s bylaws, the Investment Reserve balance is not
allowed to be greater than 80% of the company’s capital. In the case such limit is reached, shareholders may vote for
the amount in excess to be converted into capital or distributed as dividends.
107
Unrealized Income Reserve
Pursuant to Brazilian Corporate Law, the amount by which the mandatory dividend exceeds the ―realized‖
portion of net profits for any particular year may be allocated to the unrealized income reserve. The ―realized‖
portion of net profits is the amount by which ―adjusted income‖ exceeds the sum of:
(i) Our net positive results, if any, from the equity method of accounting for earnings and losses of our
subsidiaries and certain affiliates; and
(ii) The net profits, net gains or net return obtained on transactions or on accounting of assets and
liabilities based on their market value, to be completed after the end of the following fiscal year.
Tax Incentive Reserve
Under Brazilian tax laws, a portion of ―adjusted income‖ may also be allocated to a general ―tax incentive
reserve‖ in amounts corresponding to reductions in a company’s income tax generated by credits for particular
government-approved investments. This reserve is available only in connection with the acquisition of capital stock
of companies undertaking specific government-approved projects.
Goodwill premium from shares issued
Pursuant to the Brazilian Corporate Law, the amount received from subscription shares in excess of the
average book value of the shares should be allocated in this reserve. The amount can be used for future capital
increases without the issuance of new shares or to support our share buy-back program.
Fiscal Benefit of goodwill premium amortization - Normative Instruction 319/99
Pursuant to the Normative Instruction 319/99 issued by CVM, when a public company merges with its parent
company, while remaining a public company, the goodwill previously paid by the parent company on its acquisition
which is deductible for income tax and social contribution purposes, this future tax benefit is recorded as a capital
reserve by the public company. As this benefit is realized, the public company increases its capital proportionally to
the benefit, and is able to issue new shares to the parent company, pursuant to the terms of the merger agreement.
Voting Rights
Each common share entitles its holder to one vote at Ambev’s shareholders’ meetings. Holders of preferred
shares are not ordinarily entitled to vote at Ambev’s shareholders’ meetings.
The Brazilian Corporate Law provides that non-voting preferred shares entitled to receive minimum or fixed
dividends acquire full voting rights in the event that a company fails to pay the minimum or fixed dividends to
which such shares are entitled for the period established by such company’s bylaws, which may not exceed three
consecutive fiscal years. Such voting rights continue until payment of dividends is resumed (or until all dividends
due are paid, in the case of preferred shares with the right to receive dividends cumulatively). The same rule applies
to preferred shares with restricted voting rights, causing the suspension of the restrictions in place. Our by-
laws include a similar provision applicable to preferred stock with minimum dividends, if and when issued. Our
preferred stock does not have minimum or fixed dividends.
Election of Directors
Each common share of Ambev represents one vote at any shareholders’ meeting in connection with the
election of the Board of Directors of Ambev. Common shareholders holding at least 15% of voting capital or
preferred shareholders holding at least 10% of total capital may each elect one member of the Board of Directors
and its alternate member. Additionally, if such shareholders do not achieve such percentage, they can jointly appoint
one member of the Board of Directors and its alternate member once they represent, together, at least 10% of total
capital. In order to exercise these minority rights, shareholders must prove that they have held the shares for at least
108
the last three months. If such prerogative is exercised with the adoption of a cumulative voting procedure, the
controlling shareholder will always have the right to elect the same number of members appointed by minority
shareholders plus one, regardless of the number of directors provided in the Company’s bylaws.
Shareholders holding shares representing at least 10% of the shares entitled to vote in the shareholders’
meeting, or such smaller percentage applicable according to a sliding scale determined by the CVM and based on
the capital of the company (5% of the voting shares, in the case of Ambev), have the right to request that a
cumulative voting procedure be adopted. Under such procedure, each voting share shall have as many votes as there
are positions of directors to be filled, and each shareholder may cast all the votes for a single candidate or distribute
them among various candidates.
Under Ambev’s bylaws and applicable law, the number of directors may be reduced to a minimum of three.
Because the Ambev Shareholders’ Agreement provides that, as long as Fundação Zerrenner maintains a minimum
shareholding in Ambev, Fundação Zerrenner shall have the right to appoint four members of the Board of Directors,
any reduction in the number of such members to fewer than four would be subject to Fundação Zerrenner’s
approval.
Liquidation
In the event of liquidation of the Company, a general shareholders’ meeting shall determine the form of
liquidation and appoint a committee to supervise the process during the liquidation period. A liquidator will be
appointed by the Board of Directors.
Upon liquidation, the preferred shares have an absolute preference over the common shares. In the event of a
liquidation, the assets available for distribution to Ambev’s shareholders would be distributed first to the preferred
shareholders in an amount equal to their pro rata share of the Company’s capital stock (Ambev’s capital as of
December 31, 2010 was 7,613 million), prior to making any distributions to Ambev’s common shareholders. In the
event that the assets to be so distributed are insufficient to fully compensate Ambev’s preferred shareholders, the
preferred shareholders would each receive a pro rata amount (based on their pro rata share of the Company’s capital
stock excluding the common shares in such calculation) of any available assets.
Shareholders‟ Meeting
A general meeting is convened by publishing, no later than 15 days prior to the scheduled meeting date and no
fewer than three times, a notice in the Diário Oficial do Estado de São Paulo and in a newspaper with general
circulation in São Paulo, where Ambev has its registered office. In the General Shareholders’ Meeting held on
April 28, 2008, the shareholders of Ambev designated Valor Econômico, a newspaper with general circulation in
São Paulo for this purpose. Such notice must contain the agenda for the meeting. CVM Regulation No. 481 of
December 17, 2009 also requires that additional information be disclosed in the call notice for certain matters. For
example, in the event of an election of directors, the call notice shall also disclose the minimum percentage of equity
participation required from a shareholder to request the adoption of cumulative voting procedures. All documents
pertaining to the matters to be discussed at the shareholders’ general meeting shall be made available to the
shareholders either within at least one month prior to the meeting or upon publication of the first call notice, as the
case may be, except if the law or CVM regulations provide otherwise.
A general meeting may be held if shareholders representing at least one-quarter of the voting shares are
present, except in some cases provided for by law, such as for the amendment of a company’s bylaws, which
requires the presence of shareholders representing at least two-thirds of the voting shares. If no such quorum is
present, eight-day prior notice must be given in the same manner as described above, and a meeting may then be
convened without any specific quorum requirement, subject to the minimum quorum and voting requirements for
specific matters, as discussed below. Shareholders without voting rights may attend a general meeting and take part
in the discussion of matters submitted for consideration.
Except as otherwise provided by law, resolutions of a general meeting are passed by a simple majority vote of
the shares present or represented at the meeting, abstentions not being taken into account. Under Brazilian Corporate
109
Law, the approval of shareholders representing at least a majority of the issued and outstanding voting shares is
required for the types of actions described below, as well as, in the case of items (a) and (b), the approval of
shareholders representing a majority of the issued and outstanding preferred shares of the affected class in a separate
special meeting held no later than one year after the resolution is approved in the following circumstances (among
others):
(a) Creating preferred shares or increasing disproportionately an existing class of preferred shares relative
to the other classes of shares, unless such action is provided for or authorized by the bylaws;
(b) Modifying a preference, privilege or condition of redemption or amortization conferred on one or more
classes of preferred shares, or creating a new class with greater privileges than those of the existing
classes of preferred shares;
(c) Reducing the mandatory dividend;
(d) Merging Ambev with another company or consolidating or splitting it;
(e) Changing the corporate purpose of Ambev; and
(f) Dissolving Ambev or ceasing its liquidation status.
General meetings can be called by the Board of Directors of Ambev. Under the Brazilian Corporate Law,
meetings can also be convened by Ambev’s shareholders as follows: (i) by any shareholder if, under certain
circumstances set forth in the Brazilian Corporate Law, the directors take more than 60 days to convene a general
shareholders’ meeting; (ii) by shareholders holding at least 5% of Ambev’s total capital stock if, after a period of
eight days, the directors fail to call a general shareholders’ meeting that has been justifiably requested by such
shareholders; and (iii) by shareholders holding at least 5% of either Ambev’s voting capital stock or Ambev’s non-
voting capital stock if, after a period of eight days, the directors fail to call a general meeting for the purpose of
installing a Conselho Fiscal that has been requested by such shareholders. Additionally, under certain circumstances
set forth in the Brazilian Corporate Law, meetings can also be convened by Ambev’s Conselho Fiscal. For further
information regarding Ambev’s Conselho Fiscal, see ―Directors, Senior Management and Employees—Directors—
Board Practices‖.
A shareholder may be represented at a general meeting by an attorney-in-fact appointed no more than one
year before the meeting, who must be a shareholder, a company officer or a lawyer. For a publicly-held company
such as Ambev, the attorney-in-fact may also be a financial institution.
Shareholders may not exercise voting rights whenever they are contributing assets in a capital increase paid in
kind or with respect to the approval of their own accounts, as well as in those resolutions that may favor such
shareholders specifically, or whenever there is a conflicting interest with the company. Mergers between affiliated
parties are subject to a special statutory valuation procedure intended to determine whether the exchange ratio is
adequate for all the parties involved, without preventing the approval of the resolution for lack of the statutory
quorum.
Restrictions on Foreign Investment
There are no restrictions on ownership or voting rights in respect of capital stock of Ambev owned by
individuals or legal entities domiciled outside Brazil. For a description of voting rights, see ―—Voting Rights‖. The
right to convert dividend (including interest on shareholders’ equity) payments and proceeds from the sale of
preferred or common shares into foreign currency and to remit such amounts outside Brazil, however, is subject to
exchange control and foreign investment legislation. For a description of these exchange control restrictions and
foreign investment legislation, see ―Key Information—Exchange Rate Information—Exchange Controls‖.
Withdrawal Rights
110
Under Brazilian Corporate Law, a dissenting shareholder has the right to withdraw from Ambev and be
reimbursed for the value of the common or preferred shares held, whenever a decision is taken at a shareholders’
meeting by a qualified quorum of shareholders representing at least 50% of the total outstanding voting capital to
(among others):
▪Create preferred shares or increase disproportionately an existing class of preferred shares relative to the
other classes of shares, unless such action is provided for or authorized by Ambev’s bylaws;
▪Codify a preference, privilege or condition of redemption or amortization conferred on one or more classes
of preferred shares, or create a new class with greater privileges than the existing classes of preferred
shares;
▪Reduce the mandatory dividend;
▪Merge or consolidate Ambev with another company;
▪Change the corporate objectives of Ambev;
▪Split Ambev, if the new entities resulting from the split have different principal corporate purposes, a
lower minimum mandatory dividend or participate in a centralized group of companies;
▪Transform Ambev into another corporate type;
▪Transform Ambev into a wholly owned subsidiary of another company; or
▪Approve the acquisition of another company, the price of which exceeds the limits set forth in Brazilian
Corporate Law.
Furthermore, if a governmental entity acquires control of Ambev through expropriation of shares,
shareholders will have the right to withdraw from Ambev and be reimbursed for the value of the shareholders’
equity attributable to their equity interest.
The withdrawal rights lapse 30 days after publication of the minutes of the relevant shareholders’ meeting in
the Brazilian press. Ambev would be entitled to reconsider any action triggering withdrawal rights within 10 days
following the expiration of such rights if the redemption of shares of dissenting shareholders would jeopardize the
financial stability of Ambev. Shares to be purchased by Ambev from the dissenting shareholders exercising
withdrawal rights will be valued at an amount equal to the ratable portion attributable to such shares of the
shareholders’ equity of Ambev as shown on the last balance sheet approved at a general meeting of the shareholders
(book value). However, if more than 60 days have elapsed since the date of such balance sheet, dissenting
shareholders may require that the value of their shares be calculated on the basis of a new balance sheet. As a
general rule, shareholders who acquire their shares after the first notice convening the shareholders’ meeting or after
the relevant press release concerning the meeting are published will not be entitled to withdrawal rights.
Preemptive Rights
Each shareholder of Ambev generally has a preemptive right to subscribe for shares in capital increases
(including in the issuance of stock purchase warrants or convertible bonds) in proportion to its shareholdings. A
minimum period of 30 days following the publication of notice of the capital increase is allowed for the exercise of
the right, and the right is negotiable. In the event of a capital increase which would maintain or increase the
proportion of capital represented by preferred or common shares, holders of preferred ADSs or common ADSs, as
the case may be, would have preemptive rights to subscribe only to newly issued preferred shares or common
shares, as applicable and only to the extent a registration statement is filed by the Company with the SEC. In the
event of a capital increase which would reduce the proportion of capital represented by preferred shares or common
shares, holders of preferred ADSs or common ADSs, as the case may be, would have preemptive rights to subscribe
for common shares or preferred shares, as applicable, in proportion to their shareholdings only to the extent
necessary to prevent dilution of their interest in Ambev. Ambev’s bylaws provide that if our Board of Directors
decides to increase our share capital within the limit of our authorized capital through sale in stock exchanges,
public offerings or public tender offers, no preemptive rights apply. In addition, Brazilian law provides that the grant
or the exercise of stock options pursuant to certain stock option plans, such as our stock ownership plan, is not
subject to preemptive rights.
111
Form and Transfer
Brazilian law provides that ownership of shares of capital stock of a Brazilian corporation shall generally be
evidenced only by a record of ownership maintained by either the corporation or an accredited intermediary, such as
a bank, acting as a registrar for the shares. Banco Bradesco S.A. currently maintains Ambev’s share ownership
records.
Because the preferred shares and common shares are in registered book-entry form, a transfer of such
preferred and common shares is made under the rules of the Brazilian Corporate Law, which provides that a transfer
of shares is effected by an entry made by the registrar for Ambev’s shares in its books, by debiting the share account
of the transferor and crediting the share account of the transferee.
Transfers of preferred and common shares by a foreign investor are made in the same way and executed by
such investor’s local agent on the investor’s behalf except that, if the original investment was registered with the
Central Bank pursuant to the foreign investment regulations, the foreign investor should also seek amendment, if
necessary, through its local agent, of the corresponding electronic registration to reflect the new ownership.
The BM&FBOVESPA operates a central clearing system. A holder of our shares may choose, at its
discretion, to participate in this system, and all shares elected to be put into the system will be deposited in custody
with the stock exchange (through a Brazilian institution that is duly authorized to operate by the Central Bank and
maintains a clearing account with the stock exchange). The fact that these shares are subject to custody with the
stock exchange will be reflected in our registry of shareholders. Each participating shareholder will, in turn, be
registered in our register of beneficial shareholders maintained by the stock exchange and will be treated in the same
way as registered shareholders.
Disclosure of Principal Shareholders
Under Brazilian law, shareholders owning more than 5% of a company’s voting shares, such as the holders of
Ambev’s common shares, must publicly disclose their shareholder ownership, as well as disclose any 5% increase or
decrease.
Other Significant Provisions of Brazilian Corporate Law
Brazilian Corporate Law also requires the following:
▪Upon a sale of control, the acquiror is required to launch a tender offer to purchase all minority voting
shares at a price equal to at least 80% of the price per share paid for the controlling stake;
▪If provided for in the bylaws, disputes among our shareholders will be subject to arbitration. Our bylaws
currently do not provide for arbitration;
▪Delisting of a public company is subject to an administrative proceeding before the CVM, having as a
condition the conduction of a tender offer by the controlling shareholder or the corporation itself for
the acquisition of all outstanding shares (defined as those owned by shareholders other than the
controlling shareholder, officers and directors) at a fair price, as determined by an independent
appraiser. Shareholders holding more than two-thirds of the free float of shares must accept the tender
offer or must expressly agree with the delisting (for this purpose, the free float of shares must be
considered those held by shareholders that have either accepted the delisting or the offer);
▪In addition, if a controlling shareholder or group of controlling shareholders acquires additional shares in
excess of one-third of the free float of shares in any class, a mandatory tender offer is required for all
the outstanding shares in that class. The same requirement applies whenever (i) a shareholder or group
of shareholders representing the same interest, and holding more than 50% of the shares in any class
from March 7, 2002 (when CVM’s Normative Ruling No. 361 became effective, except for public
companies existing in September 5, 2000, in which case this initial date will prevail), acquires a further
interest of 10% or more of that same class of shares within a 12-month period; and (ii) the CVM
112
determines, within six months after being informed, that the acquisition restricts the liquidity of the
shares;
▪Upon the occurrence of a tender offer aiming at delisting the Company or through which our controlling
shareholders acquire more than one-third of the free float shares, the purchase price shall be equal to
the fair value of the shares considering the total number of outstanding shares;
▪Members of our Board of Directors elected by the non-controlling shareholders have the right to veto the
choice of the independent accountant by the Board. All of Ambev’s directors have been appointed by
the controlling shareholders;
▪Our controlling shareholders, the shareholders that elect members to our Board of Directors and to the
Conselho Fiscal, the members of our Board of Directors and Conselho Fiscal and our executive
officers are required to disclose any purchase or sale of our shares to the CVM and to the
BM&FBOVESPA; and
▪The chairman of any shareholders’ or Board of Directors’ meeting shall disregard any vote that is rendered
against provisions of any shareholders’ agreement if that shareholders’ agreement has been duly filed
with us. The Ambev Shareholders’ Agreement has been duly filed with us.
B. Material Contracts
In addition to the contracts described in other sections of this annual report, the following is a summary of the
material contracts to which we are a party.
Shareholders‟ Agreement
The agreement originally between the shareholders of Brahma and Antarctica to form Ambev, including the
amendments inserted in connection with the transaction between, among others, Ambev and A-B InBev (as it was
then denominated), and the other amendments is discussed in ―Major Shareholders and Related Party
Transactions—Major Shareholders—Ambev Shareholders’ Agreement.‖
Acquisitions, Dispositions and Joint Ventures
We have discussed the details of some material acquisitions and agreements related thereto in ―Information on
the Company—The InBev-Ambev Transactions‖ and ―Information on the Company—Acquisition of Quinsa and
Argentinean Antitrust Approval‖. In addition, we are a party to the following material acquisitions, dispositions and
joint ventures:
Pepsi
We have had a franchise relationship with Pepsi since 1997, which over time has evolved to include
exclusivity of production, sale and distribution of Pepsi products in Brazil and currently encompasses Pepsi,
Gatorade, and H2OH! among others.
Our PepsiCo franchise agreement expires in 2017, and, thereafter, will be automatically renewed for
additional ten-year terms absent two years’ prior notice by either party of its intent not to renew the contract
following the expiration of the initial or any subsequent term.
Debt Issuances
In December 2001, CBB issued US$500 million 10.5% notes due December 2011 in a transaction exempted
from registration under the U.S. Securities Act of 1933, fully guaranteed by Ambev. This offering significantly
increased the average maturity of Ambev outstanding debt. The transaction was priced at 98.56% of the nominal
principal amount with a coupon rate of 10.5%. On October 4, 2002, we consummated an SEC registered exchange
offer. These notes contain certain covenants and events of default, which, if triggered, may cause accelerated
amortization.
113
In September 2003, CBB issued US$500 million 8.75% notes due September 2013 in a transaction exempted
from registration under the U.S. Securities Act of 1933, fully guaranteed by Ambev. The transaction was priced at
99.67% of the nominal principal amount with a coupon rate of 8.75%. We consummated an SEC registered
exchange offer on September 15, 2004. These notes contain certain covenants and events of default which, if
triggered, may cause accelerated amortization.
With the merger of CBB into Ambev in May 31, 2005, Ambev succeeded in all rights and obligations of CBB
under the 2011 notes and the 2013 notes.
In June 2006, our Board of Directors approved a public offering of unsecured non-convertible debentures
denominated in Reais in the Brazilian market of up to R$2,600.0 million. The issuance was registered with the CVM
and its final amount was approximately R$2,065.0 million. Proceeds of such issuance, which was closed in August
2006, were used to finance the purchase of shares in Quinsa. See ―History and Development of the Company—
Acquisition of Quinsa and Argentinean Antitrust Approval‖ and ―Capital Investment Program‖.
On July 24, 2007, our 100% owned finance subsidiary, Ambev International issued R$300 million in bonds
with a fixed interest of 9.500% per annum and a maturity date of July 24, 2017 to qualified institutional buyers
pursuant to Rule 144A under the Securities Act, and outside the United States to non–U.S. persons in reliance on
Regulation S, fully guaranteed by Ambev. The bonds are denominated in Brazilian Reais, but both principal and
interest are paid in U.S. dollars at the prevailing exchange rate at the applicable payment date. Interest is paid
semiannually in arrears, starting January 24, 2008. The net proceeds of the offering were used for the repayment of
short-term debt and for general corporate purposes by Ambev and its subsidiaries. In February 2009, we completed a
SEC-registered exchange offer for these notes.
License Agreements
We have a number of important license agreements, including a cross-license agreement with A-B InBev that
allows us to exclusively produce, distribute and market the Stella Artois and Beck’s brands in most of Latin
America, and allows A-B InBev to exclusively produce, distribute and market the Brahma brand in Europe, Asia,
Africa, Cuba and the United States, in addition to license agreements among us and A-B InBev and according to
which we may distribute Stella Artois branded beer in Canada and Argentina. Additionally, Ambev’s subsidiary in
Canada, Labatt, and A-B InBev have an arrangement through which Labatt distributes Budweiser branded beers in
Canada, and Latin America South’s subsidiary in Paraguay, Cervecería Paraguay (Cervepar) signed in April 2009 a
distribution agreement with A-B InBev to distribute Budweiser in Paraguay. See ―Information on the Company—
Licenses‖. See also, for the Ambev-A-B InBev cross-license agreement, ―Major Shareholders and Related Party
Transactions—Material Related Party Transactions‖, and for the exclusive bottling agreements with PepsiCo, ―—
Material Contracts—Acquisitions, Dispositions and Joint Ventures—Pepsi‖.
Tax Benefits
Many states in Brazil offer tax benefits programs to attract investments to their regions. We participate in
ICMS value-added tax credit programs offered by various Brazilian states which provide (i) tax credits to offset
ICMS value-added taxes payable and (ii) ICMS deferrals. In return, we are required to meet certain operational
requirements including, depending on the State, production volume and employment targets, among others. All of
these conditions are included in specific agreements between Ambev and the state governments. In the event that we
do not meet the program’s targets, future benefits may be withdrawn. Also, the State of São Paulo has challenged in
the Brazilian Supreme Court state laws upon which certain of the above benefits have been granted, on the basis that
they constitute tax benefits created without certain approvals required under Brazilian tax laws and regulations,
which would render such state laws unconstitutional. There is also a controversy regarding whether these benefits
are constitutional when granted without the approval of every state of the country. Although the Brazilian Supreme
Court has already declared part of Pará State’s benefit law unconstitutional, almost every state has specific
legislation on this topic and even the State of Pará may still grant benefits which were not included in this decision.
Accordingly, as far as the tax benefits are granted based on the state legislation, most companies apply for and use
those benefits when granted. See ―Operating and Financial Review and Prospects—Sales tax deferrals and other tax
credits‖ and ―Key Information—Risk Factors—The pending tax reform in Brazil may increase our tax burden‖.
114
C. Exchange Controls and other Limitations Affecting Security Holders
See ―Item 3 - Key Information - Exchange controls.‖
D. Taxation
The following discussion summarizes the principal Brazilian and U.S. federal income tax consequences of
acquiring, holding and disposing of notes, preferred shares, preferred ADSs, common shares or common ADSs. This
discussion is not a comprehensive discussion of all the tax considerations that may be relevant to a decision to
purchase, hold or dispose notes, preferred shares, preferred ADSs, common shares or common ADSs and is not
applicable to all categories of investors, some of which may be subject to special rules. Each prospective purchaser
is urged to consult its own tax advisor about the particular Brazilian and U.S. tax consequences to it of an
investment in notes, preferred shares, preferred ADSs, common shares or common ADSs.
The summary is based upon tax laws of Brazil and the U.S. and the regulations thereunder, as in effect on the
date hereof, which are subject to change (possibly with retroactive effect). Although there is at present no income
tax treaty between Brazil and the U.S., the tax authorities of the two countries have had discussions that may
culminate in a treaty. No assurance can be given, however, as to whether or when a treaty will enter into force or of
how it will affect the U.S. Holders of any of the notes, preferred shares, preferred ADSs, common shares or common
ADSs. This summary is also based on representations of the depositary and on the assumption that each obligation
in the Deposit Agreement relating to the preferred ADSs and common ADSs, as applicable, and the related
documents will be performed in accordance with its terms.
Brazilian Tax Considerations
The following discussion summarizes the principal Brazilian tax consequences of the acquisition, ownership
and disposition of preferred shares, preferred ADSs, common shares or common ADSs by a holder that is not
deemed to be domiciled in Brazil for purposes of Brazilian taxation and, in the case of a holder of preferred or
common shares, which has registered its investment in such securities with the Central Bank as a U.S. dollar
investment (in each case, a ―Non-Brazilian Holder‖).
The discussion does not purport to be a comprehensive description of all tax considerations that may be
relevant to a decision to purchase preferred shares, preferred ADSs, common shares or common ADSs. It is based
on Brazilian law as currently in effect. Any change in such law may change the consequences described below. The
following discussion does not specifically address all of the Brazilian tax considerations applicable to any particular
Non-Brazilian Holder, and each Non-Brazilian Holder should consult his or her own tax advisor concerning the
Brazilian tax consequences of an investment in preferred shares, preferred ADSs, common shares or common ADSs.
Income Tax
Taxation of Dividends. Dividends paid by Ambev to The Bank of New York Mellon in respect of the
preferred or common shares underlying the respective ADSs, or to a Non-Brazilian Holder with respect to preferred
or common shares, generally will not be subject to Brazilian withholding income tax.
Taxation of Gains. Gains realized outside Brazil by a Non-Brazilian Holder on the disposition of assets
located in Brazil, including preferred or common shares, to a Brazilian resident or to a non-resident in Brazil, are
subject to Brazilian withholding income tax. In this case, gains would be subject to a 15% withholding tax rate,
except if the Non-Brazilian Holder is located in a tax-haven jurisdiction, as defined by Brazilian law in different
situations, in which case the applicable rate would be 25%.
The statutory definition of a tax-haven jurisdiction for the purpose of income taxation on gains should differ
depending on whether or not the investment in our preferred shares, preferred ADSs, common shares, or common
ADSs is registered under Resolution No. 2,689 or under Law No. 4,131. In the case of gains arising from an
investment registered under Resolution No. 2,689, a country or location should be defined as a tax-haven
jurisdiction when such country or location (a) does not tax income, or (b) taxes income at a rate lower than 20%. In
115
turn, in the case of gains arising from an investment under Law No. 4,131, in addition to criteria (a) and (b) above
for the definition of a tax-haven jurisdiction, a country or location should also be considered a tax-haven jurisdiction
if (c) the laws of such country or location do not allow access to information related to shareholding composition, to
the ownership of investments, or to the identification of the beneficial owner of earnings that are attributed to non-
residents.
The Brazilian tax authorities regularly issue a list of jurisdictions which are considered tax-haven jurisdictions
(―black-list‖)2. Notwithstanding this, Brazilian legislation pertaining to the definition of a tax-haven jurisdiction in
different situations was recently modified by Law No. 11,727, and, following this legal modification an updated
―black-list‖ of tax-haven jurisdictions has been issued in June 4, 2010 in accordance with Normative Ruling
1,037/10 issued by the Brazilian Revenue Service.
We understand that ADSs are not assets located in Brazil for the purposes of the above-mentioned taxation on
gains. However, we are unable to predict how Brazilian courts would view this issue, and to date, we are not aware
of any judicial or administrative precedent on this specific matter. The withdrawal of preferred or common ADSs in
exchange for preferred or common shares is not subject to Brazilian income tax. The deposit of Ambev’s preferred
or common shares in connection with the issuance of preferred or common ADSs is not subject to Brazilian tax,
provided that the preferred or common shares are registered under the Resolution No. 2,689 and the investor is not
located in a tax-haven jurisdiction, considering the definition described above, that should apply to this situation.
There is a special taxation system applicable to Non-Brazilian Holders (provided investments are duly registered
under the Resolution No. 2,689 and with the CVM and other conditions are fulfilled). Upon receipt of the underlying
preferred or common shares, a Non-Brazilian Holder who qualifies under the Resolution 2,689 will be entitled to
register the U.S. dollar value of such shares with the Central Bank as described below.
Non-Brazilian Holders are generally subject to withholding tax at a rate of 15% on gains realized on sales or
exchanges in Brazil of preferred or common shares that occur on a Brazilian stock exchange, unless (a) such a sale is
made within five business days of the withdrawal of such preferred or common shares in exchange for ADSs and the
proceeds of such sale are remitted abroad within such five-day period and the investor is not located in a tax-haven
jurisdiction (as defined above for investments registered under Resolution No. 2,689), or (b) such a sale is made
under the Resolution No. 2,689 by Non-Brazilian Holders which register with the CVM and are not located in a tax-
haven jurisdiction (as defined above for this type of investment), in which cases such gains are exempt. If the Non-
Brazilian Holder is located in a tax-haven jurisdiction (considering the definition for each type of investment), this
Non-Brazilian Holder will be subject to the same general taxation rules applicable to Brazilian residents. The ―gain
realized‖ as a result of a transaction on a Brazilian stock exchange is the difference between the amount in Brazilian
2 The countries currently included in this list, according to Normative Ruling of the Brazilian
Federal Revenue Service No. 1,037/10, are: American Samoa, Andorra, Anguilla, Antigua and Barbuda, Aruba,
Ascension Island, Bahamas, Bahrain, Barbados, Belize, Bermuda, Brunei, British Virgin Islands, Campione D’Italia,
Cayman Islands, Channel Islands (Jersey, Guernsey, Alderney and Sark), Cook Islands, Costa Rica, Cyprus,
Djibouti, Dominica, Gibraltar, Grenada, Hong Kong, Kiribati, Isle of Man, Lebanon, Lebuan, Liberia, Liechtenstein,
Macau, Madeira Islands, Maldives, Malta, Marshall Islands, Mauritius, Monaco, Montserrat, Nauru, Netherland
Antilles, Niue, Norfolk Island, Oman, Panama, Pitcairn Island, French Polynesia, Qeshm Island, Saint Kitts and
Nevis, Saint Lucia, Saint Vincent and The Grenadines, Saint Helena Islands, São Pedro e Miguelão Islands, San
Marino, Seychelles, Singapore, Solomon Islands, Suaziland, Switzerland, Tristão da Cunha, Tonga, Turks and
Caicos Islands, United Arab Emirates, U.S. Virgin Islands, Vanuatu and Western Samoa. In addition, the United
States LLCs, held by non-residents and not subject to federal income tax in the US and holding companies
domiciled in Luxemburg, Denmark and Netherlands shall be treated as tax privileged domiciled entities, as well as:
(i) Financial Investment Companies of Uruguay (Sociedades Financeiras de Inversão), (ii) International Trading
Company (ITC) domiciled in Iceland, (iii) the offshore KFT companies domiciled in Hungary, (iv) Entidad de
Tenencia de Valores Extranjeros (ETVEs) of Spain; (v) the International Trading Companies (ITC) and
International Holding Companies (IHC) domiciled in Malta. The effects of the inclusion of Switzerland in the list
were suspended by Declaratory Act of the Brazilian Federal Revenue Service No 11/2010, due to a review request
presented by that Government to the Brazilian authorities.
116
currency realized on the sale or exchange of the shares and their acquisition cost, without any correction for
inflation.
The ―gain realized‖ as a result of a transaction with shares which are registered under a Law No. 4,131
certificate of registration of investment will be calculated based on the foreign currency amount registered with the
Central Bank and will accordingly be subject to tax at a rate of 15% (or 25% if domiciled in a tax-haven jurisdiction,
as defined for investments under Law No. 4,131, described above). There can be no assurance that the current
preferential treatment for holders of ADSs and Non-Brazilian Holders of preferred and common shares under the
Resolution 2,689 will continue in the future or that it will not be changed in the future. Reductions in the tax rate
provided for by Brazil’s tax treaties (except for the tax treaty signed between Japan and Brazil) do not apply to tax
on gains realized on sales or exchanges of preferred or common shares.
Any exercise of preemptive rights relating to the preferred or common shares or preferred or common ADSs
of Ambev will not be subject to Brazilian taxation. Gains on the sale of preemptive rights relating to the common
shares will be treated differently for Brazilian tax purposes depending on (i) whether the sale is made by The Bank
of New York Mellon or the investor and (ii) whether the transaction takes place on a Brazilian stock exchange.
Gains on sales made by the depositary on a Brazilian stock exchange are not taxed in Brazil, but gains on other sales
may be subject to tax at rates of up to 25%, if the ADSs were to be considered assets located in Brazil by the tax
authorities.
Distributions of Interest on shareholders’ equity. In accordance with Law No. 9,249, dated December 26,
1995, Brazilian corporations may make payments to shareholders characterized as distributions of interest on a
company’s shareholders’ equity. Such interest is limited to the shareholders’ equity multiplied by the TJLP, as
determined by the Central Bank from time to time.
Distributions of interest on shareholders’ equity in respect of the preferred or common shares paid to
shareholders who are either Brazilian residents or non-Brazilian residents, including holders of ADSs, are subject to
Brazilian withholding tax at the rate of 15% or 25% if the payee is domiciled in a tax-haven jurisdiction. In this case,
of interest on shareholders’ equity, a payee’s country or location should be deemed a tax-haven jurisdiction when
(a) such country or location does not tax income, (b) such country or location taxes income at a rate lower than 20%,
or (c) the laws of such country or location do not allow access to information related to shareholding composition, to
the ownership of investments, or to the identification of the beneficial owner of earnings that are attributed to non-
residents.
The amounts paid as distribution of interest on shareholders’ equity are deductible from the taxable basis of
the corporate income tax and social contribution on net profits, both of which are taxes levied on Ambev’s profits, as
long as the payment of a distribution of interest is approved in a general meeting of shareholders of Ambev. The
amount of such deduction cannot exceed the greater of:
▪50% of net income (after social contribution on net profits, and before taking such distribution and any
deductions for corporate income tax into account) for the period in respect of which the payment is
made; or
▪50% of the sum of retained earnings and profit reserves as of the initial date of the period in respect of
which the payment is made.
The distribution of interest on shareholders’ equity may be determined by the Board of Directors of Ambev.
No assurance can be given that the Board of Directors of Ambev will not determine that future distributions of
profits may be made by means of interest on shareholders’ equity instead of by means of dividends.
Other Relevant Brazilian Taxes
There are no Brazilian inheritance, gift or succession taxes applicable to the ownership, transfer or disposition
of preferred or common shares or preferred or common ADSs by a Non-Brazilian Holder except for gift and
inheritance taxes which may be levied by some states of Brazil. There is no Brazilian stamp, issue, registration or
similar taxes or duties payable by holders of preferred or common shares or preferred or common ADSs.
117
Brazilian law imposes a Tax on Foreign Exchange Transactions, or ―IOF/Exchange‖, on the conversion of
Reais into foreign currency and on the conversion of foreign currency into Reais. As from December 17, 2007, the
general IOF/Exchange rate applicable to almost all foreign currency exchange transactions was increased from zero
to 0.38%, although other rates may apply in particular operations, such as:
(i) inflow related to transactions carried out in the Brazilian financial and capital markets, including
investments in our common shares or preferred shares by investors which register their investment under
Resolution No. 2,689, 2%;
(ii) outflow related to the return of the investment mentioned under item (i) above, zero; and
(iii) outflow related to the payment of dividends and interest on shareholders’ equity in connection with the
investment mentioned under item (i) above, zero.
Notwithstanding these rates of the IOF/Exchange, in force as of the date hereof, the Minister of Finance is
legally entitled to increase the rate of the IOF/Exchange to a maximum of 25% of the amount of the currency
exchange transaction, but only on a prospective basis.
Tax on Transactions Involving Bonds and Securities, or ―IOF/Bonds‖ may be levied on transactions involving
common or preferred shares, even if the transactions are effected on Brazilian stock, futures or commodities
exchanges. IOF/Bonds may also be levied on transactions involving common or preferred ADSs if they are
considered assets located in Brazil by the tax authorities. As mentioned in the above discussion on taxation of gains,
we are unable to predict how Brazilian courts would view this issue, and to date, we are not aware of any judicial or
administrative precedent on this specific matter. The IOF/Bonds levies at a rate of 1.5% on the transfer (―cessão‖) of
shares traded in a Brazilian stock exchange environment with the specific purpose of enabling the issuance of
depositary receipts to be traded outside Brazil. This rate of 1.5% is applied to the product of (a) the number of shares
which are transferred, multiplied by (b) the closing price for such shares on the date prior to the date of the transfer.
If no closing price is available on that date, the last available closing price will be adopted. The rate of this tax with
respect to other transactions related to common or preferred shares and common or preferred ADSs (if applicable) is
currently zero. The Minister of Finance, however, has the legal power to increase the rate to a maximum of 1.5% of
the amount of the taxed transaction per each day of the investor’s holding period, but only on a prospective basis.
Registered Capital. The amount of an investment in preferred or common shares held by a Non-Brazilian
Holder who qualifies under the Resolution 2,689 and obtains registration with the CVM, or by The Bank of New
York Mellon, as the depositary representing such holder, is eligible for registration with the Central Bank. Such
registration allows the remittance outside of Brazil of any proceeds of distributions on the shares, and amounts
realized with respect to disposition of such shares. The amounts received in Brazilian currency are converted into
foreign currency through the use of the market rate. The registered capital for preferred shares purchased in the form
of a preferred ADS or common shares purchased in the form of a common ADS or purchased in Brazil, and
deposited with The Bank of New York Mellon in exchange for a preferred or common ADS, will be equal to their
purchase price (in U.S. dollars) to the purchaser. The registered capital for preferred or common shares that are
withdrawn upon surrender of preferred or common ADSs, as applicable, will be the U.S. dollar equivalent of the
average price of the preferred or common shares, as applicable, on the Brazilian stock exchange on which the
greatest number of such preferred or common shares, as applicable, was sold on the day of withdrawal. If no
preferred or common shares, as applicable, were sold on such day, the registered capital will refer to the average
price on the Brazilian stock exchange on which the greatest number of preferred or common shares, as applicable,
was sold in the 15 trading sessions immediately preceding such withdrawal. The U.S. dollar value of the preferred or
common shares, as applicable, is determined on the basis of the average market rate quoted by the Central Bank on
such date or, if the average price of preferred or common shares is determined under the last preceding sentence, the
average of such average quoted rates on the same 15 dates used to determine the average price of the preferred or
common shares.
A Non-Brazilian Holder of preferred or common shares may experience delays in effecting such action which
may delay remittances abroad. Such a delay may adversely affect the amount, in U.S. dollars, received by the Non-
Brazilian Holder.
118
Temporary Contribution on Financial Transaction (CPMF). Until December 31, 2007, any transaction carried
out by a holder of securities in Brazil that resulted in the transfer of Reais from an account maintained by such
holder (or its custodian) with a Brazilian financial institution could be subject to the CPMF, at the rate of 0.38%.
From January 1, 2008 onwards, the CPMF has ceased to exist.
Material United States Federal Income Tax Considerations
The following summary describes the material U.S. federal income tax consequences of holding preferred
shares, preferred ADSs, common shares or common ADSs. This summary is based on the Internal Revenue Code of
1986, as amended (the ―Code‖), its legislative history, existing final, temporary and proposed U.S. Treasury
Regulations, rulings and judicial decisions, all as currently in effect and all of which are subject to prospective and
retroactive rulings and changes.
This summary does not purport to address all U.S. federal income tax consequences that may be relevant to a
particular holder and you are urged to consult your own tax advisor regarding your specific tax situation. The
summary applies only to holders who hold preferred shares, preferred ADSs, common shares or common ADSs as
―capital assets‖ (generally, property held for investment) under the Code. This summary does not address the tax
consequences that may be relevant to holders in special tax situations including, for example:
▪Insurance companies;
▪Tax-exempt organizations;
▪Dealers in securities or currencies;
▪Traders in securities that elect to use a mark-to-market method of accounting for their securities holdings;
▪Banks, mutual funds or other financial institutions;
▪Partnerships or other entities treated as partnerships for U.S. federal income tax purposes;
▪U.S. holders (as defined below) whose functional currency for tax purposes is not the United States dollar;
▪United States expatriates;
▪An S corporation or small business investment company;
▪Real estate investment trusts;
▪Investors in a pass-through entity;
▪Holders of preferred shares, preferred ADSs, common shares or common ADSs as part of a hedge,
straddle, conversion or other integrated transaction, for tax purposes;
▪Holders who own, directly, indirectly or constructively, 10% or more of the total combined voting power
of our stock (including by way of owning preferred shares, preferred ADSs, common shares or
common ADSs); or
▪Holders who acquired their preferred shares, preferred ADSs, common shares or common ADSs as
compensation.
This summary assumes that we are not a passive foreign investment company (―PFIC‖) for U.S. federal
income tax purposes. Please see the discussion under ―—Taxation of U.S. Holders—Passive Foreign Investment
Company Rules‖ below.
Further, this summary does not address the alternative minimum tax consequences of holding preferred
shares, preferred ADSs, common shares or common ADSs or the indirect consequences to holders of equity interests
in entities that own our preferred shares, preferred ADSs, common shares or common ADSs. In addition, this
summary does not address the state, local, foreign or other tax consequences, if any, of holding our preferred shares,
preferred ADSs, common shares or common ADSs.
119
You should consult your own tax advisor regarding the U.S. federal, state, local and foreign and other tax
consequences of acquiring, owning and disposing of preferred shares, preferred ADSs, common shares or common
ADSs in your particular circumstances.
Taxation of U.S. Holders
For purposes of this summary, you are a ―U.S. Holder‖ if you are a beneficial owner of preferred shares,
preferred ADSs, common shares or common ADSs and you are for U.S. federal income tax purposes:
▪A citizen or resident of the United States;
▪A corporation, or any other entity taxable as a corporation, created or organized in or under the laws of the
United States or any state thereof or the District of Columbia;
▪An estate the income of which is subject to U.S. federal income tax regardless of its source; or
▪A trust if (i) a court within the United States is able to exercise primary supervision over its administration
and one or more United States persons have the authority to control all substantial decisions of the trust
or (ii) the trust has in effect a valid election to be subject to tax as a U.S. person.
If a partnership (or an entity or arrangement treated as a partnership for U.S. federal income tax purposes)
holds or disposes of preferred shares, preferred ADSs, common shares or common ADSs, the tax treatment of a
partner in that partnership will generally depend upon the status of the partner and upon the activities of the
partnership. A partner in a partnership holding or disposing of preferred shares, preferred ADSs, common shares or
common ADSs should consult its own tax advisor regarding the U.S. federal income tax consequences to them of
holding or disposing of preferred shares, preferred ADSs, common shares or common ADSs.
A ―Non-U.S. Holder‖ is a beneficial owner of preferred shares, preferred ADSs, common shares or common
ADSs who or which is not a U.S. Holder and that is not an entity or arrangement treated as a partnership for U.S.
federal income tax purposes.
For U.S. Federal income tax purposes, a U.S. Holder of an ADS will be treated as the beneficial owner of the
preferred shares or common shares represented by the applicable ADS. Accordingly, the conversion of ADSs to
shares or the conversion of shares to ADSs will not be taxable transactions for U.S. federal income tax purposes.
E. Preferred Shares, Preferred ADSs, Common Shares, Common ADSs
Distributions on Preferred Shares, Preferred ADSs, Common Shares or Common ADSs
The gross amount of distributions paid by us to a U.S. Holder (including amounts withheld to pay Brazilian
withholding taxes) with respect to preferred shares, preferred ADSs, common shares or common ADSs (including
distributions of interest on shareholders’ equity) generally will be taxable to such U.S. Holder as ordinary dividend
income or qualified dividend income (as further described below) to the extent that such distribution is paid, actually
or constructively, out of our current or accumulated earnings and profits (as determined for U.S. federal income tax
purposes). Distributions in excess of our current or accumulated earnings and profits will be treated first as a non-
taxable return of capital reducing (on a dollar-for-dollar basis) such U.S. Holder’s tax basis in the preferred shares,
preferred ADSs, common shares or common ADSs, as applicable. Any distribution in excess of such tax basis will
be treated as capital gain and will be either long-term or short-term capital gain depending upon whether the U.S.
Holder held the preferred shares, preferred ADSs, common shares or common ADSs, as applicable, for more than
one year.
Dividends received by a U.S. Holder will generally be taxed at ordinary income tax rates. However, pursuant
to the Jobs and Growth Tax Relief Reconciliation Act of 2003, in the case of dividends that constitute qualified
dividend income and are received by an individual U.S. Holder during the tax years beginning after 2002 and before
2011, such dividends will be taxed at the same rate that is applicable to long-term capital gains. For this purpose,
qualified dividend income includes any dividends paid with respect to stock in a foreign corporation if such stock is
―readily tradable on an established securities market in the United States‖ and the corporation is not a PFIC (as
120
discussed below). Based upon United States Internal Revenue Service Notice 2003-71, the preferred ADSs and
common ADSs will, but the preferred shares and common shares will not, be treated as readily tradable on an
established securities market in the United States. Consequently, dividends paid with respect to ADSs, but not to
shares held directly by U.S. Holders, should constitute ―qualified dividend income.‖
A U.S. Holder generally will be entitled, subject to a number of complex rules and limitations, to claim a
United States foreign tax credit in respect of any Brazilian withholding taxes imposed on distributions received on
preferred shares, preferred ADSs, common shares or common ADSs. U.S. Holders who do not elect to claim a
foreign tax credit may instead claim a deduction in respect of such withholdings. Dividends received with respect to
the preferred shares, preferred ADSs, common shares or common ADSs will be treated as foreign source income
and generally will constitute ―passive income‖ for U.S. foreign tax credit limitation purposes. We urge all holders to
consult their tax advisors regarding the availability of the foreign tax credit under their particular circumstances.
Dividends paid by us generally will not be eligible for the dividends received deduction generally available to
certain U.S. corporate shareholders.
For U.S. federal income tax purposes, the amount of any cash distribution paid in Brazilian currency will
equal the U.S. dollar value of the distribution, calculated by reference to the exchange rate in effect at the time the
distribution is received by the depositary (in the case of ADSs) or by the U.S. Holder (in the case of preferred shares
or common shares held directly by such U.S. Holder), regardless of whether the payment is in fact converted to U.S.
dollars at that time. A U.S. Holder should not recognize any foreign currency gain or loss if such Brazilian currency
is converted into U.S. dollars on the date received. If the Brazilian currency is not converted into U.S. dollars on the
date of receipt, however, gain or loss may be recognized upon a subsequent sale or other disposition of the Brazilian
currency. Such foreign currency gain or loss, if any, generally will be U.S. source ordinary income or loss.
Section 305 of the Code provides special rules for the tax treatment of preferred stock. According to the U.S.
Treasury Regulations under that section, the term preferred stock generally refers to stock which enjoys certain
limited rights and privileges (generally associated with specified dividend and liquidation priorities) but does not
participate in corporate growth to any significant extent. While our preferred shares have some preferences over our
common shares, the preferred shares are not fixed as to dividend payments or liquidation value; thus, although the
matter is not entirely clear, we believe and have taken and intend to continue to take the position, that the preferred
shares should be treated as ―common stock‖ within the meaning of Section 305 of the Code. If the preferred shares
are treated as ―common stock‖ for purposes of Section 305 of the Code, distributions to U.S. Holders of additional
shares of such ―common stock‖ or preemptive rights relating to such ―common stock‖ with respect to their preferred
shares or preferred ADSs that are made as part of a pro rata distribution to all shareholders in most instances will not
be subject to U.S. federal income tax. Alternatively, if the preferred shares are treated as ―preferred stock‖ within the
meaning of Section 305 of the Code and a U.S. Holder receives a distribution of additional shares or preemptive
rights as described in the preceding sentence, such distributions (including amounts withheld in respect of any
Brazilian taxes) will be treated as dividends that can be included in the U.S. Holder’s gross income to the same
extent and in the same manner as distributions payable in cash. In that event, the amount of such distribution (and
the basis of the new shares or preemptive rights so received) will equal the fair market value of the shares or
preemptive rights on the date of distribution.
Sale, exchange or other taxable disposition of preferred shares, preferred ADSs, common shares or common
ADSs
A U.S. Holder will generally recognize capital gain or loss upon the sale, exchange or other taxable
disposition of preferred shares, preferred ADSs, common shares or common ADSs, as applicable, measured by the
difference between the U.S. dollar value of the amount received and the U.S. Holder’s tax basis (determined in U.S.
dollars) in the preferred shares, preferred ADSs, common shares or common ADSs, as applicable. If a Brazilian tax
is withheld on the sale or disposition of a share, the amount realized by a U.S. Holder will include the gross amount
of the proceeds of that sale or disposition before deduction of the Brazilian tax. Any gain or loss will be long-term
capital gain or loss if the preferred shares, preferred ADSs, common shares or common ADSs have been held for
more than one year. Long-term capital gains recognized by individuals are currently subject to reduced rates of
taxation. Your ability to deduct capital losses is subject to limitations. Capital gain or loss, if any, realized by a U.S.
Holder on the sale, exchange or other taxable disposition of a common share, common ADS, preferred share or
121
preferred ADS, as applicable, generally will be treated as U.S.-source income or loss for U.S. foreign tax credit
purposes. Consequently, in the case of a disposition of a common share or preferred share that is subject to Brazilian
tax imposed on the gain (or, in the case of a deposit, in exchange for a common ADS or preferred ADS of a common
share or preferred share, as the case may be, that is not registered pursuant to Resolution No. 2,689/00, on which a
Brazilian capital gains tax is imposed (see ―—Brazilian Tax Considerations—Taxation of Gains‖)), the U.S. Holder
may not be able to benefit from the foreign tax credit for that Brazilian tax unless it can apply (subject to applicable
limitations) the credit against U.S. tax payable on other income from foreign sources in the appropriate income
category, or, alternatively, it may take a deduction for the Brazilian tax if such U.S. Holder elects to deduct all of its
foreign income taxes. Any Brazilian tax paid by a U.S. Holder that is not eligible for a credit or deduction will be
treated as a reduction in the amount of cash received by the U.S. Holder on the sale, exchange or other taxable
disposition of preferred shares, preferred ADSs, common shares or common ADSs and will generally reduce the
amount of gain (if any) recognized by the U.S. Holder.
Passive Foreign Investment Company (“PFIC”) rules
Based upon the nature of our current and projected income, assets and activities, we do not believe that we
are, and we do not expect the preferred shares, preferred ADSs, common shares or common ADSs to be considered
shares of, a PFIC for U.S. federal income tax purposes. In general, a foreign corporation is a PFIC if, for any taxable
year in which the U.S. Holder holds stock in the foreign corporation, at least 75% of such corporation’s gross
income is passive income or at least 50% of the value of such corporation’s assets (determined on the basis of a
quarterly average) produce passive income or are held for the production of passive income. The determination of
whether the preferred shares, preferred ADSs, common shares or common ADSs constitute shares of a PFIC is a
factual determination made annually and thus may be subject to change. Subject to certain exceptions, once a U.S.
Holder’s preferred shares or common shares, as applicable, are treated as shares in a PFIC, they remain shares in a
PFIC. In addition, dividends received by a U.S. Holder from a PFIC will not constitute qualified dividend income.
If we are treated as a PFIC, contrary to the discussion above, a U.S. Holder would be subject to special rules
with respect to (a) any gain realized on the sale or other disposition of common shares, common ADSs, preferred
shares or preferred ADSs and (b) any ―excess distribution‖ by us to the U.S. Holder (generally, the part of the
distribution during a taxable year that exceeds 125% of the average annual taxable distribution the U.S. Holder
received on the common shares, common ADSs, preferred shares or preferred ADSs during the preceding three
taxable years or, if shorter, the U.S. Holder’s holding period for the common shares, common ADSs, preferred
shares or preferred ADSs). Under those rules (a) the gain or excess distribution would be allocated ratably over the
U.S. Holder’s holding period for the common shares, common ADSs, preferred shares or preferred ADSs, (b) the
amount allocated to the taxable year in which the gain or excess distribution is realized and to taxable years before
the first day we became a PFIC would be taxable as ordinary income, (c) the amount allocated to each other year
(with certain exceptions) would be subject to tax at the highest U.S. federal income tax rate in effect for that year,
and an additional amount equal to the interest charge generally applicable to underpayments of tax would be
imposed in respect of the tax attributable to each such year.
A U.S. Holder that owns common shares, common ADSs, preferred shares or preferred ADSs during any year
we are a PFIC must file IRS Form 8621. In general, if we are treated as a PFIC, the rules described in the second
paragraph of this section can be avoided by a U.S. Holder that elects to be subject to a mark-to-market regime for
stock in a PFIC. A U.S. Holder may elect mark-to-market treatment for its common shares, common ADSs,
preferred shares or preferred ADSs, provided the common shares, common ADSs, preferred shares or preferred
ADSs, for purposes of the rules, constitute ―marketable stock‖ as defined in U.S. Treasury Regulations. A U.S.
Holder electing the mark-to-market regime generally would treat any gain recognized under mark-to-market
treatment or on an actual sale as ordinary income and would be allowed an ordinary deduction for any decrease in
the value of common shares, common ADSs, preferred shares or preferred ADSs in any taxable year and for any
loss recognized on an actual sale, but only to the extent, in each case, of previously included mark-to-market income
not offset by previously deducted decreases in value. A U.S. Holder’s basis in common shares, common ADSs,
preferred shares or preferred ADSs would increase or decrease by gain or loss taken into account under the mark-to-
market regime. A mark-to-market election is generally irrevocable. Another election to treat us as a qualified
electing fund would not be available because we do not currently plan to provide holders with information sufficient
to permit any U.S. Holder to make such election.
122
Deposits and Withdrawals
Deposits or withdrawals of preferred shares or common shares in exchange for preferred ADSs or common
ADSs, as applicable, will not result in the realization of any gain or loss for U.S. federal income tax purposes.
Taxation of Non-U.S. Holders
Preferred Shares, Preferred ADSs, Common Shares or Common ADSs
Non-U.S. Holders generally will not be subject to U.S. federal income or withholding tax on dividends
received from us with respect to preferred shares, preferred ADSs, common shares or common ADSs, unless such
income is considered effectively connected with the Non-U.S. Holder’s conduct of a U.S. trade or business (and, if
required by an applicable income tax treaty, the income is attributable to a permanent establishment or, in the case of
an individual Non-U.S. Holder, a fixed base maintained in the United States).
Non-U.S. Holders generally will not be subject to U.S. federal income tax on any gain realized upon the sale,
exchange or other taxable disposition of preferred shares, preferred ADSs, common shares or common ADSs unless
(i) the gain is effectively connected with the Non-U.S. Holder’s conduct of a U.S. trade or business (and, if required
by an applicable income tax treaty, the income is attributable to a permanent establishment or, in the case of an
individual Non-U.S. Holder, a fixed base maintained in the United States) or (ii) such Non-U.S. Holder is an
individual who is present in the United States for 183 days or more during the taxable year of such sale, exchange or
other taxable disposition and certain other conditions are met. If the first exception applies, the Non-U.S. Holder will
be subject to U.S. federal income tax on the sale, exchange or other taxable disposition as if such Non-U.S. Holder
were a U.S. Holder, as described above. If the second exception applies, then, generally speaking, the Non-U.S.
Holder will be subject to U.S. federal income tax at a rate of 30% on the amount by which such Non-U.S. Holder’s
U.S.-source capital gains exceed such Non-U.S. Holder’s U.S.-source capital losses.
In addition, any effectively connected dividends or gains realized by a Non-U.S. Holder that is a corporation
for U.S. federal income tax purposes may also, under certain circumstances, be subject to an additional branch
profits tax at a rate of 30% (or such lower rate as may be specified by an applicable income tax treaty).
Backup Withholding and Information Reporting
In general, information reporting requirements will apply to the payment of dividends to non-corporate U.S.
Holders or the proceeds received on the sale, exchange or redemption of shares or ADSs by non-corporate U.S.
Holders, and such amounts may be subject to U.S. backup withholding tax (currently at a rate of 28%). Backup
withholding will not apply, however, to a U.S. Holder that (i) is a corporation or comes within certain enumerated
categories of persons and, when required, demonstrates this fact or (ii) furnishes a correct taxpayer identification
number and makes certain other required certifications. Generally, a U.S. Holder will provide such certifications on
IRS Form W-9 (Request for Taxpayer Identification Number and Certification) or other substitute form. A U.S.
Holder that is required to but does not furnish us with its correct taxpayer identification number may also be subject
to penalties imposed by the Internal Revenue Service. Non-U.S. Holders generally will not be subject to United
States information reporting or backup withholding. However, Non-U.S. Holders may be required to provide
certification of non-U.S. status in connection with payments received in the United States or through certain U.S.-
related financial intermediaries. Amounts withheld as backup withholding may be claimed as a credit against a
holder’s U.S. federal income tax liability, provided that the required information is timely furnished to the IRS, and
a holder may obtain a refund of any excess amounts withheld under the backup withholding rules by filing the
appropriate claim for refund with the Internal Revenue Service and furnishing any required information.
THE PRECEDING DISCUSSION OF THE MATERIAL U.S. FEDERAL INCOME TAX
CONSEQUENCES IS FOR GENERAL INFORMATION ONLY AND IS NOT TAX ADVICE. ACCORDINGLY,
EACH INVESTOR SHOULD CONSULT HIS, HER OR ITS OWN TAX ADVISOR AS TO THE PARTICULAR
TAX CONSEQUENCES OF PURCHASING, HOLDING AND DISPOSING OF PREFERRED SHARES,
PREFERRED ADSs, COMMON SHARES OR COMMON ADSs, INCLUDING THE APPLICABILITY AND
123
EFFECT OF ANY STATE, LOCAL, FOREIGN OR OTHER TAX LAWS AND OF ANY PROPOSED
CHANGES IN APPLICABLE LAW.
F. Where You Can Find More Information
Ambev is subject to the informational reporting requirements of the United States Securities Exchange Act of
1934, as amended, and files with the SEC:
▪Annual reports;
▪Certain other reports that we make public under Brazilian law, file with the Brazilian stock exchanges or
distribute to shareholders; and
▪Other information.
You may read and copy any reports or other information that Ambev files at the SEC’s public reference rooms
at 450 Fifth Street, N.W., Washington, D.C. 20549, and at the SEC’s regional offices located at the Woolworth
Building, 233 Broadway, New York, New York 10279 and Citicorp Center, 500 West Madison Street, Suite 1400,
Chicago, Illinois 60661. Please call the SEC at 1-800-SEC-0330 for further information on the public reference
rooms. Electronic filings made through the Electronic Data Gathering, Analysis and Retrieval System are also
publicly available through the Securities and Exchange Commission’s website on the Internet at www.sec.gov. In
addition, material filed by Ambev may also be inspected at the offices of the New York Stock Exchange at 20 Broad
Street, New York, New York 10005.
As a foreign private issuer, Ambev is exempt from the rules under the Exchange Act prescribing the
furnishing and content of proxy statements and will not be required to file proxy statements with the SEC, and its
officers, directors and principal shareholders will be exempt from the reporting and ―short swing‖ profit recovery
provisions contained in Section 16 of the Exchange Act.
You may obtain documents from Ambev by requesting them in writing, at the following addresses or by
telephone:
Companhia de Bebidas das Américas – Ambev
Attention: Telephone numbers:
Fax: Email:
Investor Relations Department (55-11) 2122-1415 (55-11) 2122-1414 (55-11) 2122-1526 [email protected]
You may obtain additional information about Ambev on its website at www.Ambev-ir.com. The information
contained therein is not part of this annual report.
124
ITEM 11. QUANTITATIVE AND QUALITATIVE DISCLOSURES ABOUT MARKET RISK
We are exposed to various market risks, including changes in foreign currency exchange rates and interest
rates and changes in the prices of certain commodities, including malt, aluminum and sugar. Market risk is the
potential loss arising from adverse changes in market rates and prices. We enter into derivatives and other financial
instruments, in order to manage and reduce the impact of fluctuations in commodity prices, in foreign currency
exchange rates and in interest rates. We have established policies and procedures for risk assessment and the
approval, reporting and monitoring of derivative financial activities. Decisions regarding hedging are made
according to our risk management policy, taking into consideration the amount and duration of the exposure, market
volatility and economic trends.
These instruments are accounted for based on their characteristics. See Note 28 to our consolidated financial
statements for a discussion of the accounting policies and information on derivative financial instruments.
We have a policy of entering into contracts only with parties that have high credit ratings. The counterparties
to these contracts are major financial institutions, and we do not have significant exposure to any single
counterparty. We do not anticipate a credit loss from counterparty non-performance. Our short-term investments
consist mainly of fixed-term obligations and government securities.
Enterprise Risk Management (ERM)
We have implemented a management strategy to promote enterprise-wide risk management (ERM), through
an integrated framework that considers the impact on our business of not only market risks but also of compliance,
strategic and operational risks. We believe that such integrated framework, which accounts for different kinds of
business risks, enables us to improve management’s ability to evaluate risks associated with our business.
The risk management department is responsible for review and follow up with management the risk factors
and related mitigating initiatives consistent with our corporate strategy.
Commodity Risk
We use a large volume of agricultural goods to produce our products, including malt and hops for our beer
and sugar, guaraná, other fruits and sweeteners for our CSDs. See ―Information on the Company—Ambev Business
Overview—Sources and Availability of Raw Materials‖. We purchase a significant portion of our malt and all of our
hops outside of Brazil. We purchase the remainder of our malt and our sugar, guaraná and other fruits and
sweeteners locally. Ambev also purchases substantial quantities of aluminum cans.
We produce approximately 80% of our consolidated malt needs. The remainder and all other commodities are
purchased from third parties. We believe that adequate supplies of the commodities we use are available at the
present time, but we cannot predict the future availability of these commodities or the prices we will have to pay for
such commodities. The commodity markets have experienced and will continue to experience price fluctuations. We
believe that the future price and supply of agricultural materials will be determined by, among other factors, the
level of crop production, weather conditions, export demand, and government regulations and legislation affecting
agriculture, and that the price of aluminum and sugar will be largely influenced by international market prices. See
―Information on the Company—Ambev Business Overview—Sources and Availability of Raw Materials‖.
All of the hops we purchase in the international markets outside of South America are paid for in U.S. dollars.
In addition, although we purchase aluminum cans and sugar in Brazil, their prices are directly influenced by the
fluctuation of international commodity prices.
As of December 31, 2010, our derivative activities consisted of sugar, wheat, aluminum, corn, crude oil and
heating oil derivatives. The table below provides information about our significant commodity risk sensitive
instruments as of December 31, 2010. The contract terms of these instruments have been categorized by expected
maturity dates and are measured at market prices.
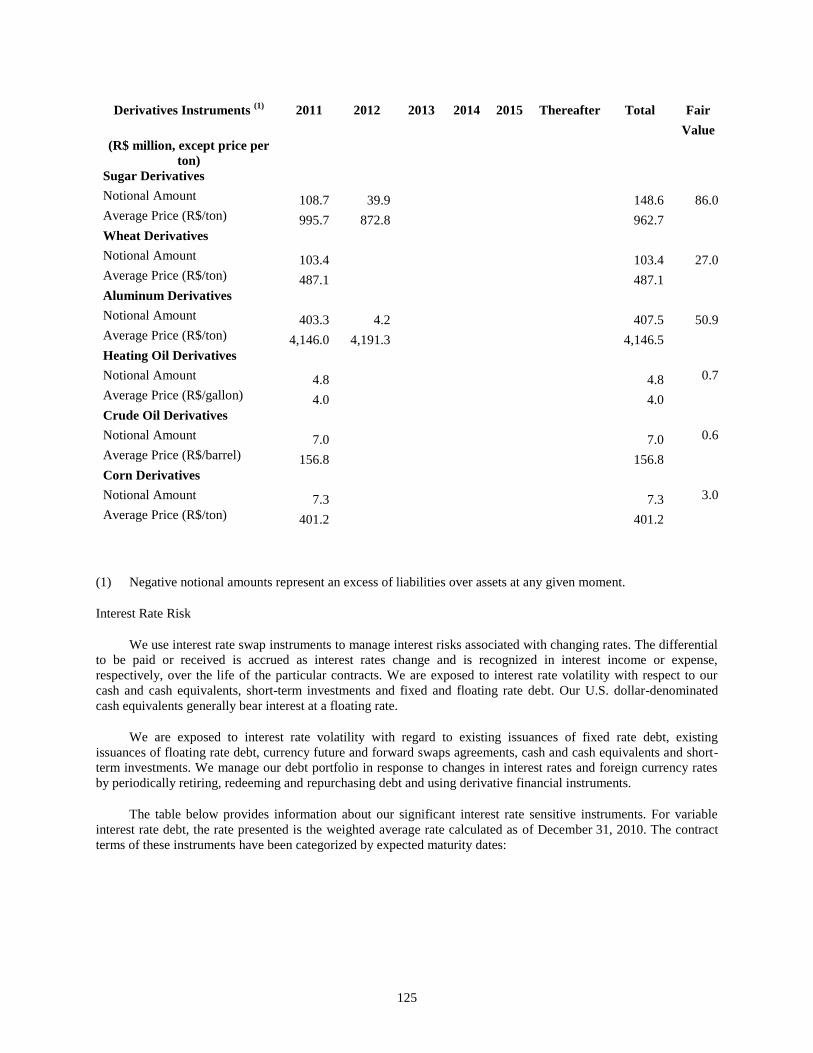
125
Derivatives Instruments (1)
2011 2012 2013 2014 2015 Thereafter Total Fair
Value
(R$ million, except price per
ton)
Sugar Derivatives
Notional Amount 108.7 39.9
148.6 86.0
Average Price (R$/ton) 995.7 872.8
962.7
Wheat Derivatives
Notional Amount 103.4
103.4 27.0
Average Price (R$/ton) 487.1
487.1
Aluminum Derivatives
Notional Amount 403.3 4.2
407.5 50.9
Average Price (R$/ton) 4,146.0 4,191.3
4,146.5
Heating Oil Derivatives
Notional Amount 4.8
4.8 0.7
Average Price (R$/gallon) 4.0
4.0
Crude Oil Derivatives
Notional Amount 7.0
7.0 0.6
Average Price (R$/barrel) 156.8
156.8
Corn Derivatives
Notional Amount 7.3
7.3 3.0
Average Price (R$/ton) 401.2
401.2
(1) Negative notional amounts represent an excess of liabilities over assets at any given moment.
Interest Rate Risk
We use interest rate swap instruments to manage interest risks associated with changing rates. The differential
to be paid or received is accrued as interest rates change and is recognized in interest income or expense,
respectively, over the life of the particular contracts. We are exposed to interest rate volatility with respect to our
cash and cash equivalents, short-term investments and fixed and floating rate debt. Our U.S. dollar-denominated
cash equivalents generally bear interest at a floating rate.
We are exposed to interest rate volatility with regard to existing issuances of fixed rate debt, existing
issuances of floating rate debt, currency future and forward swaps agreements, cash and cash equivalents and short-
term investments. We manage our debt portfolio in response to changes in interest rates and foreign currency rates
by periodically retiring, redeeming and repurchasing debt and using derivative financial instruments.
The table below provides information about our significant interest rate sensitive instruments. For variable
interest rate debt, the rate presented is the weighted average rate calculated as of December 31, 2010. The contract
terms of these instruments have been categorized by expected maturity dates:
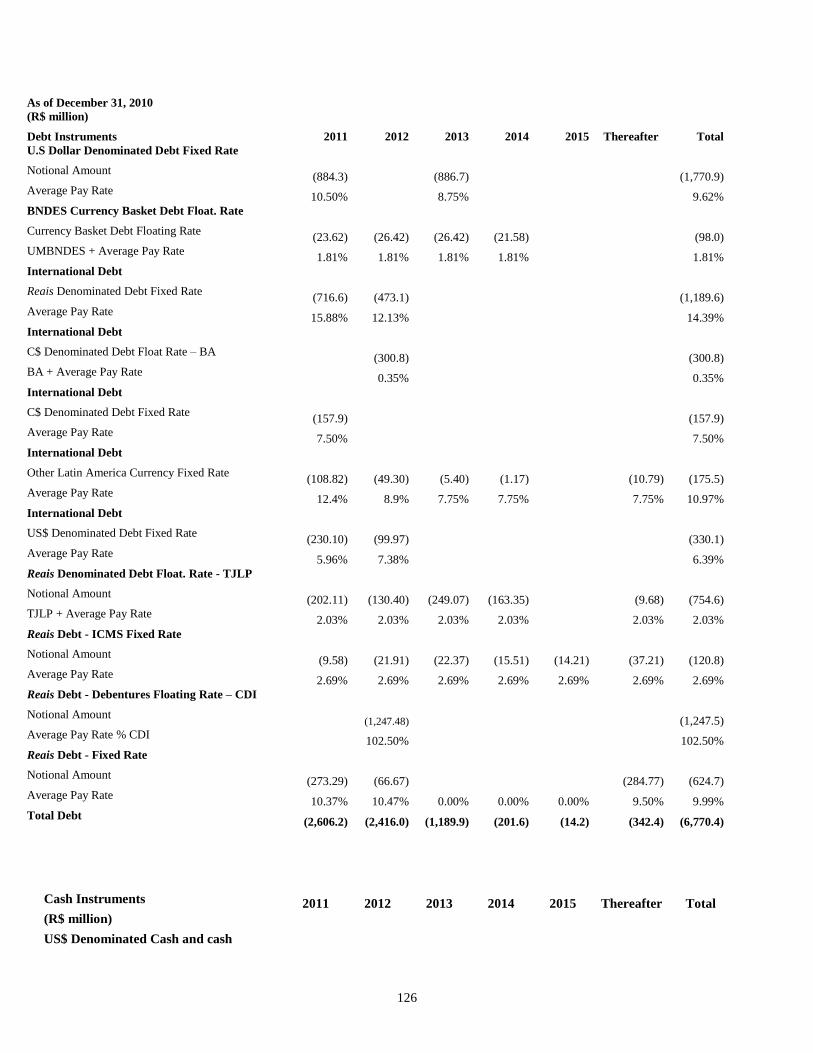
126
As of December 31, 2010
(R$ million)
Debt Instruments 2011 2012 2013 2014 2015 Thereafter Total
U.S Dollar Denominated Debt Fixed Rate
Notional Amount (884.3)
(886.7)
(1,770.9)
Average Pay Rate 10.50%
8.75%
9.62%
BNDES Currency Basket Debt Float. Rate
Currency Basket Debt Floating Rate (23.62) (26.42) (26.42) (21.58)
(98.0)
UMBNDES + Average Pay Rate 1.81% 1.81% 1.81% 1.81%
1.81%
International Debt
Reais Denominated Debt Fixed Rate (716.6) (473.1)
(1,189.6)
Average Pay Rate 15.88% 12.13%
14.39%
International Debt
C$ Denominated Debt Float Rate – BA
(300.8)
(300.8)
BA + Average Pay Rate
0.35%
0.35%
International Debt
C$ Denominated Debt Fixed Rate (157.9)
(157.9)
Average Pay Rate 7.50%
7.50%
International Debt
Other Latin America Currency Fixed Rate (108.82) (49.30) (5.40) (1.17)
(10.79) (175.5)
Average Pay Rate 12.4% 8.9% 7.75% 7.75%
7.75% 10.97%
International Debt
US$ Denominated Debt Fixed Rate (230.10) (99.97)
(330.1)
Average Pay Rate 5.96% 7.38%
6.39%
Reais Denominated Debt Float. Rate - TJLP
Notional Amount (202.11) (130.40) (249.07) (163.35)
(9.68) (754.6)
TJLP + Average Pay Rate 2.03% 2.03% 2.03% 2.03%
2.03% 2.03%
Reais Debt - ICMS Fixed Rate
Notional Amount (9.58) (21.91) (22.37) (15.51) (14.21) (37.21) (120.8)
Average Pay Rate 2.69% 2.69% 2.69% 2.69% 2.69% 2.69% 2.69%
Reais Debt - Debentures Floating Rate – CDI
Notional Amount
(1,247.48)
(1,247.5)
Average Pay Rate % CDI
102.50%
102.50%
Reais Debt - Fixed Rate
Notional Amount (273.29) (66.67)
(284.77) (624.7)
Average Pay Rate 10.37% 10.47% 0.00% 0.00% 0.00% 9.50% 9.99%
Total Debt (2,606.2) (2,416.0) (1,189.9) (201.6) (14.2) (342.4) (6,770.4)
Cash Instruments 2011 2012 2013 2014 2015 Thereafter Total
(R$ million)
US$ Denominated Cash and cash
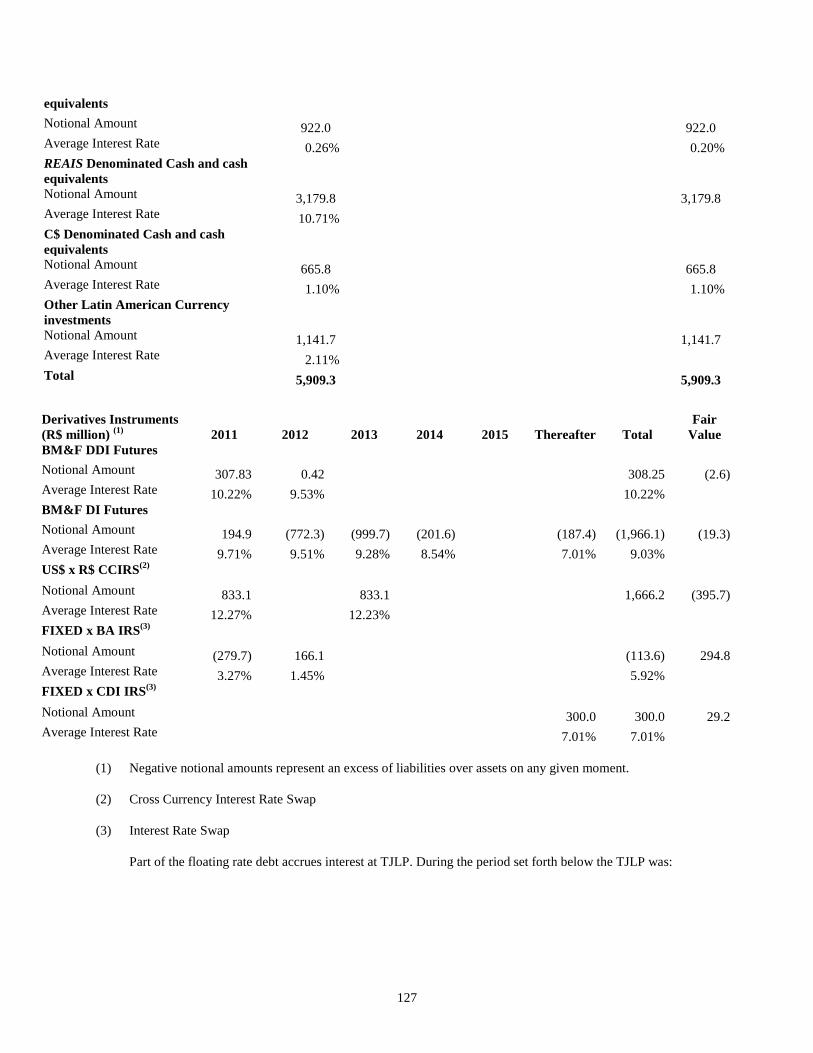
127
equivalents
Notional Amount 922.0
922.0
Average Interest Rate 0.26%
0.20%
REAIS Denominated Cash and cash
equivalents
Notional Amount 3,179.8
3,179.8
Average Interest Rate 10.71%
C$ Denominated Cash and cash
equivalents
Notional Amount 665.8
665.8
Average Interest Rate 1.10%
1.10%
Other Latin American Currency
investments
Notional Amount 1,141.7
1,141.7
Average Interest Rate 2.11%
Total 5,909.3
5,909.3
(1) Negative notional amounts represent an excess of liabilities over assets on any given moment.
(2) Cross Currency Interest Rate Swap
(3) Interest Rate Swap
Part of the floating rate debt accrues interest at TJLP. During the period set forth below the TJLP was:
Derivatives Instruments
(R$ million) (1)
2011 2012 2013 2014 2015 Thereafter Total
Fair
Value
BM&F DDI Futures
Notional Amount 307.83 0.42
308.25 (2.6)
Average Interest Rate 10.22% 9.53%
10.22%
BM&F DI Futures
Notional Amount 194.9 (772.3) (999.7) (201.6)
(187.4) (1,966.1) (19.3)
Average Interest Rate 9.71% 9.51% 9.28% 8.54%
7.01% 9.03%
US$ x R$ CCIRS(2)
Notional Amount 833.1
833.1
1,666.2 (395.7)
Average Interest Rate 12.27%
12.23%
FIXED x BA IRS(3)
Notional Amount (279.7) 166.1
(113.6) 294.8
Average Interest Rate 3.27% 1.45%
5.92%
FIXED x CDI IRS(3)
Notional Amount
300.0 300.0 29.2
Average Interest Rate
7.01% 7.01%
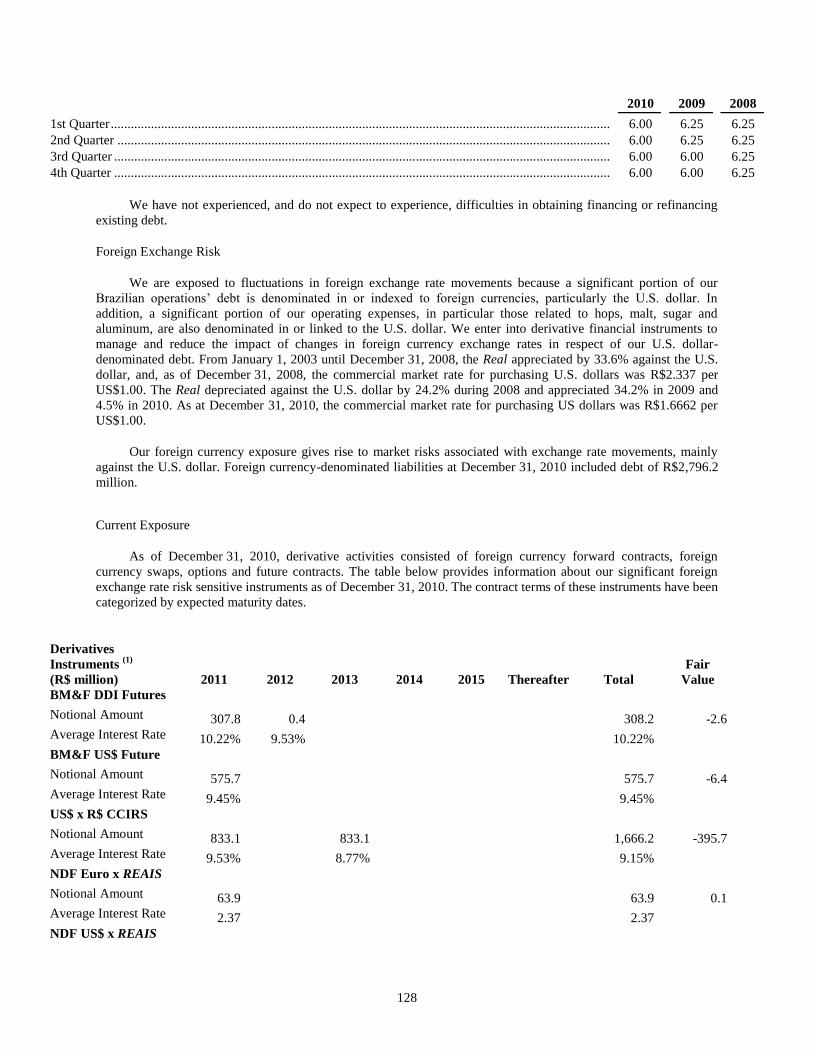
128
2010
2009
2008
1st Quarter ........................................................................................................................................................ 6.00 6.25 6.25
2nd Quarter ...................................................................................................................................................... 6.00 6.25 6.25
3rd Quarter ....................................................................................................................................................... 6.00 6.00 6.25
4th Quarter ....................................................................................................................................................... 6.00 6.00 6.25
We have not experienced, and do not expect to experience, difficulties in obtaining financing or refinancing
existing debt.
Foreign Exchange Risk
We are exposed to fluctuations in foreign exchange rate movements because a significant portion of our
Brazilian operations’ debt is denominated in or indexed to foreign currencies, particularly the U.S. dollar. In
addition, a significant portion of our operating expenses, in particular those related to hops, malt, sugar and
aluminum, are also denominated in or linked to the U.S. dollar. We enter into derivative financial instruments to
manage and reduce the impact of changes in foreign currency exchange rates in respect of our U.S. dollar-
denominated debt. From January 1, 2003 until December 31, 2008, the Real appreciated by 33.6% against the U.S.
dollar, and, as of December 31, 2008, the commercial market rate for purchasing U.S. dollars was R$2.337 per
US$1.00. The Real depreciated against the U.S. dollar by 24.2% during 2008 and appreciated 34.2% in 2009 and
4.5% in 2010. As at December 31, 2010, the commercial market rate for purchasing US dollars was R$1.6662 per
US$1.00.
Our foreign currency exposure gives rise to market risks associated with exchange rate movements, mainly
against the U.S. dollar. Foreign currency-denominated liabilities at December 31, 2010 included debt of R$2,796.2
million.
Current Exposure
As of December 31, 2010, derivative activities consisted of foreign currency forward contracts, foreign
currency swaps, options and future contracts. The table below provides information about our significant foreign
exchange rate risk sensitive instruments as of December 31, 2010. The contract terms of these instruments have been
categorized by expected maturity dates.
Derivatives
Instruments (1)
(R$ million) 2011 2012 2013 2014 2015 Thereafter Total
Fair
Value
BM&F DDI Futures
Notional Amount 307.8 0.4
308.2 -2.6
Average Interest Rate 10.22% 9.53%
10.22%
BM&F US$ Future
Notional Amount 575.7
575.7 -6.4
Average Interest Rate 9.45%
9.45%
US$ x R$ CCIRS
Notional Amount 833.1
833.1
1,666.2 -395.7
Average Interest Rate 9.53%
8.77%
9.15%
NDF Euro x REAIS
Notional Amount 63.9
63.9 0.1
Average Interest Rate 2.37
2.37
NDF US$ x REAIS
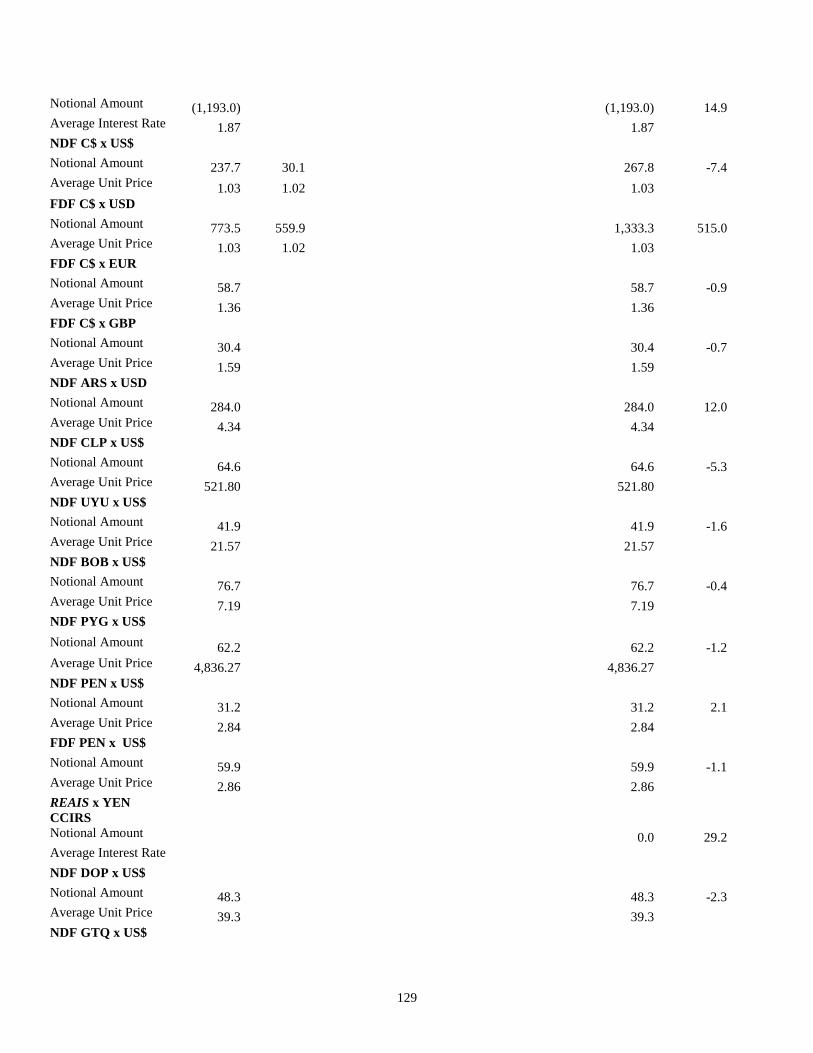
129
Notional Amount (1,193.0)
(1,193.0) 14.9
Average Interest Rate 1.87
1.87
NDF C$ x US$
Notional Amount 237.7 30.1
267.8 -7.4
Average Unit Price 1.03 1.02
1.03
FDF C$ x USD
Notional Amount 773.5 559.9
1,333.3 515.0
Average Unit Price 1.03 1.02
1.03
FDF C$ x EUR
Notional Amount 58.7
58.7 -0.9
Average Unit Price 1.36
1.36
FDF C$ x GBP
Notional Amount 30.4
30.4 -0.7
Average Unit Price 1.59
1.59
NDF ARS x USD
Notional Amount 284.0
284.0 12.0
Average Unit Price 4.34
4.34
NDF CLP x US$
Notional Amount 64.6
64.6 -5.3
Average Unit Price 521.80
521.80
NDF UYU x US$
Notional Amount 41.9
41.9 -1.6
Average Unit Price 21.57
21.57
NDF BOB x US$
Notional Amount 76.7
76.7 -0.4
Average Unit Price 7.19
7.19
NDF PYG x US$
Notional Amount 62.2
62.2 -1.2
Average Unit Price 4,836.27
4,836.27
NDF PEN x US$
Notional Amount 31.2
31.2 2.1
Average Unit Price 2.84
2.84
FDF PEN x US$
Notional Amount 59.9
59.9 -1.1
Average Unit Price 2.86
2.86
REAIS x YEN
CCIRS
Notional Amount
0.0 29.2
Average Interest Rate
NDF DOP x US$
Notional Amount 48.3
48.3 -2.3
Average Unit Price 39.3
39.3
NDF GTQ x US$
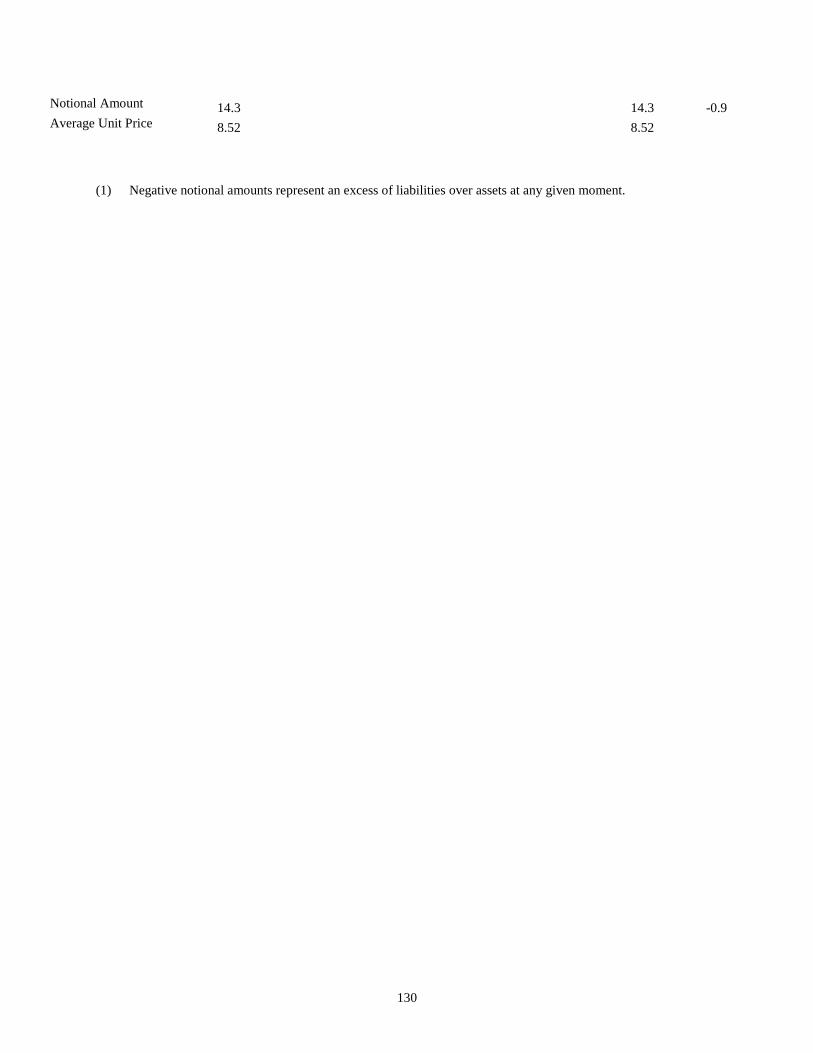
130
Notional Amount 14.3
14.3 -0.9
Average Unit Price 8.52
8.52
(1) Negative notional amounts represent an excess of liabilities over assets at any given moment.
131
ITEM 12. DESCRIPTION OF SECURITIES OTHER THAN EQUITY SECURITIES
Debt Securities
Not Applicable.
Warrants and Rights
Not Applicable.
Other Securities
Not Applicable.
American Depositary Shares
The Bank of New York Mellon (formerly The Bank of New York) is the depositary of Ambev shares in
accordance with Common Deposit Agreement, dated July 17, 2000, as amended and restated in October 23, 2000
and August 2, 2007, entered into with Ambev, The Bank of New York Mellon, as depositary, and all owners from
time to time of ADSs issued by Ambev (―Depositary Agreement‖). A copy of this Depositary Agreement is filed as
an exhibit to this Form 20−F.
The depositary, The Bank of New York Mellon, collects its fees for delivery and surrender of ADSs directly
from investors depositing shares or surrendering ADSs or from intermediaries acting for them. The depositary also
collects fees for making distributions to investors by deducting those fees from the amounts distributed or by selling
a portion of distributable property to pay the fees. The depositary may collect its annual fee for depositary services
by deductions from cash distributions or by directly billing investors or by charging the book-entry system accounts
of participants acting for them. The depositary may generally refuse to provide fee-attracting services until its fees
for those services are paid. Pursuant to the Depositary Agreement, holders of our ADSs may have to pay to The
Bank of New York Mellon, either directly or indirectly, fees or charges up to the amounts set forth in the table
below.
Associated Fee Depositary Action
$5.00 or less per 100 ADSs (or portion thereof)
• Issuance of ADSs, including issuances resulting from
a distribution of shares or rights or other property.
• Cancellation of ADSs for the purpose of withdrawal,
including in case of termination of the Deposit
Agreement.
Taxes and other governmental charges the depositary or
the custodian have to pay on any ADS or share underlying
an ADS, for example, stock transfer taxes, stamp duty or
withholding taxes
As applicable
Registration and transfer fees
• Transfer and registration of shares on our share
register to or from the name of the depositary or its
agent when you deposit or withdraw shares
A fee equivalent to the fee that would be payable for
execution and delivery of ADSs as a result of the deposit of
• Issuance of ADS or shares received in exercise of
rights distributed, but whose securities or rights are
132
such securities, but which securities are instead distributed instead sold by the depositary and the net proceeds
distributed
Any charges incurred by the depositary or its agents for
servicing the deposited securities
As necessary
Expenses of the depositary
• Cable, telex and facsimile transmissions (when
expressly provided in the deposit agreement)
• Converting foreign currency to U.S. dollars
Subject to certain terms and conditions, The Bank of New York Mellon has agreed to reimburse us for certain
expenses it incurs that are related to establishment and maintenance expenses of the ADS program, including the
standard out-of-pocket maintenance costs for the ADRs, which consist of the expenses of postage and envelopes for
mailing annual and interim financial reports, printing and distributing dividend checks, electronic filing of U.S.
Federal tax information, mailing required tax forms, stationery, postage, facsimile, and telephone calls. There are
limits on the amount of expenses for which the depositary will reimburse us, but the amount of reimbursement
available to us is not necessarily tied to the amount of fees the depositary collects from investors.
The Bank of New York Mellon has made payments in the amount of US$1.2 million on behalf of Ambev
during 2010, which was used for general corporate purposes such as the payment of costs and expenses associated
with (1) the preparation and distribution of proxy materials, (2) the preparation and distribution of marketing
materials and (3) consulting and other services related to investor relations.

133
ITEM 13. DEFAULT, DIVIDENDS ARREARAGES AND DELINQUENCIES
Not Applicable.

134
ITEM 14. MATERIAL MODIFICATIONS TO THE RIGHTS OF SECURITY HOLDERS AND USE OF
PROCEEDS
Not Applicable.
135
ITEM 15. CONTROLS AND PROCEDURES
Disclosure Controls and Procedures
The Company has carried out an evaluation of the effectiveness of the design and operation of the Company’s
disclosure controls and procedures under the supervision and with the participation of the Company’s management,
which is responsible for the management of the internal controls, including the Chief Executive Officer and Chief
Financial Officer. While there are inherent limitations to the effectiveness of any system of disclosure controls and
procedures, including the possibility of human error and the circumvention or overriding of the controls and
procedures, the Company’s disclosure controls and procedures are designed to provide reasonable assurance of
achieving their objectives. Based upon the Company’s evaluation, as of the end date of the period covered by this
report, the Chief Executive Officer and Chief Financial Officer of the Company have concluded that the disclosure
controls and procedures are (i) effective in ensuring that information required to be disclosed in the reports that are
filed or submitted under the U.S. Securities Exchange Act of 1934, as amended (the ―Exchange Act‖), is recorded,
processed, summarized and reported within the time periods specified in the Commissions’ rules and forms and
(ii) effective in ensuring that information to be disclosed in the reports that are filed or submitted under the
Exchange Act is accumulated and communicated to the management of the Company, including the Chief Executive
Officer and the Chief Financial Officer, to allow timely decisions regarding required disclosure.
Management’s Annual Report on Internal Control over Financial Reporting
Our management is responsible for establishing and maintaining effective internal control over financial
reporting and for its assessment of the effectiveness of internal control over financial reporting.
Internal control over financial reporting is defined in rules 13a-15(f) and 15d-15(f) under the Exchange Act as
a process designed to provide reasonable assurance regarding the reliability of financial reporting and the
preparation of financial statements for external purposes in accordance with generally accepted accounting
principles, and includes those policies and procedures that (1) pertain to the maintenance of records that, in
reasonable detail, accurately and fairly reflect the transactions and dispositions of the assets of the Company;
(2) provide reasonable assurance that transactions are recorded as necessary to permit preparation of financial
statements in accordance with generally accepted accounting principles, and that receipts and expenditures of the
Company are being made only in accordance with authorizations of management and directors of the Company; and
(3) provide reasonable assurance regarding prevention or timely detection of unauthorized acquisition, use, or
disposition of the Company’s assets that could have a material effect on the consolidated financial statements.
Because of its inherent limitations, internal control over financial reporting may not prevent or detect material
misstatements. Also, projections of any evaluation of effectiveness to future periods are subject to the risk that
controls may become inadequate because of changes in conditions, or that the degree of compliance with the
policies or procedures may deteriorate.
The effectiveness of our internal control over financial reporting as of December 31, 2010, is based on the
criteria established in Internal Control - Integrated Framework issued by the Committee of Sponsoring
Organizations - COSO - of the Treadway Commission. Based on that assessment management has concluded that
as of December 31, 2010 the Company’s internal control over financial reporting is effective.
The effectiveness of our internal control over financial reporting as of December 31, 2010 has been audited by
PricewaterhouseCoopers Auditores Independentes, the Company’s independent registered public accounting firm,
which opinion is stated in their report, included herein.

136
Changes in Internal Control over Financial Reporting
There have been no changes in our internal control over financial reporting that occurred during the period
covered by this annual report that has materially affected, or is reasonably likely to materially affect, our internal
control over financial reporting.

137
ITEM 16A. AUDIT COMMITTEE FINANCIAL EXPERT
We have relied on the exemption provided for under Rule 10A-3(c)(3) of the Exchange Act, pursuant to
Section 301 of the Sarbanes-Oxley Act of 2002, which enables us to have the Conselho Fiscal perform the duties of
an audit committee for the purposes of such Act, to the extent permitted by Brazilian law. In accordance with the
charter of our Conselho Fiscal, at least one of its members has to fulfill the requirements of the Sarbanes-Oxley Act
of 2002 for the purposes of qualifying as an audit committee financial expert. Accordingly, our Conselho Fiscal is
comprised of one ―audit committee financial expert‖ within the meaning of this Item 16A, namely Mr. Álvaro
Antônio Cardoso de Souza, who has an extensive work-related finance background and who is ―independent‖ as set
forth in Rule 10A-3(c) of the Sarbanes-Oxley Act of 2002.

138
ITEM 16B. CODE OF BUSINESS CONDUCT
We have adopted a code of business conduct (as defined under the rules and regulations of the SEC, and
formerly called Code of Ethics) that apply to our principal executive officer, principal financial officer and principal
accounting officer, among others. The code became effective in 2003; it was last amended on December 11,
2006 and is attached to this annual report as an Exhibit. If the provisions of the code that apply to our principal
executive officer, principal financial officer or principal accounting officer are amended, or if a waiver is granted,
we will disclose such amendment or waiver.
139
ITEM 16C. PRINCIPAL ACCOUNTANT FEES AND SERVICES
PricewaterhouseCoopers Auditores Independentes acted as our independent auditor for the fiscal year ended
December 31, 2010. The chart below sets forth the total amount billed to us by PricewaterhouseCoopers Auditores
Independentes, for services performed in the year 2010, and breaks down these amounts by category of service:
2010
(R$
thousands)
Audit Fees ................................................................................................................................................. 6,283.0 Audit-Related Fees ................................................................................................................................... 0.0 Tax Fees .................................................................................................................................................... 900.0 All Other Fees ........................................................................................................................................... 354.0 Total .......................................................................................................................................................... 7,537.0
KPMG Auditores Independentes acted as our independent auditor for the fiscal years ended December
31, 2009 and 2008. The chart below sets forth the total amount billed to us by KPMG Auditores Independentes, for
services performed in the years 2009 and 2008, and breaks down these amounts by category of service:
2009 2008
(R$
thousands)
(R$
thousands) Audit Fees ................................................................................................................................................ 5,777.9 5,618.9
Audit-Related Fees ................................................................................................................................... 179.2 701.3
Tax Fees ................................................................................................................................................... 34.5 46.9
All Other Fees .......................................................................................................................................... 7.1 144.0
Total ......................................................................................................................................................... 5,998.8 6,511.1
Audit Fees
Audit fees are fees billed for the audit of our annual financial statements and for the reviews of our quarterly
financial statements in connection with statutory and regulatory filings or engagements (including audit of our
subsidiaries for consolidated purpose).
Audit-Related Fees
Audit-related fees in 2010 and 2009 consisted of fees billed for assurance and related services that were
reasonably related to the performance of the audit or review of our financial statements or that were traditionally
performed by the external auditor.
Tax Fees
Tax fees in 2010 and 2009 were related to tax compliance services.
All Other Fees
All other services consist primarily of fees billed for certain compliance reports to be filed with local
regulators and certain comfort letters issued in connection with the issuance of debt.
Independent Registered Public Accounting Firm
The financial statements for the year ended December 31, 2010 have been audited by
PricewaterhouseCoopers Auditores Independentes, São Paulo, Brazil, independent registered public accounting
firm. The offices of PricewaterhouseCoopers Auditores Independentes are located at Av. Francisco Matarazzo, 1400
140
in the city of São Paulo, São Paulo. They are members of the Conselho Regional de Contabilidade (Regional Board
of Accountants of São Paulo) and their registration number is 2SP0001/O-5.
The financial statements for the years ended December 31 2009 and 2008 have been audited by KPMG
Auditores Independentes, São Paulo, Brazil, independent registered public accounting firm. The offices of KPMG
Auditores Independentes are located at Rua Dr. Renato Paes de Barros, 33, in the city of São Paulo, São Paulo. They
are members of the Conselho Regional de Contabilidade (Regional Board of Accountants of São Paulo) and their
registration number is 2SPO14428/O-6.
Pre-Approval Policies and Procedures
We have adopted pre-approval policies and procedures under which all audit and non-audit services provided
by contracted external auditors must be pre-cleared by the Conselho Fiscal, which performs the duties of an audit
committee for the purposes of the Sarbanes-Oxley Act of 2002, in accordance with Rule 10A-3(c). The Conselho
Fiscal adopts a list of services and amount limits for contracting for each external auditor under terms included in a
―basic list‖, which is in turn approved by the Board of Directors. Any services provided from such list are deemed
―pre-approved‖ for purposes of the Sarbanes-Oxley Act of 2002. The Board of Directors and the Conselho Fiscal
periodically receive from our chief financial officer a summary report on the progress of the pre-approved services
rendered and the corresponding fees duly authorized. Any services which are not included in such require a prior
favorable opinion of our Conselho Fiscal. Our policy also contains a list of services which cannot be rendered by
our external auditors.
141
ITEM 16D. EXEMPTIONS FROM THE LISTING STANDARDS FOR AUDIT COMMITTEES
NYSE corporate governance standards require that a listed company have an audit committee composed of
three independent members that satisfy the independence requirements of Rule 10A-3 under the Exchange Act, with
a written charter that addresses certain duties.
The Conselho Fiscal is a permanent body which operates independently from our management and from our
registered independent public accounting firm. Its principal function is to examine the financial statements of each
fiscal year and provide a formal report to our shareholders. We are relying on the exemption provided for in
Rule 10A-3(c)(3) and believe that our reliance on this exemption will not materially affect the ability of the
Conselho Fiscal to act independently and to satisfy the other requirements of Rule 10A-3. In accordance with the
charter of our Conselho Fiscal, at least one of its members has to fulfill the requirements of the Sarbanes-Oxley Act
of 2002 for the purposes of qualifying as an audit committee financial expert. Accordingly, our Conselho Fiscal has
designated one financial expert, namely Mr. Álvaro Antônio Cardoso de Souza.
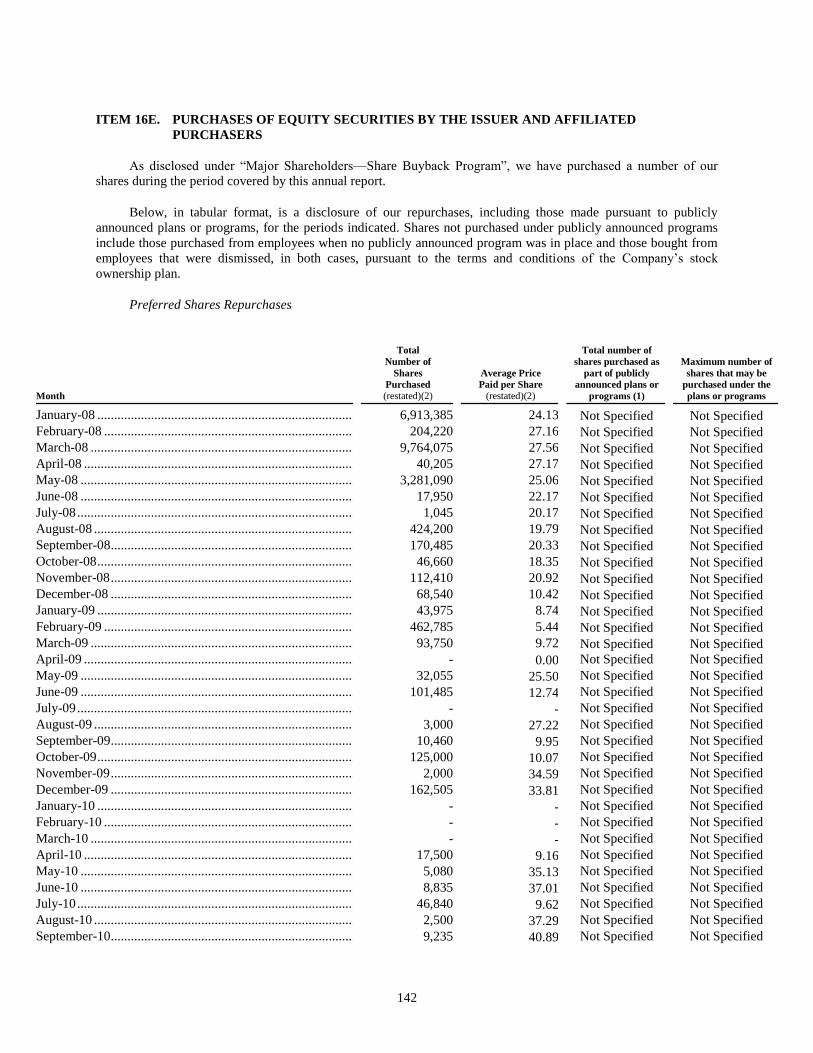
142
ITEM 16E. PURCHASES OF EQUITY SECURITIES BY THE ISSUER AND AFFILIATED
PURCHASERS
As disclosed under ―Major Shareholders—Share Buyback Program‖, we have purchased a number of our
shares during the period covered by this annual report.
Below, in tabular format, is a disclosure of our repurchases, including those made pursuant to publicly
announced plans or programs, for the periods indicated. Shares not purchased under publicly announced programs
include those purchased from employees when no publicly announced program was in place and those bought from
employees that were dismissed, in both cases, pursuant to the terms and conditions of the Company’s stock
ownership plan.
Preferred Shares Repurchases
Month
Total
Number of
Shares
Purchased (restated)(2)
Average Price
Paid per Share
(restated)(2)
Total number of
shares purchased as
part of publicly
announced plans or
programs (1)
Maximum number of
shares that may be
purchased under the
plans or programs
January-08 ....................................................................................... 6,913,385 24.13 Not Specified Not Specified February-08 ..................................................................................... 204,220 27.16 Not Specified Not Specified March-08 ......................................................................................... 9,764,075 27.56 Not Specified Not Specified April-08 ........................................................................................... 40,205 27.17 Not Specified Not Specified May-08 ............................................................................................ 3,281,090 25.06 Not Specified Not Specified June-08 ............................................................................................ 17,950 22.17 Not Specified Not Specified July-08 ............................................................................................. 1,045 20.17 Not Specified Not Specified August-08 ........................................................................................ 424,200 19.79 Not Specified Not Specified September-08 ................................................................................... 170,485 20.33 Not Specified Not Specified October-08 ....................................................................................... 46,660 18.35 Not Specified Not Specified November-08 ................................................................................... 112,410 20.92 Not Specified Not Specified December-08 ................................................................................... 68,540 10.42 Not Specified Not Specified January-09 ....................................................................................... 43,975 8.74 Not Specified Not Specified February-09 ..................................................................................... 462,785 5.44 Not Specified Not Specified March-09 ......................................................................................... 93,750 9.72 Not Specified Not Specified April-09 ........................................................................................... - 0.00 Not Specified Not Specified May-09 ............................................................................................ 32,055 25.50 Not Specified Not Specified June-09 ............................................................................................ 101,485 12.74 Not Specified Not Specified July-09 ............................................................................................. - - Not Specified Not Specified August-09 ........................................................................................ 3,000 27.22 Not Specified Not Specified September-09 ................................................................................... 10,460 9.95 Not Specified Not Specified October-09 ....................................................................................... 125,000 10.07 Not Specified Not Specified November-09 ................................................................................... 2,000 34.59 Not Specified Not Specified December-09 ................................................................................... 162,505 33.81 Not Specified Not Specified January-10 ....................................................................................... - - Not Specified Not Specified February-10 ..................................................................................... - - Not Specified Not Specified March-10 ......................................................................................... - - Not Specified Not Specified April-10 ........................................................................................... 17,500 9.16 Not Specified Not Specified
May-10 ............................................................................................ 5,080 35.13 Not Specified Not Specified
June-10 ............................................................................................ 8,835 37.01 Not Specified Not Specified
July-10 ............................................................................................. 46,840 9.62 Not Specified Not Specified
August-10 ........................................................................................ 2,500 37.29 Not Specified Not Specified
September-10 ................................................................................... 9,235 40.89 Not Specified Not Specified
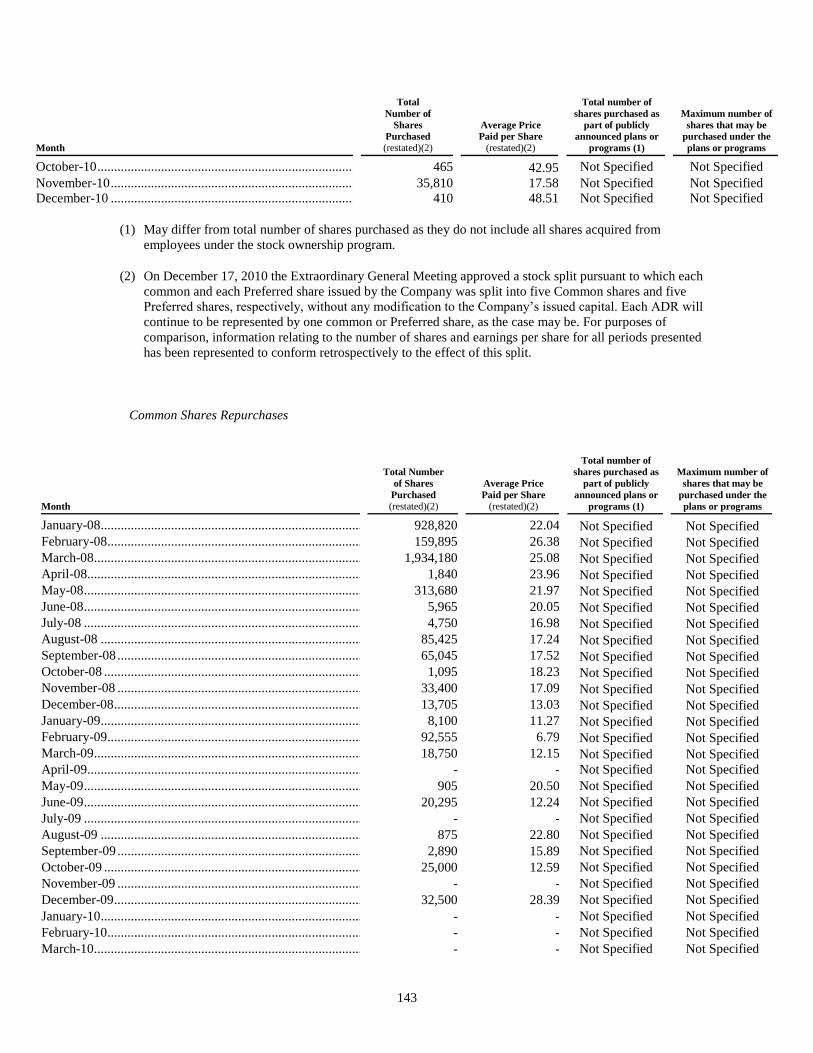
143
Month
Total
Number of
Shares
Purchased (restated)(2)
Average Price
Paid per Share
(restated)(2)
Total number of
shares purchased as
part of publicly
announced plans or
programs (1)
Maximum number of
shares that may be
purchased under the
plans or programs
October-10 ....................................................................................... 465 42.95 Not Specified Not Specified
November-10 ................................................................................... 35,810 17.58 Not Specified Not Specified
December-10 ................................................................................... 410 48.51 Not Specified Not Specified
(1) May differ from total number of shares purchased as they do not include all shares acquired from
employees under the stock ownership program.
(2) On December 17, 2010 the Extraordinary General Meeting approved a stock split pursuant to which each
common and each Preferred share issued by the Company was split into five Common shares and five
Preferred shares, respectively, without any modification to the Company’s issued capital. Each ADR will
continue to be represented by one common or Preferred share, as the case may be. For purposes of
comparison, information relating to the number of shares and earnings per share for all periods presented
has been represented to conform retrospectively to the effect of this split.
Common Shares Repurchases
Month
Total Number
of Shares
Purchased (restated)(2)
Average Price
Paid per Share (restated)(2)
Total number of
shares purchased as
part of publicly
announced plans or
programs (1)
Maximum number of
shares that may be
purchased under the
plans or programs
January-08 .................................................................................... 928,820 22.04 Not Specified Not Specified February-08 .................................................................................. 159,895 26.38 Not Specified Not Specified March-08...................................................................................... 1,934,180 25.08 Not Specified Not Specified April-08........................................................................................ 1,840 23.96 Not Specified Not Specified May-08 ......................................................................................... 313,680 21.97 Not Specified Not Specified June-08 ......................................................................................... 5,965 20.05 Not Specified Not Specified July-08 ......................................................................................... 4,750 16.98 Not Specified Not Specified August-08 .................................................................................... 85,425 17.24 Not Specified Not Specified September-08 ............................................................................... 65,045 17.52 Not Specified Not Specified October-08 ................................................................................... 1,095 18.23 Not Specified Not Specified November-08 ............................................................................... 33,400 17.09 Not Specified Not Specified December-08 ................................................................................ 13,705 13.03 Not Specified Not Specified January-09 .................................................................................... 8,100 11.27 Not Specified Not Specified February-09 .................................................................................. 92,555 6.79 Not Specified Not Specified March-09...................................................................................... 18,750 12.15 Not Specified Not Specified April-09........................................................................................ - - Not Specified Not Specified May-09 ......................................................................................... 905 20.50 Not Specified Not Specified June-09 ......................................................................................... 20,295 12.24 Not Specified Not Specified July-09 ......................................................................................... - - Not Specified Not Specified August-09 .................................................................................... 875 22.80 Not Specified Not Specified September-09 ............................................................................... 2,890 15.89 Not Specified Not Specified October-09 ................................................................................... 25,000 12.59 Not Specified Not Specified November-09 ............................................................................... - - Not Specified Not Specified December-09 ................................................................................ 32,500 28.39 Not Specified Not Specified January-10 ........................................................................................ - - Not Specified Not Specified February-10 ...................................................................................... - - Not Specified Not Specified March-10.......................................................................................... - - Not Specified Not Specified
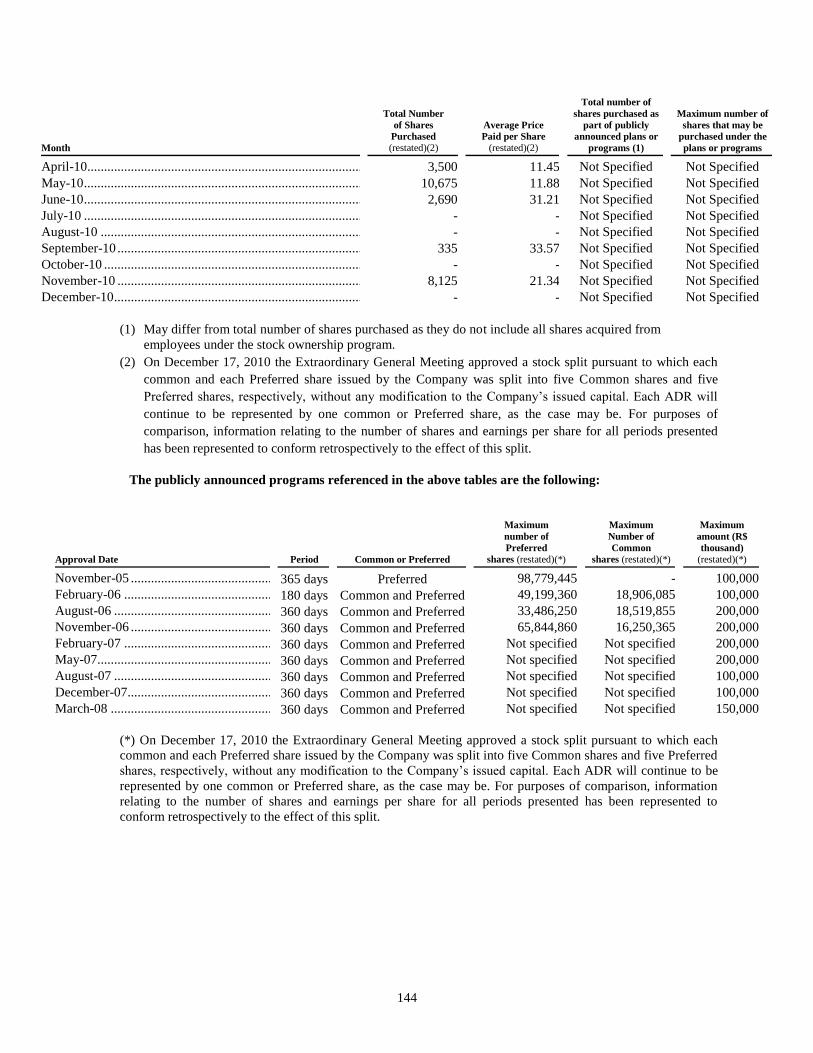
144
Month
Total Number
of Shares
Purchased (restated)(2)
Average Price
Paid per Share (restated)(2)
Total number of
shares purchased as
part of publicly
announced plans or
programs (1)
Maximum number of
shares that may be
purchased under the
plans or programs
April-10............................................................................................ 3,500 11.45 Not Specified Not Specified
May-10 ............................................................................................. 10,675 11.88 Not Specified Not Specified
June-10 ............................................................................................. 2,690 31.21 Not Specified Not Specified
July-10 ............................................................................................. - - Not Specified Not Specified
August-10 ........................................................................................ - - Not Specified Not Specified
September-10 ................................................................................... 335 33.57 Not Specified Not Specified
October-10 ....................................................................................... - - Not Specified Not Specified
November-10 ................................................................................... 8,125 21.34 Not Specified Not Specified
December-10 .................................................................................... - - Not Specified Not Specified
(1) May differ from total number of shares purchased as they do not include all shares acquired from
employees under the stock ownership program.
(2) On December 17, 2010 the Extraordinary General Meeting approved a stock split pursuant to which each
common and each Preferred share issued by the Company was split into five Common shares and five
Preferred shares, respectively, without any modification to the Company’s issued capital. Each ADR will
continue to be represented by one common or Preferred share, as the case may be. For purposes of
comparison, information relating to the number of shares and earnings per share for all periods presented
has been represented to conform retrospectively to the effect of this split.
The publicly announced programs referenced in the above tables are the following:
Approval Date
Period
Common or Preferred
Maximum
number of
Preferred
shares (restated)(*)
Maximum
Number of
Common
shares (restated)(*)
Maximum
amount (R$
thousand) (restated)(*)
November-05 .................................................... 365 days Preferred 98,779,445 - 100,000 February-06 ...................................................... 180 days Common and Preferred 49,199,360 18,906,085 100,000 August-06 ......................................................... 360 days Common and Preferred 33,486,250 18,519,855 200,000 November-06 .................................................... 360 days Common and Preferred 65,844,860 16,250,365 200,000 February-07 ...................................................... 360 days Common and Preferred Not specified Not specified 200,000 May-07.............................................................. 360 days Common and Preferred Not specified Not specified 200,000 August-07 ......................................................... 360 days Common and Preferred Not specified Not specified 100,000 December-07..................................................... 360 days Common and Preferred Not specified Not specified 100,000 March-08 .......................................................... 360 days Common and Preferred Not specified Not specified 150,000
(*) On December 17, 2010 the Extraordinary General Meeting approved a stock split pursuant to which each
common and each Preferred share issued by the Company was split into five Common shares and five Preferred
shares, respectively, without any modification to the Company’s issued capital. Each ADR will continue to be
represented by one common or Preferred share, as the case may be. For purposes of comparison, information
relating to the number of shares and earnings per share for all periods presented has been represented to
conform retrospectively to the effect of this split.

145
ITEM 16F. CHANGE IN REGISTRANT‟S CERTIFYING ACCOUNTANT
We previously reported a change in our auditors from KPMG Auditores Independentes to PricewaterhouseCoopers
Auditores Independentes in our Form 20-F/A filed with the SEC on 12 October 2010.

146
ITEM 16G. CORPORATE GOVERNANCE
The principal differences between the NYSE corporate governance standards and our corporate governance
practices are referred to in Item 6C, ―Differences Between the United States and the Brazilian Corporate
Governance Practices‖.
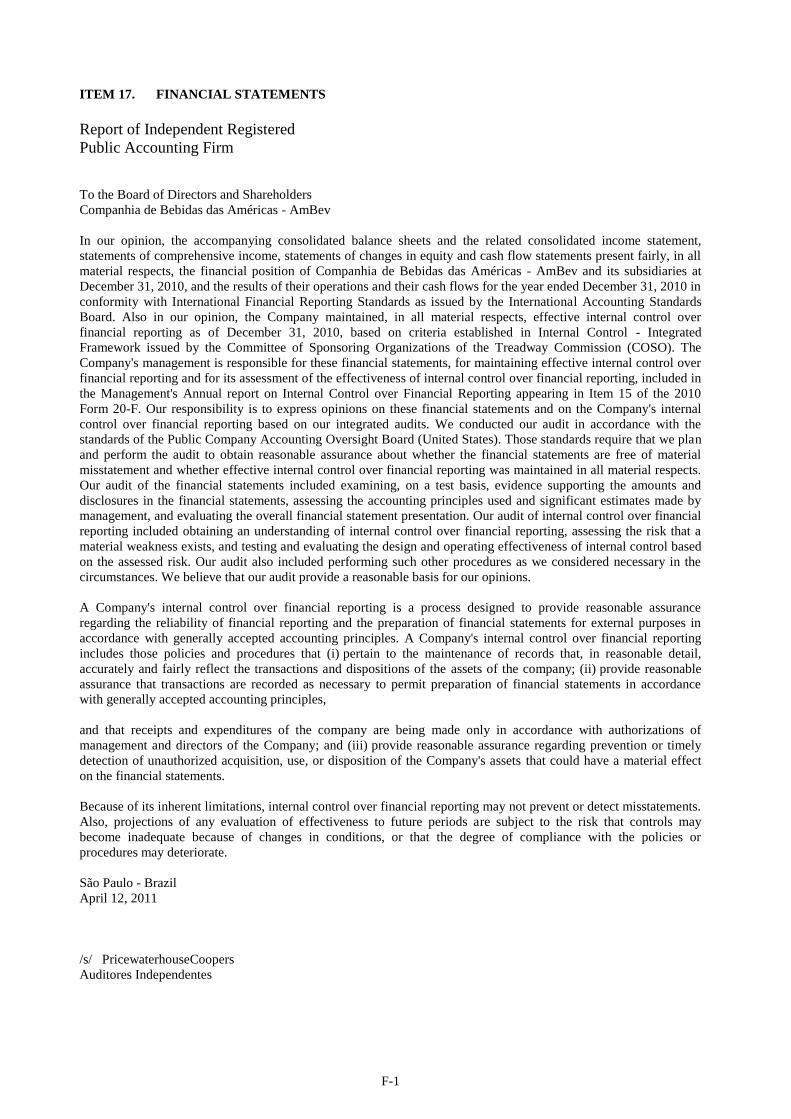
F-1
ITEM 17. FINANCIAL STATEMENTS
Report of Independent Registered
Public Accounting Firm To the Board of Directors and Shareholders
Companhia de Bebidas das Américas - AmBev
In our opinion, the accompanying consolidated balance sheets and the related consolidated income statement,
statements of comprehensive income, statements of changes in equity and cash flow statements present fairly, in all
material respects, the financial position of Companhia de Bebidas das Américas - AmBev and its subsidiaries at
December 31, 2010, and the results of their operations and their cash flows for the year ended December 31, 2010 in
conformity with International Financial Reporting Standards as issued by the International Accounting Standards
Board. Also in our opinion, the Company maintained, in all material respects, effective internal control over
financial reporting as of December 31, 2010, based on criteria established in Internal Control - Integrated
Framework issued by the Committee of Sponsoring Organizations of the Treadway Commission (COSO). The
Company's management is responsible for these financial statements, for maintaining effective internal control over
financial reporting and for its assessment of the effectiveness of internal control over financial reporting, included in
the Management's Annual report on Internal Control over Financial Reporting appearing in Item 15 of the 2010
Form 20-F. Our responsibility is to express opinions on these financial statements and on the Company's internal
control over financial reporting based on our integrated audits. We conducted our audit in accordance with the
standards of the Public Company Accounting Oversight Board (United States). Those standards require that we plan
and perform the audit to obtain reasonable assurance about whether the financial statements are free of material
misstatement and whether effective internal control over financial reporting was maintained in all material respects.
Our audit of the financial statements included examining, on a test basis, evidence supporting the amounts and
disclosures in the financial statements, assessing the accounting principles used and significant estimates made by
management, and evaluating the overall financial statement presentation. Our audit of internal control over financial
reporting included obtaining an understanding of internal control over financial reporting, assessing the risk that a
material weakness exists, and testing and evaluating the design and operating effectiveness of internal control based
on the assessed risk. Our audit also included performing such other procedures as we considered necessary in the
circumstances. We believe that our audit provide a reasonable basis for our opinions.
A Company's internal control over financial reporting is a process designed to provide reasonable assurance
regarding the reliability of financial reporting and the preparation of financial statements for external purposes in
accordance with generally accepted accounting principles. A Company's internal control over financial reporting
includes those policies and procedures that (i) pertain to the maintenance of records that, in reasonable detail,
accurately and fairly reflect the transactions and dispositions of the assets of the company; (ii) provide reasonable
assurance that transactions are recorded as necessary to permit preparation of financial statements in accordance
with generally accepted accounting principles,
and that receipts and expenditures of the company are being made only in accordance with authorizations of
management and directors of the Company; and (iii) provide reasonable assurance regarding prevention or timely
detection of unauthorized acquisition, use, or disposition of the Company's assets that could have a material effect
on the financial statements.
Because of its inherent limitations, internal control over financial reporting may not prevent or detect misstatements.
Also, projections of any evaluation of effectiveness to future periods are subject to the risk that controls may
become inadequate because of changes in conditions, or that the degree of compliance with the policies or
procedures may deteriorate.
São Paulo - Brazil
April 12, 2011
/s/ PricewaterhouseCoopers
Auditores Independentes
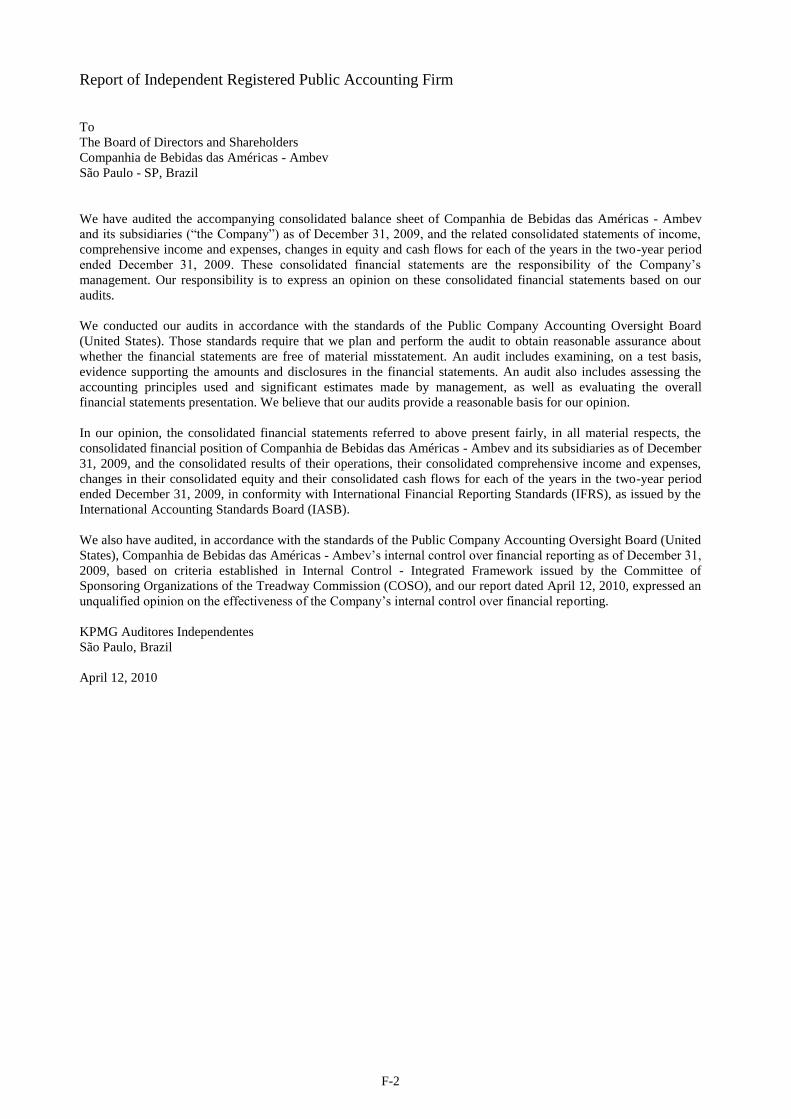
F-2
Report of Independent Registered Public Accounting Firm
To
The Board of Directors and Shareholders
Companhia de Bebidas das Américas - Ambev
São Paulo - SP, Brazil
We have audited the accompanying consolidated balance sheet of Companhia de Bebidas das Américas - Ambev
and its subsidiaries (―the Company‖) as of December 31, 2009, and the related consolidated statements of income,
comprehensive income and expenses, changes in equity and cash flows for each of the years in the two-year period
ended December 31, 2009. These consolidated financial statements are the responsibility of the Company’s
management. Our responsibility is to express an opinion on these consolidated financial statements based on our
audits.
We conducted our audits in accordance with the standards of the Public Company Accounting Oversight Board
(United States). Those standards require that we plan and perform the audit to obtain reasonable assurance about
whether the financial statements are free of material misstatement. An audit includes examining, on a test basis,
evidence supporting the amounts and disclosures in the financial statements. An audit also includes assessing the
accounting principles used and significant estimates made by management, as well as evaluating the overall
financial statements presentation. We believe that our audits provide a reasonable basis for our opinion.
In our opinion, the consolidated financial statements referred to above present fairly, in all material respects, the
consolidated financial position of Companhia de Bebidas das Américas - Ambev and its subsidiaries as of December
31, 2009, and the consolidated results of their operations, their consolidated comprehensive income and expenses,
changes in their consolidated equity and their consolidated cash flows for each of the years in the two-year period
ended December 31, 2009, in conformity with International Financial Reporting Standards (IFRS), as issued by the
International Accounting Standards Board (IASB).
We also have audited, in accordance with the standards of the Public Company Accounting Oversight Board (United
States), Companhia de Bebidas das Américas - Ambev’s internal control over financial reporting as of December 31,
2009, based on criteria established in Internal Control - Integrated Framework issued by the Committee of
Sponsoring Organizations of the Treadway Commission (COSO), and our report dated April 12, 2010, expressed an
unqualified opinion on the effectiveness of the Company’s internal control over financial reporting.
KPMG Auditores Independentes
São Paulo, Brazil
April 12, 2010
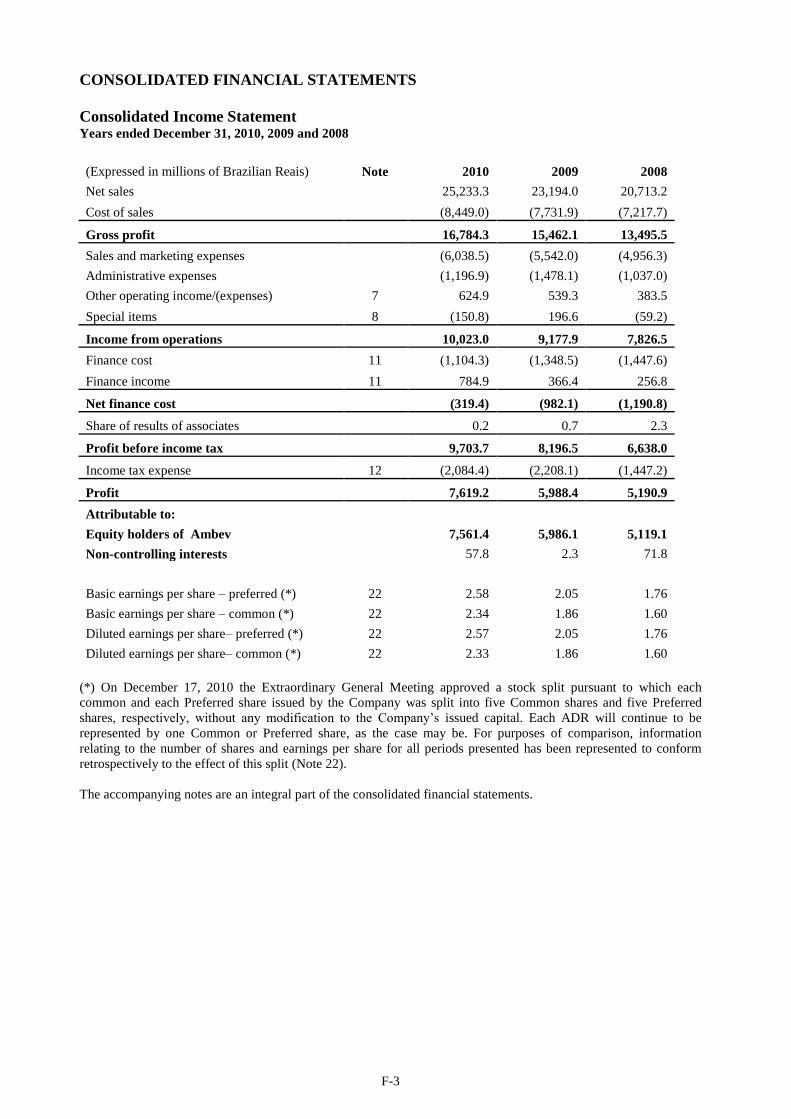
F-3
CONSOLIDATED FINANCIAL STATEMENTS
Consolidated Income Statement Years ended December 31, 2010, 2009 and 2008
(Expressed in millions of Brazilian Reais) Note 2010 2009 2008
Net sales
25,233.3 23,194.0 20,713.2
Cost of sales (8,449.0) (7,731.9) (7,217.7)
Gross profit 16,784.3 15,462.1 13,495.5
Sales and marketing expenses
(6,038.5) (5,542.0) (4,956.3)
Administrative expenses
(1,196.9) (1,478.1) (1,037.0)
Other operating income/(expenses) 7 624.9 539.3 383.5
Special items 8 (150.8) 196.6 (59.2)
Income from operations 10,023.0 9,177.9 7,826.5
Finance cost 11 (1,104.3) (1,348.5) (1,447.6)
Finance income 11 784.9 366.4 256.8
Net finance cost (319.4) (982.1) (1,190.8)
Share of results of associates 0.2 0.7 2.3
Profit before income tax 9,703.7 8,196.5 6,638.0
Income tax expense 12 (2,084.4) (2,208.1) (1,447.2)
Profit 7,619.2 5,988.4 5,190.9
Attributable to:
Equity holders of Ambev
7,561.4 5,986.1 5,119.1
Non-controlling interests
57.8 2.3 71.8
Basic earnings per share – preferred (*) 22 2.58 2.05 1.76
Basic earnings per share – common (*) 22 2.34 1.86 1.60
Diluted earnings per share– preferred (*) 22 2.57 2.05 1.76
Diluted earnings per share– common (*) 22 2.33 1.86 1.60
(*) On December 17, 2010 the Extraordinary General Meeting approved a stock split pursuant to which each
common and each Preferred share issued by the Company was split into five Common shares and five Preferred
shares, respectively, without any modification to the Company’s issued capital. Each ADR will continue to be
represented by one Common or Preferred share, as the case may be. For purposes of comparison, information
relating to the number of shares and earnings per share for all periods presented has been represented to conform
retrospectively to the effect of this split (Note 22).
The accompanying notes are an integral part of the consolidated financial statements.
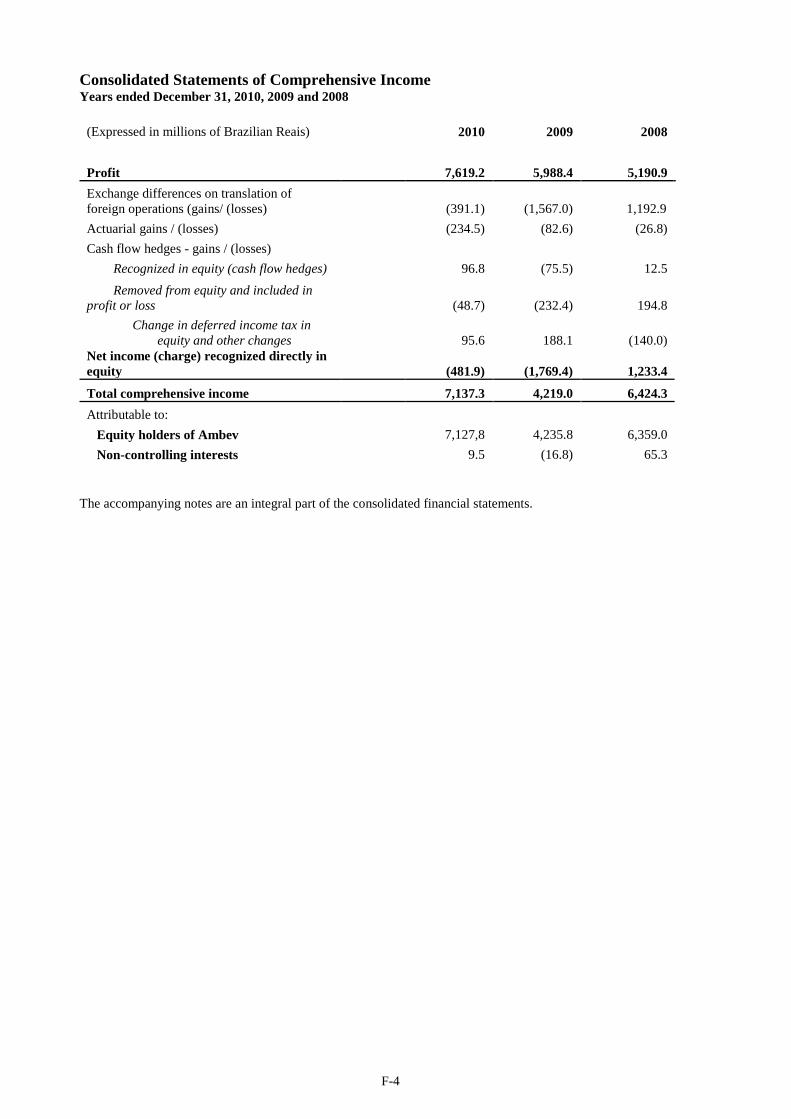
F-4
Consolidated Statements of Comprehensive Income Years ended December 31, 2010, 2009 and 2008
(Expressed in millions of Brazilian Reais)
2010 2009 2008
Profit 7,619.2 5,988.4 5,190.9
Exchange differences on translation of
foreign operations (gains/ (losses)
(391.1) (1,567.0) 1,192.9
Actuarial gains / (losses)
(234.5) (82.6) (26.8)
Cash flow hedges - gains / (losses)
Recognized in equity (cash flow hedges)
96.8 (75.5) 12.5
Removed from equity and included in
profit or loss
(48.7) (232.4) 194.8
Change in deferred income tax in
equity and other changes
95.6 188.1 (140.0)
Net income (charge) recognized directly in
equity
(481.9) (1,769.4) 1,233.4
Total comprehensive income 7,137.3 4,219.0 6,424.3
Attributable to:
Equity holders of Ambev
7,127,8 4,235.8 6,359.0
Non-controlling interests
9.5 (16.8) 65.3
The accompanying notes are an integral part of the consolidated financial statements.
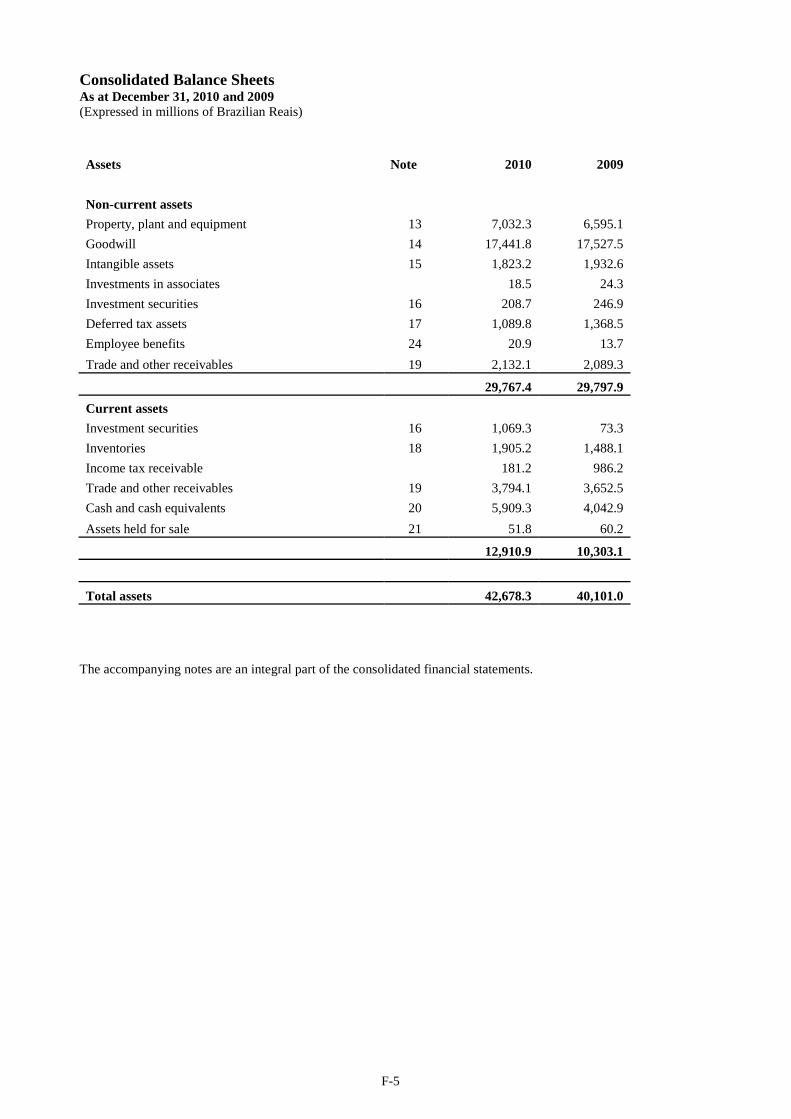
F-5
Consolidated Balance Sheets As at December 31, 2010 and 2009
(Expressed in millions of Brazilian Reais)
Assets Note 2010 2009
Non-current assets
Property, plant and equipment 13 7,032.3 6,595.1
Goodwill 14 17,441.8 17,527.5
Intangible assets 15 1,823.2 1,932.6
Investments in associates
18.5 24.3
Investment securities 16 208.7 246.9
Deferred tax assets 17 1,089.8 1,368.5
Employee benefits 24 20.9 13.7
Trade and other receivables 19 2,132.1 2,089.3
29,767.4 29,797.9
Current assets
Investment securities 16 1,069.3 73.3
Inventories 18 1,905.2 1,488.1
Income tax receivable
181.2 986.2
Trade and other receivables 19 3,794.1 3,652.5
Cash and cash equivalents 20 5,909.3 4,042.9
Assets held for sale 21 51.8 60.2
12,910.9 10,303.1
Total assets 42,678.3 40,101.0
The accompanying notes are an integral part of the consolidated financial statements.
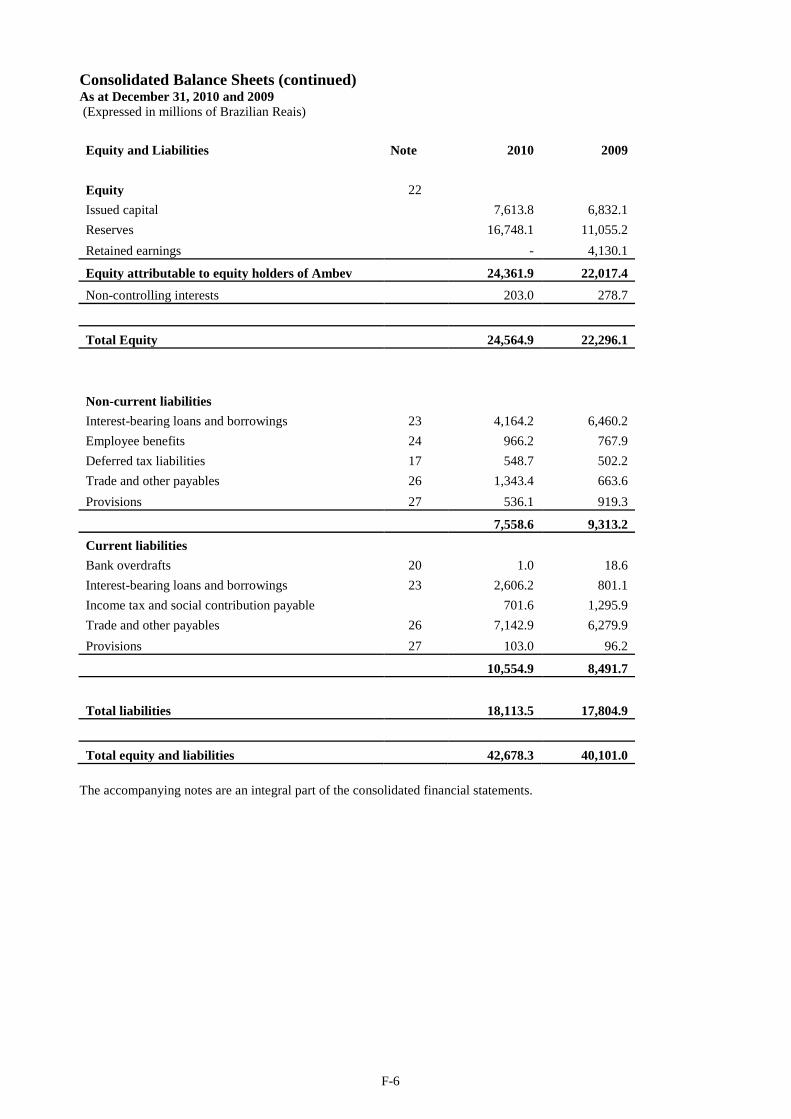
F-6
Consolidated Balance Sheets (continued) As at December 31, 2010 and 2009
(Expressed in millions of Brazilian Reais)
Equity and Liabilities Note 2010 2009
Equity 22
Issued capital
7,613.8 6,832.1
Reserves
16,748.1 11,055.2
Retained earnings - 4,130.1
Equity attributable to equity holders of Ambev 24,361.9 22,017.4
Non-controlling interests 203.0 278.7
Total Equity 24,564.9 22,296.1
Non-current liabilities
Interest-bearing loans and borrowings 23 4,164.2 6,460.2
Employee benefits 24 966.2 767.9
Deferred tax liabilities 17 548.7 502.2
Trade and other payables 26 1,343.4 663.6
Provisions 27 536.1 919.3
7,558.6 9,313.2
Current liabilities
Bank overdrafts 20 1.0 18.6
Interest-bearing loans and borrowings 23 2,606.2 801.1
Income tax and social contribution payable
701.6 1,295.9
Trade and other payables 26 7,142.9 6,279.9
Provisions 27 103.0 96.2
10,554.9 8,491.7
Total liabilities 18,113.5 17,804.9
Total equity and liabilities 42,678.3 40,101.0
The accompanying notes are an integral part of the consolidated financial statements.
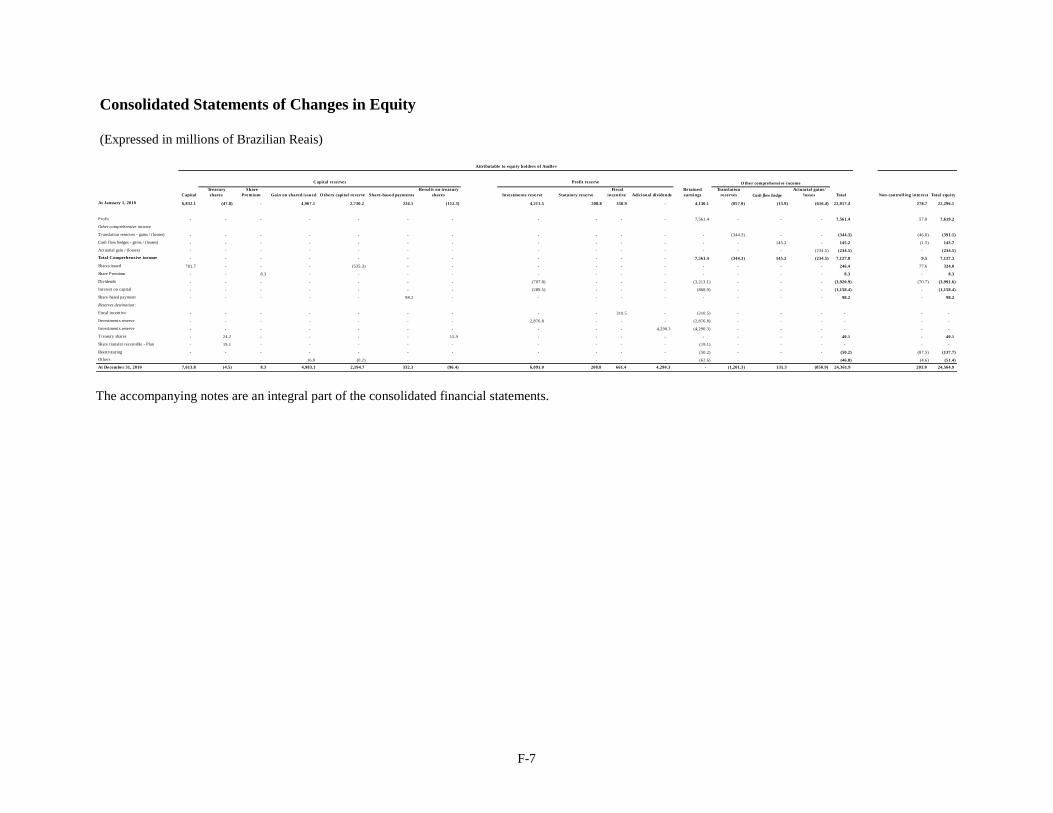
F-7
Consolidated Statements of Changes in Equity
(Expressed in millions of Brazilian Reais)
Capital
Treasury
shares
Share
Premium Gain on shared issued O thers capital reserve Share-based payments
Results on treasury
shares Investments reserve Statutory reserve
Fiscal
incentive Adicional dividends
Retained
earnings
Translation
reserves Cash flow hedge
Actuarial gains/
losses Total Non-controlling interest Total equity
At January 1, 2010 6,832.1 (47.8) - 4,967.1 2,730.2 234.1 (112.3) 4,211.5 208.8 350.9 - 4,130.1 (857.0) (13.9) (616.4) 22,017.4 278.7 22,296.1
Profit - - - - - - - - - - - 7,561.4 - - - 7,561.4 57.8 7,619.2
Other comprehensive income
Translation reserves - gains / (losses) - - - - - - - - - - - - (344.3) - - (344.3) (46.8) (391.1)
Cash flow hedges - gains / (losses) - - - - - - - - - - - - - 145.2 - 145.2 (1.5) 143.7
Actuarial gain / (losses) - - - - - - - - - - - - - - (234.5) (234.5) - (234.5)
Total Comprehensive income - - - - - - - - - - - 7,561.4 (344.3) 145.2 (234.5) 7,127.8 9.5 7,137.3
Shares issued 781.7 - - - (535.3) - - - - - - - - - - 246.4 77.6 324.0
Share Premium - - 8.3 - - - - - - - - - - - - 8.3 - 8.3
Dividends - - - - - - - (707.8) - - - (3,213.1) - - - (3,920.9) (70.7) (3,991.6)
Interest on capital - - - - - - - (289.5) - - - (868.9) - - - (1,158.4) - (1,158.4)
Share-based payment - - - - - 98.2 - - - - - - - - - 98.2 - 98.2
Reserves destination:
Fiscal incentive - - - - - - - - - 310.5 - (310.5) - - - - - -
Investments reserve - - - - - - - 2,876.8 - - - (2,876.8) - - - - - -
Investments reserve - - - - - - - - - - 4,290.3 (4,290.3) - - - - - -
Treasury shares - 24.2 - - - - 15.9 - - - - - - - - 40.1 - 40.1
Share transfer receivable - Plan - 19.1 - - - - - - - - - (19.1) - - - - - -
Reestruturing - - - - - - - - - - - (50.2) - - - (50.2) (87.5) (137.7)
Others - - - 16.0 (0.2) - - - - - - (62.6) - - - (46.8) (4.6) (51.4)
At December 31, 2010 7,613.8 (4.5) 8.3 4,983.1 2,194.7 332.3 (96.4) 6,091.0 208.8 661.4 4,290.3 - (1,201.3) 131.3 (850.9) 24,361.9 203.0 24,564.9
Attributable to equity holders of AmBev
Capital reserves Profit reserve O ther comprehensive income
The accompanying notes are an integral part of the consolidated financial statements.
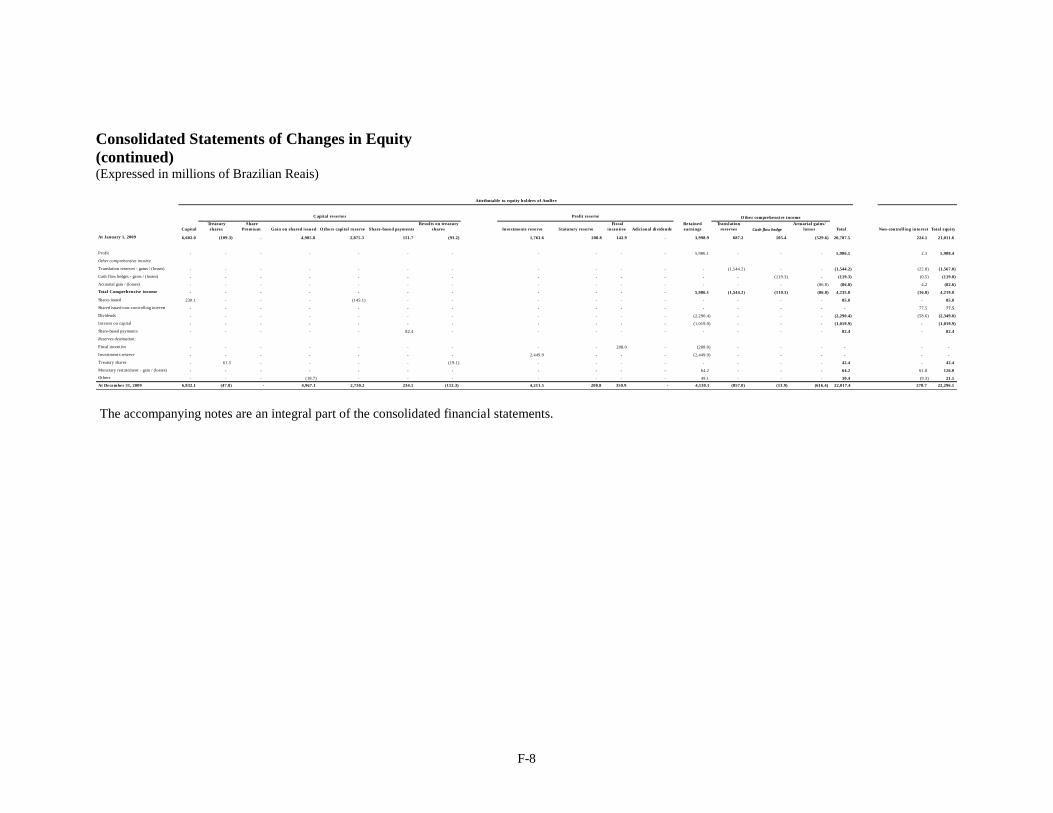
F-8
Consolidated Statements of Changes in Equity
(continued) (Expressed in millions of Brazilian Reais)
Capital
Treasury
shares
Share
Premium Gain on shared issued O thers capital reserve Share-based payments
Results on treasury
shares Investments reserve Statutory reserve
Fiscal
incentive Adicional dividends
Retained
earnings
Translation
reserves Cash flow hedge
Actuarial gains/
losses Total Non-controlling interest Total equity
At January 1, 2009 6,602.0 (109.3) - 4,985.8 2,875.3 151.7 (93.2) 1,761.6 208.8 142.9 - 3,998.9 687.2 105.4 (529.6) 20,787.5 224.1 21,011.6
Profit - - - - - - - - - - - 5,986.1 - - - 5,986.1 2.3 5,988.4
Other comprehensive income
Translation reserves - gains / (losses) - - - - - - - - - - - - (1,544.2) - - (1,544.2) (22.8) (1,567.0)
Cash flow hedges - gains / (losses) - - - - - - - - - - - - - (119.3) - (119.3) (0.5) (119.8)
Actuarial gain / (losses) - - - - - - - - - - - - - - (86.8) (86.8) 4.2 (82.6)
Total Comprehensive income - - - - - - - - - - - 5,986.1 (1,544.2) (119.3) (86.8) 4,235.8 (16.8) 4,219.0
Shares issued 230.1 - - - (145.1) - - - - - - - - - - 85.0 - 85.0
Shared issued non-controlling interest - - - - - - - - - - - - - - - - 77.5 77.5
Dividends - - - - - - - - - - - (2,290.4) - - - (2,290.4) (58.6) (2,349.0)
Interest on capital - - - - - - - - - - - (1,019.9) - - - (1,019.9) - (1,019.9)
Share-based payments - - - - - 82.4 - - - - - - - - - 82.4 - 82.4
Reserves destination:
Fiscal incentive - - - - - - - - - 208.0 - (208.0) - - - - - -
Investments reserve - - - - - - - 2,449.9 - - - (2,449.9) - - - - - -
Treasury shares - 61.5 - - - - (19.1) - - - - - - - - 42.4 - 42.4
Monetary restatement - gain / (losses) - - - - - - - - - - - 64.2 - - - 64.2 61.8 126.0
Others - - - (18.7) - - - - - - - 49.1 - - - 30.4 (9.3) 21.1
At December 31, 2009 6,832.1 (47.8) - 4,967.1 2,730.2 234.1 (112.3) 4,211.5 208.8 350.9 - 4,130.1 (857.0) (13.9) (616.4) 22,017.4 278.7 22,296.1
Attributable to equity holders of AmBev
Capital reserves Profit reserve O ther comprehensive income
The accompanying notes are an integral part of the consolidated financial statements.
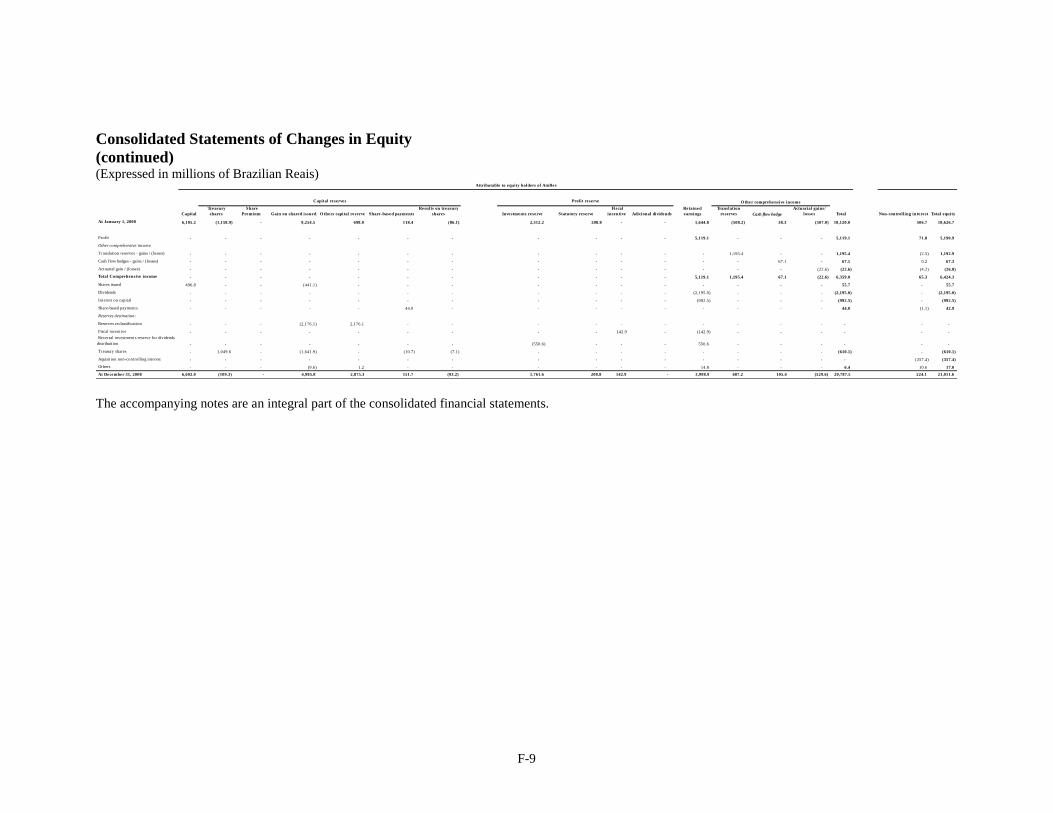
F-9
Consolidated Statements of Changes in Equity
(continued) (Expressed in millions of Brazilian Reais)
Capital
Treasury
shares
Share
Premium Gain on shared issued O thers capital reserve Share-based payments
Results on treasury
shares Investments reserve Statutory reserve
Fiscal
incentive Adicional dividends
Retained
earnings
Translation
reserves Cash flow hedge
Actuarial gains/
losses Total Non-controlling interest Total equity
At January 1, 2008 6,105.2 (1,158.9) - 9,254.5 698.0 118.4 (86.1) 2,312.2 208.8 - - 1,644.8 (508.2) 38.3 (507.0) 18,120.0 506.7 18,626.7
Profit - - - - - - - - - - - 5,119.1 - - - 5,119.1 71.8 5,190.9
Other comprehensive income
Translation reserves - gains / (losses) - - - - - - - - - - - - 1,195.4 - - 1,195.4 (2.5) 1,192.9
Cash flow hedges - gains / (losses) - - - - - - - - - - - - - 67.1 - 67.1 0.2 67.3
Actuarial gain / (losses) - - - - - - - - - - - - - - (22.6) (22.6) (4.2) (26.8)
Total Comprehensive income - - - - - - - - - - - 5,119.1 1,195.4 67.1 (22.6) 6,359.0 65.3 6,424.3
Shares issued 496.8 - - (441.1) - - - - - - - - - - - 55.7 - 55.7
Dividends - - - - - - - - - - - (2,195.0) - - - (2,195.0) - (2,195.0)
Interest on capital - - - - - - - - - - - (992.5) - - - (992.5) - (992.5)
Share-based payments - - - - - 44.0 - - - - - - - - - 44.0 (1.1) 42.9
Reserves destination:
Reserves reclassification - - - (2,176.1) 2,176.1 - - - - - - - - - - - - -
Fiscal incentive - - - - - - - - - 142.9 - (142.9) - - - - - -
Reversal investments reserve for dividends
distribuition - - - - - - - (550.6) - - - 550.6 - - - - - -
Treasury shares - 1,049.6 - (1,641.9) - (10.7) (7.1) - - - - - - - - (610.1) - (610.1)
Aquisition non-controlling interest - - - - - - - - - - - - - - - - (357.4) (357.4)
Others - - - (9.6) 1.2 - - - - - - 14.8 - - - 6.4 10.6 17.0
At December 31, 2008 6,602.0 (109.3) - 4,985.8 2,875.3 151.7 (93.2) 1,761.6 208.8 142.9 - 3,998.9 687.2 105.4 (529.6) 20,787.5 224.1 21,011.6
Attributable to equity holders of AmBev
Capital reserves Profit reserve O ther comprehensive income
The accompanying notes are an integral part of the consolidated financial statements.
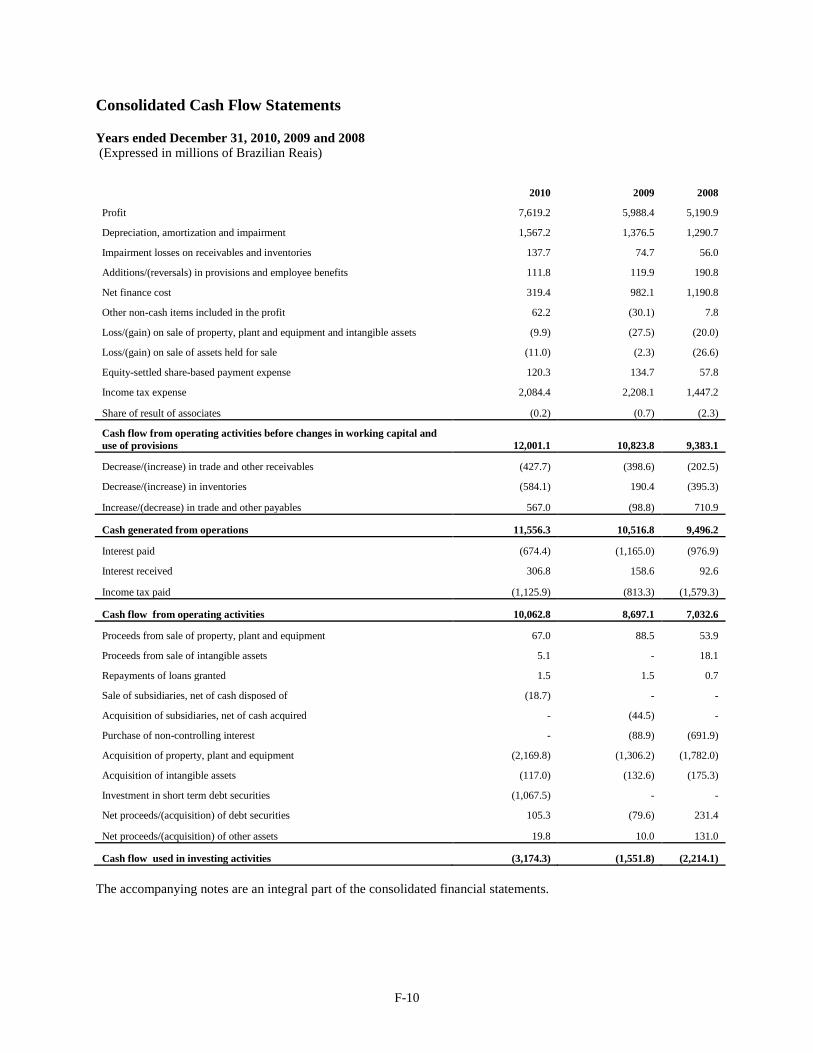
F-10
Consolidated Cash Flow Statements
Years ended December 31, 2010, 2009 and 2008
(Expressed in millions of Brazilian Reais)
2010 2009 2008
Profit 7,619.2 5,988.4 5,190.9
Depreciation, amortization and impairment 1,567.2 1,376.5 1,290.7
Impairment losses on receivables and inventories 137.7 74.7 56.0
Additions/(reversals) in provisions and employee benefits 111.8 119.9 190.8
Net finance cost 319.4 982.1 1,190.8
Other non-cash items included in the profit 62.2 (30.1) 7.8
Loss/(gain) on sale of property, plant and equipment and intangible assets (9.9) (27.5) (20.0)
Loss/(gain) on sale of assets held for sale (11.0) (2.3) (26.6)
Equity-settled share-based payment expense 120.3 134.7 57.8
Income tax expense 2,084.4 2,208.1 1,447.2
Share of result of associates (0.2) (0.7) (2.3)
Cash flow from operating activities before changes in working capital and
use of provisions 12,001.1 10,823.8 9,383.1
Decrease/(increase) in trade and other receivables (427.7) (398.6) (202.5)
Decrease/(increase) in inventories (584.1) 190.4 (395.3)
Increase/(decrease) in trade and other payables 567.0 (98.8) 710.9
Cash generated from operations 11,556.3 10,516.8 9,496.2
Interest paid (674.4) (1,165.0) (976.9)
Interest received 306.8 158.6 92.6
Income tax paid (1,125.9) (813.3) (1,579.3)
Cash flow from operating activities 10,062.8 8,697.1 7,032.6
Proceeds from sale of property, plant and equipment 67.0 88.5 53.9
Proceeds from sale of intangible assets 5.1 - 18.1
Repayments of loans granted 1.5 1.5 0.7
Sale of subsidiaries, net of cash disposed of (18.7) - -
Acquisition of subsidiaries, net of cash acquired - (44.5) -
Purchase of non-controlling interest - (88.9) (691.9)
Acquisition of property, plant and equipment (2,169.8) (1,306.2) (1,782.0)
Acquisition of intangible assets (117.0) (132.6) (175.3)
Investment in short term debt securities (1,067.5) - -
Net proceeds/(acquisition) of debt securities 105.3 (79.6) 231.4
Net proceeds/(acquisition) of other assets 19.8 10.0 131.0
Cash flow used in investing activities (3,174.3) (1,551.8) (2,214.1)
The accompanying notes are an integral part of the consolidated financial statements.
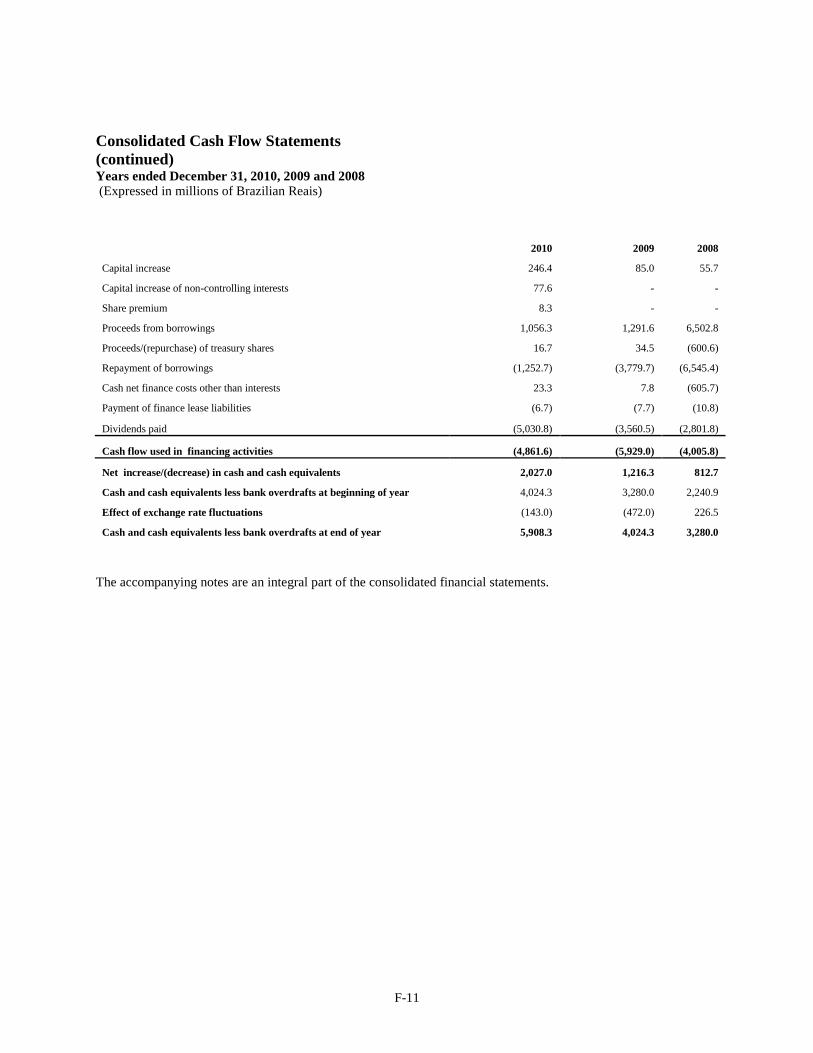
F-11
Consolidated Cash Flow Statements
(continued) Years ended December 31, 2010, 2009 and 2008
(Expressed in millions of Brazilian Reais)
2010 2009 2008
Capital increase 246.4 85.0 55.7
Capital increase of non-controlling interests 77.6 - -
Share premium 8.3 - -
Proceeds from borrowings 1,056.3 1,291.6 6,502.8
Proceeds/(repurchase) of treasury shares 16.7 34.5 (600.6)
Repayment of borrowings (1,252.7) (3,779.7) (6,545.4)
Cash net finance costs other than interests 23.3 7.8 (605.7)
Payment of finance lease liabilities (6.7) (7.7) (10.8)
Dividends paid (5,030.8) (3,560.5) (2,801.8)
Cash flow used in financing activities (4,861.6) (5,929.0) (4,005.8)
Net increase/(decrease) in cash and cash equivalents 2,027.0 1,216.3 812.7
Cash and cash equivalents less bank overdrafts at beginning of year 4,024.3 3,280.0 2,240.9
Effect of exchange rate fluctuations (143.0) (472.0) 226.5
Cash and cash equivalents less bank overdrafts at end of year 5,908.3 4,024.3 3,280.0
The accompanying notes are an integral part of the consolidated financial statements.
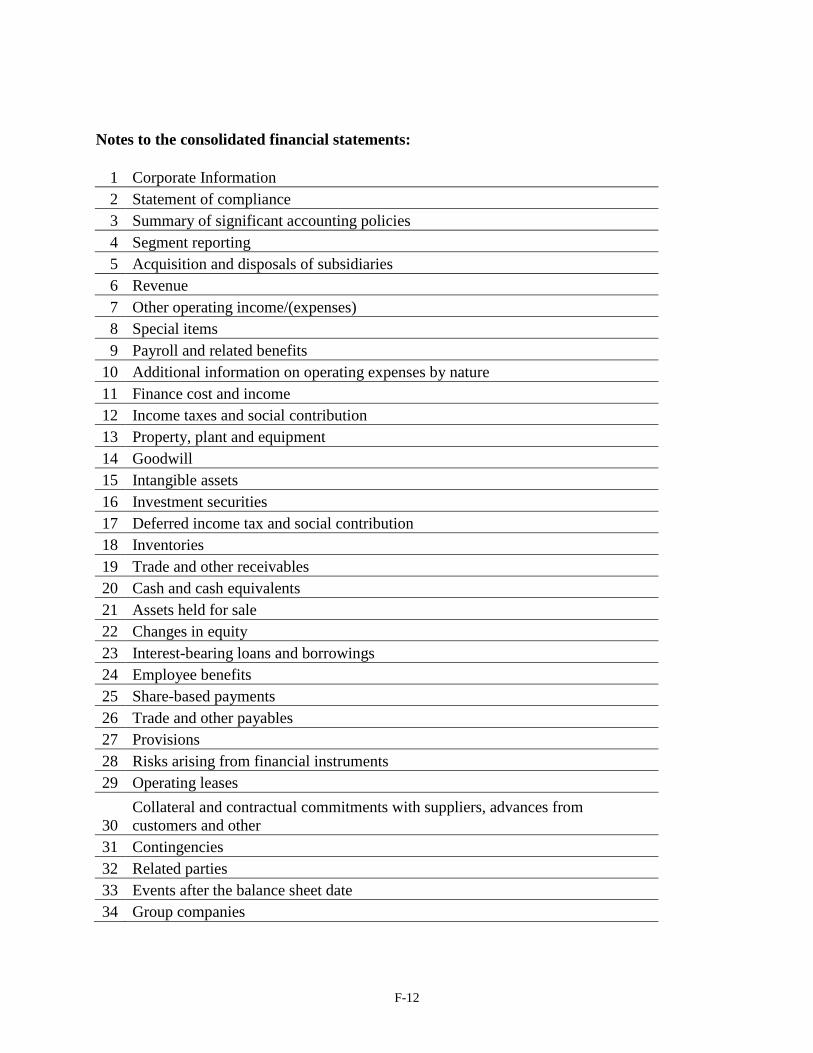
F-12
Notes to the consolidated financial statements:
1 Corporate Information
2 Statement of compliance
3 Summary of significant accounting policies
4 Segment reporting
5 Acquisition and disposals of subsidiaries
6 Revenue
7 Other operating income/(expenses)
8 Special items
9 Payroll and related benefits
10 Additional information on operating expenses by nature
11 Finance cost and income
12 Income taxes and social contribution
13 Property, plant and equipment
14 Goodwill
15 Intangible assets
16 Investment securities
17 Deferred income tax and social contribution
18 Inventories
19 Trade and other receivables
20 Cash and cash equivalents
21 Assets held for sale
22 Changes in equity
23 Interest-bearing loans and borrowings
24 Employee benefits
25 Share-based payments
26 Trade and other payables
27 Provisions
28 Risks arising from financial instruments
29 Operating leases
30
Collateral and contractual commitments with suppliers, advances from
customers and other
31 Contingencies
32 Related parties
33 Events after the balance sheet date
34 Group companies
F-13
1. CORPORATE INFORMATION
Companhia de Bebidas das Américas - AmBev (referred to as ―we‖, the ―Company‖ or
―Ambev‖), headquartered in São Paulo, Brazil produces and sells beer, draft beer, soft drinks,
other non-alcoholic beverages and malt, either directly or by participating in other Brazilian
domiciled companies and elsewhere in the Americas.
The Company maintains an agreement with PepsiCo International, Inc. (―PepsiCo‖) to bottle,
sell and distribute Pepsi products in Brazil and in other Latin American countries, including
Pepsi Cola, 7Up, Lipton Ice Tea, Gatorade and H2OH!.
The Company maintains a licensing agreement with Anheuser-Busch, Inc., through its subsidiary
Labatt Brewing Company Limited (―Labatt Canada‖) and Cervecería Paraguay (―Cervepar‖), to
produce, bottle, sell and distribute Budweiser products in Canada and Paraguay. In addition, the
Company and certain of its subsidiaries produce and distribute Stella Artois under license to
Anheuser-Busch InBev S.A./N.V. (―AB InBev‖) in Brazil, Argentina, Canada, and other
countries and, by means of a license granted to AB InBev, it distributes its Brahma product in
certain countries of Europe, Asia and Africa.
The Company’s shares are traded on the Brazilian Stock Exchange – BM&FBOVESPA and on
the New York Stock Exchange – NYSE, as American Depositary Receipts - ADRs.
Main corporate event in 2010:
On October 20, 2010, Ambev and Cerveceria Regional S.A. (―Cerveceria Regional‖) executed a
transaction pursuant to which they combined their businesses in Venezuela, whereupon
Cerveceria Regional assumed an 85% interest and Ambev the remaining 15% which may be
increased to 20% over the next four years.
The measurement at fair value of the retained interest, as prescribed by Amended IAS 27
Consolidated and separate financial statements, led to the recognition of an impairment loss of
R$49.6.
The consolidated financial statements were approved by the Board of Directors on February 28,
2011.
2. STATEMENT OF COMPLIANCE
The consolidated financial statements have been prepared in accordance with International
Financial Reporting Standards (―IFRS‖) as issued by the International Accounting Standards
Board (―IASB‖).
F-14
3. SUMMARY OF SIGNIFICANT ACCOUNTING POLICIES
(a) Basis of preparation and measurement
The consolidated financial statements were prepared in accordance with IFRS standards and the
interpretations of the International Financial Reporting Interpretations Committee (―IFRIC‖) that
were in force on December 31, 2010.
The consolidated financial statements are presented in millions of Brazilian Reais (R$), rounded
to the nearest million indicated. Depending on the applicable IFRS requirement, the
measurement basis used in preparing the financial statements is cost, net realizable value, fair
value or recoverable amount. Whenever IFRS provides an option between cost and another
measurement basis (e.g., systematic re-measurement), the cost approach is applied.
The preparation of financial statements in conformity with IFRS requires management to make
judgments, estimates and assumptions that affect the application of policies and reported
amounts of assets and liabilities, income and expenses. The estimates and associated assumptions
are based on historical experience and various other factors that are believed to be reasonable
under the circumstances, the results of which form the basis of making the judgments about
carrying values of assets and liabilities that are not readily evident from other sources. Actual
results may differ from these estimates.
The estimates and underlying assumptions are reviewed on an ongoing basis. Revisions to
accounting estimates are recognized in the period in which the estimate is revised if the revision
affects only that period or current and future periods if the revision affects such periods.
The Company believes that the following accounting policies reflect management´s most critical
judgments, estimates and assumptions that are important to its business operations and the
understanding of its results: business combinations, intangible assets, goodwill, impairment,
provisions, share-based payments, employee benefits and accounting for current and deferred
tax.
The fair value of acquired identifiable intangibles is based on an assessment of future cash flows.
Impairment analyses of goodwill and indefinite-lived intangible assets are performed annually
and whenever a triggering event has occurred, in order to determine whether the carrying value
exceeds the recoverable amount. These calculations are based on estimates of future cash flows.
Management selects a variety of methods including the discounted cash flow method and option
valuation models and make assumptions about the fair value of financial instruments that are
mainly based on market conditions at each balance sheet date.
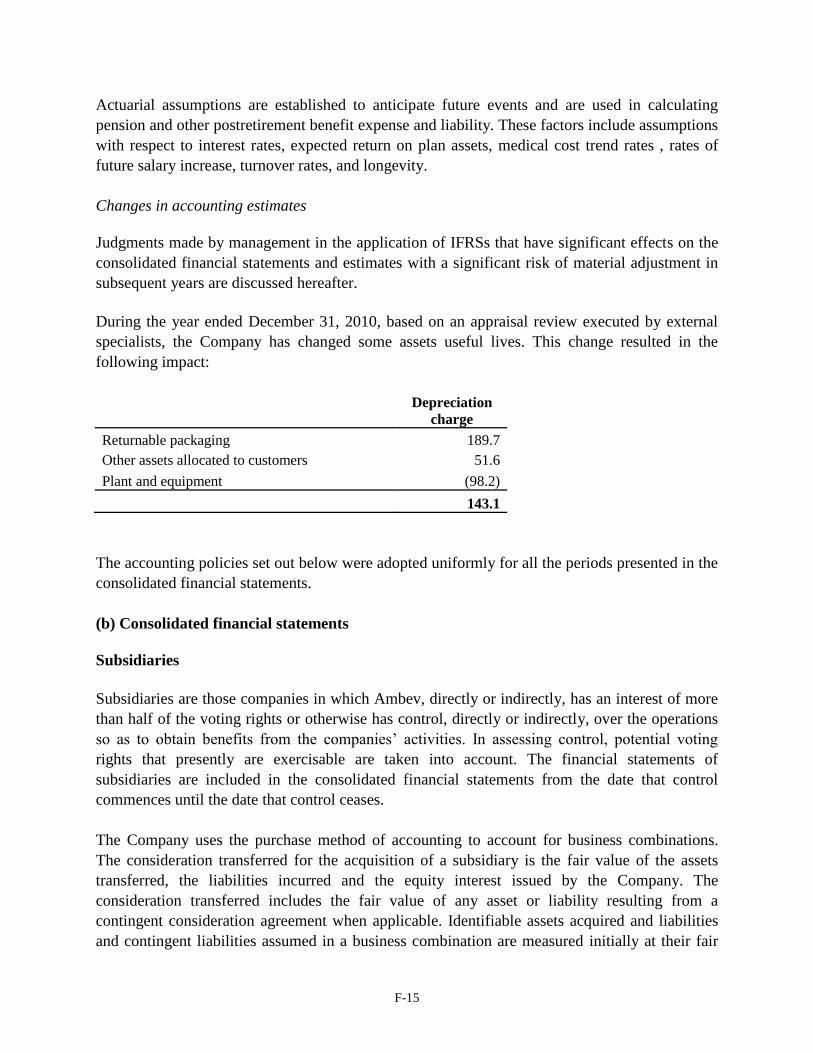
F-15
Actuarial assumptions are established to anticipate future events and are used in calculating
pension and other postretirement benefit expense and liability. These factors include assumptions
with respect to interest rates, expected return on plan assets, medical cost trend rates , rates of
future salary increase, turnover rates, and longevity.
Changes in accounting estimates
Judgments made by management in the application of IFRSs that have significant effects on the
consolidated financial statements and estimates with a significant risk of material adjustment in
subsequent years are discussed hereafter.
During the year ended December 31, 2010, based on an appraisal review executed by external
specialists, the Company has changed some assets useful lives. This change resulted in the
following impact:
Depreciation
charge
Returnable packaging 189.7
Other assets allocated to customers 51.6
Plant and equipment (98.2)
143.1
The accounting policies set out below were adopted uniformly for all the periods presented in the
consolidated financial statements.
(b) Consolidated financial statements
Subsidiaries
Subsidiaries are those companies in which Ambev, directly or indirectly, has an interest of more
than half of the voting rights or otherwise has control, directly or indirectly, over the operations
so as to obtain benefits from the companies’ activities. In assessing control, potential voting
rights that presently are exercisable are taken into account. The financial statements of
subsidiaries are included in the consolidated financial statements from the date that control
commences until the date that control ceases.
The Company uses the purchase method of accounting to account for business combinations.
The consideration transferred for the acquisition of a subsidiary is the fair value of the assets
transferred, the liabilities incurred and the equity interest issued by the Company. The
consideration transferred includes the fair value of any asset or liability resulting from a
contingent consideration agreement when applicable. Identifiable assets acquired and liabilities
and contingent liabilities assumed in a business combination are measured initially at their fair
F-16
values at the acquisition date. The Company recognizes the non-controlling interest in the
acquiree, either at fair value or at the non-controlling interest’s proportionate share of the net
assets acquired. The measurement of non-controlling interest to be recognized is determined for
each acquisition.
The excess of the consideration transferred and the fair value at the date of acquisition of
previous equity interest in the acquiree over the fair value of the Company’s share of the
identifiable net assets acquired is recorded as goodwill. In acquisitions where the Company
assigns fair value to the non-controlling interest, the goodwill calculation also includes the value
of any non-controlling interest in the acquiree, and the goodwill is determined by considering the
participation of the Company and non-controlling interests. When the consideration transferred is
less than the fair value of net assets of the subsidiary acquired, the difference is recognized
directly in income
Intercompany transactions, balances and unrealized gains on transactions between Ambev’s
companies are eliminated. Unrealized losses are also eliminated. Accounting policies of
subsidiaries have been conformed where necessary to ensure consistency with the policies
adopted by the Company.
Associates
Associates are those entities in which the Company has significant influence over the financial
and operating policies but which it does not control. This is generally evidenced by ownership of
between 20% and 50% of the voting rights.
Jointly-controlled entities
Jointly-controlled entities are consolidated using the proportionate method. The Company
consolidates the assets, the liabilities and the income of Agrega Inteligência em Compras Ltda.
(―Agrega‖) and Ice Tea do Brasil Ltda. (―ITB‖), as well as two distribution entities in Canada,
Brewers Retails Inc. and Brewers’ Distributor Ltd. in proportion to its participation in these
companies.
Consolidation process
The financial statements of our subsidiaries, jointly-controlled entities and associates are
prepared for the same reporting period as the parent company, using consistent accounting
policies.
Associates are accounted for using the equity method of accounting, from the date that
significant influence commences until the date that significant influence ceases. When Ambev’s
share of losses exceeds the carrying amount of the associate, the carrying amount of the
investment is reduced to nil.
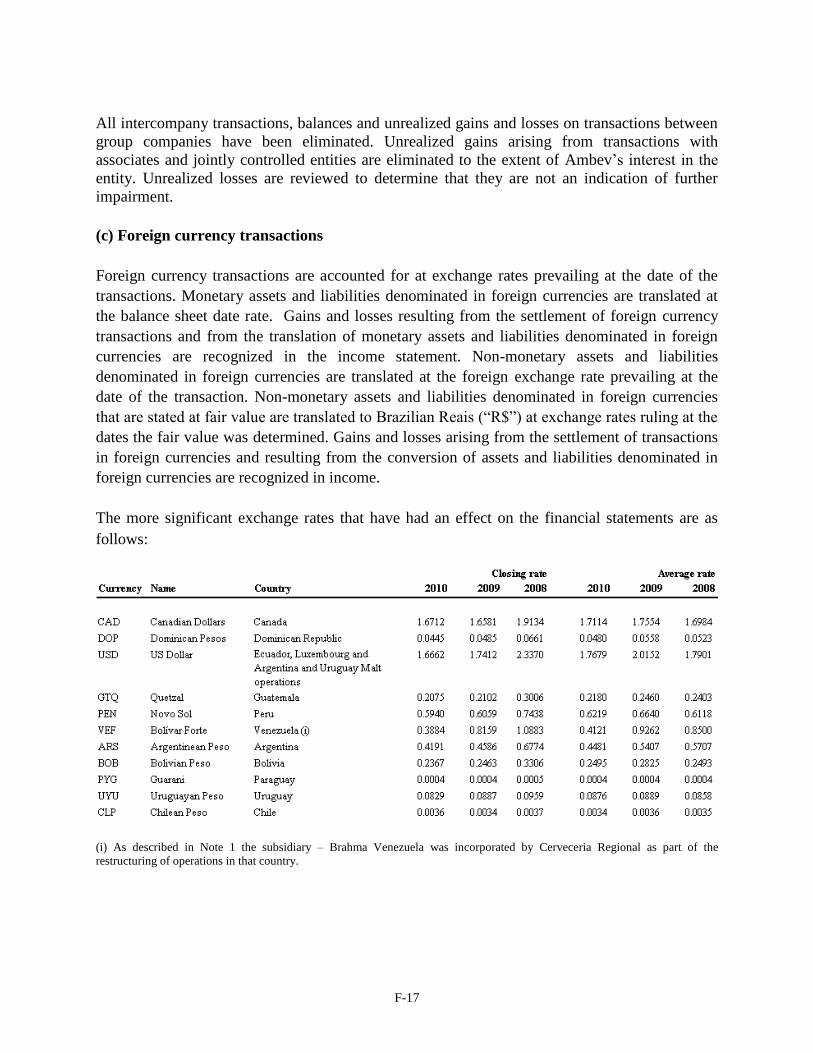
F-17
All intercompany transactions, balances and unrealized gains and losses on transactions between
group companies have been eliminated. Unrealized gains arising from transactions with
associates and jointly controlled entities are eliminated to the extent of Ambev’s interest in the
entity. Unrealized losses are reviewed to determine that they are not an indication of further
impairment.
(c) Foreign currency transactions
Foreign currency transactions are accounted for at exchange rates prevailing at the date of the
transactions. Monetary assets and liabilities denominated in foreign currencies are translated at
the balance sheet date rate. Gains and losses resulting from the settlement of foreign currency
transactions and from the translation of monetary assets and liabilities denominated in foreign
currencies are recognized in the income statement. Non-monetary assets and liabilities
denominated in foreign currencies are translated at the foreign exchange rate prevailing at the
date of the transaction. Non-monetary assets and liabilities denominated in foreign currencies
that are stated at fair value are translated to Brazilian Reais (―R$‖) at exchange rates ruling at the
dates the fair value was determined. Gains and losses arising from the settlement of transactions
in foreign currencies and resulting from the conversion of assets and liabilities denominated in
foreign currencies are recognized in income.
The more significant exchange rates that have had an effect on the financial statements are as
follows:
(i) As described in Note 1 the subsidiary – Brahma Venezuela was incorporated by Cerveceria Regional as part of the
restructuring of operations in that country.
F-18
(d) Conversion of the financial statements of subsidiaries located abroad
The transactions of each subsidiary are measured using the currency of the primary economic
environment in which the Company operates ("functional currency").
The functional currencies of most subsidiaries are their respective local currencies, since
business transactions are effected in these currencies, except for subsidiaries located in Ecuador
as well as the malt operations in Argentina and Uruguay, for which the functional currency is the
U.S. dollar, since this is the currency of the primary economic environment affecting these
entities.
The income statement and cash flows for these subsidiaries are translated at average exchange
rates for the period and the changes in equity are translated at the historical exchange rates of
each transaction. The translation adjustments arising from the difference between the average
exchange rates and the historical rates are recorded directly in Comprehensive income.
Transactions and balances
The foreign exchange gains and losses related to loans and cash and cash equivalents are
presented in the income statement as finance cost or finance income.
Changes in fair value of securities in foreign currency which are classified as available for sale
are separated from the exchange rate changes related to the amortized cost of the security and
other changes in the carrying value. The exchange rate changes in amortized cost are recognized
in income whereas other changes in carrying value of the security are recognized in equity.
The foreign exchange effects on assets and liabilities are recognized in the income statement as
part of the fair value gain or loss. The exchange rate effects on non-monetary financial assets
such as investments in shares which are classified as available for sale are included in the
available for sale reserve in equity.
On consolidation, exchange differences arising from translation of net investments in foreign
operations and borrowings and other currency instruments designated as net investment hedges
are recognized in Other comprehensive income.
Goodwill and fair value adjustments arising from the acquisition of a foreign entity are treated as
assets and liabilities of the foreign entity and translated at the closing rate (unless otherwise
stated - Note 3 (g)).
Functional and disclosure currency
F-19
The functional and presentation currency of the financial statements of the Company is the
Brazilian Real.
(e) Hyperinflationary economies
In hyperinflationary economies, the local currency-denominated non-monetary assets, liabilities,
income statement accounts as well as equity accounts are re-measured by applying a general
price index. The financial statements adjusted for inflation are then translated into the
presentation currency at the closing rate.
As of November 30, 2009, Venezuela was assessed to be a highly inflationary economy and the
Company has price-level restated the accounts based on the price index announced by
Venezuela's central bank for the period from December 2009 to October 20, 2010, when the
Venezuelan operations were deconsolidated, following the transaction between Ambev and
Cerveceria Regional (Note 1).
(f) Intangible assets
Market assets from former dealers
The distribution assets are acquired from former dealers and correspond substantially to rights
contracts with the points of sale and supply of master data information to the Company of such
points sale, including financial history and purchase profile.
Brands
In those cases in which part of the consideration paid in a business combination is related to
brands, these are recognized as Intangible assets and measured at fair value. When those brands
have indefinite useful lives they are stated at their cost less accumulated impairment losses.
Brands are tested annually to identify possible evidence of impairment.
In-house expenditures for developing a brand are recognized as expenses.
Other intangible assets
Other intangible assets are stated at cost less accumulated amortization and impairment losses.
Subsequent expenditures
Subsequent expenditures are capitalized only when they increase the future economic benefits of
an already recognized intangible asset. All other expenditures are recognized as expenses when
incurred.
Amortization
F-20
Intangible assets with finite useful lives are amortized based on the straight-line method over
their estimated useful lives. Brands are deemed intangible assets with indefinite useful lives and,
therefore, are not amortized but tested for impairment annually (refer to item (n) below).
(g) Goodwill
Goodwill arises on the acquisition of subsidiaries, associates and jointly-controlled entities.
Acquisitions prior to January 1, 2005
As part of its transition to IFRS, the Company elected to apply IFRS 3 Business Combinations
only to those business combinations that occurred on or after January 1, 2005. In respect of
acquisitions prior to January 1, 2005, goodwill was determined under the Company’s accounting
policies adopted during those periods (the ―prior Brazilian GAAP‖).
Acquisitions on or after January 1, 2005
For acquisitions on or after January 1, 2005, goodwill represents the excess of the purchase
consideration of the acquisition over the Company’s interest in the net fair value of the
identifiable assets acquired and liabilities and contingent liabilities assumed of the acquiree. In
the event an advantageous premium in acquisition (negative goodwill) is determined, it is
recognized immediately in Income Statement.
This election was in connection with the IFRS 1 First-time adoption exemptions, used in the
implementation of IFRS for the financial statements of December 31, 2008.
In conformity with IFRS 3 Business Combinations, goodwill is carried at cost and is not
amortized but tested for impairment annually and whenever there is an indicator that the cash
generating unit to which the goodwill has been allocated may be impaired.
Goodwill is expressed in the currency of the subsidiary or jointly-controlled entity to which it
relates and is translated to Reais using the year-end exchange rate, except for the acquisitions
prior to January 1, 2005 for which the Company treated them as their assets, in Reais.
Goodwill determined upon the acquisition of an associate is included in the carrying amount of
the investment in the associate.
Expenditure on internally generated goodwill is expensed as incurred.
h) Property, plant and equipment
F-21
Property, plant and equipment are measured at cost less accumulated depreciation and
impairment losses. The cost includes the purchase price, borrowing cost incurred during the
construction period and any other costs directly attributable to bringing the asset to the location
and condition necessary for it to be capable of operating in the manner intended by management
(e.g. non refundable tax, transport and the costs of dismantling and removal and site restoration,
if applicable). The cost of a self-constructed asset is determined using the same principles as for
an acquired asset.
Subsequent expenditures
The Company recognizes in the carrying amount of an item of property, plant and equipment the
cost of replacing part of such an item if it is probable that the future economic benefits embodied
with the item will flow to the Company and the cost of the item can be measured reliably. All
other costs are expensed as incurred.
Depreciation
The depreciable amount is the cost of an asset less its residual value. Residual values, if not
insignificant, are reassessed annually. Depreciation is calculated from the date the asset is
available for use, using the straight-line method over the estimated useful lives of the assets.
The estimated useful lives are as follows:
Buildings 25 years
Plant and equipment 15 years
Fixtures and fittings 10 years
External use assets 2 - 5 years
The assets’ residual value and useful lives are reviewed, and adjusted if appropriate, annually.
During the year ended at December, 31 2010 the Company modified its estimate of the economic
useful lives of certain assets (Note 3(a)).
Land is not depreciated since it is deemed to have an indefinite life.
(i) Accounting for operating and finance leases
Leases of property, plant and equipment where the Company assumes substantially all the risks
and rewards of ownership are classified as finance leases. Finance leases are recognized as assets
and liabilities (interest-bearing loans and borrowings) at amounts equal to the lower of the fair
value of the leased property and the present value of the minimum lease payments at inception of
the lease. Depreciation and impairment testing for depreciable leased assets are the same as for
depreciable assets that are Company-owned.
F-22
Lease payments are apportioned between the outstanding liability and finance charges so as to
achieve a constant periodic rate of interest on the remaining balance of the liability.
Leases of assets under which all the risks and rewards of ownership are substantially retained by
the lessor are classified as operating leases. Payments made under operating leases are charged to
the income statement on a straight-line basis over the term of the lease.
When an operating lease is terminated before the lease period has expired, any payment required
to be made to the lessor by way of penalty is recognized as an expense in the period in which
termination takes place.
(j) Investments
All investments are accounted for at trade date.
Investments in equity securities
Investments in equity securities are undertakings in which Ambev does not have significant
influence or control. This is generally evidenced by ownership of less than 20% of the voting
rights. Such investments are designated as available-for-sale financial assets which are at initial
recognition measured at fair value unless the fair value cannot be reliably determined in which
case they are measured at cost. Subsequent changes in fair value are recognized directly in
Comprehensive income, except those related to impairment losses which are recognized in the
income statement.
On disposal of an investment, the cumulative gain or loss previously recognized directly in
equity is recognized in profit or loss.
Investments in debt securities
Investments in debt securities classified as trading or as being available-for-sale are carried at
fair value, with any resulting gain or loss recognized in the income statement or directly in
Comprehensive income, respectively. Fair value of these investments is determined based on the
quoted bid price at the balance sheet date. Impairment charges and foreign exchange gains and
losses are recognized in the income statement. Investments in debt securities classified as held to
maturity are measured at amortized cost.
In general, investments in debt securities with original maturities of greater than three months
and remaining maturities of less than one year are classified as short-term investments.
Investments with maturities beyond one year may be classified as short-term based on
Management's intent and ability to withdraw them within less than one year and, considering
their highly liquid nature and because they represent cash available to fund current operations.
F-23
Other investments
Other investments held by the Company are classified as available-for-sale and are carried at fair
value, with any resulting gain or loss recognized directly in Other comprehensive income.
Impairment charges are recognized in the income statement.
(k) Inventories
Inventories are valued at the lower of cost and net realizable value. Cost includes expenditure
incurred in acquiring the inventories and bringing them to their existing location and condition.
The weighted average method is used in assigning the cost of inventories.
The cost of finished products and work in progress comprises raw materials, other production
materials, direct labor, gains and losses with derivatives financial instruments, other direct cost
and an allocation of fixed and variable overhead based on normal operating capacity. Net
realizable value is the estimated selling price in the ordinary course of business, less the cost for
bringing inventories to sales conditions and selling costs.
(l) Trade and other receivables
Trade and other receivables are carried at amortized cost less impairment losses. An estimate is
made for doubtful receivables based on a review of all outstanding amounts at the balance sheet
date. An impairment loss is recorded for an amount considered sufficient by management to
cover probable losses upon the realization of receivables. Historically, the Company has not
experience significant losses in Trade receivables.
(m) Cash and cash equivalents
Cash and cash equivalents include all cash balances and short-term highly liquid investments
with a maturity of three months or less with insignificant risk of changes in value.
(n) Impairment of assets
The carrying amounts of financial assets, property, plant and equipment, goodwill and intangible
assets are reviewed at each balance sheet date to determine whether there is any indication of
impairment. If any such indication exists, the asset’s recoverable amount is estimated. In
addition, goodwill, intangible assets that are not yet available for use and intangibles with an
indefinite life are tested for impairment annually or when there is any indication of impairment.
An impairment loss is recognized whenever the carrying amount of an asset or the related cash-
generating unit exceeds its recoverable amount. Impairment losses are recognized in the income
statement.
F-24
Calculation of recoverable amount
The recoverable amount of the Company’s investments in unquoted debt securities is calculated
as the present value of expected future cash flows, discounted at the debt securities’ original
effective interest rate. For equity and quoted debt securities the recoverable amount is their fair
value.
The recoverable amount of other assets is determined as the higher of their fair value less costs to
sell and value in use. For an asset that does not generate largely independent cash inflows, the
recoverable amount is determined for the cash-generating unit to which the asset belongs. In
assessing value in use, the estimated future cash flows are discounted to their present value using
a discount rate that reflects current market assessments of the time value of money and the risks
specific to the asset. Impairment losses recognized in respect of cash-generating units are
allocated first to reduce the carrying amount of any goodwill allocated to the units and then to
reduce the carrying amount of the other assets in the unit on a pro rata basis.
Goodwill and intangible assets with indefinite useful life are tested annually at the business unit
level (that is one level below the segments). The recoverable amount of the cash generating units
to which the goodwill and the intangible assets with indefinite useful life belong is based on a
fair value approach. More specifically, a discounted free cash flow approach, based on current
acquisition valuation models, is used. These calculations are corroborated by valuation multiples,
quoted share prices for publicly traded subsidiaries or other available fair value indicators.
Whenever there is an indication of impairment, intangible assets with an indefinite useful life are
tested on a fair value approach applying multiples that reflect current market transactions to
indicators that drive the profitability of the asset or the royalty stream that could be obtained
from licensing the intangible asset to another party in an arm’s length transaction.
Reversal of impairment losses
An impairment loss in respect of goodwill or investments in equity securities is not reversed.
Impairment losses on other assets are reversed if the subsequent increase in their recoverable
amount is related to specific events occurring after the impairment testing. Impairment losses are
reversed only to the extent that the asset’s carrying amount does not exceed the carrying amount
that would have been determined, net of depreciation or amortization, if no impairment loss had
been recognized.
(o) Assets held for sale
Ambev classifies an asset as held for sale if its carrying amount will be recovered principally
through a sale transaction rather than through continuing use. Immediately before classification
as held for sale, these assets are measured based on the lower between the carrying amount and
the fair value less cost to sell. Impairment losses on initial classification as held for sale are
included in profit or loss. The same applies to gains and losses on subsequent re-measurement.
F-25
Management is committed to selling the asset and has structured a program to locate a purchaser
for sale at a reasonable price when compared to current fair values.
Assets classified as held for sale are not depreciated or amortized.
(p) Present value of assets and liabilities
Monetary long term assets and liabilities are adjusted to present value. The present value
adjustment of current assets and liabilities is only calculated and recorded if the adjustment is
considered significant to the financial statements taken as a whole. For purposes of determining
the significance test, the present value is calculated taking into account the contractual cash
flows and interest rate applicable to the related assets and liabilities.
Loans obtained at below market rates to finance sales taxes (Note 3 (y)) are discounted to
present value pursuant to International Accounting Standard (―IAS‖) No. 20. The initial
adjustment is recorded in Other operating income, similar to other as subsidies (Note 7). The
discounted balance is accreted to Financial results.
(q) Equity
Common and Preferred shares are classified as equity.
Incremental costs directly attributable to the issue of new Common shares or options are shown
in equity as a deduction, net of tax.
Repurchase of shares capital
When Ambev buys back its own shares for treasury the amount paid, including any additional
costs directly attributable (net of income tax) is deducted from equity attributable to shareholders
until the shares are retired or reissued. If such shares are subsequently reissued, any
consideration received, net of additional costs of the transaction, including taxes, are included in
equity attributable to shareholders of the Company.
Dividends
Dividends are recorded in liabilities in the period in which they are declared, except the unpaid
portion relating to the statutory mandatory dividend which is recorded at the end of each fiscal
year, in accordance with applicable law.
Brazilian companies are permitted to pay limited amounts of interest attributable to capital to
shareholders and treat such payments as an expense for Brazilian income and social contribution
tax purposes. This notional interest distribution is treated for accounting purposes as a deduction
from shareholders' equity in a manner similar to a dividend. The benefit from the tax deductible
interest on own equity is recognized in income.
F-26
Goodwill reserve
The Company records the benefit arising from the tax deductible amortization of goodwill, in a
special equity reserve, and therefore as an equity instrument pursuant to IAS 32, since there is no
commitment and / or obligation of the controlling shareholders to subscribe shares
This presentation is consistent with Brazilian Securities Commission (―CVM‖) Instruction No.
319/99. Under the Memorandum of Justification of July 7, 2005, upon realizing the tax benefit
arising from the tax deductible amortization of goodwill, the Company will issue to the
controlling shareholders, AmBrew S/A (―AmBrew‖) and Interbrew International BV
("Interbrew"), shares representing 70% of the benefit and the remaining 30% to the benefit of all
other shareholders.
(r) Provisions
Provisions are recognized when: (i) the Company has a present legal or constructive obligation
as a result of past events; (ii) it is likely that a future disbursement will be required to settle the
current obligation; and (iii) a reliable estimate of the amount of the obligation can be made.
Restructuring
A provision for restructuring is recognized when the Company has approved a detailed
restructuring plan, and the restructuring has either commenced or has been announced. Costs
relating to the ongoing and future activities of the Company are not provided for. The provision
includes the benefit commitments in connection with early retirement and redundancy schemes.
(s) Employee benefits
Post-employment benefits include pensions managed in Brazil by Instituto Ambev de
Previdência Privada – IAPP, post-employment dental benefits and post-employment medical
benefits managed by Fundação Zerrenner (formerly Fundação Antônio e Helena Zerrener
Instituição Nacional de Beneficência - FAHZ). Usually, pension plans are funded by payments
made by both the Company and its employees, taking into account the recommendations of
independent actuaries. Post-employment dental benefits and post-employment medical benefits
are maintained by the return on Fundação Zerrener’s plan assets. If necessary, the Company may
contribute some of its profit to the Fundação Zerrener.
The Company manages defined benefit and defined contribution plans for employees of its
companies located in Brazil and in its subsidiaries located in Canada, Dominican Republic,
Argentina and Bolivia.
Ambev maintains funded and unfunded plans.
F-27
Defined contribution plans
Payments to defined contribution plans are recognized as an expense in the income statement
when incurred. A defined contribution plan is a pension plan under which Ambev pays fixed
contributions into a fund. Ambev has no legal or constructive obligations to pay further
contributions if the fund does not hold sufficient assets to pay all employees for the benefits
relating to employee service in the current and prior periods.
Defined benefit plans
For defined benefit plans, expenses are assessed separately for each plan using the projected unit
credit method. The projected unit credit method takes into account each period of service as
giving rise to an additional unit of benefit to measure each unit separately. Under this method,
the cost of providing pensions is charged to the income statement during the period of service of
the employee. The amounts charged to the income statement consist of current service cost,
interest cost, the expected return of the plan assets, past service costs and the effect of any
settlements and curtailments. The obligations of the plan recognized in the balance sheet are
measured at the present value of the estimated future cash outflows using a discount rate
equivalent to the government´s bond rates with maturity terms similar to those of the obligation,
less any past service cost not recognized and the fair value of any plan assets. Past service costs
result from the introduction of a new plan or changes to an existing plan. They are recognized in
the income statement over the period the benefit vests. Actuarial gains and losses consist of the
effects of differences between the previous actuarial assumptions and what has actually occurred
and the effects of changes in actuarial assumptions. Actuarial gains and losses are fully
recognized in Other comprehensive income.
Ambev recognizes assets (prepaid expenses) of its defined benefit plans, to the extent of the
economic value of the benefit available to Ambev, from refunds or reductions in future
contributions.
Other post-employment obligations
The Company and its subsidiaries provide post-employment medical benefits, reimbursement of
expenses with drugs and other benefits to certain retirees through Fundação Zerrenner. These
benefits are not granted to new retirees. The expected costs of these benefits are recognized over
the period of employment, using an accounting methodology similar to that for defined benefit
plans.
Bonuses
Bonuses granted to employees and managers are based on financial performance indicators. The
estimated amount of the bonus is recognized as an expense in the period the bonus is earned. To
F-28
the extent that part of the bonus is settled in shares of the Company, these are accounted for as
share-based payments.
(t) Share-based payments
Share and share option programs allow management and members of the board to acquire shares
of the Company. Ambev adopted IFRS 2 Share-based Payment for all award programs granted
after November 7, 2002 that had not vested by January 1, 2007. The fair value of the share
options is estimated at grant date, using an option pricing model that is most appropriate for the
respective option. Based on the expected number of options that will be exercised, the fair value
of the options granted is recognized as an expense over the vesting period with a credit to equity.
When the options are exercised, equity is increased by the amount of the proceeds received.
(u) Interest-bearing loans and borrowings
Interest-bearing loans and borrowings are recognized initially at fair value less attributable
transaction costs. Subsequent to initial recognition, interest-bearing loans and borrowings are
stated at amortized cost with any difference between the initial and maturity amount being
recognized in the income statement over the expected life of the instrument on an effective
interest rate basis. The Company has interest-bearing loans and borrowings that have a hedge
structure is described in Note 28.
(v) Trade and other payables
Trade and other payables are recognized at amortized cost.
(w) Income tax and social contribution
Income tax and social contribution for the year comprises current tax and deferred tax. Income
tax and social contribution are recognized in the income statement, unless they relate to items
recognized directly in Other comprehensive income or equity. In these cases the tax effect is also
recognized directly in equity or Other comprehensive income (except interest on capital, see item
(q)).
Current tax is the expectation of payment on the taxable income for the year, using tax rates
enacted, or substantially enacted, at the balance sheet date, and any adjustment to tax payable in
respect of previous years.
Pursuant to IAS 12 Income Taxes, deferred taxes are recognized using the balance sheet/ liability
method. This means that, taking into account the IAS 12 requirements, a deferred tax liability or
asset is recognized for all taxable and tax deductible temporary differences between the tax and
accounting basis of assets and liabilities. Under this method, a provision for deferred taxes is also
calculated on the differences between the fair value of assets and liabilities acquired in a business
combination and their tax basis. IAS 12 prescribes that no deferred tax is recorded: (i) when
recognizing goodwill; (ii) at the initial recognition of assets or liabilities arising from a
F-29
transaction other than a business combination; and (iii) on differences related to investments in
subsidiaries to the extent that they are not reversed in the foreseeable future. The amount of
deferred tax provided is based on the expectation of the realization or settlement of the
temporary difference, using currently or substantively enacted tax rates.
Deferred tax assets and liabilities are offset if there is a legally enforceable right to offset current
tax liabilities and assets, and they relate to income taxes levied by the same tax authority on the
same taxable entity, or on different taxable entities which intend either to settle current tax
liabilities and assets on a net basis, or to realize the assets and settle the liabilities
simultaneously.
The deferred tax asset is recognized only to the extent that it is likely that future taxable profits
will be available. The deferred income tax asset is reduced to the extent that it is no longer
probable that the future taxable benefit will occur.
(x) Income recognition
Revenue comprises the fair value of the amount received or receivable upon selling products or
rendering services in the ordinary course of business. Revenue is presented net of taxes, returns,
rebates and discounts net of elimination of sales between group companies.
The Company recognizes revenue when the amount of revenue can be measured reliably, it is
probable that economic benefits associated with the transaction will flow to the Company and
specific criteria have been met for each of the Company's activities.
Goods sold
In relation to the sale of goods, revenue is recognized when the significant risks and rewards of
ownership have been transferred to the buyer, and no significant uncertainties remain regarding
recovery of the consideration due, associated costs or the possible return of goods, and there is
no continuing management involvement with the goods. Revenue from the sale of goods is
measured at the fair value of the consideration received or receivable, net of returns and
allowances, trade discounts, volume rebates and discounts for cash payments.
As part of its commercial policy, the Company provides unconditional discounts to its
customers, which are recorded as sales deductions.
Rental and royalty revenue
Rental revenue is recognized under Other operating income on a straight-line basis over the term
of the lease. Royalties are also recognized in Other operating income on an accrual basis.
Investment subsidy and government grants
F-30
The Company benefits from Brazilian state tax incentive programs to promote industrial
development including the deferral of payment of taxes or partial reductions of the tax payable.
These state programs are to promote long-term increases in employment and regional
development.
In these states, the tax reductions and other terms are foreseen in tax law. When conditions to
obtain these grants exist, they are under Company's control. The benefits for the reduction in the
payment of such taxes are recorded in the income statement, on an accrual basis at the time the
Company meets its obligations under the program.
Finance income
Finance income consists of interest received or receivable on funds invested, dividends received,
foreign exchange gains, losses on currency hedging instruments offsetting currency gains, gains
on hedging instruments that are not part of a hedge accounting relationship, gains on financial
assets classified as trading as well as any gains from hedge ineffectiveness.
Interest income is recognized on an accrual basis unless collectability is in doubt. Dividend
income is recognized in the income statement on the date that the dividend is declared.
(y) Expenses
Royalty expenses
Royalties paid to companies which do not form part of the consolidated financial statements are
recognized as cost of sales.
Finance costs
Finance costs comprise interest payable on borrowings, calculated using the effective interest
rate method, foreign exchange losses, gains on currency hedging instruments offsetting currency
losses, results on interest rate hedging instruments, losses on hedging instruments that are not
part of a hedge accounting relationship, losses on financial assets classified as trading,
impairment losses on available-for-sale financial assets as well as any losses from hedge
ineffectiveness.
All interest costs incurred in connection with borrowings or financial transactions are expensed
as incurred as part of finance costs, except when capitalized. The interest expense component of
finance lease payments is also recognized in the income statement using the effective interest
rate method.
Research and development, marketing and system development costs
F-31
Research, advertising and promotional costs are expensed in the year in which these costs are
incurred. Development costs and system development costs are expensed in the year in which
these costs are incurred, if they do not meet the criteria for capitalization.
(z) Special items
Special items are those that in management’s judgment need to be disclosed by virtue of their
size or incidence. In determining whether an event or transaction is special, management
considers quantitative as well as qualitative factors such as the frequency or predictability of
occurrence, and the potential for variation of impact on profit or loss. These items are disclosed
on the face of the consolidated income statement or separately disclosed in the notes to the
financial statements. Transactions which may give rise to special items are principally
restructuring activities, impairments, and gains or losses on disposal of assets and investments.
(aa) Financial assets
(i) Classification
The Company classifies its financial assets in the following categories: at fair value through
profit or loss, loans and receivables, available for sale and held to maturity. The classification
depends on the purpose for which the financial assets were acquired. Management determines
the classification of its financial assets at initial recognition.
(a) Financial assets at fair value through profit or loss
Financial assets at fair value through profit or loss are financial assets held for trading. A
financial asset is classified in this category if acquired principally for the purpose of being sold in
the short term. Derivatives are also categorized as held for trading unless they are designated as
hedges. Assets in this category are classified as current assets.
(b) Loans and receivables
Loans and receivables are non-derivative financial assets with fixed or determinable payments
that are not quoted in an active market. They are included in current assets, except for maturities
greater than 12 months after the end of the reporting period, which are classified as non-current
assets.
(c) Available-for-sale financial assets
Available-for-sale financial assets are classified as non-current assets unless the investment
matures or management intends to dispose it within 12 months of the end of the reporting period.
(d) Assets held to maturity

F-32
Investments held to maturity are initially recognized at fair value plus any directly attributable
transaction costs. After initial recognition, investments held to maturity are measured at
amortized cost using the effective interest method, reduced by any loss on impairment.
F-33
(ii) Recognition and measurement
Purchases and sales of financial assets are recognized on the trade date - the date on which the
Company undertakes to buy or sell the asset. Financial assets measured at fair value through
profit and loss are initially recognized at fair value and transaction costs are charged to the
income statement. These financial assets are realized when the rights to receive cash flows from
investments have expired or have been transferred when the Company has transferred
substantially all risks and benefits of ownership. Financial assets are subsequently carried at fair
value. Loans and receivables are carried at amortized cost using the effective interest rate.
Gains or losses arising from changes in the fair value of ―Financial assets at fair value through
profit or loss‖ are presented in the income statement within Finance cost and income in the
period in which they arise.
Changes in the fair value of securities denominated in foreign currency classified as available for
sale are analyzed between translation differences resulting from changes in the amortized cost of
the security and other changes in the carrying amount of the security.
(iii) Impairment of financial assets
The Company assesses at the end of each reporting period whether there is objective evidence
that a financial asset or group of financial assets is impaired. A financial asset or a group of
financial assets is impaired and an impairment loss is recorded only if there is objective evidence
of impairment as a result of one or more events that occurred after the initial recognition of the
asset (―loss event‖) and that loss event (or events) has an impact on the estimated future cash
flows of the financial asset or group of financial assets that can be reliably estimated.
(bb) Derivative financial instruments
Ambev uses derivative financial instruments in order to mitigate against risks related to foreign
currency, interest rates and commodity prices. Ambev’s financial risk management policy does
not permit the use of derivative financial instruments for speculative purposes. Derivative
instruments that, although contracted for hedging purposes, do not meet all hedge accounting
criteria defined in IAS 39 Financial Instruments: Recognition and Measurement are recognized
at fair value in the income statement.
Derivative financial instruments are recognized initially at fair value. Fair value is the amount an
asset could be realized and a liability settled, between knowledgeable parties, in an arm’s length
transaction. The fair value of derivative financial instruments may be obtained from quoted
market prices or from pricing models that take into account current market rates.
Subsequent to initial recognition, derivative financial instruments are re-measured to their fair
value at the balance sheet date. Depending on whether cash flow or net investment hedge
F-34
accounting is applied or not, any gain or loss is either recognized directly in Other
comprehensive income or in the income statement.
Cash flow, fair value or net investment hedge accounting is applied to all hedges that qualify for
hedge accounting when the required hedge documentation is in place and when the hedge is
determined to be effective.
(i) Cash flow hedge accounting
When a derivative financial instrument hedges the variability in cash flows of a recognized asset
or liability, the foreign currency risk and the fluctuation of commodity prices associated with a
firm commitment or a highly probable forecasted transaction, the effective part of any resulting
gain or loss on the derivative financial instrument is recognized directly in Other comprehensive
income.
When the firm commitment in foreign currency or the forecasted transaction results in the
recognition of a non financial asset or a non financial liability, the cumulative gain or loss is
removed from Other comprehensive income and included in the initial measurement of the asset
or liability. When the hedge relates to financial assets or liabilities, the cumulative gain or loss
on the hedging instrument is reclassified from Other comprehensive income into the income
statement in the same period during which the hedged risk affects the income statement (e.g.
when the variable interest expense is recognized). The ineffective part of any gain or loss is
recognized immediately in the income statement.
When a hedging instrument or hedge relationship is terminated but the hedged transaction is still
expected to occur, the cumulative gain or loss (at that point) remains in equity and is reclassified
in accordance with the above policy when the hedged transaction occurs. If the hedged
transaction is no longer probable, the cumulative gain or loss recognized in Other comprehensive
income is recycled into the income statement immediately.
(ii) Net investment hedge accounting
Net investments hedge accounting, including currency hedging item which are recorded as part
of the net investment, are accounted for similarly to cash flow hedge. Gains or losses on the
hedging instrument relating to the effective portion of the hedge are recognized directly in Other
comprehensive income, while any gains or losses relating to the ineffective portion is recognized
in the income statement. On disposal of a foreign operation, the cumulative gains or losses
recognized directly in Other comprehensive income is transferred to the result (Note 28).
(iii) Fair value hedge accounting
When a derivative financial instrument hedges the variability in fair value of a recognized asset
or liability, any resulting gain or loss on the hedging instrument is recognized in the income
statement. The hedged item is also stated at fair value in respect of the risk being hedged, with
any gain or loss being recognized in the income statement.
F-35
(cc) Segment reporting
Under IFRS 8 Operating Segments reporting segments are identified based on internal reports
regularly reviewed by the chief operating decision maker of the Company for purposes of
evaluating the performance of each segment and allocating resources to those segments. Based
on the standard, the appropriate segment presentation has been determined to be geographically
based because the Company’s risks and rates of return are affected predominantly by its regional
business areas. The Company’s management structure and internal reporting system to the board
of directors reflect this basis.
Ambev operates its business through three zones identified as reportable segments:
▪ Latin America North, which includes (a) our operations in Brazil, where we operate two
sub business units: (i) Beer and (ii) Soft drinks; and (b) our Hispanic Latin America
Operations, Excluding Latin America South (―HILA-Ex‖), which includes our operations in
the Dominican Republic, Venezuela, Ecuador, Guatemala (which also serves El Salvador
and Nicaragua) and Peru. Financial data for Venezeuela was consolidated until October 20,
2010 when we combined our business with Cerveceria Regional;
▪ Latin America South, which includes our operations in Argentina, Bolivia, Paraguay,
Uruguay and Chile; and
▪ Canada, represented by Labatt’s operations, which includes domestic sales in Canada.
(dd) Summary of changes in accounting policies
The following new standards and amendments to standards are mandatory for the financial year
beginning 1 January 2010.
Revised IFRS 3 Business Combinations (2008)
Revised IFRS 3 Business Combinations (2008) incorporates the following changes that are likely
to be relevant to Ambev’s operations:
The definition of a business has been broadened, which is likely to result in more acquisitions
being treated as business combinations;
Contingent consideration will be measured at fair value, with subsequent changes therein
recognized in profit or loss;
Transaction costs, other than share and debt issue costs, will be expensed as incurred;
Any pre-existing interest in the acquire will be measured at fair value with the gain or loss
recognized in profit or loss;

F-36
Any non-controlling (minority) interest will be measured at either fair value, or at its
proportionate interest in the identifiable assets and liabilities of the acquire, on a transaction-by-
transaction basis.
The Company adopted the revised standard as of 1 January 2010 with no material effect on its
financial result or financial position.
Amended IAS 27 Consolidated and Separate Financial Statements (2008)
Amended IAS 27 Consolidated and Separate Financial Statements (2008) requires accounting for
changes in ownership interests in a subsidiary, while maintaining control, to be recognized as an
equity transaction. When a company loses control of a subsidiary, any interest retained in the
former subsidiary is measured at fair value with the gain or loss recognized in profit or loss.
The Company adopted the amendment as of 1 January 2010 with no material effect on its
financial result or financial position.
IFRIC 17 Distributions of Non-cash Assets to Owners
IFRIC 17 Distributions of Non-cash Assets to Owners addresses the treatment of distributions in
kind to shareholders. A liability is recognized when the dividend has been appropriately
authorized and is no longer at the discretion of the entity, to be measured at the fair value of the
non-cash assets to be distributed. Outside the scope of IFRIC 17 are distributions in which the
assets being distributed are ultimately controlled by the same party or parties before and after the
distribution (common control transactions).
The Company adopted the interpretation as of 1 January 2010 with no material effect on its
financial result or financial position.
IFRIC 18 Transfers of Assets from Customers
IFRIC 18 Transfers of Assets from Customers addresses the accounting by access providers for
property, plant and equipment contributed to them by customers. Recognition of the assets
depends on who controls them. When the asset is recognized by the access provider, it is
measured at fair value upon initial recognition. The timing of the recognition of the
corresponding revenue depends on the facts and circumstances.
The Company adopted the interpretation as of 1 January 2010 with no material effect on its
financial result or financial position.
Amendment to IAS 39 Financial Instruments: Recognition and Measurement – Eligible
Hedged Items
Amendment to IAS 39 Financial Instruments: Recognition and Measurement – Eligible Hedged
Items provides additional guidance concerning specific positions that qualify for hedging.
F-37
The Company adopted the amendment as of 1 January 2010 with no material effect on its
financial result or financial position.
(ee) Recently issued IFRS
To the extent that new IFRS requirements are expected to be applicable in the future, they have
been summarized hereafter. For the year ended 31 December 2010, they have not been applied
in preparing these consolidated financial statements.
Amendment to IAS 32 Financial Instruments: Presentation – Classification of Rights Issues
Amendment to IAS 32 Financial Instruments: Presentation – Classification of Rights Issues
allows rights, options or warrants to acquire a fixed number of the entity’s own equity
instruments for a fixed amount of any currency to be classified as equity instruments provided
the entity offers the rights, options or warrants pro rata to all of its existing owners of the same
class of its own non-derivative equity instruments.
IFRIC 19 Extinguishing Financial Liabilities with Equity Instruments
IFRIC 19 Extinguishing Financial Liabilities with Equity Instruments provides guidance on the
accounting for debt for equity swaps.
Revised IAS 24 Related Party Disclosures (2009)
Revised IAS 24 Related Party Disclosures amends the definition of a related party and modifies
certain related party disclosure requirements for government-related entities.
Amendments to IFRIC 14 IAS 19 The limit on a Defined Benefit Asset, Minimum Funding
Requirements and their Interaction
Amendments to IFRIC 14 IAS 19 The limit on a Defined Benefit Asset, Minimum Funding
Requirements and their Interaction removes unintended consequences arising from the treatment
of prepayments where there is a minimum funding requirement. These amendments result in
prepayments of contributions in certain circumstances being recognized as an asset rather than an
expense.
IFRS 9 Financial Instruments
IFRS 9 Financial Instruments is the standard issued as part of a wider project to replace IAS 39.
IFRS 9 retains but simplifies the mixed measurement model and establishes two primary
measurement categories for financial assets: amortized cost and fair value. The basis of
classification depends on the entity’s business model and the contractual cash flow
characteristics of the financial asset. The guidance in IAS 39 on impairment of financial assets
and hedge accounting continues to apply.
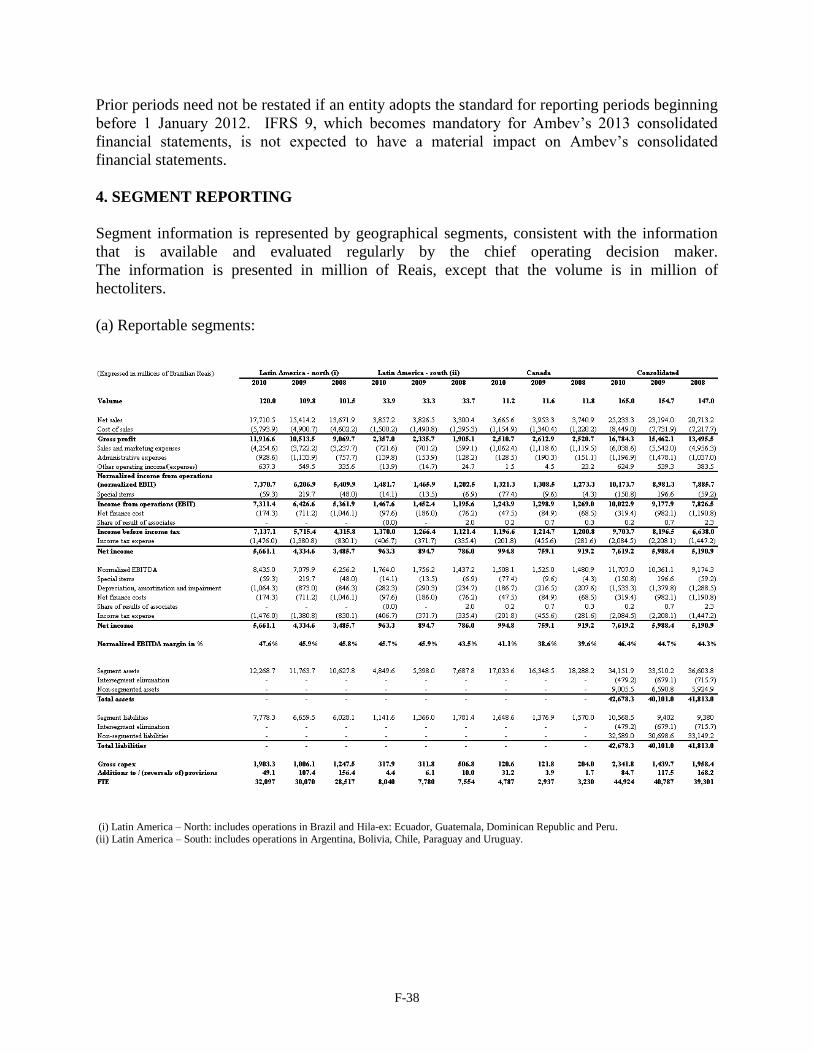
F-38
Prior periods need not be restated if an entity adopts the standard for reporting periods beginning
before 1 January 2012. IFRS 9, which becomes mandatory for Ambev’s 2013 consolidated
financial statements, is not expected to have a material impact on Ambev’s consolidated
financial statements.
4. SEGMENT REPORTING
Segment information is represented by geographical segments, consistent with the information
that is available and evaluated regularly by the chief operating decision maker.
The information is presented in million of Reais, except that the volume is in million of
hectoliters.
(a) Reportable segments:
(i) Latin America – North: includes operations in Brazil and Hila-ex: Ecuador, Guatemala, Dominican Republic and Peru.
(ii) Latin America – South: includes operations in Argentina, Bolivia, Chile, Paraguay and Uruguay.
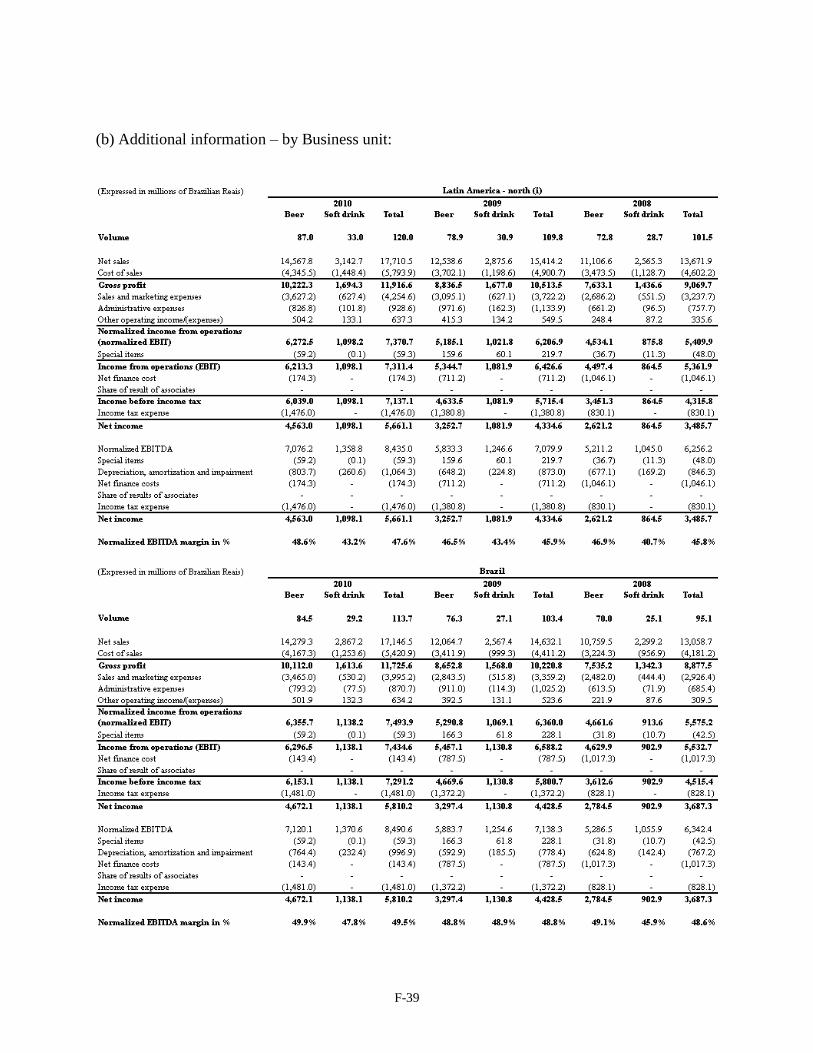
F-39
(b) Additional information – by Business unit:
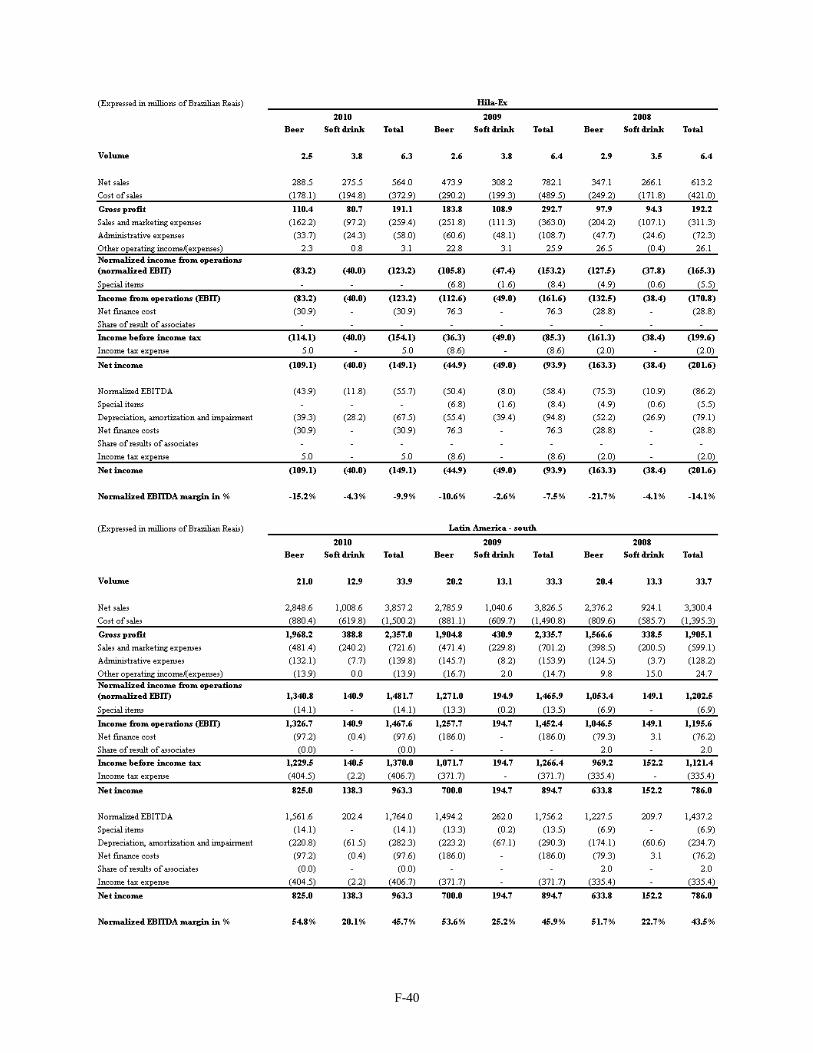
F-40
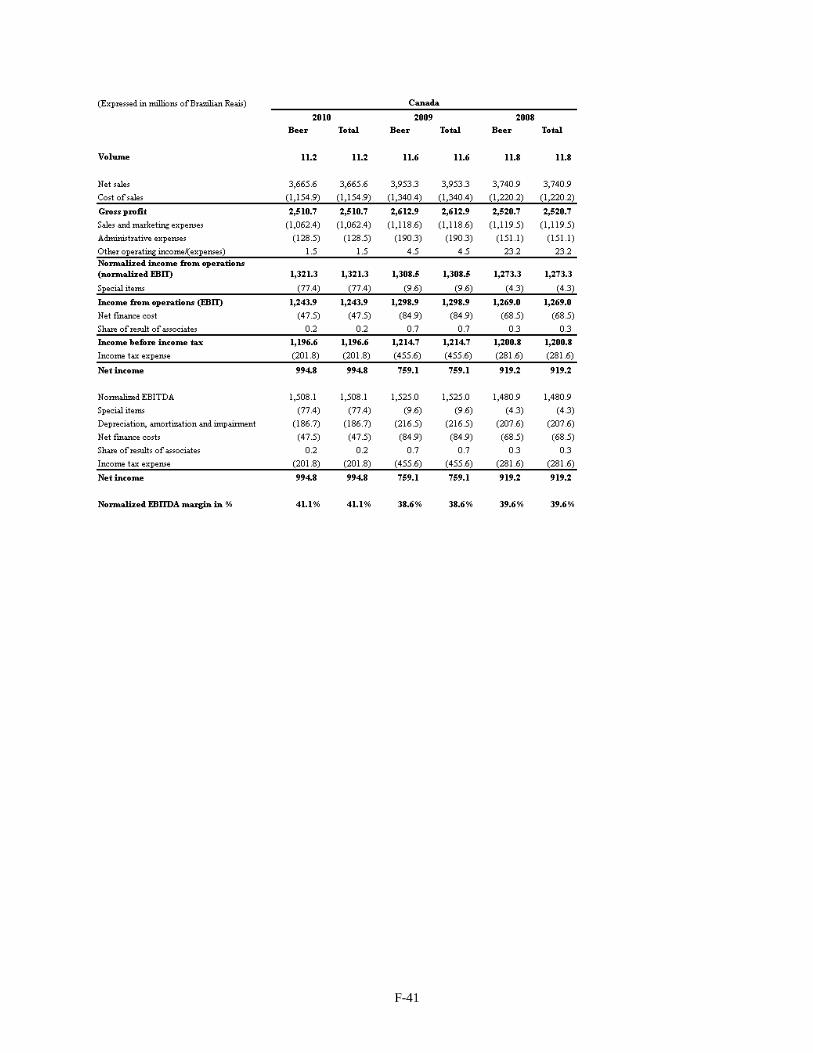
F-41
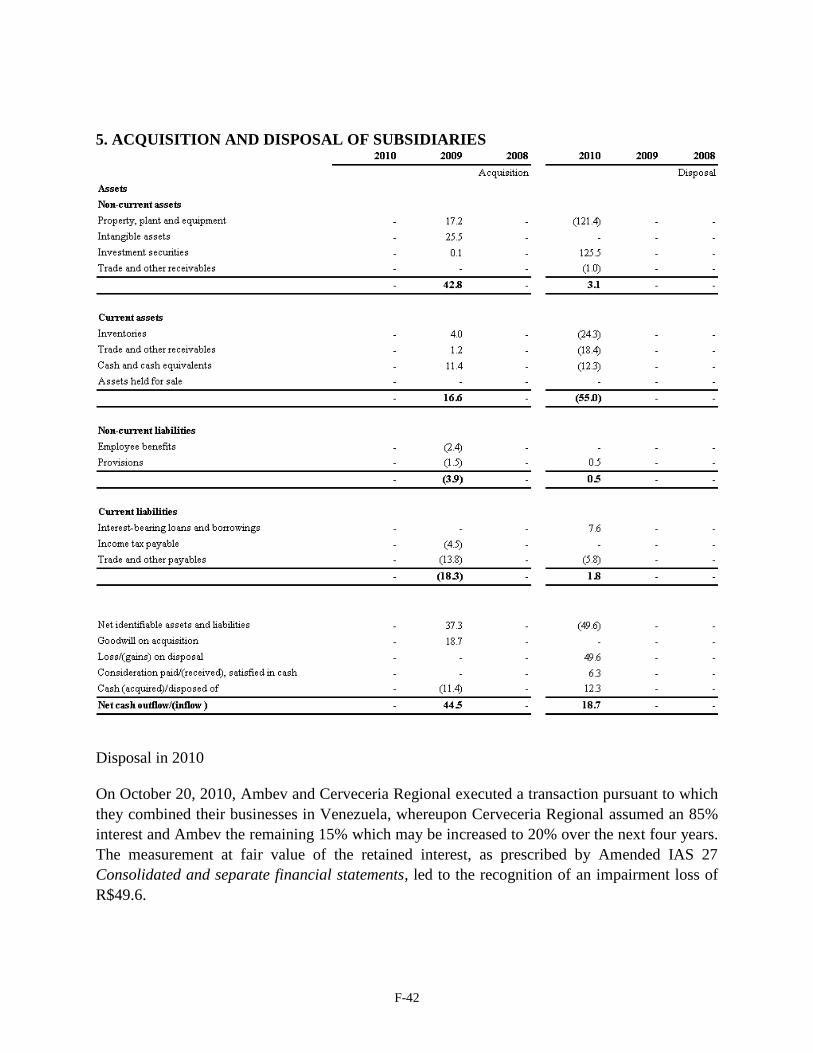
F-42
5. ACQUISITION AND DISPOSAL OF SUBSIDIARIES
Disposal in 2010
On October 20, 2010, Ambev and Cerveceria Regional executed a transaction pursuant to which
they combined their businesses in Venezuela, whereupon Cerveceria Regional assumed an 85%
interest and Ambev the remaining 15% which may be increased to 20% over the next four years.
The measurement at fair value of the retained interest, as prescribed by Amended IAS 27
Consolidated and separate financial statements, led to the recognition of an impairment loss of
R$49.6.
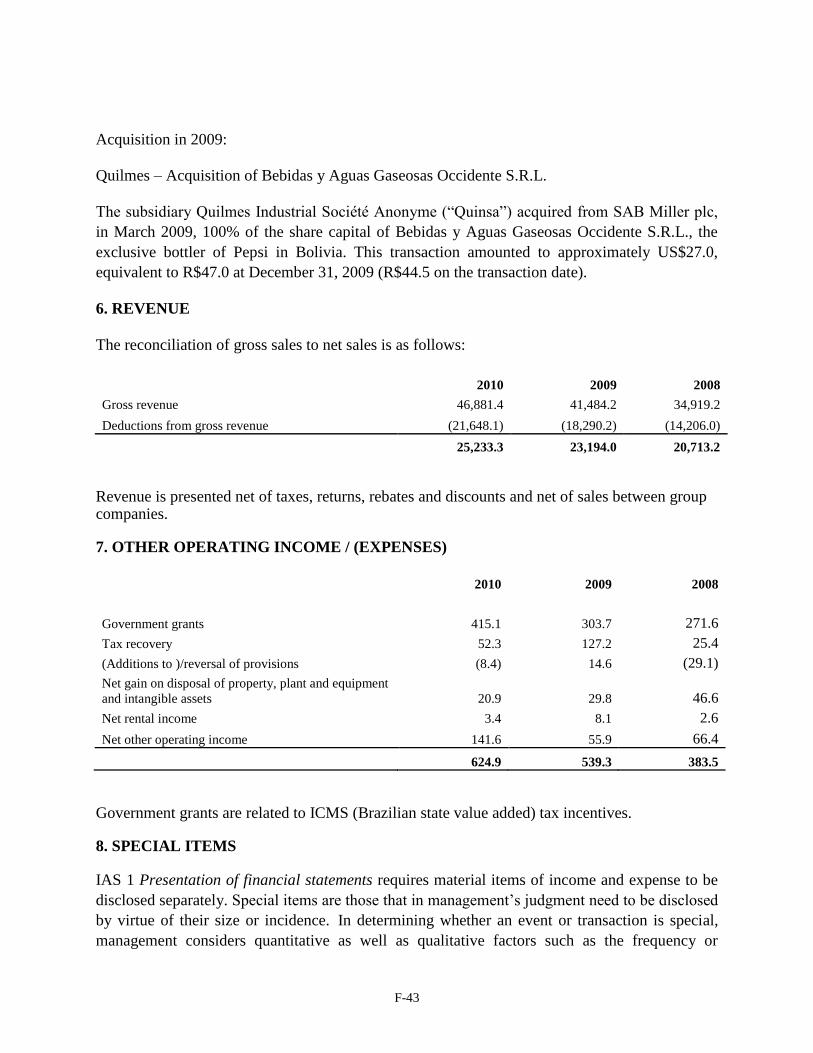
F-43
Acquisition in 2009:
Quilmes – Acquisition of Bebidas y Aguas Gaseosas Occidente S.R.L.
The subsidiary Quilmes Industrial Société Anonyme (―Quinsa‖) acquired from SAB Miller plc,
in March 2009, 100% of the share capital of Bebidas y Aguas Gaseosas Occidente S.R.L., the
exclusive bottler of Pepsi in Bolivia. This transaction amounted to approximately US$27.0,
equivalent to R$47.0 at December 31, 2009 (R$44.5 on the transaction date).
6. REVENUE
The reconciliation of gross sales to net sales is as follows:
2010 2009 2008
Gross revenue 46,881.4 41,484.2 34,919.2
Deductions from gross revenue (21,648.1) (18,290.2) (14,206.0)
25,233.3 23,194.0 20,713.2
Revenue is presented net of taxes, returns, rebates and discounts and net of sales between group companies.
7. OTHER OPERATING INCOME / (EXPENSES)
2010 2009 2008
Government grants 415.1 303.7 271.6
Tax recovery 52.3 127.2 25.4
(Additions to )/reversal of provisions (8.4) 14.6 (29.1)
Net gain on disposal of property, plant and equipment
and intangible assets 20.9 29.8 46.6
Net rental income 3.4 8.1 2.6
Net other operating income 141.6 55.9 66.4
624.9 539.3 383.5
Government grants are related to ICMS (Brazilian state value added) tax incentives.
8. SPECIAL ITEMS
IAS 1 Presentation of financial statements requires material items of income and expense to be
disclosed separately. Special items are those that in management’s judgment need to be disclosed
by virtue of their size or incidence. In determining whether an event or transaction is special,
management considers quantitative as well as qualitative factors such as the frequency or
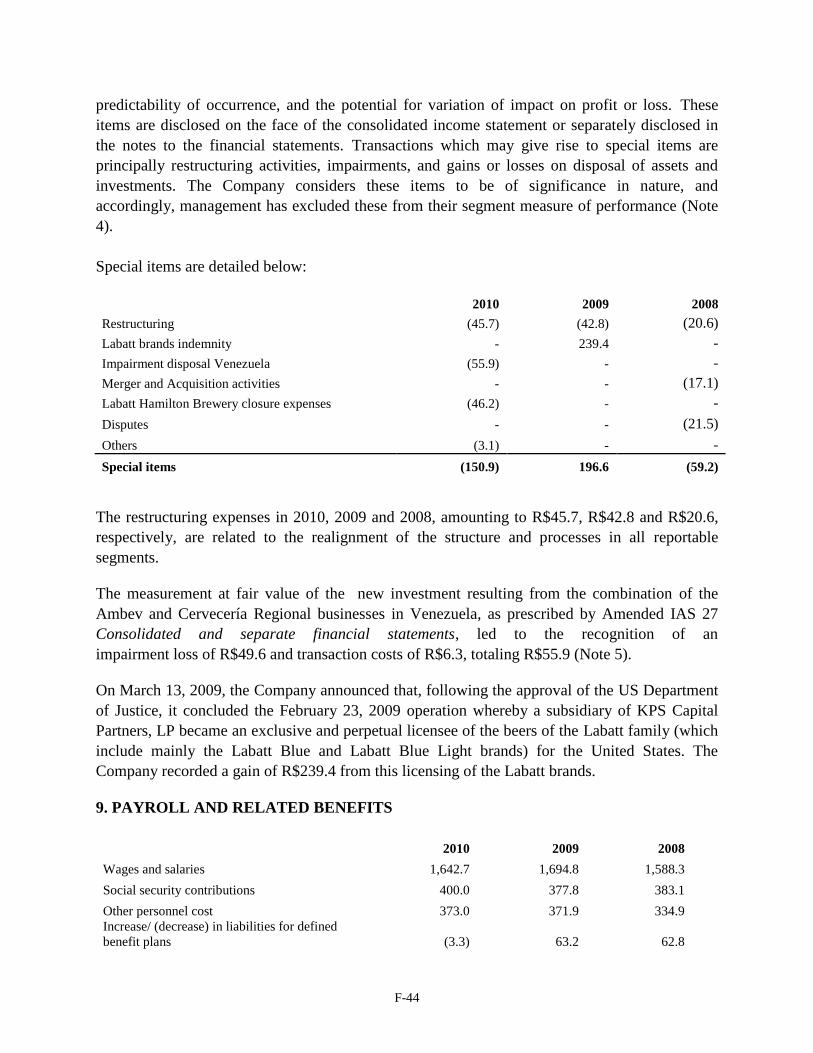
F-44
predictability of occurrence, and the potential for variation of impact on profit or loss. These
items are disclosed on the face of the consolidated income statement or separately disclosed in
the notes to the financial statements. Transactions which may give rise to special items are
principally restructuring activities, impairments, and gains or losses on disposal of assets and
investments. The Company considers these items to be of significance in nature, and
accordingly, management has excluded these from their segment measure of performance (Note
4).
Special items are detailed below:
2010 2009 2008
Restructuring (45.7) (42.8) (20.6)
Labatt brands indemnity - 239.4 -
Impairment disposal Venezuela (55.9) - -
Merger and Acquisition activities - - (17.1)
Labatt Hamilton Brewery closure expenses (46.2) - -
Disputes - - (21.5)
Others (3.1) - -
Special items (150.9) 196.6 (59.2)
The restructuring expenses in 2010, 2009 and 2008, amounting to R$45.7, R$42.8 and R$20.6,
respectively, are related to the realignment of the structure and processes in all reportable
segments.
The measurement at fair value of the new investment resulting from the combination of the
Ambev and Cervecería Regional businesses in Venezuela, as prescribed by Amended IAS 27
Consolidated and separate financial statements, led to the recognition of an
impairment loss of R$49.6 and transaction costs of R$6.3, totaling R$55.9 (Note 5).
On March 13, 2009, the Company announced that, following the approval of the US Department
of Justice, it concluded the February 23, 2009 operation whereby a subsidiary of KPS Capital
Partners, LP became an exclusive and perpetual licensee of the beers of the Labatt family (which
include mainly the Labatt Blue and Labatt Blue Light brands) for the United States. The
Company recorded a gain of R$239.4 from this licensing of the Labatt brands.
9. PAYROLL AND RELATED BENEFITS
2010 2009 2008
Wages and salaries 1,642.7 1,694.8 1,588.3
Social security contributions 400.0 377.8 383.1
Other personnel cost 373.0 371.9 334.9
Increase/ (decrease) in liabilities for defined
benefit plans (3.3) 63.2 62.8
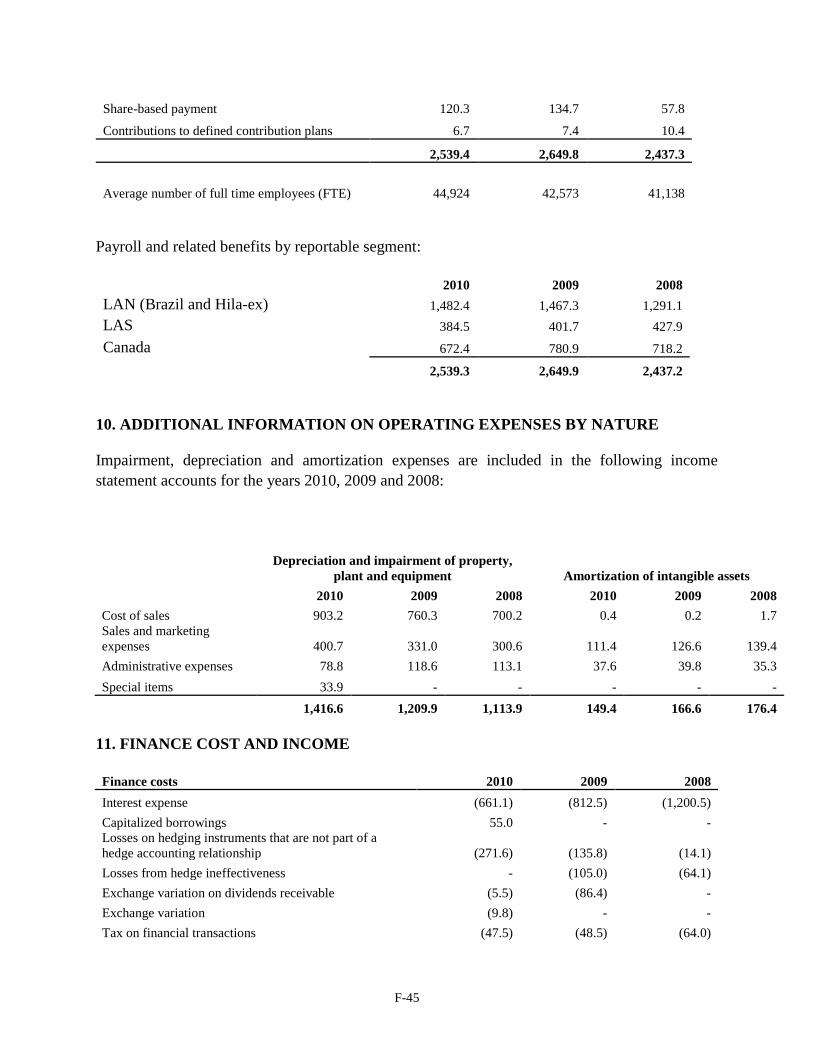
F-45
Share-based payment 120.3 134.7 57.8
Contributions to defined contribution plans 6.7 7.4 10.4
2,539.4 2,649.8 2,437.3
Average number of full time employees (FTE) 44,924 42,573 41,138
Payroll and related benefits by reportable segment:
2010 2009 2008
LAN (Brazil and Hila-ex) 1,482.4 1,467.3 1,291.1
LAS 384.5 401.7 427.9
Canada 672.4 780.9 718.2
2,539.3 2,649.9 2,437.2
10. ADDITIONAL INFORMATION ON OPERATING EXPENSES BY NATURE
Impairment, depreciation and amortization expenses are included in the following income
statement accounts for the years 2010, 2009 and 2008:
Depreciation and impairment of property,
plant and equipment Amortization of intangible assets
2010 2009 2008 2010 2009 2008
Cost of sales 903.2 760.3 700.2 0.4 0.2 1.7
Sales and marketing
expenses 400.7 331.0 300.6 111.4 126.6 139.4
Administrative expenses 78.8 118.6 113.1 37.6 39.8 35.3
Special items 33.9 - - - - -
1,416.6 1,209.9 1,113.9 149.4 166.6 176.4
11. FINANCE COST AND INCOME
Finance costs 2010 2009 2008
Interest expense (661.1) (812.5) (1,200.5)
Capitalized borrowings 55.0 - -
Losses on hedging instruments that are not part of a
hedge accounting relationship (271.6) (135.8) (14.1)
Losses from hedge ineffectiveness - (105.0) (64.1)
Exchange variation on dividends receivable (5.5) (86.4) -
Exchange variation (9.8) - -
Tax on financial transactions (47.5) (48.5) (64.0)
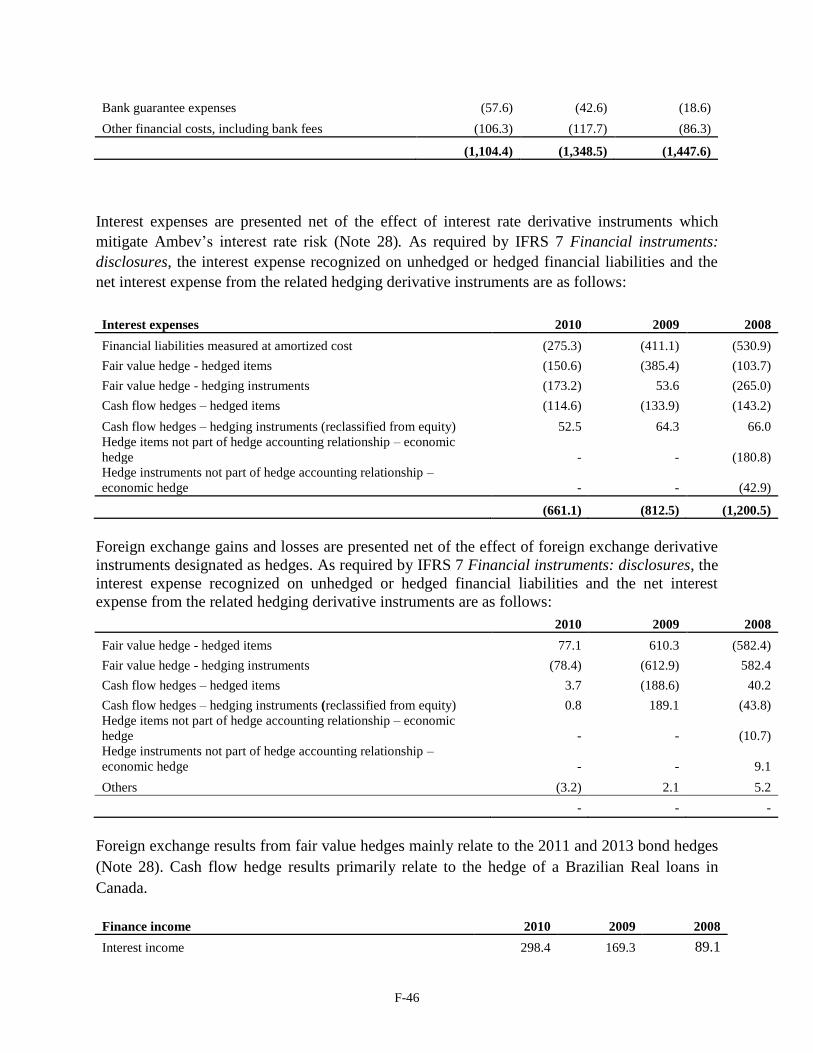
F-46
Bank guarantee expenses (57.6) (42.6) (18.6)
Other financial costs, including bank fees (106.3) (117.7) (86.3)
(1,104.4) (1,348.5) (1,447.6)
Interest expenses are presented net of the effect of interest rate derivative instruments which
mitigate Ambev’s interest rate risk (Note 28). As required by IFRS 7 Financial instruments:
disclosures, the interest expense recognized on unhedged or hedged financial liabilities and the
net interest expense from the related hedging derivative instruments are as follows:
Interest expenses 2010 2009 2008
Financial liabilities measured at amortized cost (275.3) (411.1) (530.9)
Fair value hedge - hedged items (150.6) (385.4) (103.7)
Fair value hedge - hedging instruments (173.2) 53.6 (265.0)
Cash flow hedges – hedged items (114.6) (133.9) (143.2)
Cash flow hedges – hedging instruments (reclassified from equity) 52.5 64.3 66.0
Hedge items not part of hedge accounting relationship – economic
hedge - - (180.8)
Hedge instruments not part of hedge accounting relationship –
economic hedge - - (42.9)
(661.1) (812.5) (1,200.5)
Foreign exchange gains and losses are presented net of the effect of foreign exchange derivative
instruments designated as hedges. As required by IFRS 7 Financial instruments: disclosures, the
interest expense recognized on unhedged or hedged financial liabilities and the net interest
expense from the related hedging derivative instruments are as follows:
2010 2009 2008
Fair value hedge - hedged items 77.1 610.3 (582.4)
Fair value hedge - hedging instruments (78.4) (612.9) 582.4
Cash flow hedges – hedged items 3.7 (188.6) 40.2
Cash flow hedges – hedging instruments (reclassified from equity) 0.8 189.1 (43.8)
Hedge items not part of hedge accounting relationship – economic
hedge - - (10.7)
Hedge instruments not part of hedge accounting relationship –
economic hedge - - 9.1
Others (3.2) 2.1 5.2
- - -
Foreign exchange results from fair value hedges mainly relate to the 2011 and 2013 bond hedges
(Note 28). Cash flow hedge results primarily relate to the hedge of a Brazilian Real loans in
Canada.
Finance income 2010 2009 2008
Interest income 298.4 169.3 89.1
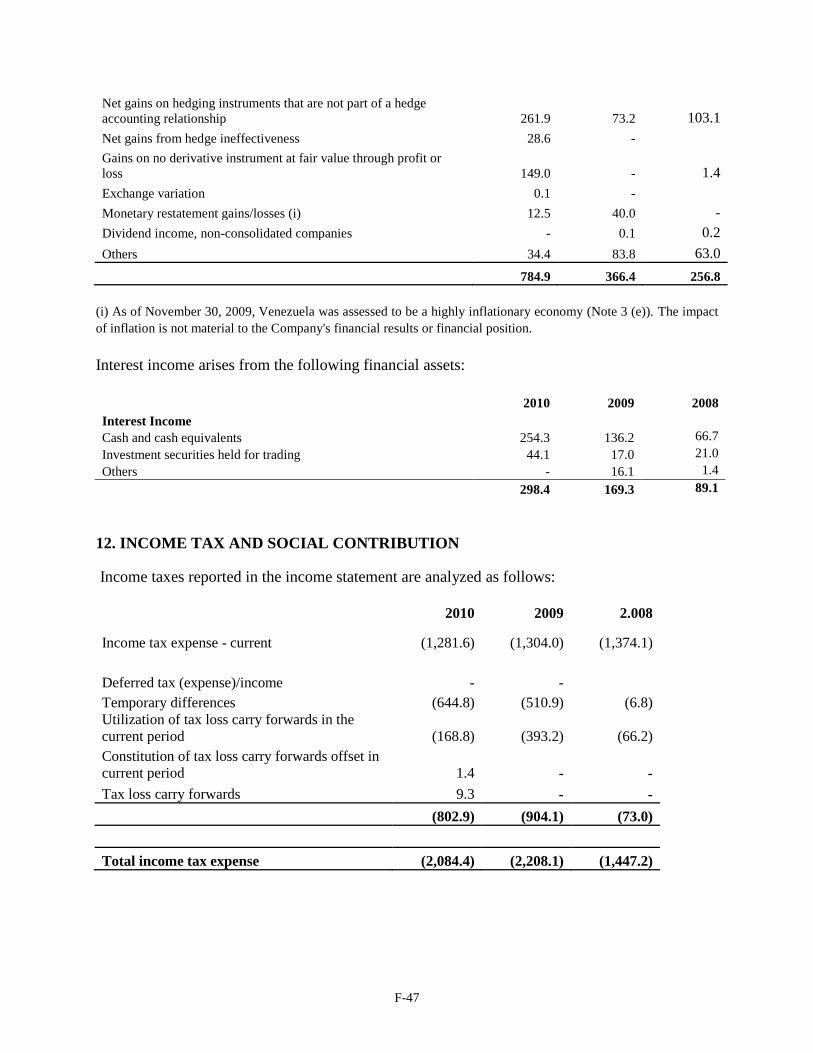
F-47
Net gains on hedging instruments that are not part of a hedge
accounting relationship 261.9 73.2 103.1
Net gains from hedge ineffectiveness 28.6 -
Gains on no derivative instrument at fair value through profit or
loss 149.0 - 1.4
Exchange variation 0.1 -
Monetary restatement gains/losses (i) 12.5 40.0 -
Dividend income, non-consolidated companies - 0.1 0.2
Others 34.4 83.8 63.0
784.9 366.4 256.8
(i) As of November 30, 2009, Venezuela was assessed to be a highly inflationary economy (Note 3 (e)). The impact
of inflation is not material to the Company's financial results or financial position.
Interest income arises from the following financial assets:
2010 2009 2008
Interest Income
Cash and cash equivalents 254.3 136.2 66.7
Investment securities held for trading 44.1 17.0 21.0
Others - 16.1 1.4
298.4 169.3 89.1
12. INCOME TAX AND SOCIAL CONTRIBUTION
Income taxes reported in the income statement are analyzed as follows:
2010 2009 2.008
Income tax expense - current (1,281.6) (1,304.0) (1,374.1)
Deferred tax (expense)/income - -
Temporary differences (644.8) (510.9) (6.8)
Utilization of tax loss carry forwards in the
current period (168.8) (393.2) (66.2)
Constitution of tax loss carry forwards offset in
current period 1.4 - -
Tax loss carry forwards 9.3 - -
(802.9) (904.1) (73.0)
Total income tax expense (2,084.4) (2,208.1) (1,447.2)
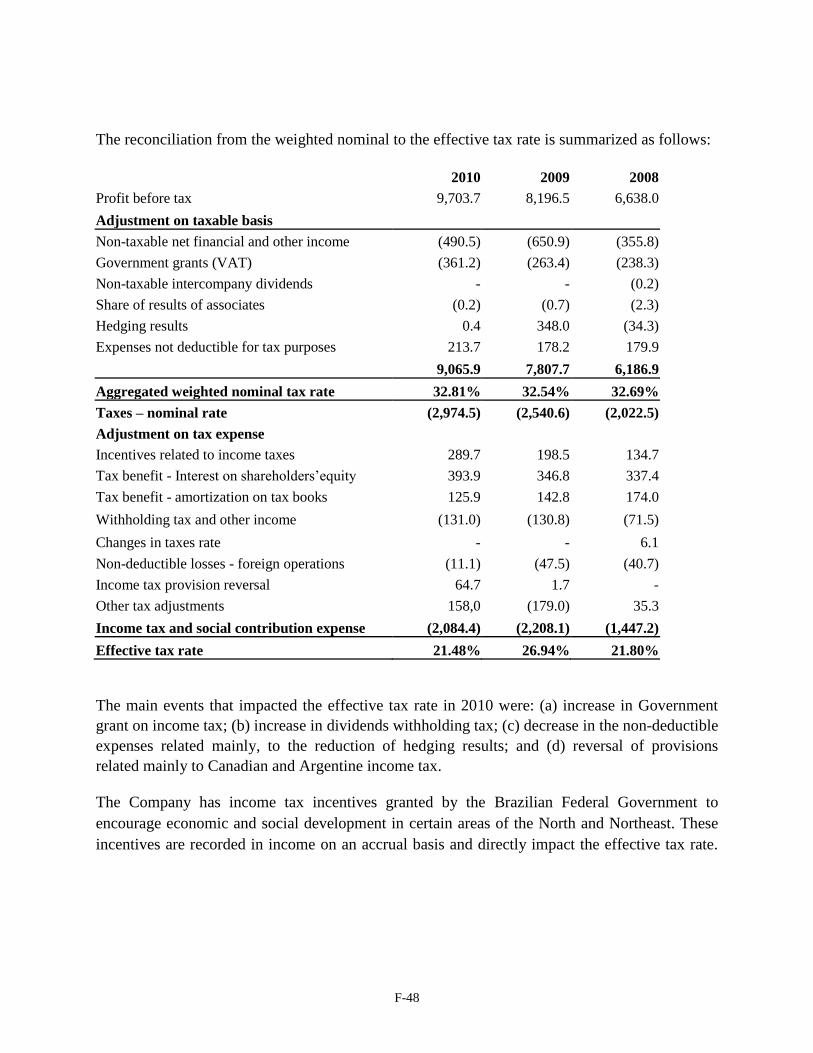
F-48
The reconciliation from the weighted nominal to the effective tax rate is summarized as follows:
2010 2009 2008
Profit before tax 9,703.7 8,196.5 6,638.0
Adjustment on taxable basis
Non-taxable net financial and other income (490.5) (650.9) (355.8)
Government grants (VAT) (361.2) (263.4) (238.3)
Non-taxable intercompany dividends - - (0.2)
Share of results of associates (0.2) (0.7) (2.3)
Hedging results 0.4 348.0 (34.3)
Expenses not deductible for tax purposes 213.7 178.2 179.9
9,065.9 7,807.7 6,186.9
Aggregated weighted nominal tax rate 32.81% 32.54% 32.69%
Taxes – nominal rate (2,974.5) (2,540.6) (2,022.5)
Adjustment on tax expense
Incentives related to income taxes 289.7 198.5 134.7
Tax benefit - Interest on shareholders’equity 393.9 346.8 337.4
Tax benefit - amortization on tax books 125.9 142.8 174.0
Withholding tax and other income (131.0) (130.8) (71.5)
Changes in taxes rate - - 6.1
Non-deductible losses - foreign operations (11.1) (47.5) (40.7)
Income tax provision reversal 64.7 1.7 -
Other tax adjustments 158,0 (179.0) 35.3
Income tax and social contribution expense (2,084.4) (2,208.1) (1,447.2)
Effective tax rate 21.48% 26.94% 21.80%
The main events that impacted the effective tax rate in 2010 were: (a) increase in Government
grant on income tax; (b) increase in dividends withholding tax; (c) decrease in the non-deductible
expenses related mainly, to the reduction of hedging results; and (d) reversal of provisions
related mainly to Canadian and Argentine income tax.
The Company has income tax incentives granted by the Brazilian Federal Government to
encourage economic and social development in certain areas of the North and Northeast. These
incentives are recorded in income on an accrual basis and directly impact the effective tax rate.
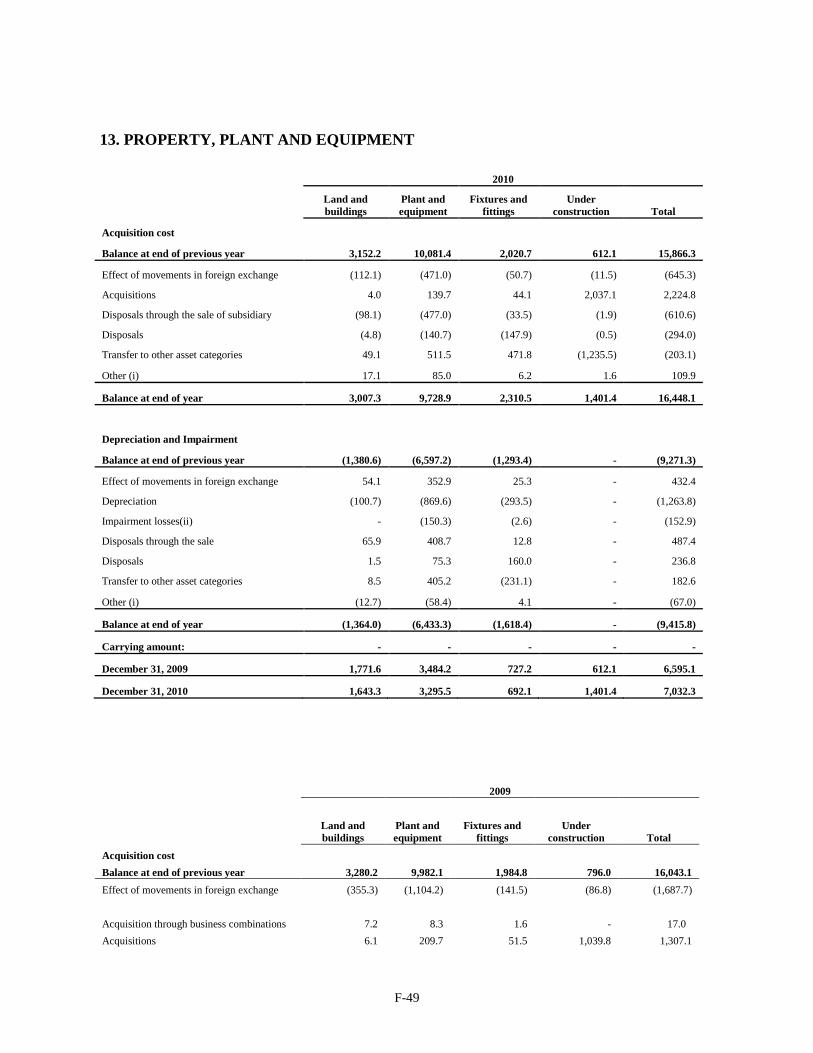
F-49
13. PROPERTY, PLANT AND EQUIPMENT
2010
Land and
buildings
Plant and
equipment
Fixtures and
fittings
Under
construction Total
Acquisition cost
Balance at end of previous year 3,152.2 10,081.4 2,020.7 612.1 15,866.3
Effect of movements in foreign exchange (112.1) (471.0) (50.7) (11.5) (645.3)
Acquisitions 4.0 139.7 44.1 2,037.1 2,224.8
Disposals through the sale of subsidiary (98.1) (477.0) (33.5) (1.9) (610.6)
Disposals (4.8) (140.7) (147.9) (0.5) (294.0)
Transfer to other asset categories 49.1 511.5 471.8 (1,235.5) (203.1)
Other (i) 17.1 85.0 6.2 1.6 109.9
Balance at end of year 3,007.3 9,728.9 2,310.5 1,401.4 16,448.1
Depreciation and Impairment
Balance at end of previous year (1,380.6) (6,597.2) (1,293.4) - (9,271.3)
Effect of movements in foreign exchange 54.1 352.9 25.3 - 432.4
Depreciation (100.7) (869.6) (293.5) - (1,263.8)
Impairment losses(ii) - (150.3) (2.6) - (152.9)
Disposals through the sale 65.9 408.7 12.8 - 487.4
Disposals 1.5 75.3 160.0 - 236.8
Transfer to other asset categories 8.5 405.2 (231.1) - 182.6
Other (i) (12.7) (58.4) 4.1 - (67.0)
Balance at end of year (1,364.0) (6,433.3) (1,618.4) - (9,415.8)
Carrying amount: - - - - -
December 31, 2009 1,771.6 3,484.2 727.2 612.1 6,595.1
December 31, 2010 1,643.3 3,295.5 692.1 1,401.4 7,032.3
2009
Land and
buildings
Plant and
equipment
Fixtures and
fittings
Under
construction Total
Acquisition cost
Balance at end of previous year 3,280.2 9,982.1 1,984.8 796.0 16,043.1
Effect of movements in foreign exchange (355.3) (1,104.2) (141.5) (86.8) (1,687.7)
Acquisition through business combinations 7.2 8.3 1.6 - 17.0
Acquisitions 6.1 209.7 51.5 1,039.8 1,307.1
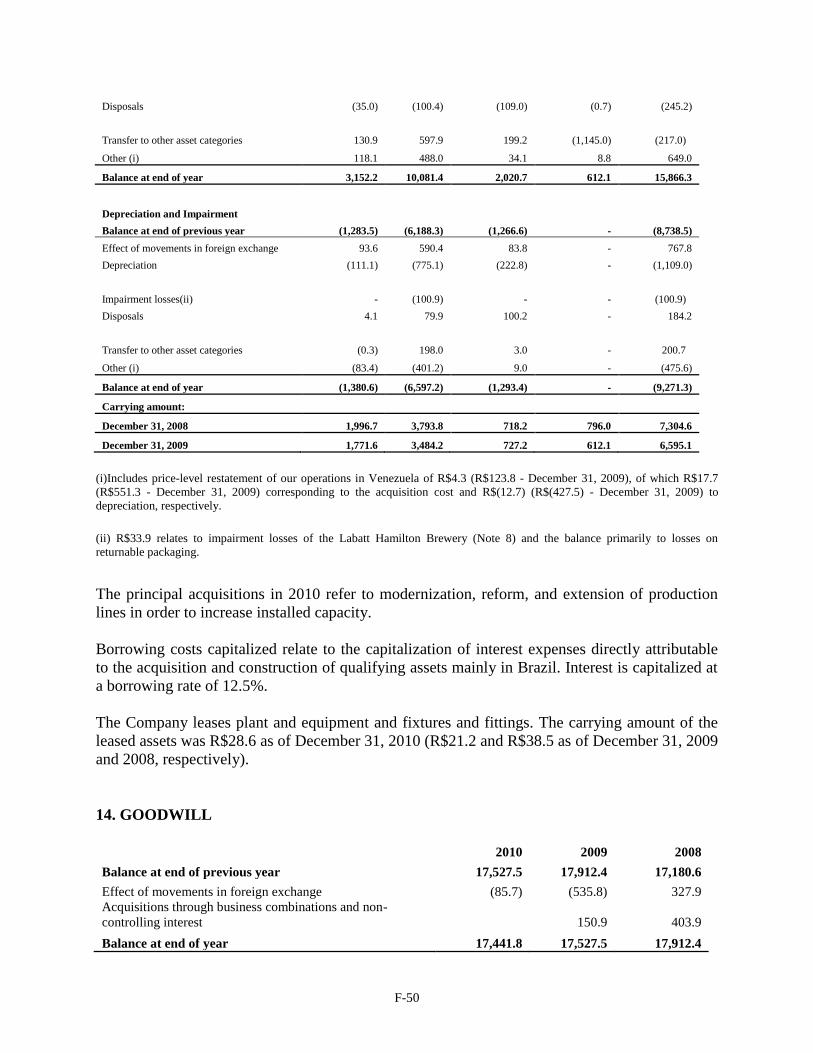
F-50
Disposals (35.0) (100.4) (109.0) (0.7) (245.2)
Transfer to other asset categories 130.9 597.9 199.2 (1,145.0) (217.0)
Other (i) 118.1 488.0 34.1 8.8 649.0
Balance at end of year 3,152.2 10,081.4 2,020.7 612.1 15,866.3
Depreciation and Impairment
Balance at end of previous year (1,283.5) (6,188.3) (1,266.6) - (8,738.5)
Effect of movements in foreign exchange 93.6 590.4 83.8 - 767.8
Depreciation (111.1) (775.1) (222.8) - (1,109.0)
Impairment losses(ii) - (100.9) - - (100.9)
Disposals 4.1 79.9 100.2 - 184.2
Transfer to other asset categories (0.3) 198.0 3.0 - 200.7
Other (i) (83.4) (401.2) 9.0 - (475.6)
Balance at end of year (1,380.6) (6,597.2) (1,293.4) - (9,271.3)
Carrying amount:
December 31, 2008 1,996.7 3,793.8 718.2 796.0 7,304.6
December 31, 2009 1,771.6 3,484.2 727.2 612.1 6,595.1
(i)Includes price-level restatement of our operations in Venezuela of R$4.3 (R$123.8 - December 31, 2009), of which R$17.7
(R$551.3 - December 31, 2009) corresponding to the acquisition cost and R$(12.7) (R$(427.5) - December 31, 2009) to
depreciation, respectively.
(ii) R$33.9 relates to impairment losses of the Labatt Hamilton Brewery (Note 8) and the balance primarily to losses on
returnable packaging.
The principal acquisitions in 2010 refer to modernization, reform, and extension of production
lines in order to increase installed capacity.
Borrowing costs capitalized relate to the capitalization of interest expenses directly attributable
to the acquisition and construction of qualifying assets mainly in Brazil. Interest is capitalized at
a borrowing rate of 12.5%.
The Company leases plant and equipment and fixtures and fittings. The carrying amount of the
leased assets was R$28.6 as of December 31, 2010 (R$21.2 and R$38.5 as of December 31, 2009
and 2008, respectively).
14. GOODWILL
2010 2009 2008
Balance at end of previous year 17,527.5 17,912.4 17,180.6
Effect of movements in foreign exchange (85.7) (535.8) 327.9
Acquisitions through business combinations and non-
controlling interest
150.9 403.9
Balance at end of year 17,441.8 17,527.5 17,912.4
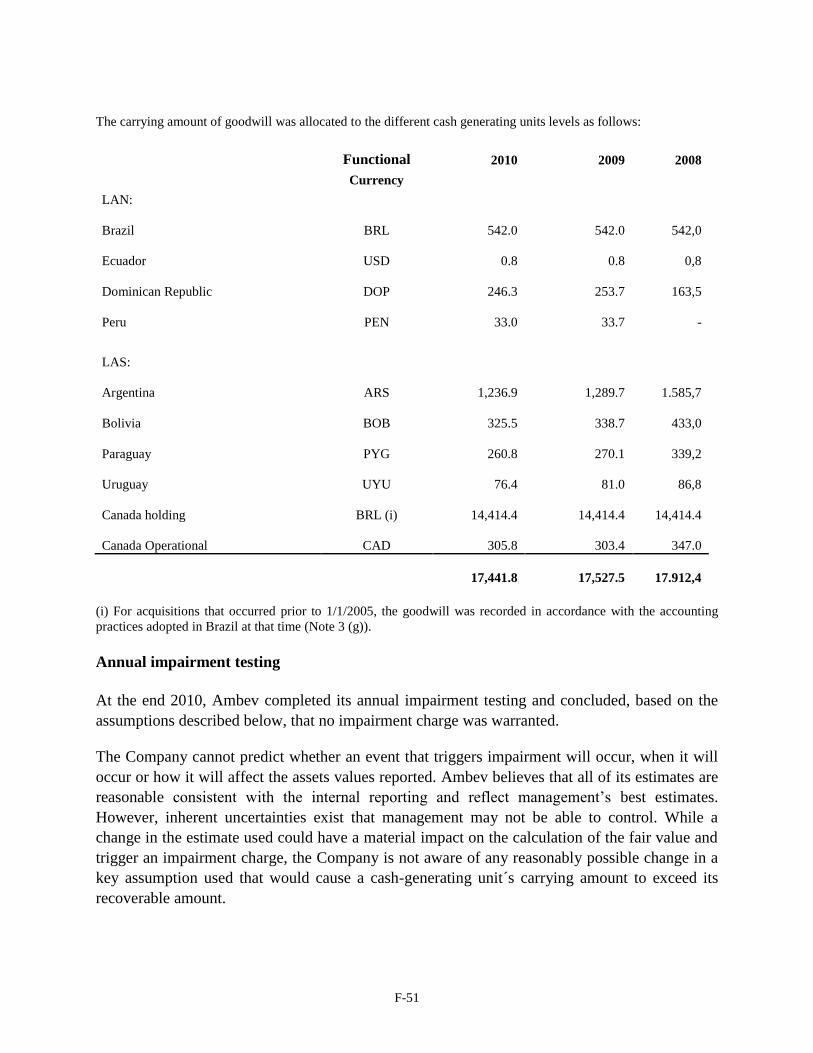
F-51
The carrying amount of goodwill was allocated to the different cash generating units levels as follows:
Functional 2010 2009 2008
Currency
LAN:
Brazil BRL 542.0 542.0
542,0
Ecuador USD 0.8 0.8
0,8
Dominican Republic DOP 246.3 253.7
163,5
Peru PEN 33.0 33.7
-
LAS:
Argentina ARS 1,236.9 1,289.7
1.585,7
Bolivia BOB 325.5 338.7
433,0
Paraguay PYG 260.8 270.1
339,2
Uruguay UYU 76.4 81.0
86,8
Canada holding BRL (i) 14,414.4 14,414.4
14,414.4
Canada Operational CAD 305.8 303.4
347.0
17,441.8 17,527.5
17.912,4
(i) For acquisitions that occurred prior to 1/1/2005, the goodwill was recorded in accordance with the accounting
practices adopted in Brazil at that time (Note 3 (g)).
Annual impairment testing
At the end 2010, Ambev completed its annual impairment testing and concluded, based on the
assumptions described below, that no impairment charge was warranted.
The Company cannot predict whether an event that triggers impairment will occur, when it will
occur or how it will affect the assets values reported. Ambev believes that all of its estimates are
reasonable consistent with the internal reporting and reflect management’s best estimates.
However, inherent uncertainties exist that management may not be able to control. While a
change in the estimate used could have a material impact on the calculation of the fair value and
trigger an impairment charge, the Company is not aware of any reasonably possible change in a
key assumption used that would cause a cash-generating unit´s carrying amount to exceed its
recoverable amount.
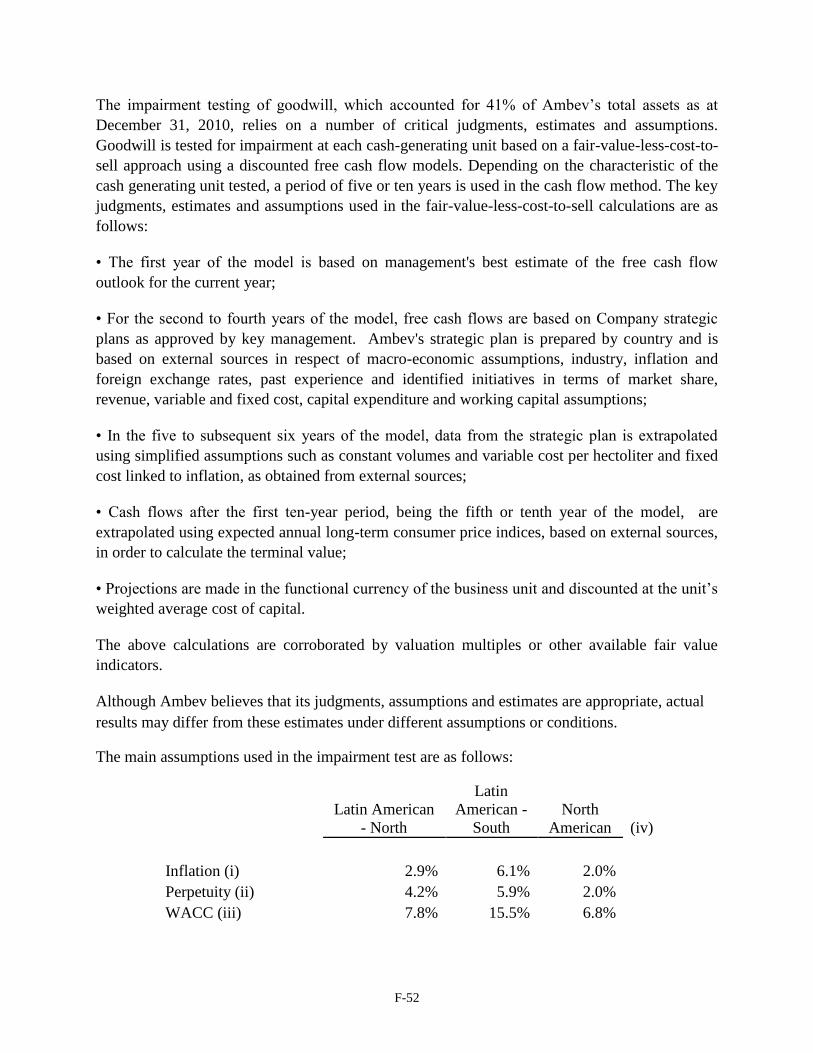
F-52
The impairment testing of goodwill, which accounted for 41% of Ambev’s total assets as at
December 31, 2010, relies on a number of critical judgments, estimates and assumptions.
Goodwill is tested for impairment at each cash-generating unit based on a fair-value-less-cost-to-
sell approach using a discounted free cash flow models. Depending on the characteristic of the
cash generating unit tested, a period of five or ten years is used in the cash flow method. The key
judgments, estimates and assumptions used in the fair-value-less-cost-to-sell calculations are as
follows:
• The first year of the model is based on management's best estimate of the free cash flow
outlook for the current year;
• For the second to fourth years of the model, free cash flows are based on Company strategic
plans as approved by key management. Ambev's strategic plan is prepared by country and is
based on external sources in respect of macro-economic assumptions, industry, inflation and
foreign exchange rates, past experience and identified initiatives in terms of market share,
revenue, variable and fixed cost, capital expenditure and working capital assumptions;
• In the five to subsequent six years of the model, data from the strategic plan is extrapolated
using simplified assumptions such as constant volumes and variable cost per hectoliter and fixed
cost linked to inflation, as obtained from external sources;
• Cash flows after the first ten-year period, being the fifth or tenth year of the model, are
extrapolated using expected annual long-term consumer price indices, based on external sources,
in order to calculate the terminal value;
• Projections are made in the functional currency of the business unit and discounted at the unit’s
weighted average cost of capital.
The above calculations are corroborated by valuation multiples or other available fair value
indicators.
Although Ambev believes that its judgments, assumptions and estimates are appropriate, actual
results may differ from these estimates under different assumptions or conditions.
The main assumptions used in the impairment test are as follows:
Latin American
- North
Latin
American -
South
North
American (iv)
Inflation (i) 2.9% 6.1% 2.0%
Perpetuity (ii) 4.2% 5.9% 2.0%
WACC (iii) 7.8% 15.5% 6.8%
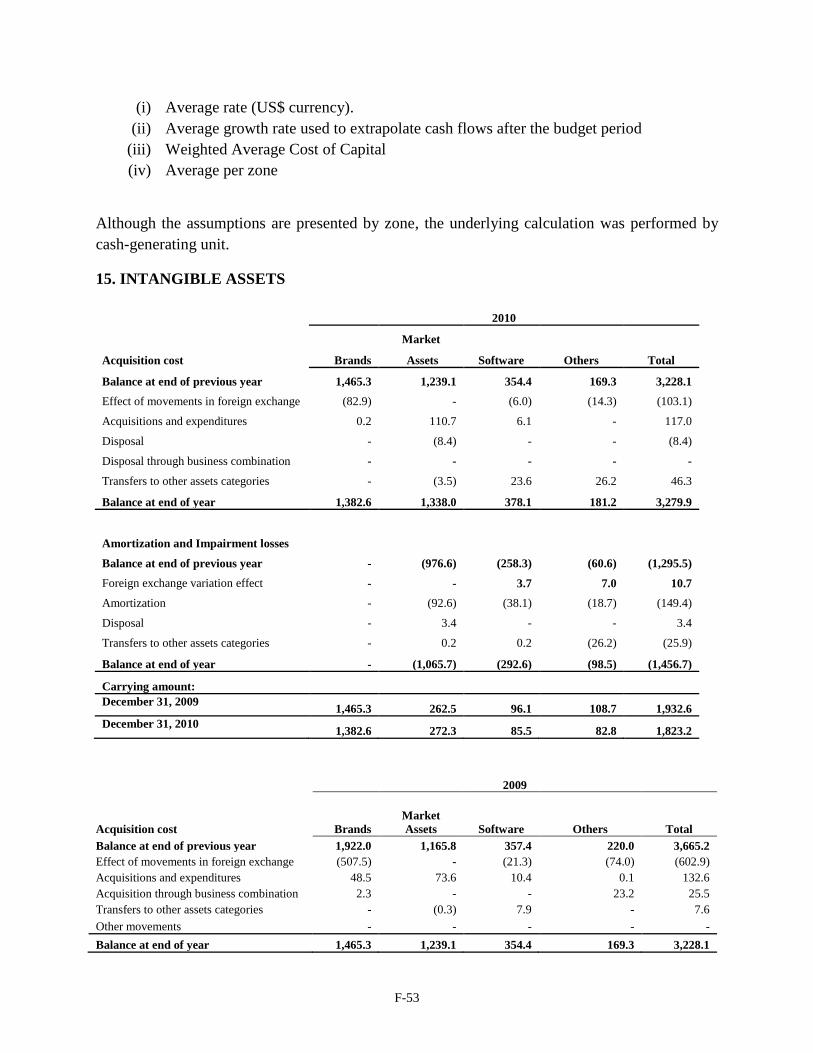
F-53
(i) Average rate (US$ currency). (ii) Average growth rate used to extrapolate cash flows after the budget period
(iii) Weighted Average Cost of Capital
(iv) Average per zone
Although the assumptions are presented by zone, the underlying calculation was performed by
cash-generating unit.
15. INTANGIBLE ASSETS
2010
Market
Acquisition cost Brands Assets Software Others Total
Balance at end of previous year 1,465.3 1,239.1 354.4 169.3 3,228.1
Effect of movements in foreign exchange (82.9) - (6.0) (14.3) (103.1)
Acquisitions and expenditures 0.2 110.7 6.1 - 117.0
Disposal - (8.4) - - (8.4)
Disposal through business combination - - - - -
Transfers to other assets categories - (3.5) 23.6 26.2 46.3
Balance at end of year 1,382.6 1,338.0 378.1 181.2 3,279.9
Amortization and Impairment losses
Balance at end of previous year - (976.6) (258.3) (60.6) (1,295.5)
Foreign exchange variation effect - - 3.7 7.0 10.7
Amortization - (92.6) (38.1) (18.7) (149.4)
Disposal - 3.4 - - 3.4
Transfers to other assets categories - 0.2 0.2 (26.2) (25.9)
Balance at end of year - (1,065.7) (292.6) (98.5) (1,456.7)
Carrying amount:
December 31, 2009 1,465.3 262.5 96.1 108.7 1,932.6
December 31, 2010 1,382.6 272.3 85.5 82.8 1,823.2
2009
Acquisition cost Brands
Market
Assets Software Others Total
Balance at end of previous year 1,922.0 1,165.8 357.4 220.0 3,665.2
Effect of movements in foreign exchange (507.5) - (21.3) (74.0) (602.9)
Acquisitions and expenditures 48.5 73.6 10.4 0.1 132.6
Acquisition through business combination 2.3 - - 23.2 25.5
Transfers to other assets categories - (0.3) 7.9 - 7.6
Other movements - - - - -
Balance at end of year 1,465.3 1,239.1 354.4 169.3 3,228.1
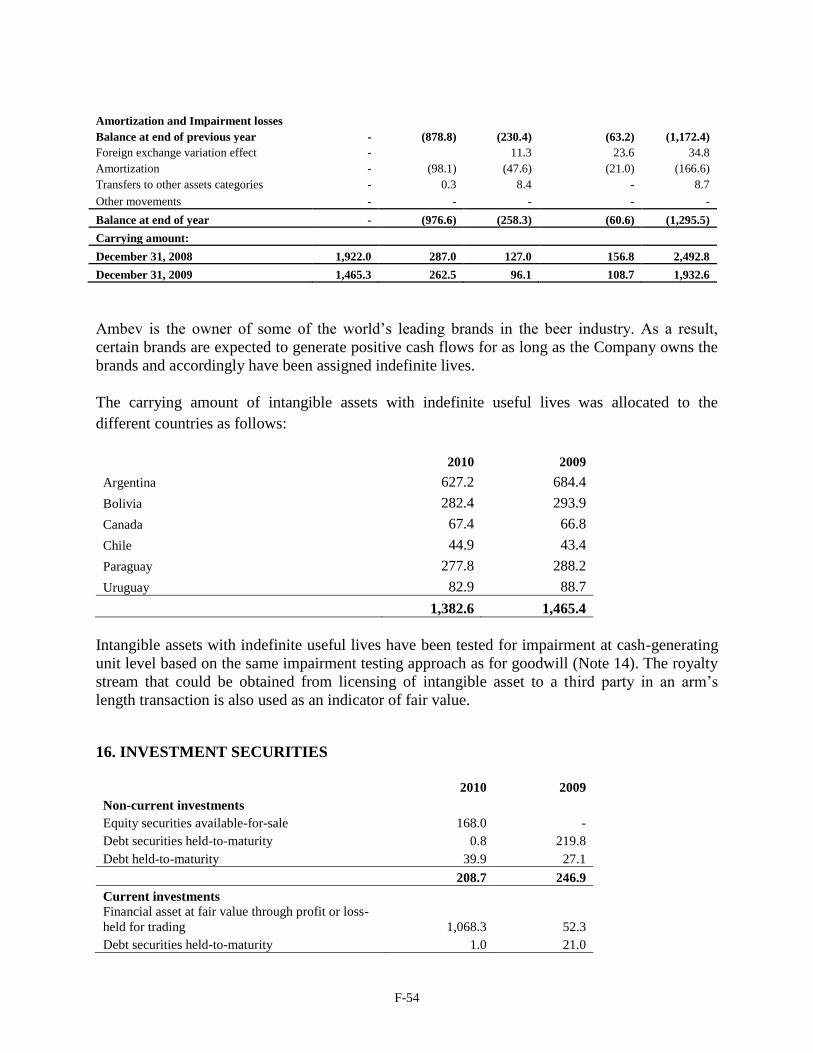
F-54
Amortization and Impairment losses
Balance at end of previous year - (878.8) (230.4) (63.2) (1,172.4)
Foreign exchange variation effect - 11.3 23.6 34.8
Amortization - (98.1) (47.6) (21.0) (166.6)
Transfers to other assets categories - 0.3 8.4 - 8.7
Other movements - - - - -
Balance at end of year - (976.6) (258.3) (60.6) (1,295.5)
Carrying amount:
December 31, 2008 1,922.0 287.0 127.0 156.8 2,492.8
December 31, 2009 1,465.3 262.5 96.1 108.7 1,932.6
Ambev is the owner of some of the world’s leading brands in the beer industry. As a result,
certain brands are expected to generate positive cash flows for as long as the Company owns the
brands and accordingly have been assigned indefinite lives.
The carrying amount of intangible assets with indefinite useful lives was allocated to the
different countries as follows:
2010 2009
Argentina 627.2 684.4
Bolivia 282.4 293.9
Canada 67.4 66.8
Chile 44.9 43.4
Paraguay 277.8 288.2
Uruguay 82.9 88.7
1,382.6 1,465.4
Intangible assets with indefinite useful lives have been tested for impairment at cash-generating
unit level based on the same impairment testing approach as for goodwill (Note 14). The royalty
stream that could be obtained from licensing of intangible asset to a third party in an arm’s
length transaction is also used as an indicator of fair value.
16. INVESTMENT SECURITIES
2010 2009
Non-current investments
Equity securities available-for-sale 168.0 -
Debt securities held-to-maturity 0.8 219.8
Debt held-to-maturity 39.9 27.1
208.7 246.9
Current investments
Financial asset at fair value through profit or loss-
held for trading 1,068.3 52.3
Debt securities held-to-maturity 1.0 21.0
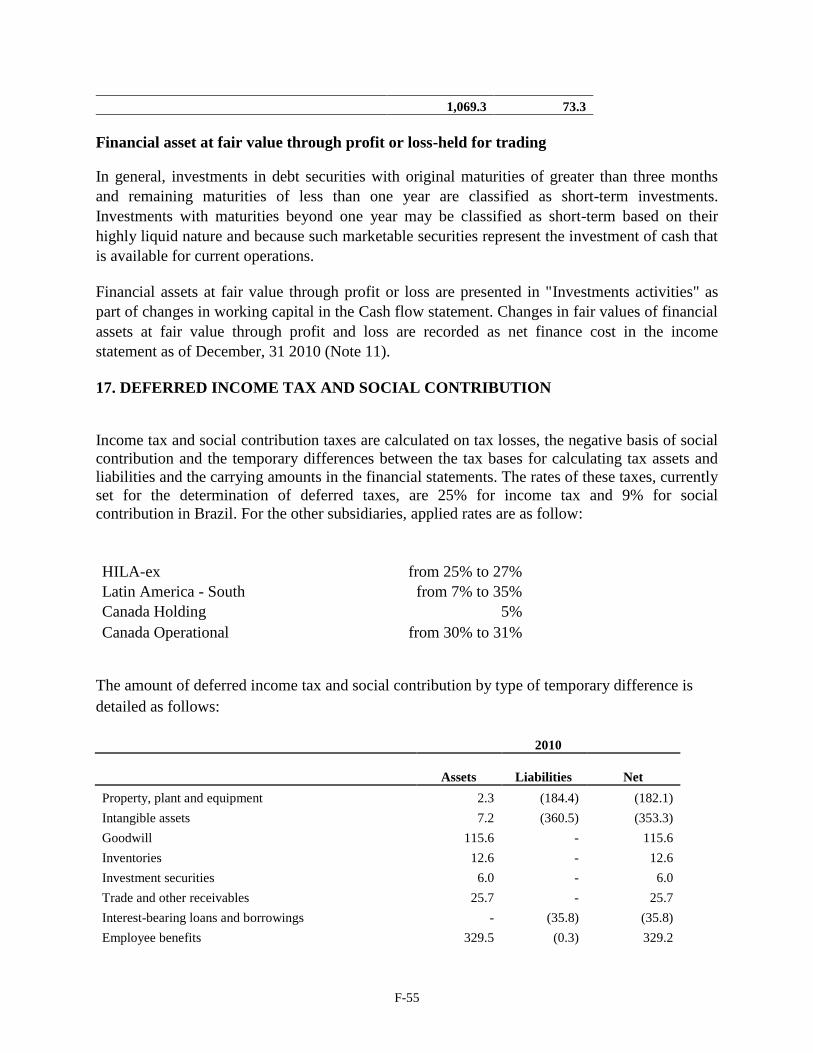
F-55
1,069.3 73.3
Financial asset at fair value through profit or loss-held for trading
In general, investments in debt securities with original maturities of greater than three months
and remaining maturities of less than one year are classified as short-term investments.
Investments with maturities beyond one year may be classified as short-term based on their
highly liquid nature and because such marketable securities represent the investment of cash that
is available for current operations.
Financial assets at fair value through profit or loss are presented in "Investments activities" as
part of changes in working capital in the Cash flow statement. Changes in fair values of financial
assets at fair value through profit and loss are recorded as net finance cost in the income
statement as of December, 31 2010 (Note 11).
17. DEFERRED INCOME TAX AND SOCIAL CONTRIBUTION
Income tax and social contribution taxes are calculated on tax losses, the negative basis of social
contribution and the temporary differences between the tax bases for calculating tax assets and
liabilities and the carrying amounts in the financial statements. The rates of these taxes, currently
set for the determination of deferred taxes, are 25% for income tax and 9% for social
contribution in Brazil. For the other subsidiaries, applied rates are as follow:
HILA-ex from 25% to 27%
Latin America - South from 7% to 35%
Canada Holding 5%
Canada Operational from 30% to 31%
The amount of deferred income tax and social contribution by type of temporary difference is
detailed as follows:
2010
Assets
Liabilities Net
Property, plant and equipment 2.3 (184.4) (182.1)
Intangible assets 7.2 (360.5) (353.3)
Goodwill 115.6 - 115.6
Inventories 12.6 - 12.6
Investment securities 6.0 - 6.0
Trade and other receivables 25.7 - 25.7
Interest-bearing loans and borrowings - (35.8) (35.8)
Employee benefits 329.5 (0.3) 329.2
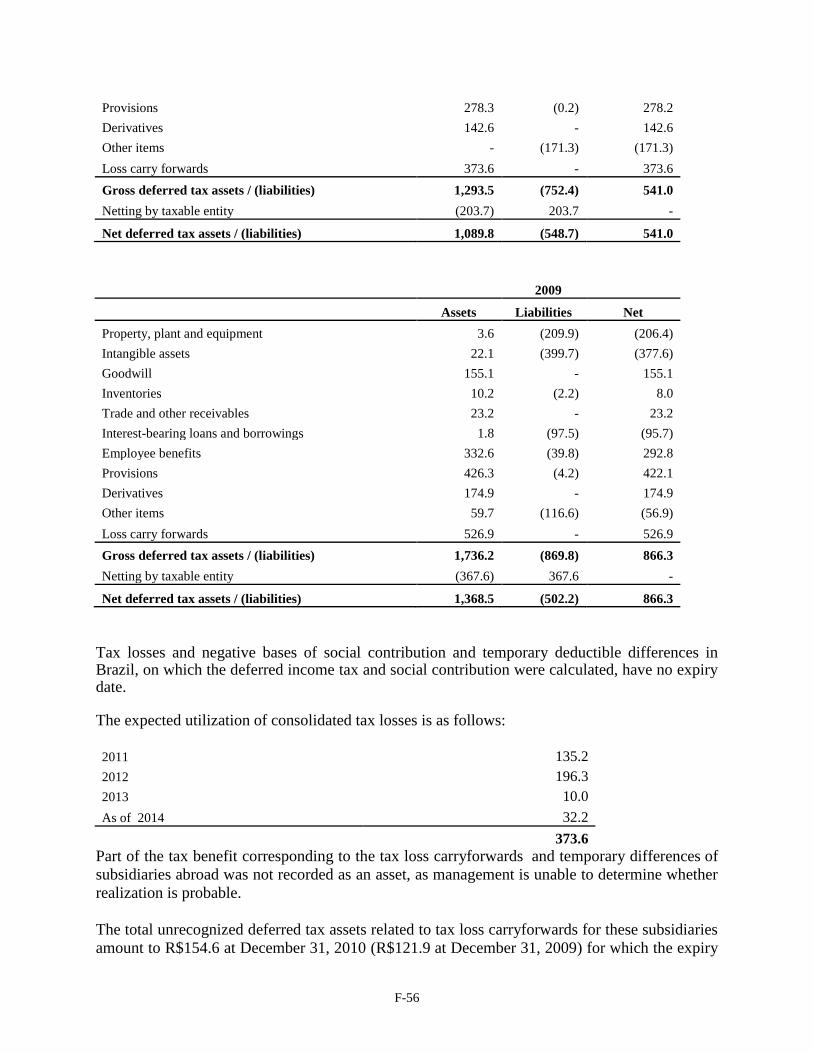
F-56
Provisions 278.3 (0.2) 278.2
Derivatives 142.6 - 142.6
Other items - (171.3) (171.3)
Loss carry forwards 373.6 - 373.6
Gross deferred tax assets / (liabilities) 1,293.5 (752.4) 541.0
Netting by taxable entity (203.7) 203.7 -
Net deferred tax assets / (liabilities) 1,089.8 (548.7) 541.0
2009
Assets Liabilities Net
Property, plant and equipment 3.6 (209.9) (206.4)
Intangible assets 22.1 (399.7) (377.6)
Goodwill 155.1 - 155.1
Inventories 10.2 (2.2) 8.0
Trade and other receivables 23.2 - 23.2
Interest-bearing loans and borrowings 1.8 (97.5) (95.7)
Employee benefits 332.6 (39.8) 292.8
Provisions 426.3 (4.2) 422.1
Derivatives 174.9 - 174.9
Other items 59.7 (116.6) (56.9)
Loss carry forwards 526.9 - 526.9
Gross deferred tax assets / (liabilities) 1,736.2 (869.8) 866.3
Netting by taxable entity (367.6) 367.6 -
Net deferred tax assets / (liabilities) 1,368.5 (502.2) 866.3
Tax losses and negative bases of social contribution and temporary deductible differences in Brazil, on which the deferred income tax and social contribution were calculated, have no expiry date.
The expected utilization of consolidated tax losses is as follows:
2011 135.2
2012 196.3
2013 10.0
As of 2014 32.2
373.6
Part of the tax benefit corresponding to the tax loss carryforwards and temporary differences of
subsidiaries abroad was not recorded as an asset, as management is unable to determine whether
realization is probable.
The total unrecognized deferred tax assets related to tax loss carryforwards for these subsidiaries
amount to R$154.6 at December 31, 2010 (R$121.9 at December 31, 2009) for which the expiry
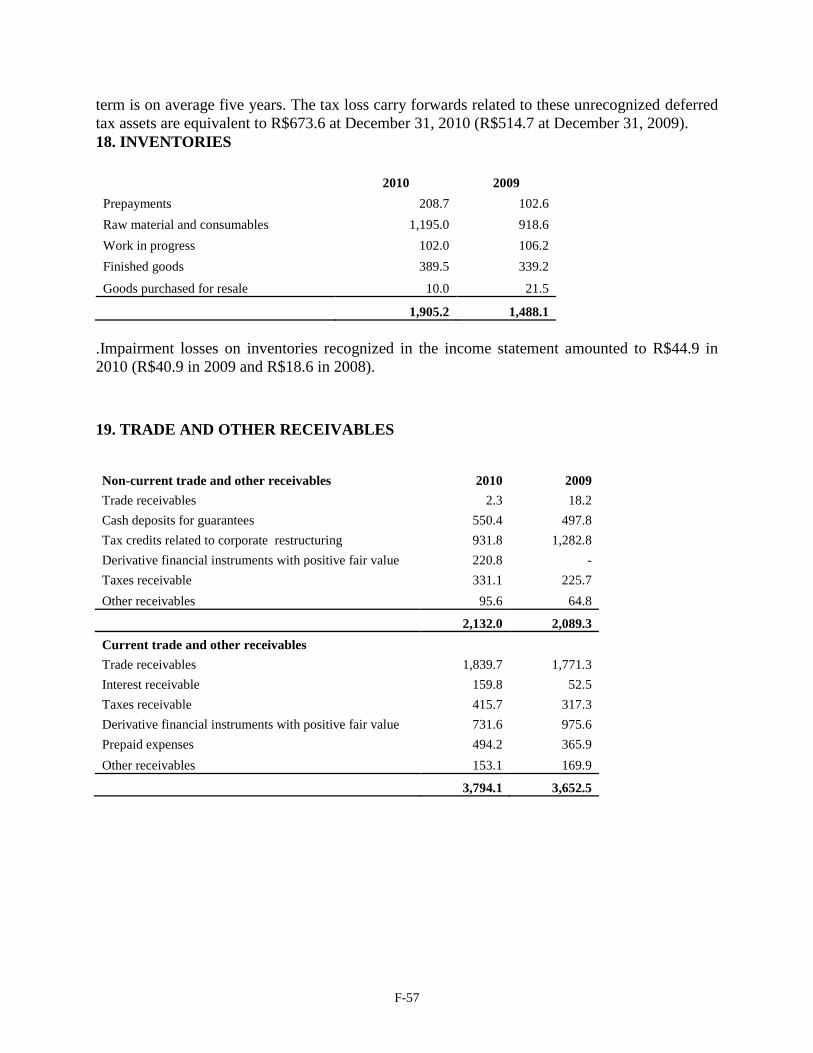
F-57
term is on average five years. The tax loss carry forwards related to these unrecognized deferred
tax assets are equivalent to R$673.6 at December 31, 2010 (R$514.7 at December 31, 2009).
18. INVENTORIES
2010 2009
Prepayments 208.7 102.6
Raw material and consumables 1,195.0 918.6
Work in progress 102.0 106.2
Finished goods 389.5 339.2
Goods purchased for resale 10.0 21.5
1,905.2 1,488.1
.Impairment losses on inventories recognized in the income statement amounted to R$44.9 in
2010 (R$40.9 in 2009 and R$18.6 in 2008).
19. TRADE AND OTHER RECEIVABLES
Non-current trade and other receivables 2010 2009
Trade receivables 2.3 18.2
Cash deposits for guarantees 550.4 497.8
Tax credits related to corporate restructuring 931.8 1,282.8
Derivative financial instruments with positive fair value 220.8 -
Taxes receivable 331.1 225.7
Other receivables 95.6 64.8
2,132.0 2,089.3
Current trade and other receivables
Trade receivables 1,839.7 1,771.3
Interest receivable 159.8 52.5
Taxes receivable 415.7 317.3
Derivative financial instruments with positive fair value 731.6 975.6
Prepaid expenses 494.2 365.9
Other receivables 153.1 169.9
3,794.1 3,652.5
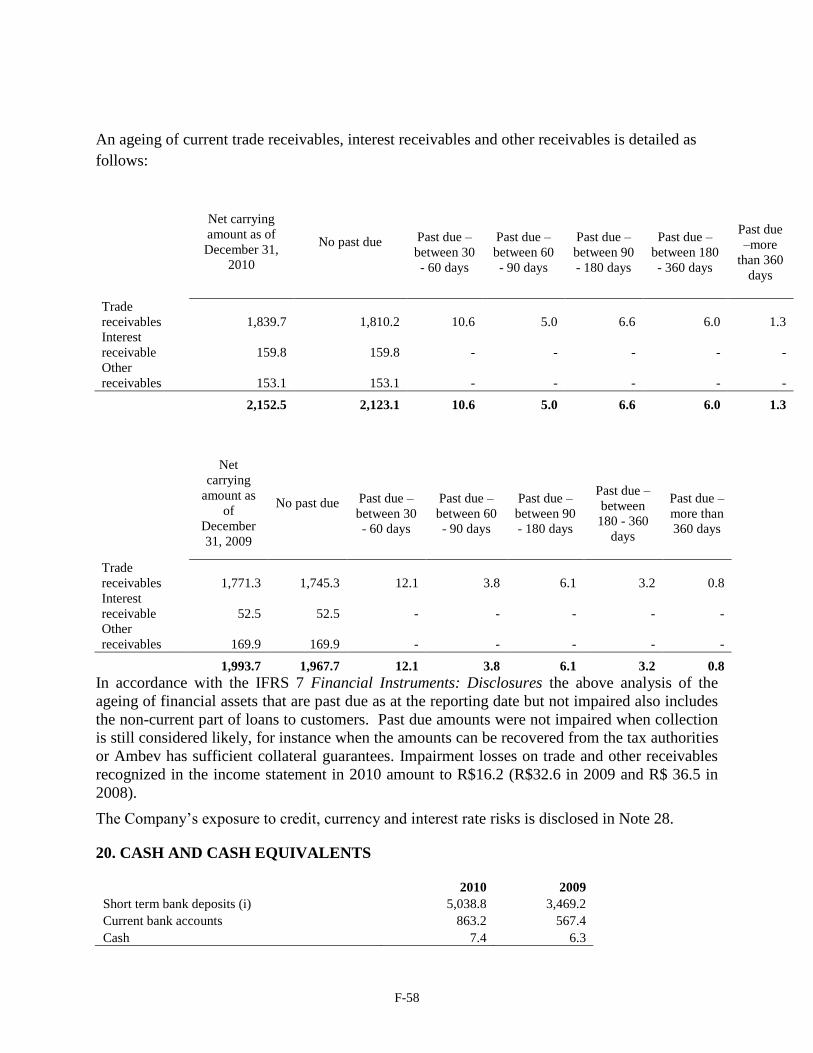
F-58
An ageing of current trade receivables, interest receivables and other receivables is detailed as
follows:
Net carrying
amount as of
December 31,
2010
No past due
Past due –
between 30
- 60 days
Past due –
between 60
- 90 days
Past due –
between 90
- 180 days
Past due –
between 180
- 360 days
Past due
–more
than 360
days
Trade
receivables 1,839.7 1,810.2
10.6
5.0
6.6
6.0
1.3
Interest
receivable 159.8 159.8
-
-
-
-
-
Other
receivables 153.1 153.1
-
-
-
-
-
2,152.5 2,123.1 10.6 5.0 6.6 6.0 1.3
Net
carrying
amount as
of
December
31, 2009
No past due
Past due –
between 30
- 60 days
Past due –
between 60
- 90 days
Past due –
between 90
- 180 days
Past due –
between
180 - 360
days
Past due –
more than
360 days
Trade
receivables 1,771.3 1,745.3 12.1 3.8 6.1 3.2 0.8
Interest
receivable 52.5 52.5 - - - - -
Other
receivables 169.9 169.9 - - - - -
1,993.7 1,967.7 12.1 3.8 6.1 3.2 0.8
In accordance with the IFRS 7 Financial Instruments: Disclosures the above analysis of the
ageing of financial assets that are past due as at the reporting date but not impaired also includes
the non-current part of loans to customers. Past due amounts were not impaired when collection
is still considered likely, for instance when the amounts can be recovered from the tax authorities
or Ambev has sufficient collateral guarantees. Impairment losses on trade and other receivables
recognized in the income statement in 2010 amount to R$16.2 (R$32.6 in 2009 and R$ 36.5 in
2008).
The Company’s exposure to credit, currency and interest rate risks is disclosed in Note 28.
20. CASH AND CASH EQUIVALENTS
2010 2009
Short term bank deposits (i) 5,038.8 3,469.2
Current bank accounts 863.2 567.4
Cash 7.4 6.3
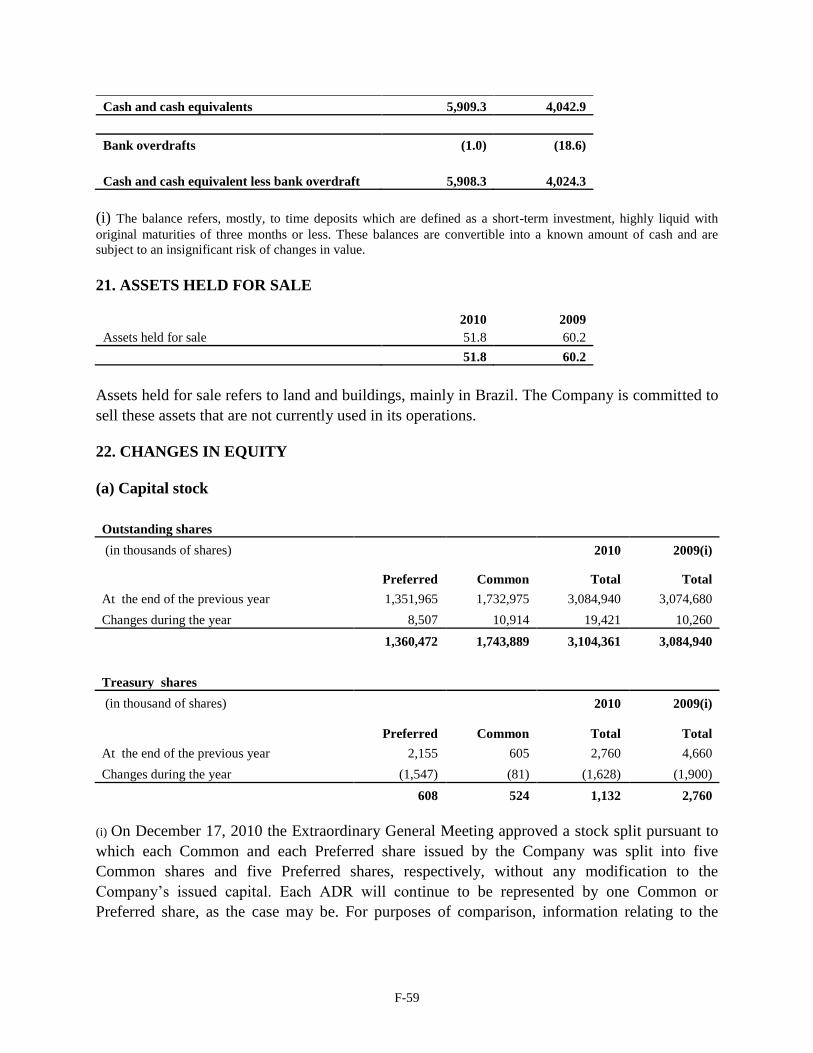
F-59
Cash and cash equivalents 5,909.3 4,042.9
Bank overdrafts (1.0) (18.6)
Cash and cash equivalent less bank overdraft 5,908.3 4,024.3
(i) The balance refers, mostly, to time deposits which are defined as a short-term investment, highly liquid with
original maturities of three months or less. These balances are convertible into a known amount of cash and are
subject to an insignificant risk of changes in value.
21. ASSETS HELD FOR SALE
2010 2009
Assets held for sale 51.8 60.2
51.8 60.2
Assets held for sale refers to land and buildings, mainly in Brazil. The Company is committed to
sell these assets that are not currently used in its operations.
22. CHANGES IN EQUITY
(a) Capital stock
Outstanding shares
(in thousands of shares)
2010 2009(i)
Preferred Common Total Total
At the end of the previous year 1,351,965 1,732,975 3,084,940 3,074,680
Changes during the year 8,507 10,914 19,421 10,260
1,360,472 1,743,889 3,104,361 3,084,940
Treasury shares
(in thousand of shares)
2010 2009(i)
Preferred Common Total Total
At the end of the previous year 2,155 605 2,760 4,660
Changes during the year (1,547) (81) (1,628) (1,900)
608 524 1,132 2,760
(i) On December 17, 2010 the Extraordinary General Meeting approved a stock split pursuant to
which each Common and each Preferred share issued by the Company was split into five
Common shares and five Preferred shares, respectively, without any modification to the
Company’s issued capital. Each ADR will continue to be represented by one Common or
Preferred share, as the case may be. For purposes of comparison, information relating to the
F-60
number of shares and earnings per share for all periods presented has been represented to
conform retrospectively to the effect of this split.
The Common shares have the right to vote at shareholder meetings. The Preferred shares are
non-voting (except when established in law), but have priority in the return of capital in the event
of liquidation and are entitled to a dividend premium of 10% over the amount paid to the
Common shareholders. Under our by-laws, we are required to distribute to shareholders as a
mandatory dividend in respect of each fiscal year ending on December 31 an amount not less
than 35% of our net income determined under Brazilian law, as adjusted in accordance with
applicable law, unless payment of such amount would be incompatible with Ambev’s financial
situation. The mandatory dividend includes amounts paid as Interest on shareholders’equity.
On December 31, 2010, the Company’s capital of R$7,613.8 (R$6,832.1 on December 31,
2009), was represented by 3,104,631 thousand shares of which 1,360,472 thousand were
Common shares and 1,743,889 thousand were Preferred shares, all without par value (in 2009
3,084,940 thousand shares, which 1,351,965 thousand Preferred shares and 1,732,975 thousand
Common shares).
Changes in equity during 2010
On September 27, 2010, the share capital was increased by R$246.4 through the subscription of
2.835 thousand Common shares and 4.660 thousand newly issued Preferred shares as determined
by the Extraordinary General Meeting of April, 28, 2010.
This capital increase resulted in a premium of R$8.3, as a consequence of the public subscription
of non-controlling interests in auction, which was appropriated to a share premium reserve.
The Extraordinary General Meeting held on April 28, 2010, approved the following changes to
capital:
Increase in the Company's capital of R$374.7 by issuing 8,080 thousand Common shares and
3,845 thousand Preferred shares in favor of Interbrew International BV and AmBrew S.A., the
Company’s controlling shareholders, corresponding to 70% of the tax benefit realized by the
Company upon the partial amortization of the special reserve of goodwill in 2009.
Increase in the Company's capital of R$160.6, corresponding to 30% of the tax benefit realized
by the Company upon the partial amortization of the special reserve of goodwill in 2009, without
issuing new shares.
Changes in equity during 2009
F-61
At the Board of Directors' Meeting held on July 30, 2009, the following changes to the
Company’s capital stock took place:
i) Capital stock increase of R$19.1 by means of the issuance of 720 thousand Preferred shares
fully subscribed by the Fundo de Investimentos do Nordeste – FINOR (Investment Fund of
Northeastern Brazil - FINOR) with resources related to income tax incentives.
ii) Capital stock increase in the amount of R$2.6, without the issuance of new shares, by
means of the capitalization of the "Tax incentive reserves – Reinvestment of Income Tax‖,
being R$0.6 related to fiscal year of 2004 and R$1.9 related to the fiscal year of 2006.
iii) Cancellation of 24 thousand Preferred shares, with the subscription price of R$91.86 that
were issued for subscription by FINOR at the Board of Directors meeting held on October 9,
2008, taking into consideration the process for payment of the respective resources in the
amount of R$(2.2) had not been concluded.
The Board of Directors, at the Meeting held on June 29, 2009, confirmed the subscription by the
shareholders of the Company of 1,415 thousand new Common shares and 2,280 thousand new
Preferred shares issued pursuant to the General Shareholders’ Meeting held on April 28, 2009,
representing, therefore, an increase in the capital stock of the Company in the amount of R$65.9.
At the Extraordinary General Meeting held on April 28, 2009, the following changes to the
Company’s capital stock were approved:
i) Capital stock increase of R$101.3 by means of the issuance of 4,020 thousand Common
shares and 1,945 thousand Preferred shares, in favor of Interbrew International B.V. and
AmBrew S/A, Company holdings, paid up by means of the capitalization of 70% of the tax
benefit resulting from the partial amortization of the special premium reserve during the fiscal
year of 2008;
ii) Capital stock increase of R$43.4, without issuance of new shares, corresponding to the
capitalization of 30% of tax benefit obtained by the Company with the partial amortization of
the special premium reserve during the fiscal year 2008.
(b)Authorized capital
The Company is authorized to increase its capital stock up to 3,500,000 thousand shares,
regardless of by-law amendment, upon the Board of Directors’ resolution, which may resolve on
the payment terms and conditions, characteristics of shares to be issued and issuance price, and
also establish whether the capital stock shall be increased by means of public or private
subscription.
F-62
(c)Interest on shareholders‟ equity / Dividends
Brazilian companies are permitted to distribute interest attributed to shareholders’ equity
calculated based on the Company’s shareholders equity (as adjusted) multiplied by the long-term
interest rate (TJLP). The TJLP is the long-term interest rate defined by the Central Bank and
used as reference in long-term loans provided by the BNDES.
Events during 2010:
The Board of Directors approved the distribution of dividends and interest on shareholder´s
equity of R$5,007.3, of which (a) R$3,213.1 in dividends and R$796 as interest on shareholder´s
equity, both of from profit of the year ended 2010 and b) R$707.8 in dividends, and R$289.6 as
interest on shareholder´s equity, which were deducted from the investment reserve.
The gross amount paid was R$1.70 per Preferred share and R$1,55 per Common share. As the
distribution of interest on shareholder´s equity is subject to withholding tax, the net distribution
was R$1,65 per Preferred share and R$1,50 per Common share.
These payments were made during 2010, as approved in Board of Directors, subject to
ratification at the Annual General Meeting referring to the fiscal year ended on December 31,
2010.
Interest on shareholder´s equity and dividends not claimed within three years revert back to the
Company. During 2010, the Company recognized R$6.3, (R$8.6 in 2009 and R$12.9 in 2008)
related to unclaimed interest on shareholders’ equity and dividends.
Events during the year 2009:
The Board of Directors approved the distribution of dividends and interest attributed to
shareholders’ equity, in the total amount of R$3,305.8, of which R$2,290.4 in dividends and
R$1,015.4 interests attributed to shareholders’ equity, both of them resulting from profit of year
ended 2009, to be attributed to the compulsory minimum dividends for the year 2009.
The gross amount paid per share were R$1.13 per preferred share and R$1.03 per common share.
The distribution of interest attributed to shareholders’ equity was taxed pursuant to the current
legislation, which resulted in a net distribution of R$1.08 per preferred share and R$0.98 per
common share.
These payments were made during 2009, as approved in Board of Directors meetings, and the
subsequent ratification was resolved at the Annual General Meeting referring to the fiscal year
ended on December 31, 2009.
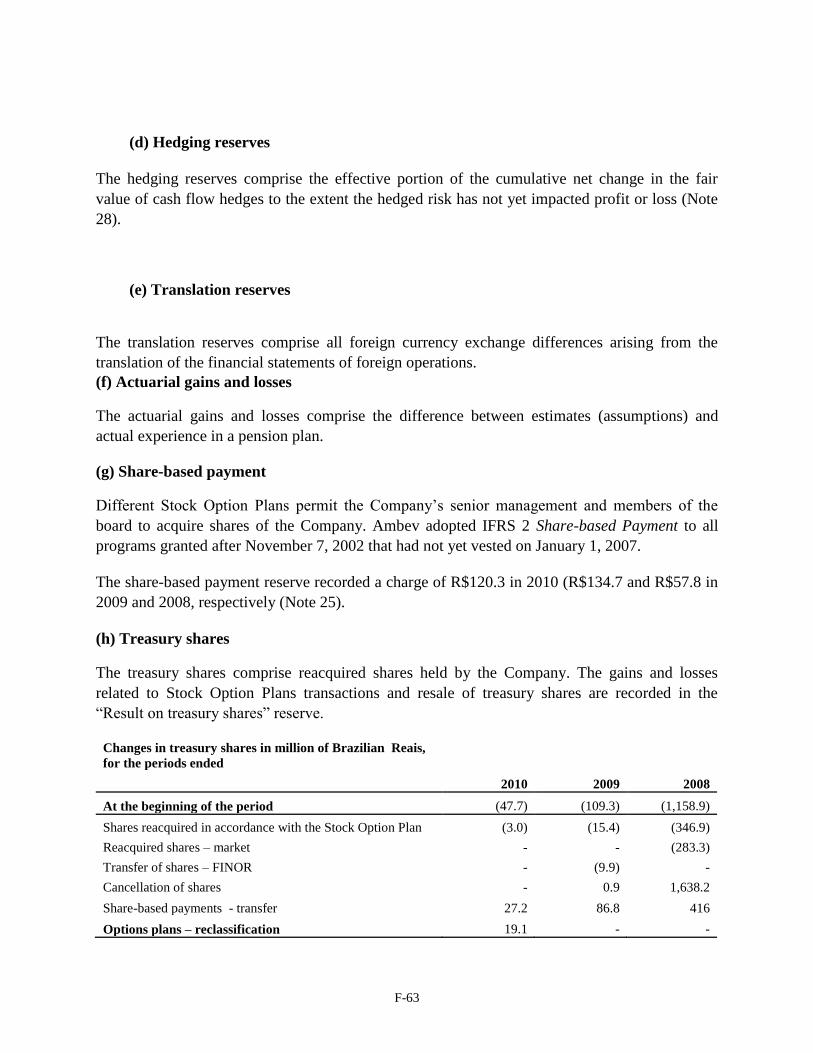
F-63
(d) Hedging reserves
The hedging reserves comprise the effective portion of the cumulative net change in the fair
value of cash flow hedges to the extent the hedged risk has not yet impacted profit or loss (Note
28).
(e) Translation reserves
The translation reserves comprise all foreign currency exchange differences arising from the
translation of the financial statements of foreign operations.
(f) Actuarial gains and losses
The actuarial gains and losses comprise the difference between estimates (assumptions) and
actual experience in a pension plan.
(g) Share-based payment
Different Stock Option Plans permit the Company’s senior management and members of the
board to acquire shares of the Company. Ambev adopted IFRS 2 Share-based Payment to all
programs granted after November 7, 2002 that had not yet vested on January 1, 2007.
The share-based payment reserve recorded a charge of R$120.3 in 2010 (R$134.7 and R$57.8 in
2009 and 2008, respectively (Note 25).
(h) Treasury shares
The treasury shares comprise reacquired shares held by the Company. The gains and losses
related to Stock Option Plans transactions and resale of treasury shares are recorded in the
―Result on treasury shares‖ reserve.
Changes in treasury shares in million of Brazilian Reais,
for the periods ended
2010 2009 2008
At the beginning of the period (47.7) (109.3) (1,158.9)
Shares reacquired in accordance with the Stock Option Plan (3.0) (15.4) (346.9)
Reacquired shares – market - - (283.3)
Transfer of shares – FINOR - (9.9) -
Cancellation of shares - 0.9 1,638.2
Share-based payments - transfer 27.2 86.8 416
Options plans – reclassification 19.1 - -

F-64
At the end of the period (4.4) (47.7) (109.3)
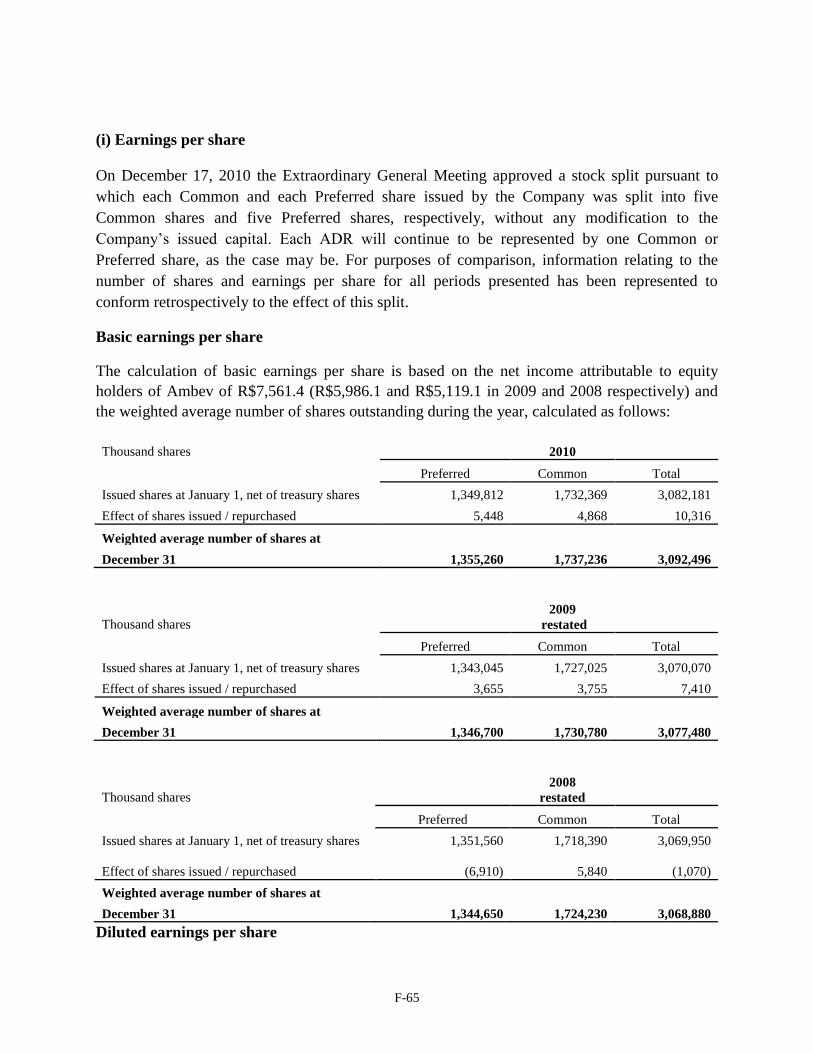
F-65
(i) Earnings per share
On December 17, 2010 the Extraordinary General Meeting approved a stock split pursuant to
which each Common and each Preferred share issued by the Company was split into five
Common shares and five Preferred shares, respectively, without any modification to the
Company’s issued capital. Each ADR will continue to be represented by one Common or
Preferred share, as the case may be. For purposes of comparison, information relating to the
number of shares and earnings per share for all periods presented has been represented to
conform retrospectively to the effect of this split.
Basic earnings per share
The calculation of basic earnings per share is based on the net income attributable to equity
holders of Ambev of R$7,561.4 (R$5,986.1 and R$5,119.1 in 2009 and 2008 respectively) and
the weighted average number of shares outstanding during the year, calculated as follows:
Thousand shares 2010
Preferred Common Total
Issued shares at January 1, net of treasury shares 1,349,812 1,732,369 3,082,181
Effect of shares issued / repurchased 5,448 4,868 10,316
Weighted average number of shares at
December 31 1,355,260 1,737,236 3,092,496
Thousand shares 2009
restated
Preferred Common Total
Issued shares at January 1, net of treasury shares 1,343,045 1,727,025 3,070,070
Effect of shares issued / repurchased 3,655 3,755 7,410
Weighted average number of shares at
December 31 1,346,700 1,730,780 3,077,480
Thousand shares
2008
restated
Preferred Common Total
Issued shares at January 1, net of treasury shares 1,351,560 1,718,390 3,069,950
Effect of shares issued / repurchased (6,910)
5,840
(1,070)
Weighted average number of shares at
December 31 1,344,650 1,724,230 3,068,880
Diluted earnings per share
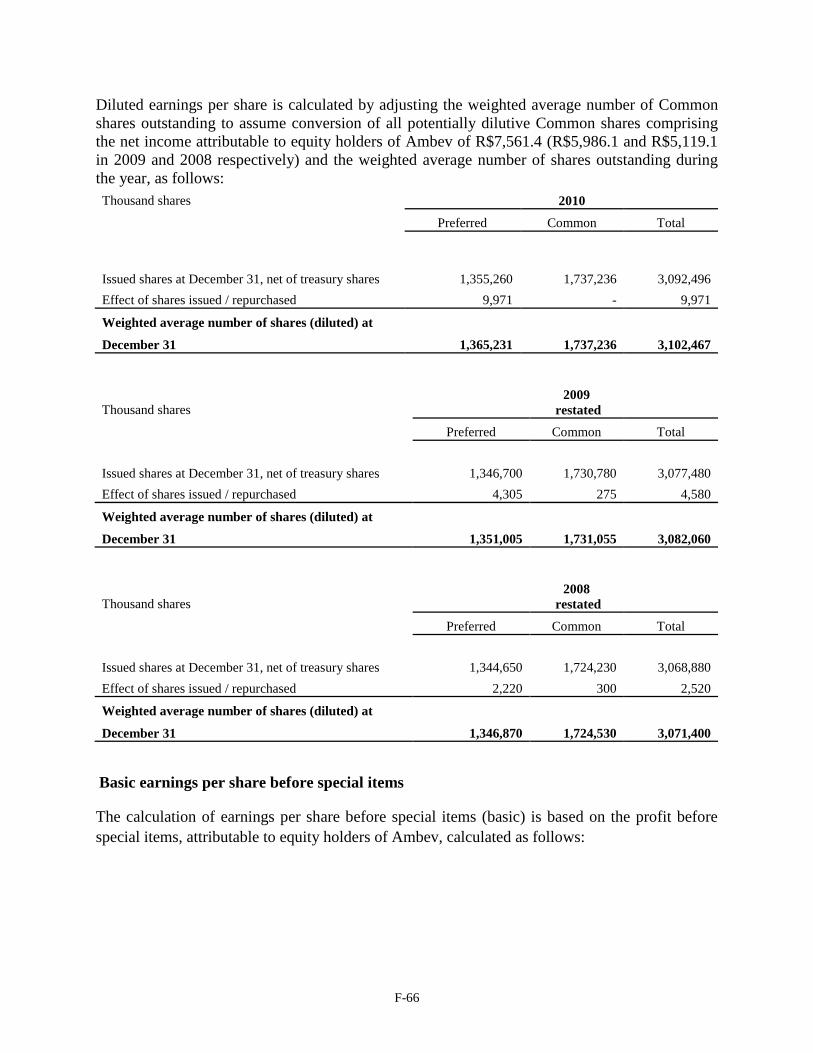
F-66
Diluted earnings per share is calculated by adjusting the weighted average number of Common
shares outstanding to assume conversion of all potentially dilutive Common shares comprising
the net income attributable to equity holders of Ambev of R$7,561.4 (R$5,986.1 and R$5,119.1
in 2009 and 2008 respectively) and the weighted average number of shares outstanding during
the year, as follows:
Thousand shares 2010
Preferred Common Total
Issued shares at December 31, net of treasury shares 1,355,260 1,737,236 3,092,496
Effect of shares issued / repurchased 9,971 - 9,971
Weighted average number of shares (diluted) at
1,365,231 1,737,236 3,102,467 December 31
Thousand shares
2009
restated
Preferred Common Total
Issued shares at December 31, net of treasury shares 1,346,700 1,730,780 3,077,480
Effect of shares issued / repurchased 4,305 275 4,580
Weighted average number of shares (diluted) at
1,351,005 1,731,055 3,082,060 December 31
Thousand shares
2008
restated
Preferred Common Total
Issued shares at December 31, net of treasury shares 1,344,650 1,724,230 3,068,880
Effect of shares issued / repurchased 2,220 300 2,520
Weighted average number of shares (diluted) at
1,346,870 1,724,530 3,071,400 December 31
Basic earnings per share before special items
The calculation of earnings per share before special items (basic) is based on the profit before
special items, attributable to equity holders of Ambev, calculated as follows:
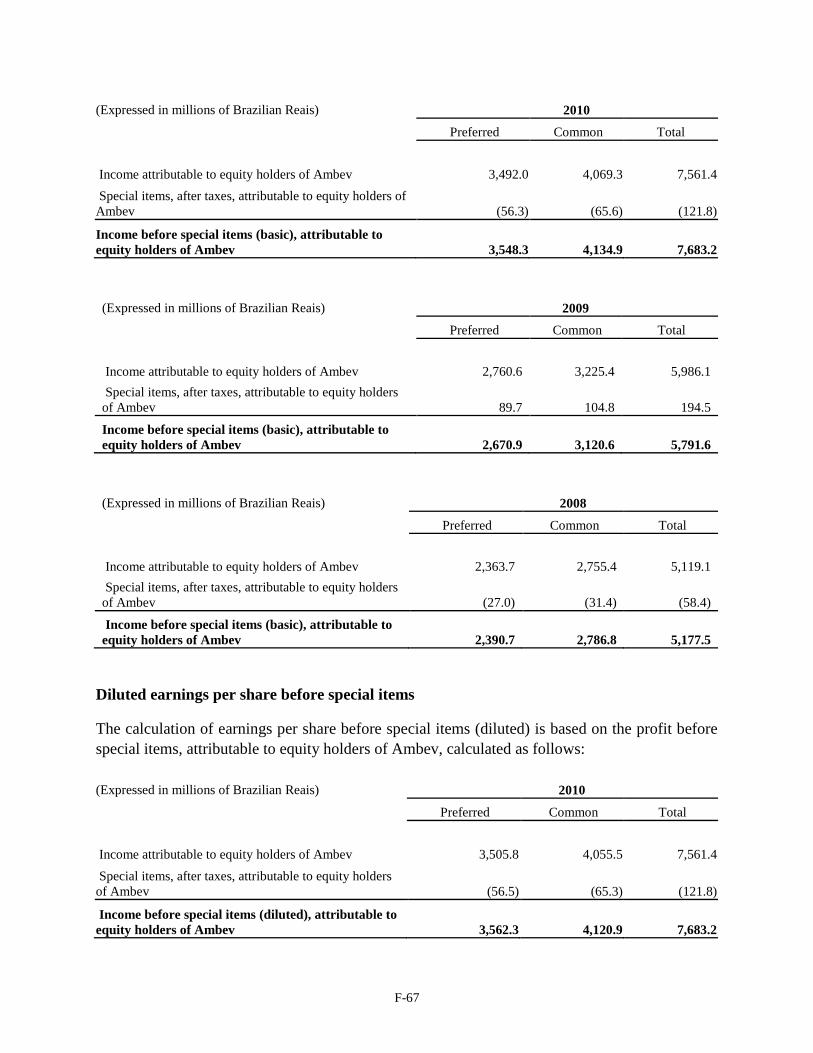
F-67
(Expressed in millions of Brazilian Reais) 2010
Preferred Common Total
Income attributable to equity holders of Ambev 3,492.0 4,069.3 7,561.4
Special items, after taxes, attributable to equity holders of
Ambev (56.3) (65.6) (121.8)
Income before special items (basic), attributable to
equity holders of Ambev 3,548.3 4,134.9 7,683.2
(Expressed in millions of Brazilian Reais) 2009
Preferred Common Total
Income attributable to equity holders of Ambev 2,760.6 3,225.4 5,986.1
Special items, after taxes, attributable to equity holders
of Ambev 89.7 104.8 194.5
Income before special items (basic), attributable to
equity holders of Ambev 2,670.9 3,120.6 5,791.6
(Expressed in millions of Brazilian Reais) 2008
Preferred Common Total
Income attributable to equity holders of Ambev 2,363.7 2,755.4 5,119.1
Special items, after taxes, attributable to equity holders
of Ambev (27.0) (31.4) (58.4)
Income before special items (basic), attributable to
equity holders of Ambev 2,390.7 2,786.8 5,177.5
Diluted earnings per share before special items
The calculation of earnings per share before special items (diluted) is based on the profit before
special items, attributable to equity holders of Ambev, calculated as follows:
(Expressed in millions of Brazilian Reais) 2010
Preferred Common Total
Income attributable to equity holders of Ambev 3,505.8 4,055.5 7,561.4
Special items, after taxes, attributable to equity holders
of Ambev (56.5) (65.3) (121.8)
Income before special items (diluted), attributable to
equity holders of Ambev 3,562.3 4,120.9 7,683.2
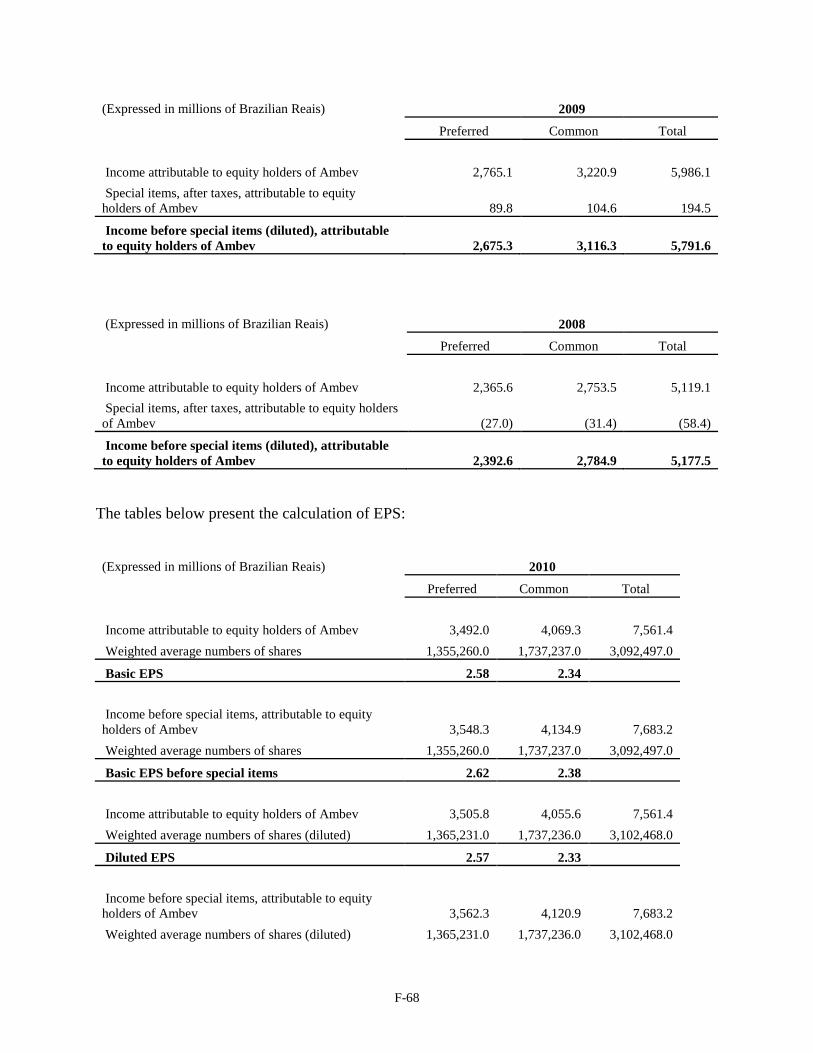
F-68
(Expressed in millions of Brazilian Reais) 2009
Preferred Common Total
Income attributable to equity holders of Ambev 2,765.1 3,220.9 5,986.1
Special items, after taxes, attributable to equity
holders of Ambev 89.8 104.6 194.5
Income before special items (diluted), attributable
to equity holders of Ambev 2,675.3 3,116.3 5,791.6
(Expressed in millions of Brazilian Reais) 2008
Preferred Common Total
Income attributable to equity holders of Ambev 2,365.6 2,753.5 5,119.1
Special items, after taxes, attributable to equity holders
of Ambev (27.0) (31.4) (58.4)
Income before special items (diluted), attributable
to equity holders of Ambev 2,392.6 2,784.9 5,177.5
The tables below present the calculation of EPS:
(Expressed in millions of Brazilian Reais) 2010
Preferred Common Total
Income attributable to equity holders of Ambev 3,492.0 4,069.3 7,561.4
Weighted average numbers of shares 1,355,260.0 1,737,237.0 3,092,497.0
Basic EPS 2.58 2.34
Income before special items, attributable to equity
holders of Ambev 3,548.3 4,134.9 7,683.2
Weighted average numbers of shares 1,355,260.0 1,737,237.0 3,092,497.0
Basic EPS before special items 2.62 2.38
Income attributable to equity holders of Ambev 3,505.8 4,055.6 7,561.4
Weighted average numbers of shares (diluted) 1,365,231.0 1,737,236.0 3,102,468.0
Diluted EPS 2.57 2.33
Income before special items, attributable to equity
holders of Ambev 3,562.3 4,120.9 7,683.2
Weighted average numbers of shares (diluted) 1,365,231.0 1,737,236.0 3,102,468.0

F-69
Diluted EPS before special items 2.61 2.37
(Expressed in millions of Brazilian Reais)
2009
restated
Preferred Common Total
Income attributable to equity holders of Ambev 2,760.6 3,225.4 5,986.1
Weighted average numbers of shares 1,346,700.0 1,730,780.0 3,077,480.0
Basic EPS 2.05 1.86
Income before special items, attributable to equity
holders of Ambev 2,670.9 3,120.6 5,791.6
Weighted average numbers of shares 1,346,700.0 1,730,780.0 3,077,480.0
Basic EPS before special items 1.98 1.80
Income attributable to equity holders of Ambev 2,765.1 3,220.9 5,986.1
Weighted average numbers of shares (diluted) 1,351,005.0 1,731,055.0 3,082,060.0
Diluted EPS 2.05 1.86
Income before special items, attributable to equity
holders of Ambev 2,675.3 3,116.3 5,791.6
Weighted average numbers of shares (diluted) 1,351,005.0 1,731,055.0 3,082,060.0
Diluted EPS before special items 1.98 1.80
(Expressed in millions of Brazilian Reais)
2008
restated
Preferred Common Total
Income attributable to equity holders of 2,363.7 2,755.4 5,119.1
Weighted average numbers of shares 1,344,650.0 1,724,230.0 3,068,880.0
Basic EPS 1.76 1.60
Income before special items, attributable to equity
holders of Ambev 2,390.7 2,786.8 5,177.5
Weighted average numbers of shares 1,344,650.0 1,724,230.0 3,068,880.0
Basic EPS before special items 1.78 1.62
Income attributable to equity holders of Ambev 2,365.6 2,753.5 5,119.1
Weighted average numbers of shares (diluted) 1,346,870.0 1,724,530.0 3,071,400.0
Diluted EPS 1.76 1.60
Income before special items, attributable to equity
holders of Ambev 2,392.6 2,784.9 5,177.5
Weighted average numbers of shares (diluted) 1,346,870.0 1,724,530.0 3,071,400.0
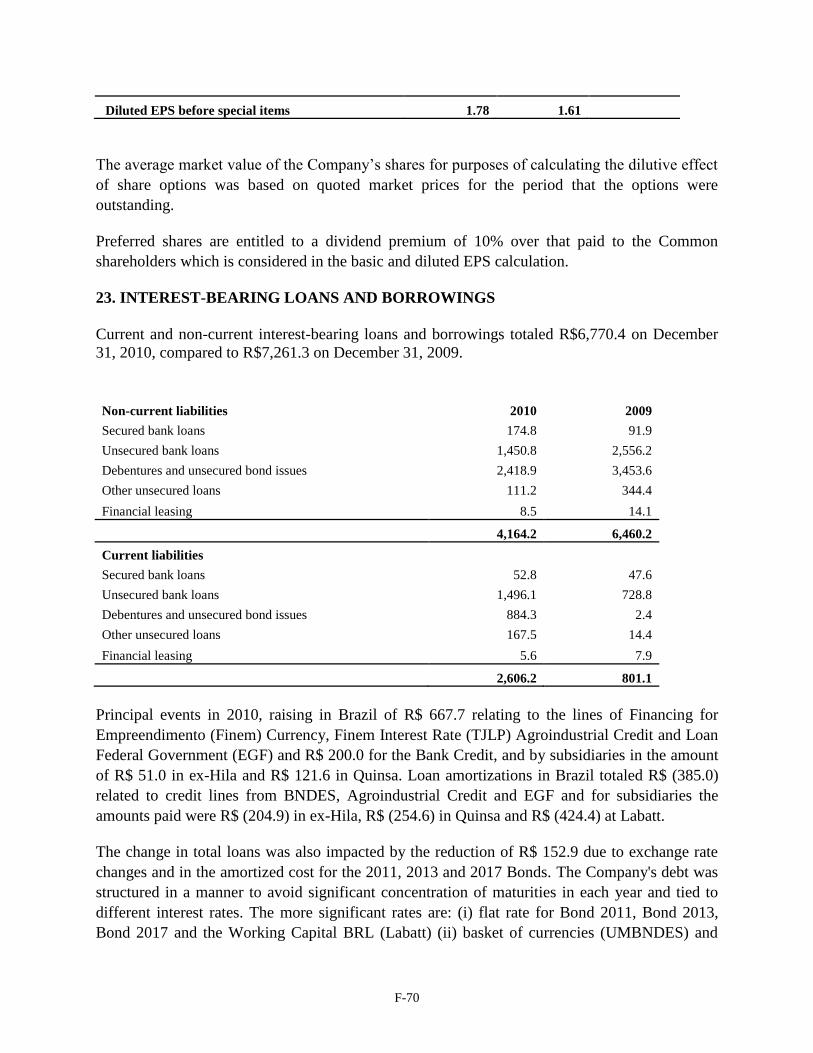
F-70
Diluted EPS before special items 1.78 1.61
The average market value of the Company’s shares for purposes of calculating the dilutive effect
of share options was based on quoted market prices for the period that the options were
outstanding.
Preferred shares are entitled to a dividend premium of 10% over that paid to the Common
shareholders which is considered in the basic and diluted EPS calculation.
23. INTEREST-BEARING LOANS AND BORROWINGS
Current and non-current interest-bearing loans and borrowings totaled R$6,770.4 on December
31, 2010, compared to R$7,261.3 on December 31, 2009.
Non-current liabilities 2010 2009
Secured bank loans 174.8 91.9
Unsecured bank loans 1,450.8 2,556.2
Debentures and unsecured bond issues 2,418.9 3,453.6
Other unsecured loans 111.2 344.4
Financial leasing 8.5 14.1
4,164.2 6,460.2
Current liabilities
Secured bank loans 52.8 47.6
Unsecured bank loans 1,496.1 728.8
Debentures and unsecured bond issues 884.3 2.4
Other unsecured loans 167.5 14.4
Financial leasing 5.6 7.9
2,606.2 801.1
Principal events in 2010, raising in Brazil of R$ 667.7 relating to the lines of Financing for
Empreendimento (Finem) Currency, Finem Interest Rate (TJLP) Agroindustrial Credit and Loan
Federal Government (EGF) and R$ 200.0 for the Bank Credit, and by subsidiaries in the amount
of R$ 51.0 in ex-Hila and R$ 121.6 in Quinsa. Loan amortizations in Brazil totaled R$ (385.0)
related to credit lines from BNDES, Agroindustrial Credit and EGF and for subsidiaries the
amounts paid were R$ (204.9) in ex-Hila, R$ (254.6) in Quinsa and R$ (424.4) at Labatt.
The change in total loans was also impacted by the reduction of R$ 152.9 due to exchange rate
changes and in the amortized cost for the 2011, 2013 and 2017 Bonds. The Company's debt was
structured in a manner to avoid significant concentration of maturities in each year and tied to
different interest rates. The more significant rates are: (i) flat rate for Bond 2011, Bond 2013,
Bond 2017 and the Working Capital BRL (Labatt) (ii) basket of currencies (UMBNDES) and
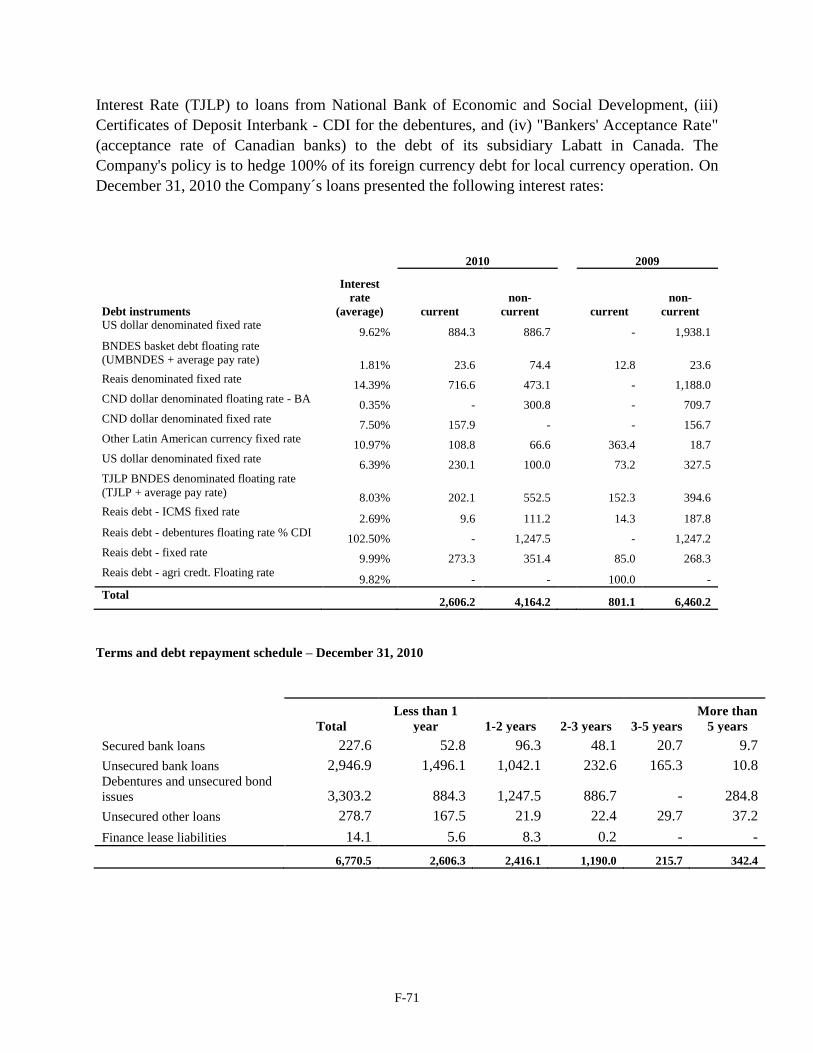
F-71
Interest Rate (TJLP) to loans from National Bank of Economic and Social Development, (iii)
Certificates of Deposit Interbank - CDI for the debentures, and (iv) "Bankers' Acceptance Rate"
(acceptance rate of Canadian banks) to the debt of its subsidiary Labatt in Canada. The
Company's policy is to hedge 100% of its foreign currency debt for local currency operation. On
December 31, 2010 the Company´s loans presented the following interest rates:
2010
2009
Debt instruments
Interest
rate
(average) current
non-
current
current
non-
current
US dollar denominated fixed rate 9.62% 884.3 886.7
- 1,938.1
BNDES basket debt floating rate
(UMBNDES + average pay rate) 1.81% 23.6 74.4
12.8 23.6
Reais denominated fixed rate 14.39% 716.6 473.1
- 1,188.0
CND dollar denominated floating rate - BA 0.35% - 300.8
- 709.7
CND dollar denominated fixed rate 7.50% 157.9 -
- 156.7
Other Latin American currency fixed rate 10.97% 108.8 66.6
363.4 18.7
US dollar denominated fixed rate 6.39% 230.1 100.0
73.2 327.5
TJLP BNDES denominated floating rate
(TJLP + average pay rate) 8.03% 202.1 552.5
152.3 394.6
Reais debt - ICMS fixed rate 2.69% 9.6 111.2
14.3 187.8
Reais debt - debentures floating rate % CDI 102.50% - 1,247.5
- 1,247.2
Reais debt - fixed rate 9.99% 273.3 351.4
85.0 268.3
Reais debt - agri credt. Floating rate 9.82% - -
100.0 -
Total
2,606.2 4,164.2
801.1 6,460.2
Terms and debt repayment schedule – December 31, 2010
Total
Less than 1
year 1-2 years 2-3 years 3-5 years
More than
5 years
Secured bank loans 227.6 52.8 96.3 48.1 20.7 9.7
Unsecured bank loans 2,946.9 1,496.1 1,042.1 232.6 165.3 10.8 Debentures and unsecured bond
issues 3,303.2 884.3 1,247.5 886.7 - 284.8
Unsecured other loans 278.7 167.5 21.9 22.4 29.7 37.2
Finance lease liabilities 14.1 5.6 8.3 0.2 - -
6,770.5 2,606.3 2,416.1 1,190.0 215.7 342.4
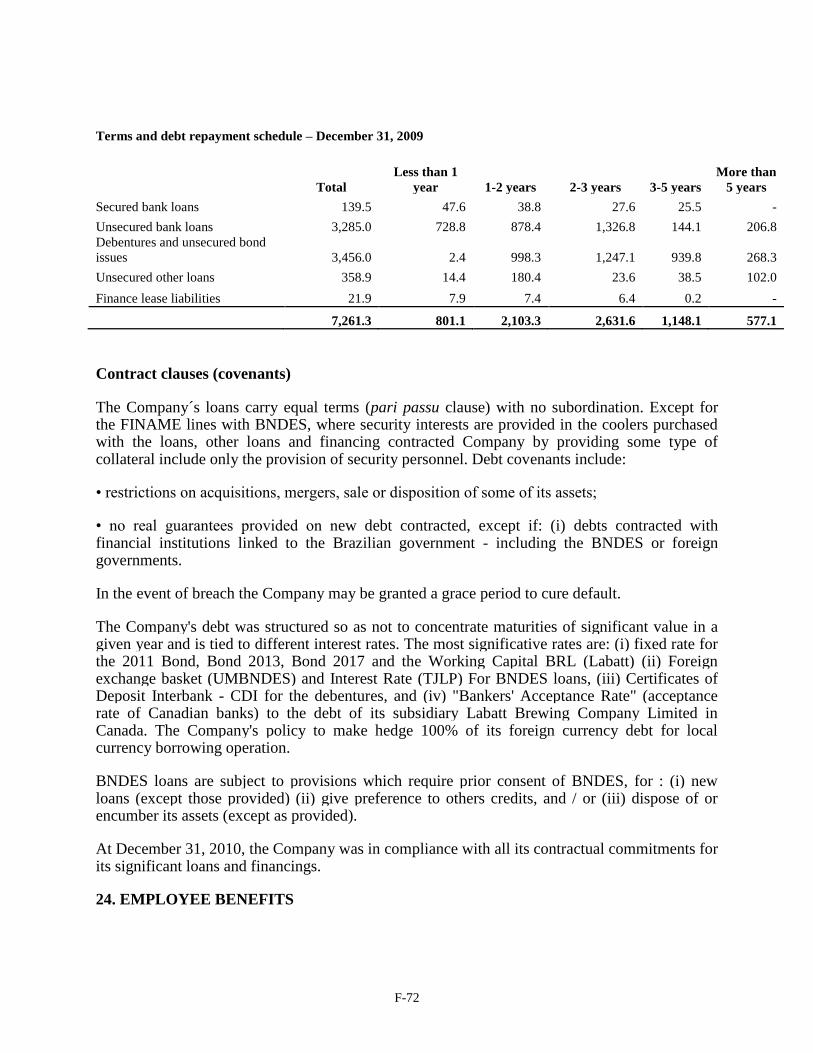
F-72
Terms and debt repayment schedule – December 31, 2009
Total
Less than 1
year 1-2 years 2-3 years 3-5 years
More than
5 years
Secured bank loans 139.5 47.6 38.8 27.6 25.5 -
Unsecured bank loans 3,285.0 728.8 878.4 1,326.8 144.1 206.8
Debentures and unsecured bond
issues 3,456.0 2.4 998.3 1,247.1 939.8 268.3
Unsecured other loans 358.9 14.4 180.4 23.6 38.5 102.0
Finance lease liabilities 21.9 7.9 7.4 6.4 0.2 -
7,261.3 801.1 2,103.3 2,631.6 1,148.1 577.1
Contract clauses (covenants)
The Company´s loans carry equal terms (pari passu clause) with no subordination. Except for the FINAME lines with BNDES, where security interests are provided in the coolers purchased with the loans, other loans and financing contracted Company by providing some type of collateral include only the provision of security personnel. Debt covenants include:
• restrictions on acquisitions, mergers, sale or disposition of some of its assets;
• no real guarantees provided on new debt contracted, except if: (i) debts contracted with financial institutions linked to the Brazilian government - including the BNDES or foreign governments.
In the event of breach the Company may be granted a grace period to cure default.
The Company's debt was structured so as not to concentrate maturities of significant value in a given year and is tied to different interest rates. The most significative rates are: (i) fixed rate for the 2011 Bond, Bond 2013, Bond 2017 and the Working Capital BRL (Labatt) (ii) Foreign exchange basket (UMBNDES) and Interest Rate (TJLP) For BNDES loans, (iii) Certificates of Deposit Interbank - CDI for the debentures, and (iv) "Bankers' Acceptance Rate" (acceptance rate of Canadian banks) to the debt of its subsidiary Labatt Brewing Company Limited in Canada. The Company's policy to make hedge 100% of its foreign currency debt for local currency borrowing operation.
BNDES loans are subject to provisions which require prior consent of BNDES, for : (i) new loans (except those provided) (ii) give preference to others credits, and / or (iii) dispose of or encumber its assets (except as provided).
At December 31, 2010, the Company was in compliance with all its contractual commitments for its significant loans and financings.
24. EMPLOYEE BENEFITS
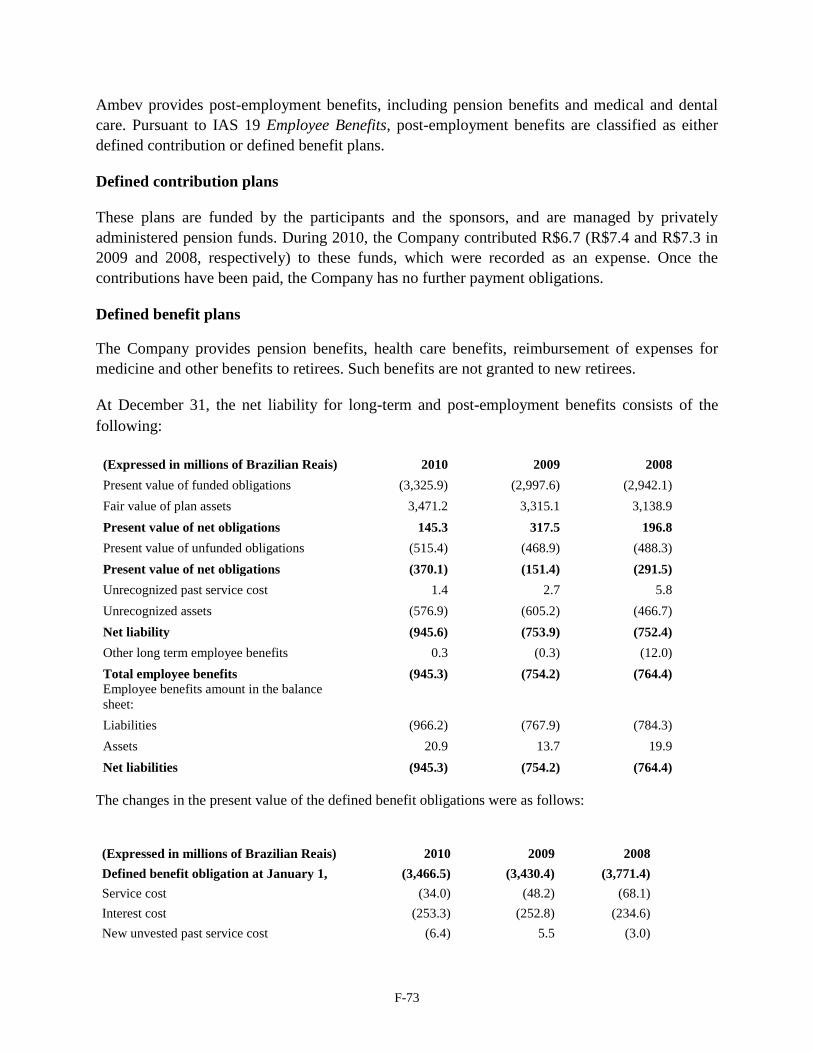
F-73
Ambev provides post-employment benefits, including pension benefits and medical and dental
care. Pursuant to IAS 19 Employee Benefits, post-employment benefits are classified as either
defined contribution or defined benefit plans.
Defined contribution plans
These plans are funded by the participants and the sponsors, and are managed by privately
administered pension funds. During 2010, the Company contributed R$6.7 (R$7.4 and R$7.3 in
2009 and 2008, respectively) to these funds, which were recorded as an expense. Once the
contributions have been paid, the Company has no further payment obligations.
Defined benefit plans
The Company provides pension benefits, health care benefits, reimbursement of expenses for
medicine and other benefits to retirees. Such benefits are not granted to new retirees.
At December 31, the net liability for long-term and post-employment benefits consists of the
following:
(Expressed in millions of Brazilian Reais) 2010 2009 2008
Present value of funded obligations (3,325.9) (2,997.6) (2,942.1)
Fair value of plan assets 3,471.2 3,315.1 3,138.9
Present value of net obligations 145.3 317.5 196.8
Present value of unfunded obligations (515.4) (468.9) (488.3)
Present value of net obligations (370.1) (151.4) (291.5)
Unrecognized past service cost 1.4 2.7 5.8
Unrecognized assets (576.9) (605.2) (466.7)
Net liability (945.6) (753.9) (752.4)
Other long term employee benefits 0.3 (0.3) (12.0)
Total employee benefits (945.3) (754.2) (764.4)
Employee benefits amount in the balance
sheet:
Liabilities (966.2) (767.9) (784.3)
Assets 20.9 13.7 19.9
Net liabilities (945.3) (754.2) (764.4)
The changes in the present value of the defined benefit obligations were as follows:
(Expressed in millions of Brazilian Reais) 2010 2009 2008
Defined benefit obligation at January 1, (3,466.5) (3,430.4) (3,771.4)
Service cost (34.0) (48.2) (68.1)
Interest cost (253.3) (252.8) (234.6)
New unvested past service cost (6.4) 5.5 (3.0)
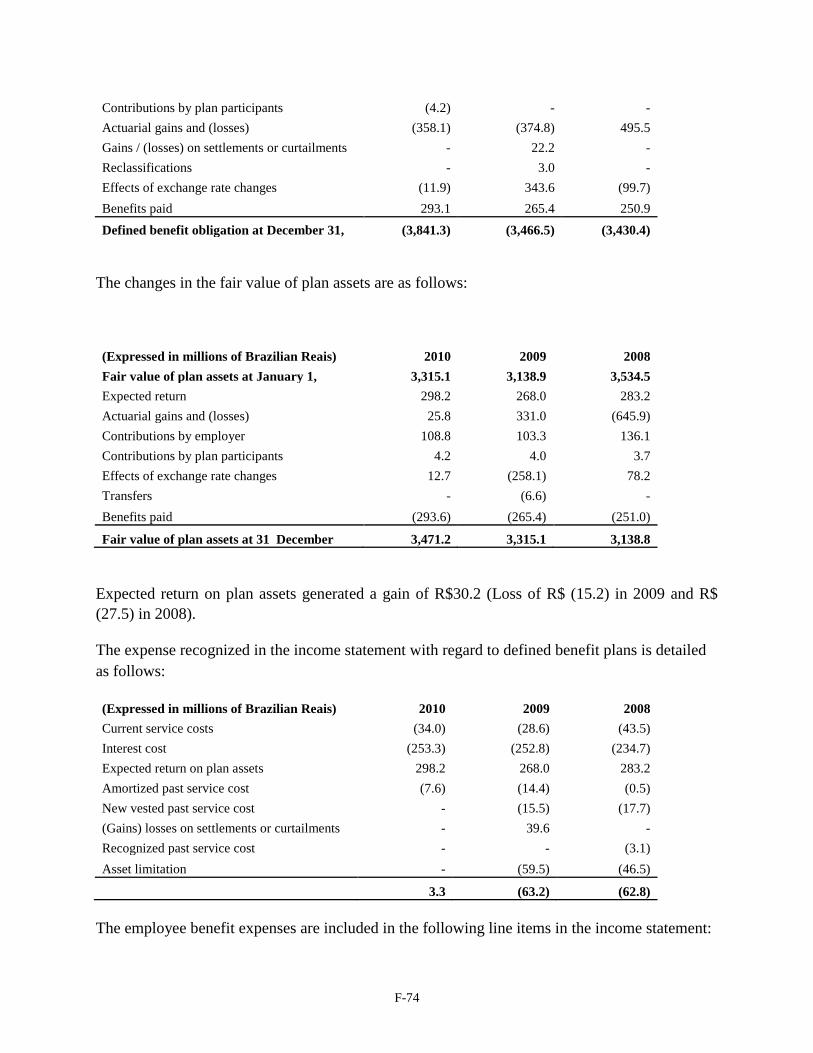
F-74
Contributions by plan participants (4.2) - -
Actuarial gains and (losses) (358.1) (374.8) 495.5
Gains / (losses) on settlements or curtailments - 22.2 -
Reclassifications - 3.0 -
Effects of exchange rate changes (11.9) 343.6 (99.7)
Benefits paid 293.1 265.4 250.9
Defined benefit obligation at December 31, (3,841.3) (3,466.5) (3,430.4)
The changes in the fair value of plan assets are as follows:
(Expressed in millions of Brazilian Reais) 2010 2009 2008
Fair value of plan assets at January 1, 3,315.1 3,138.9 3,534.5
Expected return 298.2 268.0 283.2
Actuarial gains and (losses) 25.8 331.0 (645.9)
Contributions by employer 108.8 103.3 136.1
Contributions by plan participants 4.2 4.0 3.7
Effects of exchange rate changes 12.7 (258.1) 78.2
Transfers - (6.6) -
Benefits paid (293.6) (265.4) (251.0)
Fair value of plan assets at 31 December 3,471.2 3,315.1 3,138.8
Expected return on plan assets generated a gain of R$30.2 (Loss of R$ (15.2) in 2009 and R$
(27.5) in 2008).
The expense recognized in the income statement with regard to defined benefit plans is detailed
as follows:
(Expressed in millions of Brazilian Reais) 2010 2009 2008
Current service costs (34.0) (28.6) (43.5)
Interest cost (253.3) (252.8) (234.7)
Expected return on plan assets 298.2 268.0 283.2
Amortized past service cost (7.6) (14.4) (0.5)
New vested past service cost - (15.5) (17.7)
(Gains) losses on settlements or curtailments - 39.6 -
Recognized past service cost - - (3.1)
Asset limitation - (59.5) (46.5)
3.3 (63.2) (62.8)
The employee benefit expenses are included in the following line items in the income statement:
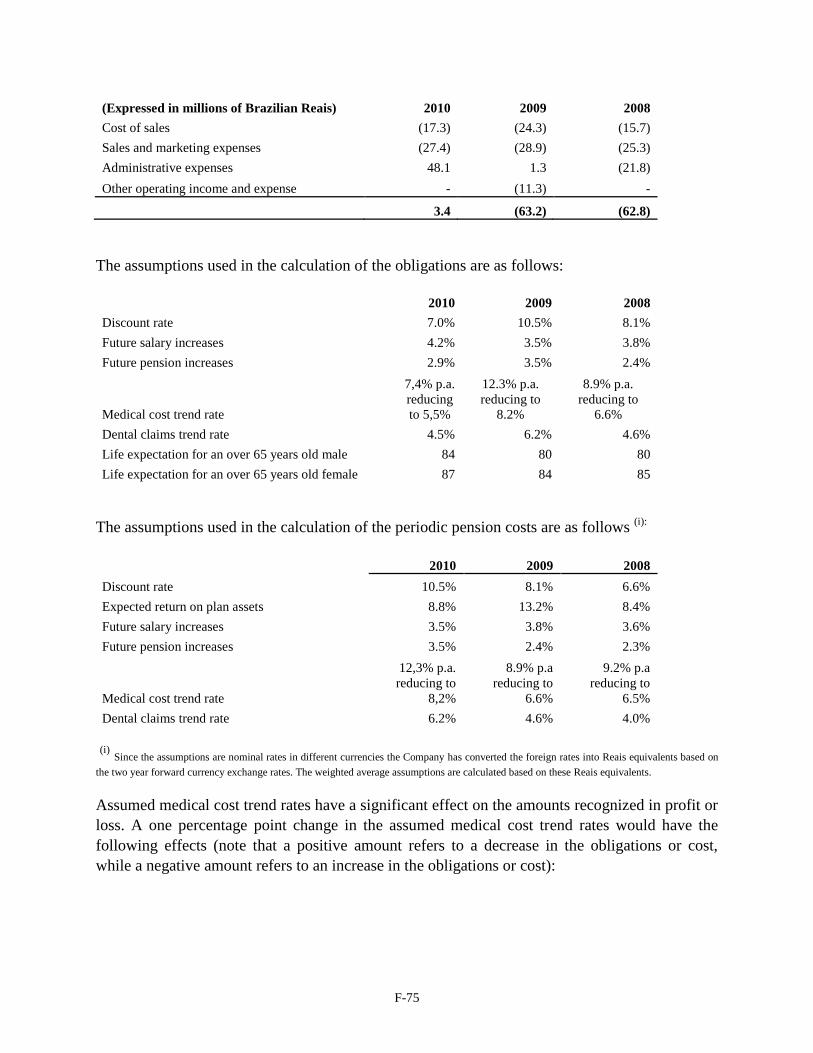
F-75
(Expressed in millions of Brazilian Reais) 2010 2009 2008
Cost of sales (17.3) (24.3) (15.7)
Sales and marketing expenses (27.4) (28.9) (25.3)
Administrative expenses 48.1 1.3 (21.8)
Other operating income and expense - (11.3) -
3.4 (63.2) (62.8)
The assumptions used in the calculation of the obligations are as follows:
2010 2009 2008
Discount rate 7.0% 10.5% 8.1%
Future salary increases 4.2% 3.5% 3.8%
Future pension increases 2.9% 3.5% 2.4%
Medical cost trend rate
7,4% p.a.
reducing
to 5,5%
12.3% p.a.
reducing to
8.2%
8.9% p.a.
reducing to
6.6%
Dental claims trend rate 4.5% 6.2% 4.6%
Life expectation for an over 65 years old male 84 80 80
Life expectation for an over 65 years old female 87 84 85
The assumptions used in the calculation of the periodic pension costs are as follows (i):
2010 2009 2008
Discount rate 10.5% 8.1% 6.6%
Expected return on plan assets 8.8% 13.2% 8.4%
Future salary increases 3.5% 3.8% 3.6%
Future pension increases 3.5% 2.4% 2.3%
Medical cost trend rate
12,3% p.a.
reducing to
8,2%
8.9% p.a
reducing to
6.6%
9.2% p.a
reducing to
6.5%
Dental claims trend rate 6.2% 4.6% 4.0%
(i)
Since the assumptions are nominal rates in different currencies the Company has converted the foreign rates into Reais equivalents based on
the two year forward currency exchange rates. The weighted average assumptions are calculated based on these Reais equivalents.
Assumed medical cost trend rates have a significant effect on the amounts recognized in profit or
loss. A one percentage point change in the assumed medical cost trend rates would have the
following effects (note that a positive amount refers to a decrease in the obligations or cost,
while a negative amount refers to an increase in the obligations or cost):
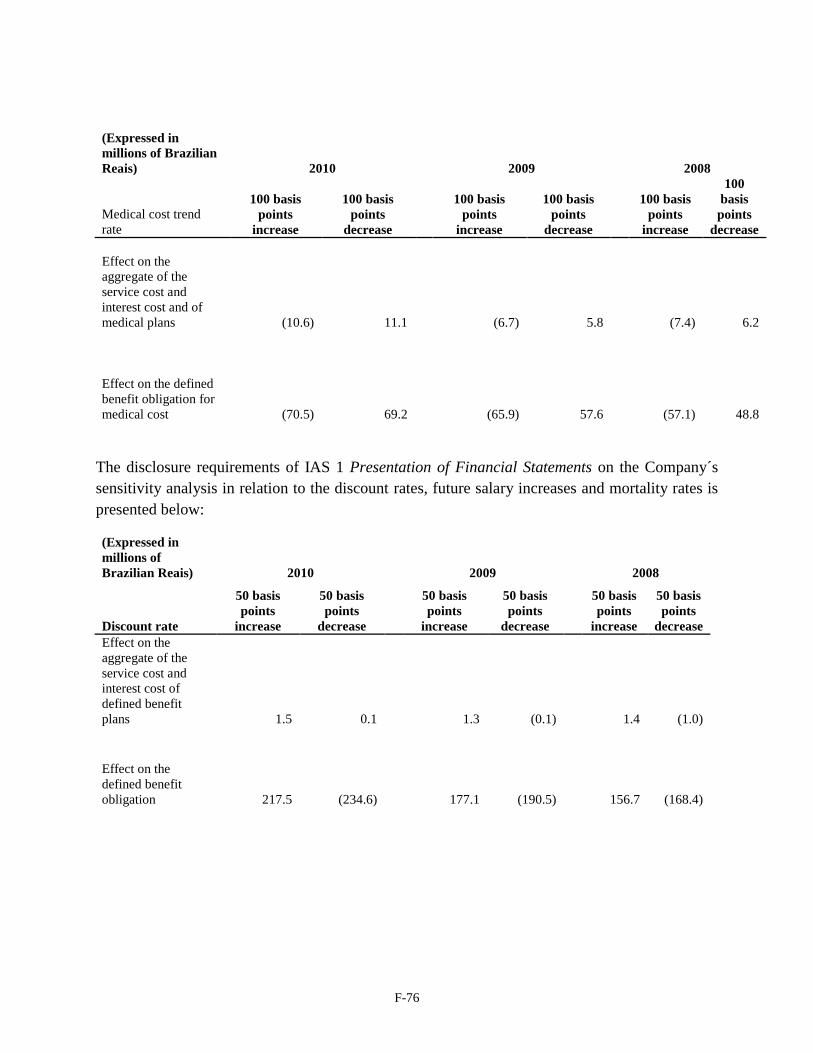
F-76
(Expressed in
millions of Brazilian
Reais) 2010
2009
2008
Medical cost trend
rate
100 basis
points
increase
100 basis
points
decrease
100 basis
points
increase
100 basis
points
decrease
100 basis
points
increase
100
basis
points
decrease
Effect on the
aggregate of the
service cost and
interest cost and of
medical plans
(10.6)
11.1
(6.7)
5.8
(7.4)
6.2
Effect on the defined
benefit obligation for
medical cost
(70.5)
69.2
(65.9)
57.6
(57.1)
48.8
The disclosure requirements of IAS 1 Presentation of Financial Statements on the Company´s
sensitivity analysis in relation to the discount rates, future salary increases and mortality rates is
presented below:
(Expressed in
millions of
Brazilian Reais) 2010
2009
2008
Discount rate
50 basis
points
increase
50 basis
points
decrease
50 basis
points
increase
50 basis
points
decrease
50 basis
points
increase
50 basis
points
decrease
Effect on the
aggregate of the
service cost and
interest cost of
defined benefit
plans
1.5
0.1
1.3
(0.1)
1.4
(1.0)
Effect on the
defined benefit
obligation
217.5
(234.6)
177.1
(190.5)
156.7
(168.4)
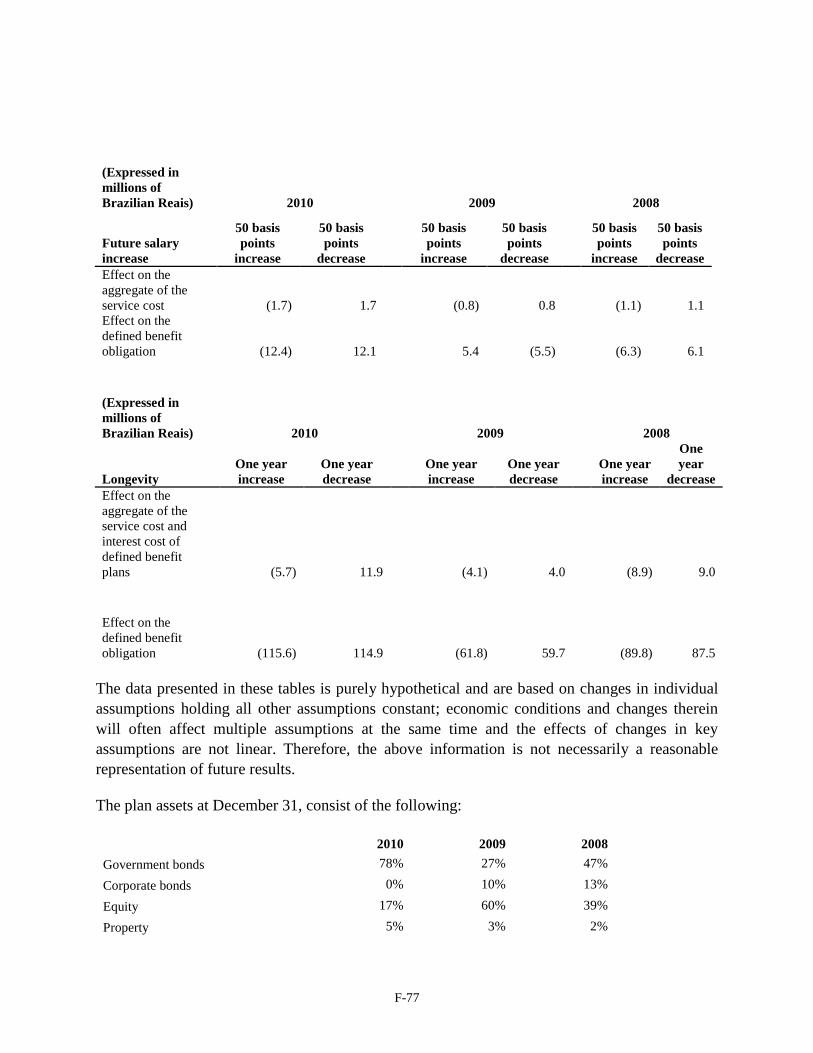
F-77
(Expressed in
millions of
Brazilian Reais)
2010
2009
2008
Future salary
increase
50 basis
points
increase
50 basis
points
decrease
50 basis
points
increase
50 basis
points
decrease
50 basis
points
increase
50 basis
points
decrease
Effect on the
aggregate of the
service cost
(1.7)
1.7
(0.8)
0.8
(1.1)
1.1
Effect on the
defined benefit
obligation
(12.4)
12.1
5.4
(5.5)
(6.3)
6.1
(Expressed in
millions of
Brazilian Reais) 2010
2009
2008
Longevity
One year
increase
One year
decrease
One year
increase
One year
decrease
One year
increase
One
year
decrease
Effect on the
aggregate of the
service cost and
interest cost of
defined benefit
plans
(5.7)
11.9
(4.1)
4.0
(8.9)
9.0
Effect on the
defined benefit
obligation
(115.6)
114.9
(61.8)
59.7
(89.8)
87.5
The data presented in these tables is purely hypothetical and are based on changes in individual
assumptions holding all other assumptions constant; economic conditions and changes therein
will often affect multiple assumptions at the same time and the effects of changes in key
assumptions are not linear. Therefore, the above information is not necessarily a reasonable
representation of future results.
The plan assets at December 31, consist of the following:
2010 2009 2008
Government bonds 78% 27% 47%
Corporate bonds 0% 10% 13%
Equity 17% 60% 39%
Property 5% 3% 2%
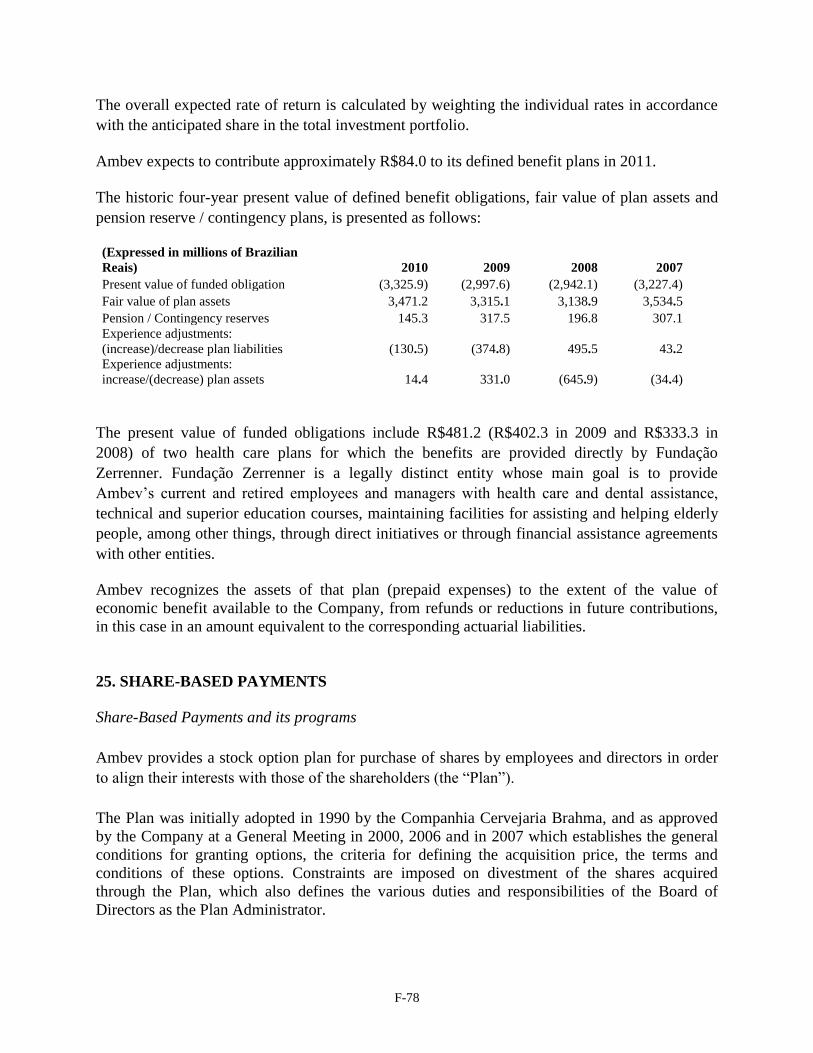
F-78
The overall expected rate of return is calculated by weighting the individual rates in accordance
with the anticipated share in the total investment portfolio.
Ambev expects to contribute approximately R$84.0 to its defined benefit plans in 2011.
The historic four-year present value of defined benefit obligations, fair value of plan assets and
pension reserve / contingency plans, is presented as follows:
(Expressed in millions of Brazilian
Reais) 2010 2009 2008 2007
Present value of funded obligation (3,325.9) (2,997.6) (2,942.1) (3,227.4)
Fair value of plan assets 3,471.2 3,315.1 3,138.9 3,534.5
Pension / Contingency reserves 145.3 317.5 196.8 307.1
Experience adjustments:
(increase)/decrease plan liabilities (130.5) (374.8) 495.5 43.2
Experience adjustments:
increase/(decrease) plan assets 14.4 331.0 (645.9) (34.4)
The present value of funded obligations include R$481.2 (R$402.3 in 2009 and R$333.3 in
2008) of two health care plans for which the benefits are provided directly by Fundação
Zerrenner. Fundação Zerrenner is a legally distinct entity whose main goal is to provide
Ambev’s current and retired employees and managers with health care and dental assistance,
technical and superior education courses, maintaining facilities for assisting and helping elderly
people, among other things, through direct initiatives or through financial assistance agreements
with other entities.
Ambev recognizes the assets of that plan (prepaid expenses) to the extent of the value of
economic benefit available to the Company, from refunds or reductions in future contributions,
in this case in an amount equivalent to the corresponding actuarial liabilities.
25. SHARE-BASED PAYMENTS
Share-Based Payments and its programs
Ambev provides a stock option plan for purchase of shares by employees and directors in order
to align their interests with those of the shareholders (the ―Plan‖).
The Plan was initially adopted in 1990 by the Companhia Cervejaria Brahma, and as approved
by the Company at a General Meeting in 2000, 2006 and in 2007 which establishes the general
conditions for granting options, the criteria for defining the acquisition price, the terms and
conditions of these options. Constraints are imposed on divestment of the shares acquired
through the Plan, which also defines the various duties and responsibilities of the Board of
Directors as the Plan Administrator.
F-79
Under the regulations of the Plan, as its Administrator, the Board of Directors is endowed with
ample powers for the organization thereof, in compliance with the general conditions of the Plan.
The Board of Directors grants the options, establishing the terms and conditions applicable to
each grant through Stock Option Programs (―Programs‖), in which it may define the
beneficiaries, the number and type of Company shares covered by the grant, the exercise price,
the exercise periods and the deadline for exercising the options, together with rules regarding
option transfers and possible constraints on the shares acquired, in addition to provisions on
penalties. Additionally, targets may be set for Company performance, with the Board of
Directors also being empowered to define specific rules for Company employees transferred to
other countries, including to the controlling shareholder or subsidiaries controlled by the
Company. The beneficiaries granted with these Options must sign Stock Option Agreements (―Agreements‖) with
the Company, through which the Beneficiaries have the option to purchase lots of shares issued by the Company in
compliance with the terms and conditions of the Plan and the corresponding Program.
Programs before 2006
Prior to the alterations to the Plan in 2006, the Company had 13 approved programs. Under these
programs, the beneficiaries must exercise their options on signature of the respective contract,
and may pay the exercise price within four years, open to extension for a further three years, with
an initial payment of at least 10% with annual interest falling due on the outstanding balance at
8% by the IGP-M index. From 2003 onwards, due to the adoption of the Sarbanes-Oxley Act in
the USA, in 2002, the Company ceased to allow the possibility of acquiring Company shares
over time under this Plan. However, the conditions granted until then under the aegis of the Plan
remained in effect in compliance with the conditions thereof, with the amounts owed by the
respective Beneficiaries to the Company necessarily being completely settled during the next
four years.
Programs from 2006 to 2010
Upon altering the Plan in 2006, the Company began to operate a new option grant model in
which the Beneficiaries may decide to allocate 50%, 75% or 100% of the amounts received as
variable remuneration (bonuses) each year, to the immediate exercise of options, to acquire
Preferred shares.
Programs from 2010
Upon altering the Plan in 2010, the Company began to operate a new option grant model, which
covers two types of grants: (i) the beneficiary may choose to apply 30%, 40% or 100% of
variable remuneration (bonuses) that received in the year, with the immediate exercise of
options, thereby acquiring the corresponding Preferred shares, although the delivery of a
substantial portion of the shares acquired is conditioned to the beneficiary continuing to be
employed by the Company for five years from the date of exercise, (ii) the beneficiary may
exercise the options after a period of five years. The exercise of options is not tied to the
Company's performance goals.
Options granted in fiscal year 2010
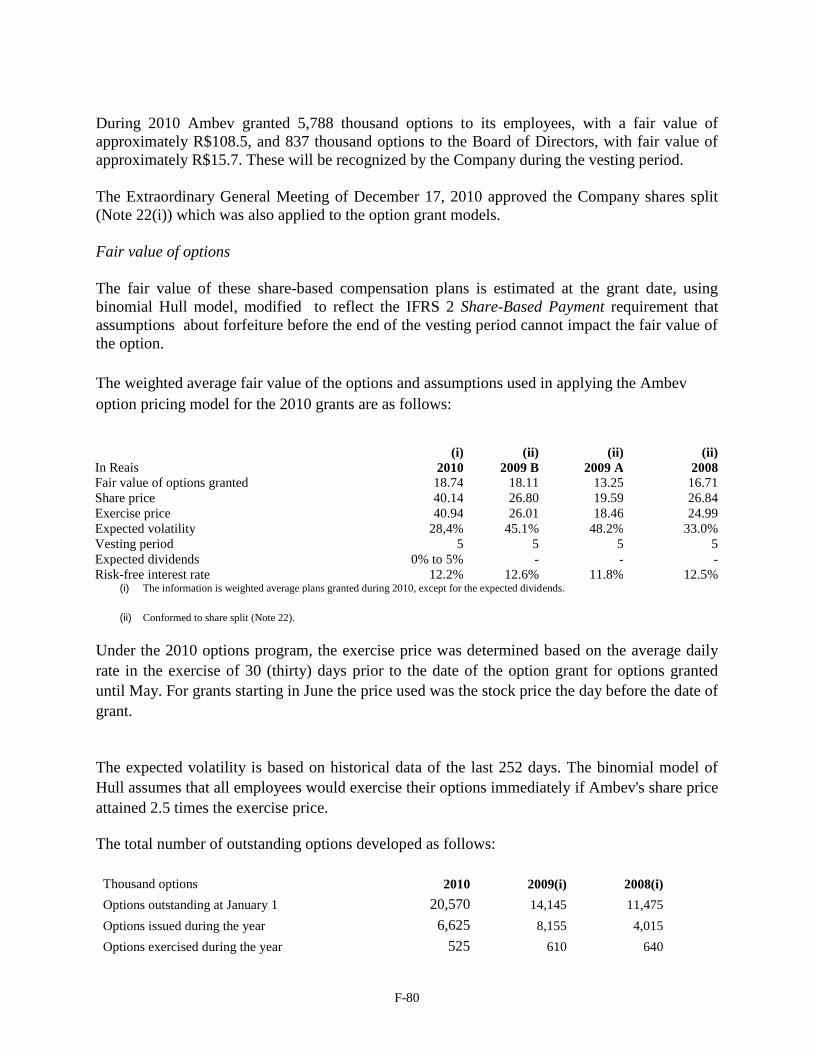
F-80
During 2010 Ambev granted 5,788 thousand options to its employees, with a fair value of
approximately R$108.5, and 837 thousand options to the Board of Directors, with fair value of
approximately R$15.7. These will be recognized by the Company during the vesting period.
The Extraordinary General Meeting of December 17, 2010 approved the Company shares split
(Note 22(i)) which was also applied to the option grant models.
Fair value of options
The fair value of these share-based compensation plans is estimated at the grant date, using
binomial Hull model, modified to reflect the IFRS 2 Share-Based Payment requirement that
assumptions about forfeiture before the end of the vesting period cannot impact the fair value of
the option.
The weighted average fair value of the options and assumptions used in applying the Ambev
option pricing model for the 2010 grants are as follows:
In Reais
(i)
2010
(ii)
2009 B
(ii)
2009 A
(ii)
2008
Fair value of options granted 18.74 18.11 13.25 16.71
Share price 40.14 26.80 19.59 26.84
Exercise price 40.94 26.01 18.46 24.99
Expected volatility 28,4% 45.1% 48.2% 33.0%
Vesting period 5 5 5 5
Expected dividends 0% to 5% - - -
Risk-free interest rate 12.2% 12.6% 11.8% 12.5% (i) The information is weighted average plans granted during 2010, except for the expected dividends.
(ii) Conformed to share split (Note 22).
Under the 2010 options program, the exercise price was determined based on the average daily
rate in the exercise of 30 (thirty) days prior to the date of the option grant for options granted
until May. For grants starting in June the price used was the stock price the day before the date of
grant.
The expected volatility is based on historical data of the last 252 days. The binomial model of
Hull assumes that all employees would exercise their options immediately if Ambev's share price
attained 2.5 times the exercise price.
The total number of outstanding options developed as follows:
Thousand options 2010 2009(i) 2008(i)
Options outstanding at January 1 20,570 14,145 11,475
Options issued during the year 6,625 8,155 4,015
Options exercised during the year 525 610 640
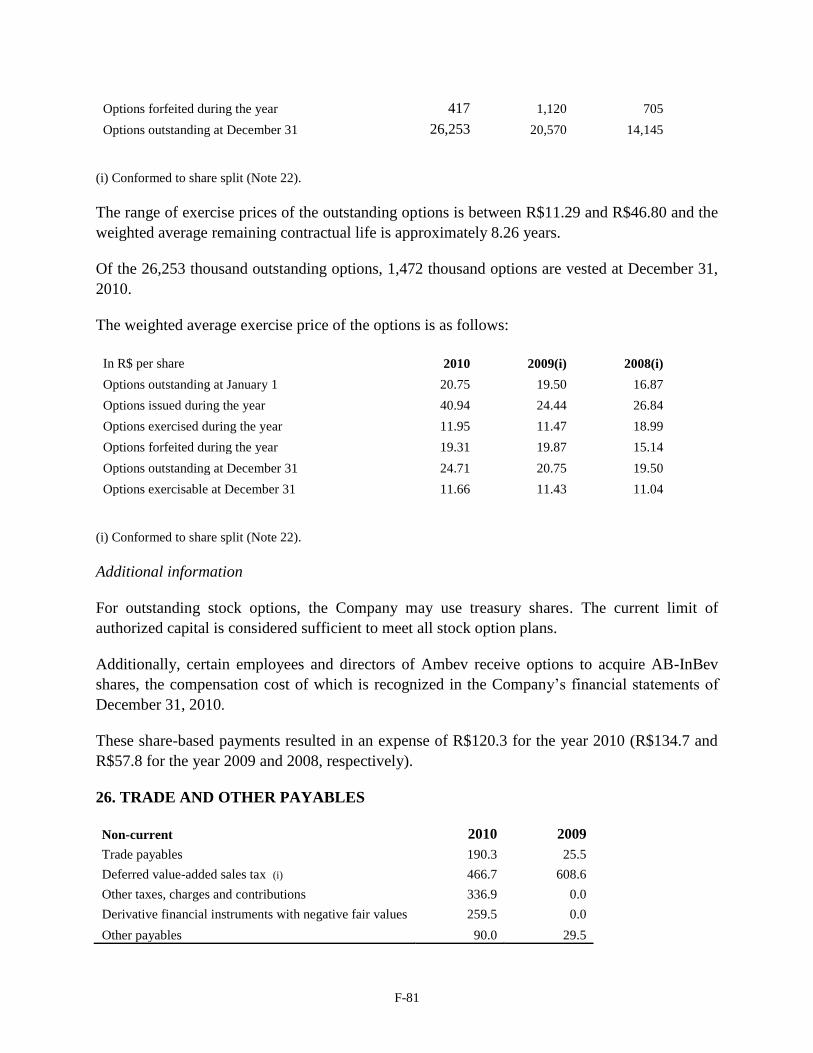
F-81
Options forfeited during the year 417 1,120 705
Options outstanding at December 31 26,253 20,570 14,145
(i) Conformed to share split (Note 22).
The range of exercise prices of the outstanding options is between R$11.29 and R$46.80 and the
weighted average remaining contractual life is approximately 8.26 years.
Of the 26,253 thousand outstanding options, 1,472 thousand options are vested at December 31,
2010.
The weighted average exercise price of the options is as follows:
In R$ per share 2010 2009(i) 2008(i)
Options outstanding at January 1 20.75 19.50 16.87
Options issued during the year 40.94 24.44 26.84
Options exercised during the year 11.95 11.47 18.99
Options forfeited during the year 19.31 19.87 15.14
Options outstanding at December 31 24.71 20.75 19.50
Options exercisable at December 31 11.66 11.43 11.04
(i) Conformed to share split (Note 22).
Additional information
For outstanding stock options, the Company may use treasury shares. The current limit of
authorized capital is considered sufficient to meet all stock option plans.
Additionally, certain employees and directors of Ambev receive options to acquire AB-InBev
shares, the compensation cost of which is recognized in the Company’s financial statements of
December 31, 2010.
These share-based payments resulted in an expense of R$120.3 for the year 2010 (R$134.7 and
R$57.8 for the year 2009 and 2008, respectively).
26. TRADE AND OTHER PAYABLES
Non-current 2010 2009
Trade payables 190.3 25.5
Deferred value-added sales tax (i) 466.7 608.6
Other taxes, charges and contributions 336.9 0.0
Derivative financial instruments with negative fair values 259.5 0.0
Other payables 90.0 29.5
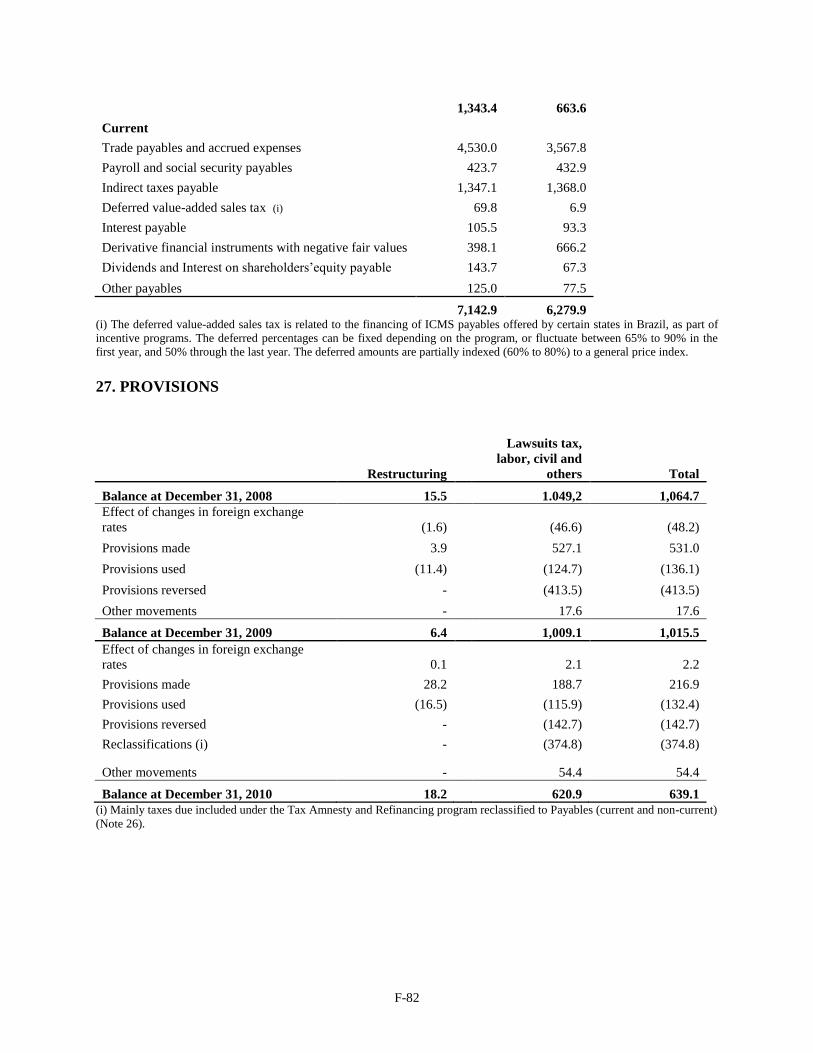
F-82
1,343.4 663.6
Current
Trade payables and accrued expenses 4,530.0 3,567.8
Payroll and social security payables 423.7 432.9
Indirect taxes payable 1,347.1 1,368.0
Deferred value-added sales tax (i) 69.8 6.9
Interest payable 105.5 93.3
Derivative financial instruments with negative fair values 398.1 666.2
Dividends and Interest on shareholders’equity payable 143.7 67.3
Other payables 125.0 77.5
7,142.9 6,279.9
(i) The deferred value-added sales tax is related to the financing of ICMS payables offered by certain states in Brazil, as part of
incentive programs. The deferred percentages can be fixed depending on the program, or fluctuate between 65% to 90% in the
first year, and 50% through the last year. The deferred amounts are partially indexed (60% to 80%) to a general price index.
27. PROVISIONS
Restructuring
Lawsuits tax,
labor, civil and
others Total
Balance at December 31, 2008 15.5
1.049,2 1,064.7
Effect of changes in foreign exchange
rates (1.6)
(46.6) (48.2)
Provisions made 3.9
527.1 531.0
Provisions used (11.4)
(124.7) (136.1)
Provisions reversed -
(413.5) (413.5)
Other movements -
17.6 17.6
Balance at December 31, 2009 6.4
1,009.1 1,015.5
Effect of changes in foreign exchange
rates 0.1
2.1 2.2
Provisions made 28.2
188.7 216.9
Provisions used (16.5)
(115.9) (132.4)
Provisions reversed -
(142.7) (142.7)
Reclassifications (i) -
(374.8) (374.8)
Other movements -
54.4 54.4
Balance at December 31, 2010 18.2
620.9 639.1
(i) Mainly taxes due included under the Tax Amnesty and Refinancing program reclassified to Payables (current and non-current)
(Note 26).
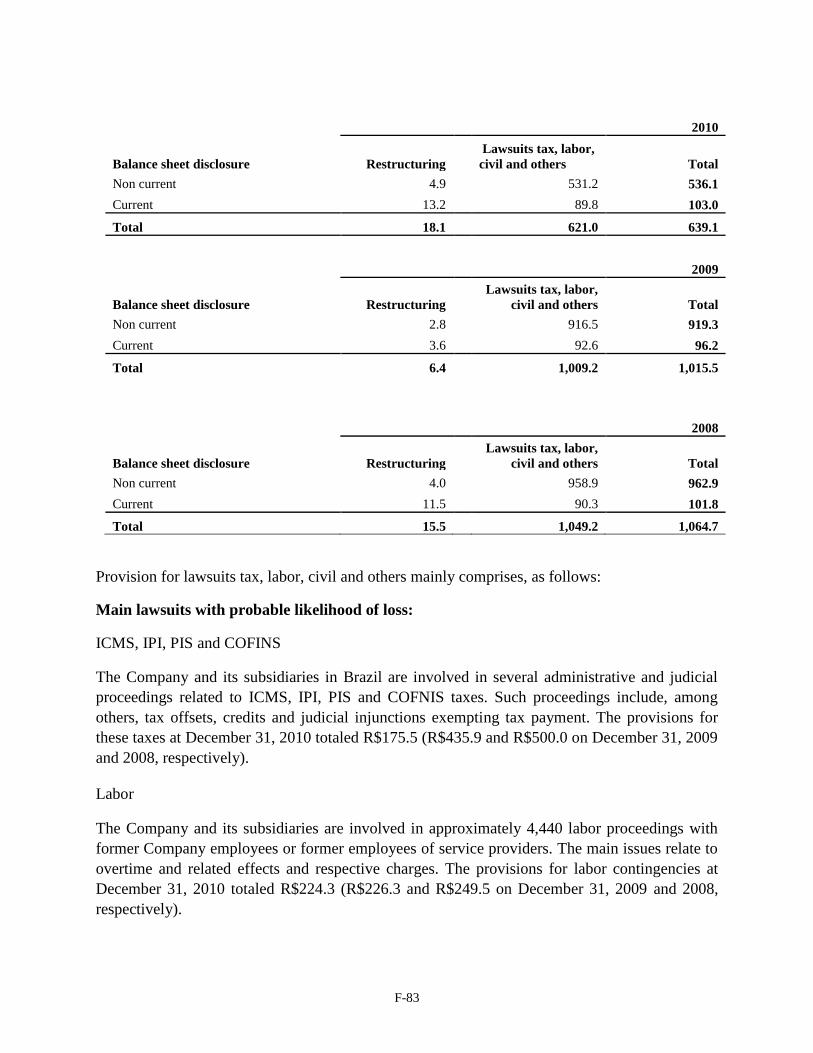
F-83
2010
Balance sheet disclosure Restructuring
Lawsuits tax, labor,
civil and others Total
Non current 4.9
531.2 536.1
Current 13.2
89.8 103.0
Total 18.1
621.0 639.1
2009
Balance sheet disclosure Restructuring
Lawsuits tax, labor,
civil and others Total
Non current 2.8
916.5 919.3
Current 3.6
92.6 96.2
Total 6.4
1,009.2 1,015.5
2008
Balance sheet disclosure Restructuring
Lawsuits tax, labor,
civil and others Total
Non current 4.0
958.9 962.9
Current 11.5
90.3 101.8
Total 15.5
1,049.2 1,064.7
Provision for lawsuits tax, labor, civil and others mainly comprises, as follows:
Main lawsuits with probable likelihood of loss:
ICMS, IPI, PIS and COFINS
The Company and its subsidiaries in Brazil are involved in several administrative and judicial
proceedings related to ICMS, IPI, PIS and COFNIS taxes. Such proceedings include, among
others, tax offsets, credits and judicial injunctions exempting tax payment. The provisions for
these taxes at December 31, 2010 totaled R$175.5 (R$435.9 and R$500.0 on December 31, 2009
and 2008, respectively).
Labor
The Company and its subsidiaries are involved in approximately 4,440 labor proceedings with
former Company employees or former employees of service providers. The main issues relate to
overtime and related effects and respective charges. The provisions for labor contingencies at
December 31, 2010 totaled R$224.3 (R$226.3 and R$249.5 on December 31, 2009 and 2008,
respectively).
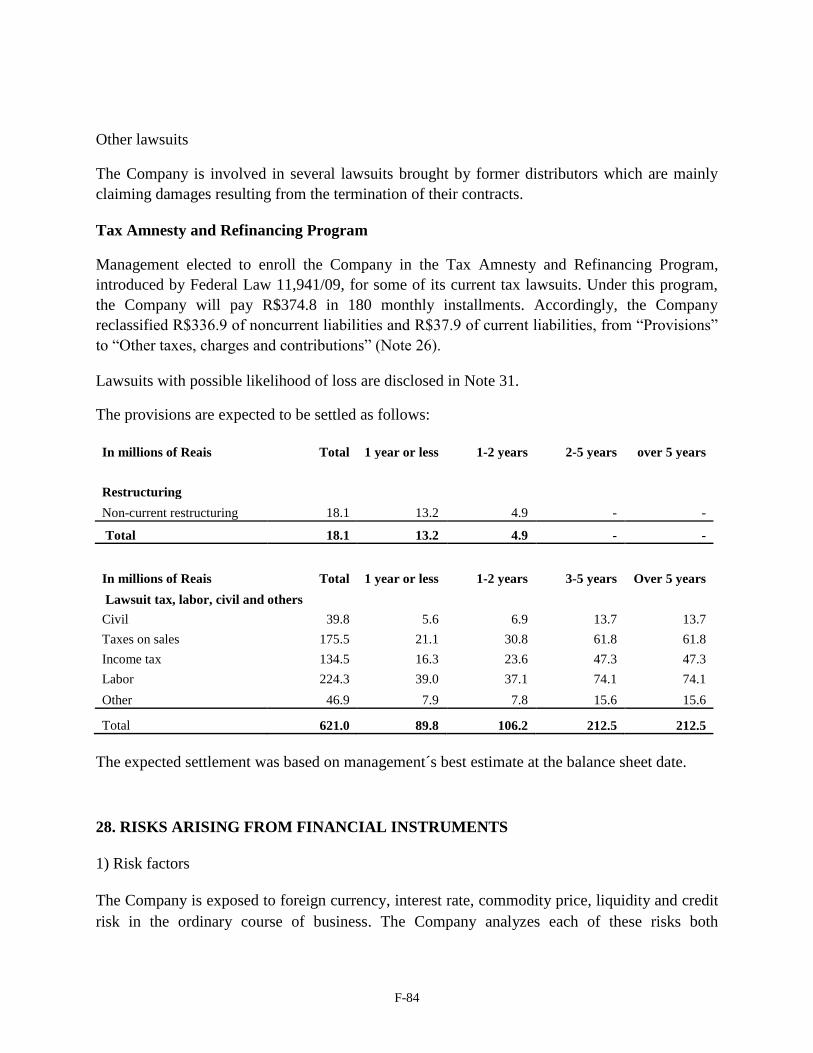
F-84
Other lawsuits
The Company is involved in several lawsuits brought by former distributors which are mainly
claiming damages resulting from the termination of their contracts.
Tax Amnesty and Refinancing Program
Management elected to enroll the Company in the Tax Amnesty and Refinancing Program,
introduced by Federal Law 11,941/09, for some of its current tax lawsuits. Under this program,
the Company will pay R$374.8 in 180 monthly installments. Accordingly, the Company
reclassified R$336.9 of noncurrent liabilities and R$37.9 of current liabilities, from ―Provisions‖
to ―Other taxes, charges and contributions‖ (Note 26).
Lawsuits with possible likelihood of loss are disclosed in Note 31.
The provisions are expected to be settled as follows:
In millions of Reais Total 1 year or less 1-2 years 2-5 years over 5 years
Restructuring
Non-current restructuring 18.1 13.2 4.9 - -
Total 18.1 13.2 4.9 - -
In millions of Reais Total 1 year or less 1-2 years 3-5 years Over 5 years
Lawsuit tax, labor, civil and others
Civil 39.8 5.6 6.9 13.7 13.7
Taxes on sales 175.5 21.1 30.8 61.8 61.8
Income tax 134.5 16.3 23.6 47.3 47.3
Labor 224.3 39.0 37.1 74.1 74.1
Other 46.9 7.9 7.8 15.6 15.6
Total 621.0 89.8 106.2 212.5 212.5
The expected settlement was based on management´s best estimate at the balance sheet date.
28. RISKS ARISING FROM FINANCIAL INSTRUMENTS
1) Risk factors
The Company is exposed to foreign currency, interest rate, commodity price, liquidity and credit
risk in the ordinary course of business. The Company analyzes each of these risks both
F-85
individually and as a whole to define strategies to manage the economic impact on the
Company's performance consistent with its policy of Financial Risk Management.
The Company’s use of derivatives strictly follows its financial risk policy approved by the Board
of Directors. The purpose of the policy is to provide guidelines for the management of financial
risks inherent to the capital markets in which Ambev carries out its operations. The policy
comprises four main aspects: (i) capital structure, financing and liquidity, (ii) transactional risks
related to the business, (iii) financial statements translation risks and (iv) credit risks of financial
counterparties.
The policy establishes that all the financial assets and liabilities in each country where the
Company operates must be denominated in their respective local currencies whenever possible.
The policy also sets forth the procedures and controls needed for identifying, measuring and
minimizing market risks, such as variations in foreign exchange rates, interest rates and
commodities (mainly aluminum, wheat and sugar) that may affect the Company’s revenues,
costs and/or investment amounts. The policy states that all the currently known risks (e.g. foreign
currency and interest) shall be mitigated by contracting derivative instruments. Existing risks not
yet evident (e.g. future contracts for the purchase of raw material and property, plant and
equipment) shall be mitigated using projections for the period necessary for the Company to
adapt to the new price scenario that may vary from 10 to 14 months, also through the use of
derivative instruments. Any exception to the policy must be approved by the Board of Directors.
The Company's operations are subject to the risk factors described below:
1.1) Foreign currency risk
Ambev incurs foreign currency risk on borrowings, investments, purchases, dividends and
interest expense/income whenever they are denominated in a currency other than the functional
currency of the subsidiary. The main derivative financial instruments used to manage foreign
currency risk are forward exchange contracts, exchange traded foreign currency futures and cross
currency interest rate swaps.
Foreign currency risk on operational activities
As far as foreign currency risk on firm commitments and forecasted transactions is concerned,
Ambev’s policy is to hedge operational transactions which are likely expected to occur (e.g. cost
of sales and sales and marketing expenses) within a maximum of 15 months. The table below
provides an indication of the company’s main net foreign currency exposure in December 31,
2010. The open positions are the result of the application of Ambev’s risk management policy.
Positive amounts indicate that the Company is long (net future cash inflows) in the first currency
of the currency pair while negative amounts indicate that the company is short (net future cash
outflows) in the first currency of the currency pair. The second currency of the currency pairs
listed is the functional currency of the related subsidiary.
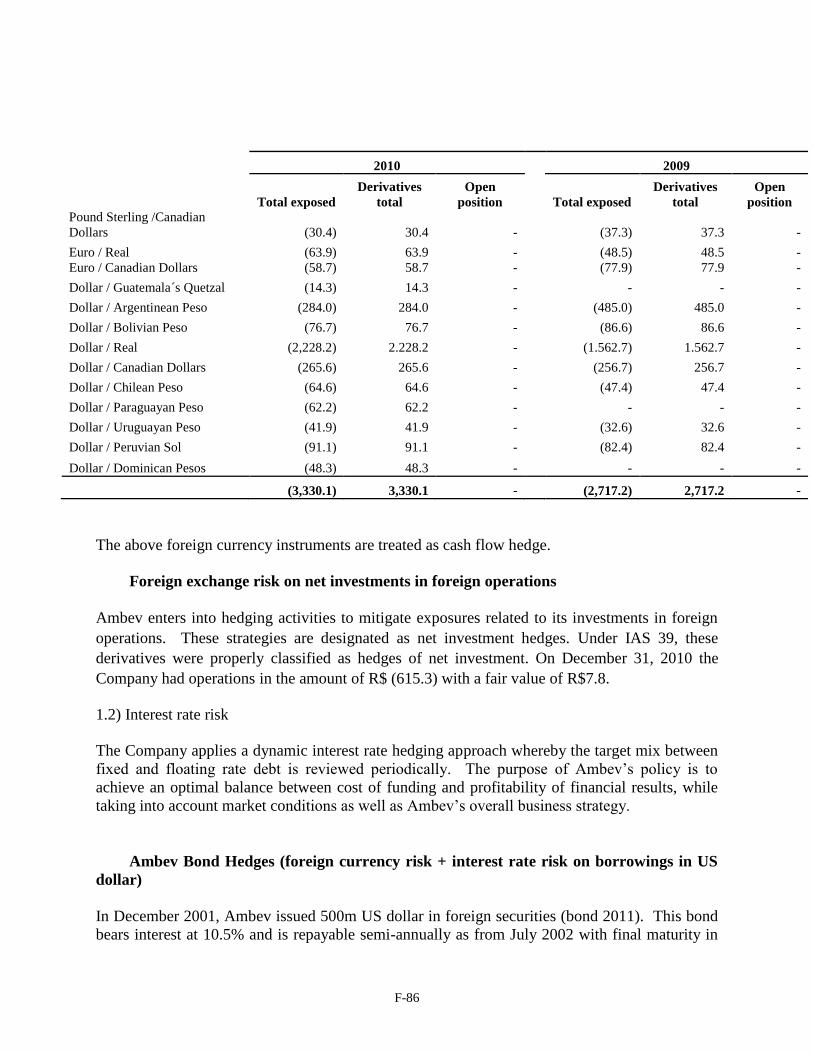
F-86
2010
2009
Total exposed
Derivatives
total
Open
position
Total exposed
Derivatives
total
Open
position
Pound Sterling /Canadian
Dollars (30.4) 30.4 -
(37.3) 37.3 -
Euro / Real (63.9) 63.9 -
(48.5) 48.5 -
Euro / Canadian Dollars (58.7) 58.7 -
(77.9) 77.9 -
Dollar / Guatemala´s Quetzal (14.3) 14.3 -
- - -
Dollar / Argentinean Peso (284.0) 284.0 -
(485.0) 485.0 -
Dollar / Bolivian Peso (76.7) 76.7 -
(86.6) 86.6 -
Dollar / Real (2,228.2) 2.228.2 -
(1.562.7) 1.562.7 -
Dollar / Canadian Dollars (265.6) 265.6 -
(256.7) 256.7 -
Dollar / Chilean Peso (64.6) 64.6 -
(47.4) 47.4 -
Dollar / Paraguayan Peso (62.2) 62.2 -
- - -
Dollar / Uruguayan Peso (41.9) 41.9 -
(32.6) 32.6 -
Dollar / Peruvian Sol (91.1) 91.1 -
(82.4) 82.4 -
Dollar / Dominican Pesos (48.3) 48.3 -
- - -
(3,330.1) 3,330.1 -
(2,717.2) 2,717.2 -
The above foreign currency instruments are treated as cash flow hedge.
Foreign exchange risk on net investments in foreign operations
Ambev enters into hedging activities to mitigate exposures related to its investments in foreign
operations. These strategies are designated as net investment hedges. Under IAS 39, these
derivatives were properly classified as hedges of net investment. On December 31, 2010 the
Company had operations in the amount of R$ (615.3) with a fair value of R$7.8.
1.2) Interest rate risk
The Company applies a dynamic interest rate hedging approach whereby the target mix between
fixed and floating rate debt is reviewed periodically. The purpose of Ambev’s policy is to
achieve an optimal balance between cost of funding and profitability of financial results, while
taking into account market conditions as well as Ambev’s overall business strategy.
Ambev Bond Hedges (foreign currency risk + interest rate risk on borrowings in US
dollar)
In December 2001, Ambev issued 500m US dollar in foreign securities (bond 2011). This bond
bears interest at 10.5% and is repayable semi-annually as from July 2002 with final maturity in
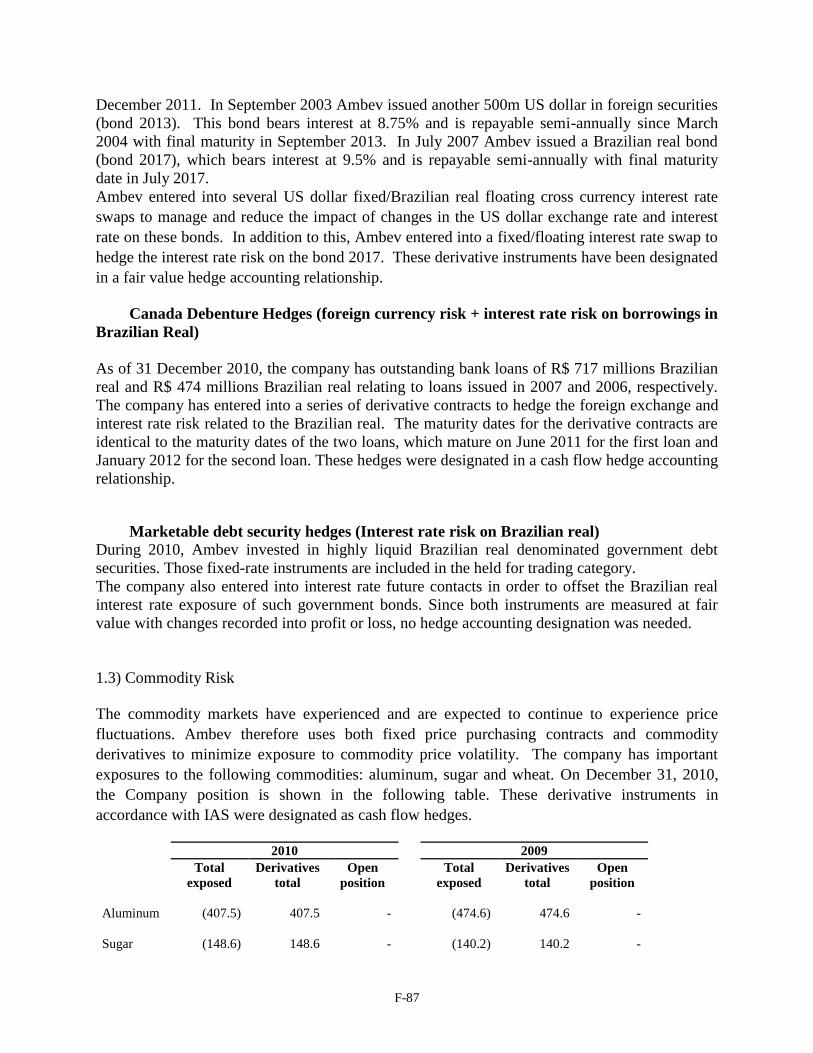
F-87
December 2011. In September 2003 Ambev issued another 500m US dollar in foreign securities
(bond 2013). This bond bears interest at 8.75% and is repayable semi-annually since March
2004 with final maturity in September 2013. In July 2007 Ambev issued a Brazilian real bond
(bond 2017), which bears interest at 9.5% and is repayable semi-annually with final maturity
date in July 2017.
Ambev entered into several US dollar fixed/Brazilian real floating cross currency interest rate
swaps to manage and reduce the impact of changes in the US dollar exchange rate and interest
rate on these bonds. In addition to this, Ambev entered into a fixed/floating interest rate swap to
hedge the interest rate risk on the bond 2017. These derivative instruments have been designated
in a fair value hedge accounting relationship.
Canada Debenture Hedges (foreign currency risk + interest rate risk on borrowings in
Brazilian Real)
As of 31 December 2010, the company has outstanding bank loans of R$ 717 millions Brazilian
real and R$ 474 millions Brazilian real relating to loans issued in 2007 and 2006, respectively.
The company has entered into a series of derivative contracts to hedge the foreign exchange and
interest rate risk related to the Brazilian real. The maturity dates for the derivative contracts are
identical to the maturity dates of the two loans, which mature on June 2011 for the first loan and
January 2012 for the second loan. These hedges were designated in a cash flow hedge accounting
relationship.
Marketable debt security hedges (Interest rate risk on Brazilian real)
During 2010, Ambev invested in highly liquid Brazilian real denominated government debt
securities. Those fixed-rate instruments are included in the held for trading category.
The company also entered into interest rate future contacts in order to offset the Brazilian real
interest rate exposure of such government bonds. Since both instruments are measured at fair
value with changes recorded into profit or loss, no hedge accounting designation was needed.
1.3) Commodity Risk
The commodity markets have experienced and are expected to continue to experience price
fluctuations. Ambev therefore uses both fixed price purchasing contracts and commodity
derivatives to minimize exposure to commodity price volatility. The company has important
exposures to the following commodities: aluminum, sugar and wheat. On December 31, 2010,
the Company position is shown in the following table. These derivative instruments in
accordance with IAS were designated as cash flow hedges.
2010
2009
Total
exposed
Derivatives
total
Open
position
Total
exposed
Derivatives
total
Open
position
Aluminum
(407.5)
407.5 -
(474.6)
474.6 -
Sugar
(148.6)
148.6 -
(140.2)
140.2 -
F-88
Wheat
(103.4)
103.4 -
(51.1)
51.1 -
Fuel
(11.8)
11.8 -
(10.3)
10.3 -
Corn
(7.3)
7.3 -
(16.2)
16.2 -
Total
(678.7) 678.7 -
(692.3) 692.3 -
1.4) Credit Risk
Concentration of credit risk on trade receivables
A substantial part of the Company’s sales is made to distributors, supermarkets and retailers,
within a broad distribution network. Credit risk is reduced because of the widespread number of
customers and control procedures used to monitor risk. Historically, the Company has not
experienced significant losses on receivables from customers.
Concentration of credit risk on counterpart
In order to minimize the credit risk of its investments, the Company has adopted procedures for
the allocation of cash and investments, taking into consideration limits and credit analysis of
financial institutions, avoiding credit concentration, i.e., the credit risk is monitored and
minimized to the extended that negotiations are carried out only with a select group of highly
rated counterparties.
The process that determines the financial institutions authorized to operate as the Company’s
counterparties is set forth in our credit risk policy. This policy establishes maximum limits of
exposure to each counterparty based on the risk rating and on each counterparty's capitalization.
The Company has adopted, in order to minimize the risk of credit with its counterparties in
significant derivative transactions, bilateral "trigger" clauses. According to these clauses, where
the fair value of an operation exceeds a percentage of its notional value (generally between 10%
and 15%), the debtor settles the difference in favor of the creditor.
At December 31, 2010, the Company held its main short-term investments with the following
financial institutions: Banco do Brasil, BNP Paribas, Bradesco, Itaú-Unibanco, Citibank,
Banesco, Banco Nacional de Bolivia, Banco Popular Dominicano, Toronto Dominion Bank,
ING, JP Morgan Chase and Santander. The Company had derivatives agreements with the
following financial institutions: Barclays, Banco de Crédito do Peru, Banco Nacional de Bolivia,
BBVA, BNB Paribas, Bradesco, Citibank, Merril Lynch, Morgan Stanley, Deutsche Bank, Itaú-
Unibanco, JP Morgan Chase, Santander, ScotiaBank, Société Générale, and TD Securities.
1.5) Liquidity risk
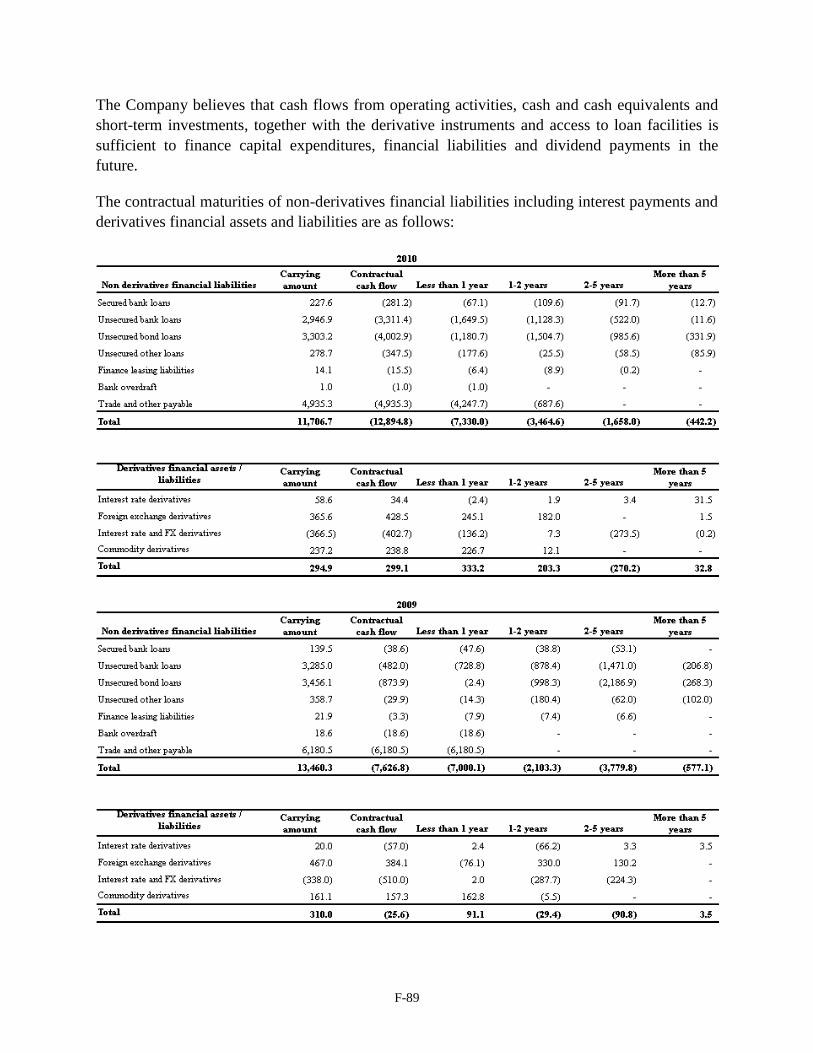
F-89
The Company believes that cash flows from operating activities, cash and cash equivalents and
short-term investments, together with the derivative instruments and access to loan facilities is
sufficient to finance capital expenditures, financial liabilities and dividend payments in the
future.
The contractual maturities of non-derivatives financial liabilities including interest payments and
derivatives financial assets and liabilities are as follows:
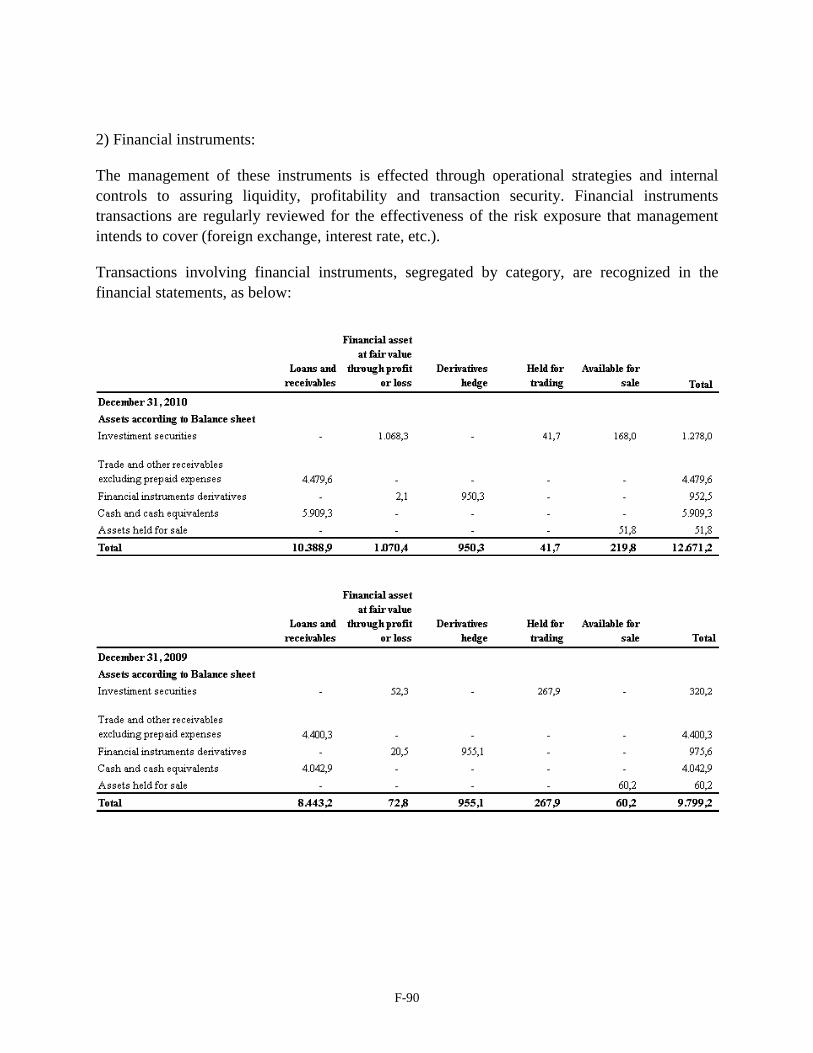
F-90
2) Financial instruments:
The management of these instruments is effected through operational strategies and internal
controls to assuring liquidity, profitability and transaction security. Financial instruments
transactions are regularly reviewed for the effectiveness of the risk exposure that management
intends to cover (foreign exchange, interest rate, etc.).
Transactions involving financial instruments, segregated by category, are recognized in the
financial statements, as below:
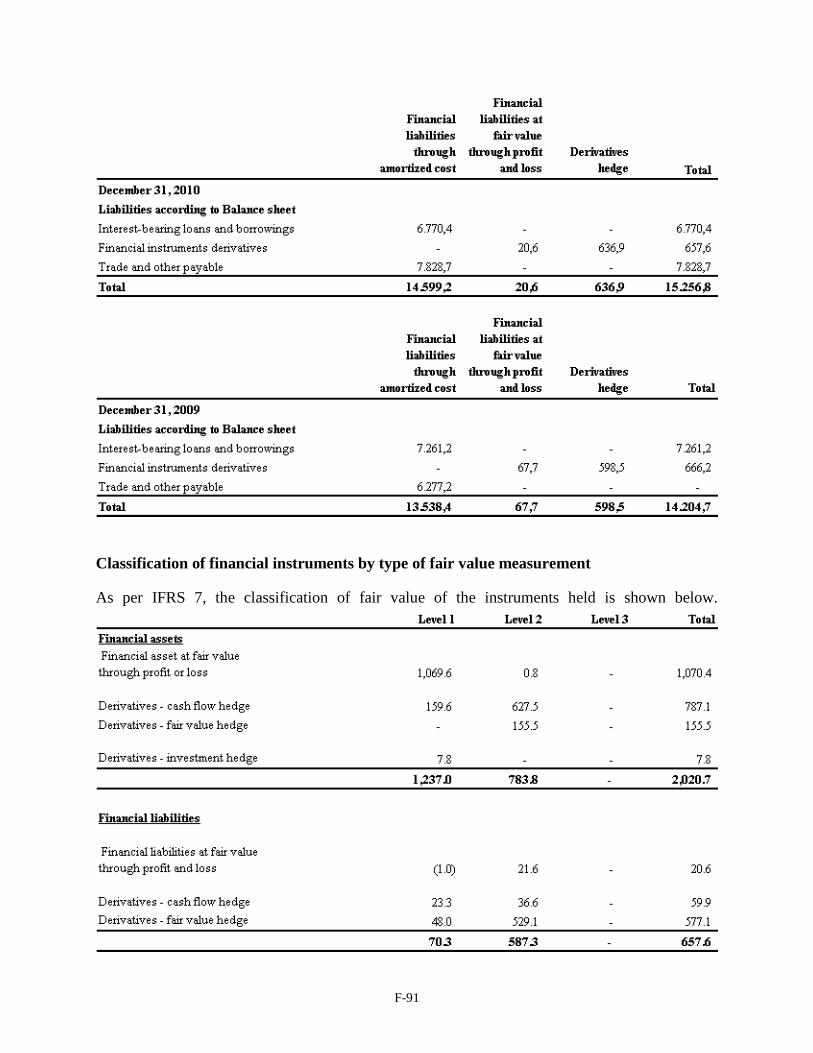
F-91
Classification of financial instruments by type of fair value measurement
As per IFRS 7, the classification of fair value of the instruments held is shown below.
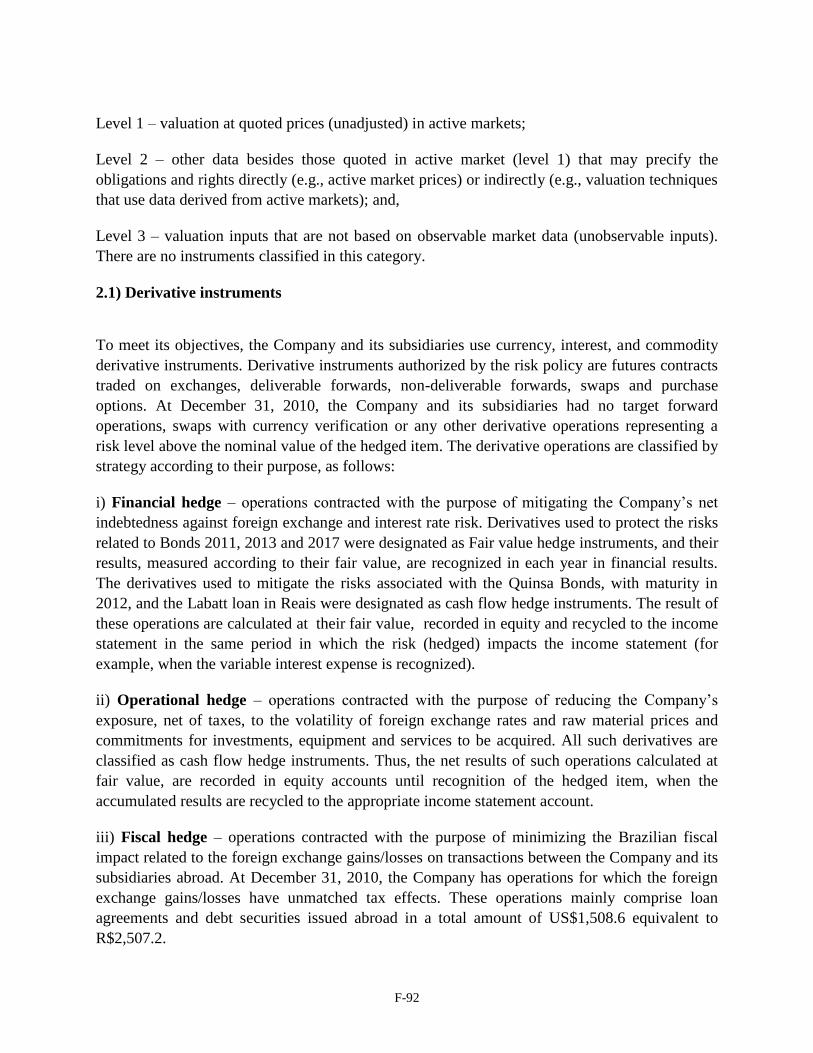
F-92
Level 1 – valuation at quoted prices (unadjusted) in active markets;
Level 2 – other data besides those quoted in active market (level 1) that may precify the
obligations and rights directly (e.g., active market prices) or indirectly (e.g., valuation techniques
that use data derived from active markets); and,
Level 3 – valuation inputs that are not based on observable market data (unobservable inputs).
There are no instruments classified in this category.
2.1) Derivative instruments
To meet its objectives, the Company and its subsidiaries use currency, interest, and commodity
derivative instruments. Derivative instruments authorized by the risk policy are futures contracts
traded on exchanges, deliverable forwards, non-deliverable forwards, swaps and purchase
options. At December 31, 2010, the Company and its subsidiaries had no target forward
operations, swaps with currency verification or any other derivative operations representing a
risk level above the nominal value of the hedged item. The derivative operations are classified by
strategy according to their purpose, as follows:
i) Financial hedge – operations contracted with the purpose of mitigating the Company’s net
indebtedness against foreign exchange and interest rate risk. Derivatives used to protect the risks
related to Bonds 2011, 2013 and 2017 were designated as Fair value hedge instruments, and their
results, measured according to their fair value, are recognized in each year in financial results.
The derivatives used to mitigate the risks associated with the Quinsa Bonds, with maturity in
2012, and the Labatt loan in Reais were designated as cash flow hedge instruments. The result of
these operations are calculated at their fair value, recorded in equity and recycled to the income
statement in the same period in which the risk (hedged) impacts the income statement (for
example, when the variable interest expense is recognized).
ii) Operational hedge – operations contracted with the purpose of reducing the Company’s
exposure, net of taxes, to the volatility of foreign exchange rates and raw material prices and
commitments for investments, equipment and services to be acquired. All such derivatives are
classified as cash flow hedge instruments. Thus, the net results of such operations calculated at
fair value, are recorded in equity accounts until recognition of the hedged item, when the
accumulated results are recycled to the appropriate income statement account.
iii) Fiscal hedge – operations contracted with the purpose of minimizing the Brazilian fiscal
impact related to the foreign exchange gains/losses on transactions between the Company and its
subsidiaries abroad. At December 31, 2010, the Company has operations for which the foreign
exchange gains/losses have unmatched tax effects. These operations mainly comprise loan
agreements and debt securities issued abroad in a total amount of US$1,508.6 equivalent to
R$2,507.2.
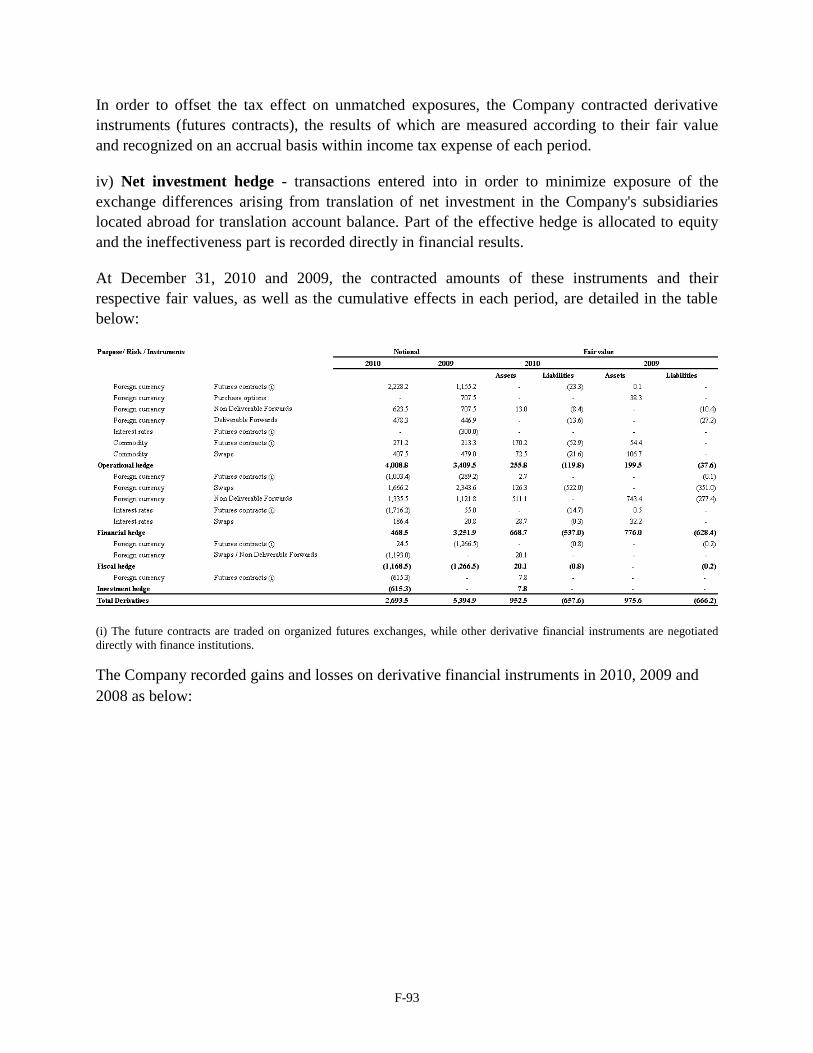
F-93
In order to offset the tax effect on unmatched exposures, the Company contracted derivative
instruments (futures contracts), the results of which are measured according to their fair value
and recognized on an accrual basis within income tax expense of each period.
iv) Net investment hedge - transactions entered into in order to minimize exposure of the
exchange differences arising from translation of net investment in the Company's subsidiaries
located abroad for translation account balance. Part of the effective hedge is allocated to equity
and the ineffectiveness part is recorded directly in financial results.
At December 31, 2010 and 2009, the contracted amounts of these instruments and their
respective fair values, as well as the cumulative effects in each period, are detailed in the table
below:
(i) The future contracts are traded on organized futures exchanges, while other derivative financial instruments are negotiated
directly with finance institutions.
The Company recorded gains and losses on derivative financial instruments in 2010, 2009 and
2008 as below:
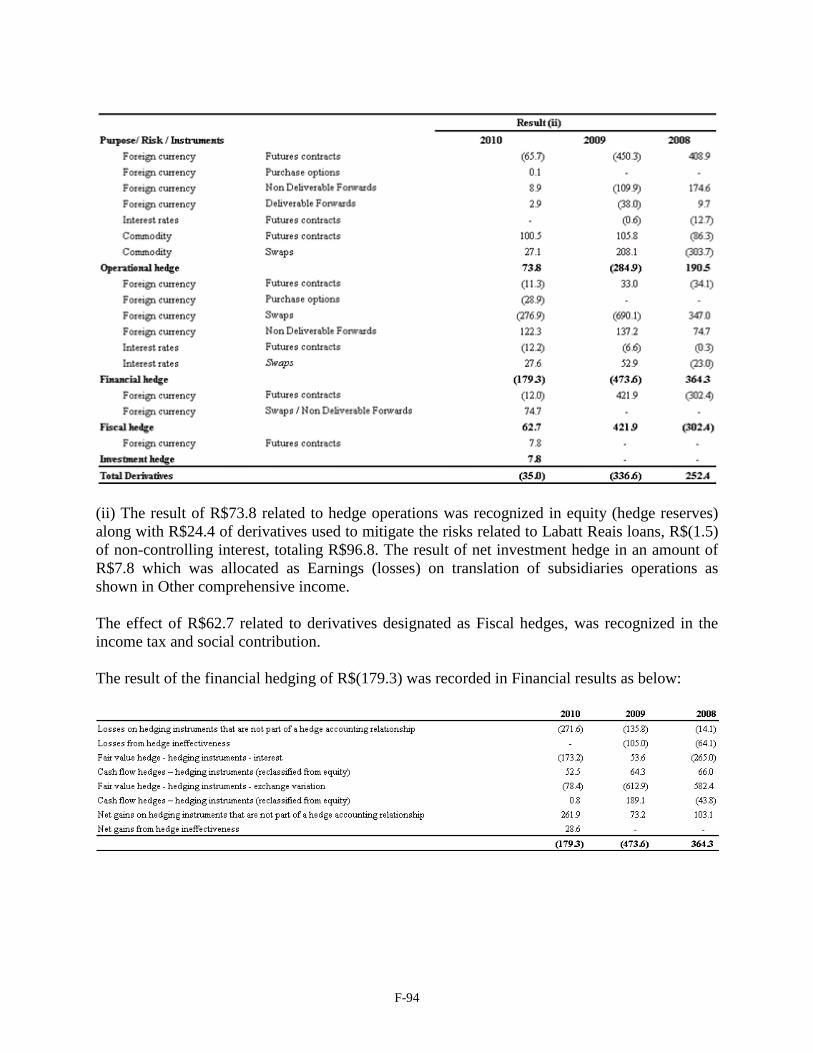
F-94
(ii) The result of R$73.8 related to hedge operations was recognized in equity (hedge reserves)
along with R$24.4 of derivatives used to mitigate the risks related to Labatt Reais loans, R$(1.5)
of non-controlling interest, totaling R$96.8. The result of net investment hedge in an amount of
R$7.8 which was allocated as Earnings (losses) on translation of subsidiaries operations as
shown in Other comprehensive income.
The effect of R$62.7 related to derivatives designated as Fiscal hedges, was recognized in the
income tax and social contribution.
The result of the financial hedging of R$(179.3) was recorded in Financial results as below:
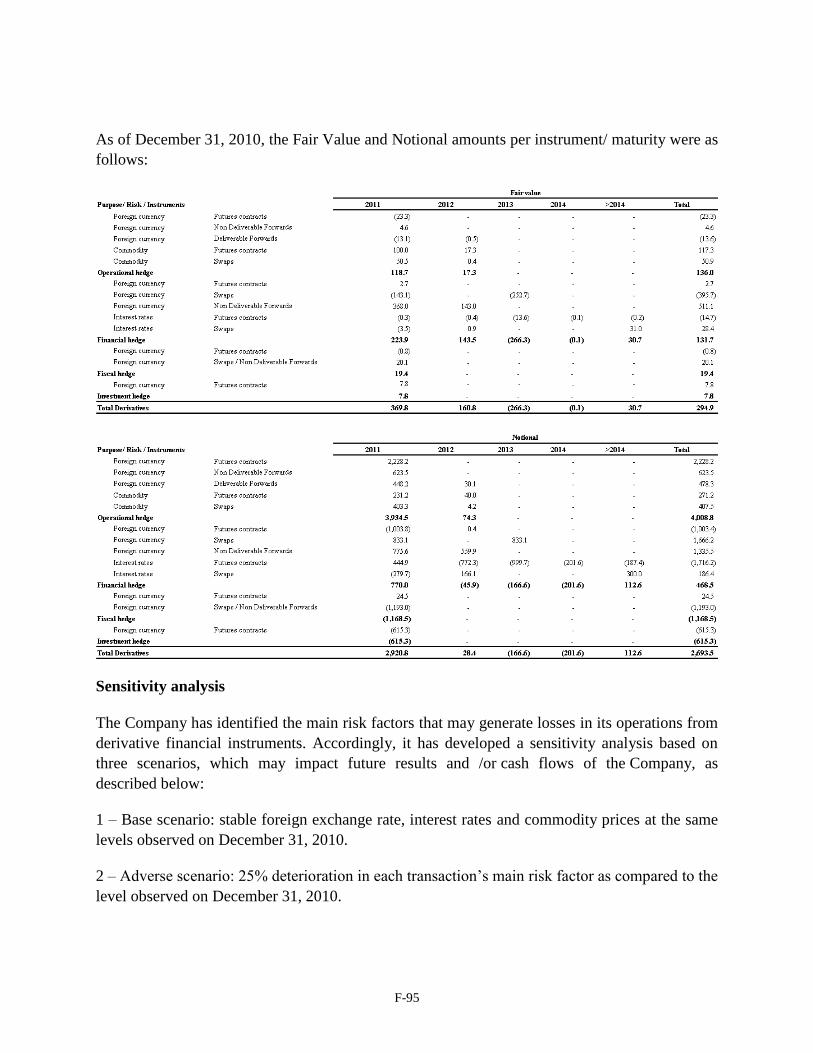
F-95
As of December 31, 2010, the Fair Value and Notional amounts per instrument/ maturity were as
follows:
Sensitivity analysis
The Company has identified the main risk factors that may generate losses in its operations from
derivative financial instruments. Accordingly, it has developed a sensitivity analysis based on
three scenarios, which may impact future results and /or cash flows of the Company, as
described below:
1 – Base scenario: stable foreign exchange rate, interest rates and commodity prices at the same
levels observed on December 31, 2010.
2 – Adverse scenario: 25% deterioration in each transaction’s main risk factor as compared to the
level observed on December 31, 2010.
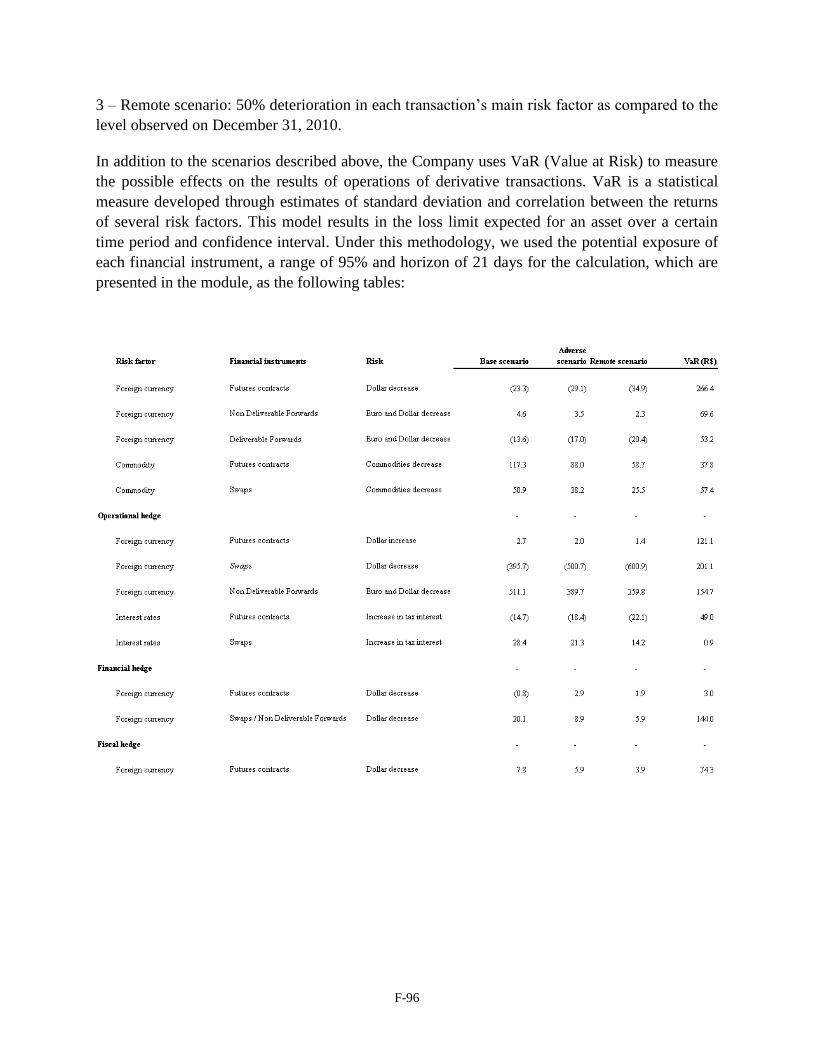
F-96
3 – Remote scenario: 50% deterioration in each transaction’s main risk factor as compared to the
level observed on December 31, 2010.
In addition to the scenarios described above, the Company uses VaR (Value at Risk) to measure
the possible effects on the results of operations of derivative transactions. VaR is a statistical
measure developed through estimates of standard deviation and correlation between the returns
of several risk factors. This model results in the loss limit expected for an asset over a certain
time period and confidence interval. Under this methodology, we used the potential exposure of
each financial instrument, a range of 95% and horizon of 21 days for the calculation, which are
presented in the module, as the following tables:
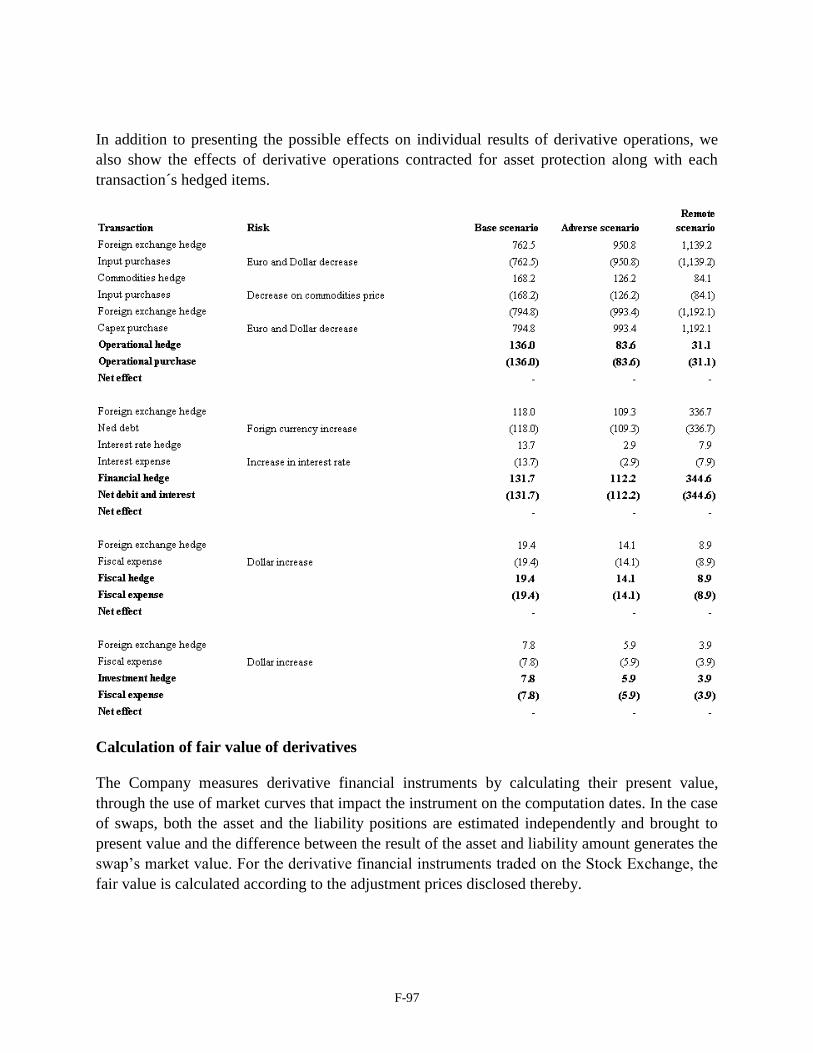
F-97
In addition to presenting the possible effects on individual results of derivative operations, we
also show the effects of derivative operations contracted for asset protection along with each
transaction´s hedged items.
Calculation of fair value of derivatives
The Company measures derivative financial instruments by calculating their present value,
through the use of market curves that impact the instrument on the computation dates. In the case
of swaps, both the asset and the liability positions are estimated independently and brought to
present value and the difference between the result of the asset and liability amount generates the
swap’s market value. For the derivative financial instruments traded on the Stock Exchange, the
fair value is calculated according to the adjustment prices disclosed thereby.
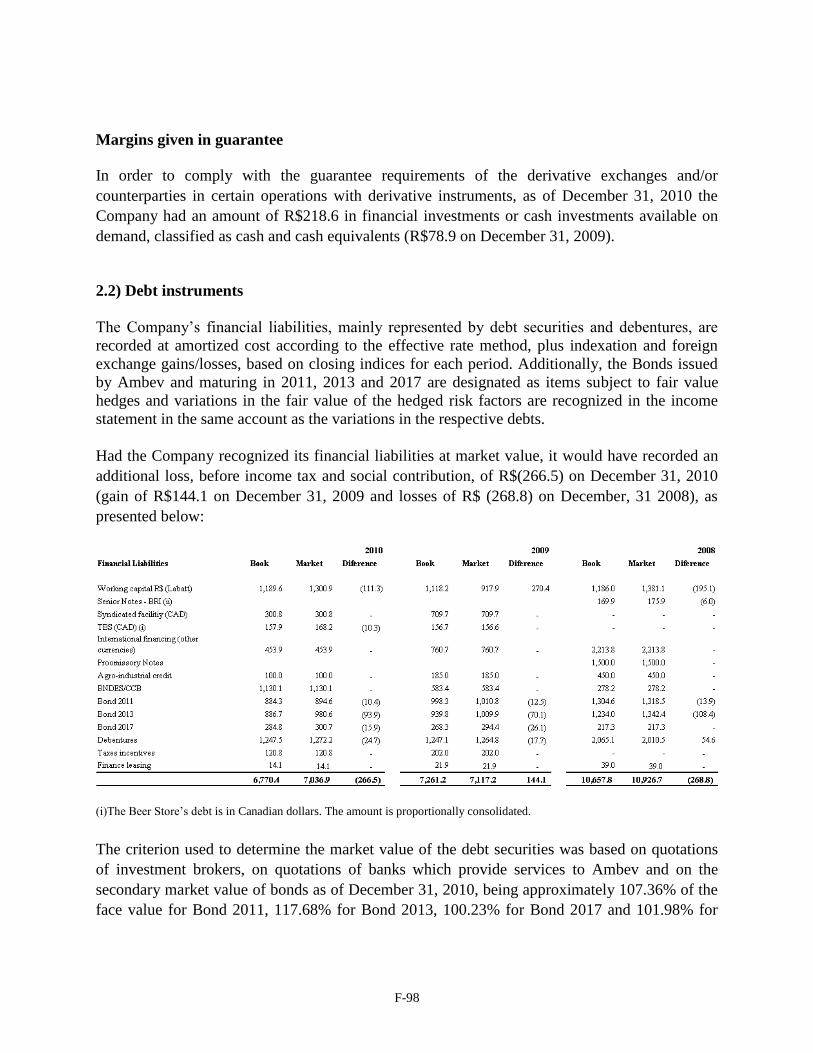
F-98
Margins given in guarantee
In order to comply with the guarantee requirements of the derivative exchanges and/or
counterparties in certain operations with derivative instruments, as of December 31, 2010 the
Company had an amount of R$218.6 in financial investments or cash investments available on
demand, classified as cash and cash equivalents (R$78.9 on December 31, 2009).
2.2) Debt instruments
The Company’s financial liabilities, mainly represented by debt securities and debentures, are
recorded at amortized cost according to the effective rate method, plus indexation and foreign
exchange gains/losses, based on closing indices for each period. Additionally, the Bonds issued
by Ambev and maturing in 2011, 2013 and 2017 are designated as items subject to fair value
hedges and variations in the fair value of the hedged risk factors are recognized in the income
statement in the same account as the variations in the respective debts.
Had the Company recognized its financial liabilities at market value, it would have recorded an
additional loss, before income tax and social contribution, of R$(266.5) on December 31, 2010
(gain of R$144.1 on December 31, 2009 and losses of R$ (268.8) on December, 31 2008), as
presented below:
(i)The Beer Store’s debt is in Canadian dollars. The amount is proportionally consolidated.
The criterion used to determine the market value of the debt securities was based on quotations
of investment brokers, on quotations of banks which provide services to Ambev and on the
secondary market value of bonds as of December 31, 2010, being approximately 107.36% of the
face value for Bond 2011, 117.68% for Bond 2013, 100.23% for Bond 2017 and 101.98% for
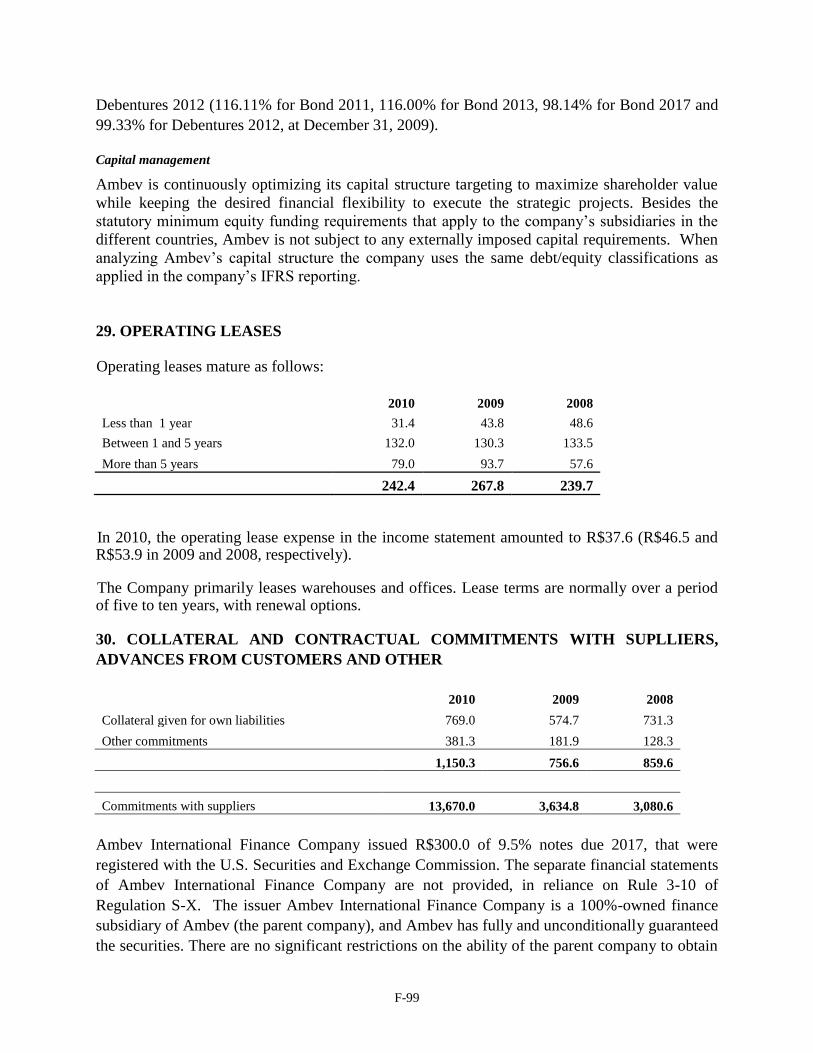
F-99
Debentures 2012 (116.11% for Bond 2011, 116.00% for Bond 2013, 98.14% for Bond 2017 and
99.33% for Debentures 2012, at December 31, 2009).
Capital management
Ambev is continuously optimizing its capital structure targeting to maximize shareholder value
while keeping the desired financial flexibility to execute the strategic projects. Besides the
statutory minimum equity funding requirements that apply to the company’s subsidiaries in the
different countries, Ambev is not subject to any externally imposed capital requirements. When
analyzing Ambev’s capital structure the company uses the same debt/equity classifications as
applied in the company’s IFRS reporting.
29. OPERATING LEASES
Operating leases mature as follows:
2010 2009 2008
Less than 1 year 31.4 43.8 48.6
Between 1 and 5 years 132.0 130.3 133.5
More than 5 years 79.0 93.7 57.6
242.4 267.8 239.7
In 2010, the operating lease expense in the income statement amounted to R$37.6 (R$46.5 and R$53.9 in 2009 and 2008, respectively).
The Company primarily leases warehouses and offices. Lease terms are normally over a period of five to ten years, with renewal options.
30. COLLATERAL AND CONTRACTUAL COMMITMENTS WITH SUPLLIERS,
ADVANCES FROM CUSTOMERS AND OTHER
2010 2009 2008
Collateral given for own liabilities 769.0 574.7 731.3
Other commitments 381.3 181.9 128.3
1,150.3 756.6 859.6
Commitments with suppliers 13,670.0 3,634.8 3,080.6
Ambev International Finance Company issued R$300.0 of 9.5% notes due 2017, that were
registered with the U.S. Securities and Exchange Commission. The separate financial statements
of Ambev International Finance Company are not provided, in reliance on Rule 3-10 of
Regulation S-X. The issuer Ambev International Finance Company is a 100%-owned finance
subsidiary of Ambev (the parent company), and Ambev has fully and unconditionally guaranteed
the securities. There are no significant restrictions on the ability of the parent company to obtain
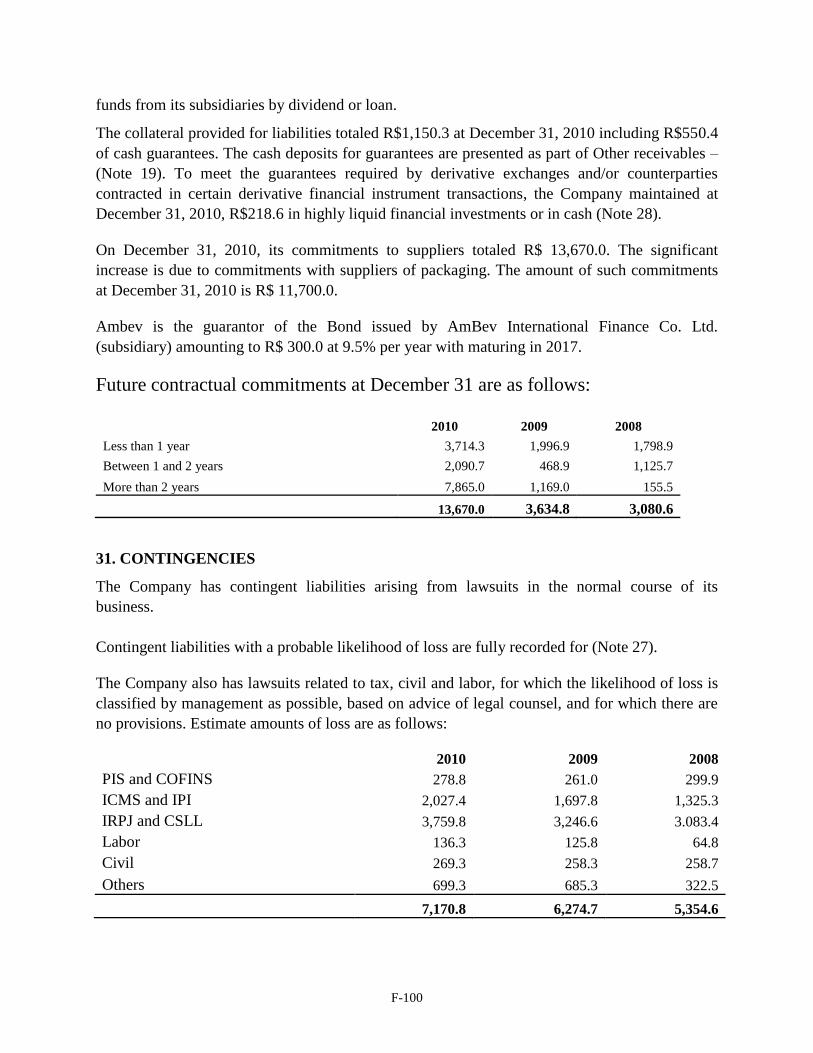
F-100
funds from its subsidiaries by dividend or loan.
The collateral provided for liabilities totaled R$1,150.3 at December 31, 2010 including R$550.4
of cash guarantees. The cash deposits for guarantees are presented as part of Other receivables –
(Note 19). To meet the guarantees required by derivative exchanges and/or counterparties
contracted in certain derivative financial instrument transactions, the Company maintained at
December 31, 2010, R$218.6 in highly liquid financial investments or in cash (Note 28).
On December 31, 2010, its commitments to suppliers totaled R$ 13,670.0. The significant
increase is due to commitments with suppliers of packaging. The amount of such commitments
at December 31, 2010 is R$ 11,700.0.
Ambev is the guarantor of the Bond issued by AmBev International Finance Co. Ltd.
(subsidiary) amounting to R$ 300.0 at 9.5% per year with maturing in 2017.
Future contractual commitments at December 31 are as follows:
2010 2009 2008
Less than 1 year 3,714.3 1,996.9 1,798.9
Between 1 and 2 years 2,090.7 468.9 1,125.7
More than 2 years 7,865.0 1,169.0 155.5
13,670.0 3,634.8 3,080.6
31. CONTINGENCIES
The Company has contingent liabilities arising from lawsuits in the normal course of its
business.
Contingent liabilities with a probable likelihood of loss are fully recorded for (Note 27).
The Company also has lawsuits related to tax, civil and labor, for which the likelihood of loss is
classified by management as possible, based on advice of legal counsel, and for which there are
no provisions. Estimate amounts of loss are as follows:
2010 2009 2008
PIS and COFINS 278.8 261.0 299.9
ICMS and IPI 2,027.4 1,697.8 1,325.3
IRPJ and CSLL 3,759.8 3,246.6 3.083.4
Labor 136.3 125.8 64.8
Civil 269.3 258.3 258.7
Others 699.3 685.3 322.5
7,170.8 6,274.7 5,354.6
F-101
Lawsuits with possible loss:
The Company has other ongoing lawsuits for which, in the opinion of management and its legal
counsels, the risk of loss is possible but not probable.
Profits generated abroad
Certain subsidiaries of Ambev have received tax assessments related to corporate Brazilian
taxation of income generated outside Brazil. In 2005 and 2008, Ambev was officially notified of
administrative Lower Court decisions, recognizing that a substantial portion of the amount of
these tax assessments was incorrect. These decisions, of which some were appealed, reduced the
amount of the tax assessments to 3.0 billion Brazilian real (1.8 billion US dollar) including
interest and penalties. Ambev disputes the validity of these tax assessments and intends to
vigorously defend its case. No provision has been recorded related to these tax assessments.
Utilization of tax loss on mergers
The Company and its subsidiaries have received tax assessments by Brazilian Tax authorities,
which has aim of the recovering of certain tax credits arising from alleged non-compliance with
the Brazilian tax regulation when taking full advantage of accumulated tax losses by companies
in its final year of existence, due to the merger.
Based on advice from legal counsel, management believes the likelihood of loss is possible and
estimates the exposure to losses on these assessments at approximately R$372.3 at December 31,
2010.
Subscription Warrants
Certain holders of warrants issued by the Company in 1996 for exercise in 2003 have proposed
lawsuits to subscribe the corresponding shares for an amount lower than what the Company
considers to have been established at the time of the issuance of the warrants. Furthermore, the
holders of these warrants claim the right to receive the dividends relative to these shares since
2003 (currently approximately R$212.1), in addition to legal fees and charges. If the Company
loses all these lawsuits, the issuance of 27,684,596 preferred shares and 6,881,719 common
shares would be necessary, with the Company receiving funds substantially lower than the
current market value of its shares.
Based on advice from legal counsel, management believes the likelihood of loss is possible.
Antitrust Matters
On July 22, 2009, CADE, the Brazilian antitrust authority, issued its ruling in connection with
Administrative Proceeding in 2004 as a result of a complaint filed by Schincariol (a South
F-102
American brewery and beverage maker based in Brazil) which had, as its main purpose, the
investigation of our conduct in the market, in particular our customer loyalty program known as
―Tô Contigo‖, which is similar to airline frequent flyer and other loyalty programs.
During its investigation, the Secretariat of Economic Law of the Ministry of Justice (―SDE‖)
concluded that the program should be considered anticompetitive unless certain adjustments
were made. These adjustments have already been substantially incorporated into the current
version of the Program. The SDE opinion did not suggest any fines and recommended that the
other accusations be dismissed. After the SDE opinion, the proceeding was sent to CADE, which
issued a ruling against the Company involving a fine in the amount of R$352.7.
Ambev believes that CADE’s decision is without merit and thus has challenged it in the federal
courts, which have ordered the suspension of the fine and other parts of the decision upon
rendering of guarantee. Ambev has already provided a letter of guarantee for this purpose.
Based on advice from legal counsel, management believes the likelihood of loss is possible and
therefore has not recorded a provision. We are also involved in other administrative proceedings
with CADE and SDE, relating to the investigation of certain matters of conduct, none of which
we believe contravene competition rules and regulations.
Suit against Brazilian Beer Industry
On October 28, 2008, federal prosecutors filed an action for indemnity against Ambev and two
other companies in the beverage industry, claiming damages totaling approximately R$2.8
billion (of which about R$2.1 billion is claimed from Ambev). The prosecutors allege that: (i)
alcohol causes serious harm to individual and public health, and beer is the alcoholic drink most
consumed in Brazil, (ii) the defendants have an approximately 90% share in the Brazilian beer
market, and make significant investments in advertising, and (iii) advertising campaigns not only
increase the market share of the defendants, but also the total alcohol consumption and,
consequently, the damage to society. Ambev believes that the action lacks merits and intends to
vigorously defend it. Shortly after the filing of such action, an association of consumer protection
requested their inclusion in the case. After the admission of a non-governmental organization as
a co-author of the action, the total amount claimed by authors rose to R$5.6 billion, being R$4.2
billion related to Ambev. The Company believes that the actions and lack of origin is defending
itself vigorously in this action.
Contingent assets
At December 31, 2010, the Company had no contingent assets, for which the probability of
success is probable, which require to be disclosed.
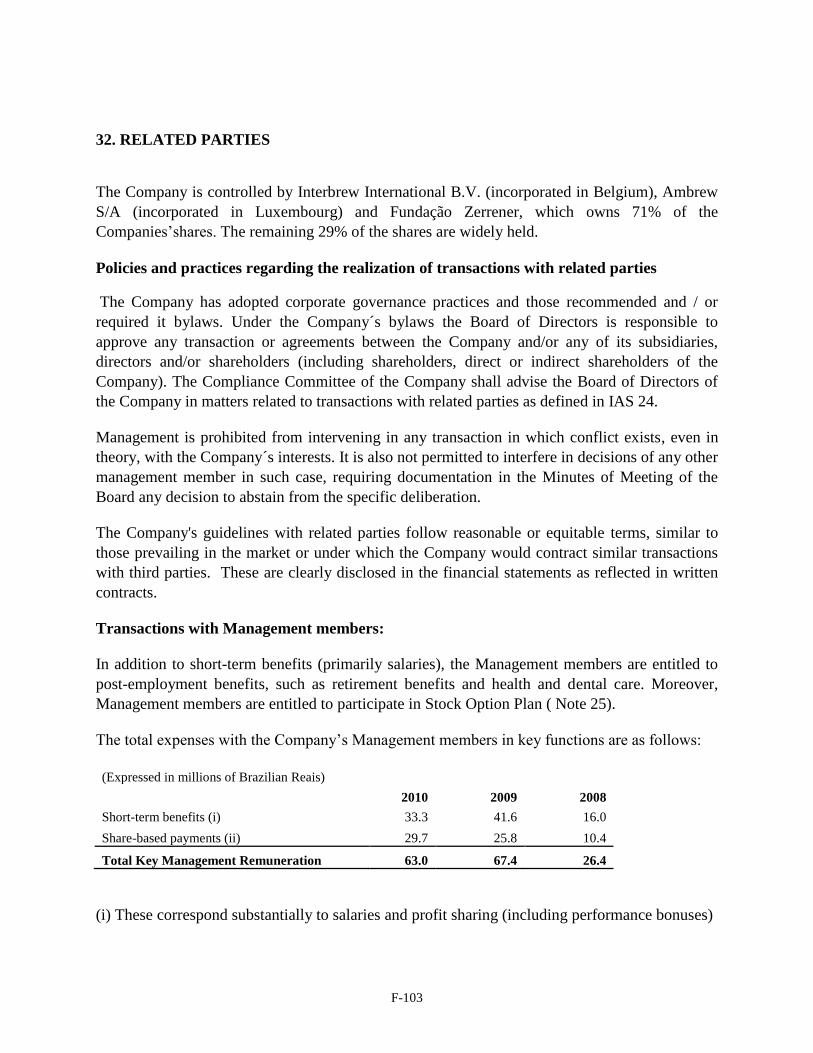
F-103
32. RELATED PARTIES
The Company is controlled by Interbrew International B.V. (incorporated in Belgium), Ambrew
S/A (incorporated in Luxembourg) and Fundação Zerrener, which owns 71% of the
Companies’shares. The remaining 29% of the shares are widely held.
Policies and practices regarding the realization of transactions with related parties
The Company has adopted corporate governance practices and those recommended and / or
required it bylaws. Under the Company´s bylaws the Board of Directors is responsible to
approve any transaction or agreements between the Company and/or any of its subsidiaries,
directors and/or shareholders (including shareholders, direct or indirect shareholders of the
Company). The Compliance Committee of the Company shall advise the Board of Directors of
the Company in matters related to transactions with related parties as defined in IAS 24.
Management is prohibited from intervening in any transaction in which conflict exists, even in
theory, with the Company´s interests. It is also not permitted to interfere in decisions of any other
management member in such case, requiring documentation in the Minutes of Meeting of the
Board any decision to abstain from the specific deliberation.
The Company's guidelines with related parties follow reasonable or equitable terms, similar to
those prevailing in the market or under which the Company would contract similar transactions
with third parties. These are clearly disclosed in the financial statements as reflected in written
contracts.
Transactions with Management members:
In addition to short-term benefits (primarily salaries), the Management members are entitled to
post-employment benefits, such as retirement benefits and health and dental care. Moreover,
Management members are entitled to participate in Stock Option Plan ( Note 25).
The total expenses with the Company’s Management members in key functions are as follows:
(Expressed in millions of Brazilian Reais)
2010 2009 2008
Short-term benefits (i) 33.3 41.6 16.0
Share-based payments (ii) 29.7 25.8 10.4
Total Key Management Remuneration 63.0 67.4 26.4
(i) These correspond substantially to salaries and profit sharing (including performance bonuses)
F-104
(ii) These correspond to the compensation cost of stock options granted to Management.
These amounts exclude remuneration paid to members of the Fiscal Council
Before January 1, 2003, Ambev had deferred payment stock purchase plans. Such an option,
however, has been removed from the stock ownership plans approved subsequent to the
enactment of the Sarbanes-Oxley Act.
Excluding the abovementioned plan, Ambev neither has any type of transaction with the
Management members nor pending balances receivable or payable in its balance sheet.
Transactions with the Company's shareholders:
a) Medical, dental and other benefits
The Fundação Zerrenner is one of the Company’s shareholders, and at December 31, 2010 held
16.91% of the voting rights and 9.519% of total share capital. Fundação Zerrenner is also a
independent legal entity whose main goal is to provide Ambev’s employees, both active and
retirees, with health care and dental assistance, technical and superior education courses,
facilities for assisting elderly people, among other things, through direct initiatives or through
financial assistance agreements with other entities. On December 31, 2010, 2009 and 2008,
actuarial liabilities related to the benefits provided directly by Fundação Zerrenner are fully
offset by the plans assets. As a result, the net liability recognized in the financial statements is
nil.
The expenses incurred by Fundação Zerrener (Formely ―Fundação Antonio e Helena Zerrener‖)
in providing these benefits mentioned totaled R$123.7 in the year ended December 31, 2010
(R$107.7 and R$93.3 - December 31, 2009 and 2008, respectively), of which R$105.8 (R$91.0
and R$81.0 - December 31, 2009 and 2008) related to active employees and R$17.9 (R$16.6 and
R$12.3 - December 31, 2009 and 2008, respectively) related to retirees.
b) Special Goodwill Reserve
As a result of the merger of InBev Holding Brazil SA by the Company in 2005, the Company
benefits in January of each year from the amortization of tax deductible goodwill pursuant to
CVM Instruction 319/99. As permitted by CVM Instruction 319/99 the Merger Protocol and
Justification signed on July 7, 2005, 70% of the special reserve for goodwill resulting from the
merger, corresponding to the tax benefit obtained by the Company as a result of the amortization
of the goodwill, is to be used to increase capital for the benefit of the controlling shareholders
(AmBrew and Interbrew) and the balance of 30% is to be capitalized without issuing new shares,
to the benefit of all shareholders. Pursuant to the agreement, starting in 2006, the reserve has
been used to increase capital. The balance of the special goodwill reserve at December 31, 2010
was R$1,496.0 (R$2,031.3 at December 31, 2009) and it may be used for future capital increases
in the proportions described above.
F-105
c) Leasing
The Company, through its subsidiary BSA (labeling), has an asset leasing agreement with
Fundação Zerrener, for R$64.8 for ten years, maturing in, 2018.
d) Leasing – Ambev head office
The Fundação Zerrenner and Ambev have a lease of two commercial sets, of R$ 6.4 maturing in
January 2013.
e) Labatt Brands
In 2009 the Company announced that KPS Capital Partners LP had become the exclusive
licensee of Labatt family beers (Note 8). As consequence of this licensing agreement, the
Company recognized a gain of R$ 239.4.
f) Licensing agreement
The Company maintains a licensing agreement with Anheuser-Busch, Inc., through Labatt
Canada and Cervepar (Note 1), to produce, bottle, sell and distribute Budweiser products in
Canada and Paraguay. In addition, the Company and certain of its subsidiaries produce and
distribute Stella Artois under license AB InBev in Brazil, Argentina e Canada. The amount
recorded was R$ 2.0 (R$2.3 in 2009) and R$169.1 (R$168.9 in 2009) as licensing income and
expense, respectively.
Jointly-controlled entities
Ambev reports its interest in jointly-controlled entities using the line-by-line reporting format for
proportionate consolidation. Significant interest in joint ventures include two distribution entities
in Canada and two entities in Brazil (Ice Tea and Agrega.). The following balances represent the
participation of Ambev in these entities and were included in the consolidated financial
statements:
(Expressed in millions of Brazilian Reais) 2010 2009 2008
Non-current assets 188.2 131.7 157.1
Current assets 102.2 95.2 130.7
Non-current liabilities 164.9 198.6 187.4
Current liabilities 334.7 160.1 123.9
Result from operations 22.0 16.3 13.0
Income attributable to shareholders 1.9 23.6 1.6
F-106
Transactions with associates
Ambev transactions with associates were as follows:
(Expressed in millions of Brazilian Reais) 2010 2009 2008
Net sales 11.2 11.1 10.5
Current liabilities 14.5 65.5 30.3
Transactions with associates include two entities in Argentina (Eco de Los Andes S.A and
Agrega S.A) and two entities in Canada (Guinness Canada Limited and Agrega Canada
Limited).
33. EVENTS AFTER THE BALANCE SHEET DATE
a) Dividend and interest on equity
On February 28, 2011, the Company approved the distribution of (i) dividends, to be deducted
from the reserve and attributed to the minimum mandatory dividends for 2010, at R$ 0.56 per
Common share and R$ 0.61 per Preferred share, without withholding income tax, pursuant to
applicable law.
The payments were made on March 22, 2011 (conditioned to approval of the Annual General
Meeting which will approve the 2010 financial statements). The record date was March 3, 2011
for BM&FBOVESPA shareholders and March 8, 2011 for ADR holders. Shares and ADRs shall
be traded ex-dividends as from March 4, 2011.
34. GROUP COMPANIES
Listed below are the main group companies. The total number of companies consolidated (fully
and proportionally) is 46.
Argentina
CERVECERIA Y MALTERIA QUILMES SAICA Y G - Av. Del
Libertador 498, 26º andar - Buenos Aires 99,7%
Bolivia
CERVECERIA BOLIVIANA NACIONAL S.A. - Av. Montes 400 e Rua
Chuquisaca - La Paz 85,6%
Brazil
COMPANHIA DE BEBIDAS DAS AMÉRICAS - AMBEV - Rua Dr.
Renato Paes de Barros, 1017, 4º andar, cj. 44 e 42 - Itaim Bibi, São
Consolidating
Company
F-107
Paulo.
AMBEV BRASIL BEBIDAS LTDA. - Avenida Antarctica, 1.891
Fazenda Santa Úrsula - Jaguariúna - São Paulo 100,0%
AROSUCO AROMAS E SUCOS LTDA. - Avenida Buriti, 5.385 Distrito
Industrial - Manaus - AM 100,0%
EAGLE DISTRIBUIDORA DE BEBIDAS S.A. - Avenida Antarctica,
1.891 Fazenda Santa Úrsula - Jaguariúna – São Paulo 100,0%
FRATELLI VITA BEBIDAS S.A. - Estrada do Engenho D'Água nº 199-
Fundos Jacarepaguá – Rio de Janeiro 99,5%
TAURUS INVESTMENTS SPC - Queensgate House, South Church
Street, P.O. Box 1234 George Town Grand Cayman Cayman
Islands 100,0%
Canada
LABATT BREWING COMPANY LIMITED - 207 Queens Quay West,
Suite 299 - M5J 1A7 - Toronto 100,0%
Dominican Republic
COMPAÑIA CERVECERA AMBEV DOMINICANA, C. POR A. - Av.
San Martin, 279 - Apartado Postal 723 - Santo Domingo 100,0%
Ecuador
Companhia Cervecera AMBEV ECUADOR S.A. - Km 14,5 - Vía
Dauley, Av. Las Iguanas - Guayaquil 100,0%
Guatemala
INDUSTRIAS DEL ATLÁNTICO, SOCIEDAD ANÓNIMA - 43 Calle
1-10 Clzd. Aguilar Bartres Zona 12, Edifício Mariposa, nível 4 -
01012 - Zacapa 50,0%
Paraguay
CERVECERIA PARAGUAY S.A. - Ruta Villeta KM 30 - Ypané 87,4%
Peru
COMPANÍA CERVECERA AMBEV PERU S.A.C. - Av. República de
Panamá, 3659 San Isidro - Lima 41 - Lima 100,0%
Uruguay
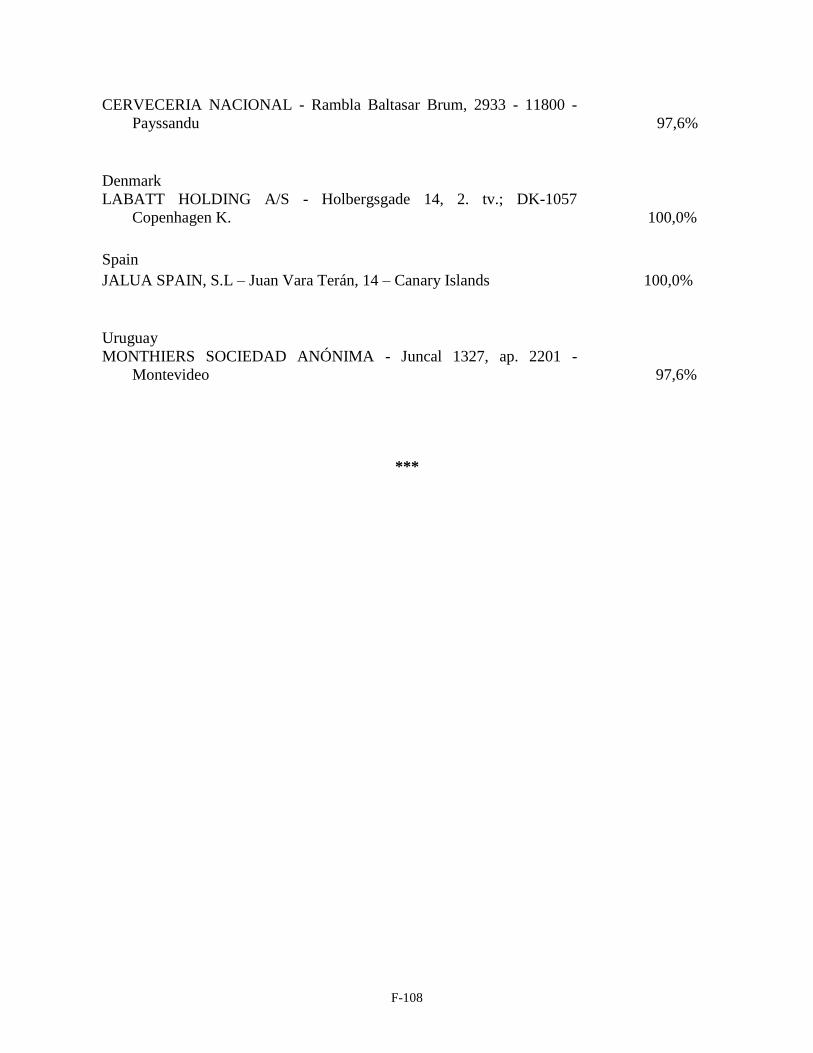
F-108
CERVECERIA NACIONAL - Rambla Baltasar Brum, 2933 - 11800 -
Payssandu 97,6%
Denmark
LABATT HOLDING A/S - Holbergsgade 14, 2. tv.; DK-1057
Copenhagen K. 100,0%
Spain
JALUA SPAIN, S.L – Juan Vara Terán, 14 – Canary Islands 100,0%
Uruguay
MONTHIERS SOCIEDAD ANÓNIMA - Juncal 1327, ap. 2201 -
Montevideo 97,6%
***

252
ITEM 18. FINANCIAL STATEMENTS
See ―Item 17.— Financial Statements.‖
253
ITEM 19 EXHIBITS
1.1 Bylaws of Companhia de Bebidas das Américas - Ambev (English-language translation) (incorporated by reference
to the Company’s filing on Form 6-K filed by Ambev on December 20, 2010)
1.2 Minutes of the Extraordinary Shareholders’ Meeting held on May 18, 2004 (incorporated by reference to Form 6-K
filed by Ambev on May 20, 2004).
2.1 Indenture dated December 19, 2001 between CBB and The Bank of New York as Trustee (incorporated by reference
to Exhibit 4.1 to Form F-4 filed by Ambev on August 29, 2002).
2.2 Form of Note (contained in Exhibit 2.1).
2.3 Insurance Policy for Expropriation and Currency Inconvertibility dated December 19, 2001 between Steadfast
Insurance Company and The Bank of New York (incorporated by reference to Exhibit 4.5 to Form F-4 filed by
Ambev on August 29, 2002).
2.4 Agreement Regarding the Insurance Policy for Expropriation and Currency Inconvertibility dated December 19,
2001 among Steadfast Insurance Company, The Bank of New York, Ambev and CBB (incorporated by reference to
Exhibit 4.6 to Form F-4 filed by Ambev on August 29, 2002).
2.5 Indenture dated September 18, 2003 between CBB and The Bank of New York as Trustee (incorporated by
reference to Exhibit 2.1 to Form 20-F filed by Ambev on June 30, 2004).
2.6 Form of Note (contained in Exhibit 2.5).
2.7 Agreement Regarding the Insurance Policy for Expropriation and Currency Inconvertibility by the Trustee, Ambev,
CBB and the Insurer, dated September 18, 2003 (incorporated by reference to Exhibit 2.5 to Form 20-F filed by
Ambev on June 30, 2004).
2.8 Application for Political Risk Insurance for Capital Markets Transactions, executed by the Trustee (incorporated by
reference to Exhibit 2.6 to Form 20-F filed by Ambev on June 30, 2004).
3.1 Amendment to the Shareholders’ Agreement of Companhia de Bebidas das Américas - Ambev dated as of March 2,
2004 among Fundação Zerrenner, Braco, ECAP, Ambev, Jorge Paulo Lemann, Marcel Herrmann Telles, and Carlos
Alberto da Veiga Sicupira (English-language translation) (incorporated by reference to Exhibit 2.16 to Amendment
No. 9 to Schedule 13D relating to Quinsa, filed by Ambev on March 9, 2004).
3.2 Incorporação Agreement dated March 3, 2004 (incorporated by reference to Exhibit 2.13 to Amendment No. 9 to
Schedule 13D relating to Quinsa, filed by Ambev on March 9, 2004).
3.3 Shareholders’ Voting Rights Agreement of S-Braco Participações S.A. dated as of August 30, 2002 among Santa
Judith, Santa Irene, Santa Estela and Santa Prudência Participações S.A., with Jorge Paulo Lemann, Carlos Alberto
da Veiga Sicupira and Marcel Herrmann Telles as intervening parties, and S-Braco, Braco, ECAP and Ambev as
acknowledging parties (English-language translation) (incorporated by reference to Exhibit C to Amendment No. 2
to Schedule 13D relating to Ambev, filed by Fundação Zerrenner, Braco and ECAP on November 29, 2002).
4.1 Termination of the Letter Agreement, dated June 22, 2004, between Labatt Holding, B.V. and Interbrew
International, B.V. (incorporated by reference to Exhibit 4.15 to Form 20-F filed by the Company on July 1, 2005).
4.2 Letter from InBev to Ambev and Labatt, relating to Labatt Tax Reassessment, dated March 4, 2005 (incorporated
by reference to Exhibit 4.16 to Form 20-F filed by the Company on July 1, 2005).
4.3 Confirmation of Intellectual Property and Hedging Arrangements, dated August 27, 2004, to Ambev and Labatt
from Interbrew S.A. (incorporated by reference to Exhibit 4.17 to Form 20-F filed by the Company on July 1,
2005).
4.4 Executed Letter Agreement dated July 22, 2004, to Ambev from Interbrew regarding the provision of certain
information relating to each business and its affiliates (incorporated by reference to Exhibit 4.18 to Form 20-F filed
by the Company on July 1, 2005).
254
4.5 Labatt Services Agreement, dated August 27, 2004, between Labatt Brewing and Interbrew S.A. regarding services
until December 31, 2004 (incorporated by reference to Exhibit 4.19 to Form 20-F filed by the Company on July 1,
2005).
4.6 Labatt Services Agreement, dated August 27, 2004, between Interbrew S.A. and Labatt Brewing regarding services
until December 31, 2004 (incorporated by reference to Exhibit 4.20 to Form 20-F filed by the Company on July 1,
2005).
4.7 Transfer Agreement, dated August 2004, among Interbrew S.A., Interbrew International, Ambev and Jalua Spain
S.L. (incorporated by reference to Exhibit 4.21 to Form 20-F filed by the Company on July 1, 2005)
4.8 License Agreement, dated March 21, 2005, between Ambev and InBev (incorporated by reference to Exhibit 4.22 to
Form 20-F filed by the Company on July 1, 2005).
4.9 Announcement of commencement of the Public Offer of non-share convertible and subordinated debentures, dated
August 3, 2006 (incorporated by reference to Exhibit 4.11 to Form 20-F filed by the Company on July 09, 2007).
4.10 Announcement of termination of the Public Offer of non-share convertible and subordinated debentures, dated
August 7, 2006 (incorporated by reference to Exhibit 4.12 to Form 20-F filed by the Company on July 09, 2007).
8.1 List of Material Subsidiaries of Companhia de Bebidas das Américas - Ambev.
11.1 Code of Business Conduct (English-language version) (formerly Code of Ethics) dated December 11, 2006
(incorporated by reference to Exhibit 11.1 to Form 20-F filed by the Company on July 09, 2007).
12.1 Principal Executive Officer Certification pursuant to Section 302 of the Sarbanes-Oxley Act of 2002.
12.2 Principal Financial Officer Certification pursuant to Section 302 of the Sarbanes-Oxley Act of 2002.
13.1 Principal Executive Officer Certification pursuant to Section 906 of the Sarbanes-Oxley Act of 2002.
13.2 Principal Financial Officer Certification pursuant to Section 906 of the Sarbanes-Oxley Act of 2002.
16F Auditors’ Letter Regarding Change in Auditor (incorporated by reference to Exhibit 16F to Form 20-F/A filed by
the company on October 12, 2010)
Pursuant to the requirements of Section 12 of the Securities Exchange Act of 1934, the registrant, Companhia
de Bebidas das Américas - Ambev, certifies that it meets all of the requirements for filing on Form 20-F and that it
has duly caused and authorized the undersigned to sign this annual report on Form 20-F on its behalf.
COMPANHIA DE BEBIDAS DAS
AMÉRICAS - AMBEV By: /s/ João Mauricio Giffoni de Castro
Neves Name: João Mauricio Giffoni de Castro
Neves Title: Chief Executive Officer By: /s/ Nelson José Jamel Name: Nelson José Jamel Title: Chief Financial Officer
Date: April 12, 2011
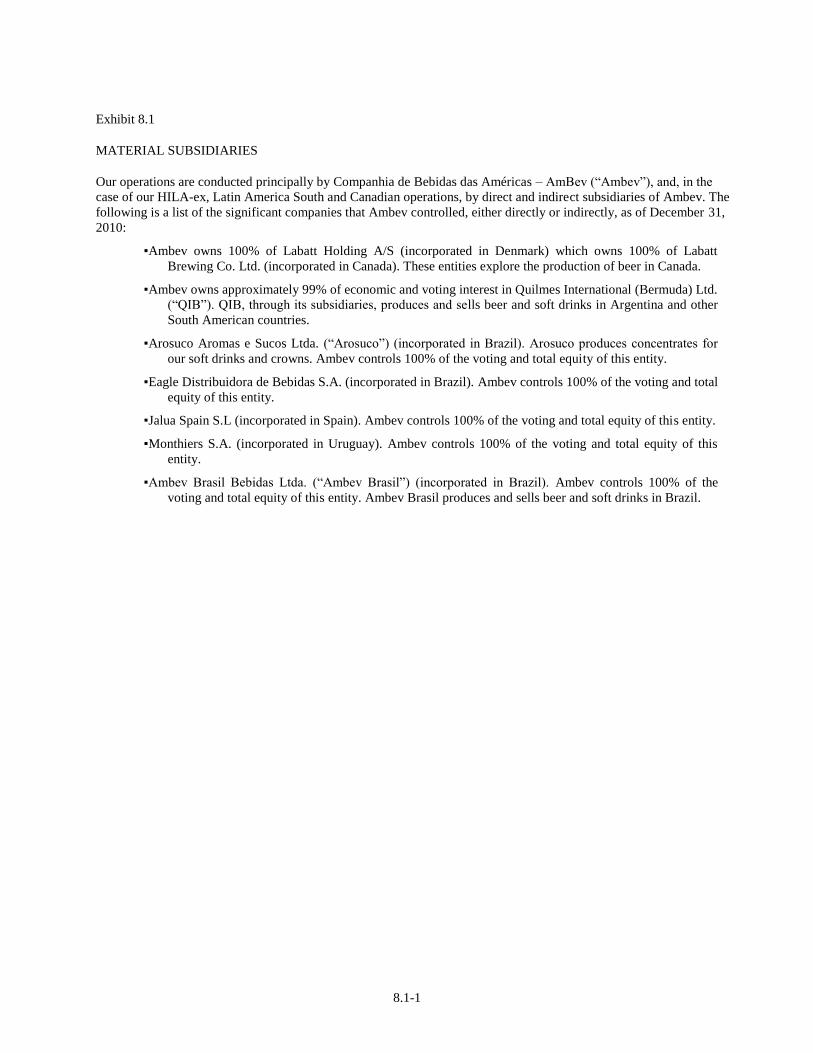
8.1-1
Exhibit 8.1
MATERIAL SUBSIDIARIES
Our operations are conducted principally by Companhia de Bebidas das Américas – AmBev (―Ambev‖), and, in the
case of our HILA-ex, Latin America South and Canadian operations, by direct and indirect subsidiaries of Ambev. The
following is a list of the significant companies that Ambev controlled, either directly or indirectly, as of December 31,
2010:
▪Ambev owns 100% of Labatt Holding A/S (incorporated in Denmark) which owns 100% of Labatt
Brewing Co. Ltd. (incorporated in Canada). These entities explore the production of beer in Canada.
▪Ambev owns approximately 99% of economic and voting interest in Quilmes International (Bermuda) Ltd.
(―QIB‖). QIB, through its subsidiaries, produces and sells beer and soft drinks in Argentina and other
South American countries.
▪Arosuco Aromas e Sucos Ltda. (―Arosuco‖) (incorporated in Brazil). Arosuco produces concentrates for
our soft drinks and crowns. Ambev controls 100% of the voting and total equity of this entity.
▪Eagle Distribuidora de Bebidas S.A. (incorporated in Brazil). Ambev controls 100% of the voting and total
equity of this entity.
▪Jalua Spain S.L (incorporated in Spain). Ambev controls 100% of the voting and total equity of this entity.
▪Monthiers S.A. (incorporated in Uruguay). Ambev controls 100% of the voting and total equity of this
entity.
▪Ambev Brasil Bebidas Ltda. (―Ambev Brasil‖) (incorporated in Brazil). Ambev controls 100% of the
voting and total equity of this entity. Ambev Brasil produces and sells beer and soft drinks in Brazil.
12.1-1
Exhibit 12.1
PRINCIPAL EXECUTIVE OFFICER CERTIFICATION
I, João Mauricio Giffoni de Castro Neves, certify that:
1. I have reviewed this annual report on Form 20-F of Companhia de Bebidas das Américas—Ambev (the
―Company‖);
2. Based on my knowledge, this report does not contain any untrue statement of a material fact or omit to state
a material fact necessary to make the statements made, in light of the circumstances under which such statements
were made, not misleading with respect to the period covered by this report;
3. Based on my knowledge, the financial statements, and other financial information included in this report,
fairly present in all material respects the financial condition, results of operations and cash flows of the Company as
of, and for, the periods presented in this report;
4. The Company’s other certifying officer and I are responsible for establishing and maintaining disclosure
controls and procedures (as defined in Exchange Act Rules 13a-15(e) and 15d-15(e)) and internal control over
financial reporting (as defined in Exchange Act Rules 13a-15(f) and 15d-15(f)) for the Company and have:
a. Designed such disclosure controls and procedures, or caused such disclosure controls and procedures to be
designed under our supervision, to ensure that material information relating to the Company, including its
consolidated subsidiaries, is made known to us by others within those entities, particularly during the period in
which this report is being prepared;
b. Designed such internal control over financial reporting, or caused such internal control over financial
reporting to be designed under our supervision, to provide reasonable assurance regarding the reliability of
financial reporting and the preparation of financial statements for external purposes in accordance with
generally accepted accounting principles;
c. Evaluated the effectiveness of the Company’s disclosure controls and procedures and presented in this
report our conclusions about the effectiveness of the disclosure controls and procedures, as of the end of the
period covered by this report based on such evaluation; and
d. Disclosed in this report any change in the Company’s internal control over financial reporting that occurred
during the period covered by the annual report that has materially affected, or is reasonably likely to materially
affect, the Company’s internal control over financial reporting; and
5. The Company’s other certifying officer and I have disclosed, based on our most recent evaluation of
internal control over financial reporting, to the Company’s auditors and the audit committee of Company’s Board of
Directors (or persons performing the equivalent functions):
a. All significant deficiencies and material weaknesses in the design or operation of internal control over
financial reporting which are reasonably likely to adversely affect the Company’s ability to record, process,
summarize and report financial information; and
b. Any fraud, whether or not material, that involves management or other employees who have a significant
role in the Company’s internal control over financial reporting.

12.1-2
Date: April 12, 2011
/s/ João Mauricio Giffoni de Castro Neves
Name: João Mauricio Giffoni de Castro
Neves
Title: Chief Executive Officer
12.2-1
Exhibit 12.2
PRINCIPAL FINANCIAL OFFICER CERTIFICATION
I, Nelson José Jamel, certify that:
1. I have reviewed this annual report on Form 20-F of Companhia de Bebidas das Américas—Ambev (the
―Company‖);
2. Based on my knowledge, this report does not contain any untrue statement of a material fact or omit to state
a material fact necessary to make the statements made, in light of the circumstances under which such statements
were made, not misleading with respect to the period covered by this report;
3. Based on my knowledge, the financial statements, and other financial information included in this report,
fairly present in all material respects the financial condition, results of operations and cash flows of the Company as
of, and for, the periods presented in this report;
4. The Company’s other certifying officer and I are responsible for establishing and maintaining disclosure
controls and procedures (as defined in Exchange Act Rules 13a-15(e) and 15d-15(e)) and internal control over
financial reporting (as defined in Exchange Act Rules 13a-15(f) and 15d-15(f)) for the Company and have:
a. Designed such disclosure controls and procedures, or caused such disclosure controls and procedures to be
designed under our supervision, to ensure that material information relating to the Company, including its
consolidated subsidiaries, is made known to us by others within those entities, particularly during the period
in which this report is being prepared;
b. Designed such internal control over financial reporting, or caused such internal control over financial
reporting to be designed under our supervision, to provide reasonable assurance regarding the reliability of
financial reporting and the preparation of financial statements for external purposes in accordance with
generally accepted accounting principles;
c. Evaluated the effectiveness of the Company’s disclosure controls and procedures and presented in this
report our conclusions about the effectiveness of the disclosure controls and procedures, as of the end of the
period covered by this report based on such evaluation; and
d. Disclosed in this report any change in the Company’s internal control over financial reporting that occurred
during the period covered by the annual report that has materially affected, or is reasonably likely to
materially affect, the Company’s internal control over financial reporting; and
5. The Company’s other certifying officer and I have disclosed, based on our most recent evaluation of
internal control over financial reporting, to the Company’s auditors and the audit committee of Company’s Board of
Directors (or persons performing the equivalent functions):
a. All significant deficiencies and material weaknesses in the design or operation of internal control over
financial reporting which are reasonably likely to adversely affect the Company’s ability to record, process,
summarize and report financial information; and
b. Any fraud, whether or not material, that involves management or other employees who have a significant
role in the Company’s internal control over financial reporting.

12.2-2
Date: April 12, 2011
/s/ Nelson José Jamel
Name: Nelson José Jamel
Title: Chief Financial Officer
13.1-1
Exhibit 13.1
Certification of the Principal Executive Officer
Pursuant to 18 U.S.C. Section 1350,
As Adopted Pursuant to Section 906 of the Sarbanes - Oxley Act of 2002
In connection with the annual report of Companhia de Bebidas das Américas – Ambev (the ―Company‖) on
Form 20–F for the year ended December 31, 2010 as filed with the Securities and Exchange Commission on the date
hereof (the ―Report‖), I, João Mauricio Giffoni de Castro Neves, Chief Executive Officer of the Company, certify,
pursuant to 18 U.S.C. § 1350, as adopted pursuant to Section 906 of the Sarbanes–Oxley Act of 2002, that:
(1) The Report fully complies with the requirements of Section 13(a) or 15(d) of the Securities Exchange
Act of 1934; and
(2) The information contained in the Report fairly presents, in all material respects, the financial condition
and results of operations of the Company.
Date: April 12, 2011
/s/ João Mauricio Giffoni de Castro Neves
Name: João Mauricio Giffoni de Castro
Neves
Title: Chief Executive Officer
A signed original of this written statement required by Section 906 has been provided to the Company and
will be retained by the Company and furnished to the Securities and Exchange Commission or its staff upon request.
13.2-1
Exhibit 13.2
Certification of the Principal Financial Officer
Pursuant to 18 U.S.C. Section 1350,
As Adopted Pursuant to Section 906 of the Sarbanes - Oxley Act of 2002
In connection with the annual report of Companhia de Bebidas das Américas – Ambev (the Company) on
Form 20–F for the year ended December 31, 2010 as filed with the Securities and Exchange Commission on the date
hereof (the ―Report‖), I, Nelson José Jamel, Chief Financial Officer of the Company, certify, pursuant to 18 U.S.C.
§ 1350, as adopted pursuant to Section 906 of the Sarbanes–Oxley Act of 2002, that:
(1) The Report fully complies with the requirements of Section 13(a) or 15(d) of the Securities Exchange
Act of 1934; and
(2) The information contained in the Report fairly presents, in all material respects, the financial condition
and results of operations of the Company.
Date: April 12, 2011
/s/ Nelson José Jamel
Name: Nelson José Jamel
Title: Chief Financial Officer A signed original of this written statement required by Section 906 has been provided to the Company and will be
retained by the Company and furnished to the Securities and Exchange Commission or its staff upon request.