algebra ii semester 2 (quarter 3) unit 3: inferences …...algebra ii semester 2 (quarter 3) unit 3:...
TRANSCRIPT
HIGLEY UNIFIED SCHOOL DISTRICT INSTRUCTIONAL ALIGNMENT
Algebra II Semester 2 (Quarter 3) Unit 3: Inferences and Conclusions from Data
Topic A: Probability The concepts of probability and statistics covered in Algebra II build on students’ previous work in Grade 7 and Algebra I. Topics A and B address standards S-CP.A.1–5 and S-CP.B.6–7, which deal primarily with probability. In Topic A, fundamental ideas from Grade 7 are revisited and extended to allow students to build a more formal understanding of probability. More complex events are considered (unions, intersections, complements) (S-CP.A.1). Students calculate probabilities based on two-way data tables and interpret them in context (S-CP.A.4). They also see how to create “hypothetical 1000” two-way tables as a way of calculating probabilities. Students are introduced to conditional probability (S-CP.A.3, S-CP.A.5), and the important concept of independence is developed (S-CP.A.2, S-CP.A.5). The final lessons in this topic introduce probability rules (S-CP.B.6, S-CP.B.7).
Big Idea:
• Events can be described as a subset of a sample space. • The probability of two events occurring together is the product of their probabilities, if and only if then the events are independent. • The probability of two events can be conditional on each other and the interpretation of that probability. • Two-way frequency tables can be used to decide if events are independent and to find conditional probabilities. • Conditional probability and independence are applied to everyday situations. • Conditional probability of A given B can be found and interpreted in context. • The addition rule can be applied and the resulting probability can be interpreted in context.
Essential Questions:
• How can an event be described as a subset of outcomes using correct set notation? • How are probabilities, including joint probabilities, of independent events calculated? • How are probabilities of independent events compared to their joint probability? • How does conditional probability apply to real-life events? • How are two-way frequency tables used to model real-life data? • How are conditional probabilities and independence interpreted in relation to a situation? • What is the difference between compound and conditional probabilities? • How is the probability of event (A or B) found?
Vocabulary Sample space, event, probability of an event, two-way frequency table, hypothetical 1000 two-way table, conditional probability, independent event, complement rule, addition rule, disjoint events
Standard AZ College and Career Readiness Standards Explanations & Examples Resources
S.IC.A.2
A. Understand and evaluate random processes underlying statistical experiments. Decide if a specified model is consistent with results from a given data-generating process, e.g., using
Explanation: Students explain how well and why a sample represents the variable of interest from a population.
Examples:
• Multiple groups flip coins. One group flips a coin 5 times, one
Eureka Math Module 4 Lesson 1
7/4/2016 Page 1 of 42
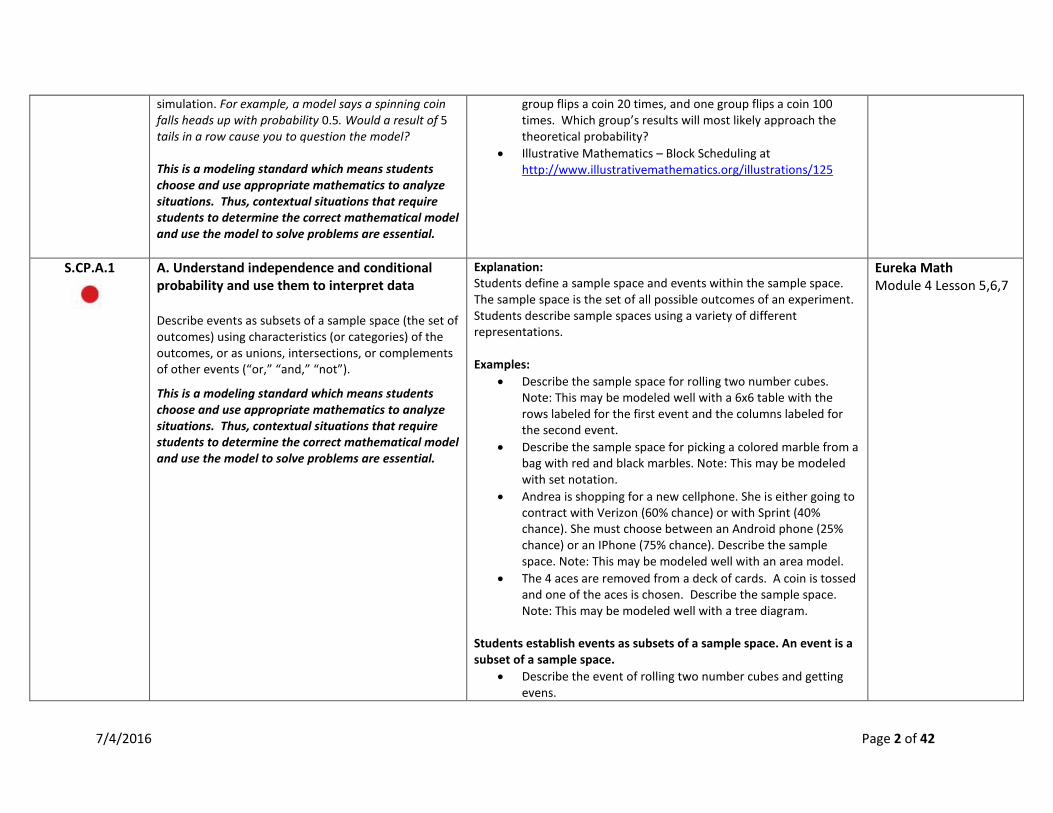
simulation. For example, a model says a spinning coin falls heads up with probability 0.5. Would a result of 5 tails in a row cause you to question the model? This is a modeling standard which means students choose and use appropriate mathematics to analyze situations. Thus, contextual situations that require students to determine the correct mathematical model and use the model to solve problems are essential.
group flips a coin 20 times, and one group flips a coin 100 times. Which group’s results will most likely approach the theoretical probability?
• Illustrative Mathematics – Block Scheduling at http://www.illustrativemathematics.org/illustrations/125
S.CP.A.1
A. Understand independence and conditional probability and use them to interpret data Describe events as subsets of a sample space (the set of outcomes) using characteristics (or categories) of the outcomes, or as unions, intersections, or complements of other events (“or,” “and,” “not”).
This is a modeling standard which means students choose and use appropriate mathematics to analyze situations. Thus, contextual situations that require students to determine the correct mathematical model and use the model to solve problems are essential.
Explanation: Students define a sample space and events within the sample space. The sample space is the set of all possible outcomes of an experiment. Students describe sample spaces using a variety of different representations. Examples:
• Describe the sample space for rolling two number cubes. Note: This may be modeled well with a 6x6 table with the rows labeled for the first event and the columns labeled for the second event.
• Describe the sample space for picking a colored marble from a bag with red and black marbles. Note: This may be modeled with set notation.
• Andrea is shopping for a new cellphone. She is either going to contract with Verizon (60% chance) or with Sprint (40% chance). She must choose between an Android phone (25% chance) or an IPhone (75% chance). Describe the sample space. Note: This may be modeled well with an area model.
• The 4 aces are removed from a deck of cards. A coin is tossed and one of the aces is chosen. Describe the sample space. Note: This may be modeled well with a tree diagram.
Students establish events as subsets of a sample space. An event is a subset of a sample space.
• Describe the event of rolling two number cubes and getting evens.
Eureka Math Module 4 Lesson 5,6,7
7/4/2016 Page 2 of 42
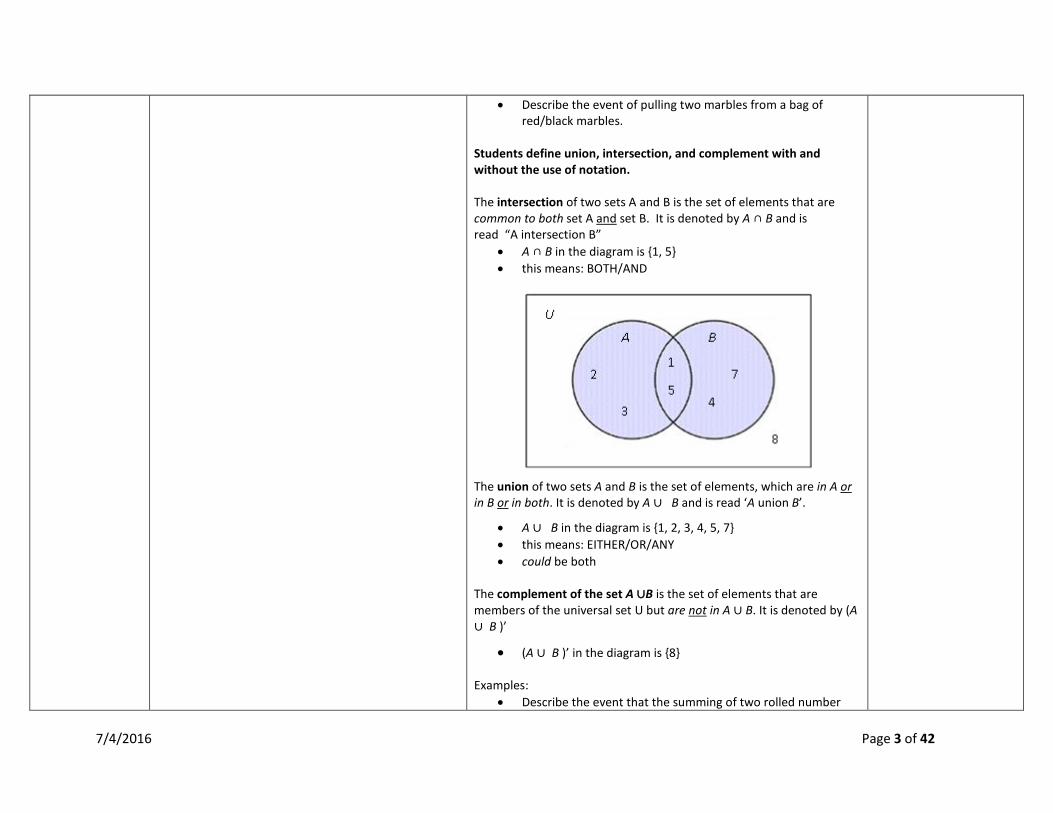
• Describe the event of pulling two marbles from a bag of red/black marbles.
Students define union, intersection, and complement with and without the use of notation. The intersection of two sets A and B is the set of elements that are common to both set A and set B. It is denoted by A ∩ B and is read “A intersection B”
• A ∩ B in the diagram is {1, 5} • this means: BOTH/AND
The union of two sets A and B is the set of elements, which are in A or in B or in both. It is denoted by A ∪ B and is read ‘A union B’.
• A ∪ B in the diagram is {1, 2, 3, 4, 5, 7} • this means: EITHER/OR/ANY • could be both
The complement of the set A ∪B is the set of elements that are members of the universal set U but are not in A ∪ B. It is denoted by (A ∪ B )’
• (A ∪ B )’ in the diagram is {8} Examples:
• Describe the event that the summing of two rolled number
7/4/2016 Page 3 of 42
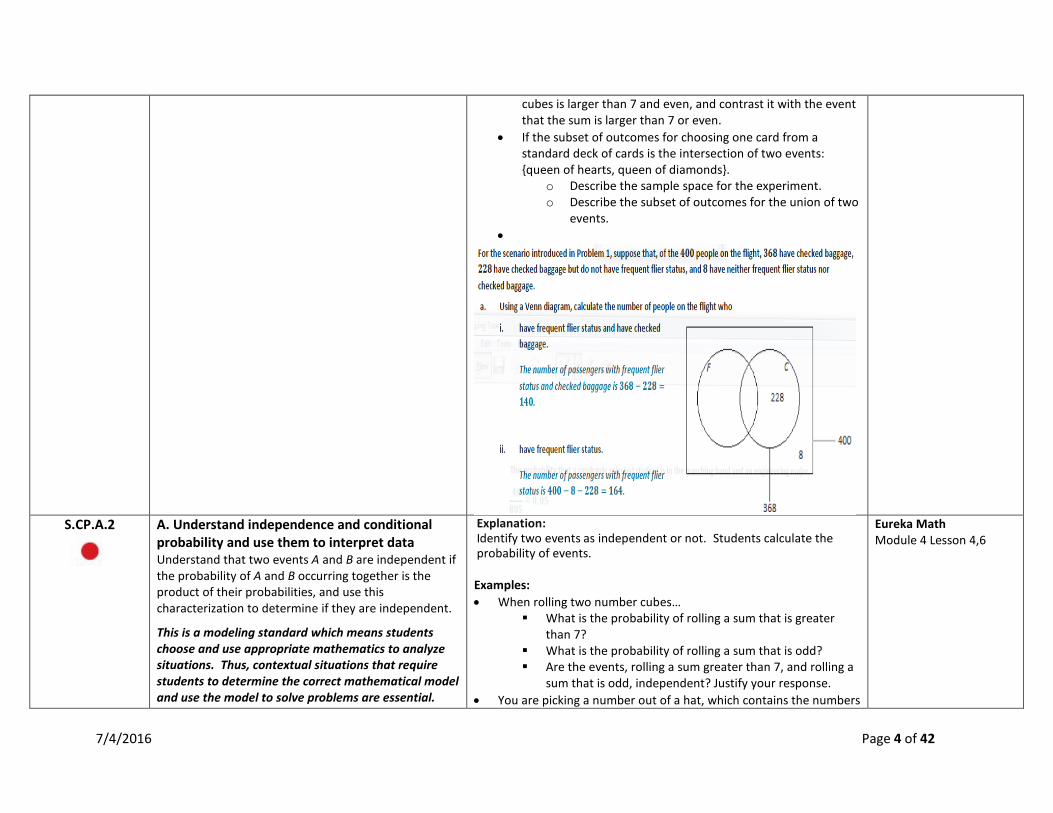
cubes is larger than 7 and even, and contrast it with the event that the sum is larger than 7 or even.
• If the subset of outcomes for choosing one card from a standard deck of cards is the intersection of two events: {queen of hearts, queen of diamonds}.
o Describe the sample space for the experiment. o Describe the subset of outcomes for the union of two
events. •
S.CP.A.2
A. Understand independence and conditional probability and use them to interpret data Understand that two events A and B are independent if the probability of A and B occurring together is the product of their probabilities, and use this characterization to determine if they are independent.
This is a modeling standard which means students choose and use appropriate mathematics to analyze situations. Thus, contextual situations that require students to determine the correct mathematical model and use the model to solve problems are essential.
Explanation: Identify two events as independent or not. Students calculate the probability of events. Examples: • When rolling two number cubes…
What is the probability of rolling a sum that is greater than 7?
What is the probability of rolling a sum that is odd? Are the events, rolling a sum greater than 7, and rolling a
sum that is odd, independent? Justify your response. • You are picking a number out of a hat, which contains the numbers
Eureka Math Module 4 Lesson 4,6
7/4/2016 Page 4 of 42
1 through 100. What are the following events and their probabilities?
The number has a single digit The number has two digits The number is a multiple of 4 The number is not a multiple of 4 The sum of the number’s digits is 5
Students understand that two events A and B are independent when the probability that one event occurs in no way affects the probability of the other event occurring. In other words, the probability of A is the same even of event B has occurred.
• If events are independent then the 𝑃𝑃 𝐴𝐴 ∩ 𝐵𝐵 = 𝑃𝑃 (𝐴𝐴) ∙ 𝑃𝑃 (𝐵𝐵) Examples:
• Determine if the events are independent or not. Explain your reasoning.
o Flipping a coin and getting heads and rolling a number cube and getting a 4
o When rolling a pair of number cubes consider the events: getting a sum of 7 and getting doubles
o From a standard deck of cards consider the events: draw a diamond and draw an ace
S.CP.A.3
A. Understand independence and conditional probability and use them to interpret data Understand the conditional probability of A given B as P(A and B)/P(B), and interpret independence of A and B as saying that the conditional probability of A given B is the same as the probability of A, and the conditional probability of B given A is the same as the probability of B.
This is a modeling standard which means students choose and use appropriate mathematics to analyze situations. Thus, contextual situations that require students to determine the correct mathematical model and use the model to solve problems are essential.
Explanation: Define and calculate conditional probabilities. Use the Multiplication Principal to decide if two events are independent and to calculate conditional probabilities. Students understand conditional probability as the probability of A occurring given B has occurred. Examples:
• What is the probability that the sum of two rolled number cubes is 6 given that you rolled doubles?
• Each student in the Junior class was asked if they had to complete chores at home and if they had a curfew. The table represents the data.
Eureka Math Module 4 Lesson 3,4,6
7/4/2016 Page 5 of 42
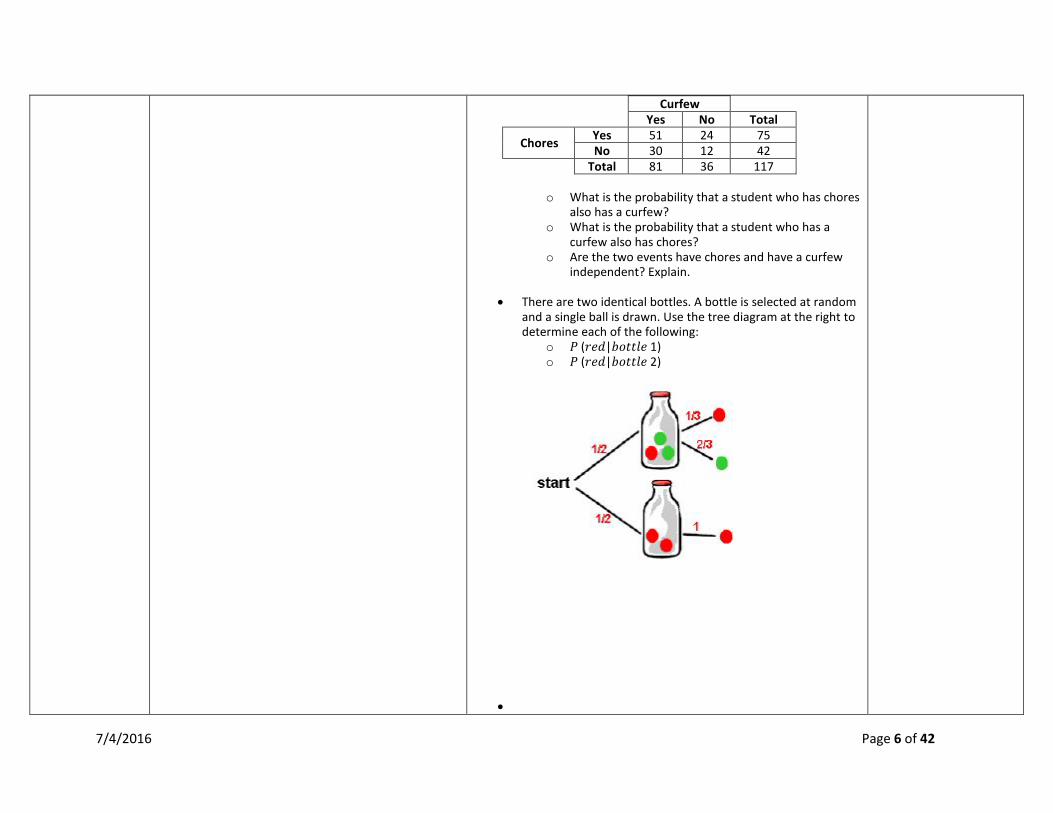
Curfew Yes No Total
Chores Yes 51 24 75 No 30 12 42
Total 81 36 117
o What is the probability that a student who has chores also has a curfew?
o What is the probability that a student who has a curfew also has chores?
o Are the two events have chores and have a curfew independent? Explain.
• There are two identical bottles. A bottle is selected at random and a single ball is drawn. Use the tree diagram at the right to determine each of the following:
o 𝑃𝑃 (𝑟𝑟𝑒𝑒𝑑𝑑|𝑏𝑏𝑜𝑜𝑡𝑡𝑡𝑡𝑙𝑙𝑒𝑒 1) o 𝑃𝑃 (𝑟𝑟𝑒𝑒𝑑𝑑|𝑏𝑏𝑜𝑜𝑡𝑡𝑡𝑡𝑙𝑙𝑒𝑒 2)
•
7/4/2016 Page 6 of 42
•
S.CP.A.4
A. Understand independence and conditional probability and use them to interpret data Construct and interpret two-way frequency tables of data when two categories are associated with each object being classified. Use the two-way table as a sample space to decide if events are independent and to approximate conditional probabilities. For example, collect data from a random sample of students in your
Explanation: Students may use spreadsheets, graphing calculators, and simulations to create frequency tables and conduct analyses to determine if events are independent or determine approximate conditional probabilities. Students –
• Determine when a two-way frequency table is an appropriate display for a set of data
• Collect data from a random sample
Eureka Math Module 4 Lesson 2,3,4
7/4/2016 Page 7 of 42
school on their favorite subject among math, science, and English. Estimate the probability that a randomly selected student from your school will favor science given that the student is in tenth grade. Do the same for other subjects and compare the results.
This is a modeling standard which means students choose and use appropriate mathematics to analyze situations. Thus, contextual situations that require students to determine the correct mathematical model and use the model to solve problems are essential.
• Construct a two-way frequency table for the data using the appropriate categories for each variable
• Calculate probabilities from the table • Use probabilities from the table to evaluate independence of
two variables
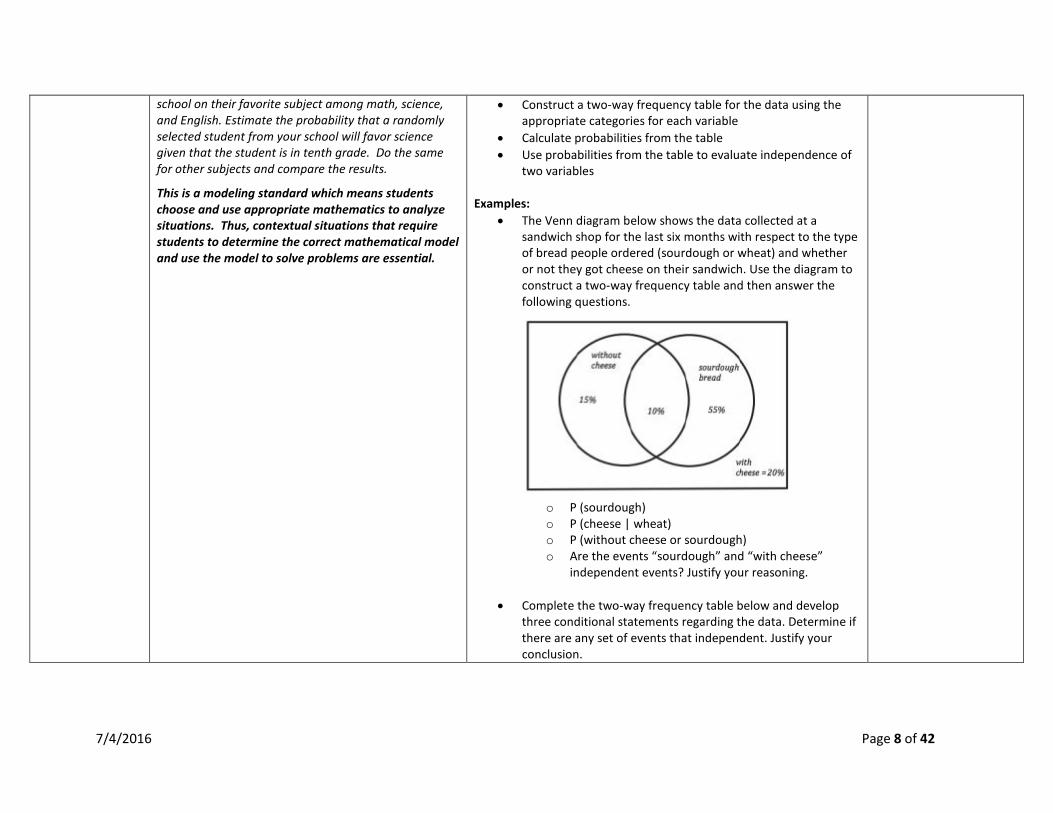
Examples: • The Venn diagram below shows the data collected at a
sandwich shop for the last six months with respect to the type of bread people ordered (sourdough or wheat) and whether or not they got cheese on their sandwich. Use the diagram to construct a two-way frequency table and then answer the following questions.
o P (sourdough) o P (cheese | wheat) o P (without cheese or sourdough) o Are the events “sourdough” and “with cheese”
independent events? Justify your reasoning.
• Complete the two-way frequency table below and develop three conditional statements regarding the data. Determine if there are any set of events that independent. Justify your conclusion.
7/4/2016 Page 8 of 42
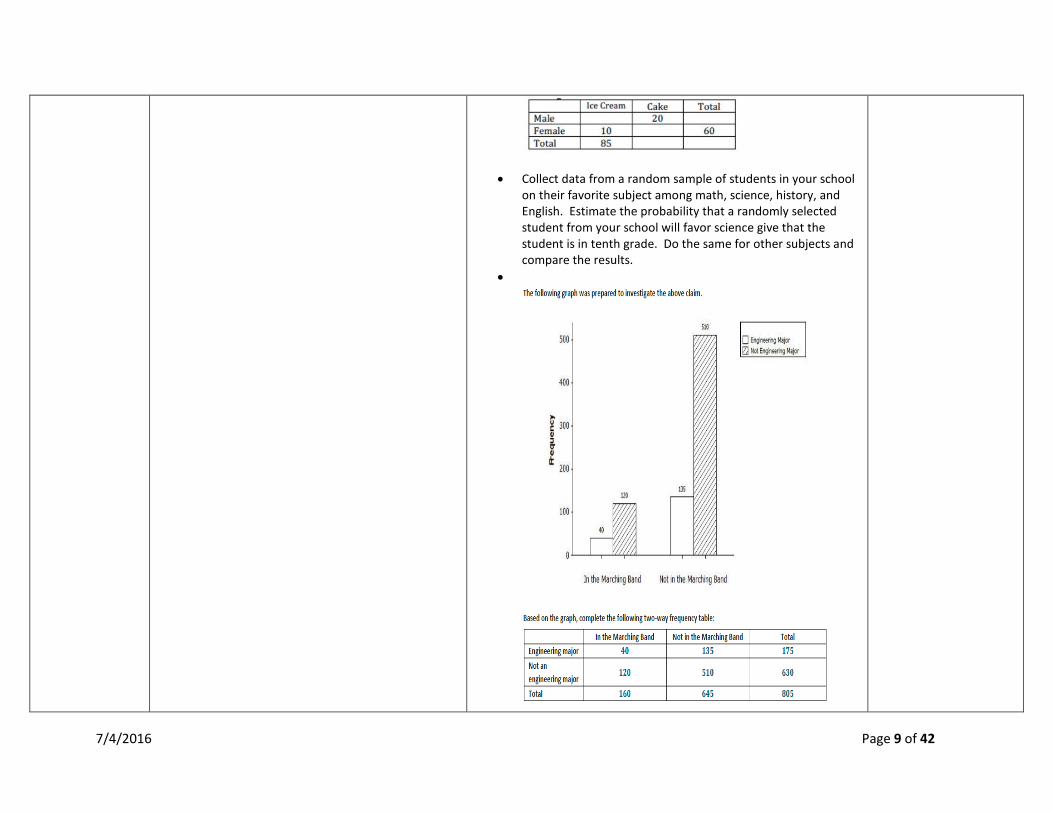
• Collect data from a random sample of students in your school on their favorite subject among math, science, history, and English. Estimate the probability that a randomly selected student from your school will favor science give that the student is in tenth grade. Do the same for other subjects and compare the results.
•
7/4/2016 Page 9 of 42
S.CP.A.5
A. Understand independence and conditional probability and use them to interpret data Recognize and explain the concepts of conditional probability and independence in everyday language and everyday situations. For example, compare the chance of having lung cancer if you are a smoker with the chance of being a smoker if you have lung cancer.
This is a modeling standard which means students choose and use appropriate mathematics to analyze situations. Thus, contextual situations that require students to determine the correct mathematical model and use the model to solve problems are essential.
Explanation: Students explain properties of independence and conditional probabilities in context and everyday language. Examples:
• Felix is a good chess player and a good math student. Do you think that the events “being good at playing chess” and “being a good math student” are independent or dependent? Justify your answer.
• Juanita flipped a coin 10 times and got the following results: T, H, T, T, H, H, H, H, H, H. Her math partner Harold thinks that the next flip is going to result in tails because there have been so many heads in a row. Do you agree? Explain why or why not.
• At your high school the probability that a student takes a Business class and Spanish is 0.062. The probability that a student takes a Business class is 0.43. What is the probability that a student takes Spanish given that the student is taking a Business class?
• What is the probability of drawing a heart from a standard deck of cards on a second draw, given that a heart was drawn on the first draw and not replaced? Are these events independent or dependent?
• At Johnson Middle School, the probability that a student takes computer science and French is 0.062. The probability that a student takes computer science is 0.43. What is the probability that a student takes French given that the student is taking computer science?
Eureka Math Module 4 Lesson 4-6
S.CP.B.6
B. Use the rules of probability to compute probabilities of compound events in a uniform probability model
Find the conditional probability of A given B as the fraction of B’s outcomes that also belong to A, and interpret the answer in terms of the model. This is a modeling standard which means students choose and use appropriate mathematics to analyze
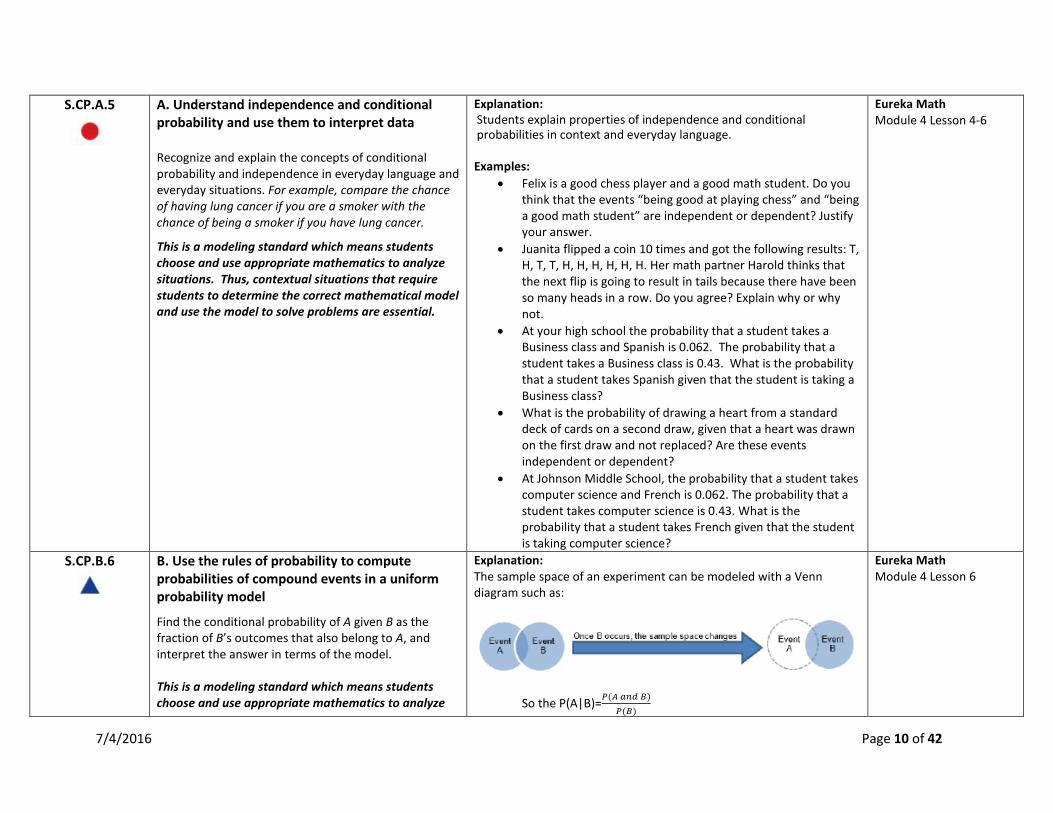
Explanation: The sample space of an experiment can be modeled with a Venn diagram such as:
So the P(A|B)=𝑃𝑃(𝐴𝐴 𝑎𝑎𝑎𝑎𝑎𝑎 𝐵𝐵)𝑃𝑃(𝐵𝐵)
Eureka Math Module 4 Lesson 6
7/4/2016 Page 10 of 42
situations. Thus, contextual situations that require students to determine the correct mathematical model and use the model to solve problems are essential.
Students could use graphing calculators, simulations, or applets to model probability experiments and interpret the outcomes. Examples:
• Peter has a bag of marbles. In the bag are 4 white marbles, 2 blue marbles, and 6 green marbles. Peter randomly draws one marble, sets it aside, and then randomly draws another marble. What is the probability of Peter drawing out two green marbles? Note: Students must recognize that this a conditional probability P(green | green).
• A teacher gave her class two quizzes. 30% of the class passed both quizzes and 60% of the class passed the first quiz. What percent of those who passed the first quiz also passed the second quiz?
• If a balanced tetrahedron with faces 1, 2, 3, 4 is rolled twice, what is the probability that the sum is prime (A) of those that show a 3 on at least one roll (B)?
7/4/2016 Page 11 of 42
S.CP.B.7
B. Use the rules of probability to compute probabilities of compound events in a uniform probability model
Apply the Addition Rule, P(A or B) = P(A) + P(B) – P(A and B), and interpret the answer in terms of the model.
This is a modeling standard which means students choose and use appropriate mathematics to analyze situations. Thus, contextual situations that require students to determine the correct mathematical model and use the model to solve problems are essential.
Explanation: Students understand that the 𝑷𝑷(𝑨𝑨 𝒐𝒐𝒐𝒐 𝑩𝑩) = 𝑷𝑷(𝑨𝑨) + 𝑷𝑷(𝑩𝑩) −𝑷𝑷(𝑨𝑨 𝒂𝒂𝒂𝒂𝒂𝒂 𝑩𝑩). Students may recognize that if two events A and B are mutually exclusive, also called disjoint, the rule can be simplified to 𝑷𝑷(𝑨𝑨 𝒐𝒐𝒐𝒐 𝑩𝑩) = 𝑷𝑷(𝑨𝑨) + 𝑷𝑷(𝑩𝑩) since for mutually exclusive events (𝑨𝑨 𝒂𝒂𝒂𝒂𝒂𝒂 𝑩𝑩) = 𝟎𝟎 .
Students could use graphing calculators, simulations, or applets to model probability experiments and interpret the outcomes.
Example:
• Given the situation of drawing a card from a standard deck of cards, calculate the probability of the following:
o Drawing a red card or a king o Drawing a ten or a spade o Drawing a four or a queen
• In a math class of 32 students, 18 are boys and 14 are girls. On
a unit test, 5 boys and 7 girls made an A grade. If a student is chosen at random from the class, what is the probability of choosing a girl or an A student?
•
Eureka Math Module 4 Lesson 7
7/4/2016 Page 12 of 42
Algebra II Semester 2 (Quarter 3) Unit 3: Inferences and Conclusions from Data
Topic B: Modeling Data Distributions Topic B is a short topic consisting of four lessons. This topic introduces the idea of using a smooth curve to model a data distribution, describes properties of the normal distribution, and asks students to distinguish between data distributions for which it would be reasonable to use a normal distribution as a model and those for which a normal distribution would not be a reasonable model. Students use tables and technology to find areas under a normal curve and interpret these areas in the context of modeling a data distribution (S-ID.A.4).
Big Idea: • Statistics is a process of making inferences. • The mean and standard deviation of a data set is used to fit a normal distribution.
Essential Questions:
• How is a data set fit to a normal curve?
Vocabulary Standard deviation, deviations, symmetric, skewed, center, shape, spread, normal curve, mean, z scores, normal distribution, normal probability
Standard AZ College and Career Readiness Standards Explanations & Examples Resources
S.ID.A.4
A. Summarize, represent, and interpret data on a single count or measurement variable Use the mean and standard deviation of a data set to fit it to a normal distribution and to estimate population percentages. Recognize that there are data sets for which such a procedure is not appropriate. Use calculators, spreadsheets, and tables to estimate areas under the normal curve.
This is a modeling standard which means students choose and use appropriate mathematics to analyze situations. Thus, contextual situations that require students to determine the correct mathematical model and use the model to solve problems are essential.
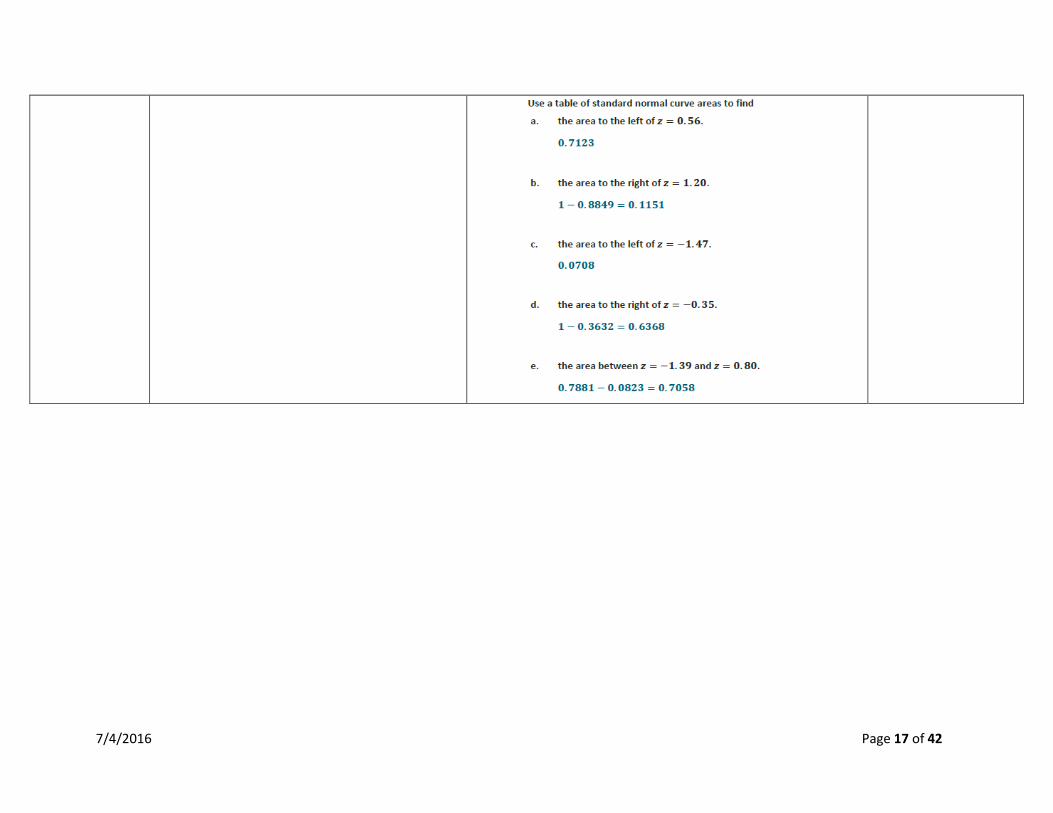
Explanation: Students use the normal distribution to make estimates of frequencies (which can be expressed as probabilities). They recognize that only some data are well described by a normal distribution. They use the 68-95-99.7 rule to estimate the percent of a normal population that falls within 1, 2, or 3 standard deviations of the mean. Students may use spreadsheets, graphing calculators, statistical software and tables to analyze the fit between a data set and normal distributions and estimate areas under the curve.
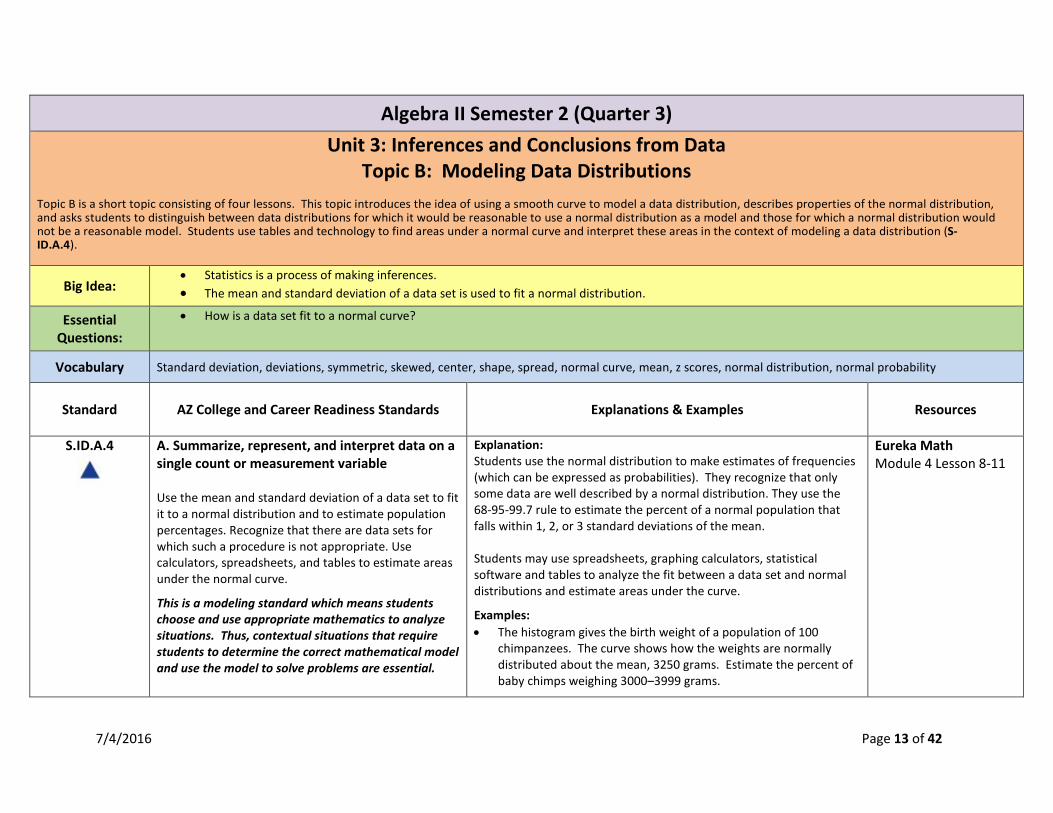
Examples: • The histogram gives the birth weight of a population of 100
chimpanzees. The curve shows how the weights are normally distributed about the mean, 3250 grams. Estimate the percent of baby chimps weighing 3000–3999 grams.
Eureka Math Module 4 Lesson 8-11
7/4/2016 Page 13 of 42
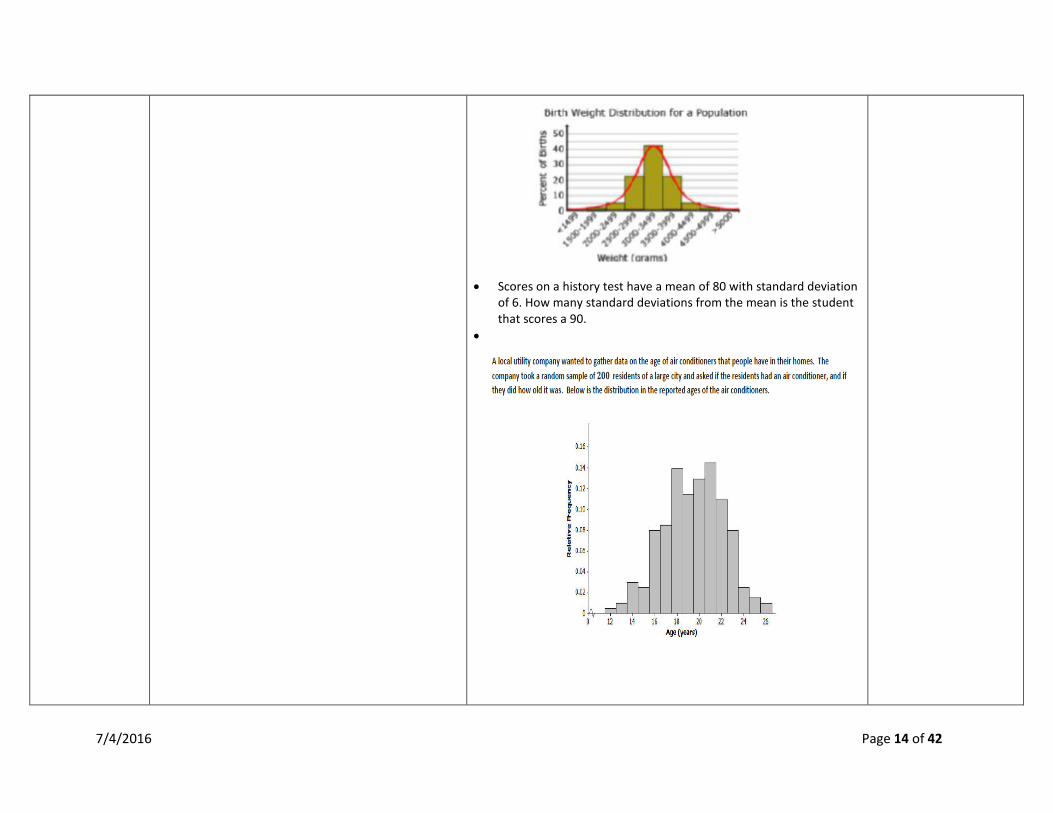
• Scores on a history test have a mean of 80 with standard deviation of 6. How many standard deviations from the mean is the student that scores a 90.
•
7/4/2016 Page 14 of 42
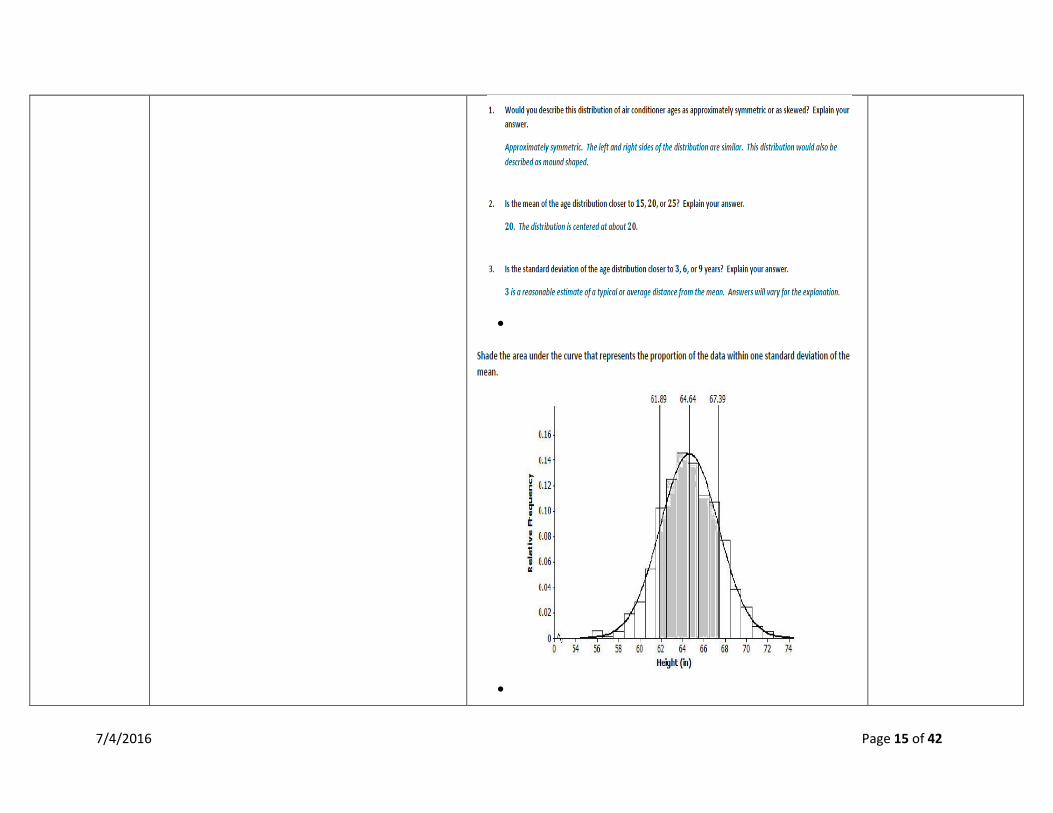
•
•
7/4/2016 Page 15 of 42
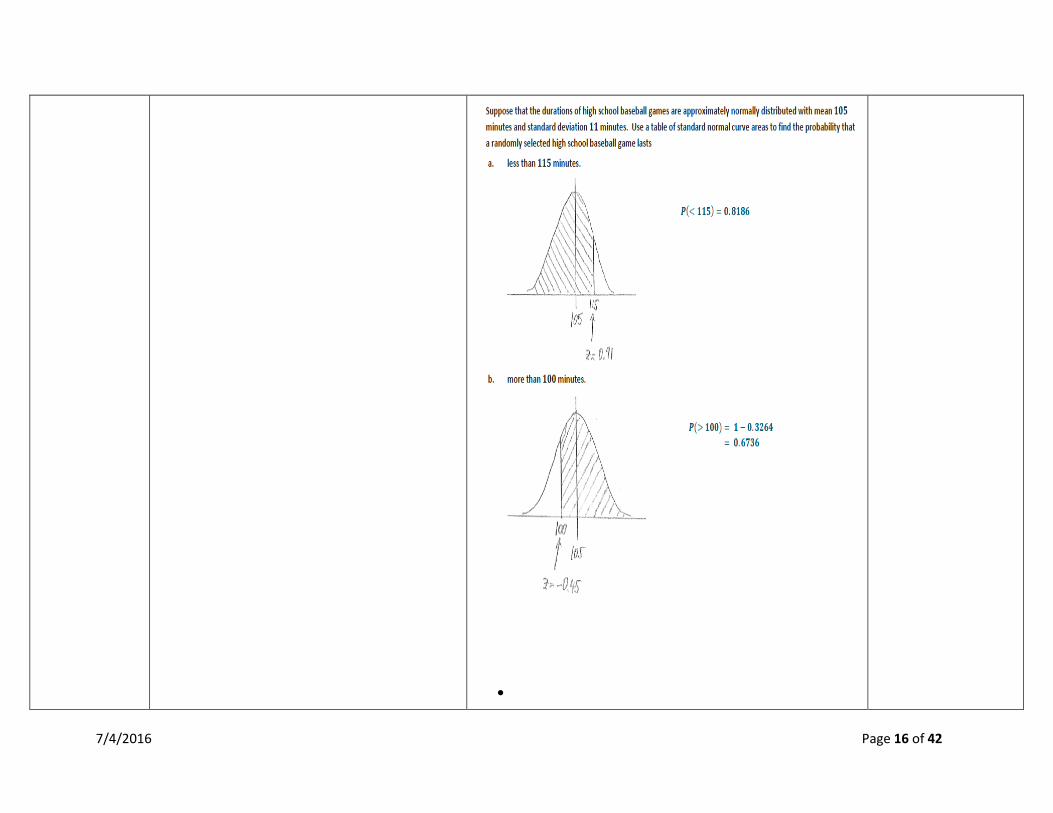
•
7/4/2016 Page 16 of 42
7/4/2016 Page 17 of 42
Algebra II Semester 2 (Quarter 3) Unit 3: Inferences and Conclusions from Data
Topic C: Drawing Conclusions Using data from a Sample Topics C and D develop students’ understanding of statistical inference and introduce different types of statistical studies (observational studies, surveys, and experiments) (S-IC.B.3). In Topic C, students explore using data from a random sample to estimate a population mean or a population proportion. Building on what they learned about sampling variability in Grade 7, students use simulation to create an understanding of margin of error. Students calculate the margin of error and interpret it in context (S-IC.B.4). Students also evaluate reports from the media using sample data to estimate a population mean or proportion (S-IC.B.6).
Big Idea:
• Statistics is a process of making inferences. • Results from a model may or may not be consistent with a real-life simulation of the process. • Different data collection methods are appropriate for different situations and randomization relates to each. • Data from a sample survey is used to estimate a population mean. • Simulations are used to decide if differences between parameters are significant.
Essential Questions:
• How is statistics used? • When is it appropriate to question the results from a model compared to a real-life simulation? • Which data collection method is best used for a specific context? • How does randomization relate to a data collection method? • How is a population mean estimated from data from a sample survey? • When is the difference between parameters significant?
Vocabulary Observational study, survey, experiment, bias, cause and effect conclusions, sample statistics, sampling variability, sample proportion, margin of error, plausible population proportion
Standard AZ College and Career Readiness Standards Explanations & Examples Resources
S.IC.A.1
A. Understand and evaluate random processes underlying statistical experiments Understand statistics as a process for making inferences to be made about population parameters based on a random sample from that population. This is a modeling standard which means students choose and use appropriate mathematics to analyze situations. Thus, contextual situations that require
Explanation: Students define populations, population parameter, random sample, and inference.
• A population consists of everything or everyone being studied in an inference procedure. It is rare to be able to perform a census of every individual member of the population. Due to constraints of resources it is nearly impossible to perform a measurement on every subject in a population.
• A parameter is a value, usually unknown (and which therefore has to be estimated), used to represent a certain population
Eureka Math Module 4 Lesson 12-22
7/4/2016 Page 18 of 42
students to determine the correct mathematical model and use the model to solve problems are essential.
characteristic. • Inferential statistics considers a subset of the population. This
subset is called a statistical sample often including members of a population selected in a random process. The measurements of the individuals in the sample tell us about corresponding measurements in the population.
Students demonstrate an understanding of the different kinds of sampling methods
Example: • From a class containing 12 girls and 10 boys, three students
are to be selected to serve on a school advisory panel. Here are four different methods of making the selection.
I. Select the first three names on the class roll. II. Select the first three students who volunteer.
III. Place the names of the 22 students in a hat, mix them thoroughly, and select three names from the mix.
IV. Select the first three students who show up for class tomorrow.
Which is the best sampling method, among these four, if you want the school panel to represent a fair and representative view of the opinions of your class? Explain the weaknesses of the three you did not select as the best.
S.IC.B.3
A. Make inferences and justify conclusions from sample surveys, experiments, and observational studies Recognize the purposes of and differences among sample surveys, experiments, and observational studies; explain how randomization relates to each. This is a modeling standard which means students choose and use appropriate mathematics to analyze situations. Thus, contextual situations that require students to determine the correct mathematical model and use the model to solve problems are essential.
Explanation: Students understand the different methods of data collection, specifically the difference between an observational study and a controlled experiment, and know the appropriate use for each.
• Observational study – a researcher collects information about a population by measuring a variable of interest, but does not impose a treatment on the subjects. (I.e. examining the health effects of smoking).
• Experiment – an investigator imposes a change of treatments on one or more group(s), often called treatment group(s).
• A comparative experiment is where a control group is given a placebo to compare the reaction(s) between the treatment group(s) and the control group.
Eureka Math Module 4 Lesson 12
7/4/2016 Page 19 of 42
Students understand the role that randomization plays in eliminating bias from collected data.
Examples: • Students in a high school mathematics class decided that their
term project would be a study of the strictness of the parents or guardians of students in the school. Their goal was to estimate the proportion of students in the school who thought of their parents or guardians as “strict”. They do not have time to interview all 1000 students in the school, so they plan to obtain data from a sample of students.
o Describe the parameter of interest and a statistic the students could use to estimate the parameter.
o Is the best design for this study a sample survey, an experiment, or an observational study? Explain your reasoning.
o The students quickly realized that, as there is no definition of “strict”, they could not simply ask a student, “Are your parents or guardians strict?” Write three questions that could provide objective data related to strictness.
o Describe an appropriate method for obtaining a sample of 100 students, based on your answer in part (a) above.
Students should be able to explain techniques/applications for randomly selecting study subjects from a population and how those techniques/applications differ from those used to randomly assign existing subjects to control groups or experimental groups in a statistical experiment.
In statistics, an observational study draws inferences about the possible effect of a treatment on subjects, where the assignment of subjects into a treated group versus a control group is outside the control of the investigator (for example, observing data on academic achievement and socio-economic status to see if there is a relationship between them). This is in contrast to controlled experiments, such as randomized controlled trials, where each subject is randomly assigned
7/4/2016 Page 20 of 42
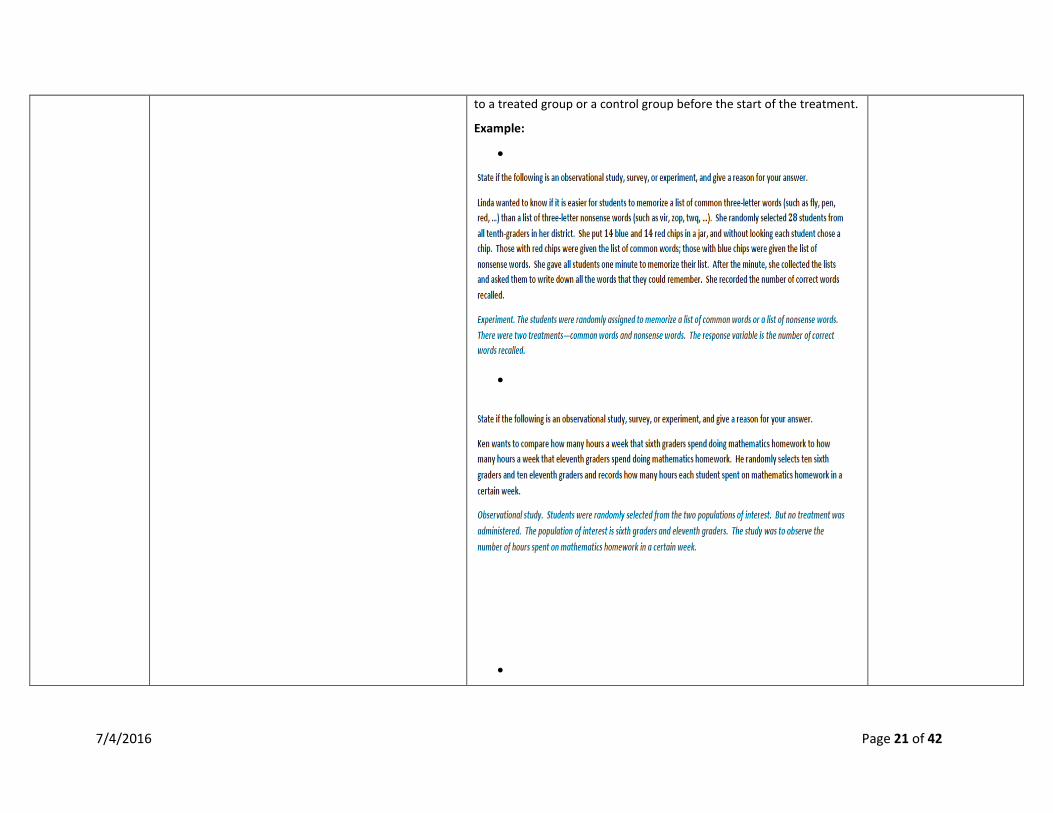
to a treated group or a control group before the start of the treatment.
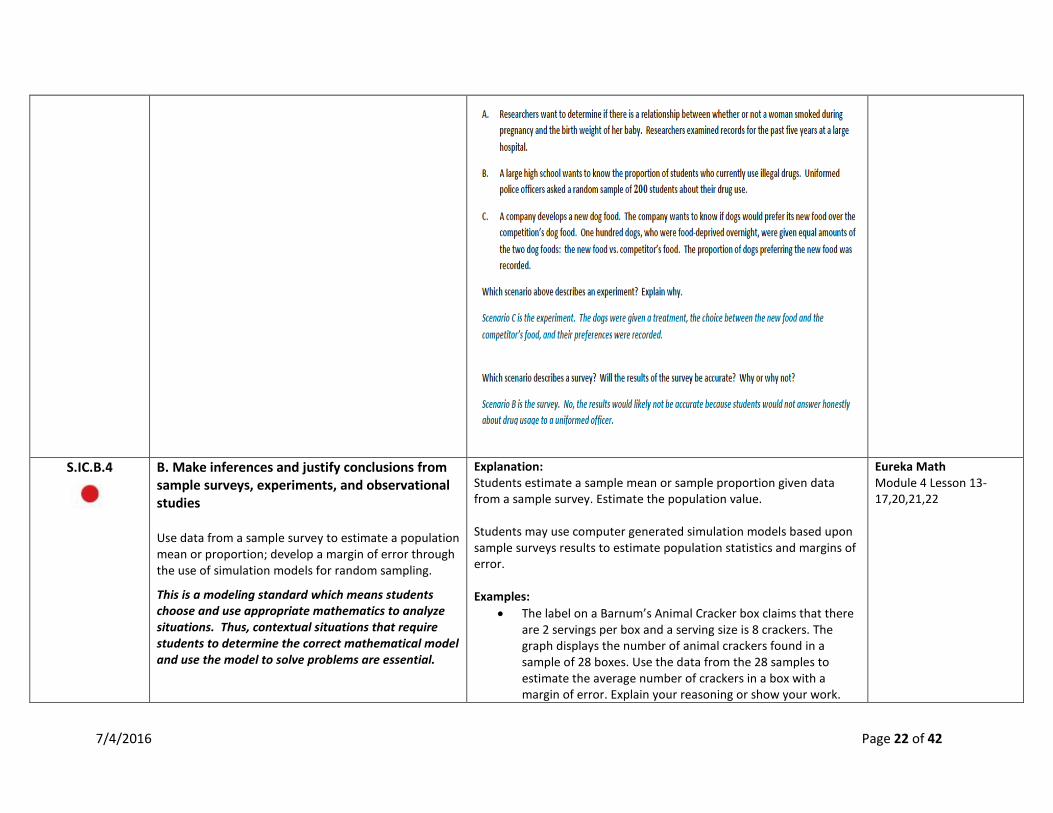
Example:
•
•
•
7/4/2016 Page 21 of 42
S.IC.B.4
B. Make inferences and justify conclusions from sample surveys, experiments, and observational studies Use data from a sample survey to estimate a population mean or proportion; develop a margin of error through the use of simulation models for random sampling.
This is a modeling standard which means students choose and use appropriate mathematics to analyze situations. Thus, contextual situations that require students to determine the correct mathematical model and use the model to solve problems are essential.
Explanation: Students estimate a sample mean or sample proportion given data from a sample survey. Estimate the population value. Students may use computer generated simulation models based upon sample surveys results to estimate population statistics and margins of error. Examples:
• The label on a Barnum’s Animal Cracker box claims that there are 2 servings per box and a serving size is 8 crackers. The graph displays the number of animal crackers found in a sample of 28 boxes. Use the data from the 28 samples to estimate the average number of crackers in a box with a margin of error. Explain your reasoning or show your work.
Eureka Math Module 4 Lesson 13-17,20,21,22
7/4/2016 Page 22 of 42
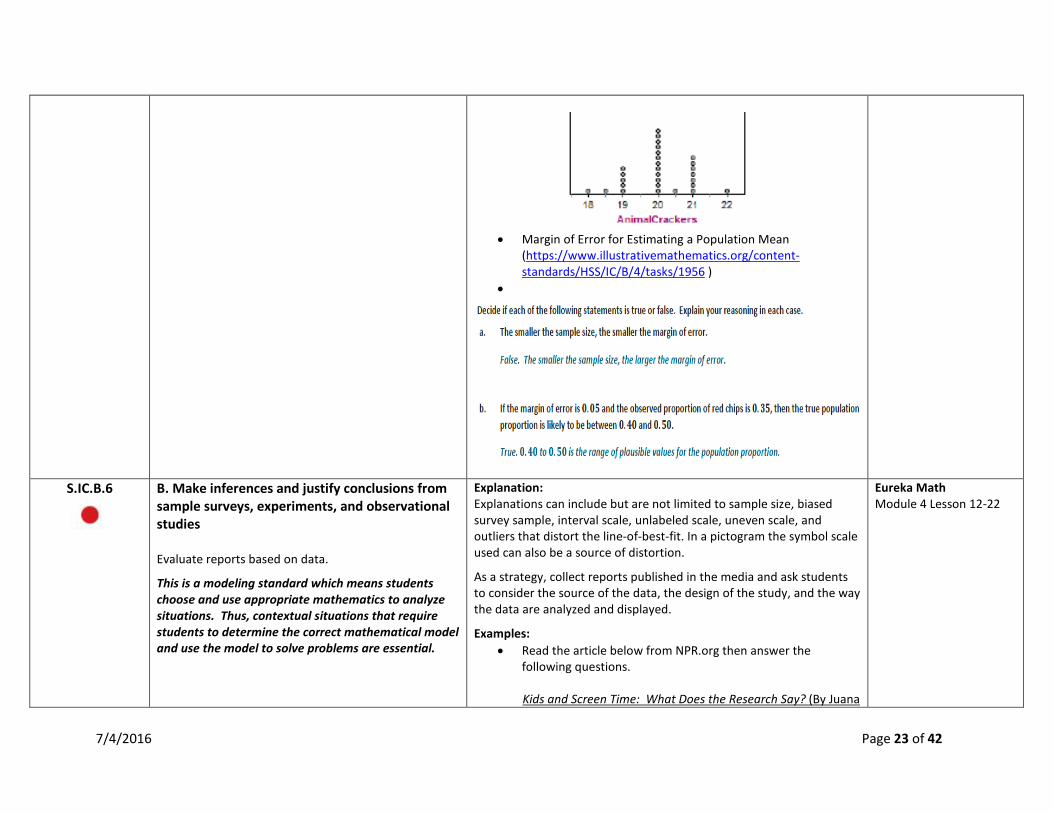
• Margin of Error for Estimating a Population Mean
(https://www.illustrativemathematics.org/content-standards/HSS/IC/B/4/tasks/1956 )
•
S.IC.B.6
B. Make inferences and justify conclusions from sample surveys, experiments, and observational studies Evaluate reports based on data.
This is a modeling standard which means students choose and use appropriate mathematics to analyze situations. Thus, contextual situations that require students to determine the correct mathematical model and use the model to solve problems are essential.
Explanation: Explanations can include but are not limited to sample size, biased survey sample, interval scale, unlabeled scale, uneven scale, and outliers that distort the line-of-best-fit. In a pictogram the symbol scale used can also be a source of distortion.
As a strategy, collect reports published in the media and ask students to consider the source of the data, the design of the study, and the way the data are analyzed and displayed.
Examples: • Read the article below from NPR.org then answer the
following questions. Kids and Screen Time: What Does the Research Say? (By Juana
Eureka Math Module 4 Lesson 12-22
7/4/2016 Page 23 of 42
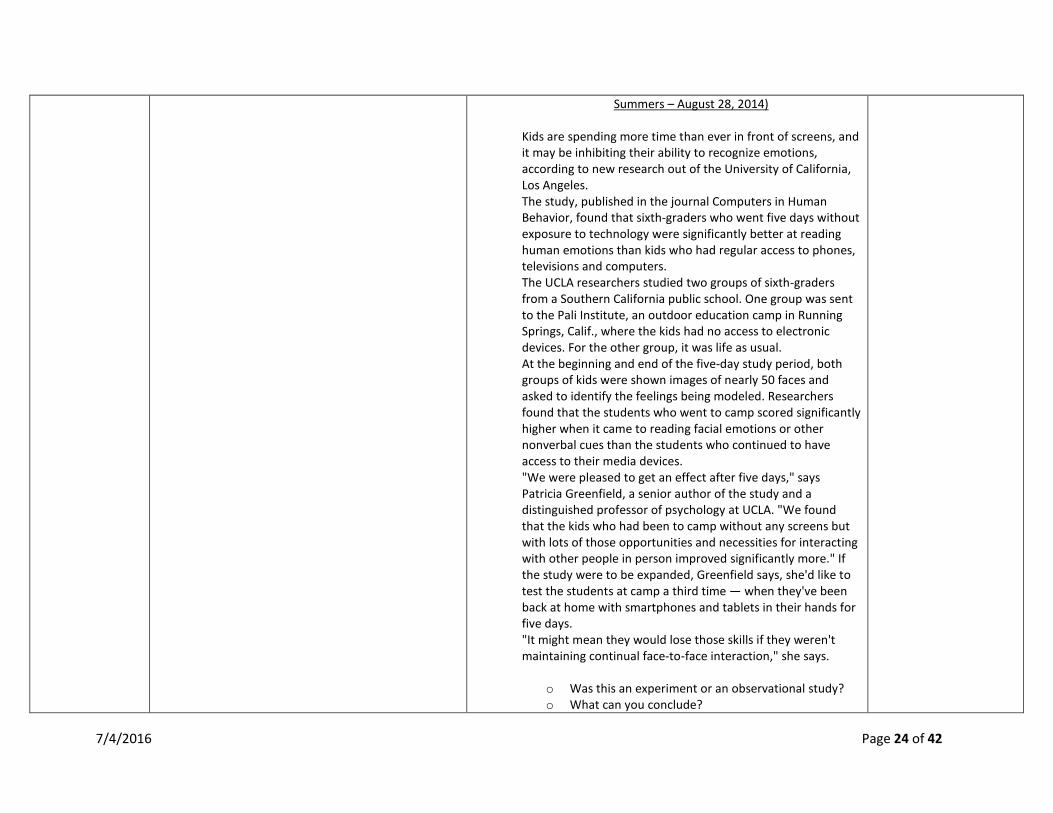
Summers – August 28, 2014) Kids are spending more time than ever in front of screens, and it may be inhibiting their ability to recognize emotions, according to new research out of the University of California, Los Angeles. The study, published in the journal Computers in Human Behavior, found that sixth-graders who went five days without exposure to technology were significantly better at reading human emotions than kids who had regular access to phones, televisions and computers. The UCLA researchers studied two groups of sixth-graders from a Southern California public school. One group was sent to the Pali Institute, an outdoor education camp in Running Springs, Calif., where the kids had no access to electronic devices. For the other group, it was life as usual. At the beginning and end of the five-day study period, both groups of kids were shown images of nearly 50 faces and asked to identify the feelings being modeled. Researchers found that the students who went to camp scored significantly higher when it came to reading facial emotions or other nonverbal cues than the students who continued to have access to their media devices. "We were pleased to get an effect after five days," says Patricia Greenfield, a senior author of the study and a distinguished professor of psychology at UCLA. "We found that the kids who had been to camp without any screens but with lots of those opportunities and necessities for interacting with other people in person improved significantly more." If the study were to be expanded, Greenfield says, she'd like to test the students at camp a third time — when they've been back at home with smartphones and tablets in their hands for five days. "It might mean they would lose those skills if they weren't maintaining continual face-to-face interaction," she says.
o Was this an experiment or an observational study? o What can you conclude?
7/4/2016 Page 24 of 42
o Are there any limitations or concerns with this statistical study?
7/4/2016 Page 25 of 42
Algebra II Semester 2 (Quarter 3) Unit 3: Inferences and Conclusions from Data
Topic D: Drawing Conclusions Using data from an Experiment Topic D focuses on drawing conclusions based on data from a statistical experiment. Given data from a statistical experiment, students use simulation to create a randomization distribution and use it to determine if there is a significant difference between two treatments (S-IC.B.5). Students also critique and evaluate published reports based on statistical experiments that compare two treatments (S-IC.B.6).
Big Idea:
• Statistics is a process of making inferences. • Results from a model may or may not be consistent with a real-life simulation of the process. • Different data collection methods are appropriate for different situations and randomization relates to each. • Data from a sample survey is used to estimate a population mean. • Simulations are used to decide if differences between parameters are significant.
Essential Questions:
• How is statistics used? • When is it appropriate to question the results from a model compared to a real-life simulation? • Which data collection method is best used for a specific context? • How does randomization relate to a data collection method? • How is a population mean estimated from data from a sample survey? • When is the difference between parameters significant?
Vocabulary Assignment, random selection, random assignment, subject, response variable, treatments, placebo, “changeinscore”
Standard AZ College and Career Readiness Standards Explanations & Examples Resources
S.IC.B.3
B. Make inferences and justify conclusions from sample surveys, experiments, and observational studies Recognize the purposes of and differences among sample surveys, experiments, and observational studies; explain how randomization relates to each. This is a modeling standard which means students choose and use appropriate mathematics to analyze situations. Thus, contextual situations that require students to determine the correct mathematical model
Explanation: Students understand the different methods of data collection, specifically the difference between an observational study and a controlled experiment, and know the appropriate use for each.
• Observational study – a researcher collects information about a population by measuring a variable of interest, but does not impose a treatment on the subjects. (I.e. examining the health effects of smoking).
• Experiment – an investigator imposes a change of treatments on one or more group(s), often called treatment group(s).
• A comparative experiment is where a control group is given a placebo to compare the reaction(s) between the treatment
Eureka Math Module 4 Lesson 23-29
7/4/2016 Page 26 of 42
and use the model to solve problems are essential.
group(s) and the control group.
Students understand the role that randomization plays in eliminating bias from collected data.
Students should be able to explain techniques/applications for randomly selecting study subjects from a population and how those techniques/applications differ from those used to randomly assign existing subjects to control groups or experimental groups in a statistical experiment.
In statistics, an observational study draws inferences about the possible effect of a treatment on subjects, where the assignment of subjects into a treated group versus a control group is outside the control of the investigator (for example, observing data on academic achievement and socio-economic status to see if there is a relationship between them). This is in contrast to controlled experiments, such as randomized controlled trials, where each subject is randomly assigned to a treated group or a control group before the start of the treatment.
Examples: refer to examples in Unit 3 Topic C S.IC.B.5
B. Make inferences and justify conclusions from sample surveys, experiments, and observational studies Use data from a randomized experiment to compare two treatments; use simulations to decide if differences between parameters are significant. This is a modeling standard which means students choose and use appropriate mathematics to analyze situations. Thus, contextual situations that require students to determine the correct mathematical model and use the model to solve problems are essential.
Explanation: Students may use computer generated simulation models to decide how likely it is that observed differences in a randomized experiment are due to chance.
Treatment is a term used in the context of an experimental design to refer to any prescribed combination of values of explanatory variables. For example, one wants to determine the effectiveness of weed killer. Two equal parcels of land in a neighborhood are treated; one with a placebo and one with weed killer to determine whether there is a significant difference in effectiveness in eliminating weeds.
Examples: • Sal purchased two types of plant fertilizer and conducted an
experiment to see which fertilizer would be best to use in his greenhouse. He planted 20 seedlings and used Fertilizer A on ten of them and Fertilizer B on the other ten. He measured the height of each plant after two weeks. Use the data below to determine which fertilizer Sal should use.
Eureka Math Module 4 Lesson 24-29
7/4/2016 Page 27 of 42
Fertilizer A 23.4 30.1 28.5 26.3 32.0
29.6 26.8 25.2 27.5 30.8
Fertilizer B 19.8 25.7 29.0 23.2 27.8
31.1 26.5 24.7 21.3 25.6
o Use the data to generate simulated treatment results by randomly selecting ten plant heights from the twenty plant heights listed.
o Calculate the average plant height for each treatment of ten plants
o Find the difference between consecutive pairs of treatment averages and compare. Does your simulated data provide evidence that the average plant heights using Fertlizer A and Fertilizer B is significant?
• Are Starbucks customers more likely to be female?” To answer the question, students decide to randomly select 30-minute increments of time throughout the week and have an observer record the gender of every tenth customer who enters the Starbucks store. At the end of the week, they had collected data on 260 customers, 154 females and 106 males. This data seems to suggest more females visited Starbucks during this time than males. To determine if these results are statistically significant, students investigated if they could get this proportion of females just by chance if the population of customers is truly 50% females and 50% males. Students simulated samples of 260 customers that are 50---50 females to males by flipping a coin 260 then recording the proportion of heads to represent the number of women in a random sample of 260 customers (e.g., 0.50 means that 130 of the 260 flips were heads). Their results are displayed in the graph at the right.
7/4/2016 Page 28 of 42
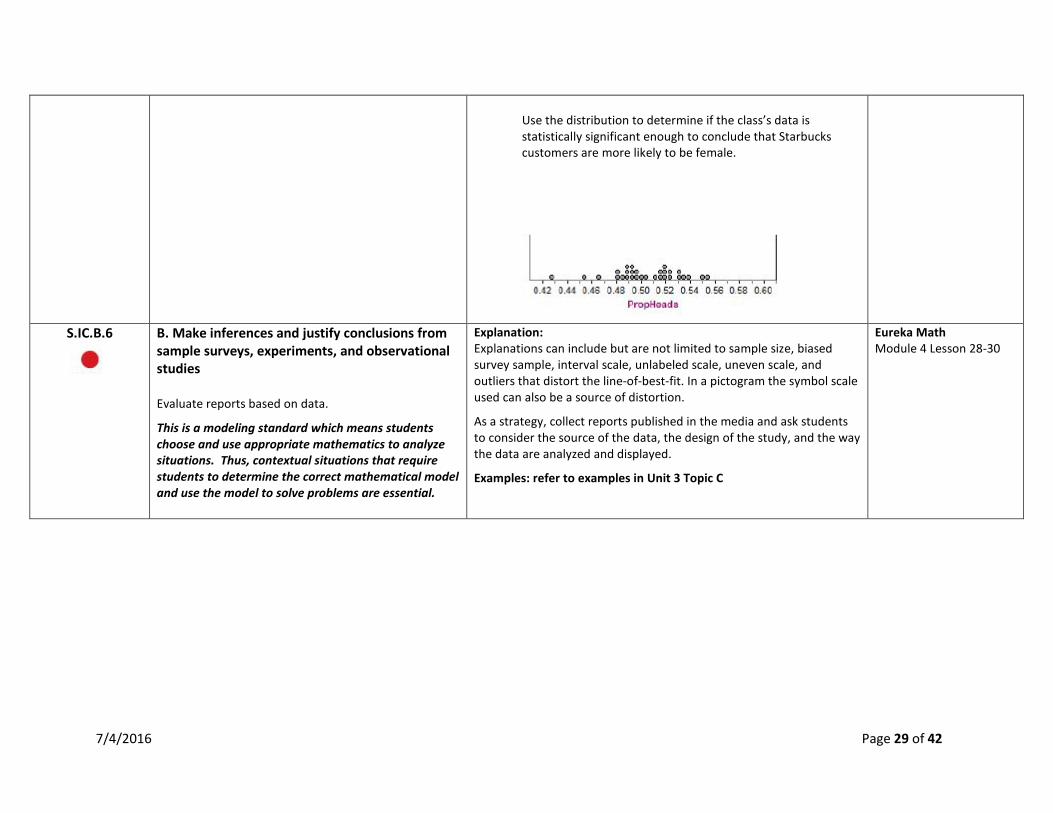
Use the distribution to determine if the class’s data is statistically significant enough to conclude that Starbucks customers are more likely to be female.
S.IC.B.6
B. Make inferences and justify conclusions from sample surveys, experiments, and observational studies Evaluate reports based on data.
This is a modeling standard which means students choose and use appropriate mathematics to analyze situations. Thus, contextual situations that require students to determine the correct mathematical model and use the model to solve problems are essential.
Explanation: Explanations can include but are not limited to sample size, biased survey sample, interval scale, unlabeled scale, uneven scale, and outliers that distort the line-of-best-fit. In a pictogram the symbol scale used can also be a source of distortion.
As a strategy, collect reports published in the media and ask students to consider the source of the data, the design of the study, and the way the data are analyzed and displayed.
Examples: refer to examples in Unit 3 Topic C
Eureka Math Module 4 Lesson 28-30
7/4/2016 Page 29 of 42
Algebra II Semester 2 (Quarter 3) Unit 4: Trigonometric Functions
Topic A: The Story of Trigonometry and Its Contexts Unit 4 builds on students’ previous work with units (N-Q.A.1) and with functions (F-IF.A.1, F-IF.A.2, F-IF.B.4, F-IF.C.7e, F-BF.A.1, F-BF.B.3) from Algebra I, and with trigonometric ratios and circles (G-SRT.C.6, G-SRT.C.7, G-SRT.C.8) from high school Geometry. Topic A starts by asking students to graph the height of a Ferris wheel as a function of time and uses that study to help define the sine, cosine, and tangent functions as functions from all (or most) real numbers to the real numbers. A precise definition of sine and cosine (as well as tangent and the co-functions) is developed using transformational geometry from high school Geometry. This precision leads to a discussion of a mathematically natural unit of measurement for angle measures, a radian, and students begin to build fluency with values of sine, cosine, and tangent at 𝜋𝜋/6, 𝜋𝜋/4, 𝜋𝜋/3, 𝜋𝜋/2, 𝜋𝜋, etc. The topic concludes with students graphing the sine and cosine functions and noticing various aspects of the graph, which they write down as simple trigonometric identities.
Big Idea:
• The unit circle allows all real numbers to work in trigonometric functions. • Key features in graphs and tables shed light on relationships between two quantities. • Trigonometric functions can be represented by a table, graph, verbal description or equation, and each representation can be transferred to another
representation
Essential Questions:
• How do you use/read a unit circle (using radians)? • What do the key features of a trigonometric function represent? • What are the different ways you can represent a trigonometric function?
Vocabulary Radian, periodic function, Sine, Cosine, tangent, secant, cosecant cotangent
Standard AZ College and Career Readiness Standards Explanations & Examples Resources
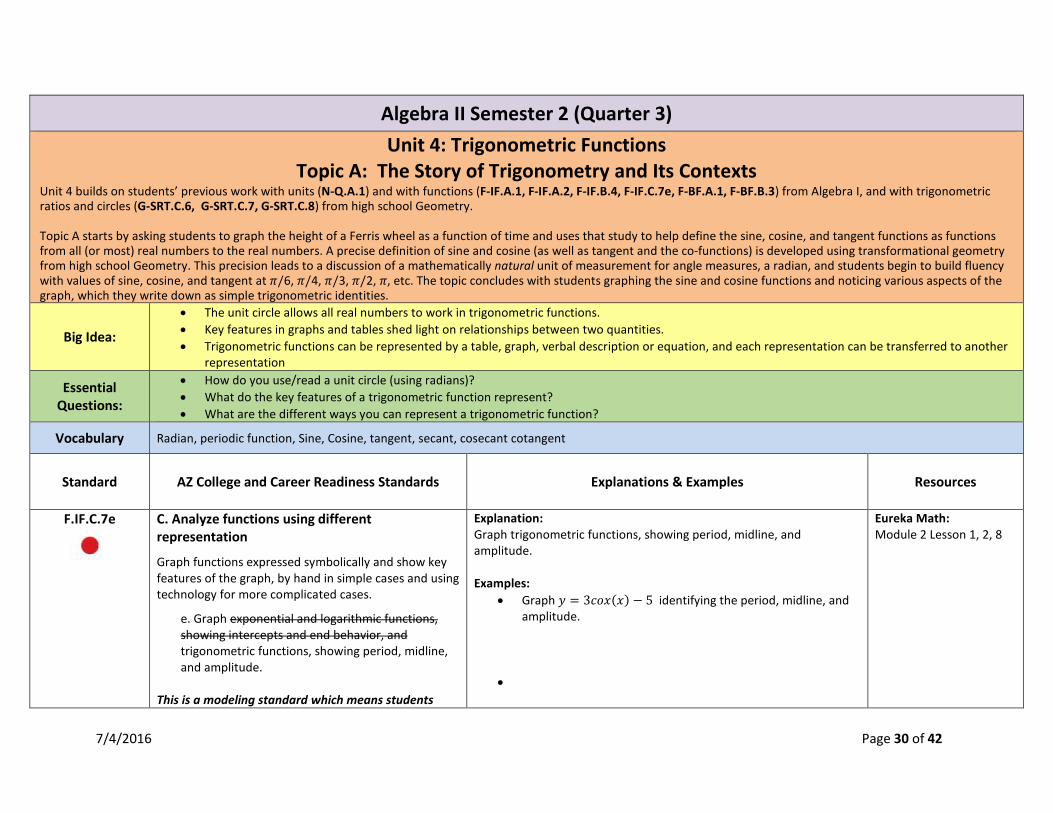
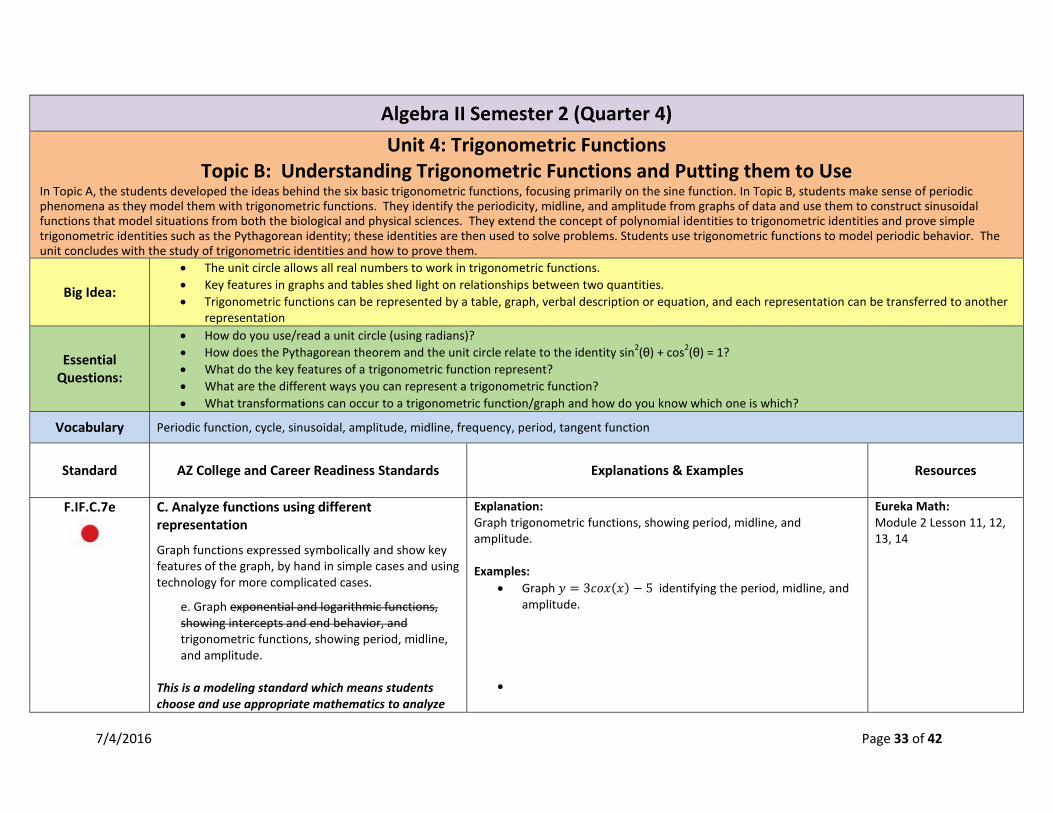
F.IF.C.7e
C. Analyze functions using different representation
Graph functions expressed symbolically and show key features of the graph, by hand in simple cases and using technology for more complicated cases.
e. Graph exponential and logarithmic functions, showing intercepts and end behavior, and trigonometric functions, showing period, midline, and amplitude.
This is a modeling standard which means students
Explanation: Graph trigonometric functions, showing period, midline, and amplitude. Examples:
• Graph 𝑦𝑦 = 3𝑐𝑐𝑜𝑜𝑐𝑐(𝑐𝑐) − 5 identifying the period, midline, and amplitude.
•
Eureka Math: Module 2 Lesson 1, 2, 8
7/4/2016 Page 30 of 42
choose and use appropriate mathematics to analyze situations. Thus, contextual situations that require students to determine the correct mathematical model and use the model to solve problems are essential.
F.TF.A.1
A. Extend the domain of trigonometric functions using the unit circle
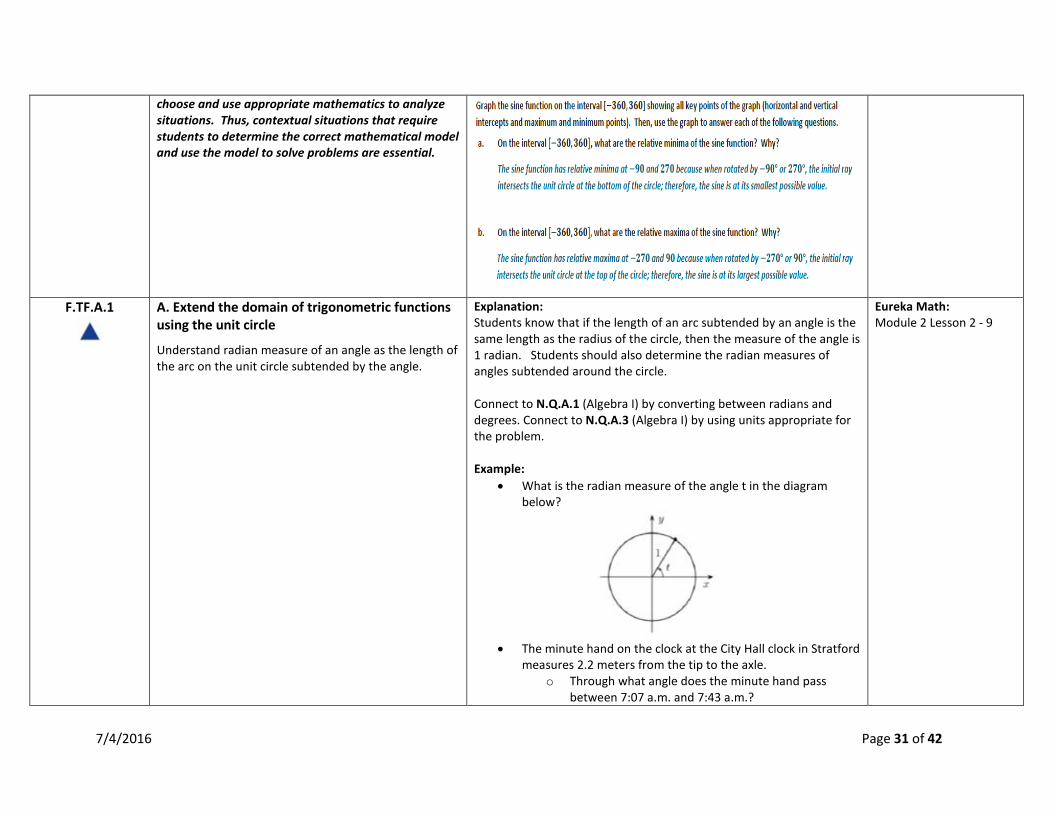
Understand radian measure of an angle as the length of the arc on the unit circle subtended by the angle.
Explanation: Students know that if the length of an arc subtended by an angle is the same length as the radius of the circle, then the measure of the angle is 1 radian. Students should also determine the radian measures of angles subtended around the circle. Connect to N.Q.A.1 (Algebra I) by converting between radians and degrees. Connect to N.Q.A.3 (Algebra I) by using units appropriate for the problem. Example:
• What is the radian measure of the angle t in the diagram below?
• The minute hand on the clock at the City Hall clock in Stratford
measures 2.2 meters from the tip to the axle. o Through what angle does the minute hand pass
between 7:07 a.m. and 7:43 a.m.?
Eureka Math: Module 2 Lesson 2 - 9
7/4/2016 Page 31 of 42
o What distance does the tip of the minute hand travel during this period?
F.TF.A.2
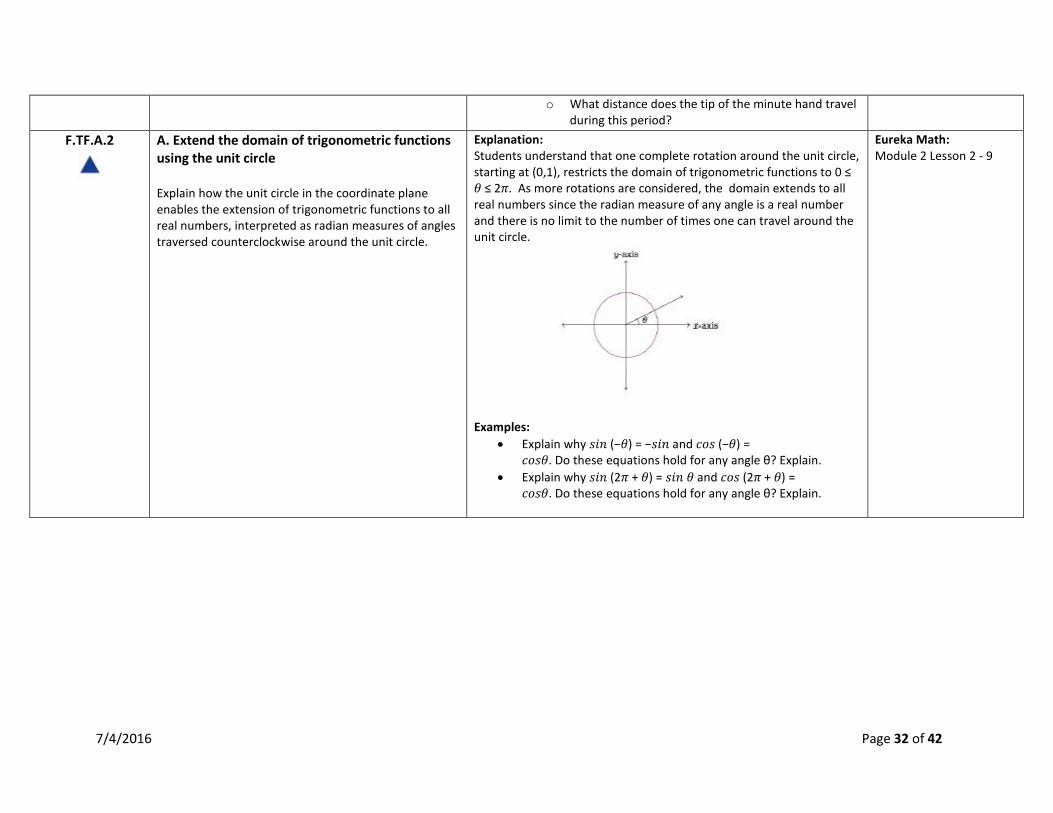
A. Extend the domain of trigonometric functions using the unit circle Explain how the unit circle in the coordinate plane enables the extension of trigonometric functions to all real numbers, interpreted as radian measures of angles traversed counterclockwise around the unit circle.
Explanation: Students understand that one complete rotation around the unit circle, starting at (0,1), restricts the domain of trigonometric functions to 0 ≤ 𝜃𝜃 ≤ 2𝜋𝜋. As more rotations are considered, the domain extends to all real numbers since the radian measure of any angle is a real number and there is no limit to the number of times one can travel around the unit circle.
Examples:
• Explain why 𝑠𝑠𝑖𝑖𝑛𝑛 (−𝜃𝜃) = −𝑠𝑠𝑖𝑖𝑛𝑛 and 𝑐𝑐𝑜𝑜𝑠𝑠 (−𝜃𝜃) = 𝑐𝑐𝑜𝑜𝑠𝑠𝜃𝜃. Do these equations hold for any angle θ? Explain.
• Explain why 𝑠𝑠𝑖𝑖𝑛𝑛 (2𝜋𝜋 + 𝜃𝜃) = 𝑠𝑠𝑖𝑖𝑛𝑛 𝜃𝜃 and 𝑐𝑐𝑜𝑜𝑠𝑠 (2𝜋𝜋 + 𝜃𝜃) = 𝑐𝑐𝑜𝑜𝑠𝑠𝜃𝜃. Do these equations hold for any angle θ? Explain.
Eureka Math: Module 2 Lesson 2 - 9
7/4/2016 Page 32 of 42
Algebra II Semester 2 (Quarter 4) Unit 4: Trigonometric Functions
Topic B: Understanding Trigonometric Functions and Putting them to Use In Topic A, the students developed the ideas behind the six basic trigonometric functions, focusing primarily on the sine function. In Topic B, students make sense of periodic phenomena as they model them with trigonometric functions. They identify the periodicity, midline, and amplitude from graphs of data and use them to construct sinusoidal functions that model situations from both the biological and physical sciences. They extend the concept of polynomial identities to trigonometric identities and prove simple trigonometric identities such as the Pythagorean identity; these identities are then used to solve problems. Students use trigonometric functions to model periodic behavior. The unit concludes with the study of trigonometric identities and how to prove them.
Big Idea:
• The unit circle allows all real numbers to work in trigonometric functions. • Key features in graphs and tables shed light on relationships between two quantities. • Trigonometric functions can be represented by a table, graph, verbal description or equation, and each representation can be transferred to another
representation
Essential Questions:
• How do you use/read a unit circle (using radians)? • How does the Pythagorean theorem and the unit circle relate to the identity sin2(θ) + cos2(θ) = 1? • What do the key features of a trigonometric function represent? • What are the different ways you can represent a trigonometric function? • What transformations can occur to a trigonometric function/graph and how do you know which one is which?
Vocabulary Periodic function, cycle, sinusoidal, amplitude, midline, frequency, period, tangent function
Standard AZ College and Career Readiness Standards Explanations & Examples Resources
F.IF.C.7e
C. Analyze functions using different representation
Graph functions expressed symbolically and show key features of the graph, by hand in simple cases and using technology for more complicated cases.
e. Graph exponential and logarithmic functions, showing intercepts and end behavior, and trigonometric functions, showing period, midline, and amplitude.
This is a modeling standard which means students choose and use appropriate mathematics to analyze
Explanation: Graph trigonometric functions, showing period, midline, and amplitude. Examples:
• Graph 𝑦𝑦 = 3𝑐𝑐𝑜𝑜𝑐𝑐(𝑐𝑐) − 5 identifying the period, midline, and amplitude.
•
Eureka Math: Module 2 Lesson 11, 12, 13, 14
7/4/2016 Page 33 of 42
situations. Thus, contextual situations that require students to determine the correct mathematical model and use the model to solve problems are essential.
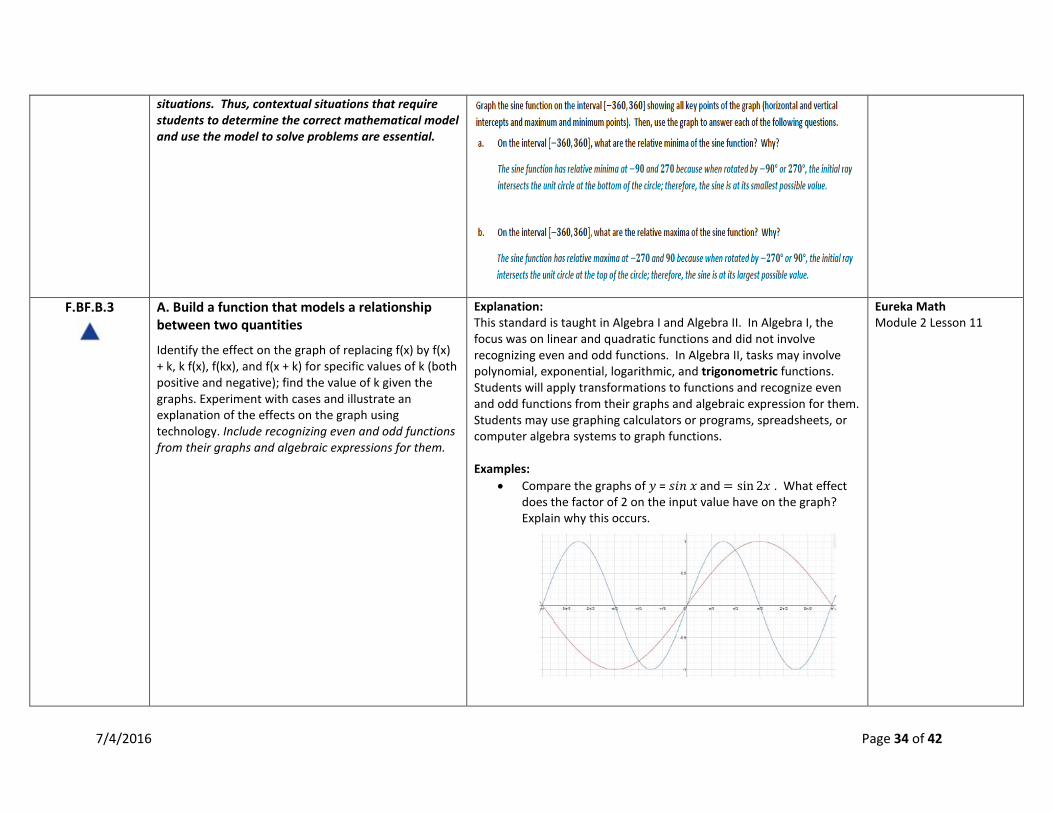
F.BF.B.3
A. Build a function that models a relationship between two quantities
Identify the effect on the graph of replacing f(x) by f(x) + k, k f(x), f(kx), and f(x + k) for specific values of k (both positive and negative); find the value of k given the graphs. Experiment with cases and illustrate an explanation of the effects on the graph using technology. Include recognizing even and odd functions from their graphs and algebraic expressions for them.
Explanation: This standard is taught in Algebra I and Algebra II. In Algebra I, the focus was on linear and quadratic functions and did not involve recognizing even and odd functions. In Algebra II, tasks may involve polynomial, exponential, logarithmic, and trigonometric functions. Students will apply transformations to functions and recognize even and odd functions from their graphs and algebraic expression for them. Students may use graphing calculators or programs, spreadsheets, or computer algebra systems to graph functions. Examples:
• Compare the graphs of 𝑦𝑦 = 𝑠𝑠𝑖𝑖𝑛𝑛 𝑐𝑐 and = sin 2𝑐𝑐 . What effect does the factor of 2 on the input value have on the graph? Explain why this occurs.
Eureka Math Module 2 Lesson 11
7/4/2016 Page 34 of 42
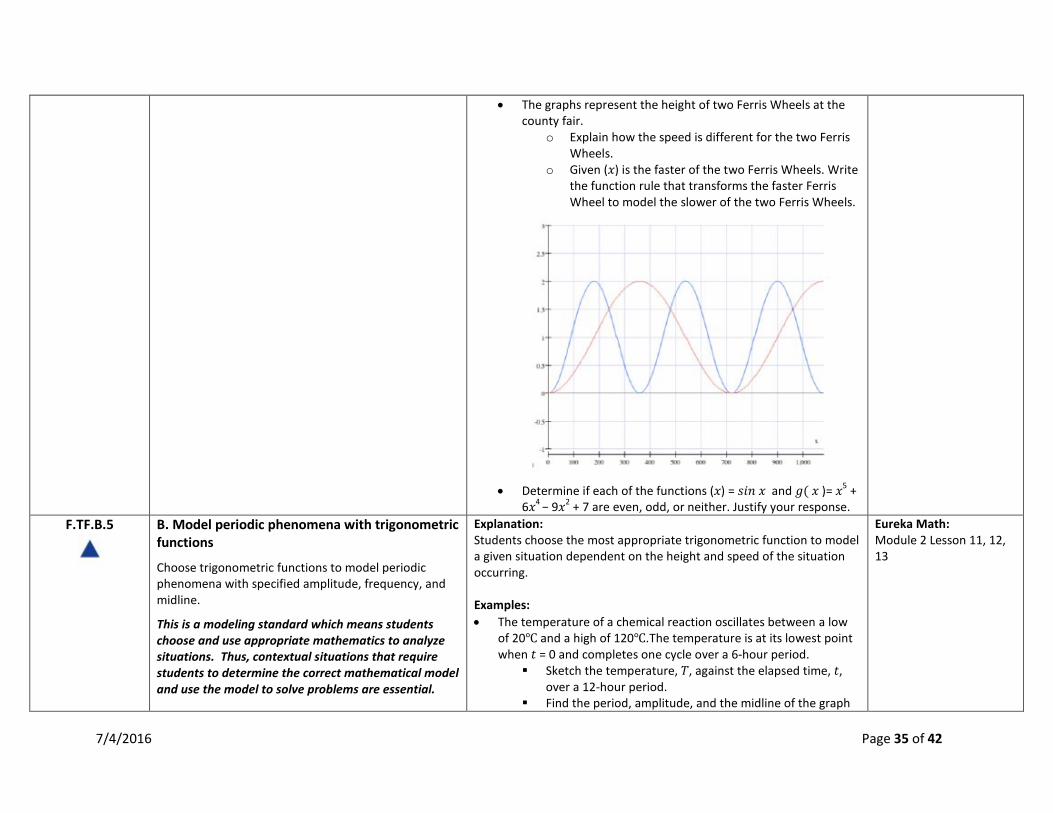
• The graphs represent the height of two Ferris Wheels at the county fair.
o Explain how the speed is different for the two Ferris Wheels.
o Given (𝑐𝑐) is the faster of the two Ferris Wheels. Write the function rule that transforms the faster Ferris Wheel to model the slower of the two Ferris Wheels.
• Determine if each of the functions (𝑐𝑐) = 𝑠𝑠𝑖𝑖𝑛𝑛 𝑐𝑐 and 𝑔𝑔( 𝑐𝑐 )= 𝑐𝑐5 +
6𝑐𝑐4 − 9𝑐𝑐2 + 7 are even, odd, or neither. Justify your response. F.TF.B.5
B. Model periodic phenomena with trigonometric functions
Choose trigonometric functions to model periodic phenomena with specified amplitude, frequency, and midline.
This is a modeling standard which means students choose and use appropriate mathematics to analyze situations. Thus, contextual situations that require students to determine the correct mathematical model and use the model to solve problems are essential.
Explanation: Students choose the most appropriate trigonometric function to model a given situation dependent on the height and speed of the situation occurring. Examples: • The temperature of a chemical reaction oscillates between a low
of 20℃ and a high of 120℃.The temperature is at its lowest point when 𝑡𝑡 = 0 and completes one cycle over a 6-hour period.
Sketch the temperature, 𝑇𝑇, against the elapsed time, 𝑡𝑡, over a 12-hour period.
Find the period, amplitude, and the midline of the graph
Eureka Math: Module 2 Lesson 11, 12, 13
7/4/2016 Page 35 of 42
you drew in part a. Write a function to represent the relationship between
time and temperature. What will the temperature of the reaction be 14 hours
after it began? At what point during a 24-hour day will the reaction have
a temperature of 60℃?
F.TF.C.8
C. Prove and apply trigonometric identities
Prove the Pythagorean identity sin2(θ) + cos2(θ) = 1 and use it to find sin(θ), cos(θ), or tan(θ) given sin(θ), cos(θ), or tan(θ) and the quadrant of the angle.
Explanation: Students prove (𝜽𝜽) + 𝒄𝒄𝒐𝒐𝒔𝒔(𝜽𝜽) = 𝟏𝟏. In the unit circle, the cosine is the x-value, while the sine is the y-value. Since the hypotenuse is always 1, the Pythagorean relationship 𝑠𝑠𝑖𝑖𝑛𝑛2𝑐𝑐 + 𝑐𝑐𝑜𝑜𝑠𝑠2𝑐𝑐 = 1 is always true. Students use (𝜽𝜽) + 𝒄𝒄𝒐𝒐𝒔𝒔(𝜽𝜽) = 𝟏𝟏 to find 𝒔𝒔𝒊𝒊𝒂𝒂 (𝜽𝜽), 𝒄𝒄𝒐𝒐𝒔𝒔 (𝜽𝜽), or 𝒕𝒕𝒂𝒂𝒂𝒂 (𝜽𝜽) given 𝒔𝒔𝒊𝒊𝒂𝒂 (𝜽𝜽), 𝒄𝒄𝒐𝒐𝒔𝒔 (𝜽𝜽), or 𝒕𝒕𝒂𝒂𝒂𝒂 (𝜽𝜽) and the quadrant of the angle. Examples: •
Eureka Math: Module 2 Lesson 15
S.ID.B.6a
B. Summarize, represent, and interpret data on two categorical and quantitative variables. Represent data on two quantitative variables on a scatter plot, and describe how the variables are related. a. Fit a function to the data; use functions fitted to data to solve problems in the context of the data. Use given functions or choose a function suggested by the context. This is a modeling standard which means students choose and use appropriate mathematics to analyze situations. Thus, contextual situations that require students to determine the correct mathematical model and use the model to solve problems are essential.
Explanation: Students may use spreadsheets, graphing calculators, and statistical software to represent data, describe how the variables are related, fit functions to data, perform regressions, and calculate residuals. This standard builds on students’ work from 8th grade with bivariate data and its relationship. Previous studies of relationships primarily focused on linear models. In Algebra I, students used a linear function to model the relationship between two numerical variables. In addition to fitting a line to data, students assessed how well the model fit by analyzing residuals. Part a of this standard is taught in Algebra I and Algebra II. In Algebra II, tasks have a real-world context and are limited to exponential functions with domains not in the integers and trigonometric
Eureka Math: Module 2 Lesson 13
7/4/2016 Page 36 of 42
functions. Students should be provided with data that represents a variety of different functions (linear, exponential and trigonometric). Examples:
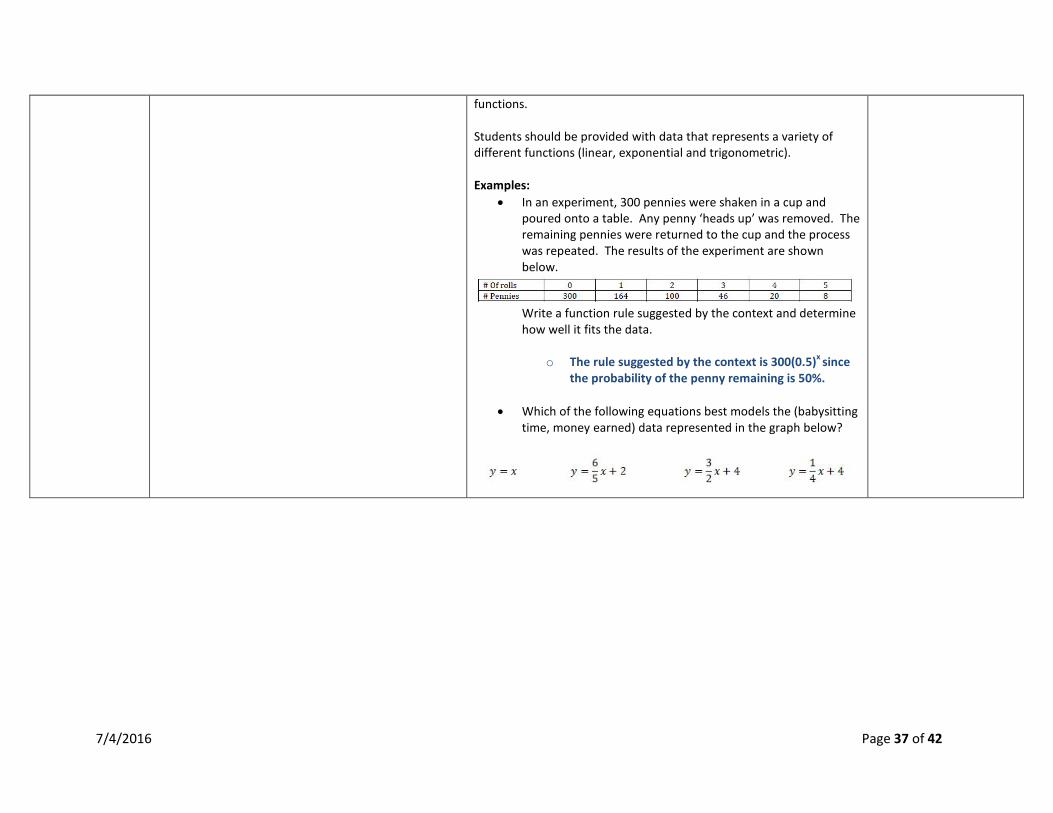
• In an experiment, 300 pennies were shaken in a cup and poured onto a table. Any penny ‘heads up’ was removed. The remaining pennies were returned to the cup and the process was repeated. The results of the experiment are shown below.
Write a function rule suggested by the context and determine how well it fits the data.
o The rule suggested by the context is 300(0.5)x since
the probability of the penny remaining is 50%.
• Which of the following equations best models the (babysitting time, money earned) data represented in the graph below?
7/4/2016 Page 37 of 42
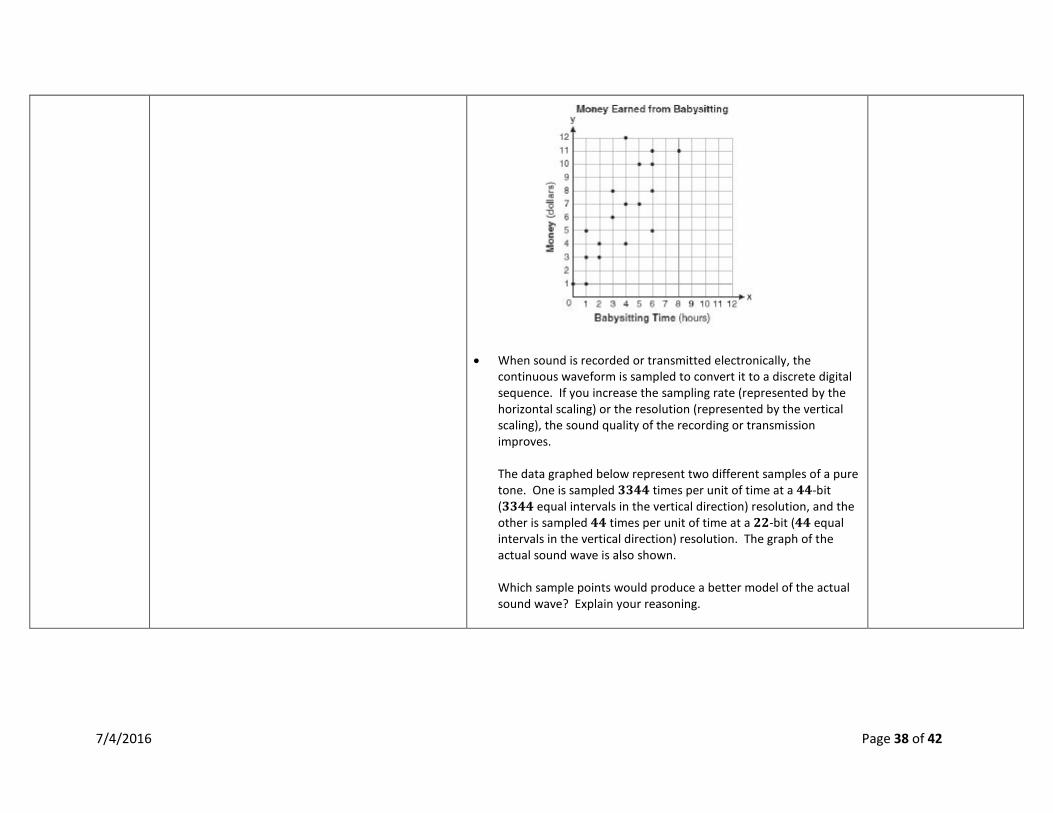
• When sound is recorded or transmitted electronically, the
continuous waveform is sampled to convert it to a discrete digital sequence. If you increase the sampling rate (represented by the horizontal scaling) or the resolution (represented by the vertical scaling), the sound quality of the recording or transmission improves. The data graphed below represent two different samples of a pure tone. One is sampled 𝟑𝟑𝟑𝟑𝟒𝟒𝟒𝟒 times per unit of time at a 𝟒𝟒𝟒𝟒-bit (𝟑𝟑𝟑𝟑𝟒𝟒𝟒𝟒 equal intervals in the vertical direction) resolution, and the other is sampled 𝟒𝟒𝟒𝟒 times per unit of time at a 𝟐𝟐𝟐𝟐-bit (𝟒𝟒𝟒𝟒 equal intervals in the vertical direction) resolution. The graph of the actual sound wave is also shown. Which sample points would produce a better model of the actual sound wave? Explain your reasoning.
7/4/2016 Page 38 of 42
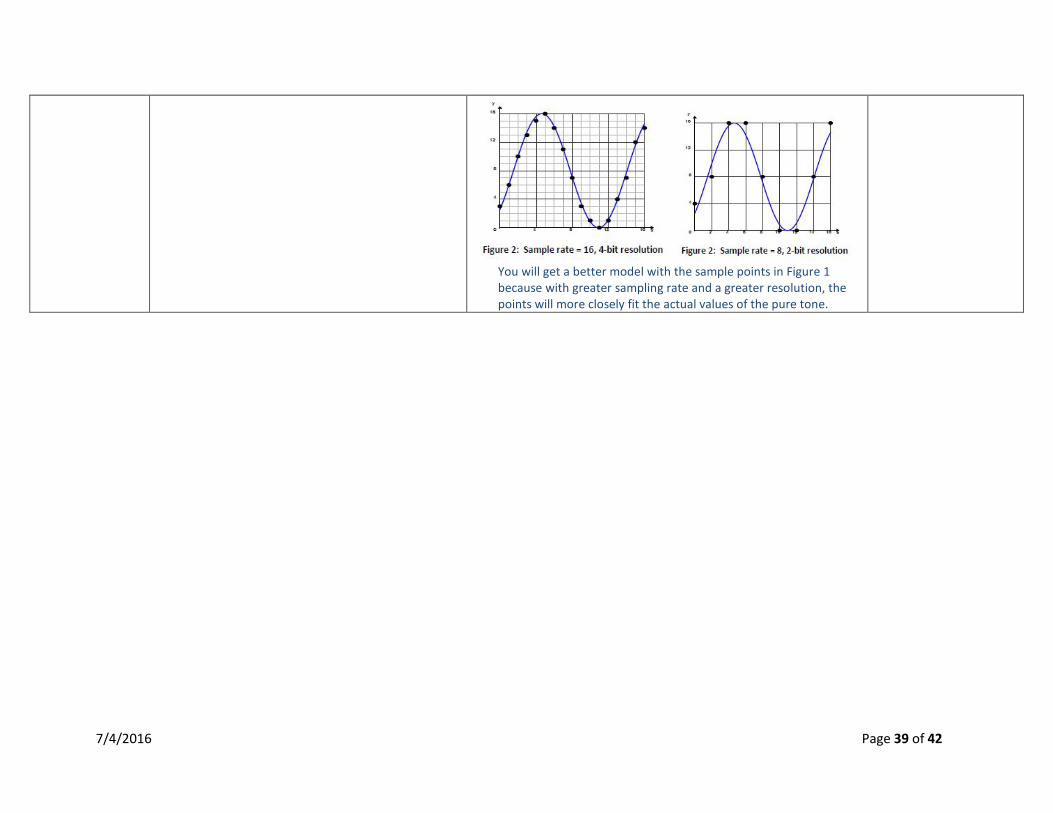
You will get a better model with the sample points in Figure 1 because with greater sampling rate and a greater resolution, the points will more closely fit the actual values of the pure tone.
7/4/2016 Page 39 of 42
Mathematical Practice Standards Throughout Semester 2
MP.1 Make sense of problems and persevere in solving them.
Mathematically proficient students start by explaining to themselves the meaning of a problem and looking for entry points to its solution. They analyze givens, constraints, relationships, and goals. They make conjectures about the form and meaning of the solution and plan a solution pathway rather than simply jumping into a solution attempt. They consider analogous problems, and try special cases and simpler forms of the original problem in order to gain insight into its solution. They monitor and evaluate their progress and change course if necessary. Mathematically proficient students check their answers to problems using a different method, and they continually ask themselves, "Does this make sense?" They can understand the approaches of others to solving complex problems and identify correspondences between different approaches.
Eureka Math Module 4 Lesson 5,7, 13, 15, 23
MP.2 Reason abstractly and quantitatively. Students use data from a sample to estimate a population mean or proportion and generalize from a sample to the population. They associate a margin of error with estimates based on a sample and interpret them in the context of generalizing from a sample to the population. Students also make conjectures or claims about independence and use arguments based on probabilities to support them. Students extend the study of trigonometry to the domain of all (or almost all) real inputs. By focusing only on the linear components of circular motion (the vertical or the horizontal displacement of a point in orbit), students develop the means to analyze periodic phenomena.
Eureka Math Module 4 Lesson 1-5, 8, 12, 14,16-24, 26 Module 2 Lesson 1, 8, 9, 12, 13
MP.3 Construct viable arguments and critique the reasoning of others.
Students test conjectures about treatment differences in the context of a statistical experiment. Students critique and evaluate reports based on data from random samples and reports based on data from experiments. Students frequently develop conjectures and use statistical reasoning to evaluate them. The vertical and horizontal displacements of a Ferris wheel passenger car are both periodic. Students conjecture how these functions are related to the trigonometric ratios they studied in geometry, making plausible arguments by modeling the Ferris wheel with a circle in the
Eureka Math Module 4 Lesson 1,2,4, 10, 12-16,22-25, 28-30 Module 2 Lesson 4, 6, 7, 11-13
7/4/2016 Page 40 of 42
coordinate plane.
MP.4 Model with mathematics. Students use smooth curves to model data distributions. Students use the normal distribution as a model in order to answer questions about a data distribution. Students use probability models to describe real-world contexts. The main modeling activity of this module is to analyze the vertical and horizontal displacement of a passenger car of a Ferris wheel. As they make assumptions and simplify the situation, they discover the need for sine and cosine functions to model the periodic motion using sinusoidal functions.
Eureka Math Module 4 Lesson 6, 9-11, 18, 25, 27 Module 2 Lesson 1-4, 12
MP.5 Use appropriate tools strategically. Students use technology to carry out simulations in order to study sampling variability. Students also use technology to compute estimates of population characteristics (such as the mean and standard deviation) and to calculate margin of error. Students also use simulation to investigate statistical significance in the context of comparing treatments in a statistical experiment.
Eureka Math Module 4 Lesson 9,11, 13,19-21, 27, 28 Module 2 Lesson 11, 13
MP.6 Attend to precision. Mathematically proficient students try to communicate precisely to others. They try to use clear definitions in discussion with others and in their own reasoning. They state the meaning of the symbols they choose, including using the equal sign consistently and appropriately. They are careful about specifying units of measure, and labeling axes to clarify the correspondence with quantities in a problem. They calculate accurately and efficiently, express numerical answers with a degree of precision appropriate for the problem context.
Eureka Math: Module 2 Lesson 1, 13
MP.7 Look for and make use of structure.
Mathematically proficient students look closely to discern a pattern or structure. Students recognize the periodic nature of a phenomenon and look for suitable values of midline, amplitude, and frequency for it. The periodicity and properties of cyclical motion shown in graphs helps students to recognize different trigonometric identities, and structure in standard proofs (of the Pythagorean theorem, for example) provides the means to extend familiar trigonometric results to a wider range of
Eureka Math Module 4 Lesson 17 Module 2 Lesson 1, 3, 6, 8, 11
7/4/2016 Page 41 of 42
input values.
MP.8 Look for and express regularity in repeated reasoning.
Mathematically proficient students notice if calculations are repeated, and look both for general methods and for shortcuts. As they work to solve a problem, mathematically proficient students maintain oversight of the process, while attending to the details. They continually evaluate the reasonableness of their intermediate results. In repeatedly graphing different sinusoidal functions, students identify how parameters within the function give information about the amplitude, midline, and frequency of the function. They express this regularity in terms of a general formula for sinusoidal functions and use the formula to quickly write functions that model periodic data.
Eureka Math Module 4 Lesson 6 Module 2 Lesson 6, 9, 11, 14
7/4/2016 Page 42 of 42