algebra 1 b semester exam revie€¦ · algebra 1 b semester exam review ... how many more hot dogs...
TRANSCRIPT
ALGEBRA 1 B Semester Exam Review
MCPS © 2012–2013 1
The Algebra 1 Semester B examination will have the following types of questions:
Selected Response Student Produced Response (Grid-in) Brief Constructed Response (BCR) Extended Constructed Response (ECR) Short Answer
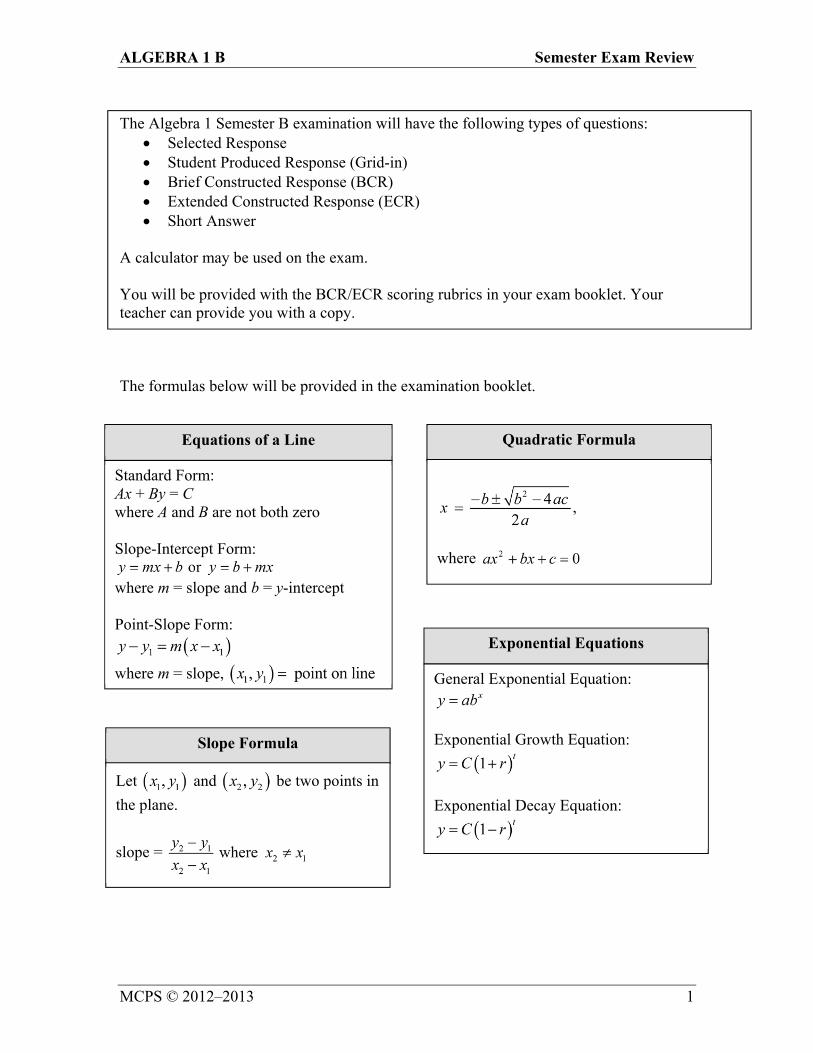
A calculator may be used on the exam. You will be provided with the BCR/ECR scoring rubrics in your exam booklet. Your teacher can provide you with a copy. The formulas below will be provided in the examination booklet.
Equations of a Line
Slope Formula
Let and be two points in
the plane.
slope =
Standard Form: Ax + By = C where A and B are not both zero Slope-Intercept Form:
where m = slope and b = y-intercept Point-Slope Form:
where m = slope,
Quadratic Formula
,
where
Exponential Equations
General Exponential Equation:
Exponential Growth Equation:
Exponential Decay Equation:
ALGEBRA 1 B Semester Exam Review
MCPS © 2012–2013 2
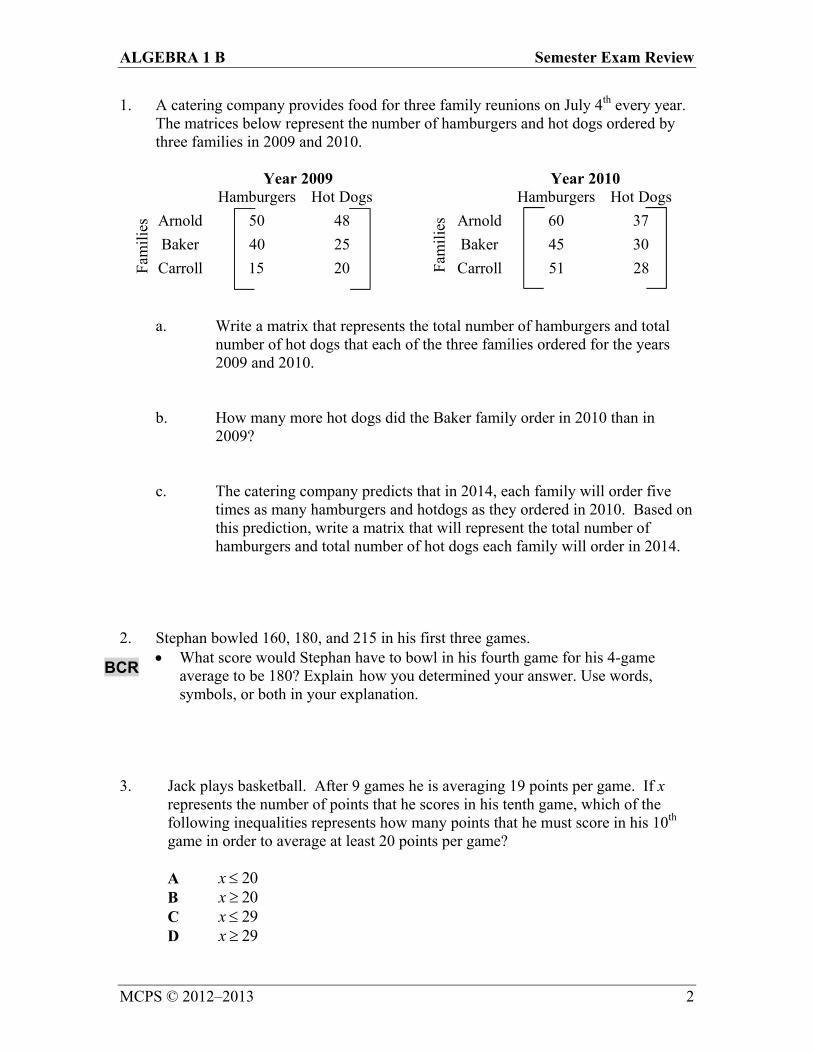
1. A catering company provides food for three family reunions on July 4th every year. The matrices below represent the number of hamburgers and hot dogs ordered by three families in 2009 and 2010. Year 2009 Year 2010
Hamburgers Hot Dogs
Arnold 50 48
Baker 40 25
Carroll 15 20
Hamburgers Hot Dogs
Arnold 60 37
Baker 45 30
Carroll 51 28
a. Write a matrix that represents the total number of hamburgers and total
number of hot dogs that each of the three families ordered for the years 2009 and 2010.
b. How many more hot dogs did the Baker family order in 2010 than in
2009?
c. The catering company predicts that in 2014, each family will order five times as many hamburgers and hotdogs as they ordered in 2010. Based on this prediction, write a matrix that will represent the total number of hamburgers and total number of hot dogs each family will order in 2014.
2. Stephan bowled 160, 180, and 215 in his first three games. What score would Stephan have to bowl in his fourth game for his 4-game
average to be 180? Explain how you determined your answer. Use words, symbols, or both in your explanation.
3. Jack plays basketball. After 9 games he is averaging 19 points per game. If x
represents the number of points that he scores in his tenth game, which of the following inequalities represents how many points that he must score in his 10th game in order to average at least 20 points per game?
A 20x B 20x C 29x D 29x
Fam
ilie
s
Fam
ilie
s
BCR
ALGEBRA 1 B Semester Exam Review
MCPS © 2012–2013 3
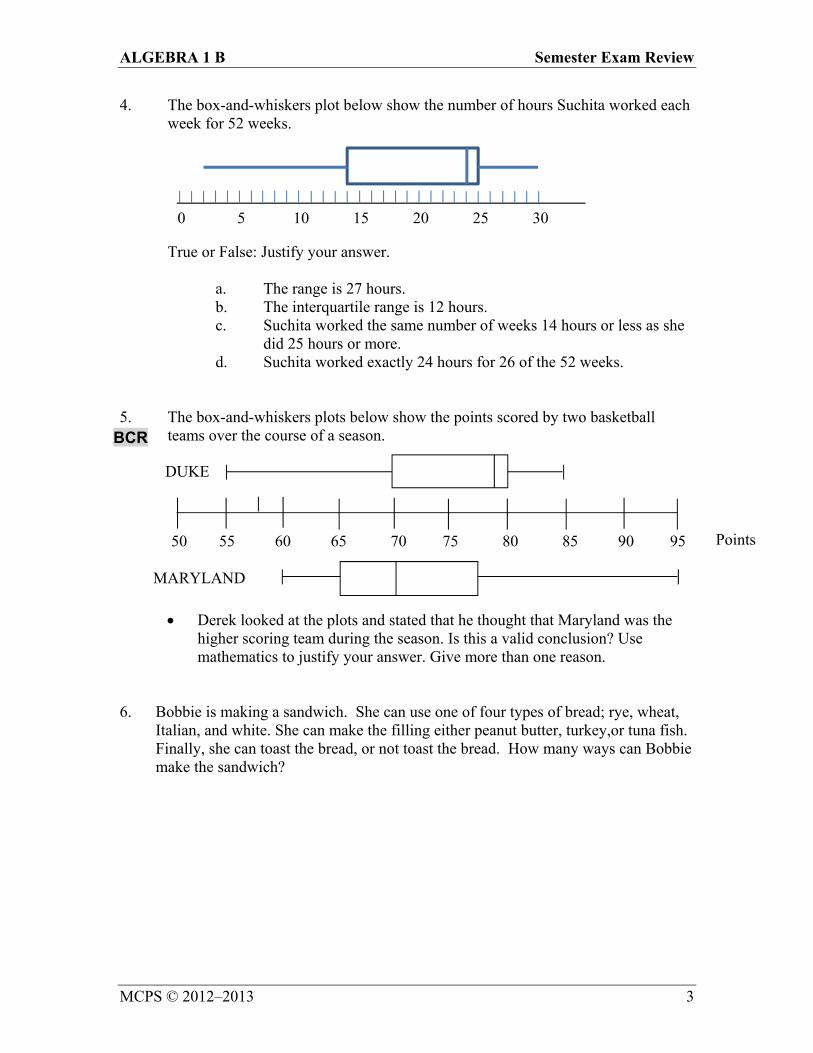
4. The box-and-whiskers plot below show the number of hours Suchita worked each week for 52 weeks.
True or False: Justify your answer.
a. The range is 27 hours. b. The interquartile range is 12 hours. c. Suchita worked the same number of weeks 14 hours or less as she did 25 hours or more. d. Suchita worked exactly 24 hours for 26 of the 52 weeks.
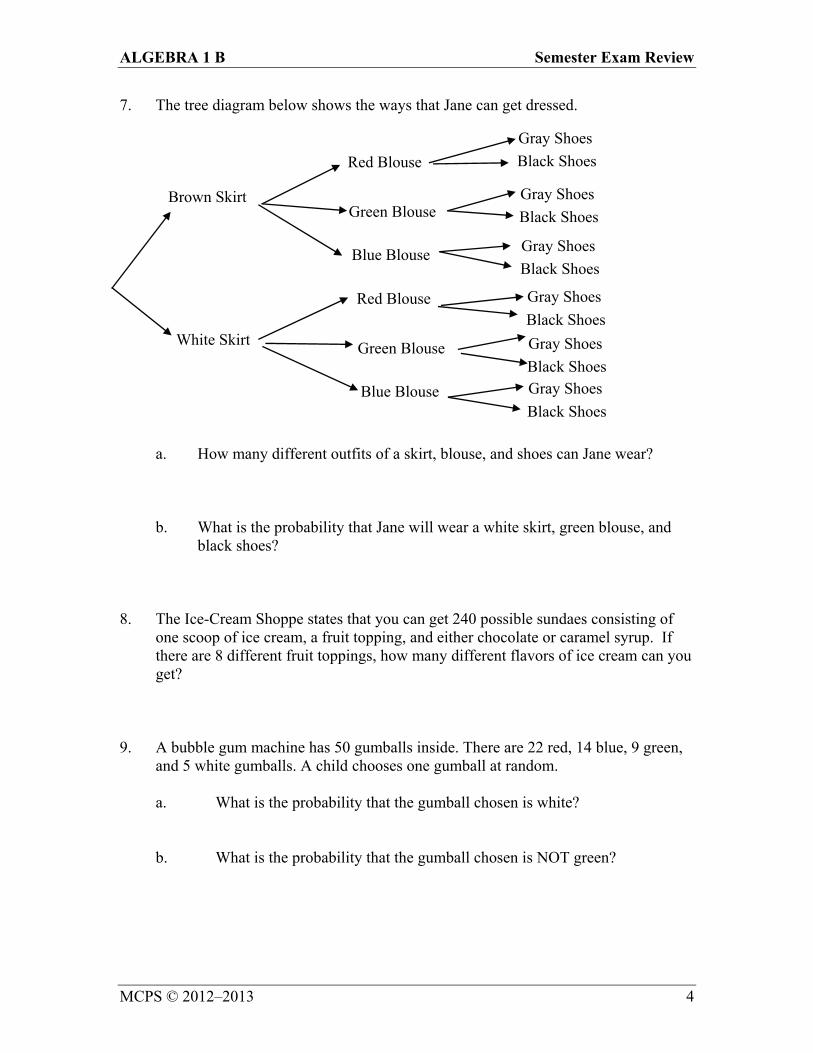
5. The box-and-whiskers plots below show the points scored by two basketball teams over the course of a season.
Derek looked at the plots and stated that he thought that Maryland was the higher scoring team during the season. Is this a valid conclusion? Use mathematics to justify your answer. Give more than one reason.
6. Bobbie is making a sandwich. She can use one of four types of bread; rye, wheat,
Italian, and white. She can make the filling either peanut butter, turkey,or tuna fish. Finally, she can toast the bread, or not toast the bread. How many ways can Bobbie make the sandwich?
50 55 60 65 70 75 80 85 90 95
DUKE
MARYLAND
BCR
Points
0 5 10 15 20 25 30
ALGEBRA 1 B Semester Exam Review
MCPS © 2012–2013 4
7. The tree diagram below shows the ways that Jane can get dressed.
a. How many different outfits of a skirt, blouse, and shoes can Jane wear? b. What is the probability that Jane will wear a white skirt, green blouse, and
black shoes? 8. The Ice-Cream Shoppe states that you can get 240 possible sundaes consisting of one scoop of ice cream, a fruit topping, and either chocolate or caramel syrup. If there are 8 different fruit toppings, how many different flavors of ice cream can you get? 9. A bubble gum machine has 50 gumballs inside. There are 22 red, 14 blue, 9 green, and 5 white gumballs. A child chooses one gumball at random.
a. What is the probability that the gumball chosen is white? b. What is the probability that the gumball chosen is NOT green?
Brown Skirt
White Skirt
Red Blouse
Green Blouse
Blue Blouse
Red Blouse
Green Blouse
Blue Blouse
Gray Shoes
Black Shoes
Gray Shoes
Black Shoes
Gray Shoes
Black Shoes
Gray Shoes
Black Shoes
Gray Shoes
Black Shoes Gray Shoes
Black Shoes
ALGEBRA 1 B Semester Exam Review
MCPS © 2012–2013 5
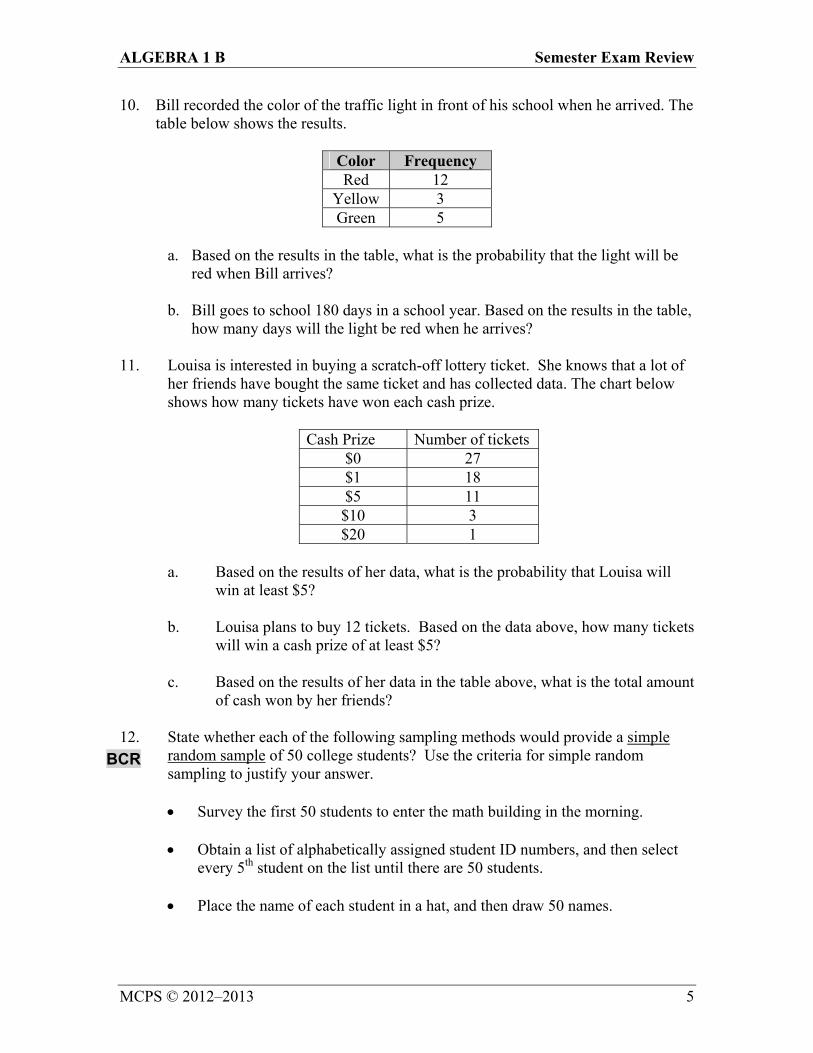
10. Bill recorded the color of the traffic light in front of his school when he arrived. The table below shows the results.
Color Frequency Red 12
Yellow 3 Green 5
a. Based on the results in the table, what is the probability that the light will be
red when Bill arrives?
b. Bill goes to school 180 days in a school year. Based on the results in the table, how many days will the light be red when he arrives?
11. Louisa is interested in buying a scratch-off lottery ticket. She knows that a lot of her friends have bought the same ticket and has collected data. The chart below shows how many tickets have won each cash prize.
Cash Prize Number of tickets $0 27 $1 18 $5 11 $10 3 $20 1
a. Based on the results of her data, what is the probability that Louisa will win at least $5? b. Louisa plans to buy 12 tickets. Based on the data above, how many tickets will win a cash prize of at least $5? c. Based on the results of her data in the table above, what is the total amount of cash won by her friends? 12. State whether each of the following sampling methods would provide a simple
random sample of 50 college students? Use the criteria for simple random sampling to justify your answer.
Survey the first 50 students to enter the math building in the morning.
Obtain a list of alphabetically assigned student ID numbers, and then select
every 5th student on the list until there are 50 students.
Place the name of each student in a hat, and then draw 50 names.
BCR

ALGEBRA 1 B Semester Exam Review
MCPS © 2012–2013 6
13. Jack and Jill surveyed students in their school to estimate how many students listen to classical music. Jack’s sample was to randomly select 50 orchestra students. Jill’s sample was chosen by selecting students randomly from a list of all students in the school.
Will Jack or Jill’s sample be more likely to be representative of the school’s population? Use mathematics to justify your answer.
14. The table below shows the results of Jill’s survey from item 13.
Number of Students Who Listen to Classical Music
Number of Students Who Do Not Listen To Classical Music
10 40
Based on the results of the survey, if a student is chosen at random, what
is the probability that a student listens to classical music? Explain how you determined your answer. Use words, symbols, or both in your explanation.
Based on the results of the survey, if there are 800 students in her school,
predict how many students listen to classical music. Explain how you determined your answer. Use words, symbols, or both in your explanation.
15. Hairless in Seattle, Inc. is marketing its hair growth cream. The two graphs below
are being considered for use in magazine ads.
Graph One Graph Two
The two graphs represent the same information. Why do the two graphs look different?
BCR
1.2
Hair Growth Cream
Hair Length
(inches)
Time (weeks) 0 1 2 3 4
1.4
1.6
1.8
1
Hair Growth Cream
Hair Length (inches)
Time (weeks) 0 1 2 3 4
2
3
4
1 0
BCR
ALGEBRA 1 B Semester Exam Review
MCPS © 2012–2013 7
16. On the first 5 weeks of a job, Nancy earned $50, $50, $80, $90, and $300. Which measure of central tendency is best representative of Nancy’s weekly income? Explain your answer.
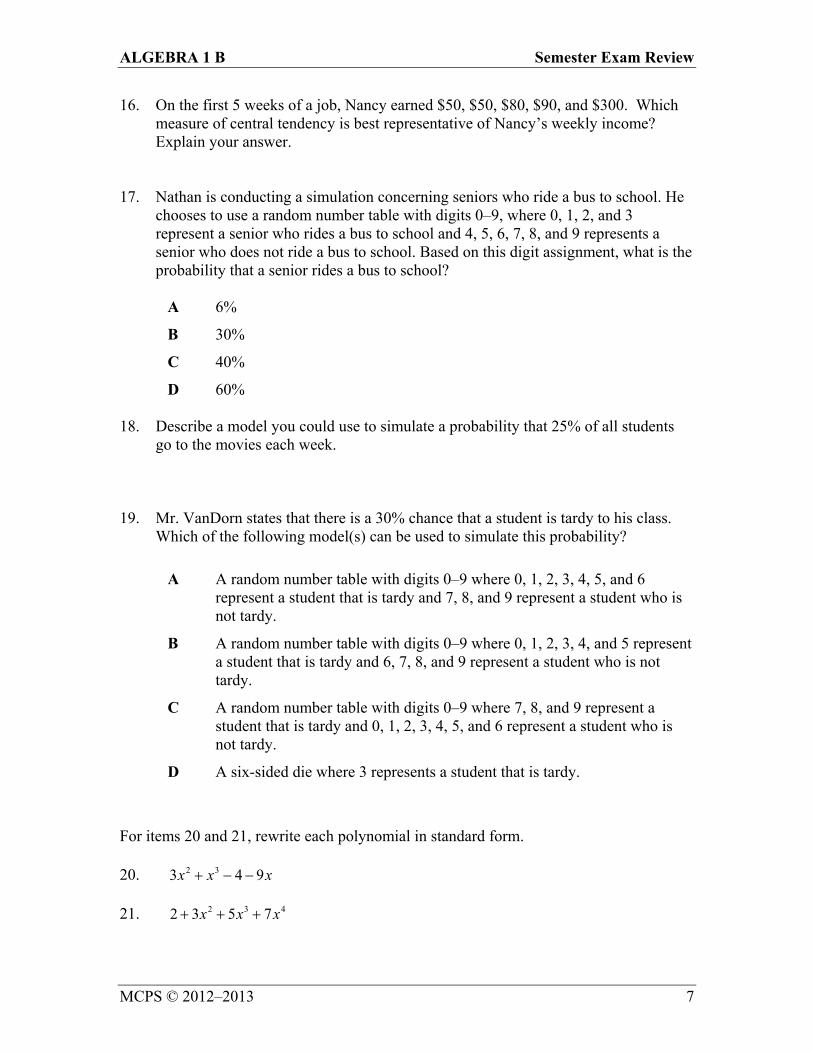
17. Nathan is conducting a simulation concerning seniors who ride a bus to school. He
chooses to use a random number table with digits 0–9, where 0, 1, 2, and 3 represent a senior who rides a bus to school and 4, 5, 6, 7, 8, and 9 represents a senior who does not ride a bus to school. Based on this digit assignment, what is the probability that a senior rides a bus to school?
A 6%
B 30%
C 40%
D 60% 18. Describe a model you could use to simulate a probability that 25% of all students go to the movies each week. 19. Mr. VanDorn states that there is a 30% chance that a student is tardy to his class.
Which of the following model(s) can be used to simulate this probability?
A A random number table with digits 0–9 where 0, 1, 2, 3, 4, 5, and 6 represent a student that is tardy and 7, 8, and 9 represent a student who is not tardy.
B A random number table with digits 0–9 where 0, 1, 2, 3, 4, and 5 represent a student that is tardy and 6, 7, 8, and 9 represent a student who is not tardy.
C A random number table with digits 0–9 where 7, 8, and 9 represent a student that is tardy and 0, 1, 2, 3, 4, 5, and 6 represent a student who is not tardy.
D A six-sided die where 3 represents a student that is tardy.
For items 20 and 21, rewrite each polynomial in standard form.
20. 2 33 4 9x x x
21. 2 3 42 3 5 7x x x
ALGEBRA 1 B Semester Exam Review
MCPS © 2012–2013 8
For items 22 through 27, simplify. Your final answer should have only positive exponents.
22. 42 33x y
23. 24 35x y
24. 6 3 22 3x y x y
25. 5 3 44 2xy x y
26. 6 7
3 5
36
4
x y
x y
27. 3 2
2 3
15
3
x y
x y
For items 28 through 31, add or subtract as indicated.
28. 2 23 4 7 2 8x x x x
29. 2 25 6 12 2 11m m m m
30. 3 24 6 12 5 9 15x x x x
31. 2 23 9 3 4 17t t t t
For items 32 through 39, multiply or divide as indicated. 32. 2 5 4 7x x
33. 3 2 7x x
34. 22 5x
35. 25 3x
36. 9 9x x
37. 3 5 3 5x y x y
38. 3 23 12 9
3
x x x
x
39. 3 2 2 3 5 5
2 2
64 16 32
8
x y x y x y
x y
ALGEBRA 1 B Semester Exam Review
MCPS © 2012–2013 9
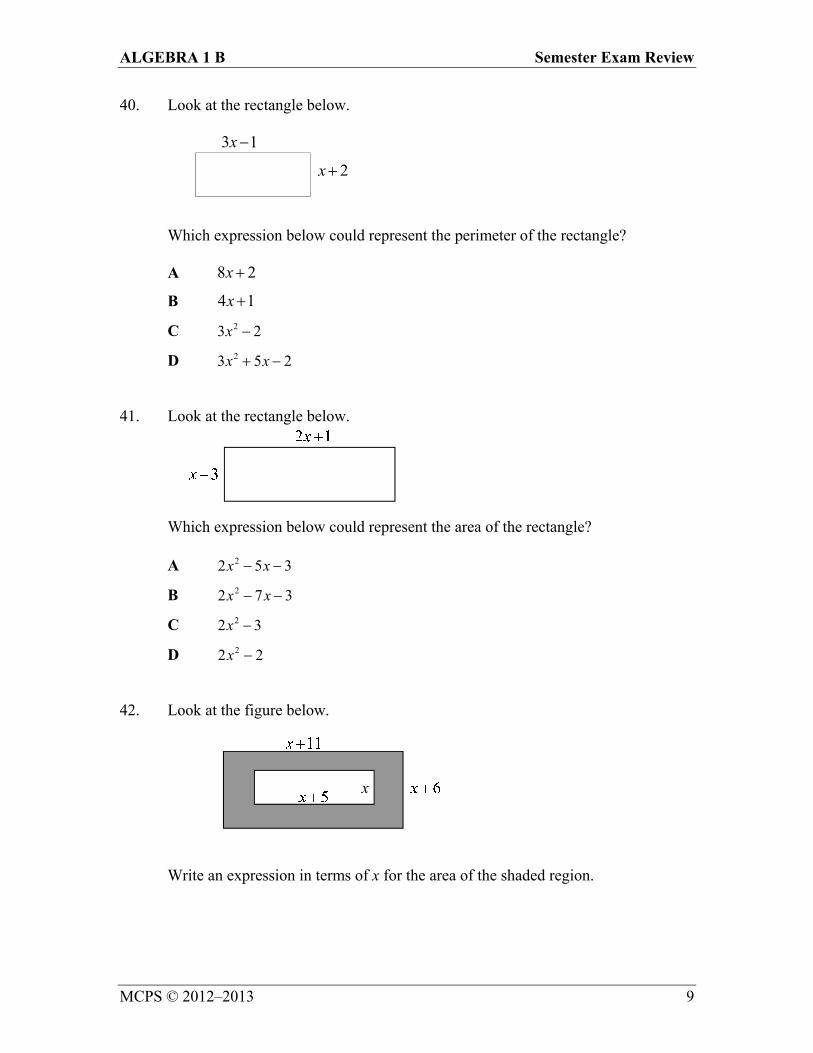
40. Look at the rectangle below. 3 1x
2x
Which expression below could represent the perimeter of the rectangle?
A 8 2x
B 4 1x
C 23 2x
D 23 5 2x x 41. Look at the rectangle below.
Which expression below could represent the area of the rectangle? A 22 5 3x x
B 22 7 3x x
C 22 3x
D 22 2x 42. Look at the figure below.
Write an expression in terms of x for the area of the shaded region.
x
ALGEBRA 1 B Semester Exam Review
MCPS © 2012–2013 10
43. Which binomial below is a factor of 2 12?x x
A 4x
B 3x
C 3x
D 6x
For items 44 through 51, factor each of the following completely. 44. 3 26 30x x
45. 3 2 2 35 15x y x y
46. 2 17 30x x
47. 22 9 5x x
48. 2 81x
49. 225 64x
50. 2 14 49a a
51. 2 20 100x x
For items 52 through 57, solve. 52. 2 5 1 0x x
53. 6 3 7 0x x
54. 2 10 9 0r r
55. 2 6 7 0t t
56. 2 7 2 0x x
57. 2 5 1 x x

ALGEBRA 1 B Semester Exam Review
MCPS © 2012–2013 11
58. Let 25 4f x x x
a. Sketch the graph of f x below. Indicate the location of the vertices and
all x- and y- intercepts. b. Using the graph, write the vertex form of the equation of the parabola. c. What are the zeros of the function? d. Write the equation for the axis of symmetry.
x O
y
ALGEBRA 1 B Semester Exam Review
MCPS © 2012–2013 12
59. Let 2 6 5f x x x .
a. What is the vertex of the graph?
b. What is the equation of the axis of symmetry of the graph?
c. What is the y-intercept of the graph?
d. What are the x-intercepts of the graph? e. What are the zeros of the function?
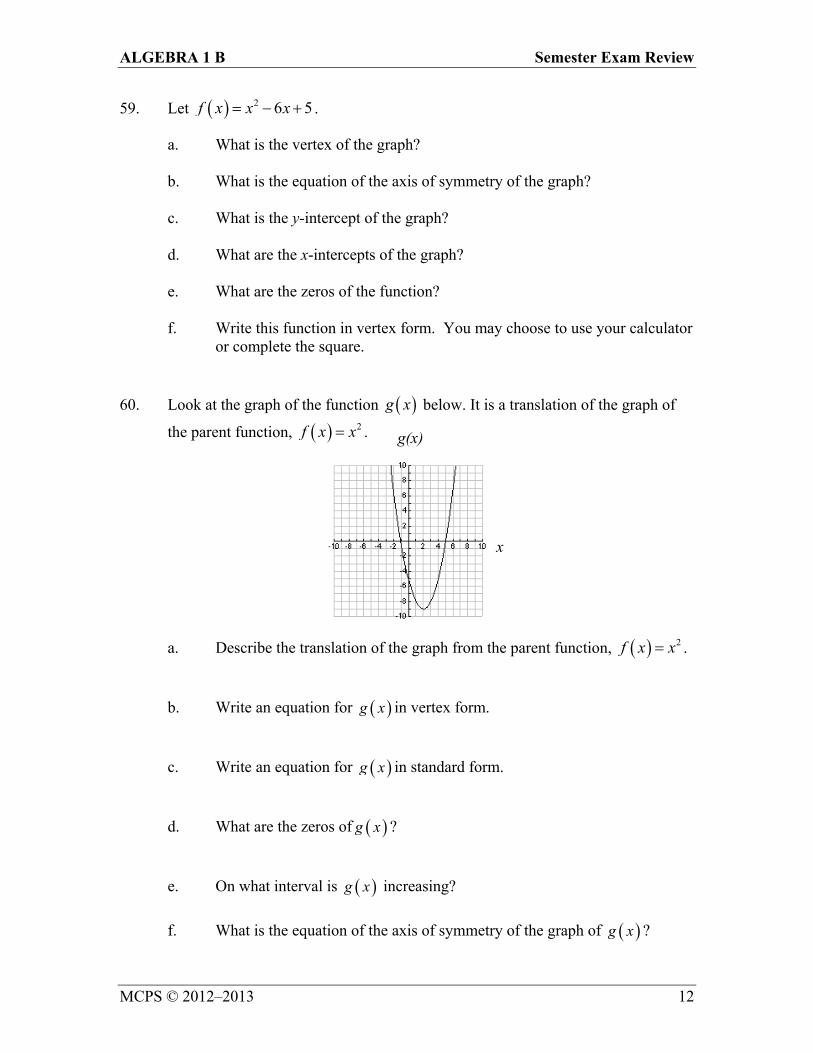
f. Write this function in vertex form. You may choose to use your calculator or complete the square. 60. Look at the graph of the function g x below. It is a translation of the graph of
the parent function, 2f x x .
a. Describe the translation of the graph from the parent function, 2f x x .
b. Write an equation for g x in vertex form.
c. Write an equation for g x in standard form. d. What are the zeros of g x ?
e. On what interval is g x increasing?
f. What is the equation of the axis of symmetry of the graph of g x ?
g(x)
x

ALGEBRA 1 B Semester Exam Review
MCPS © 2012–2013 13
61. What is the equation of the axis of symmetry for the graph of the parabola
represented by 22 7 5y x ?
62. What is the vertex for the graph of the parabola represented by 24 5 6y x ?
A 5, 6
B 5,6
C 5, 6
D 5,6
63. Jack kicked a football. The height, h t in feet, of the ball after t seconds is given
by the quadratic function. 2( ) 16 50h t t t .
Does the ball reach its maximum height at 2t seconds? Use mathematics to justify your answer.
After how many seconds does the ball hit the ground? Explain how you determined your answer. Use words, symbols, or both on your explanation.
64. An animal makes a leap into the air. A function for the height h t , in meters of
the animal’s feet above the ground after t seconds is given by 25 12.5h t t t .
a. What is the maximum height that the animal’s feet reach? b. How long is the animal in the air?
ECR
ALGEBRA 1 B Semester Exam Review
MCPS © 2012–2013 14
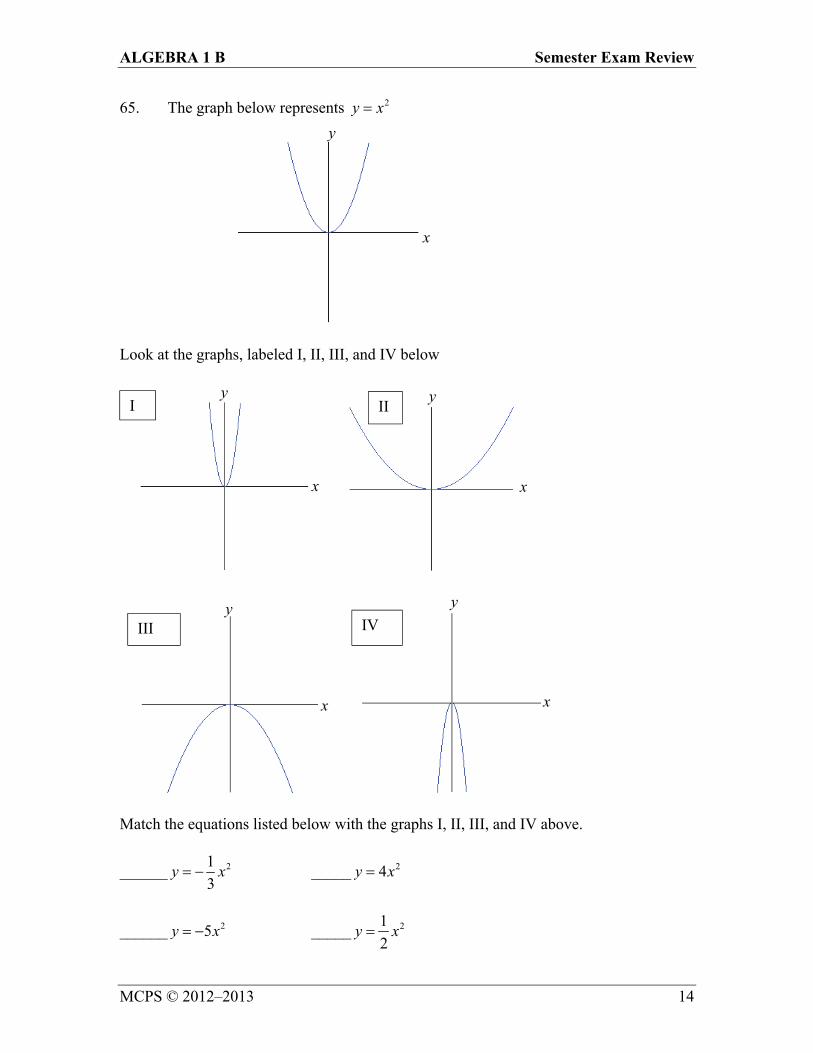
65. The graph below represents 2y x
Look at the graphs, labeled I, II, III, and IV below
Match the equations listed below with the graphs I, II, III, and IV above.
______ 21
3y x _____ 24y x
______ 25y x _____ 21
2y x
I II
III IV
x
x
x x
x
y y
y y
y
ALGEBRA 1 B Semester Exam Review
MCPS © 2012–2013 15
66. Complete the table below so that it represents an exponential function.
x 1 2 3 4 5 6
f x 7 28 112 224
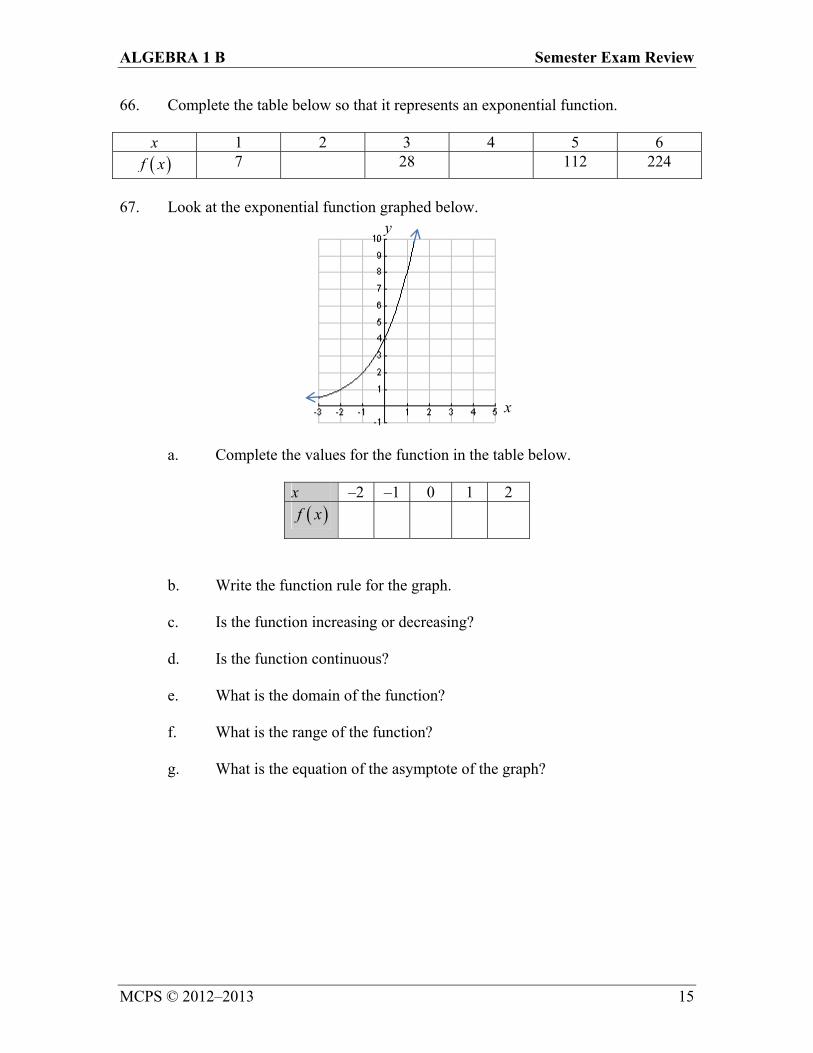
67. Look at the exponential function graphed below.
a. Complete the values for the function in the table below.
x –2 –1 0 1 2
f x
b. Write the function rule for the graph.
c. Is the function increasing or decreasing? d. Is the function continuous? e. What is the domain of the function? f. What is the range of the function? g. What is the equation of the asymptote of the graph?
x
y
ALGEBRA 1 B Semester Exam Review
MCPS © 2012–2013 16
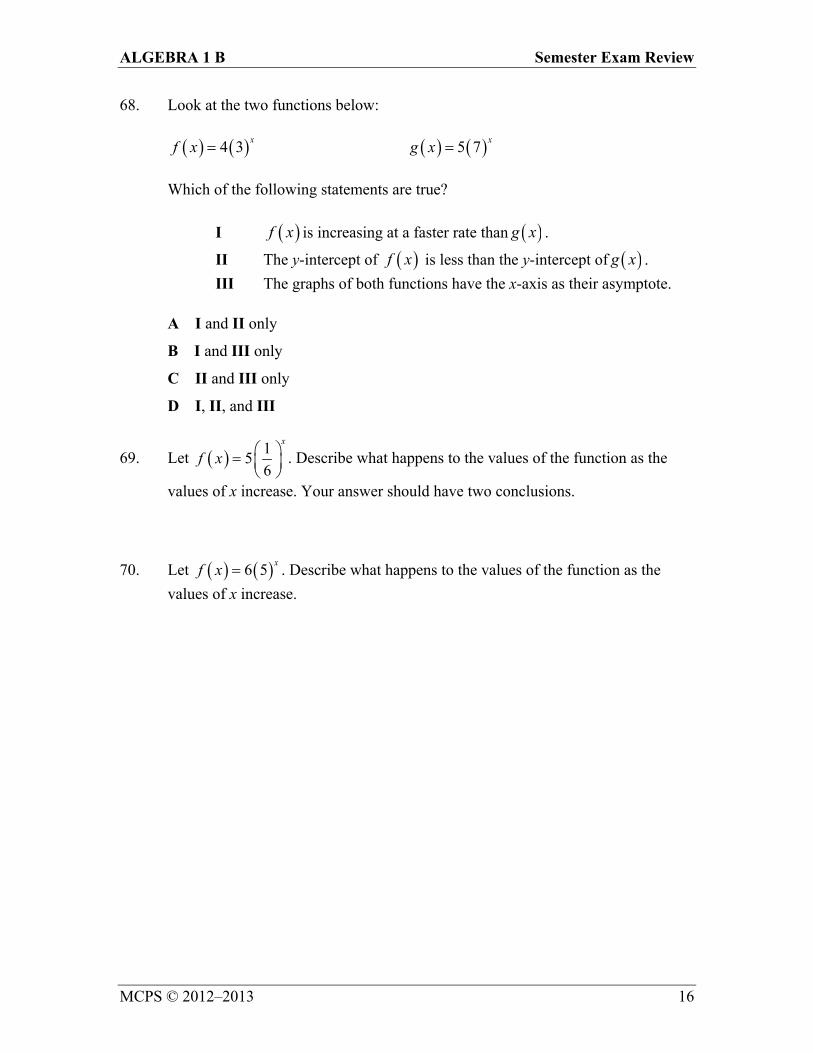
68. Look at the two functions below:
4 3x
f x 5 7x
g x
Which of the following statements are true? I f x is increasing at a faster rate than g x .
II The y-intercept of f x is less than the y-intercept of g x .
III The graphs of both functions have the x-axis as their asymptote.
A I and II only
B I and III only
C II and III only
D I, II, and III
69. Let 15
6
x
f x
. Describe what happens to the values of the function as the
values of x increase. Your answer should have two conclusions.
70. Let 6 5x
f x . Describe what happens to the values of the function as the
values of x increase.
ALGEBRA 1 B Semester Exam Review
MCPS © 2012–2013 17
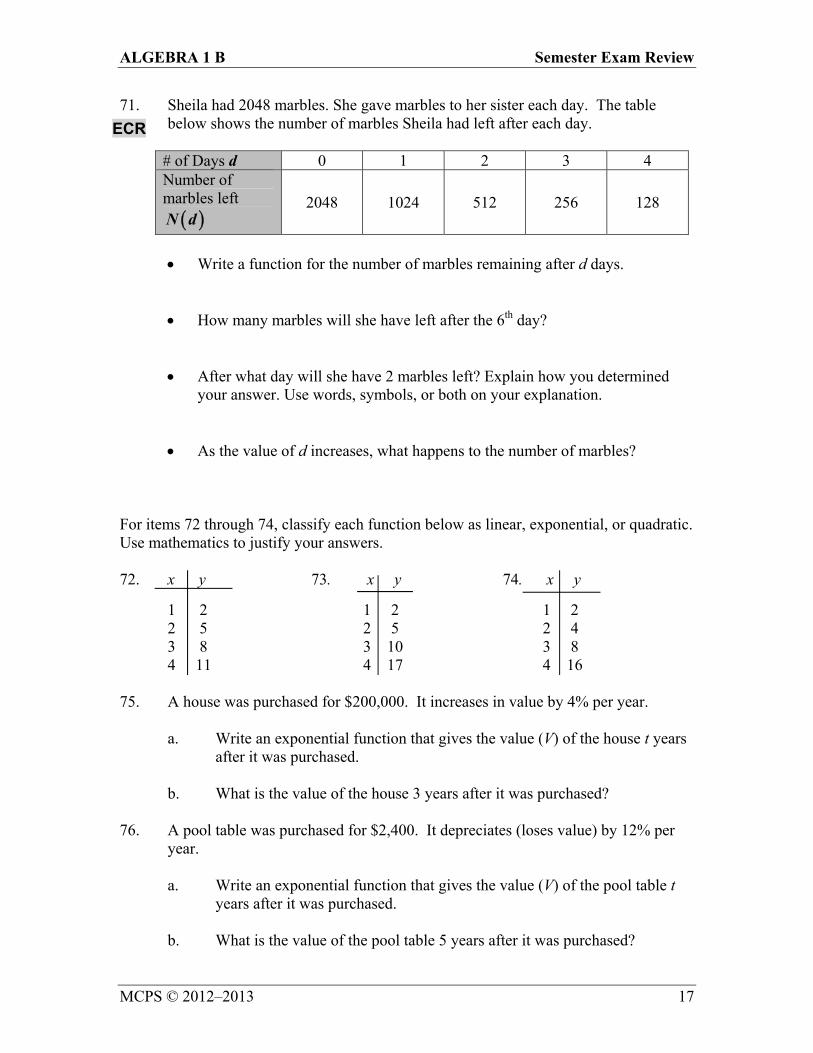
71. Sheila had 2048 marbles. She gave marbles to her sister each day. The table below shows the number of marbles Sheila had left after each day.
# of Days d 0 1 2 3 4 Number of marbles left
N d 2048 1024 512 256 128
Write a function for the number of marbles remaining after d days.
How many marbles will she have left after the 6th day?
After what day will she have 2 marbles left? Explain how you determined your answer. Use words, symbols, or both on your explanation.
As the value of d increases, what happens to the number of marbles?
For items 72 through 74, classify each function below as linear, exponential, or quadratic. Use mathematics to justify your answers. 72. x y 73. x y 74. x y
1 2 1 2 1 2 2 5 2 5 2 4 3 8 3 10 3 8 4 11 4 17 4 16
75. A house was purchased for $200,000. It increases in value by 4% per year.
a. Write an exponential function that gives the value (V) of the house t years after it was purchased.
b. What is the value of the house 3 years after it was purchased?
76. A pool table was purchased for $2,400. It depreciates (loses value) by 12% per year.
a. Write an exponential function that gives the value (V) of the pool table t years after it was purchased.
b. What is the value of the pool table 5 years after it was purchased?
ECR
ALGEBRA 1 B Semester Exam Review
MCPS © 2012–2013 18
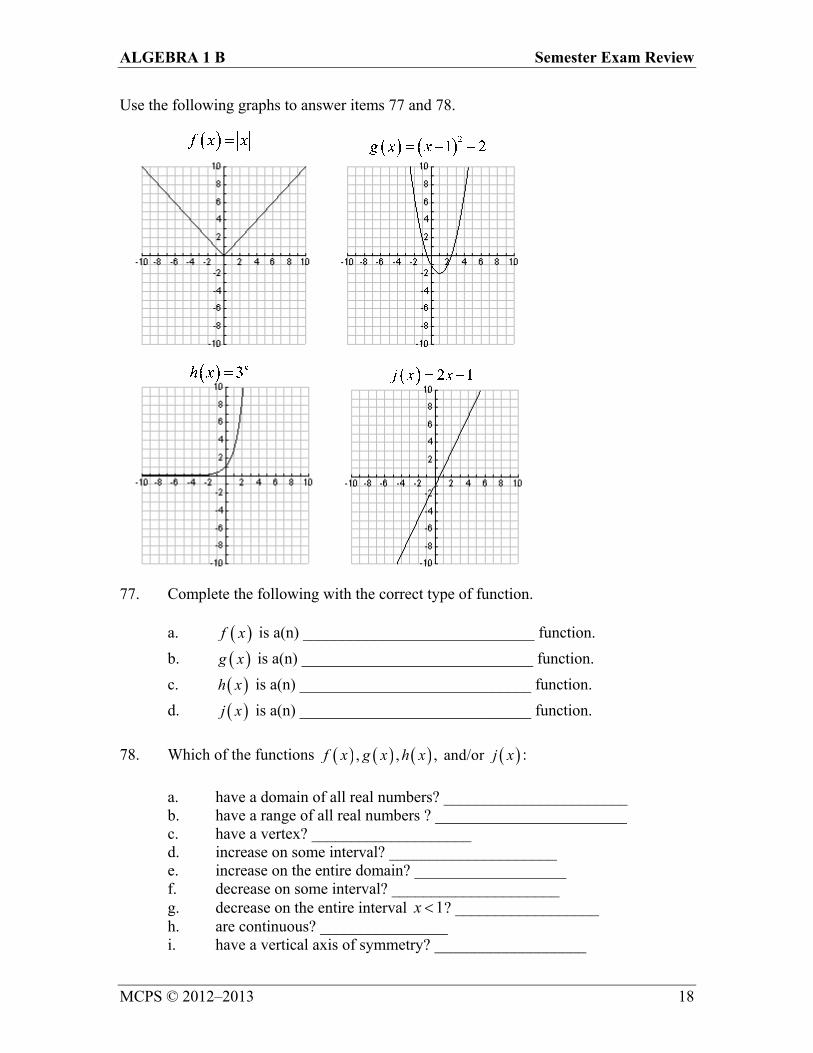
Use the following graphs to answer items 77 and 78.
77. Complete the following with the correct type of function. a. f x is a(n) _____________________________ function.
b. g x is a(n) _____________________________ function.
c. h x is a(n) _____________________________ function.
d. j x is a(n) _____________________________ function.
78. Which of the functions , , , and/orf x g x h x j x :
a. have a domain of all real numbers? _______________________ b. have a range of all real numbers ? ________________________ c. have a vertex? ____________________ d. increase on some interval? _____________________ e. increase on the entire domain? ___________________ f. decrease on some interval? _____________________ g. decrease on the entire interval 1x ? __________________ h. are continuous? ________________ i. have a vertical axis of symmetry? ___________________
ALGEBRA 1 B Semester Exam Review
MCPS © 2012–2013 19
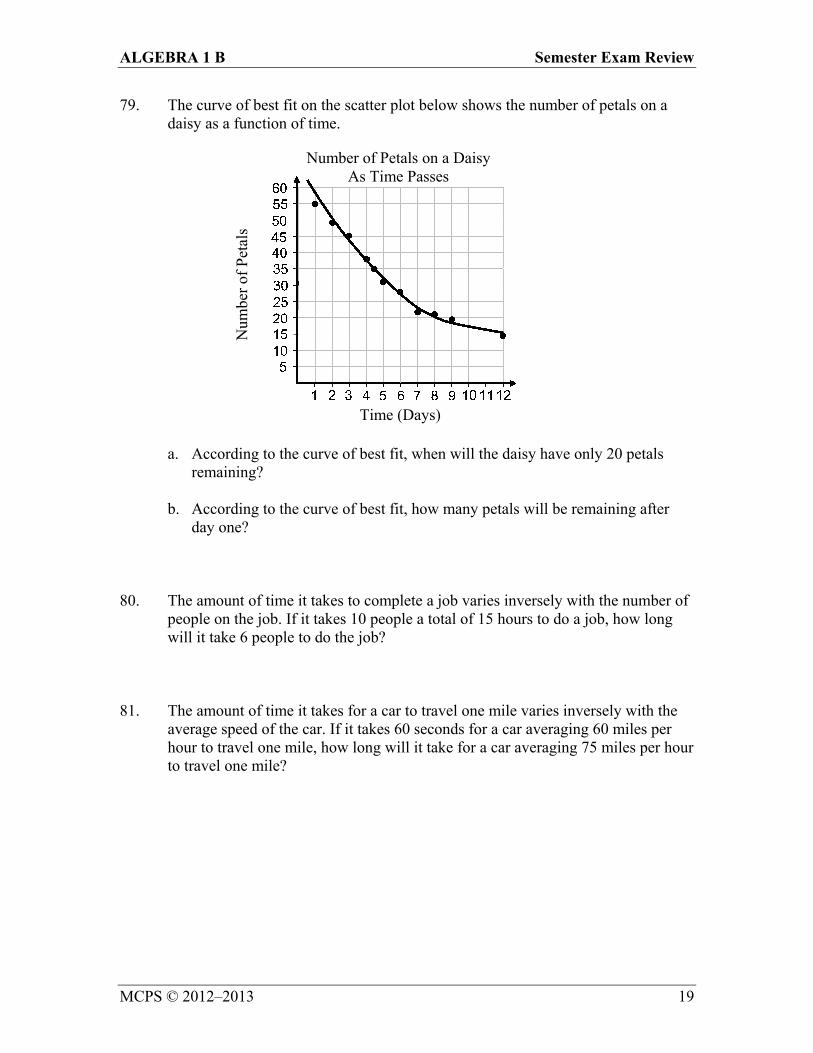
79. The curve of best fit on the scatter plot below shows the number of petals on a daisy as a function of time.
a. According to the curve of best fit, when will the daisy have only 20 petals remaining?
b. According to the curve of best fit, how many petals will be remaining after day one?
80. The amount of time it takes to complete a job varies inversely with the number of
people on the job. If it takes 10 people a total of 15 hours to do a job, how long will it take 6 people to do the job?
81. The amount of time it takes for a car to travel one mile varies inversely with the
average speed of the car. If it takes 60 seconds for a car averaging 60 miles per hour to travel one mile, how long will it take for a car averaging 75 miles per hour to travel one mile?
Number of Petals on a Daisy As Time Passes
Time (Days)
Num
ber
of P
etal
s
ALGEBRA 1 B Semester Exam Review
MCPS © 2012–2013 20
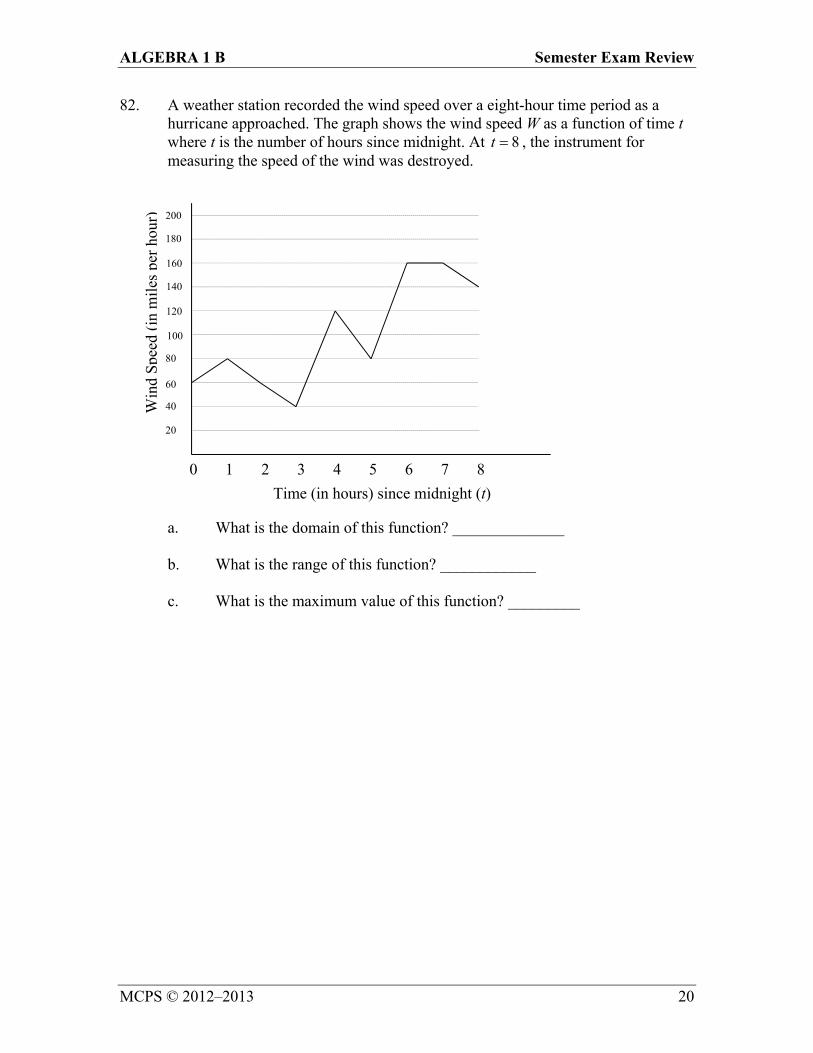
82. A weather station recorded the wind speed over a eight-hour time period as a hurricane approached. The graph shows the wind speed W as a function of time t where t is the number of hours since midnight. At 8t , the instrument for measuring the speed of the wind was destroyed. a. What is the domain of this function? ______________ b. What is the range of this function? ____________ c. What is the maximum value of this function? _________
0 1 2 3 4 5 6 7 8
Time (in hours) since midnight (t)
200
180
160
140
120
100
80
60
40
20
Win
d S
peed
(in
mil
es p
er h
our)
ALGEBRA 1 B Semester Exam Review
MCPS © 2012–2013 21
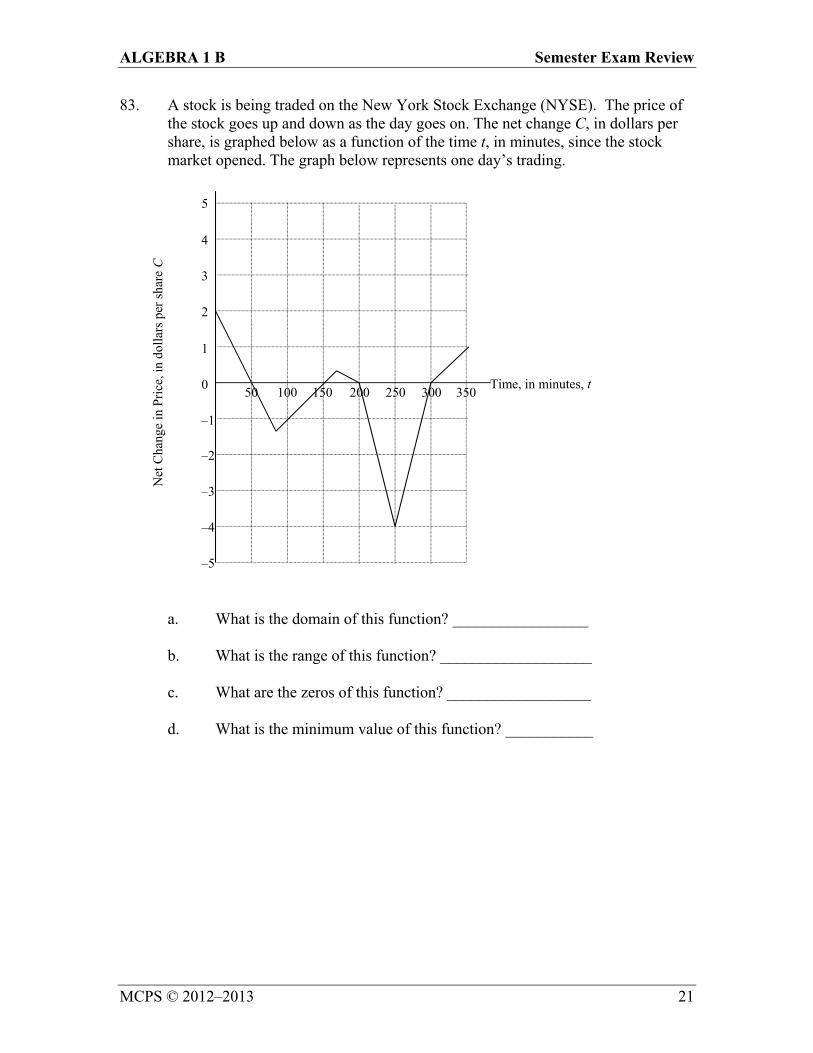
83. A stock is being traded on the New York Stock Exchange (NYSE). The price of the stock goes up and down as the day goes on. The net change C, in dollars per share, is graphed below as a function of the time t, in minutes, since the stock market opened. The graph below represents one day’s trading. a. What is the domain of this function? _________________ b. What is the range of this function? ___________________ c. What are the zeros of this function? __________________ d. What is the minimum value of this function? ___________
Time, in minutes, t
5
4
3
2
1
0
–5
–4
–3
–2
–1
350300250200150100 50
Net
Cha
nge
in P
rice
, in
dolla
rs p
er s
hare
C