alcohol, health inequalities and the harm paradox: why ... reports/ias report alcohol and... ·...
TRANSCRIPT
Alcohol, Health Inequalities and the Harm Paradox:
Why some groups face greater problemsdespite consuming less alcohol
A summary of the available evidence
By Dr Katherine Smith, Reader – Global Public Health Unit,School of Social & Political Science, University of Edinburgh,
&
Jon Foster, Senior Research and Policy Officer, Institute ofAlcohol Studies
Alcohol, Health Inequalities and the Harm Paradox 1
Contents
4 1. Introduction4 1.1 What are ‘health inequalities’?5 1.2 Alcohol and health inequalities5 1.3 Alcohol and national efforts to reduce health inequalities
7 2. Patterns and Trends in Health inequalities in the UK8 2.1 The 2010 Marmot Review of Health9 2.2 How inequality is measured
11 3. The relationship between alcohol and health inequalities11 3.1 The role that alcohol plays in overall health inequalities12 3.2 The ‘alcohol harm paradox’13 3.3 Consumption patterns14 3.4 Inaccurate consumption reporting 14 3.5 Alcohol and other unhealthy behaviours 15 3.6 Access to healthcare15 3.7 Materialist explanations
16 4. Health inequalities: the policy context in the UK17 4.1 Alcohol policy and health inequalities across the UK
19 5. Interventions to address alcohol related inequalities19 5.1 Alcohol Affordability and Minimum Unit Pricing 21 5.2 Alcohol availability and outlet density22 Case Study: alcohol related health inequalities CIP in Liverpool24 5.3 A Public Health Licencing Objective25 Case Study: Leeds City Council South Leeds Guidance26 5.4 General welfare expenditure
27 6. Possible directions for future research
28 7. Conclusion
A summary of this report, and a podcast interview withProfessor Sir Michael Marmot, can be found in the IAS Reports
section of our website.
Cover image by Kimery Davis.
Alcohol, Health Inequalities and the Harm Paradox 2

Acknowledgements
The authors would like to thank the following for their help in the production of this report:
Sir Michael Marmot FBA FMedSci FRCP, Professor of Epidemiology and Public Health at University College London.
Dr John Holmes, Research Fellow in the Sheffield Alcohol Research Group, School of Health and Related Research
David Buck, Senior Fellow, Public health & health inequalities The King's Fund
Liverpool City Council Public Health Department
Leeds City Council Entertainment Licensing Team
Alcohol, Health Inequalities and the Harm Paradox 3
1. Introduction
1.1 What are ‘health inequalities’?
In the UK, the term ‘health inequality’ is usually used to refer to systematic differences in health which exist between socio-economic classes or geographical areas, although there are other inequalities, for example by gender and ethnicity. Health inequalities can be defined in a purely descriptive way, but the moral and ethical dimensions of the term are often emphasized. For example, Whiteheadi defines health inequalities as ‘systematic differences in health between different socio-economic groups within a society’ which are ‘socially produced’ and, therefore, ‘potentially avoidable and widely considered unacceptable in a civilised society’.
A commonly cited example of health inequalities within the UK is that men living in the Calton area of Glasgow live, on average, 28 years less than men living in Lenzie, just a few kilometres away.ii
There is a significant consensus within available research that such inequalities are related to material factors, such as financial resources and housing.iii iv There is also a consensus that it is important to consider the whole life-course, with evidence highlighting how individuals who are exposed to adverse conditions in one respect, such as work, are also more likely to encounter disadvantage in others, such as poor and damp housing, or inadequate nutrition.v vi Psychological factors such as stress responses and coping strategies have also been investigated as plausible pathways linking material inequalities to health inequalities.vii
Finally, cultural-behavioural factors such as alcohol consumption, smoking, exercise and diet are also part of the picture.viii Studies consistently find a socio-demographic gradient in the prevalence of multiple lifestyle-behavioural risk factors, with men, younger age groups and those of lower socioeconomic status all more likely to experience multiple risks.ix However, lifestyle-behaviours are generally regarded by researchers as both symptoms and causes of health inequalities. This is
Alcohol, Health Inequalities and the Harm Paradox 4
Summary Points
• Health inequalities are systematic differences in health between different social groups within a society
• Health inequalities are estimated to cost the UK £32-33 billion per year in terms of illness, lost taxes and productivity
• Lower socioeconomic status (SES) is associated with higher mortality for alcohol-attributable causes, despite lower socioeconomic groups often reporting lower levels of consumption
• Alcohol can be seen as a contributing factor for almost 50% of the indicators within the Public Health Outcomes Framework for England. As such addressing alcohol-related harm could be a key route to improving public health and reducing general health inequalities.
because such behaviours are themselves shaped by the socioeconomic contexts in which people live and work.x
1.2 Alcohol and health inequalities
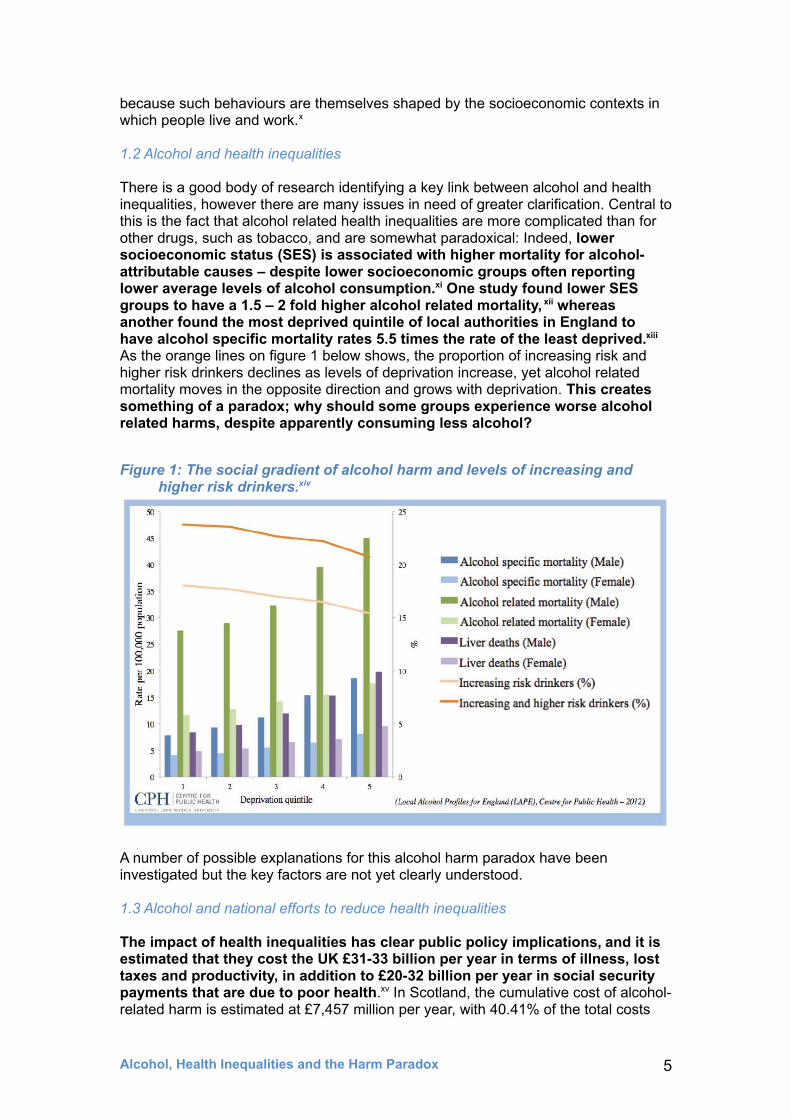
There is a good body of research identifying a key link between alcohol and health inequalities, however there are many issues in need of greater clarification. Central to this is the fact that alcohol related health inequalities are more complicated than for other drugs, such as tobacco, and are somewhat paradoxical: Indeed, lower socioeconomic status (SES) is associated with higher mortality for alcohol-attributable causes – despite lower socioeconomic groups often reporting lower average levels of alcohol consumption.xi One study found lower SES groups to have a 1.5 – 2 fold higher alcohol related mortality, xii whereas another found the most deprived quintile of local authorities in England to have alcohol specific mortality rates 5.5 times the rate of the least deprived.xiii As the orange lines on figure 1 below shows, the proportion of increasing risk and higher risk drinkers declines as levels of deprivation increase, yet alcohol related mortality moves in the opposite direction and grows with deprivation. This creates something of a paradox; why should some groups experience worse alcohol related harms, despite apparently consuming less alcohol?
Figure 1: The social gradient of alcohol harm and levels of increasing and higher risk drinkers.xiv
A number of possible explanations for this alcohol harm paradox have been investigated but the key factors are not yet clearly understood.
1.3 Alcohol and national efforts to reduce health inequalities
The impact of health inequalities has clear public policy implications, and it is estimated that they cost the UK £31-33 billion per year in terms of illness, lost taxes and productivity, in addition to £20-32 billion per year in social security payments that are due to poor health.xv In Scotland, the cumulative cost of alcohol-related harm is estimated at £7,457 million per year, with 40.41% of the total costs
Alcohol, Health Inequalities and the Harm Paradox 5

arising from the most deprived 20% of areas.xvi These costs are not purely economic; people living in deprived areas experience first-hand the burden of alcohol harms more than any other group.
Alcohol is involved in a wide range of health and social concerns, from dangerous driving to crime and domestic abuse, cancer, heart and liver disease, to accidents at work. Given this, and the fact that the most deprived communities are disproportionately affected by these issues,xvii xviii tackling problems associated with alcohol can be seen as central to efforts to reduce health inequalities across society, whilst tackling the ‘upstream’ social, economic and environmental determinants of health inequalities is likely to support efforts to reduce alcohol-related harms.xix xx
Alcohol related factors are found across all four of the domains in the current Public Health Outcomes Framework for England (see figure 6 on page 18) and, as such, tackling alcohol related harm could be a key route to reducing health inequalities in general. Yet in addition to alcohol specific measures mentioned in this paper, it is important to note that general welfare spending has been found to impact positively on alcohol-attributable mortality. Several studies have shown that a rise in social welfare spending is associated with a decrease in alcohol-attributable mortality, whereas rising healthcare spending is not.xxi
Given the current political and economic climate, with a likely rise in inequality,xxii this fact does not bode well for alcohol related health inequalities. In addition, public health bodies have raised concerns about the lack of action in key areas designed to reduce alcohol harm, such as tackling affordability of alcohol through minimum unit pricing. Research indicates that this would have a positive impact on reducing health inequalities, by targeting price increases on heavier drinkers in the lower socioeconomic groups who are at greatest risk of harm.xxiii Commentators have criticised the Government for delaying the introduction of minimum unit pricing and instead introducing a ban on below cost sales. Research indicates that this option will be much less effective; a minimum alcohol unit price of 40 – 50p would have 40 – 50 times greater effect than a ban on below cost sales in terms of reducing consumption and alcohol related harms.xxiv In addition, the UK Government has recently reduced taxes on alcohol by abolishing the alcohol duty escalator in the 2014 Budget. This action was taken in the face of research that suggests making alcohol more affordable will result in a greater increase in alcohol-attributable deaths among people of low SES compared with people of high SES.xxv
Alcohol, Health Inequalities and the Harm Paradox 6

2. Patterns and Trends in Health inequalities in the UK
Health inequalities have been identified as an area for concern across Europe. A 2006 Institute of Alcohol Studies report on the impact of alcohol in Europe, funded by the European Commission, identified alcohol related health inequalities both between and within EU countries.xxvi For example, this report estimates that alcohol is responsible for approximately 90 extra deaths per 100,000 people for men and 60 per 100,000 for women within newer EU member-states (Cyprus, the Czech Republic, Estonia, Hungary, Latvia, Lithuania, Malta, Poland, Slovakia and Slovenia) compared with the older EU member states (Austria, Belgium, Denmark, France, Finland, Germany, Greece, Ireland, Italy, Luxembourg, Netherlands, Portugal, Spain, Sweden, and the United Kingdom).
Such patterns are apparent within counties as well as between them. Within the UK, recent data from Public Health England (2014) highlights significant regional differences within England in terms of both alcohol related mortality and hospital admissions, with some of the most deprived communities seeing an increase in deaths. Of the 326 local authorities included in the 2014 data, 145 (45%) have seen an increase in alcohol-related deaths among men and 154 (47%) among women, compared with the last update in 2012.xxvii The areas with the best overall alcohol health outcomes were mainly found in the south of England, whereas the local authorities with the highest rates of alcohol related mortality were situated predominantly within the North West, with Liverpool among the worst five areas for both sexes, as figure 2 below demonstrates.
Alcohol, Health Inequalities and the Harm Paradox 7
Summary Points
• While there have been improvements in health for most sections of UK society, the health of the most advantaged groups has improved at a faster rate than the least advantaged groups
• Unless consciously designed not to, policies and actions that work for populations as a whole can inadvertently exacerbate inequalities
• Public health interventions which rely on individuals to change, such as public education campaigns, are likely to increase health inequalities, whilst more ‘upstream’ public health interventions, such as price increases and restrictions on the availability of health-damaging products, are most likely to help reduce health inequalities
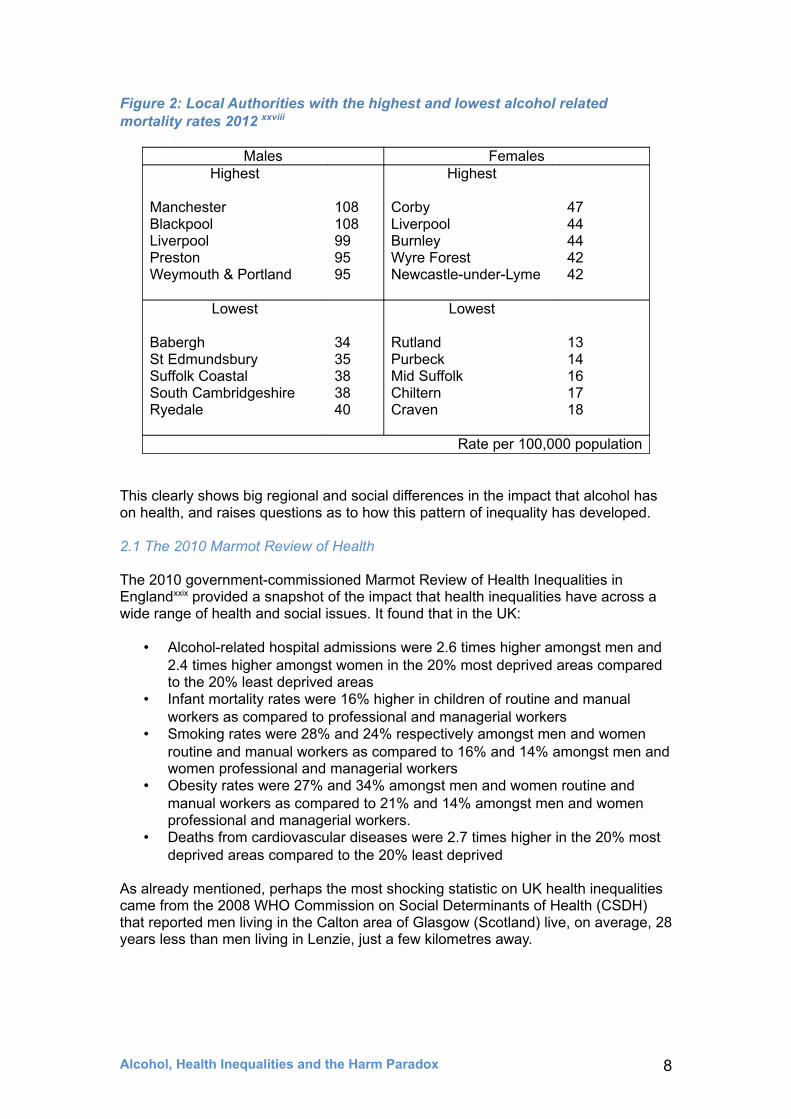
Figure 2: Local Authorities with the highest and lowest alcohol related mortality rates 2012 xxviii
Males FemalesHighest
ManchesterBlackpoolLiverpoolPrestonWeymouth & Portland
108108999595
Highest
CorbyLiverpoolBurnleyWyre ForestNewcastle-under-Lyme
4744444242
Lowest
BaberghSt EdmundsburySuffolk CoastalSouth CambridgeshireRyedale
3435383840
Lowest
RutlandPurbeckMid SuffolkChilternCraven
1314161718
Rate per 100,000 population
This clearly shows big regional and social differences in the impact that alcohol has on health, and raises questions as to how this pattern of inequality has developed.
2.1 The 2010 Marmot Review of Health
The 2010 government-commissioned Marmot Review of Health Inequalities in Englandxxix provided a snapshot of the impact that health inequalities have across a wide range of health and social issues. It found that in the UK:
• Alcohol-related hospital admissions were 2.6 times higher amongst men and 2.4 times higher amongst women in the 20% most deprived areas compared to the 20% least deprived areas
• Infant mortality rates were 16% higher in children of routine and manual workers as compared to professional and managerial workers
• Smoking rates were 28% and 24% respectively amongst men and women routine and manual workers as compared to 16% and 14% amongst men and women professional and managerial workers
• Obesity rates were 27% and 34% amongst men and women routine and manual workers as compared to 21% and 14% amongst men and women professional and managerial workers.
• Deaths from cardiovascular diseases were 2.7 times higher in the 20% most deprived areas compared to the 20% least deprived
As already mentioned, perhaps the most shocking statistic on UK health inequalities came from the 2008 WHO Commission on Social Determinants of Health (CSDH) that reported men living in the Calton area of Glasgow (Scotland) live, on average, 28 years less than men living in Lenzie, just a few kilometres away.
Alcohol, Health Inequalities and the Harm Paradox 8
2.2 How inequality is measured
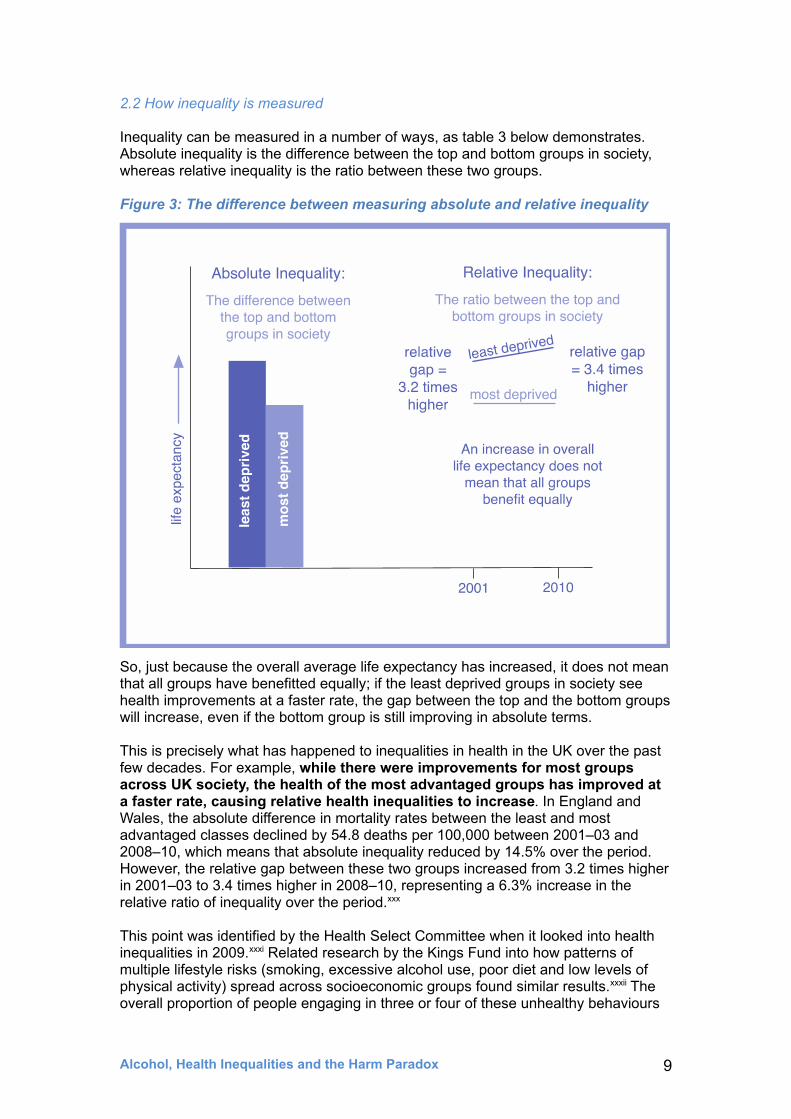
Inequality can be measured in a number of ways, as table 3 below demonstrates. Absolute inequality is the difference between the top and bottom groups in society, whereas relative inequality is the ratio between these two groups.
Figure 3: The difference between measuring absolute and relative inequality
So, just because the overall average life expectancy has increased, it does not mean that all groups have benefitted equally; if the least deprived groups in society see health improvements at a faster rate, the gap between the top and the bottom groups will increase, even if the bottom group is still improving in absolute terms.
This is precisely what has happened to inequalities in health in the UK over the past few decades. For example, while there were improvements for most groups across UK society, the health of the most advantaged groups has improved at a faster rate, causing relative health inequalities to increase. In England and Wales, the absolute difference in mortality rates between the least and most advantaged classes declined by 54.8 deaths per 100,000 between 2001–03 and 2008–10, which means that absolute inequality reduced by 14.5% over the period. However, the relative gap between these two groups increased from 3.2 times higher in 2001–03 to 3.4 times higher in 2008–10, representing a 6.3% increase in the relative ratio of inequality over the period.xxx
This point was identified by the Health Select Committee when it looked into health inequalities in 2009.xxxi Related research by the Kings Fund into how patterns of multiple lifestyle risks (smoking, excessive alcohol use, poor diet and low levels of physical activity) spread across socioeconomic groups found similar results.xxxii The overall proportion of people engaging in three or four of these unhealthy behaviours
Alcohol, Health Inequalities and the Harm Paradox 9
declined significantly between 2003 and 2005. However, most of the reduction came from those in higher SES groups, with the gap between the top and the bottom groups growing. In 2003, people with no qualifications were three times more likely to engage in all four unhealthy behaviours as those with higher education, whereas by 2008 this was found to have increased to over five times as likely.xxxiii As highlighted by the King’s Fund:
This reflects one of public health’s most difficult dilemmas: unless consciously designed not to, policies and actions that work for populations as a whole often inadvertently entrench inequalities.xxxiv
A systematic review into the types of intervention that generate inequalities suggest that it might be more accurate to use the word ‘exacerbate’ rather than entrench, but points to very much the same conclusion. It found that public health interventions which rely on individuals to change, such as public education campaigns, are likely to increase health inequalities, whilst more ‘upstream’ public health interventions (e.g. price increases and restrictions in the availability of health-damaging products) are most likely to help reduce health inequalities.xxxv
In terms of alcohol related policies, the evidence suggests that Minimum Unit Pricing and targeted restrictions on the availability of alcohol are more likely to be effective in tackling health inequalities than education campaigns. These kinds of ‘upstream’ interventions more effectively target heavy drinkers from low SES backgrounds, as we will see in the following chapters.
Alcohol, Health Inequalities and the Harm Paradox 10
3. The relationship between alcohol and health inequalities
3.1 The role that alcohol plays in overall health inequalities
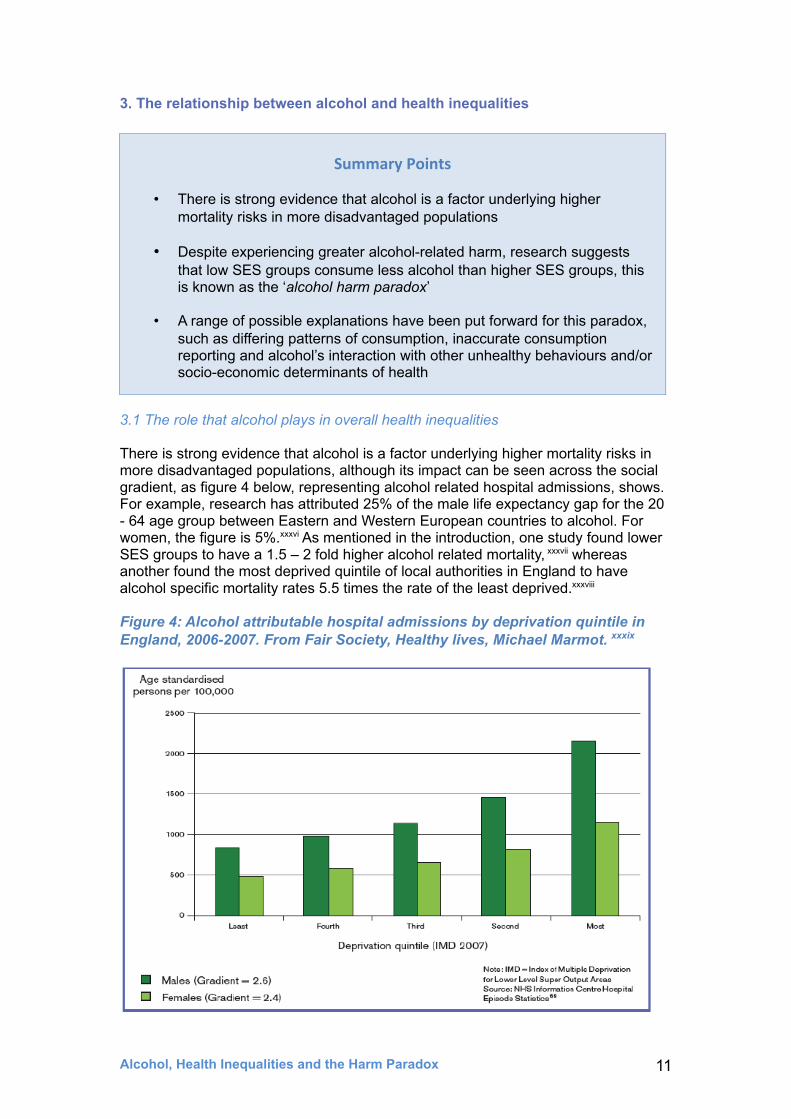
There is strong evidence that alcohol is a factor underlying higher mortality risks in more disadvantaged populations, although its impact can be seen across the social gradient, as figure 4 below, representing alcohol related hospital admissions, shows. For example, research has attributed 25% of the male life expectancy gap for the 20 - 64 age group between Eastern and Western European countries to alcohol. For women, the figure is 5%.xxxvi As mentioned in the introduction, one study found lower SES groups to have a 1.5 – 2 fold higher alcohol related mortality, xxxvii whereas another found the most deprived quintile of local authorities in England to have alcohol specific mortality rates 5.5 times the rate of the least deprived.xxxviii
Figure 4: Alcohol attributable hospital admissions by deprivation quintile in England, 2006-2007. From Fair Society, Healthy lives, Michael Marmot. xxxix
Alcohol, Health Inequalities and the Harm Paradox 11
Summary Points
• There is strong evidence that alcohol is a factor underlying higher mortality risks in more disadvantaged populations
• Despite experiencing greater alcohol-related harm, research suggests that low SES groups consume less alcohol than higher SES groups, this is known as the ‘alcohol harm paradox’
• A range of possible explanations have been put forward for this paradox, such as differing patterns of consumption, inaccurate consumption reporting and alcohol’s interaction with other unhealthy behaviours and/or socio-economic determinants of health
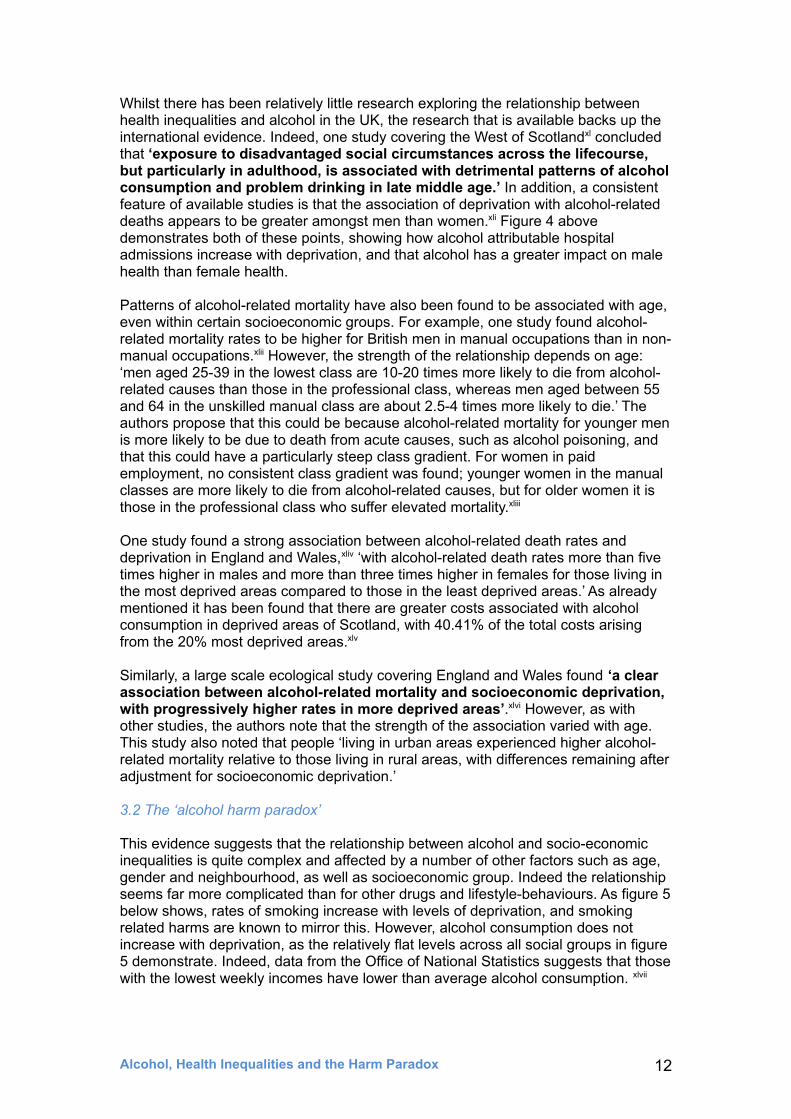
Whilst there has been relatively little research exploring the relationship between health inequalities and alcohol in the UK, the research that is available backs up the international evidence. Indeed, one study covering the West of Scotlandxl concluded that ‘exposure to disadvantaged social circumstances across the lifecourse, but particularly in adulthood, is associated with detrimental patterns of alcohol consumption and problem drinking in late middle age.’ In addition, a consistent feature of available studies is that the association of deprivation with alcohol-related deaths appears to be greater amongst men than women.xli Figure 4 above demonstrates both of these points, showing how alcohol attributable hospital admissions increase with deprivation, and that alcohol has a greater impact on male health than female health.
Patterns of alcohol-related mortality have also been found to be associated with age, even within certain socioeconomic groups. For example, one study found alcohol-related mortality rates to be higher for British men in manual occupations than in non-manual occupations.xlii However, the strength of the relationship depends on age: ‘men aged 25-39 in the lowest class are 10-20 times more likely to die from alcohol-related causes than those in the professional class, whereas men aged between 55 and 64 in the unskilled manual class are about 2.5-4 times more likely to die.’ The authors propose that this could be because alcohol-related mortality for younger men is more likely to be due to death from acute causes, such as alcohol poisoning, and that this could have a particularly steep class gradient. For women in paid employment, no consistent class gradient was found; younger women in the manual classes are more likely to die from alcohol-related causes, but for older women it is those in the professional class who suffer elevated mortality.xliii
One study found a strong association between alcohol-related death rates and deprivation in England and Wales,xliv ‘with alcohol-related death rates more than five times higher in males and more than three times higher in females for those living in the most deprived areas compared to those in the least deprived areas.’ As already mentioned it has been found that there are greater costs associated with alcohol consumption in deprived areas of Scotland, with 40.41% of the total costs arising from the 20% most deprived areas.xlv
Similarly, a large scale ecological study covering England and Wales found ‘a clear association between alcohol-related mortality and socioeconomic deprivation, with progressively higher rates in more deprived areas’.xlvi However, as with other studies, the authors note that the strength of the association varied with age. This study also noted that people ‘living in urban areas experienced higher alcohol-related mortality relative to those living in rural areas, with differences remaining after adjustment for socioeconomic deprivation.’
3.2 The ‘alcohol harm paradox’
This evidence suggests that the relationship between alcohol and socio-economic inequalities is quite complex and affected by a number of other factors such as age, gender and neighbourhood, as well as socioeconomic group. Indeed the relationship seems far more complicated than for other drugs and lifestyle-behaviours. As figure 5 below shows, rates of smoking increase with levels of deprivation, and smoking related harms are known to mirror this. However, alcohol consumption does not increase with deprivation, as the relatively flat levels across all social groups in figure 5 demonstrate. Indeed, data from the Office of National Statistics suggests that those with the lowest weekly incomes have lower than average alcohol consumption. xlvii
Alcohol, Health Inequalities and the Harm Paradox 12
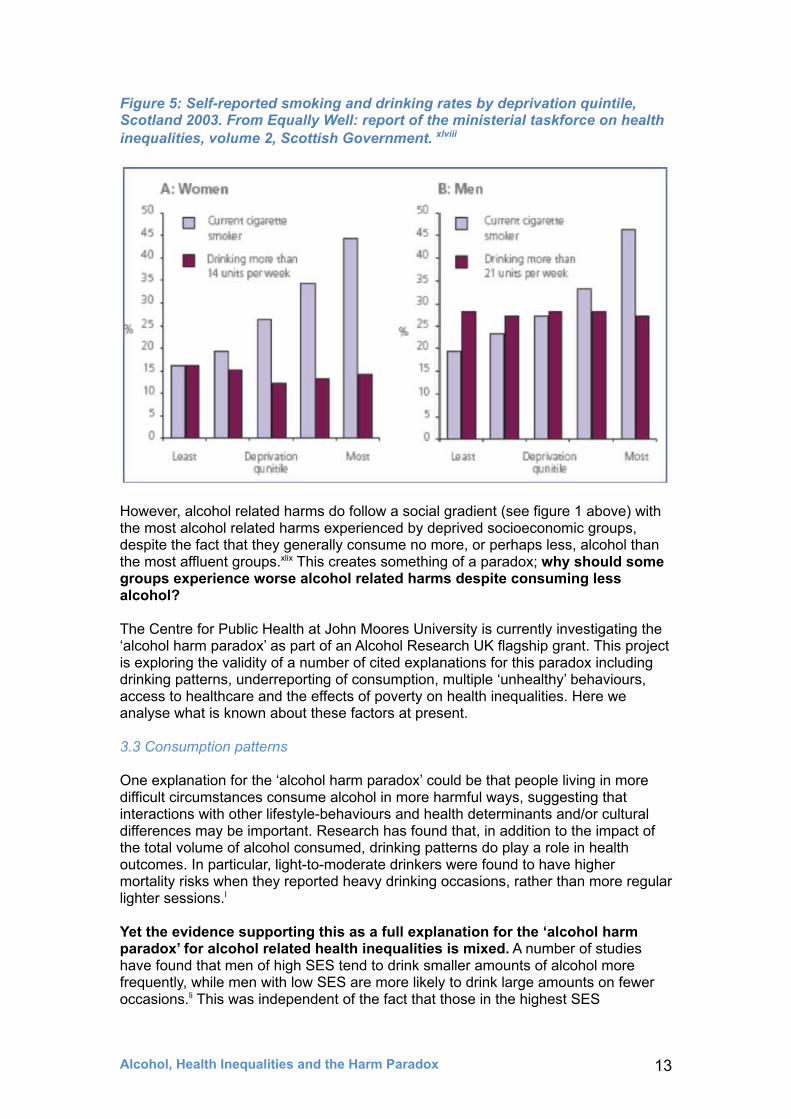
Figure 5: Self-reported smoking and drinking rates by deprivation quintile, Scotland 2003. From Equally Well: report of the ministerial taskforce on health inequalities, volume 2, Scottish Government. xlviii
However, alcohol related harms do follow a social gradient (see figure 1 above) with the most alcohol related harms experienced by deprived socioeconomic groups, despite the fact that they generally consume no more, or perhaps less, alcohol than the most affluent groups.xlix This creates something of a paradox; why should some groups experience worse alcohol related harms despite consuming less alcohol?
The Centre for Public Health at John Moores University is currently investigating the ‘alcohol harm paradox’ as part of an Alcohol Research UK flagship grant. This project is exploring the validity of a number of cited explanations for this paradox including drinking patterns, underreporting of consumption, multiple ‘unhealthy’ behaviours, access to healthcare and the effects of poverty on health inequalities. Here we analyse what is known about these factors at present.
3.3 Consumption patterns
One explanation for the ‘alcohol harm paradox’ could be that people living in more difficult circumstances consume alcohol in more harmful ways, suggesting that interactions with other lifestyle-behaviours and health determinants and/or cultural differences may be important. Research has found that, in addition to the impact of the total volume of alcohol consumed, drinking patterns do play a role in health outcomes. In particular, light-to-moderate drinkers were found to have higher mortality risks when they reported heavy drinking occasions, rather than more regular lighter sessions.l
Yet the evidence supporting this as a full explanation for the ‘alcohol harm paradox’ for alcohol related health inequalities is mixed. A number of studies have found that men of high SES tend to drink smaller amounts of alcohol more frequently, while men with low SES are more likely to drink large amounts on fewer occasions.li This was independent of the fact that those in the highest SES
Alcohol, Health Inequalities and the Harm Paradox 13
neighbourhoods were more likely to report overall excess consumption.lii For women, the differences in consumption patterns seem less clear, and some studies have found women of high SES more likely to consume heavily than those of middle or lower SES.liii However, it is worth mentioning that some research found that whilst there are fewer heavy drinkers amongst lower SES groups, this group does consume more than heavy drinkers in higher SES groups.liv
However, other research, using data from 25 countries,lv found that ‘lower educated men and women were more likely to report negative consequences than higher educated men and women even after controlling for drinking patterns’ (added emphasis). Other research in Finland has also found that socioeconomic differences in alcohol related mortality could not be fully explained by differences in consumption patterns lvi and recent research in Australia found that:
Socioeconomically advantaged Australians engage in alcohol-related risky behaviour at higher rates than more disadvantaged Australians even with alcohol consumption controlled. The significant socioeconomic disparities in negative consequences linked to alcohol consumption cannot in this instance be explained via differences in behaviour while drinking.lvii
So, if consumption patterns play a role in alcohol related health inequalities it appears to be a minor one, and there are clearly other important factors involved.
3.4 Inaccurate consumption reporting
Given that both levels and patterns of alcohol consumption do not appear to fully explain the alcohol harm paradox, there are a number of other potential explanations that require further research.lviii These include the possibility that the consumption of alcohol is under-reported in more deprived groups (relative to less deprived groups), possibly because key groups are missed, such as people experiencing homelessness and those working in the military. Consumption on holiday and on special occasions is also often not included when people estimate their average weekly intake, but can add a significant amount to their total annual consumption.lix
This seems unlikely to explain the paradox though, since poorer groups tend not to be able to afford to go on holidays and have less to spend on special occasions.lx In addition there may be a methodological issue with how alcohol consumption data is recorded, potentially resulting in the consumption of some groups being systematically under-reported more than others.
3.5 Alcohol and other unhealthy behaviours
Some research has looked at alcohol consumption as part of a complex system of interactions with other ‘poly-behaviours’, such as diet and exercise, which account for the relatively greater harms that are experienced by more deprived groups. As already mentioned, research by the Kings Fund into how patterns of multiple lifestyle risks (smoking, excessive alcohol use, poor diet and low levels of physical activity) spread across socioeconomic groups, found that people with no qualifications were five times more likely to engage in all four unhealthy behaviours than those with higher education.lxi It was found that engaging in all four unhealthy behaviours resulted in a 14-year reduction in life expectancy compared with those who engaged with none of them.lxii
Other research has gone further and investigated how some of these unhealthy behaviours might interact with each other. For example, it has been found that the uptake of vitamins and proteins can be affected by alcohol, and that malnutrition and
Alcohol, Health Inequalities and the Harm Paradox 14
heavy alcohol use can result in immunosuppressant effects. In addition it is also known that low SES groups consume more foods high in salt, sugar and fat, as well as more processed food.lxiii Researchers looking at obesity and alcohol consumption have found a ‘supra-additive interaction’ between the two, particularly in relation to liver disease.lxiv
It is also known that a combination of smoking and drinking accelerates the risk of mouth and throat cancers, and that premature mortality is particularly high in smokers who drink more than 15 units a week.lxv It has been found that tobacco and alcohol related cancers in the UK are 2-3 times more common in areas of the most deprivation than the least.lxvi Evidence such as this could go some way to explaining health inequalities, although this evidence is insufficient for determining what might be most effective in intervening to try to change these behavioural patterns.
3.6 Access to healthcare
There is also evidence that those living in more deprived circumstances face greater barriers to accessing health and alcohol related services and interventions than those in less deprived circumstances. Barriers include factors such as costs, distance, transport and availability, and stigmatisation, with stigma a particular problem for those of low SES.lxvii In addition, those from a more deprived background with insecure employment may be less able to take time off work when they get ill, compounding the problem.lxviii Alternatively, those receiving additional help or benefits related to a long term health condition or disability may be discouraged from efforts to get better by the fact that they would then have to go without this additional help. In either scenario individuals may become trapped in a situation that puts them at risk of poor health.lxix
3.7 Materialist explanations
As noted earlier, one of the most well-supported explanations for overall health inequalities relates to the material (social, economic and environmental) circumstances in which people live and work.lxx These factors also seem likely to contribute to explaining alcohol related inequalities and, potentially, the alcohol-harm paradox. For example, in reflecting on why lower educated groups are more likely to report negative consequences of alcohol than higher educated groups, even after controlling for drinking patterns (see above), some researchers suggest that ‘those of fewer resources are less protected from the experience of a problem or the impact of a stressful life event.’ lxxi
Alcohol, Health Inequalities and the Harm Paradox 15
4. Health inequalities and alcohol: the policy context in the UK
Labour won the 1997 General Election with a manifesto that included a commitment to reducing health inequalities. In 2001, the Government announced the first national targets for reducing health inequalities in England, which aimed to achieve a 10% reduction in inequalities relating to infant mortality and life expectancy at birth between the areas with the worst health and deprivation and the population as a whole by 2010. While some viewed this as an optimistic target, lxxii it was criticized by a number of health inequalities researchers for not being ambitious enough, as it only aimed to reduce inequalities between the most deprived areas and the population average, rather than between the most and least deprived areas.lxxiii However, the target was not achieved.
In 2010 a review by the National Audit Office (NAO) found that the number of policy pronouncements regarding health inequalities had been too numerous for the local NHS bodies (Primary Care Trusts - PCTs) with responsibility for meeting the health inequalities targets to keep up with. Moreover, PCTs and local authorities reported facing conflicting demands from central government, which had also set national targets for a range of other issues. It also stated that it was hard to see an obvious link between spending and improvements.lxxiv However, the King’s Fund described the overall Public Service Agreement (PSA) target as ‘arguably one of the very few, if any, in the last government that was outcomes focused and, since it was a broad outcome, left lots of local leeway for innovation and differences of approach.’ lxxv Reflecting some of the NAO’s comments it also argued that the main reason the PSA target was missed was that the Department of Health did not performance manage it adequately, not that it was overly ambitious, and argued that stronger performance management should be considered in order to reduce health inequalities.lxxvi
However, the Coalition Government has taken a very different approach, and by transferring responsibility for public health to Local Authorities, central government now has far less ability to performance manage public health issues, relying on incentives instead. In addition, targets for the most deprived ‘Spearhead’ Local Authorities to bring their life expectancy figures closer to the England average have been scrapped.lxxvii Instead the Government has stated an unquantifiable commitment to ‘improve the health of the poorest fastest’.lxxviii Commentators have complained that this has seen the issue left on the sidelines somewhat, especially as current economic and welfare policies seem likely to widen health inequalities. lxxix
Alcohol, Health Inequalities and the Harm Paradox 16
Summary Points
• Central targets for reducing health inequalities in England have been scrapped and responsibility for public health has been handed over to local authorities
• Alcohol can be seen as a contributing factor for almost 50% of the indicators within the Public Health Outcomes Framework for England, which does include a commitment to ‘reduce differences in life expectancy and healthy life expectancy between communities’
• It is likely that addressing alcohol-related health inequalities would have a significant impact on health inequalities in general
4.1 Alcohol policy and health inequalities across the UK
Alcohol has a wide and significant impact across a range of issues related to health inequalities, and it could be seen as central to attempts to lessen health inequalities in general. However, health bodies have argued that policy efforts to achieve this in the UK are lacking.
Whilst the Coalition Government has given the NHS a legal duty to reduce inequalities in access to care, critics have argued it now has less responsibility for tackling overall inequalities in health. lxxx The Public Health Outcomes Framework includes a commitment to ‘reduce differences in life expectancy and healthy life expectancy between communities’lxxxi but there are no specific targets or indicators attached to this commitment. The Public Health Outcomes Framework does include a set of trackable indicators across four domains:
• Improving the wider determinants of health• Health improvement• Health protection and • Public health and preventing premature mortality
Alcohol can be seen as a contributing factor across all of these, from the increasing awareness of foetal alcohol spectrum disorder, to alcohol’s association with crime, as a risk factor in cancer, liver and heart disease, and its impact on dementialxxxii and falls in the elderly.lxxxiii Alcohol even appears in the Health protection domain, where it plays a part in the spread of sexually transmitted infections, and where heavy alcohol use is a risk factor in the spread of TB, including the risk of re-infection.lxxxiv Figure 6 below shows the four domains with the alcohol related indicators highlighted.
The spread of alcohol related indicators across all four domains suggests that clear and effective efforts by the Government and Public Health England to reduce alcohol related health inequalities would make a significant impact on health inequalities across the board. However, critics have argued that the Government is not taking action on alcohol, having turned its back on a number of potentially effective policy initiatives, such as Minimum Unit Pricing (MUP) and a public health licencing objective (more below)
Alcohol, Health Inequalities and the Harm Paradox 17

Figure 6: Indicators with a relationship to alcohol across the four domains of the Public Health Outcomes Framework
Alcohol, Health Inequalities and the Harm Paradox 18
5. Interventions to address alcohol related inequalities
Alcohol causes a significant health and economic burden on communities least able to afford it. As a result, the role of alcohol needs to be considered in strategies aiming to reduce overall health inequalities.lxxxv While few alcohol-related interventions have been assessed from an inequalities perspective, there is evidence that a number of policies designed to reduce alcohol related harm overall would work to reduce alcohol related inequalities.
5.1 Alcohol Affordability and Minimum Unit Pricing
There is strong evidence that reducing the affordability of alcohol by raising prices leads to a reduction in alcohol consumption and associated harms, including reductions in mortality from liver cirrhosis, accidents, suicide, homicide, and heart diseaselxxxvi as well as a reduction in levels of violence and crime.lxxxvii One such price related policy is Minimum Unit Pricing (MUP), which sets a level below which retailers are not allowed to sell alcohol, depending on the number of units it contains. The evidence base for MUP has been supported by the World Health Organisationlxxxviii and the OECDlxxxix and it has been described by NICE as ‘the most effective way of reducing alcohol related harm’.xc Similar policies have also been effectively introduced in Canada. xci
Evidence suggests that MUP would not have a significant impact on moderate drinkers, but would significantly affect harmful drinkers. As well as purchasing more units overall, harmful drinkers tend to buy more cheap alcohol than moderate drinkers. Indeed research into the potential impact of MUP on patients with liver disease, found that patients with alcohol-related cirrhosis paid an average price of 33p per unit, compared with £1.10 per unit for low-risk drinkers.xcii This means that harmful drinkers - regardless of their socioeconomic group - would be most affected by an intervention that raises the lowest alcohol prices such as MUP, as figure 7 below illustrates.
Alcohol, Health Inequalities and the Harm Paradox 19
Summary Points
• 80% of the lives potentially saved by introducing minimum unit pricing would be from those with low SES, targeting those who experience the worst alcohol-related health inequalities
• Research has found a relationship between off licence density and crime, with deprived areas more likely to be affected. A public health licensing objective could be used to address this
• At present, too few alcohol-focused interventions have been evaluated in a way that enables an analysis of differential impacts by social class or area

Figure 7: Purchasing of alcohol below 45p per unit by income and type of drinker. Data supplied by the University of Sheffield Alcohol Research Group.
P u r c h a s i n g o f a l c o h o l b e l o w 4 5 p p e r u n i t
4 0 . 6 %
2 0 . 3 %
2 9 . 2 %
9 . 8 %
1 8 . 4 %
5 . 5 %
0
5
1 0
1 5
2 0
2 5
3 0
3 5
4 0
L o w H i g h L o w H i g h L o w H i g h
Wee
kly
un
its
pu
rch
ased
fo
r b
elo
w 4
5p % o f u n i t s b e l o w 4 5 p
H a r m f u l d r i n k e r s H a z a r d o u s d r i n k e r s M o d e r a t e d r i n k e r s
i n c o m e i n c o m e i n c o m e
Evidence is mixed on whether harmful drinkers are more or less responsive to price changes than moderate drinkers; however, they both purchase more cheap alcohol and purchase a greater proportion of their alcohol cheaply, suggesting MUP would impact on them to a greater degree than moderate drinkers, even when it is assumed they are less price responsive.xciii In this way, research indicates MUP would be likely to counter alcohol related health inequalities. For example, research by the University of Sheffield suggests that a 45p minimum unit price would lead to 860 fewer deaths and 29,900 fewer hospital admissions due to alcohol per year, and that routine or manual worker households, who account for around 41% of the population, would account for around 80% of these reductions. Figure 8 below outlines these findings.
Overall, this evidence suggests that MUP would target all those with the most harmful drinking patterns, but that it would have the greatest impact on those with low SES who are the group at greatest risk of harm from their drinking. As figure 8 above demonstrates, it would also have a minimal impact on moderate drinkers, irrespective of income or socioeconomic status, making it a particularly targeted intervention.
Alcohol, Health Inequalities and the Harm Paradox 20
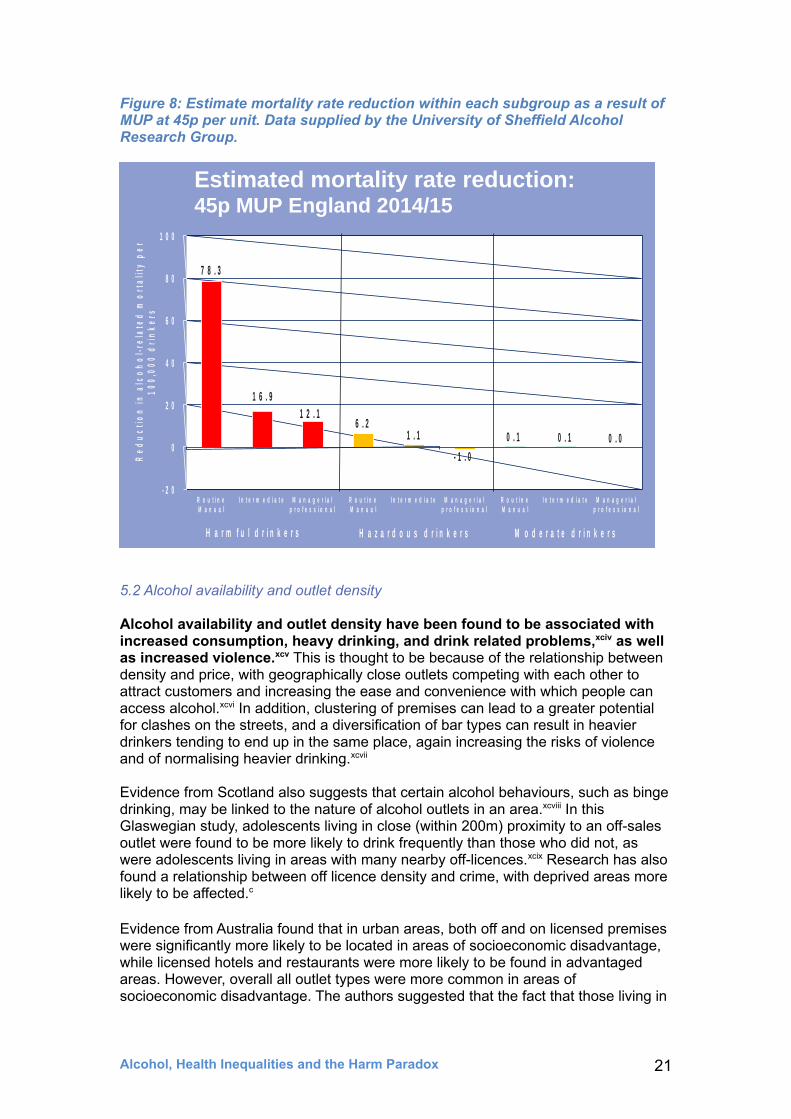
Figure 8: Estimate mortality rate reduction within each subgroup as a result of MUP at 45p per unit. Data supplied by the University of Sheffield Alcohol Research Group.
7 8 . 3
1 6 . 9 1 2 . 1
6 . 2 1 . 1
- 1 . 0
0 . 1 0 . 1 0 . 0
- 2 0
0
2 0
4 0
6 0
8 0
1 0 0
R o u t i n e M a n u a l
I n t e r m e d i a t e M a n a g e r i a l p r o f e s s i o n a l
R o u t i n e M a n u a l
I n t e r m e d i a t e M a n a g e r i a l p r o f e s s i o n a l
R o u t i n e M a n u a l
I n t e r m e d i a t e M a n a g e r i a l p r o f e s s i o n a l
Re
du
cti
on
in
alc
oh
ol-
rela
ted
mo
rta
lity
pe
r 1
00
,00
0 d
rin
ke
rs
H a r m f u l d r i n k e r s H a z a r d o u s d r i n k e r s M o d e r a t e d r i n k e r s
Estimated mortality rate reduction:45p MUP England 2014/15
5.2 Alcohol availability and outlet density
Alcohol availability and outlet density have been found to be associated with increased consumption, heavy drinking, and drink related problems,xciv as well as increased violence.xcv This is thought to be because of the relationship between density and price, with geographically close outlets competing with each other to attract customers and increasing the ease and convenience with which people can access alcohol.xcvi In addition, clustering of premises can lead to a greater potential for clashes on the streets, and a diversification of bar types can result in heavier drinkers tending to end up in the same place, again increasing the risks of violence and of normalising heavier drinking.xcvii
Evidence from Scotland also suggests that certain alcohol behaviours, such as binge drinking, may be linked to the nature of alcohol outlets in an area.xcviii In this Glaswegian study, adolescents living in close (within 200m) proximity to an off-sales outlet were found to be more likely to drink frequently than those who did not, as were adolescents living in areas with many nearby off-licences.xcix Research has also found a relationship between off licence density and crime, with deprived areas more likely to be affected.c
Evidence from Australia found that in urban areas, both off and on licensed premises were significantly more likely to be located in areas of socioeconomic disadvantage, while licensed hotels and restaurants were more likely to be found in advantaged areas. However, overall all outlet types were more common in areas of socioeconomic disadvantage. The authors suggested that the fact that those living in
Alcohol, Health Inequalities and the Harm Paradox 21
disadvantaged areas are generally exposed to higher levels of alcohol availability may play a role in explaining general socioeconomic disparities in health outcomes.ci
Other Scottish research identified that neighbourhoods with greater concentrations of alcohol outlets had significantly higher alcohol-related death rates. Indeed alcohol-related death rates in neighbourhoods with the most alcohol outlets were more than double the rates in those with the fewest outlets.cii
Such evidence around alcohol availability and outlet density has potential consequences for health inequalities, ‘suggesting that the mismatch between supply and demand could result in alcohol-related harm being disproportionately higher in people living in deprived neighbourhoods in proximity to alcohol outlets.’ciii
These findings have clear implications for alcohol related health inequalities, with more deprived communities potentially experiencing more alcohol exposure due to greater outlet density, and facing greater violence and crime as a result, in addition to the increased health related harms mentioned above.
Addressing the density of premises is not an easy task. In England and Wales cumulative impact policies (CIPs) can be introduced in areas where the cumulative effect of licensed premises on the four licensing objectives is sufficient to suggest that the growth of similar premises in that area needs to be controlled. While it introduces an assumption that no further licenses will be granted unless the applicant can show that it will not add to the existing problems, it does not necessarily allow for the current density to be reduced, even if it is already a problem.civ
Alcohol, Health Inequalities and the Harm Paradox 22
Case Study: alcohol related health inequalities CIP in Liverpool
Liverpool City Council’s Public Health Team has taken an innovative approach to using alcohol related health inequalities data in building the case for a CIP in the Kensington and Fairfield Ward. This area has a specific street drinking problem, along with acute deprivation: 45.4% of children in the ward are classified as living in poverty, more than twice the national average (20.6%). The proposal for a CIP was made in order to limit off licenses and late night takeaways operating between the hours of 11pm – 5am, and in putting their evidence together the public heath team focused on two particular licensing objectives, the protection of children from harm and public safety, taking a ‘creative’ approach to the second of these which included health related data. They also worked collaboratively with the other responsible authorities involved.
A broad range of data was compiled, highlighting a range of indicators related to alcohol health inequalities, such as the fact that GP practices in the ward have extremely high rates of admissions for alcohol specific conditions. They also highlighted related inequalities, such as high crime rates and poor pupil attainment and absence rates (up to 23% in one school), and the fact that persistent truancy is a key indicator of substance abuse. They also mapped pubs, off licences, restaurants, cafés and hotels in the area, producing a striking visual image of the ward, and estimating that most people were within a 2 minute walk of licenced premises (see figure 9 below).

Alcohol, Health Inequalities and the Harm Paradox 23
Figure 9: Map of alcohol licensed premises and GP practices in Kensington area, Liverpool, supplied by Liverpool City Council Public Health Team

5.3 A Public Health Licencing Objective
While this example from Liverpool shows that health inequalities can be taken into account within the current licensing system, the fact that it is the first of its kind in the country suggests that it is not an easy thing to do, and it seems likely that significant change would be needed to spread this approach nationally. A number of groups, such as the Local Government Association (LGA),cv have been calling for the addition of a public health licensing objective so that Local Authorities can better implement their public health responsibilities. In conversation with the public health team at Liverpool City Council, they expressed the view that a public health objective would have a ‘massive impact’ on their ability to promote and protect public health.
It would allow Local Authorities much greater scope to take health inequalities into account, including factors such as density and the supply of alcohol in an area, and the prevalence of both on and off license premises. Taking a holistic, rather than a case by case, view of licensing applications would represent another upstream policy to address alcohol related harms (focusing on limiting availability), and local authorities could also have regard to the impact of these issues on health inequalities. A public health objective would also allow licencing boards to write more specific public health conditions into a license when it was granted, as well as allowing a holistic overview in addressing the accumulation of licences in a specific area.
Alcohol, Health Inequalities and the Harm Paradox 24
The CIP was implemented on 15th January 2014, and as a result there have been no new licenses issued in the area since. Since the introduction of the CIP no further Grant applications have been received in the CIP area (as of October 11th 2014), a number of licences have closed due to economic forces and a licensee found to have breached the terms of their license has had their license revoked, subject to appeal. This has resulted in a reduction in the number of licenced premises, and sent a very strong signal to other licensees in the area. In addition, the Public Health funded Alcohol and Tobacco Unit in Liverpool has engaged with licensees in the area, promoting good practice, and Liverpool City Council have asked licensees to stop selling single units of beer over 6.5% ABV. This agreement is currently on a voluntary basis but is being written into licencing conditions as and when licences come under review.
Early evaluation data shows a drop in alcohol related crime, both within the streets that sat within the CIP area and within the vicinity of off licences and takeaways. For example, in 2011/12 alcohol related crime accounted for 29% of all reported crime in the examined streets. However, in the 4 months immediately after the introduction of the CIP alcohol related crime accounted for just 7% of all reported crime in the same streets. When considering reported crime in the immediate vicinity of off licences and takeaways, the percentage of alcohol related crime fell from 56% in 2011/12 to just 4% during the 4 months after the launch of the CIP. While the effect on health specific statistics will take much longer to be seen, these initial figures suggest that focusing on alcohol related health inequalities, and taking a public health into account via licensing, can have a big impact.
Alcohol, Health Inequalities and the Harm Paradox 25
Case Study: Leeds City Council South Leeds Guidance
Leeds City Council have taken action via the licensing system to tackle an area they identified within their Joint Strategic Needs Assessment as having particular problems related to health inequalities - the postcodes LS10 and LS11. These are areas of deprivation, with a life expectancy in some parts 10 years lower than other areas in Leeds. Alcohol misuse, obesity and smoking were identified as contributory factors, and rates of all three, including alcohol related conditions, hospital admissions and alcohol related domestic violence, were found to be significantly above the city average.
Leeds City Council and NHS Leeds formed a multi-agency group in order to address the problems presenting in these areas, bringing together the police, licensing, planning, treatment services, domestic violence team and youth services.
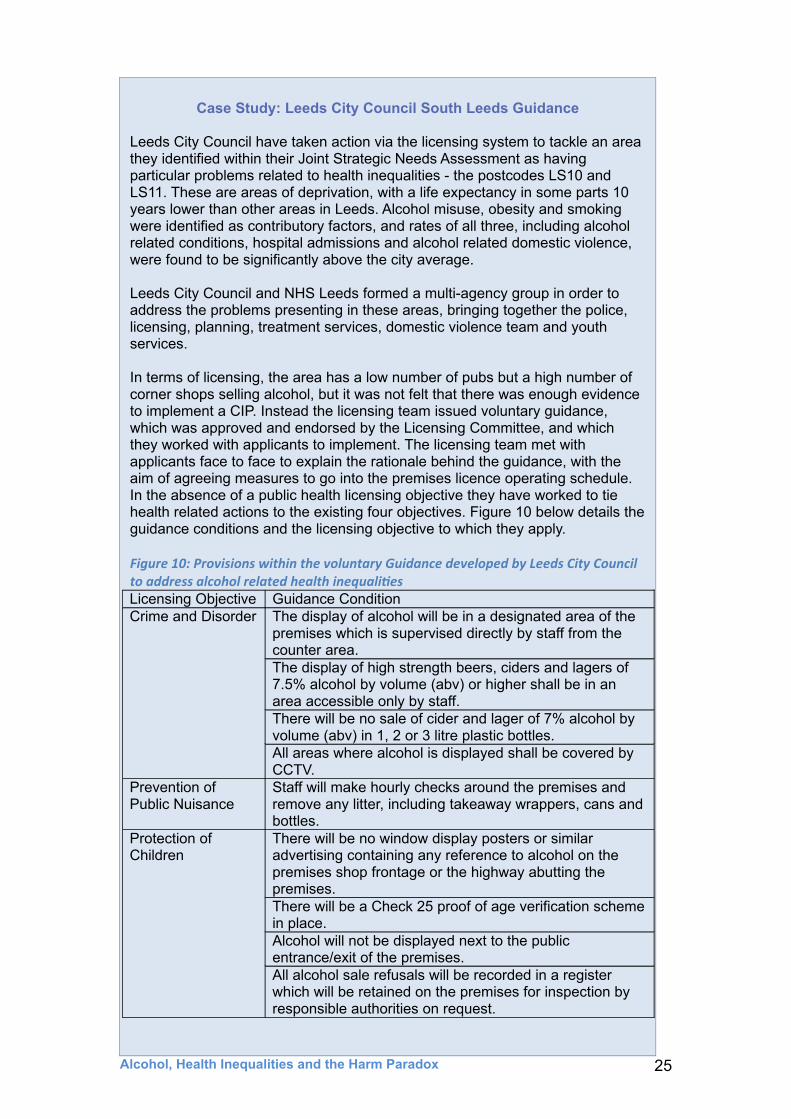
In terms of licensing, the area has a low number of pubs but a high number of corner shops selling alcohol, but it was not felt that there was enough evidence to implement a CIP. Instead the licensing team issued voluntary guidance, which was approved and endorsed by the Licensing Committee, and which they worked with applicants to implement. The licensing team met with applicants face to face to explain the rationale behind the guidance, with the aim of agreeing measures to go into the premises licence operating schedule. In the absence of a public health licensing objective they have worked to tie health related actions to the existing four objectives. Figure 10 below details the guidance conditions and the licensing objective to which they apply.
Figure 10: Provisions within the voluntary Guidance developed by Leeds City Council to address alcohol related health inequalitiesLicensing Objective Guidance ConditionCrime and Disorder The display of alcohol will be in a designated area of the
premises which is supervised directly by staff from the counter area.The display of high strength beers, ciders and lagers of 7.5% alcohol by volume (abv) or higher shall be in an area accessible only by staff.There will be no sale of cider and lager of 7% alcohol by volume (abv) in 1, 2 or 3 litre plastic bottles.All areas where alcohol is displayed shall be covered by CCTV.
Prevention of Public Nuisance
Staff will make hourly checks around the premises and remove any litter, including takeaway wrappers, cans and bottles.
Protection of Children
There will be no window display posters or similar advertising containing any reference to alcohol on the premises shop frontage or the highway abutting the premises.There will be a Check 25 proof of age verification scheme in place. Alcohol will not be displayed next to the public entrance/exit of the premises. All alcohol sale refusals will be recorded in a register which will be retained on the premises for inspection by responsible authorities on request.
At the time of writing, the Home Office and Public Health England are investigating mechanisms though which a public health licensing objective could be effectively implemented with the help of 20 Local Alcohol Action Areas.cvi It is however, unclear as to quite how such an objective would be implemented in practice, and findings from Scotland, which has had public heath as a 5th licencing objective since 2005, point towards both practical and cultural problems, despite some success.cvii In the interim, Public Health England, in conjunction with the LGA, have recently produced guidance on how public health teams in England and Wales can effectively participate in licensing decisions given the current four licensing objectives, which do not include public health.cviii
However, while there are practical issues in need of attention, a public health licencing objective would seem to offer opportunities for alcohol related health inequalities to be addressed in some way. Alternatively, a more creative and expansive application of CIPs in areas with particular alcohol related problems may offer a step half way towards a public health objective.
5.4 General welfare expenditure
In addition to measures on alcohol price and availability, it is important to note that general welfare spending has been found to impact positively on alcohol-attributable mortality. Several studies have shown that a rise in social welfare spending is associated with a decrease in alcohol-attributable mortality, whereas rising healthcare spending is notcix. As stated by the King’s Fund:
The impacts of the government’s social welfare reforms, the recession and long-term unemployment have the potential to outweigh any efforts the NHS and local authorities may make to reduce inequalities. If the government is serious about narrowing health inequalities, it cannot rely on the NHS and public health sector alone. cx
Alcohol, Health Inequalities and the Harm Paradox 26
Leeds City Council has found the majority of licensees willing to work to these voluntary guidance measures with 9 out of 10 applicants agreeing additional measures. The tenth withdrew their application. Having piloted the initiative for one year, licensing is now introducing similar guidance in other areas. While this approach has been judged a success, it is still limited in scope compared to measures that could be implemented under a public health licensing objective.

6. Possible directions for future research
Alcohol can be seen as central to a range of health inequalities and its role needs to be considered in strategies aiming to reduce overall health inequalities.cxi As such, there are some important synergies between alcohol and health inequalities research and likely policy agendas.
Firstly, whilst there are clearly some policies that would have a positive impact on alcohol related health inequalities, there is a need for more research to examine how interventions intended to improve health can impact on different social groups or areas.cxii At present, too few alcohol-focused interventions appear to have been evaluated in a manner that enables an analysis of differential impacts by social class or area.
Secondly, the available evidence for effective means of reducing alcohol related harms and health inequalities points to the need for upstream policy measurescxiii addressing factors such as regulating the availability, marketing and price of alcohol. In contrast, the kinds of interventions and policies promoted by alcohol industry interests in the UK have tended to involve voluntary, educational approaches which research suggests are not only less effective overallcxiv but also likely to increase health inequalities.cxv
Thirdly, there is support in both alcohol and health inequalities research and advocacy communities for the need to develop a better understanding of the actors, ideas and institutions affecting the policies that impact on health, particularly in terms of the influence of business interests that profit from unhealthy behaviours. cxvi So far, public health researchers have focused far more on tobacco industry efforts to influence policy than they have on exploring the influence of alcoholcxvii or other commercial interests and there has been very little consideration of how these interests impact on health inequalities.cxviii Within the UK for example, the Government has relied on the industry-led Responsibility Deal for tackling alcohol-related problems, despite almost all public health and charity participants leaving the scheme in protest at the lack of effective action.cxix
Finally, determined action to address both alcohol and health inequalities requires public as well as political will. This demands that more attention in both fields is paid to public and media understandings of these health issues and to public preferences for different policy proposals. This may require stronger links between research and advocacy and between advocates and researchers focusing on alcohol and those focusing on inequality and poverty. The overlap between these different public health agendas therefore requires further consideration and debate.
Alcohol, Health Inequalities and the Harm Paradox 27
7. Conclusion
Despite real improvements in health and life expectancy across most social groups in the UK in recent decades, health inequalities remain entrenched, with little sign of improving in the near future. There is much evidence that alcohol plays a significant part in this, with low SES groups being disproportionally affected by alcohol related harms - despite appearing to have lower overall rates of consumption.
Whilst there are clear moral implications surrounding a situation where one group is likely to die many years earlier than another group living just a few miles away, health inequalities also have public policy and economic implications. There are, therefore, both moral and economic justifications for intervening to try to reduce health inequalities. As well as influencing how long someone is likely to live, health inequalities affect how long someone is likely to live without being affected by disability or a long-term illness. If something practical can be done to stop increasing numbers of people with low and moderate SES needing medical and social support in the last few years of their life, this is likely to be cost-effective as well as socially desirable.
While the debate around what can be done to tackle health inequalities remains ongoing, where clear evidence exists that alcohol related health inequalities can be addressed, this should be acted upon. This is the case with minimum unit pricing, where scenario modelling predicts that 80% of the lives saved would be those from low SES groups, and a public health licensing objective, which would allow local authorities to act to reduce the availability of alcohol in areas experiencing alcohol-related health problems, and to properly exercise their duties around public health.
For more information please contact: Jon Foster, Senior Research and Policy Officer, Institute of Alcohol Studies, Alliance House, 12 Caxton Street, London SW1H 0QS Email: [email protected] Tel: 0207 222 4001
A summary of this report, and a podcast interview with Professor SirMichael Marmot, can be found in the IAS Reports section of our website.
Alcohol, Health Inequalities and the Harm Paradox 28

i Whitehead, M. (2007). ‘A typology of actions to tackle social inequalities in health.’ Journal of Epidemiology and Community Health, 61, 473-78ii CSDH (2008). ‘Closing the gap in a generation: health equity through action on the social determinants of health. Final Report of the Commission on Social Determinants of Health.’ Geneva, World Health Organization. P 32iii Graham, H. (2004) ‘Socioeconomic inequalities in health in the UK: Evidence on pattern and determinants. A short report for the Disability Rights Commission’ Institute for Health Research, Lancaster Universityiv Marmot, M (2010). ‘Fair Society, Healthy Lives, The Marmot Review.’ UCL Institute of Health Equity. v Barker, D.J.P., (1992) ‘Fetal and Infant Origins of Adult Disease.’ British Medical Journal, London vi Bartley. M., (2004) ‘Health Inequality: An Introduction to Theories, Concepts and Methods.’ Cambridge: Polity Pressvii Probst. C., Roerecke. M., Behrendt., Rehm. J., (2014) ‘Socioeconomic differences in alcohol-attributable mortality compared with all-cause mortality: a systematic review and meta-analysis.’ Int. J. Epidemiology. Oxford University Press. P 2viii Ibidix Buck. D., Frosini. F., (August 2012) ‘ Clustering of unhealthy behaviours over time : Implications for policy and practice.’ Kings Fund. P 3x Bartley. M., (2004) ‘Health Inequality: An Introduction to Theories, Concepts and Methods.’ Cambridge: Polity Pressxi Anderson. P., and Baumberg. B., (June 2006) Alcohol in Europe, a public health perspective. A report for the European Commission, P 99xii Probst. C., Roerecke. M., Behrendt., Rehm. J., (2014) ‘Socioeconomic differences in alcohol-attributable mortality compared with all-cause mortality: a systematic review and meta-analysis.’ Int. J. Epidemiology. Oxford University Press. P 1xiii Department of Health (May 2012) Written evidence from the Department of Health for the Health Select Committee.xiv Bellis. M., Jones. L., Morleo. M., (March 2013) Understanding the alcohol harm paradox: Presentation andslides from the Alcohol Research UK conference 2013. Liverpool John Moores University Centre for Public Health.xv Marmot, M (2010). ‘Fair Society, Healthy Lives, The Marmot Review.’ UCL Institute of Health Equity. Executive summary, p 12xvi Johnston. M. C., Ludbrook. A., Jaffra. M., (2012) ‘Inequalities in the Distribution of the Costs of Alcohol Misuse in Scotland: A Cost of Illness Study,’ Alcohol and Alcoholismxvii Impinen. A., Mäkelä. P., Karjalainen. K., Haukka. J., Lintonen. T., Lillsunde. P., Rahkonen. O., Ostamo. A. (2011) ‘The Association between Social Determinants and Drunken Driving: A 15-Year Register-based Study of 81,125 Suspects.’ Alcohol and Alcoholism.xviii American Psychological Association. ‘Violence and Socioeconomic status factsheet.’ Accessed on 1/10/2014xix Marmot, M (2010). ‘Fair Society, Healthy Lives, The Marmot Review.’ UCL Institute of Health Equity.xx Lorenc. T., Petticrew. M., Welch. V., Tugwell. P., (2012) What types of interventions generate inequalities? Evidence from systematic reviews J Epidemiol Community Healthxxi Probst. C., Roerecke. M., Behrendt., Rehm. J., (2014) ‘Socioeconomic differences in alcohol-attributable mortality compared with all-cause mortality: a systematic review and meta-analysis.’ Int. J. Epidemiology. Oxford University Press. P 10xxii Public Health Informaiton for Scotland (October 2013) Making a bad situation worse? The impact of welfare reform and the economic recession on health and health inequalities in Scotland.xxiii Holmes. J., Meng. Y., Meier. PS., et al. (2014) ‘Effects of minimum unit pricing for alcohol on different income and socioeconomic groups: a modelling study.’ Lancetxxiv Brennan. A., Meng. Y., Holmes. J., Hill-McManus. D., Meier. PS., (2014) ‘Potential benefits of minimum unit pricing for alcohol versus a ban on below cost selling in England 2014: modelling study.’ BMJxxv Probst. C., Roerecke. M., Behrendt., Rehm. J., (2014) ‘Socioeconomic differences in alcohol-attributable mortality compared with all-cause mortality: a systematic review and meta-analysis.’ Int. J. Epidemiology. Oxford University Press. P 10xxvi Anderson. P., and Baumberg. B., (June 2006) Alcohol in Europe, a public health perspective. A report for the European Commission, P 221xxvii Public Health England (2014 update) Local Alcohol Profiles for England
xxviii Institute of Alcohol Studies (May 2014) A lc ohol-related deaths in England continue to fall, but concerns persist about regional inequalities Accessed on 6/10/14xxix Marmot, M (2010). ‘Fair Society, Healthy Lives, The Marmot Review.’ UCL Institute of Health Equity.xxx Office of National Statistics (May 2013) Statistical Bulletin: Trends in All-cause Mortality by NS-SEC for English Regions and Wales, 2001–03 to 2008–10 Accessed on 6/10/14xxxi House of Commons Health Committee (Match 2009) Health Inequalities: Third Report of Session 2008–09 Accessed on 29/09/14 xxxii Buck. D., Frosini. F., (August 2012) ‘Clustering of unhealthy behaviours over time : Implications for policy and practice.’ Kings Fund. P 3xxxiii Ibidxxxiv Ibidxxxv Lorenc. T., Petticrew. M., Welch. V., Tugwell. P., (2012) What types of interventions generate inequalities? Evidence from systematic reviews J Epidemiol Community Health xxxvi Zatoński, W., Mańczuk, M., Sulkowska, U. and the HEM project team (eds) (2011) Closing the health gap in European Union.xxxvii Probst. C., Roerecke. M., Behrendt., Rehm. J., (2014) ‘Socioeconomic differences in alcohol-attributable mortality compared with all-cause mortality: a systematic review and meta-analysis.’ Int. J. Epidemiology. Oxford University Press. P 1xxxviii Department of Health (May 2012) Written evidence from the Deparment of Health for the Health Select Committee.xxxix Marmot, M (2010). ‘Fair Society, Healthy Lives, The Marmot Review.’ UCL Institute of Health Equity. Executive summary, Table p 57xl Batty, D., Lewars. H., Emslie. C., Benzeval, M,. Hunt, K,. (2008) ‘Problem drinking and exceeding guidelines for 'sensible' alcohol consumption in Scottish men: associations with life course socioeconomic disadvantage in a population-based cohort study’xli Strong. M., Pearson. T., MacNab. T., Maheswaran. R., (2012) ‘Mapping gender variation in the spatial pattern of alcohol-related mortality: a Bayesian analysis using data from South Yorkshire, United Kingdom.’ Spatial and Spatio-temoral Epidemiology xlii Harrison, L,. Gardiner, E,. (1999) ‘Do the rich really die young? Alcohol-related mortality and social class in Great Britain,’ 1988-94. Addictionxliii Ibidxliv Breakwell, C,. et al. (2007) ‘Trends and geographical variations in alcohol-related deaths in the United Kingdom, 1991–2004.’ Health Statistics Quarterlyxlv Johnston. M. C., Ludbrook. A., Jaffra. M., (2012) ‘Inequalities in the Distribution of the Costs of Alcohol Misuse in Scotland: A Cost of Illness Study,’ Alcohol and Alcoholismxlvi Erskine, S,. Maheswaran, M,. Pearson, T,. Gleeson, D,. (2010) ‘Socioeconomic deprivation, urban-rural location and alcohol-related mortality in England and Wales’xlvii Health and Social Care Information Centre (2013) Statistics on Alcohol: England, 2001, Table 2.1xlviii Scottish Government (June 2008) Equally Well: report of the ministerial taskforce on health inequalities, volume 2. P 4xlix Marmot, M (2010). ‘Fair Society, Healthy Lives, The Marmot Review.’ UCL Institute of Health Equity. P 58 & P 144l Rehm. J., Greenfield. T., Rogers. D., (2001) Average Volume of Alcohol Consumption, Patterns of Drinking, and All-Cause Mortality: Results from the US National Alcohol Survey. American Journal of Epidemiology. li Probst. C., Roerecke. M., Behrendt., Rehm. J., (2014) ‘Socioeconomic differences in alcohol-attributable mortality compared with all-cause mortality: a systematic review and meta-analysis.’ Int. J. Epidemiology. Oxford University Press. P 8lii Probst. C., Roerecke. M., Behrendt., Rehm. J., (2014) ‘Socioeconomic differences in alcohol-attributable mortality compared with all-cause mortality: a systematic review and meta-analysis.’ Int. J. Epidemiology. Oxford University Press. P 8liii Ibidliv Holmes. J., Meng. Y., Meier. PS., et al. (2014) ‘Effects of minimum unit pricing for alcohol on different income and socioeconomic groups: a modelling study.’ Lancetlv Grittner. U., et al. (2012) ‘Social inequalities and gender differences in the experience of alcohol-related problems.’ Alcohol and alcoholism lvi Probst. C., Roerecke. M., Behrendt., Rehm. J., (2014) ‘Socioeconomic differences in alcohol-attributable mortality compared with all-cause mortality: a systematic review and meta-analysis.’ Int. J. Epidemiology.
Oxford University Press. P 8lvii Livingston. M., (2014), Socioeconomic differences in alcohol-related risk-taking behaviours. Drug and Alcohol Review.lviii Bellis. M., Jones. L., Morleo. M., (March 2013) Understanding the alcohol harm paradox: Presentation and slides from the Alcohol Research UK conference 2013. Liverpool John Moores University Centre for Public Health.lix Ibid lx Shildrick. T., MacDonald. R.. (2013), Poverty talk: how people experiencing poverty deny their poverty and why they blame ‘the poor’. The Sociological Reviewlxi Buck. D., Frosini. F., (August 2012) ‘Clustering of unhealthy behaviours over time : Implications for policy and practice.’ Kings Fund.lxii Ibid 3lxiii Probst. C., Roerecke. M., Behrendt., Rehm. J., (2014) ‘Socioeconomic differences in alcohol-attributable mortality compared with all-cause mortality: a systematic review and meta-analysis.’ Int. J. Epidemiology. Oxford University Press. P 9lxiv Hart. C., Morrison. D., Batty. G., Mitchell. R., Smith. G., (March 2010) Effect of body mass index and alcohol consumption on liver disease: analysis of data from two prospective cohort studies. BMJlxv Hart. C., Smith. G., Gruer. L., Watt. G., (Dec 2010) The combined effect of smoking tobacco and drinking alcohol on cause-specific mortality: a 30 year cohort study. BMJlxvi Anderson. P., and Baumberg. B., (June 2006) Alcohol in Europe, a public health perspective. A report for the European Commission. P 222lxvii Probst. C., Roerecke. M., Behrendt., Rehm. J., (2014) ‘Socioeconomic differences in alcohol-attributable mortality compared with all-cause mortality: a systematic review and meta-analysis.’ Int. J. Epidemiology. Oxford University Press. P 9lxviii Bellis. M., Jones. L., Morleo. M., (March 2013) Understanding the alcohol harm paradox: Presentation and slides from the Alcohol Research UK conference 2013. Liverpool John Moores University Centre for Public Health.lxix Ibidlxx Marmot, M (2010). ‘Fair Society, Healthy Lives, The Marmot Review.’ UCL Institute of Health Equity.lxxi Grittner. U., et al. (2012) ‘Social inequalities and gender differences in the experience of alcohol-related problems.’ Alcohol and alcoholism lxxii The Kings Fund (2011) The King’s Fund’s response to Healthy Lives, Healthy People and associated consultations on the Public Health Outcomes Framework and Funding and Commissioning Routes. p16lxxiii Shaw. M., Smith G., (April 2005) Health inequalities and New Labour: how the promises compare with real progress. BMJlxxiv National Audit Office (March 2010) Healthy Balance, a review of public health performance and spending. Page 12/13lxxv The Kings Fund (2011) The King’s Fund’s response to Healthy Lives, Healthy People and associated consultations on the Public Health Outcomes Framework and Funding and Commissioning Routes. p 17lxxvi Ibidlxxvii Gregory. S., Dixon. A., Ham. C., (2012) Health policy under the coalition government: A mid-term assessment. P 44lxxviii HM Government (November 2010) Healthy Lives, Healthy People: Our stratgey for Public Health England. P 4lxxix Public Health Informaiton for Scotland (October 2013) Making a bad situation worse? The impact of welfare reform and the economic recession on health and health inequalities in Scotland. lxxx Gregory. S., Dixon. A., Ham. C., (2012) Health policy under the coalition government: A mid-term assessment. P 44lxxxi Department of Health (November 2013) Improving outcomes and supporting transparency: Part 1A: A public health outcomes framework for England, 2013-2016. p4lxxxii Ridley. N., Draper. B., Withall. A., (2013) Alcohol-related dementia: an update of the evidence. Alzheimer’s Research and Therapy lxxxiii Mukamal. KJ., Mittleman. MA., Longstreth. WT., Newmand. AB., Fried. LP., Soscovick. DS., (2004) Self-reported alcohol consumption and falls in older adults: cross-sectional and longitudinal analyses of the cardiovascular health study. Journal of the American Geriatric Society lxxxiv Rehm. J., Samokhvalov. A., Nwumand. M., Room. R., et al (2009) The Association between Alcohol Use, Alcohol Use Disorders and Tuberculosis (TB). A Systematic Review. BMC Public Health
lxxxv Marmot, M (2010). ‘Fair Society, Healthy Lives, The Marmot Review.’ UCL Institute of Health Equity.lxxxvi Norstrom, T. & Skog, O.J (2001) ‘Alcohol and Mortality,’ Addiction 96, Supplement Number 1lxxxvii Matthews. K., Shepherd. J., Sivarajasingham. V. (2006), Violence-related injury and the price of beer in England and Wales. Applied Economicslxxxviii Alcohol price controls suggested by World Health Organisation (16th November 1999) Guardian Newspaper. Accessed on 29/09/14lxxxix The prevention of harmful alcohol use (March 2011) OECDxc NICE (June 2010) Alcohol-use disorders: preventing the development of hazardous and harmful drinking, public health guidance 24xci Stockwell, T., Auld, M. C., Zhao, J. and Martin, G. (2012), Does minimum pricing reduce alcohol consumption? The experience of a Canadian province. Addictionxcii Sheron. N., Chilcott. F., Matthews. L., Challoner. B., Thomas. M., (2014) Impact of minimum price per unit of alcohol on patients with liver disease in the UK. Clinical Medicine 2014 Vol 14xciii Purshouse. R., et al. (2009) ‘Modelling to assess the effectiveness and cost-effectiveness of public health related strategies and intervention to reduce alcohol attributable harm in England using the Sheffield Alcohol Policy Model version 2.0’, Report to the NICE Public Health Programme Development Group. xciv Weitzman. E., Folkman. A., Folkman. K., Wechsler. H., (2003) The relationship of alcohol outlet density to heavy and frequent drinking and drinking-related problems among college students at eight universities. Health & Place xcv Norström. T., (2000) Outlet Denisty and Criminal Violence in Norway, 1960 – 1995. Journal of Studies on Alcohol and Drugsxcvi Alcohol Concern Wales (2012) Full to the brim? Outlet density and alcohol-related harm. xcvii Grubesic. T., Pridemore. W. (2011) Alcohol outlets and cluster of violence. International Journal of Health Geographics xcviii Young, R., Macdonald. L., Ellaway, A,. (2013) ‘Associations between proximity and density of local alcohol outlets and alcohol use among Scottish adolescents’ xcix Ibidc Rice. D., (September 2013) Alcohol Outlet Density, Deprivation, and Crime in Scotland. University of Edinburg. Accessed on 18.09.14ci Livingston. M., (2011) Alcohol outlet density and harm: Comparing the impacts on violence and chronic harms. Drug and Alcohol Reviewcii Richardson. E., Shortt. K., Pearce. J., Mitchell. R., (2014) Alcohol-related illness and death in Scottish neighborhoods: is there a relationship with the number of alcohol outlets? Report for Alcohol Focus Scotlandciii Fone. D., Dunstand. F., White. J., et al (June 2012) Change in alcohol outlet density and alcohol-related harm to population health (CHALICE). BMC Public Healthciv Southward Council. A guide to cumulative impact and saturation policies. Accessed on 01/10/14cv Local Government Association & Alcohol Research UK (January 2013) Public health and alcohol licensing in England: LGA and Alcohol Research UK briefing. cvi Home Office Guidance (2014) Local Alcohol Action Areascvii Alcohol Research UK (August 2014) Using licensing to protect public health: from evidence to practicecviii Public Health England & the LGA (2014) Public health and the Licensing Act 2003 - guidance note on effective participation by public health teamscix Probst. C., Roerecke. M., Behrendt., Rehm. J., (2014) ‘Socioeconomic differences in alcohol-attributable mortality compared with all-cause mortality: a systematic review and meta-analysis.’ Int. J. Epidemiology. Oxford University Press. P 10cx Gregory. S., Dixon. A., Ham. C., (2012) Health policy under the coalition government: A mid-term assessment. P48cxi Marmot, M (2010). ‘Fair Society, Healthy Lives, The Marmot Review.’ UCL Institute of Health Equity.cxii Katikireddi, S.V., Higgins, M., Smith, K.E. and Williams, G. (2013) Editorial: Health Inequalities – The Need to Move Beyond Bad Behaviours. Journal of Epidemiology and Community Health. cxiii Lorenc. T., Petticrew. M., Welch. V., Tugwell. P., (2012) What types of interventions generate inequalities? Evidence from systematic reviews J Epidemiol Community Health Zatoński, W., Mańczuk, M., Sulkowska, U. and the HEM project team (eds) (2011)cxiv Babor et al (2003) Alcohol: no ordinary commodity. Page 189. Oxford University Presscxv Lorenc. T., Petticrew. M., Welch. V., Tugwell. P., (2012) What types of interventions generate inequalities? Evidence from systematic reviews J Epidemiol Community Health

Zatoński, W., Mańczuk, M., Sulkowska, U. and the HEM project team (eds) (2011) Closing the health gap in European Union.cxvi Casswell, S. (2013) Vested interests in addiction research and policy. Why do we not see the corporate interests of the alcohol industry as clearly as we see those of the tobacco industry? Addiction, 108(4): 680-5.cxvii Ibidcxviii Katikireddi, S.V., Higgins, M., Smith, K.E. and Williams, G. (2013) Editorial: Health Inequalities – The Need to Move Beyond Bad Behaviours. Journal of Epidemiology and Community Health.cxix Lyness. S., McCambridge. J., (2014) The alcohol industry, charities and policy influence in the UK. The European Journal of Public Health