albanian res by dr lorenc gordani - slides
TRANSCRIPT


A l b a n i a n H y d r o C a p a c i t y a n d M a r k e t P e r s p e c t i v e s w i t h i n E U
P o l i c i e s o f 2 0 2 0 a n d 2 0 3 0
Adv. Lorenc Gordani, PhDDirector of Legal Office AREAProfessor at Polis University

Albanian Hydro Capacity and MarketPerspectives within EU Policies of 2020 and 2030
T h e m a i n b u l l e t p o i n t s c o v e r e d :
I. Regulation on the Promotion of Res in Albania
II. State of Implementation of Renewable Resources
III. Hydropower Deployment Scenarios in Albania
IV. Financial Effort Scenarios Run by Type of Technology
V. Revenues allocation form the hydro-energy sector in theState Budget
VI. Forecast on the Res-E Sector of Renewable Resource

State of Implementation of Renewable Resources (RES)
ktoe 2009 2010 2011 2012 2013 2014
Res-R&R 219.7 211.7 219.7 218.3 213.4 205.3
Res-E 408.0 413.6 337.6 406.3 598.2 390.5
Res-T - - - - 8.1 10.5
Res Total 627.6 625.3 557.3 624.6 819.7 606.3
GFEC 2,103.9 2,105.5 2,161.8 2,014.2 2,345.9 2,339.8
Res % 29.8% 29.7% 25.8% 31.0% 34.9% 25.9%
Source: INSTAT

AMB
Scenario 2015 2016 2017 2018 2019 2020 2025 2030
Hydro* 1 801 1 894 1 941 1 991 2 264 2 324 3 179 3 869
Pumped
storage 0 0 0 0 0 0 0 0
Geother
mal 0 0 0 0 0 0 0 0
Solar 2 5 10 16 24 32 120 220
Wind 0 0 4 10 20 30 160 310
Biomass 5 5 5 5 5 5 80 80
Hydropower Deployment Scenarios in Albania by AMB Scenario (MW)
Source: SLED
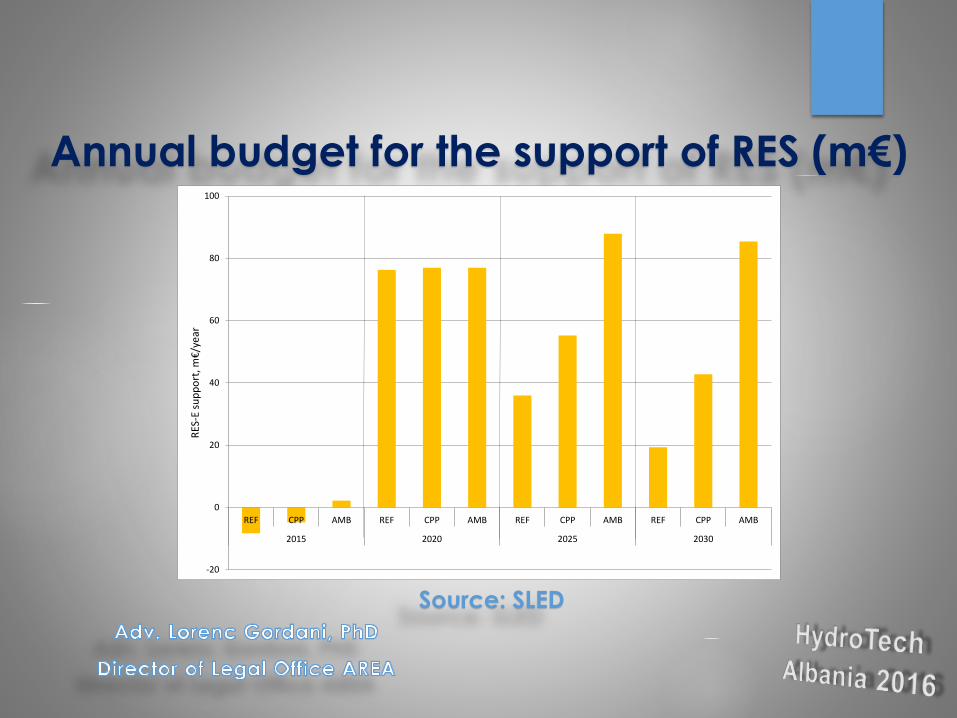
Annual budget for the support of RES (m€)
-20
0
20
40
60
80
100
REF CPP AMB REF CPP AMB REF CPP AMB REF CPP AMB
2015 2020 2025 2030
RES
-E s
up
po
rt, m
€/y
ear
Source: SLED

Average RES Support Fee to Each End-
User (€/MWh)
-2
0
2
4
6
8
10
12
REF CPP AMB REF CPP AMB REF CPP AMB REF CPP AMB
2015 2020 2025 2030
RES
-E s
up
po
rtfe
e, €
/MW
h
Source: SLED

Revenues allocation in the State Budget
Source: AlbEiti

NREAP Prevision for Each Sector of RES 2015 - 2020
Additional RES according
to technology 2015 - 2020
Quantity Generation Installation
ktoe GWh MW
RE
S-E
SHPP up 10 MW 200 2,326 744.3
Wind 20 233 97.7
PV 50 582 116.3
Total 1 270 3,140 958
% ne GFEC 29%
RE
S-
N&
FBiomass 52 800 279
Total 2 52
% GFEC 10%
RE
S-T
Biofuel (FAME) 85 -
Total 3 85
% ne GFEC 3%
RE
S Total 1+2+3 634
% GFEC 38%
Source: MEI

Thank you for Your Attention!
