akzonobel q4 and full-year 2014 results media presentation
TRANSCRIPT
255-255-255
185-201-208
068-105-125
085-190-207
000-146-187
000-139-197
000-081-146
134-134-136
000-000-000
183-185-186
000-139-197
000-081-146
134-134-136
183-185-186
185-201-208
255-255-255
Text Bk D1
Color 6
Color 5
Color 4
Color 3
Color 2
Color 1
Text Bk D2
Text Bk L1
Text Bk L2
Hyper
F. Hyper
Text D2
Text L2
Agenda main
Agenda main 2nd
Media Update Full-Year 2014 & Q4 results
Ton Büchner & Maëlys Castella
February 12, 2015
255-255-255
185-201-208
068-105-125
085-190-207
000-146-187
000-139-197
000-081-146
134-134-136
000-000-000
183-185-186
000-139-197
000-081-146
134-134-136
183-185-186
185-201-208
255-255-255
Text Bk D1
Color 6
Color 5
Color 4
Color 3
Color 2
Color 1
Text Bk D2
Text Bk L1
Text Bk L2
Hyper
F. Hyper
Text D2
Text L2
Agenda main
Agenda main 2nd
Agenda
Media Update Full-Year 2014 and Q4 results
1. 2014 highlights and operational review
2. Financial review
3. Key developments in 2014
4. Conclusion
5. Questions
2
255-255-255
185-201-208
068-105-125
085-190-207
000-146-187
000-139-197
000-081-146
134-134-136
000-000-000
183-185-186
000-139-197
000-081-146
134-134-136
183-185-186
185-201-208
255-255-255
Text Bk D1
Color 6
Color 5
Color 4
Color 3
Color 2
Color 1
Text Bk D2
Text Bk L1
Text Bk L2
Hyper
F. Hyper
Text D2
Text L2
Agenda main
Agenda main 2nd
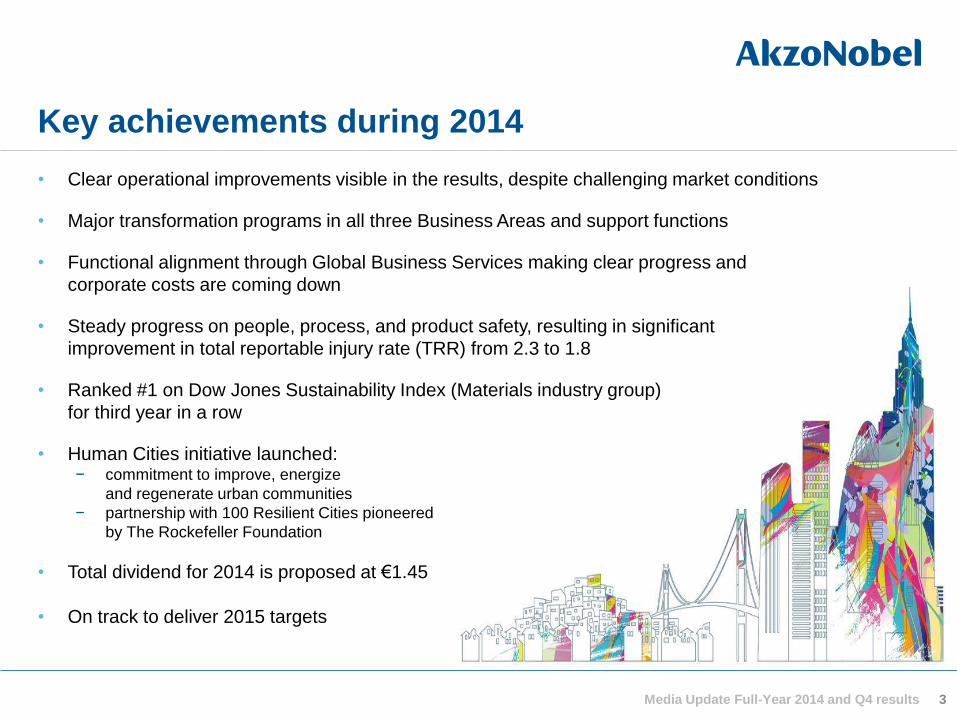
• Clear operational improvements visible in the results, despite challenging market conditions
• Major transformation programs in all three Business Areas and support functions
• Functional alignment through Global Business Services making clear progress and
corporate costs are coming down
• Steady progress on people, process, and product safety, resulting in significant
improvement in total reportable injury rate (TRR) from 2.3 to 1.8
• Ranked #1 on Dow Jones Sustainability Index (Materials industry group)
for third year in a row
• Human Cities initiative launched: − commitment to improve, energize
and regenerate urban communities
− partnership with 100 Resilient Cities pioneered
by The Rockefeller Foundation
• Total dividend for 2014 is proposed at €1.45
• On track to deliver 2015 targets
Key achievements during 2014
3 Media Update Full-Year 2014 and Q4 results
255-255-255
185-201-208
068-105-125
085-190-207
000-146-187
000-139-197
000-081-146
134-134-136
000-000-000
183-185-186
000-139-197
000-081-146
134-134-136
183-185-186
185-201-208
255-255-255
Text Bk D1
Color 6
Color 5
Color 4
Color 3
Color 2
Color 1
Text Bk D2
Text Bk L1
Text Bk L2
Hyper
F. Hyper
Text D2
Text L2
Agenda main
Agenda main 2nd
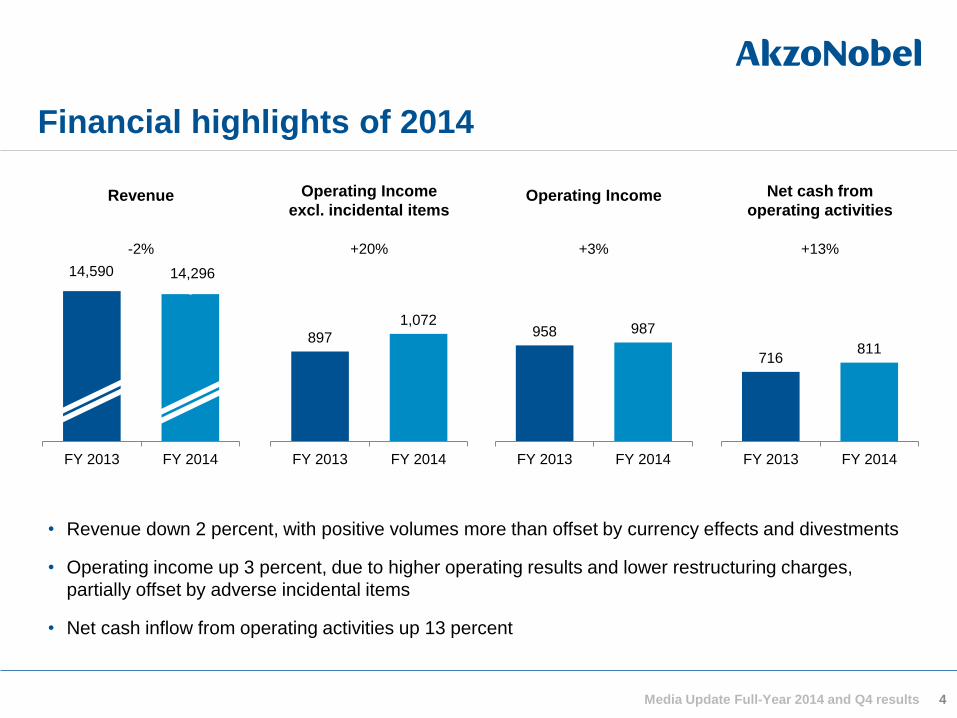
Financial highlights of 2014
4 Media Update Full-Year 2014 and Q4 results
14.296
FY 2013 FY 2014
958 987
FY 2013 FY 2014
716 811
FY 2013 FY 2014
Revenue
Operating Income
Net cash from
operating activities
• Revenue down 2 percent, with positive volumes more than offset by currency effects and divestments
• Operating income up 3 percent, due to higher operating results and lower restructuring charges,
partially offset by adverse incidental items
• Net cash inflow from operating activities up 13 percent
897
1,072
FY 2013 FY 2014
Operating Income
excl. incidental items
14,590 14,296
-2% +13% +20% +3%
255-255-255
185-201-208
068-105-125
085-190-207
000-146-187
000-139-197
000-081-146
134-134-136
000-000-000
183-185-186
000-139-197
000-081-146
134-134-136
183-185-186
185-201-208
255-255-255
Text Bk D1
Color 6
Color 5
Color 4
Color 3
Color 2
Color 1
Text Bk D2
Text Bk L1
Text Bk L2
Hyper
F. Hyper
Text D2
Text L2
Agenda main
Agenda main 2nd
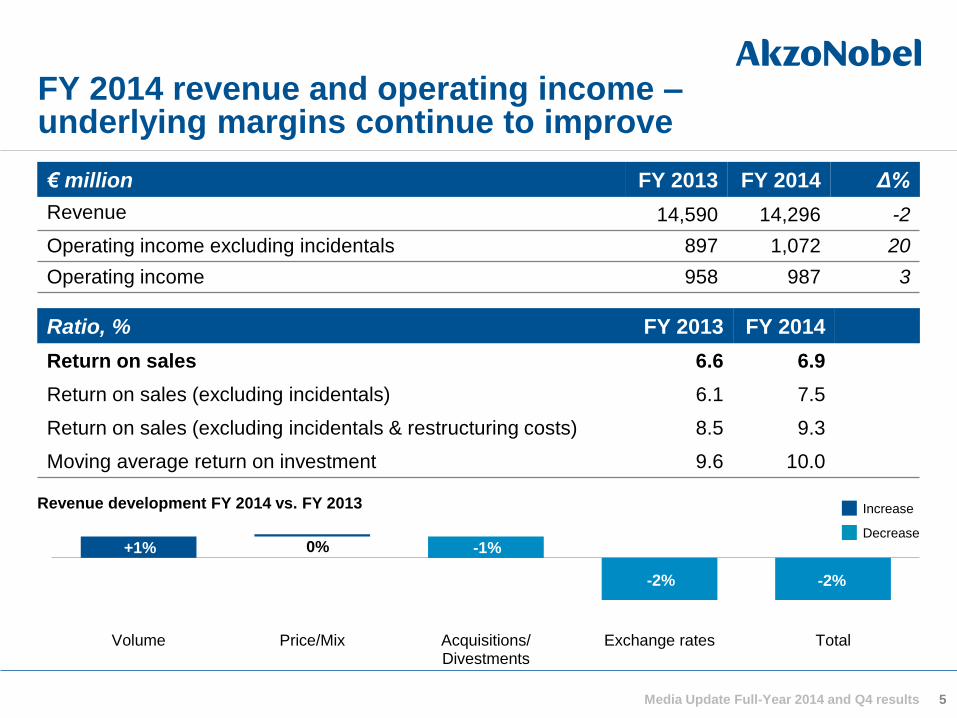
FY 2014 revenue and operating income – underlying margins continue to improve
€ million FY 2013 FY 2014 Δ%
Revenue 14,590 14,296 -2
Operating income excluding incidentals 897 1,072 20
Operating income 958 987 3
Ratio, % FY 2013 FY 2014
Return on sales 6.6 6.9
Return on sales (excluding incidentals) 6.1 7.5
Return on sales (excluding incidentals & restructuring costs) 8.5 9.3
Moving average return on investment 9.6 10.0
Increase
Decrease
-1% +1% 0%
-2%
Volume Price/Mix Acquisitions/Divestments
Exchange rates Total
-2%
Revenue development FY 2014 vs. FY 2013
5 Media Update Full-Year 2014 and Q4 results
255-255-255
185-201-208
068-105-125
085-190-207
000-146-187
000-139-197
000-081-146
134-134-136
000-000-000
183-185-186
000-139-197
000-081-146
134-134-136
183-185-186
185-201-208
255-255-255
Text Bk D1
Color 6
Color 5
Color 4
Color 3
Color 2
Color 1
Text Bk D2
Text Bk L1
Text Bk L2
Hyper
F. Hyper
Text D2
Text L2
Agenda main
Agenda main 2nd
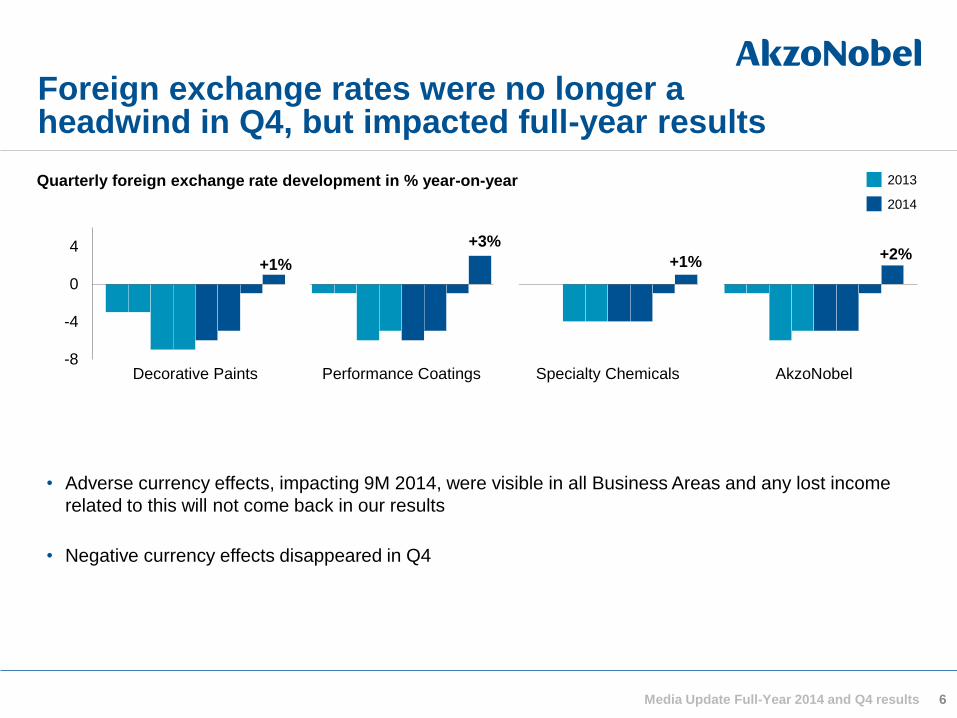
Foreign exchange rates were no longer a headwind in Q4, but impacted full-year results
-8
-4
0
4
Decorative Paints Performance Coatings Specialty Chemicals AkzoNobel
Quarterly foreign exchange rate development in % year-on-year
+1%
+3% +2%
+1%
2013
2014
6
• Adverse currency effects, impacting 9M 2014, were visible in all Business Areas and any lost income
related to this will not come back in our results
• Negative currency effects disappeared in Q4
Media Update Full-Year 2014 and Q4 results
255-255-255
185-201-208
068-105-125
085-190-207
000-146-187
000-139-197
000-081-146
134-134-136
000-000-000
183-185-186
000-139-197
000-081-146
134-134-136
183-185-186
185-201-208
255-255-255
Text Bk D1
Color 6
Color 5
Color 4
Color 3
Color 2
Color 1
Text Bk D2
Text Bk L1
Text Bk L2
Hyper
F. Hyper
Text D2
Text L2
Agenda main
Agenda main 2nd
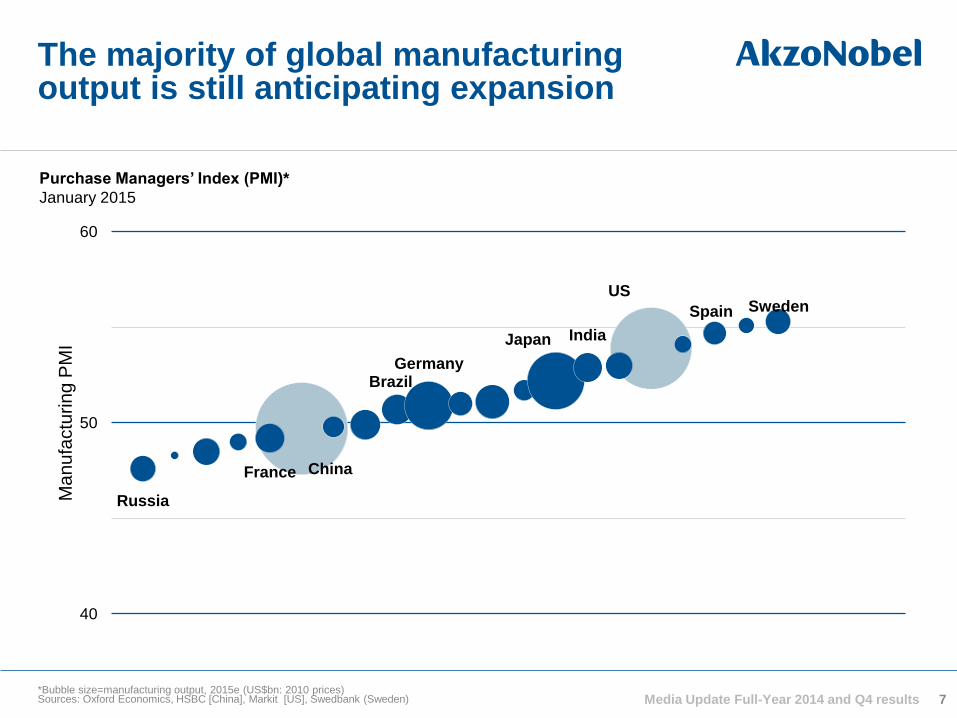
The majority of global manufacturing output is still anticipating expansion
7 *Bubble size=manufacturing output, 2015e (US$bn: 2010 prices) Sources: Oxford Economics, HSBC [China], Markit [US], Swedbank (Sweden)
Purchase Managers’ Index (PMI)*
January 2015
Media Update Full-Year 2014 and Q4 results
Russia
France China
Brazil Germany
Japan India
US
Spain Sweden
40
50
60
Ma
nu
factu
rin
g P
MI
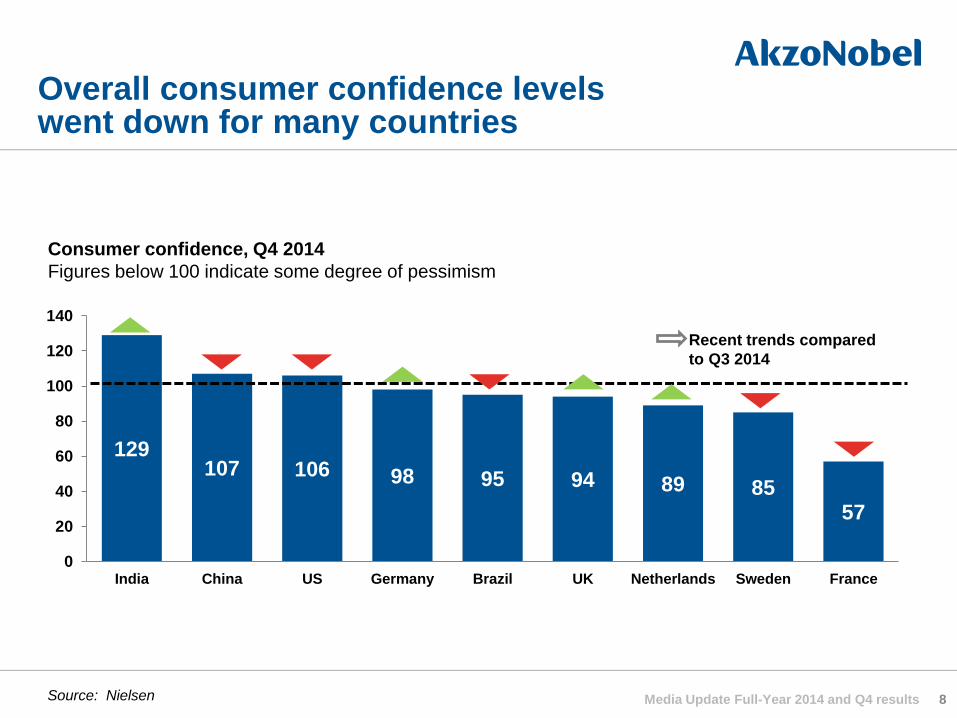
Overall consumer confidence levels went down for many countries
8 Source: Nielsen
129 107 106 98 95 94 89 85
57
0
20
40
60
80
100
120
140
India China US Germany Brazil UK Netherlands Sweden France
Consumer confidence, Q4 2014
Figures below 100 indicate some degree of pessimism
Recent trends compared
to Q3 2014
Media Update Full-Year 2014 and Q4 results
255-255-255
185-201-208
068-105-125
085-190-207
000-146-187
000-139-197
000-081-146
134-134-136
000-000-000
183-185-186
000-139-197
000-081-146
134-134-136
183-185-186
185-201-208
255-255-255
Text Bk D1
Color 6
Color 5
Color 4
Color 3
Color 2
Color 1
Text Bk D2
Text Bk L1
Text Bk L2
Hyper
F. Hyper
Text D2
Text L2
Agenda main
Agenda main 2nd
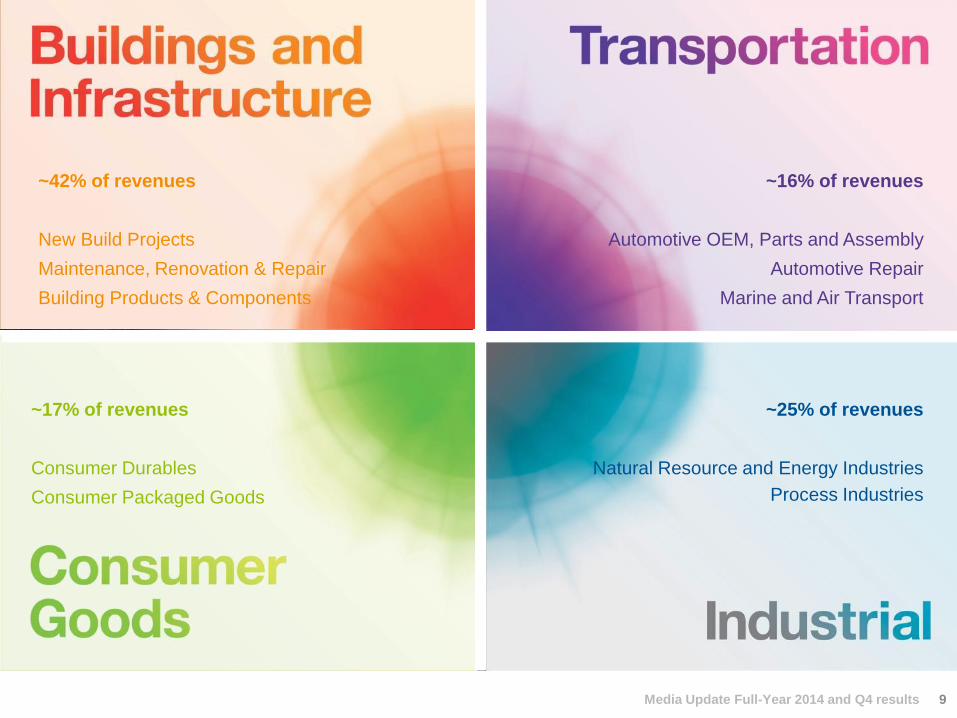
~42% of revenues
New Build Projects
Maintenance, Renovation & Repair
Building Products & Components
~16% of revenues
Automotive OEM, Parts and Assembly
Automotive Repair
Marine and Air Transport
~17% of revenues
Consumer Durables
Consumer Packaged Goods
~25% of revenues
Natural Resource and Energy Industries
Process Industries
9 Media Update Full-Year 2014 and Q4 results
255-255-255
185-201-208
068-105-125
085-190-207
000-146-187
000-139-197
000-081-146
134-134-136
000-000-000
183-185-186
000-139-197
000-081-146
134-134-136
183-185-186
185-201-208
255-255-255
Text Bk D1
Color 6
Color 5
Color 4
Color 3
Color 2
Color 1
Text Bk D2
Text Bk L1
Text Bk L2
Hyper
F. Hyper
Text D2
Text L2
Agenda main
Agenda main 2nd
10
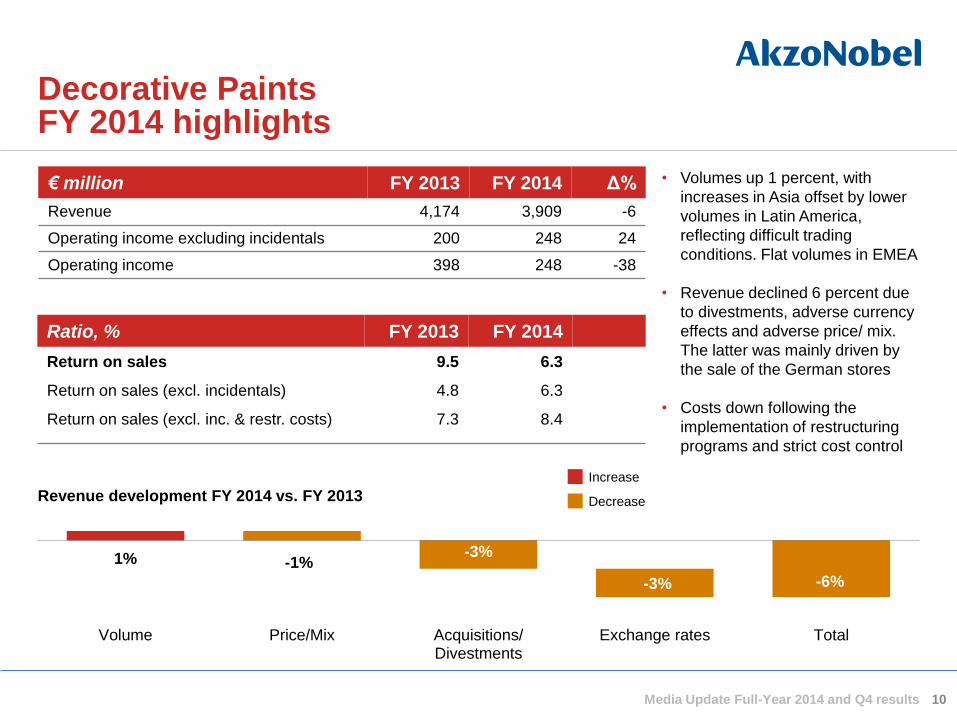
= • Volumes up 1 percent, with
increases in Asia offset by lower
volumes in Latin America,
reflecting difficult trading
conditions. Flat volumes in EMEA
• Revenue declined 6 percent due
to divestments, adverse currency
effects and adverse price/ mix.
The latter was mainly driven by
the sale of the German stores
• Costs down following the
implementation of restructuring
programs and strict cost control
Decorative Paints FY 2014 highlights
€ million FY 2013 FY 2014 Δ%
Revenue 4,174 3,909 -6
Operating income excluding incidentals 200 248 24
Operating income 398 248 -38
Ratio, % FY 2013 FY 2014
Return on sales 9.5 6.3
Return on sales (excl. incidentals) 4.8 6.3
Return on sales (excl. inc. & restr. costs) 7.3 8.4
Increase
Decrease Revenue development FY 2014 vs. FY 2013
1% -3%
-3% -6%
Volume Price/Mix Acquisitions/Divestments
Exchange rates Total
-1%
Media Update Full-Year 2014 and Q4 results
255-255-255
185-201-208
068-105-125
085-190-207
000-146-187
000-139-197
000-081-146
134-134-136
000-000-000
183-185-186
000-139-197
000-081-146
134-134-136
183-185-186
185-201-208
255-255-255
Text Bk D1
Color 6
Color 5
Color 4
Color 3
Color 2
Color 1
Text Bk D2
Text Bk L1
Text Bk L2
Hyper
F. Hyper
Text D2
Text L2
Agenda main
Agenda main 2nd
11
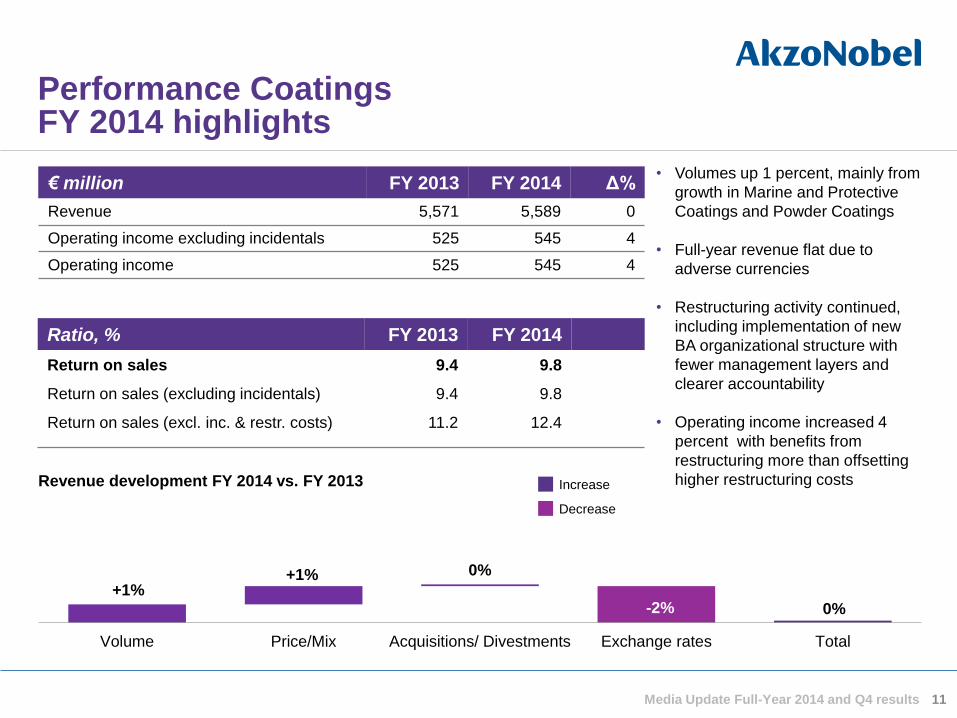
Performance Coatings FY 2014 highlights
Increase
Decrease
+1% +1% 0%
0%
Volume Price/Mix Acquisitions/ Divestments Exchange rates Total
Revenue development FY 2014 vs. FY 2013
• Volumes up 1 percent, mainly from
growth in Marine and Protective
Coatings and Powder Coatings
• Full-year revenue flat due to
adverse currencies
• Restructuring activity continued,
including implementation of new
BA organizational structure with
fewer management layers and
clearer accountability
• Operating income increased 4
percent with benefits from
restructuring more than offsetting
higher restructuring costs
-2%
€ million FY 2013 FY 2014 Δ%
Revenue 5,571 5,589 0
Operating income excluding incidentals 525 545 4
Operating income 525 545 4
Ratio, % FY 2013 FY 2014
Return on sales 9.4 9.8
Return on sales (excluding incidentals) 9.4 9.8
Return on sales (excl. inc. & restr. costs) 11.2 12.4
Media Update Full-Year 2014 and Q4 results
255-255-255
185-201-208
068-105-125
085-190-207
000-146-187
000-139-197
000-081-146
134-134-136
000-000-000
183-185-186
000-139-197
000-081-146
134-134-136
183-185-186
185-201-208
255-255-255
Text Bk D1
Color 6
Color 5
Color 4
Color 3
Color 2
Color 1
Text Bk D2
Text Bk L1
Text Bk L2
Hyper
F. Hyper
Text D2
Text L2
Agenda main
Agenda main 2nd
12
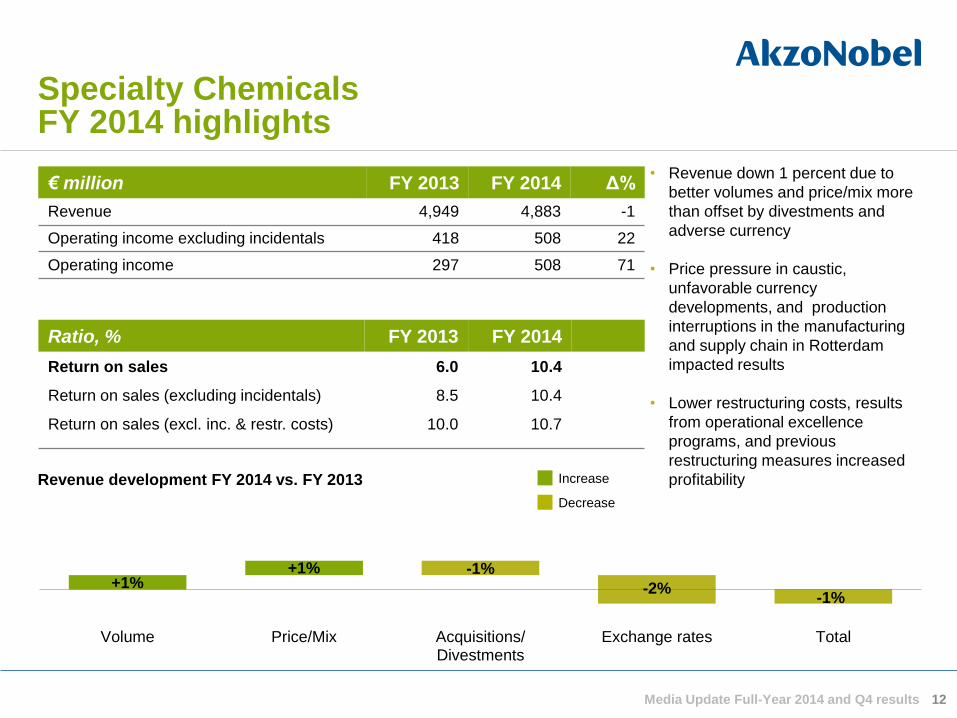
• Revenue down 1 percent due to
better volumes and price/mix more
than offset by divestments and
adverse currency
• Price pressure in caustic,
unfavorable currency
developments, and production
interruptions in the manufacturing
and supply chain in Rotterdam
impacted results
• Lower restructuring costs, results
from operational excellence
programs, and previous
restructuring measures increased
profitability
Specialty Chemicals FY 2014 highlights
Increase
Decrease
-1%
-2% -1%
+1% +1%
Volume Price/Mix Acquisitions/Divestments
Exchange rates Total
Revenue development FY 2014 vs. FY 2013
€ million FY 2013 FY 2014 Δ%
Revenue 4,949 4,883 -1
Operating income excluding incidentals 418 508 22
Operating income 297 508 71
Ratio, % FY 2013 FY 2014
Return on sales 6.0 10.4
Return on sales (excluding incidentals) 8.5 10.4
Return on sales (excl. inc. & restr. costs) 10.0 10.7
Media Update Full-Year 2014 and Q4 results
255-255-255
185-201-208
068-105-125
085-190-207
000-146-187
000-139-197
000-081-146
134-134-136
000-000-000
183-185-186
000-139-197
000-081-146
134-134-136
183-185-186
185-201-208
255-255-255
Text Bk D1
Color 6
Color 5
Color 4
Color 3
Color 2
Color 1
Text Bk D2
Text Bk L1
Text Bk L2
Hyper
F. Hyper
Text D2
Text L2
Agenda main
Agenda main 2nd
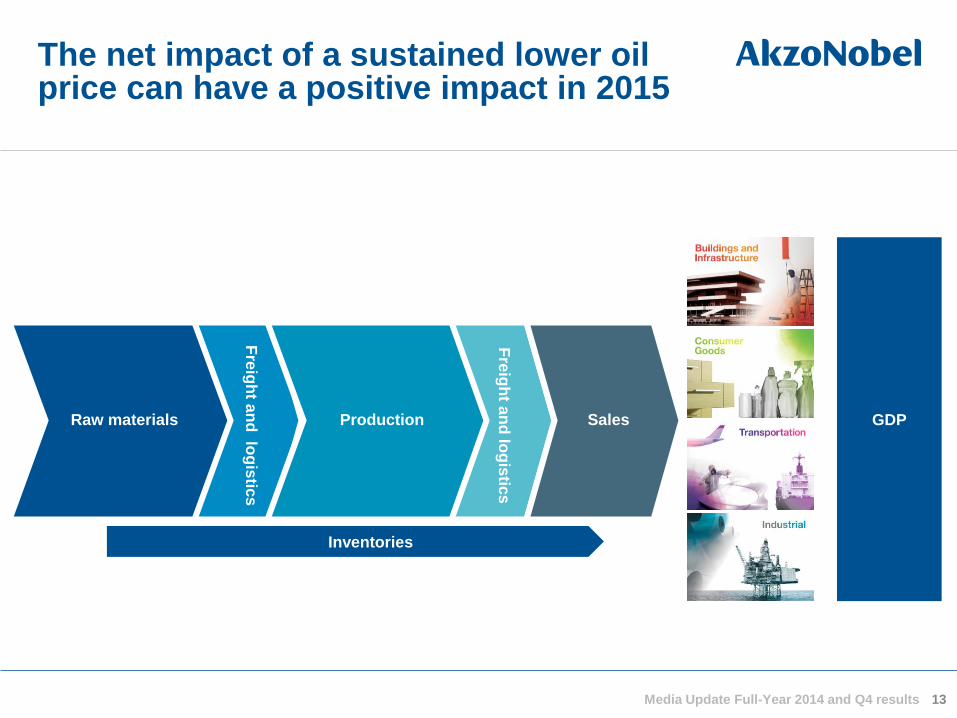
The net impact of a sustained lower oil price can have a positive impact in 2015
13
Inventories
GDP
Media Update Full-Year 2014 and Q4 results
Fre
igh
t an
d lo
gis
tics
F
reig
ht a
nd
log
istic
s
Sales Raw materials Production
255-255-255
185-201-208
068-105-125
085-190-207
000-146-187
000-139-197
000-081-146
134-134-136
000-000-000
183-185-186
000-139-197
000-081-146
134-134-136
183-185-186
185-201-208
255-255-255
Text Bk D1
Color 6
Color 5
Color 4
Color 3
Color 2
Color 1
Text Bk D2
Text Bk L1
Text Bk L2
Hyper
F. Hyper
Text D2
Text L2
Agenda main
Agenda main 2nd
Media Update Full-Year 2014 and Q4 results
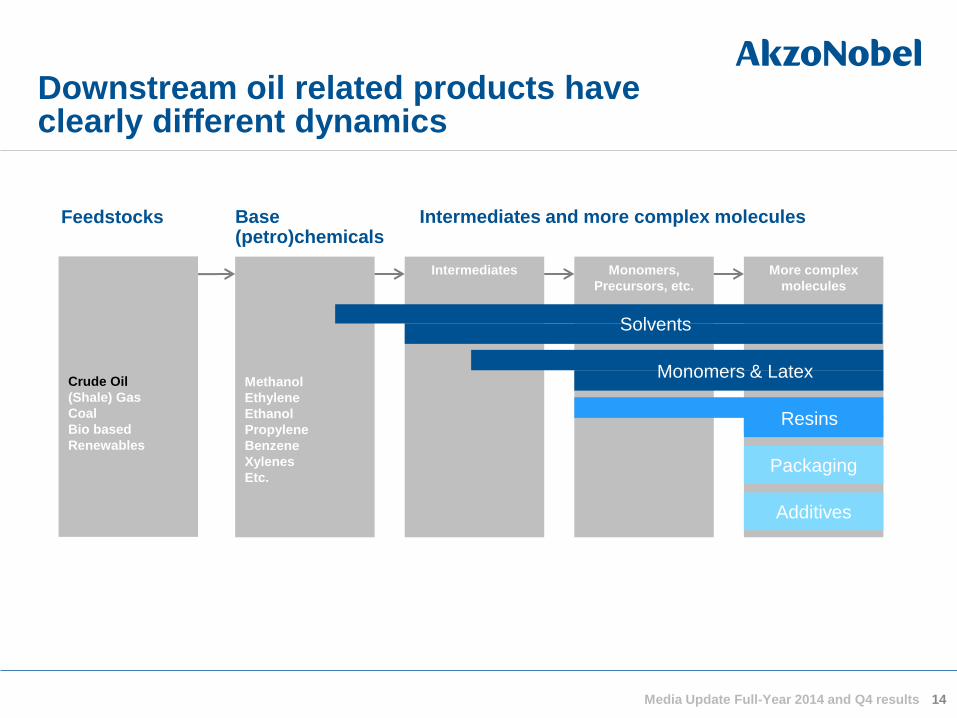
Monomers,
Precursors, etc.
Downstream oil related products have clearly different dynamics
14
Feedstocks Base (petro)chemicals
Intermediates and more complex molecules
Methanol
Ethylene
Ethanol
Propylene
Benzene
Xylenes
Etc.
Intermediates More complex
molecules
Monomers & Latex
Resins
Packaging
Additives
Solvents
Crude Oil
(Shale) Gas
Coal
Bio based
Renewables
255-255-255
185-201-208
068-105-125
085-190-207
000-146-187
000-139-197
000-081-146
134-134-136
000-000-000
183-185-186
000-139-197
000-081-146
134-134-136
183-185-186
185-201-208
255-255-255
Text Bk D1
Color 6
Color 5
Color 4
Color 3
Color 2
Color 1
Text Bk D2
Text Bk L1
Text Bk L2
Hyper
F. Hyper
Text D2
Text L2
Agenda main
Agenda main 2nd
255-255-255
185-201-208
068-105-125
085-190-207
000-146-187
000-139-197
000-081-146
134-134-136
000-000-000
183-185-186
000-139-197
000-081-146
134-134-136
183-185-186
185-201-208
255-255-255
Text Bk D1
Color 6
Color 5
Color 4
Color 3
Color 2
Color 1
Text Bk D2
Text Bk L1
Text Bk L2
Hyper
F. Hyper
Text D2
Text L2
Agenda main
Agenda main 2nd
Financial review Maëlys Castella
15 Media Update Full-Year 2014 and Q4 results
255-255-255
185-201-208
068-105-125
085-190-207
000-146-187
000-139-197
000-081-146
134-134-136
000-000-000
183-185-186
000-139-197
000-081-146
134-134-136
183-185-186
185-201-208
255-255-255
Text Bk D1
Color 6
Color 5
Color 4
Color 3
Color 2
Color 1
Text Bk D2
Text Bk L1
Text Bk L2
Hyper
F. Hyper
Text D2
Text L2
Agenda main
Agenda main 2nd
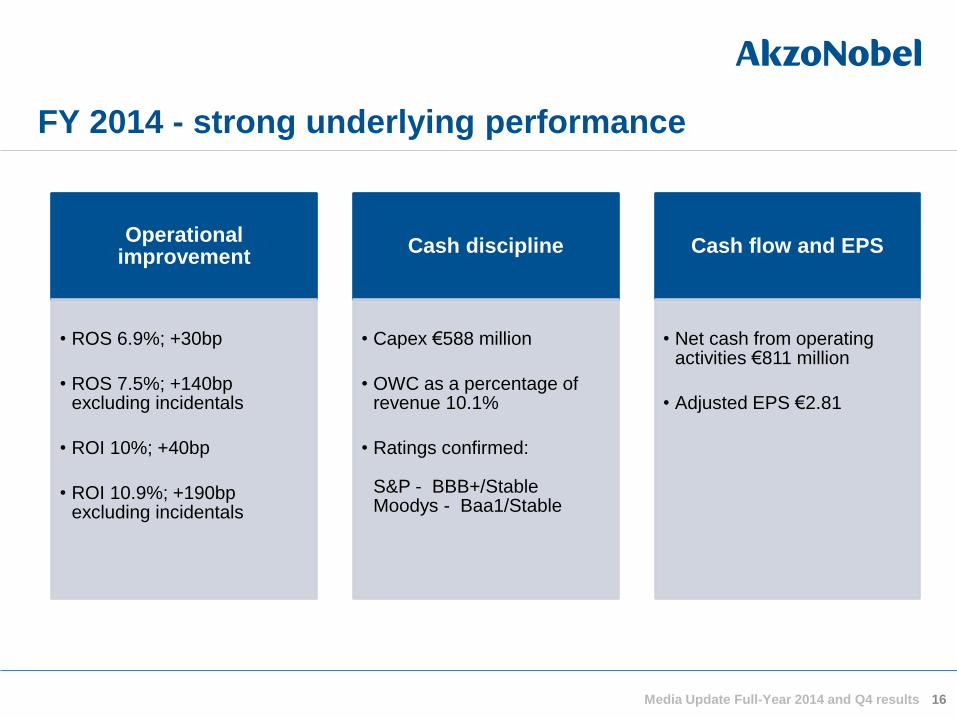
FY 2014 - strong underlying performance
16 Media Update Full-Year 2014 and Q4 results
Operational improvement
• ROS 6.9%; +30bp
• ROS 7.5%; +140bp excluding incidentals
• ROI 10%; +40bp
• ROI 10.9%; +190bp excluding incidentals
Cash discipline
• Capex €588 million
• OWC as a percentage of revenue 10.1%
• Ratings confirmed: S&P - BBB+/Stable Moodys - Baa1/Stable
Cash flow and EPS
• Net cash from operating activities €811 million
• Adjusted EPS €2.81
255-255-255
185-201-208
068-105-125
085-190-207
000-146-187
000-139-197
000-081-146
134-134-136
000-000-000
183-185-186
000-139-197
000-081-146
134-134-136
183-185-186
185-201-208
255-255-255
Text Bk D1
Color 6
Color 5
Color 4
Color 3
Color 2
Color 1
Text Bk D2
Text Bk L1
Text Bk L2
Hyper
F. Hyper
Text D2
Text L2
Agenda main
Agenda main 2nd
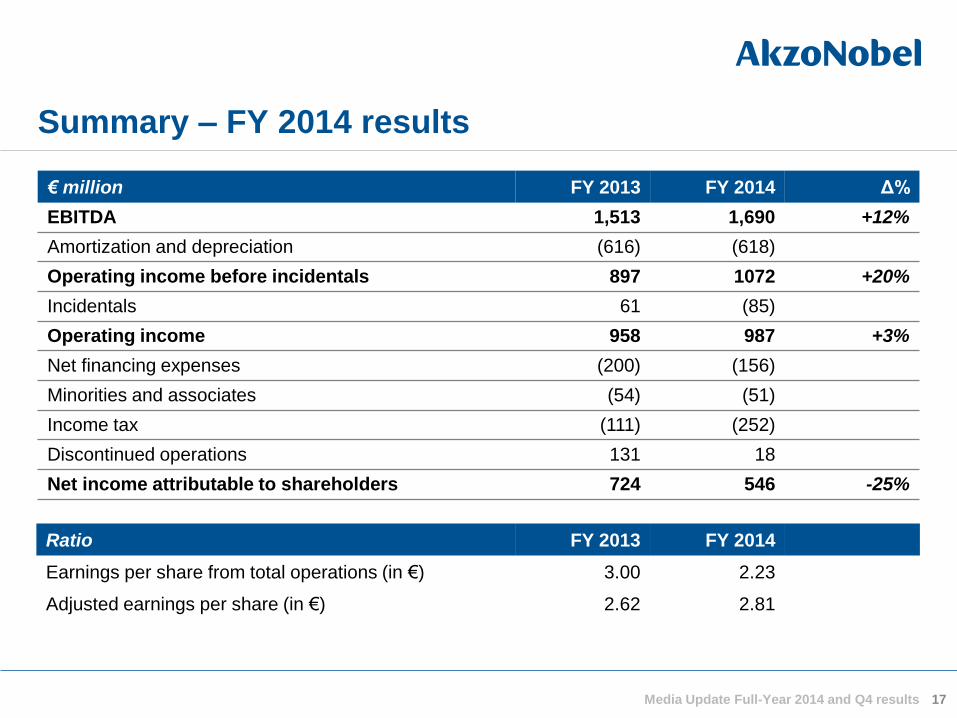
Summary – FY 2014 results
€ million FY 2013 FY 2014 Δ%
EBITDA 1,513 1,690 +12%
Amortization and depreciation (616) (618)
Operating income before incidentals 897 1072 +20%
Incidentals 61 (85)
Operating income 958 987 +3%
Net financing expenses (200) (156)
Minorities and associates (54) (51)
Income tax (111) (252)
Discontinued operations 131 18
Net income attributable to shareholders 724 546 -25%
Ratio FY 2013 FY 2014
Earnings per share from total operations (in €) 3.00 2.23
Adjusted earnings per share (in €) 2.62 2.81
17 Media Update Full-Year 2014 and Q4 results
255-255-255
185-201-208
068-105-125
085-190-207
000-146-187
000-139-197
000-081-146
134-134-136
000-000-000
183-185-186
000-139-197
000-081-146
134-134-136
183-185-186
185-201-208
255-255-255
Text Bk D1
Color 6
Color 5
Color 4
Color 3
Color 2
Color 1
Text Bk D2
Text Bk L1
Text Bk L2
Hyper
F. Hyper
Text D2
Text L2
Agenda main
Agenda main 2nd
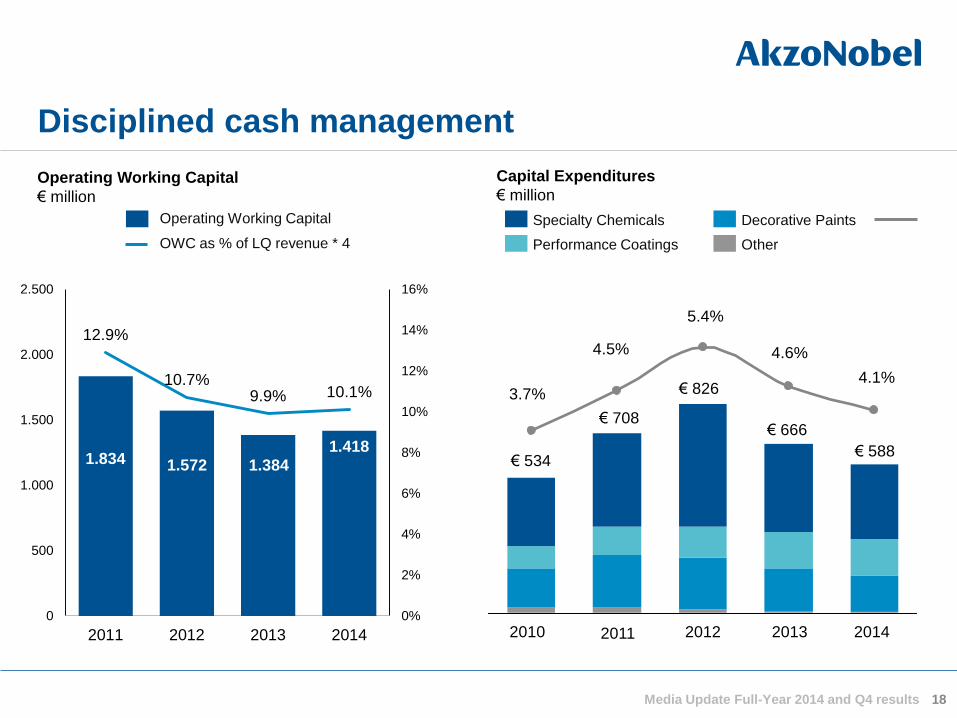
Disciplined cash management
18
1.834 1.572 1.384
1.418
12.9%
10.7% 9.9% 10.1%
0%
2%
4%
6%
8%
10%
12%
14%
16%
0
500
1.000
1.500
2.000
2.500
2011 2012 2013 2014
Operating Working Capital
€ million
€ 666
€ 826
4.6%
5.4%
€ 708
4.5%
3.7%
€ 534
2013 2012 2011 2010 2014
€ 588
4.1%
Capital Expenditures
€ million
Other
Decorative Paints
Performance Coatings
Specialty Chemicals
Media Update Full-Year 2014 and Q4 results
Operating Working Capital
OWC as % of LQ revenue * 4
255-255-255
185-201-208
068-105-125
085-190-207
000-146-187
000-139-197
000-081-146
134-134-136
000-000-000
183-185-186
000-139-197
000-081-146
134-134-136
183-185-186
185-201-208
255-255-255
Text Bk D1
Color 6
Color 5
Color 4
Color 3
Color 2
Color 1
Text Bk D2
Text Bk L1
Text Bk L2
Hyper
F. Hyper
Text D2
Text L2
Agenda main
Agenda main 2nd
19 Media Update Full-Year 2014 and Q4 results
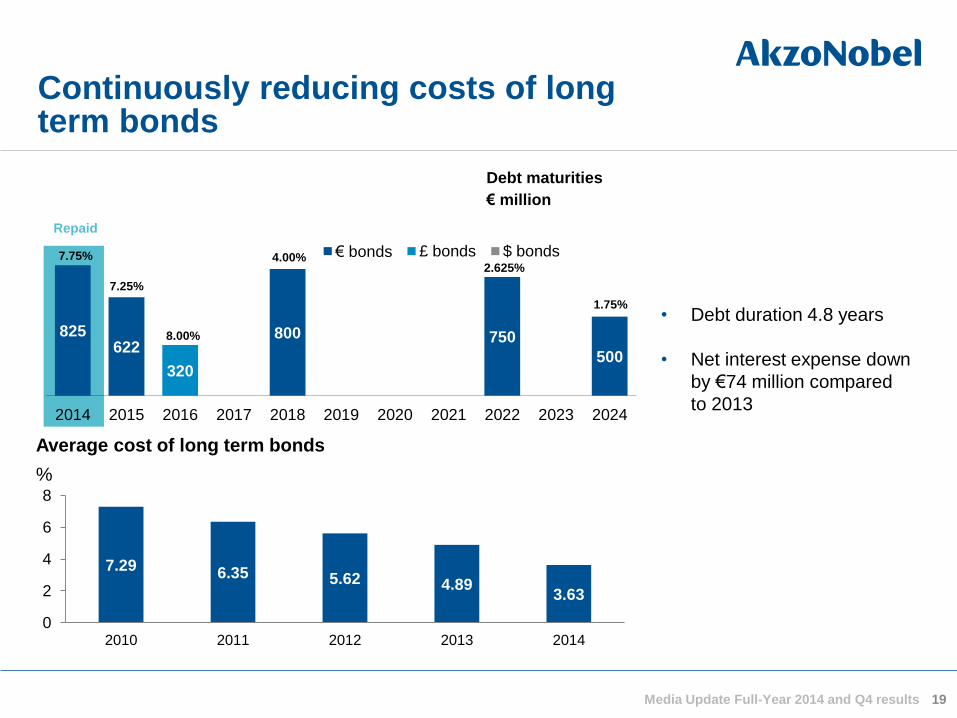
Debt maturities
€ million
Continuously reducing costs of long term bonds
Average cost of long term bonds
%
7.29 6.35 5.62 4.89 3.63
0
2
4
6
8
2010 2011 2012 2013 2014
825 622
800 750
500 320
2014 2015 2016 2017 2018 2019 2020 2021 2022 2023 2024
€ bonds £ bonds $ bonds
• Debt duration 4.8 years
• Net interest expense down
by €74 million compared
to 2013
Repaid
7.75%
7.25%
8.00%
4.00% 2.625%
1.75%
255-255-255
185-201-208
068-105-125
085-190-207
000-146-187
000-139-197
000-081-146
134-134-136
000-000-000
183-185-186
000-139-197
000-081-146
134-134-136
183-185-186
185-201-208
255-255-255
Text Bk D1
Color 6
Color 5
Color 4
Color 3
Color 2
Color 1
Text Bk D2
Text Bk L1
Text Bk L2
Hyper
F. Hyper
Text D2
Text L2
Agenda main
Agenda main 2nd
255-255-255
185-201-208
068-105-125
085-190-207
000-146-187
000-139-197
000-081-146
134-134-136
000-000-000
183-185-186
000-139-197
000-081-146
134-134-136
183-185-186
185-201-208
255-255-255
Text Bk D1
Color 6
Color 5
Color 4
Color 3
Color 2
Color 1
Text Bk D2
Text Bk L1
Text Bk L2
Hyper
F. Hyper
Text D2
Text L2
Agenda main
Agenda main 2nd
Key developments in 2014 Ton Büchner
20 Media Update Full-Year 2014 and Q4 results
255-255-255
185-201-208
068-105-125
085-190-207
000-146-187
000-139-197
000-081-146
134-134-136
000-000-000
183-185-186
000-139-197
000-081-146
134-134-136
183-185-186
185-201-208
255-255-255
Text Bk D1
Color 6
Color 5
Color 4
Color 3
Color 2
Color 1
Text Bk D2
Text Bk L1
Text Bk L2
Hyper
F. Hyper
Text D2
Text L2
Agenda main
Agenda main 2nd
21 Media Update Full-Year 2014 and Q4 results
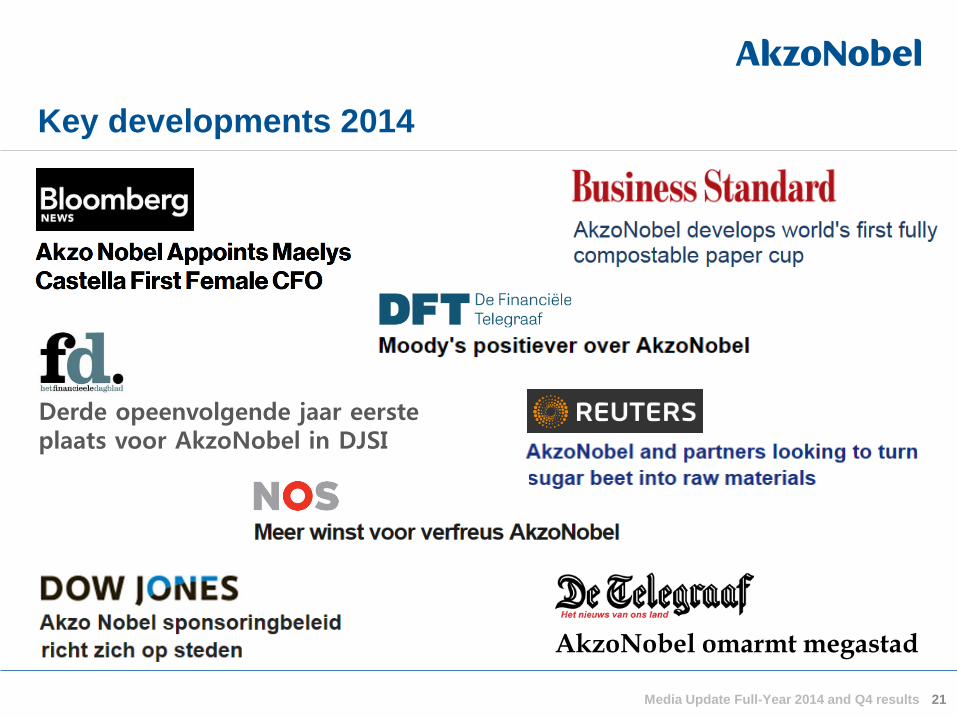
Key developments 2014
Derde opeenvolgende jaar eerste plaats voor AkzoNobel in DJSI
AkzoNobel omarmt megastad
255-255-255
185-201-208
068-105-125
085-190-207
000-146-187
000-139-197
000-081-146
134-134-136
000-000-000
183-185-186
000-139-197
000-081-146
134-134-136
183-185-186
185-201-208
255-255-255
Text Bk D1
Color 6
Color 5
Color 4
Color 3
Color 2
Color 1
Text Bk D2
Text Bk L1
Text Bk L2
Hyper
F. Hyper
Text D2
Text L2
Agenda main
Agenda main 2nd
Human Cities
22 Media Update Full-Year 2014 and Q4 results
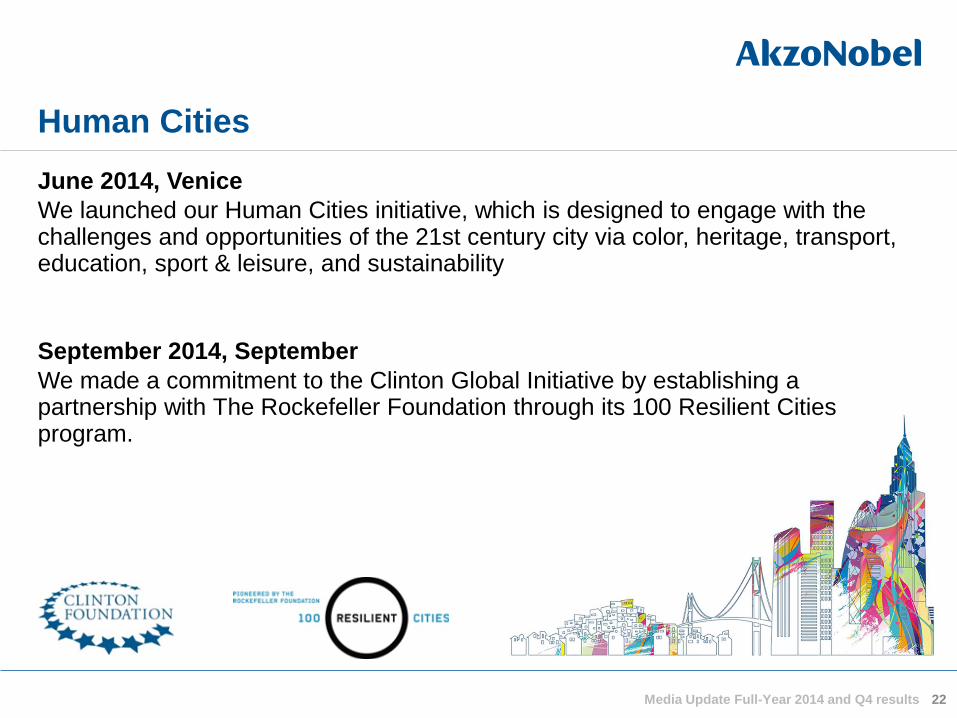
June 2014, Venice
We launched our Human Cities initiative, which is designed to engage with the challenges and opportunities of the 21st century city via color, heritage, transport, education, sport & leisure, and sustainability
September 2014, September
We made a commitment to the Clinton Global Initiative by establishing a partnership with The Rockefeller Foundation through its 100 Resilient Cities program.
255-255-255
185-201-208
068-105-125
085-190-207
000-146-187
000-139-197
000-081-146
134-134-136
000-000-000
183-185-186
000-139-197
000-081-146
134-134-136
183-185-186
185-201-208
255-255-255
Text Bk D1
Color 6
Color 5
Color 4
Color 3
Color 2
Color 1
Text Bk D2
Text Bk L1
Text Bk L2
Hyper
F. Hyper
Text D2
Text L2
Agenda main
Agenda main 2nd
Conclusion
23
• Improved underlying performance as efficiency programs take effect
• Higher return on sales and return on investment, despite the volatile economic environment
• Developing from transformation towards continuous improvement
• Markets, raw materials and exchange rates expected to remain volatile
• We are on track to deliver the 2015 targets
Media Update Full-Year 2014 and Q4 results
255-255-255
185-201-208
068-105-125
085-190-207
000-146-187
000-139-197
000-081-146
134-134-136
000-000-000
183-185-186
000-139-197
000-081-146
134-134-136
183-185-186
185-201-208
255-255-255
Text Bk D1
Color 6
Color 5
Color 4
Color 3
Color 2
Color 1
Text Bk D2
Text Bk L1
Text Bk L2
Hyper
F. Hyper
Text D2
Text L2
Agenda main
Agenda main 2nd
255-255-255
185-201-208
068-105-125
085-190-207
000-146-187
000-139-197
000-081-146
134-134-136
000-000-000
183-185-186
000-139-197
000-081-146
134-134-136
183-185-186
185-201-208
255-255-255
Text Bk D1
Color 6
Color 5
Color 4
Color 3
Color 2
Color 1
Text Bk D2
Text Bk L1
Text Bk L2
Hyper
F. Hyper
Text D2
Text L2
Agenda main
Agenda main 2nd
Questions
24
255-255-255
185-201-208
068-105-125
085-190-207
000-146-187
000-139-197
000-081-146
134-134-136
000-000-000
183-185-186
000-139-197
000-081-146
134-134-136
183-185-186
185-201-208
255-255-255
Text Bk D1
Color 6
Color 5
Color 4
Color 3
Color 2
Color 1
Text Bk D2
Text Bk L1
Text Bk L2
Hyper
F. Hyper
Text D2
Text L2
Agenda main
Agenda main 2nd
Safe Harbor Statement
This presentation contains statements which address such key issues as
AkzoNobel’s growth strategy, future financial results, market positions, product development, products in
the pipeline, and product approvals. Such statements should be carefully considered, and it should be
understood that many factors could cause forecasted and actual results to differ from these statements.
These factors include, but are not limited to, price fluctuations, currency fluctuations, developments in raw
material and personnel costs, pensions, physical and environmental risks, legal issues, and legislative,
fiscal, and other regulatory measures. Stated competitive positions are based on management estimates
supported by information provided by specialized external agencies. For a more comprehensive discussion
of the risk factors affecting our business please see our latest Annual Report, a copy of which can be found
on the company’s corporate website www.akzonobel.com.
25 Media Update Full-Year 2014 and Q4 results

255-255-255
185-201-208
068-105-125
085-190-207
000-146-187
000-139-197
000-081-146
134-134-136
000-000-000
183-185-186
000-139-197
000-081-146
134-134-136
183-185-186
185-201-208
255-255-255
Text Bk D1
Color 6
Color 5
Color 4
Color 3
Color 2
Color 1
Text Bk D2
Text Bk L1
Text Bk L2
Hyper
F. Hyper
Text D2
Text L2
Agenda main
Agenda main 2nd
255-255-255
185-201-208
068-105-125
085-190-207
000-146-187
000-139-197
000-081-146
134-134-136
000-000-000
183-185-186
000-139-197
000-081-146
134-134-136
183-185-186
185-201-208
255-255-255
Text Bk D1
Color 6
Color 5
Color 4
Color 3
Color 2
Color 1
Text Bk D2
Text Bk L1
Text Bk L2
Hyper
F. Hyper
Text D2
Text L2
Agenda main
Agenda main 2nd
Appendix
26 Media Update Full-Year 2014 and Q4 results
255-255-255
185-201-208
068-105-125
085-190-207
000-146-187
000-139-197
000-081-146
134-134-136
000-000-000
183-185-186
000-139-197
000-081-146
134-134-136
183-185-186
185-201-208
255-255-255
Text Bk D1
Color 6
Color 5
Color 4
Color 3
Color 2
Color 1
Text Bk D2
Text Bk L1
Text Bk L2
Hyper
F. Hyper
Text D2
Text L2
Agenda main
Agenda main 2nd
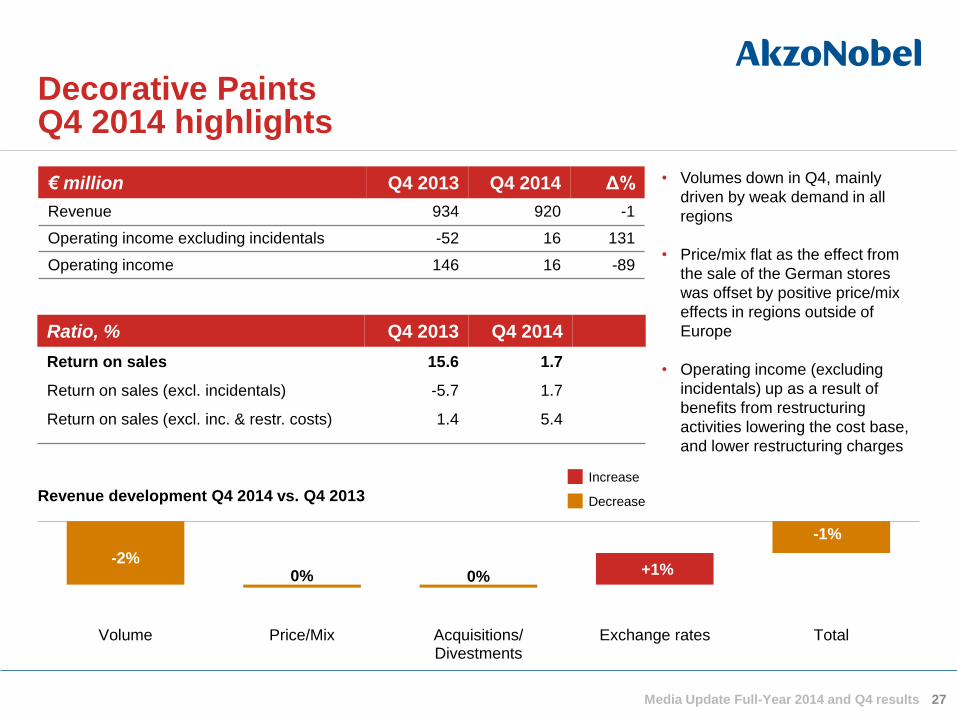
27
= • Volumes down in Q4, mainly
driven by weak demand in all
regions
• Price/mix flat as the effect from
the sale of the German stores
was offset by positive price/mix
effects in regions outside of
Europe
• Operating income (excluding
incidentals) up as a result of
benefits from restructuring
activities lowering the cost base,
and lower restructuring charges
Decorative Paints Q4 2014 highlights
€ million Q4 2013 Q4 2014 Δ%
Revenue 934 920 -1
Operating income excluding incidentals -52 16 131
Operating income 146 16 -89
Ratio, % Q4 2013 Q4 2014
Return on sales 15.6 1.7
Return on sales (excl. incidentals) -5.7 1.7
Return on sales (excl. inc. & restr. costs) 1.4 5.4
Increase
Decrease Revenue development Q4 2014 vs. Q4 2013
-2% 0% +1%
-1%
0%
Volume Price/Mix Acquisitions/Divestments
Exchange rates Total
-4%
Media Update Full-Year 2014 and Q4 results
255-255-255
185-201-208
068-105-125
085-190-207
000-146-187
000-139-197
000-081-146
134-134-136
000-000-000
183-185-186
000-139-197
000-081-146
134-134-136
183-185-186
185-201-208
255-255-255
Text Bk D1
Color 6
Color 5
Color 4
Color 3
Color 2
Color 1
Text Bk D2
Text Bk L1
Text Bk L2
Hyper
F. Hyper
Text D2
Text L2
Agenda main
Agenda main 2nd
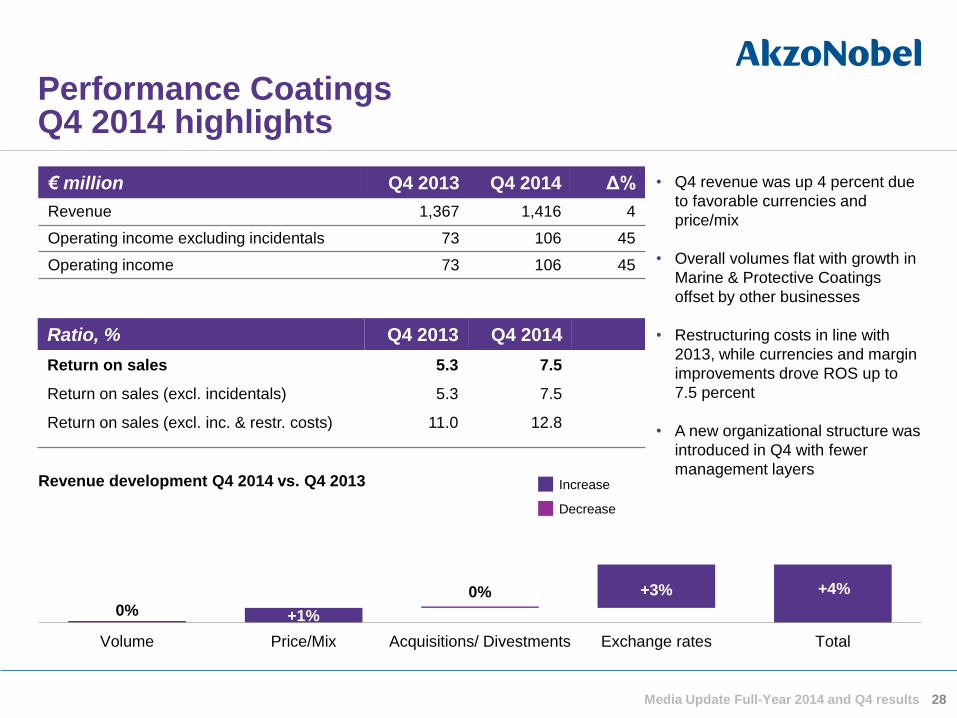
28
Performance Coatings Q4 2014 highlights
Increase
Decrease
+1% 0% 0% +3% +4%
Volume Price/Mix Acquisitions/ Divestments Exchange rates Total
Revenue development Q4 2014 vs. Q4 2013
• Q4 revenue was up 4 percent due
to favorable currencies and
price/mix
• Overall volumes flat with growth in
Marine & Protective Coatings
offset by other businesses
• Restructuring costs in line with
2013, while currencies and margin
improvements drove ROS up to
7.5 percent
• A new organizational structure was
introduced in Q4 with fewer
management layers
-1%
€ million Q4 2013 Q4 2014 Δ%
Revenue 1,367 1,416 4
Operating income excluding incidentals 73 106 45
Operating income 73 106 45
Ratio, % Q4 2013 Q4 2014
Return on sales 5.3 7.5
Return on sales (excl. incidentals) 5.3 7.5
Return on sales (excl. inc. & restr. costs) 11.0 12.8
Media Update Full-Year 2014 and Q4 results
255-255-255
185-201-208
068-105-125
085-190-207
000-146-187
000-139-197
000-081-146
134-134-136
000-000-000
183-185-186
000-139-197
000-081-146
134-134-136
183-185-186
185-201-208
255-255-255
Text Bk D1
Color 6
Color 5
Color 4
Color 3
Color 2
Color 1
Text Bk D2
Text Bk L1
Text Bk L2
Hyper
F. Hyper
Text D2
Text L2
Agenda main
Agenda main 2nd
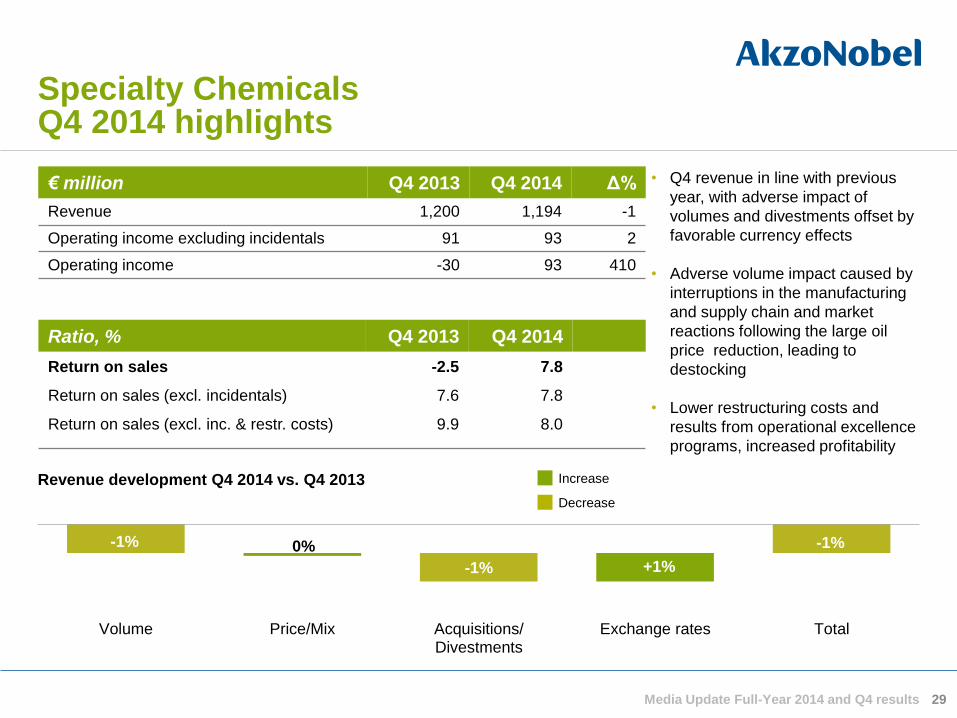
29
• Q4 revenue in line with previous
year, with adverse impact of
volumes and divestments offset by
favorable currency effects
• Adverse volume impact caused by
interruptions in the manufacturing
and supply chain and market
reactions following the large oil
price reduction, leading to
destocking
• Lower restructuring costs and
results from operational excellence
programs, increased profitability
Specialty Chemicals Q4 2014 highlights
Increase
Decrease
-1%
-1%
-1% 0%
Volume Price/Mix Acquisitions/Divestments
Exchange rates Total
Revenue development Q4 2014 vs. Q4 2013
€ million Q4 2013 Q4 2014 Δ%
Revenue 1,200 1,194 -1
Operating income excluding incidentals 91 93 2
Operating income -30 93 410
Ratio, % Q4 2013 Q4 2014
Return on sales -2.5 7.8
Return on sales (excl. incidentals) 7.6 7.8
Return on sales (excl. inc. & restr. costs) 9.9 8.0
+1%
Media Update Full-Year 2014 and Q4 results
255-255-255
185-201-208
068-105-125
085-190-207
000-146-187
000-139-197
000-081-146
134-134-136
000-000-000
183-185-186
000-139-197
000-081-146
134-134-136
183-185-186
185-201-208
255-255-255
Text Bk D1
Color 6
Color 5
Color 4
Color 3
Color 2
Color 1
Text Bk D2
Text Bk L1
Text Bk L2
Hyper
F. Hyper
Text D2
Text L2
Agenda main
Agenda main 2nd
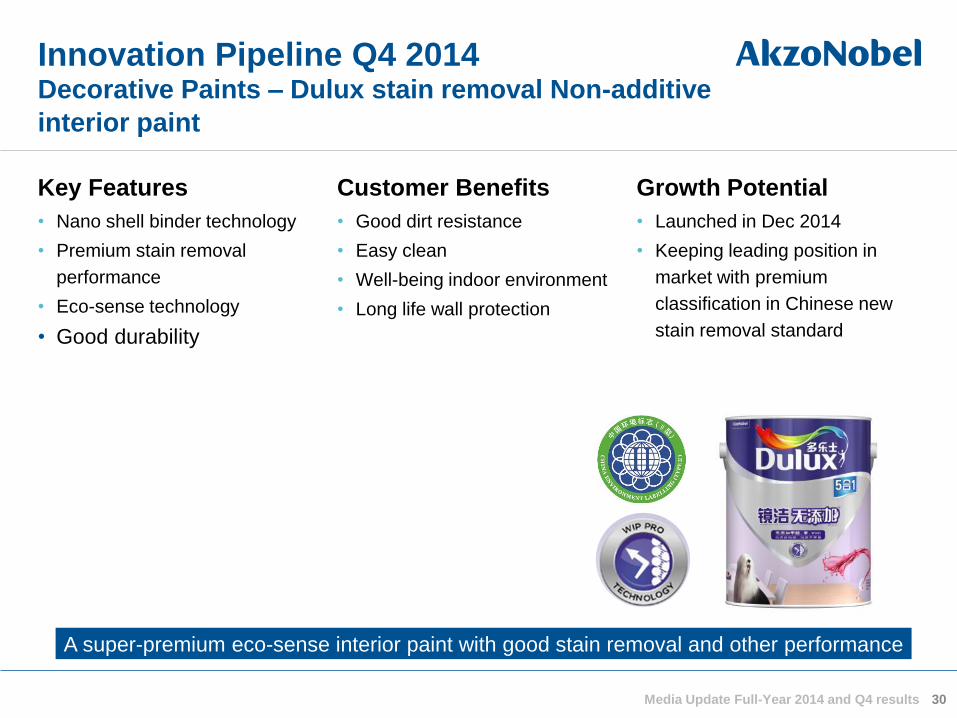
Innovation Pipeline Q4 2014 Decorative Paints – Dulux stain removal Non-additive
interior paint
Key Features
• Nano shell binder technology
• Premium stain removal
performance
• Eco-sense technology
• Good durability
Customer Benefits
• Good dirt resistance
• Easy clean
• Well-being indoor environment
• Long life wall protection
Growth Potential
• Launched in Dec 2014
• Keeping leading position in
market with premium
classification in Chinese new
stain removal standard
A super-premium eco-sense interior paint with good stain removal and other performance
Media Update Full-Year 2014 and Q4 results 30
255-255-255
185-201-208
068-105-125
085-190-207
000-146-187
000-139-197
000-081-146
134-134-136
000-000-000
183-185-186
000-139-197
000-081-146
134-134-136
183-185-186
185-201-208
255-255-255
Text Bk D1
Color 6
Color 5
Color 4
Color 3
Color 2
Color 1
Text Bk D2
Text Bk L1
Text Bk L2
Hyper
F. Hyper
Text D2
Text L2
Agenda main
Agenda main 2nd
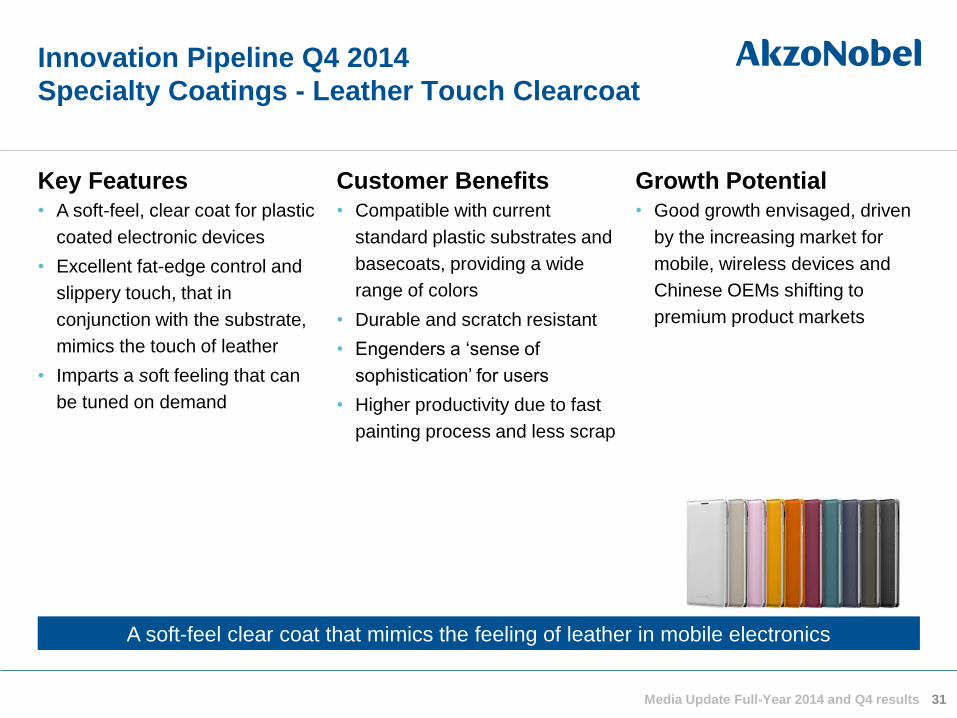
Innovation Pipeline Q4 2014
Specialty Coatings - Leather Touch Clearcoat
Key Features • A soft-feel, clear coat for plastic
coated electronic devices
• Excellent fat-edge control and
slippery touch, that in
conjunction with the substrate,
mimics the touch of leather
• Imparts a soft feeling that can
be tuned on demand
Customer Benefits • Compatible with current
standard plastic substrates and
basecoats, providing a wide
range of colors
• Durable and scratch resistant
• Engenders a ‘sense of
sophistication’ for users
• Higher productivity due to fast
painting process and less scrap
Growth Potential • Good growth envisaged, driven
by the increasing market for
mobile, wireless devices and
Chinese OEMs shifting to
premium product markets
A soft-feel clear coat that mimics the feeling of leather in mobile electronics
Media Update Full-Year 2014 and Q4 results 31
255-255-255
185-201-208
068-105-125
085-190-207
000-146-187
000-139-197
000-081-146
134-134-136
000-000-000
183-185-186
000-139-197
000-081-146
134-134-136
183-185-186
185-201-208
255-255-255
Text Bk D1
Color 6
Color 5
Color 4
Color 3
Color 2
Color 1
Text Bk D2
Text Bk L1
Text Bk L2
Hyper
F. Hyper
Text D2
Text L2
Agenda main
Agenda main 2nd
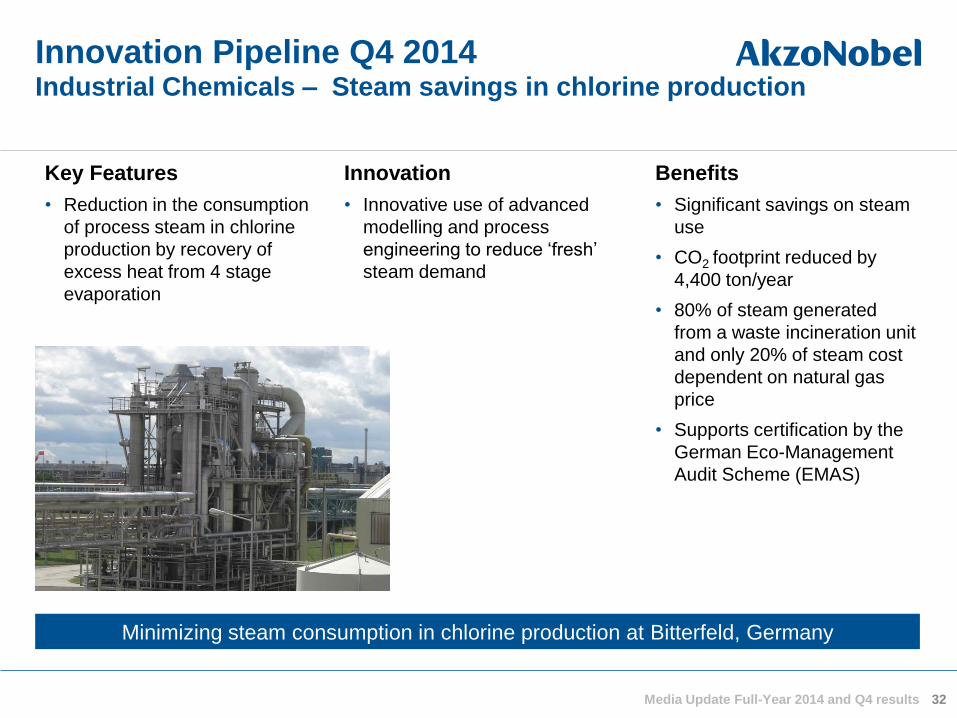
Innovation Pipeline Q4 2014 Industrial Chemicals – Steam savings in chlorine production
Key Features
• Reduction in the consumption
of process steam in chlorine
production by recovery of
excess heat from 4 stage
evaporation
Benefits
• Significant savings on steam
use
• CO2 footprint reduced by
4,400 ton/year
• 80% of steam generated
from a waste incineration unit
and only 20% of steam cost
dependent on natural gas
price
• Supports certification by the
German Eco-Management
Audit Scheme (EMAS)
Minimizing steam consumption in chlorine production at Bitterfeld, Germany
Innovation
• Innovative use of advanced
modelling and process
engineering to reduce ‘fresh’
steam demand
Media Update Full-Year 2014 and Q4 results 32