air pollution: monitoring, managing and - public health on · pdf fileair pollution:...
TRANSCRIPT


Air Pollution: Monitoring, Managing and
Minimizing Effects on Health
J. R. Brook Senior Scientist
Air Quality Research Division
OEH SEMINAR TORONTO
NOV. 21, 2013

Page 2
Learning Objectives
• To become familiar with the new Federal-Provincial Air Quality Management System.
• To understand more about approaches available and being developed to improve characterization of individual and population exposures to air pollutants.
• To learn about some recent research results and ongoing challenges regarding air pollutant exposures and effects

Page 3
Outline • Monitoring
– Traditional networks of surface stations – New developments
• Managing – The new Federal-Provincial Air Quality Management System
(AQMS) – Prediction of future levels
• Minimizing – Learning more about health effects
• Concluding Remarks

Page 4
Canadian National Air Pollution Surveillance (NAPS) Monitoring Sites

Page 5
What has this monitoring told us?

Page 6
Brook et al., Springer, 2013

Page 7
Brook et al., Springer, 2013

Page 8
Long-Term Trend in “Soot”
19741976
19781980
19821984
19861988
19901992
19941996
19982000
20022004
20062008
0.0
0.5
1.0
1.5
2.0
2.5
3.0E
C (µ
g/m
³)
EC derived from COH EC
-51% Decrease 1990-2006
Courtesy of Tom Dann

Page 9
An Environmental Management

Page 10
Ground Level Ozone Trend
Brook et al., Springer, 2013

Page 11
Ozone has declined since the early 2000s, however…
Large regions encompassing a large fraction of the population still exceed the CAAQS
Local hotspot
Brook et al., Springer, 2013

Page 12
Other Exposure Hotspots - Industry
Ambient Volatile Organic Compound (VOC) levels increasing among monitoring sites near petrochemical industries
Brook et al., Springer, 2013

Page 13
Exposure to traffic emissions – An issue in all Canadian cities - health effects have been demonstrated in Canada and elsewhere
East Montréal Mobile Lab Observations (CRUISER) • A focus on multi-pollutant
exposure in an industrial area • Levy et al, EHP, 2013
45% of Metro Toronto population lives within 500m of a highway or 100m of a major road - HEI, 2010

Page 14
Toronto Surveys – Neighbourhood vs. Main City Streets
Brook et al., unpublished

Page 15
Toronto Surveys – Neighbourhood vs. Main City Streets
0
10
20
30
40
50
60
70
NO NO2 BC CO/10 UFP/1000
Bathurst
neighbourhood
Brook et al., unpublished

Page 16
Location of New Toronto Near-Roadway Sites A Partnership with Provinces & Municipalities
Page 17
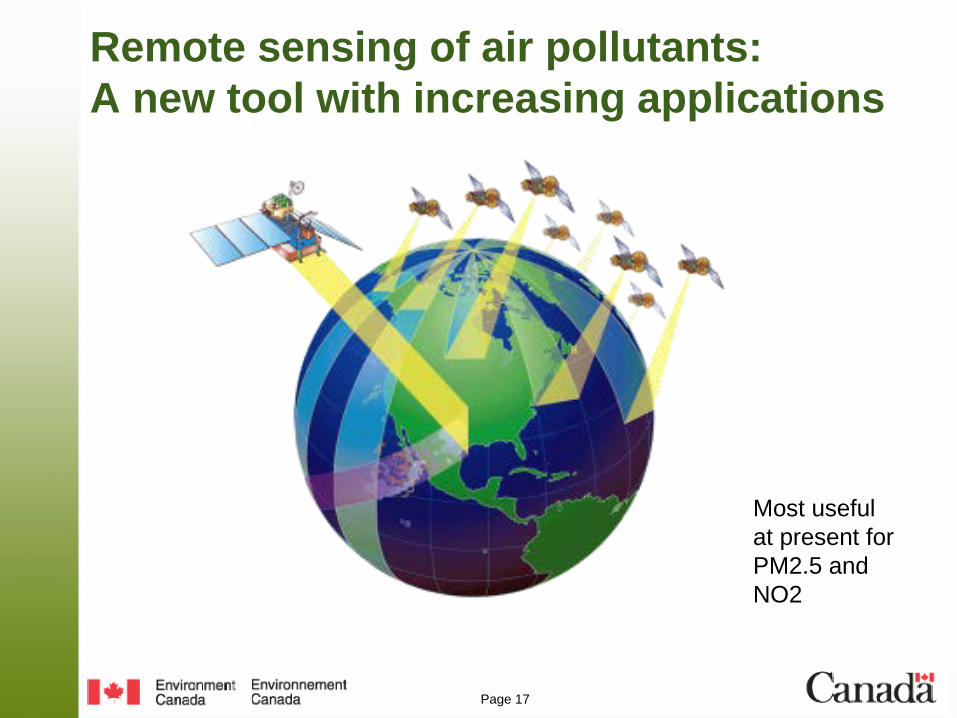
Remote sensing of air pollutants: A new tool with increasing applications
Most useful at present for PM2.5 and NO2

Page 18
Air Quality Models • Evaluating the effects of changes in emissions due to future growth or policies
– Effects on air quality, deposition to the surface (acid rain) and climate
• Assessing our level of scientific understanding
• Forecasting future conditions – services such as the AQHI forecast
Canadian Air Quality Model Forecasts: http://weather.gc.ca/aqfm/index_e.html

Page 19
Air Quality Model Measurement networks
LUR models
Satellite observations
Hi-res Emissions

Page 20
Combining Model Output and Observations (‘Data Fusion’)
• Allows a better characterization of the hotspots and their causes
• Led to a process and modelling research focus in the 2007 BAQS-Met Study, which led to significant model improvements
• Supporting AQHI program and health effects studies
Interpolated Observations Objective Analysis of Obs. and Model
Brook et al., ACP, 2013 Brook et al., CRC Press, 2010

Page 21
Combination of Model and Monitor PM2.5
Average PM2.5 Summer 2012
Robichaud and Menard, ACP, 2013

Page 22
Average NO2 over SW Ontario by wind direction from satellite
Can infer movement of urban emissions and gain insight into the size of the area that is impacted
Lee et al., ACP, 2011
NW NE
SE SW

Page 23
Scientific Challenges in AQ Research
• Air pollution is a complex mixture – What are the multi-pollutant effects? – How do we manage AQ holistically? – How reliable is the model?
• Exposure from traffic emissions – Near roadway processes – Details of the mixture – How do changes in engine, fuel
and after treatment technologies affect health?
• Improvement of high resolution models
NO
CO
NO2
Aldehydes
CO
NO2
NO
NO CO
CO
HNO3 O3
O3
N2O5 VOC
SVOC
dust
SO2
SO2
metals
O3
VOC
SVOC SO2
H2O
H2O
SVOC
POPs
Distance from Road
Organics
SVOC, IVOC SVOC, IVOC
OH, O3, NO3
Primary OA
Secondary Organic Aerosol
Many km’s A few meters
Dilution
Pre-existing OA

Page 24
Emissions from most sources are a complex mixture of pollutants and contribute to multiple secondary pollutants
NO
CO
NO2
Aldehydes
CO NO2
NO
NO CO
CO
HNO3 O3
O3
N2O5 VOC
SVOC SO2
SO2
O3
VOC
SVOC SO2
H2O
H2O
SVOC
NO2 CO
SVOC SO2 H2O
O3
CO
VOC
POPs

Page 25
Co-Benefits of Reducing Black Carbon Emissions

Page 26
BC-Climate Science Community:
What degree?
What certainty is there in the health benefits?
[63] While health effects are not evaluated in this report, there is always the potential to obtain some degree of health benefits by mitigating BC emissions. Emissions that preferentially occur in populated areas have large health impacts,
[64] Diesel sources of BC appear to offer the most promising mitigation opportunities in terms of near-term forcing and maturity of technology and delivery programs. Although some options, such as diesel retrofits, may be costly relative to other BC mitigation options, they may also deliver significant health benefits.

Page 27
Unmeasured chemicals in the traffic emissions mixture
Wentzell et al., ES&T 2013
HNCO
Correlation between Benzene and isocyanic acid during the Toronto morning rush hour

Page 28
Assessing Air Quality Holistically and from the Regional Perspective to Best Aid Management
• Local emission sectors of importance, present and future
• Meteorological influences on AQ
• The role of long-range and transboundary transport
• Considering the lattest scientific insights resulting from data analyses/interpretation
• Insights from special field studies contributing further local and national knowledge and testing models
• Focus on region-specific knowledge gaps
Observations ModelingSourceApportionment
AtmosphericConcentrations
Emissions
Chemistry Meteorology
Regional Airshed Conceptual Model
Observations ModelingSourceApportionment
AtmosphericConcentrations
Emissions
Chemistry Meteorology
Regional Airshed Conceptual Model

Page 29
Main Concepts in Current Canadian Air Quality Management Approach
• Establish new standards for PM2.5 and O3 that are lower than the current values
• Maintain current levels where they are below the standard
• Engage industry to obtain agreements on emission reductions by sector
• Apply cost-benefit analyses for policies considered

Page 30
Canadian Ambient Air Quality Standards (CAAQS) • Derived following the exposure reduction concept:
– Applying the principle of continuous improvement, an AQO is expressed as a required percentage decrease in concentrations.
• Concentration values determined by using a new Population Improvement Approach (PIA)
– links ambient concentrations to the size of the population exposed. – The potential standards can then be set by specifying the desired reduction in
exposed population.
Ranges for 2015 - PIA of 5-10% • Ozone = 60-62 ppb • PM2.5 (24h) = 28 -29 µg/m3
• PM2.5 (annual) = 9.9-10.5 µg/m3

Page 31
65 ppb
63 ppb
65%
60%
The ongoing challenge of dealing with O3

Page 32
o Achieve CAAQS o Prevent CAAQS
Exceedances o Prevent Air Quality
Deterioration o Keep clean areas clean
New Canadian Ambient Air Quality Standards (CAAQS)

Page 33
Air Quality Management System • The Government of Canada is working with the provinces, territories and
stakeholders to implement the new Air Quality Management System to address air pollution issues
• The system includes: – New Canadian Ambient Air Quality Standards (CAAQS)
▪ PM2.5 and Ozone published in Canada Gazette, May 2013
▪ Future CAAQS being developed for NO2 and SO2
– Establishment of base-level industrial emissions requirements for major industrial sectors and equipment types
– Air zones delineated by provinces and territories will target key sources of air pollutants contributing to poor air quality at the local level ▪ Annual air zone reporting by provinces and territories starting in 2014
– 6 Regional Airsheds with unique air quality characteristics ▪ State of Air reports (starting 2015 and then every 5 years) will be based on
analysis of air quality and management actions within airsheds. – Collaborative process to reduce the emissions from mobile sources

Page 34
Canadian Regional Airsheds
• Geographic regions defined to have similar air quality profiles based on factors such as air flow trajectories, weather patterns and topography
• Encompass several jurisdictions crossing provincial/territorial and national boundaries

Page 35

Page 36

Page 37
Satellite PM2.5 used for Canadian Census Health and Environment Cohort (CanCHEC)
Increased Risk of mortality shown to well below 10 µg/m3
Hazard Ratio per 10 µg/m3 = 1.10 (1.05-1.15)
PM2.5 (µg/m3)
Adju
sted
Res
pons
e in
mor
talit
y
Crouse et al, EHP, 2012

Page 38
Air Pollution Health Effects: Key insights over the past 25 years • There are effects at the current (low) levels • The existence and importance of cardiovascular effects
– and a growing number of other outcomes (e.g., birth, neurological, cancer)
• The mounting evidence of the risks associated with traffic-related air pollution, a pervasive exposure in modern society
• The commonality of the physiological pathways that air pollution acts upon vs. many other adverse conditions
– Oxidative stress, inflammation

Page 39
Globally, two risks from inhalation exposures are top ten disease burdens
Lim et al. 2012 Lancet

Page 40
HR 1.11; CI 1.02-1.22
Retrospective Cohort from National Population Health Survey N=62K ; 6.3K new cases 8 yr follow-up (1996-2010)
Chen et al., EHP, Apr. 2013.
Development of diabetes: Ontario

Page 41
Retrospective Cohort from National Population Health Survey 8 yr follow-up (1996-2010)
Incident hypertension N=35.3K; 8.6K cases HR=1.13; CI 1.05-1.22
Chen et al., Circulation Nov. 2013.
Development of hypertension

Page 42
What do we need to know to minimize effects?
• Better quantification of the relationship between air pollution and health effects to guide policy • More accurate and more precise concentration-
response functions by population sub-group • large cohorts with more precise exposure
• More complete attribution of risk by including more endpoints and air pollution mixtures
• Develop protective measures for uncontrollable exposures or treatments or cures (therapeutics)
• Determine how to measure if an individual is exceeding their safe dose before disease development
– Set guidelines – Personalized environmental medicine

Page 43
While there are considerable strengths we have some significant weaknesses in Canada • No concerted funding program for
environmental health – Opportunities for groups working together and
capitalizing on ideas, existing capacity and data are not realized
• Most prospective cohorts don’t have a highly detailed environmental exposure aspect to their design
• No separate funding source to start and sustain environmental health cohorts
• Limited integration of biomarker research for diagnostics and exposures

Page 44
Strengths • Public health care system
– Complete coverage of population – Good records which can be linked with many databases – Relatively good management of population/individual health
• Some retrospective and prospective cohorts • Exposure information; AQ monitoring and modelling • Controlled exposure facilities for diesel, PM and gases • Low levels in Canada, useful for assessing population
thresholds and the shape of the dose-response • Excellent scientific capacity, strong collaborative
culture

Page 45
Future Directions & Opportunities • Very large cohorts – retrospective • More pooling of existing prospective cohorts • Improved characterization of exposure patterns
– Toronto area studies related to the Pan AM Games
• Refining exposure measurement via the EXPOSOME concept
• CIHR Signature Initiative on Environment and Health

Page 46
Inexpensive, multi-pollutant sensor arrays for enhanced monitoring
Mykhaylova et al., AAAR, 2013

Page 47
High Resolution AQ Models Coupled to Infiltration and Time-Activity Models
& Obs.
Regional background Concentrations • Primary and secondary pollutants
Urban concentrations • Primary and secondary
Neighbourhood concentrations
Indoor - home/other concentrations
S C A L E S
Near source concentrations
LUR Model
Regional background Concentrations • Primary and secondary pollutants
Urban concentrations • Primary and secondary
Neighborhood concentrations
Indoor - home/other concentrations
S C A L E S
Near source concentrations Near source concentrations
• Ambient monitoring data collected by Environment Canada informs the regional and urban concentrations for specific pollutants
• Short term studies provide insight at the local scale (neighbourhood) and near source scales
Time activity/housing
• MODELS are required to combine the information to estimate past/current exposure and changes arising from policy scenarios
Higher resolution is needed for advancement

Page 48
Viruses
Birth Cohort Examining the Origins of Asthma A national platform for multi-disciplinary research
on environment and health
Genetics Immune phenotypes Clinical phenotypes Stress
SES
Home environment
Pollution
Work & School environment
Diet
Exposures
Pets
N = 3600
www.canadianchildstudy.ca
Page 49
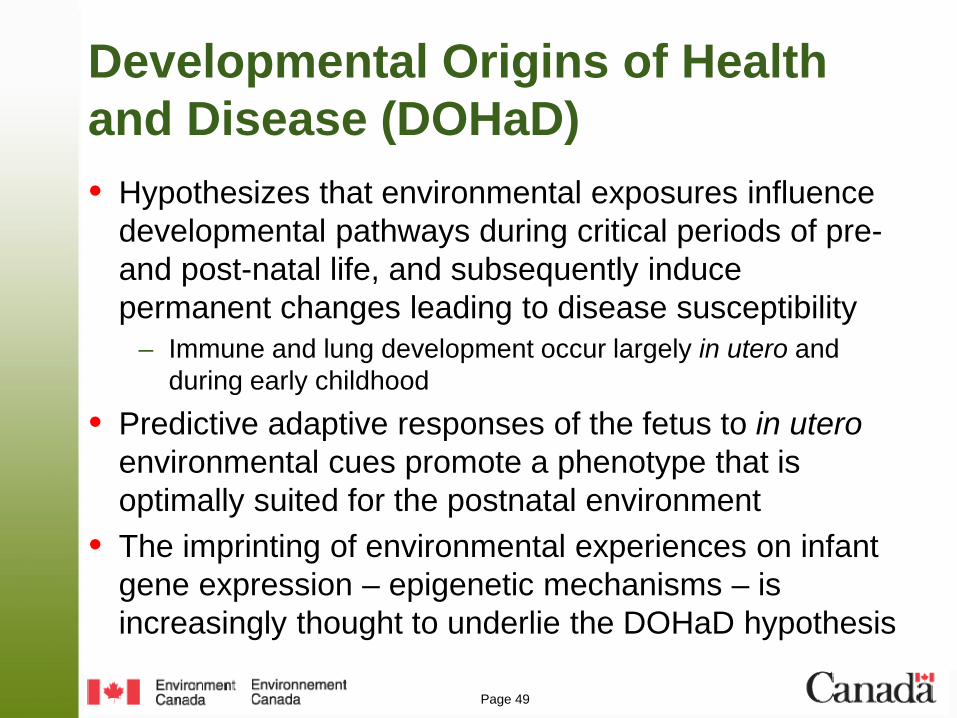
Developmental Origins of Health and Disease (DOHaD) • Hypothesizes that environmental exposures influence
developmental pathways during critical periods of pre-and post-natal life, and subsequently induce permanent changes leading to disease susceptibility
– Immune and lung development occur largely in utero and during early childhood
• Predictive adaptive responses of the fetus to in utero environmental cues promote a phenotype that is optimally suited for the postnatal environment
• The imprinting of environmental experiences on infant gene expression – epigenetic mechanisms – is increasingly thought to underlie the DOHaD hypothesis

Page 50
Window of environmental intervention may be early in life
Godfrey et al., Trends in Endocrinology and Metabolism 2010

Page 51
Minimizing Effects: Can’t be done independent of other risks/issues Over-Arching Policy Questions: • Are the impacts on public health due to current
transportation and industrial practices large enough that the costs of changing would be less than the cost of inaction?
• What would the unintended consequences be of changes in transportation and industrial practices or other emissions motivated by a need to minimize, mitigate and/or adapt to climate change?

Page 52
Concluding Remarks: Did we meet our learning objectives? To become familiar with the new Federal-
Provincial Air Quality Management System. To understand more about approaches
available and being developed to improve characterization of individual and population exposures to air pollutants. To learn about some recent research results
and ongoing challenges regarding air pollutant exposures and effects

Page 53
Acknowledgements
• Rick Burnett • Hong Chen • Dan Crouse • Tom Dann • Didier Davingnon • Greg Evans • Dennis Herod • Barry Jessimin
• Qian Li • Sabrina Li • John Liggio • Alain Robichaud • Malcolm Sears • PJ Subbarao • Kevin Thomson • Jeremy Wentzell