air pollution and public health - weizmann institute of ... 01 air pollution and... · london smog,...
TRANSCRIPT
Air Pollution and Public Health
Where have we been?Where are we going?
Joel Schwartz
Harvard School of Public Health
Meuse Valley Disaster
• December 1—5 1930– Intense Fog in valley between Liege and
Huy– Worst on December 3 and 4– Over 60 Deaths, 14 in Engis which
normally had 65 deaths per year
Notable Remarks
• A Similar Episode in London would kill Over 3000 People
• Many of the Deaths were Cardiovascular Deaths, following respiratory distress
• Submicron particles found in the alveolar region of the lung, Macrophages filled with Particles
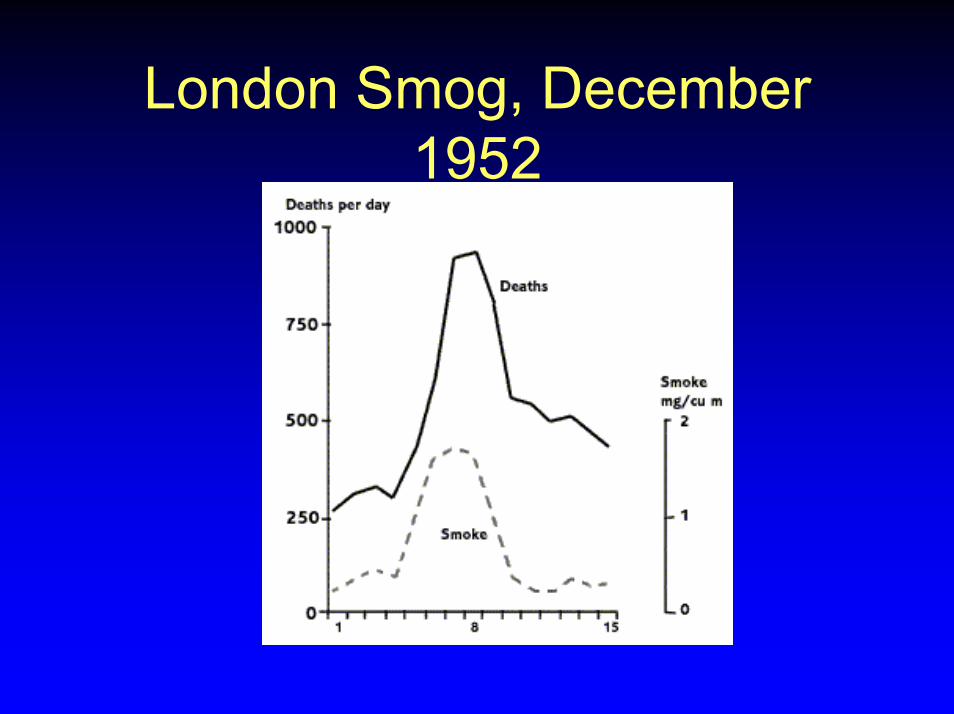
London Smog, December 1952
First Response
• British Clean Air Act 1956• US Clean Air Act 1963• Levels Lowered• Problem Solved
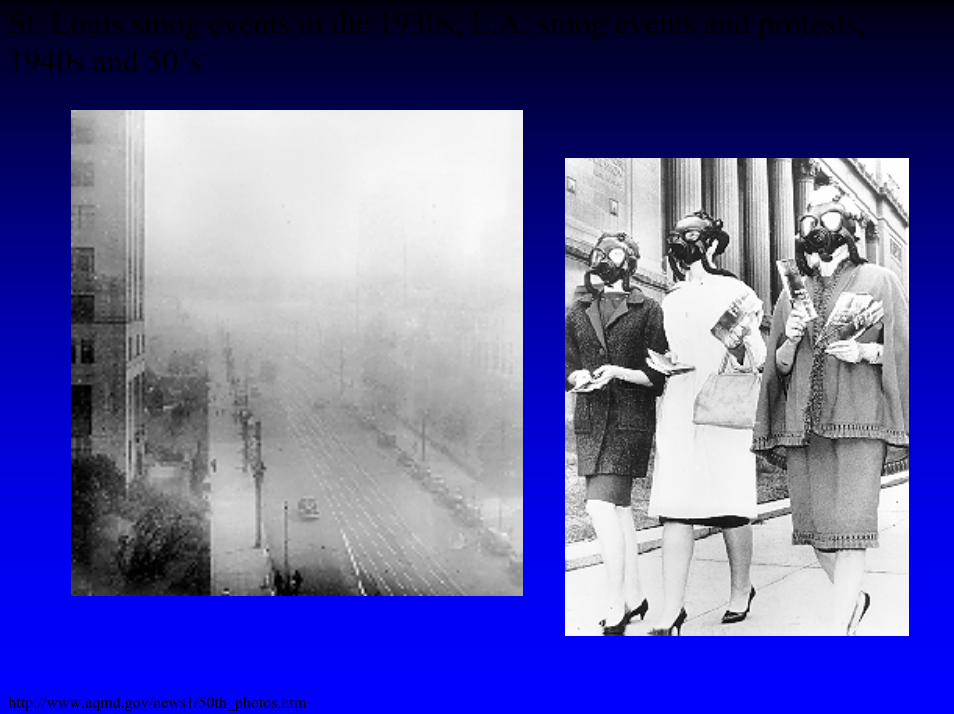
St. Louis smog events in the 1930s; L.A. smog events and protests, 1940s and 50’s
http://www.aqmd.gov/news1/50th_photos.htm
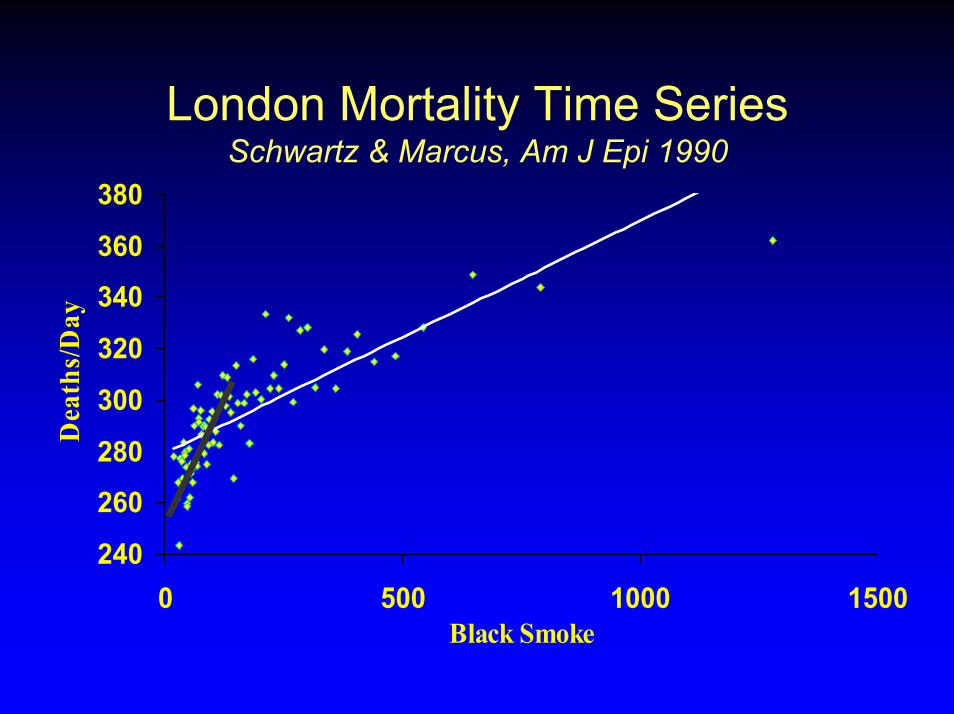
London Mortality Time SeriesSchwartz & Marcus, Am J Epi 1990
240
260
280
300
320
340
360
380
0 500 1000 1500Black Smoke
Dea
ths/
Day
How Can this Happen?
• What are people dying of?• What increases your risk of dying of
those diseases?• What possible mechanism can there
be?
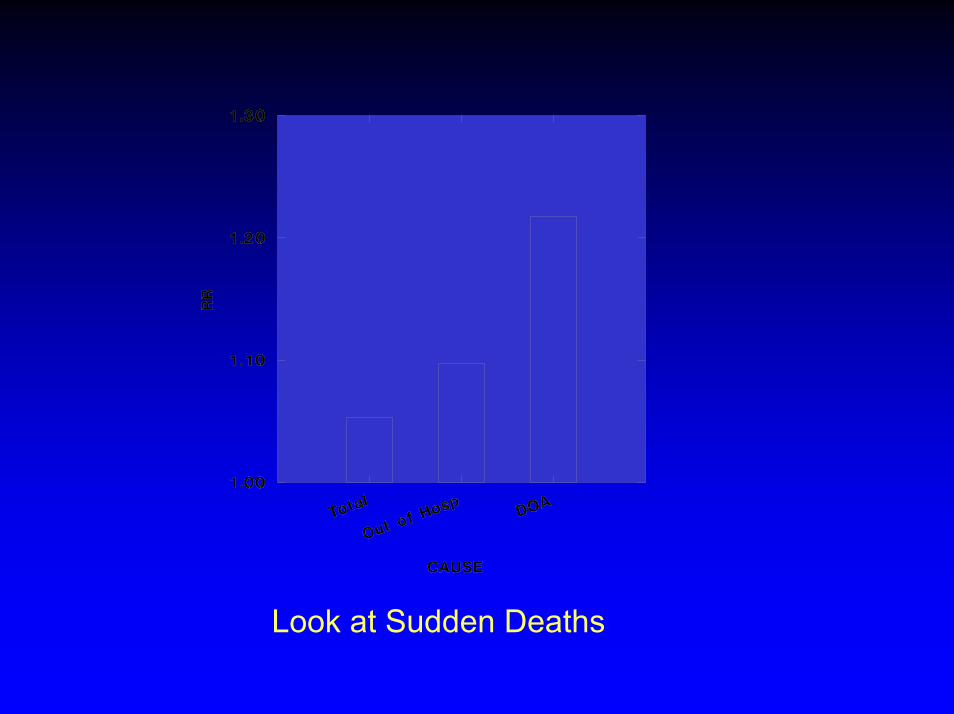
Look at Sudden Deaths
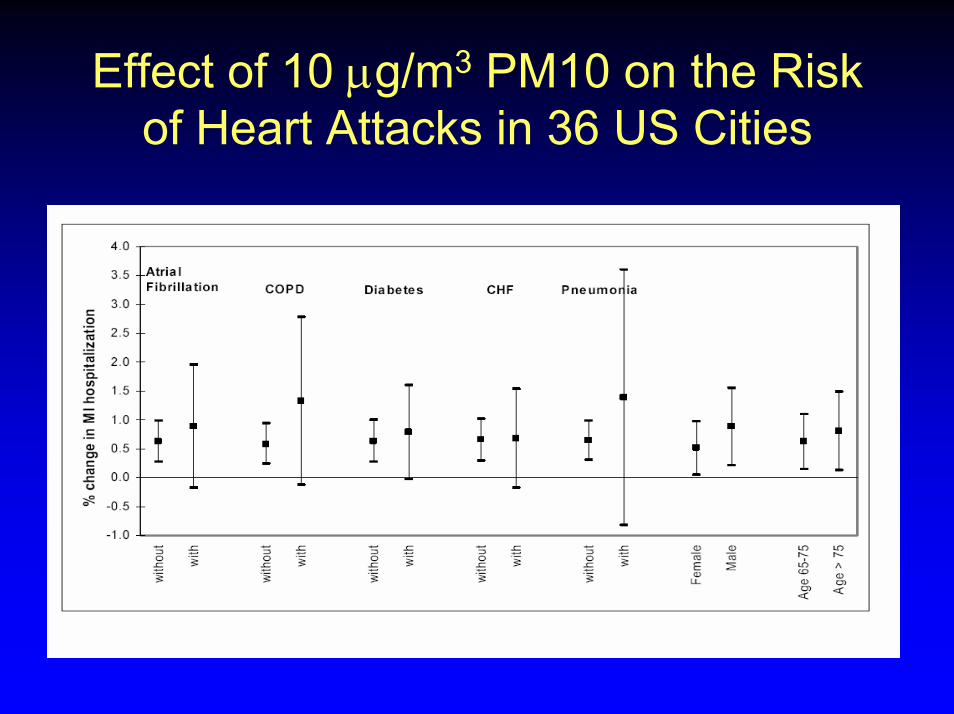
Effect of 10 µg/m3 PM10 on the Risk of Heart Attacks in 36 US Cities
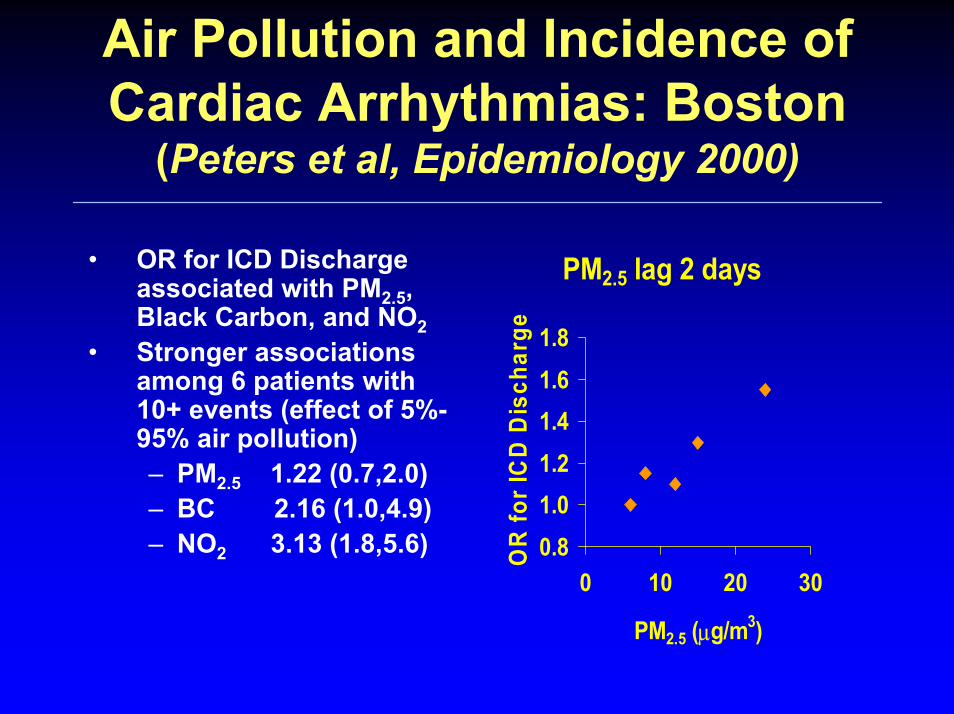
Air Pollution and Incidence of Cardiac Arrhythmias: Boston
(Peters et al, Epidemiology 2000)
• OR for ICD Discharge associated with PM2.5, Black Carbon, and NO2
• Stronger associations among 6 patients with 10+ events (effect of 5%-95% air pollution)– PM2.5 1.22 (0.7,2.0)– BC 2.16 (1.0,4.9)– NO2 3.13 (1.8,5.6)
PM2.5 lag 2 days
0.81.01.21.41.61.8
0 10 20 30
PM2.5 (µg/m3)
OR
for I
CD
Dis
char
ge
How is this Happening?
• Autonomic Dysfunction• Arterial Dysfunction• Thrombosis
Harvard School of Public Health
Heart Rate Variability
• Variability of time between heart beats• More Variability Protects against Arrhythmia
– Decreases in Boston (3 studies), Baltimore (2 studies), Utah Valley (2 studies), Mexico City (2 studies), ARIC Study, Elderly Chamber Study
– No effect (Vancouver)• Seems stronger in Elderly
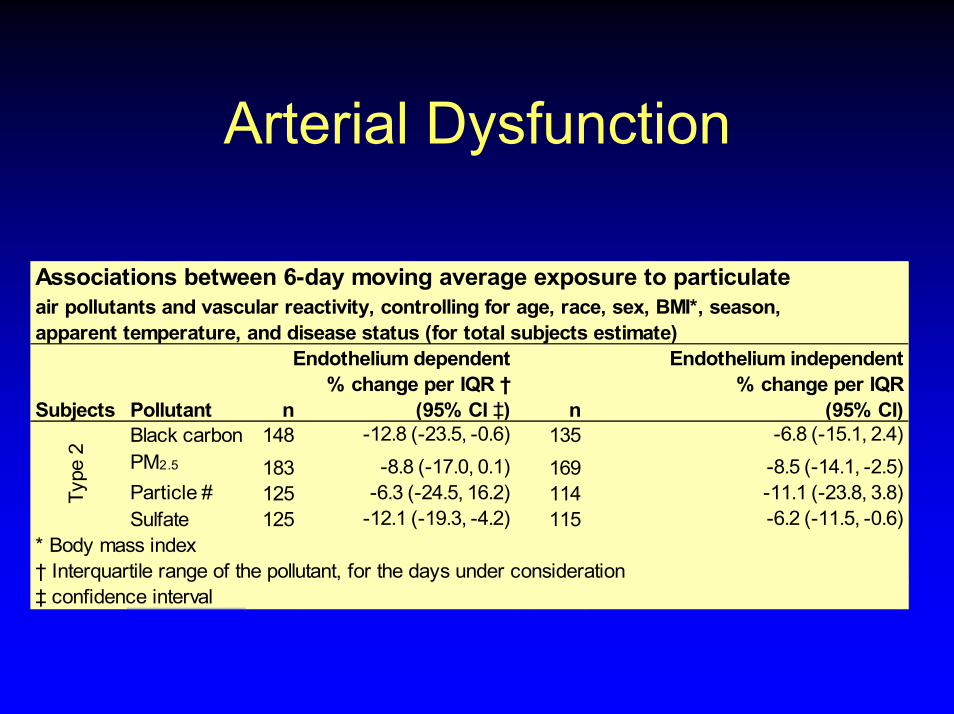
Arterial Dysfunction
Associations between 6-day moving average exposure to particulate air pollutants and vascular reactivity, controlling for age, race, sex, BMI*, season, apparent temperature, and disease status (for total subjects estimate)
% change per IQR † % change per IQRSubjects Pollutant n (95% CI ‡) n (95% CI)
Black carbon 148 -12.8 (-23.5, -0.6) 135 -6.8 (-15.1, 2.4)PM2.5 183 -8.8 (-17.0, 0.1) 169 -8.5 (-14.1, -2.5)Particle # 125 -6.3 (-24.5, 16.2) 114 -11.1 (-23.8, 3.8)Sulfate 125 -12.1 (-19.3, -4.2) 115 -6.2 (-11.5, -0.6)
* Body mass index† Interquartile range of the pollutant, for the days under consideration‡ confidence interval
Endothelium independent
Type
2
Endothelium dependent
Thrombosis
• Peters et al 2001 Increases in CRP • Fibrinogen Increases (Ghio 2000,
Pekkanen 2000, Schwartz 2001)• Von Willibrand’s Factor (Liao 2005,
O’Neill in review)

FEV1 Growth vs PM2.5 in Southern California Children (Gauderman et al.,
2000)
New Directions
• Mechanistic Pathways• Traffic Pollution and Fine Scale
Exposure• Developing Countries
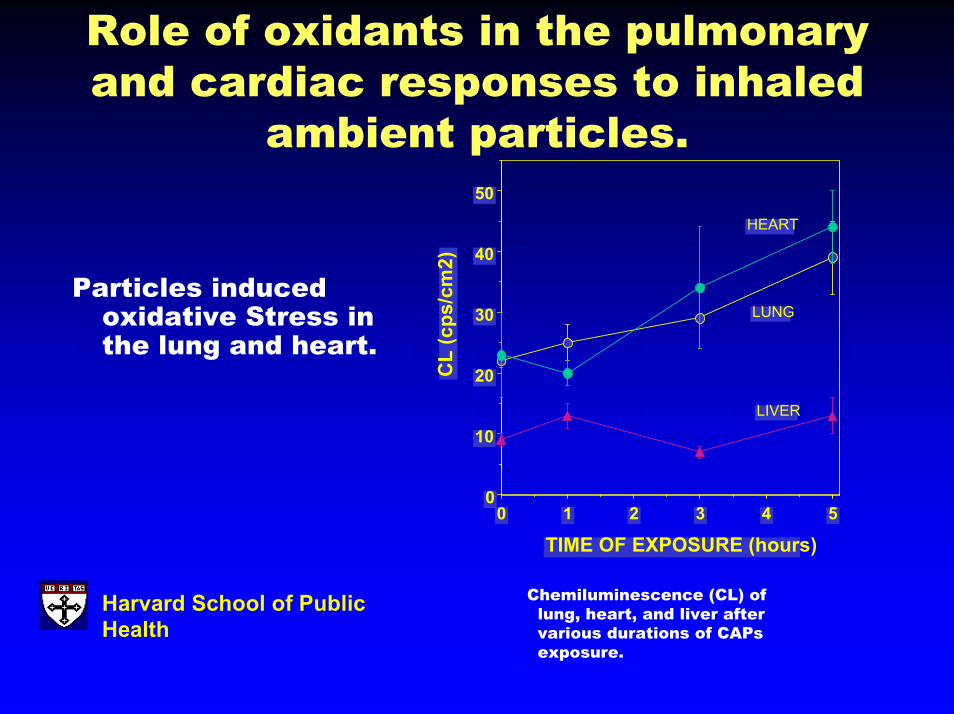
Role of oxidants in the pulmonary and cardiac responses to inhaled
ambient particles.
Particles induced oxidative Stress in the lung and heart.
5432100
10
20
30
40
50
TIME OF EXPOSURE (hours)
CL
(cps
/cm
2)
LUNG
HEART
LIVER
Chemiluminescence (CL) oflung, heart, and liver after various durations of CAPsexposure.
Harvard School of Public Health
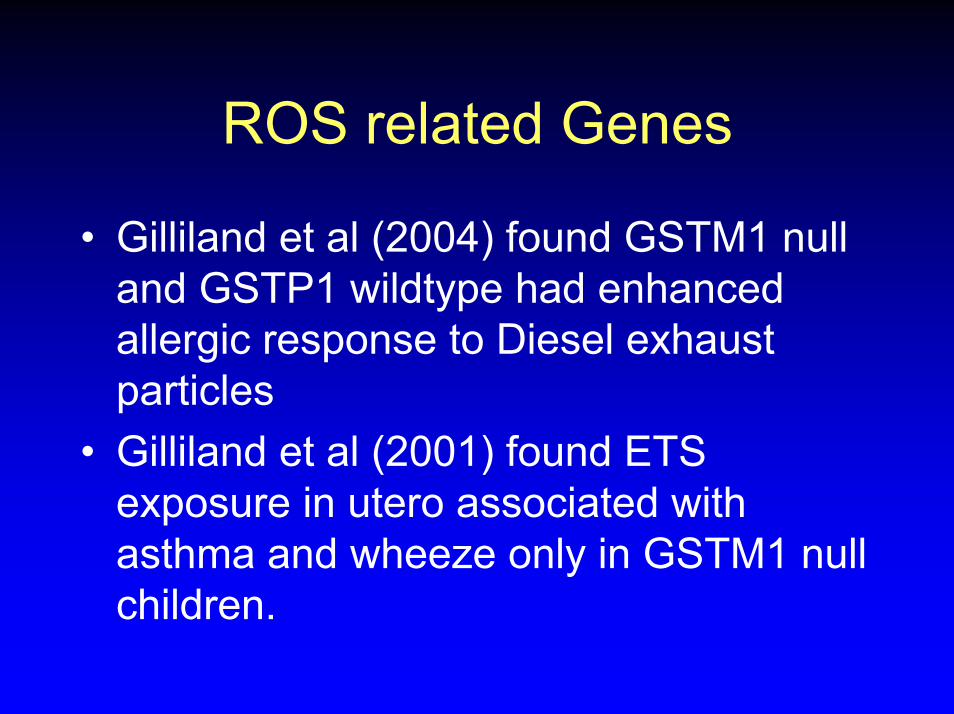
ROS related Genes
• Gilliland et al (2004) found GSTM1 null and GSTP1 wildtype had enhanced allergic response to Diesel exhaust particles
• Gilliland et al (2001) found ETS exposure in utero associated with asthma and wheeze only in GSTM1 null children.
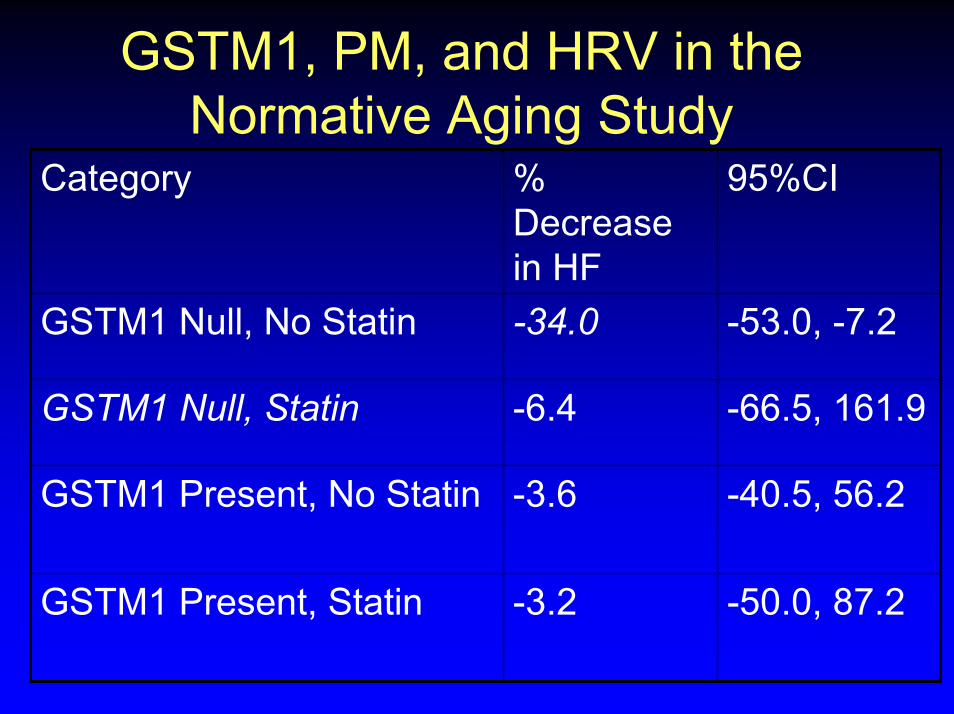
GSTM1, PM, and HRV in the Normative Aging Study
-50.0, 87.2 -3.2GSTM1 Present, Statin
-40.5, 56.2 -3.6GSTM1 Present, No Statin
-66.5, 161.9 -6.4GSTM1 Null, Statin
-53.0, -7.2 -34.0GSTM1 Null, No Statin
95%CI% Decrease in HF
Category
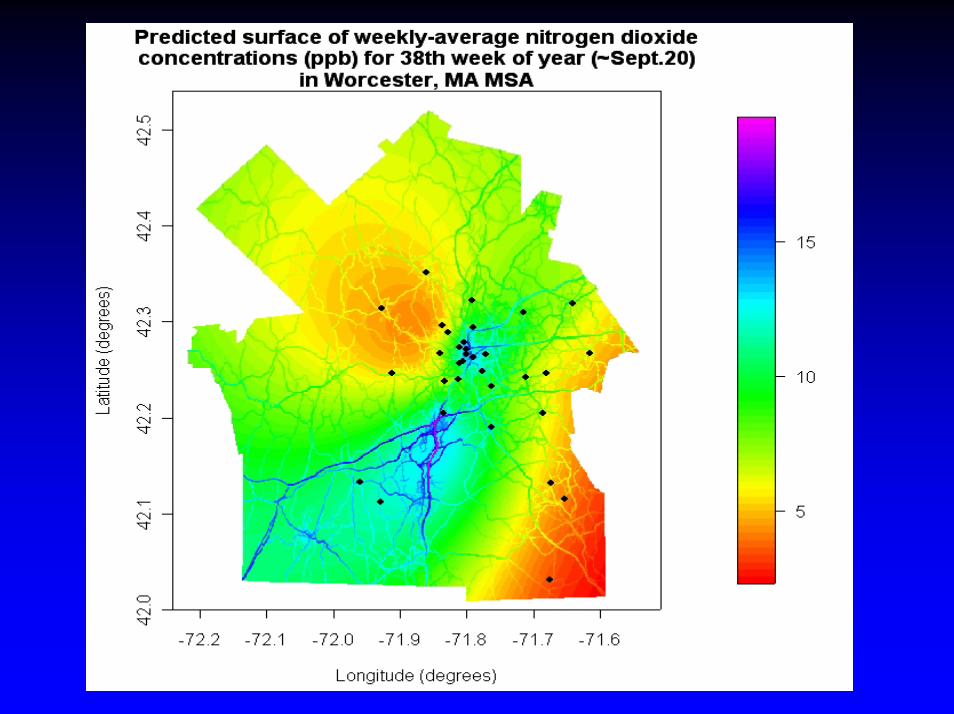
Traffic Pollution
• Not uniform over space
• Big difference in a few blocks
Harvard School of Public Health
Dutch Cohort Study(Hoek et al)
• Estimated Traffic Particle Exposure at Home Address
• Larger Increase in Risk of Death than Previous Cohort Studies
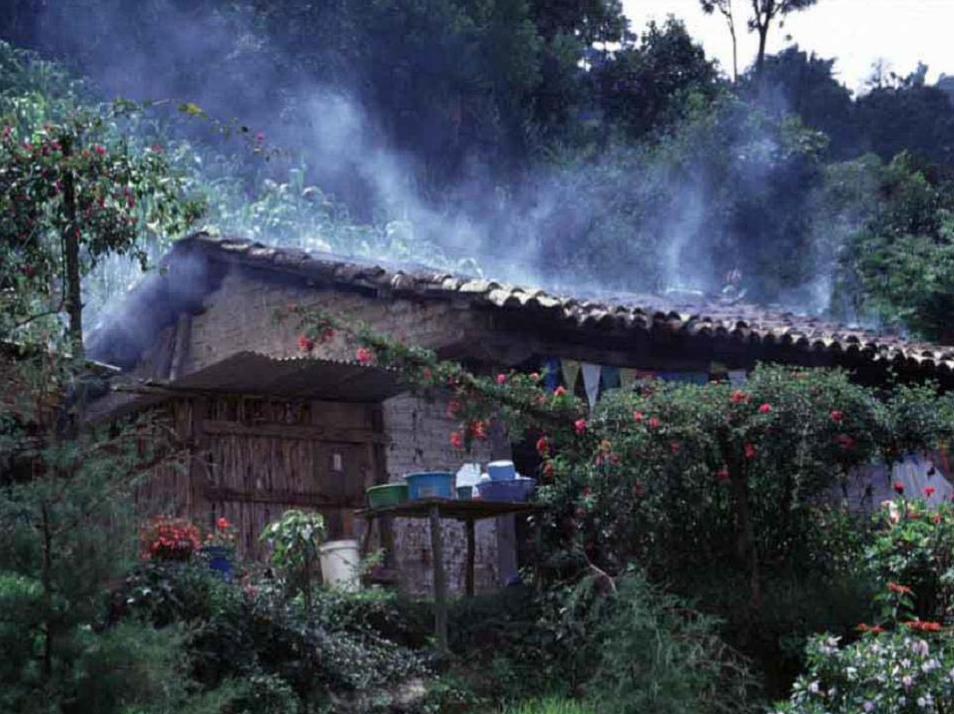
Cardiovascular Effects of Biomass Smoke:
A Randomized Stove Trial in Guatemala
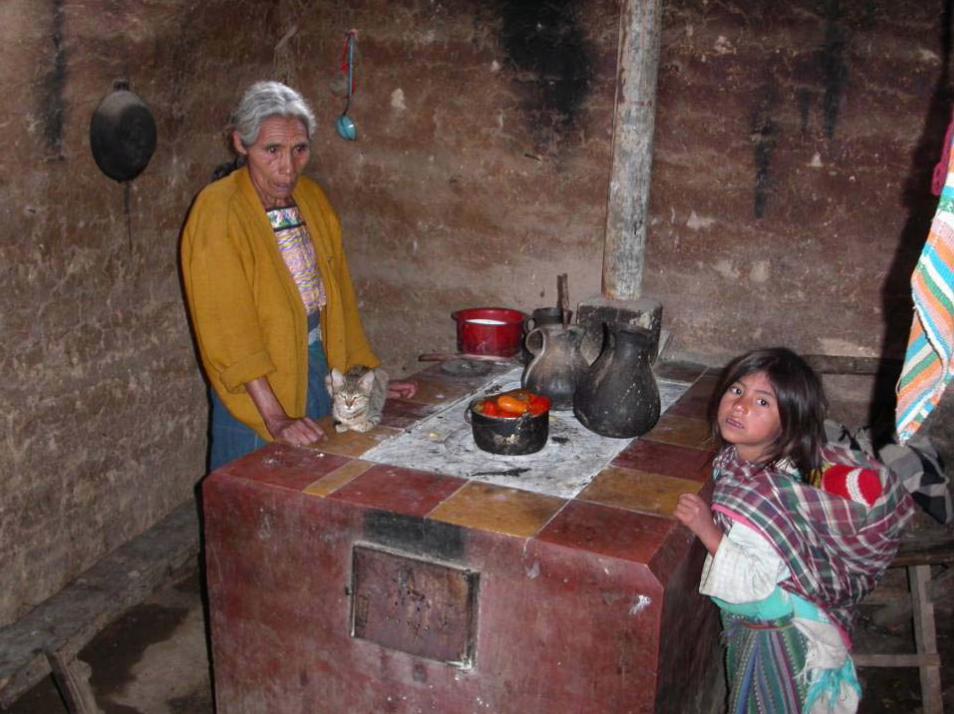
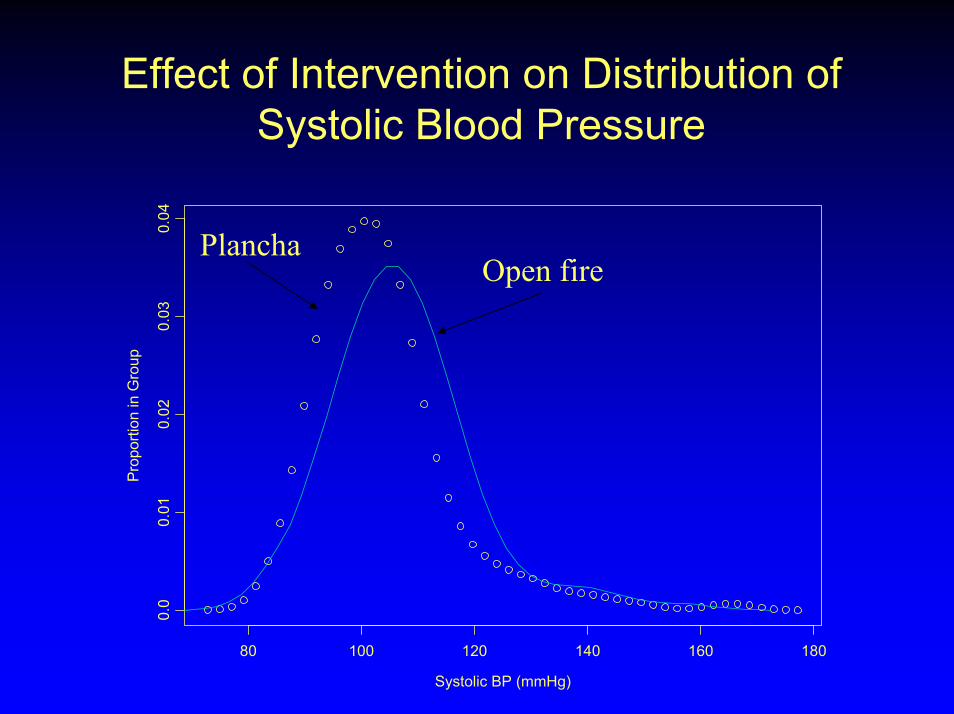
Effect of Intervention on Distribution of Systolic Blood Pressure
Systolic BP (mmHg)
Pro
porti
on in
Gro
up
80 100 120 140 160 180
0.0
0.01
0.02
0.03
0.04
PlanchaOpen fire
What happens if we Improve Air Quality?
Harvard School of Public Health
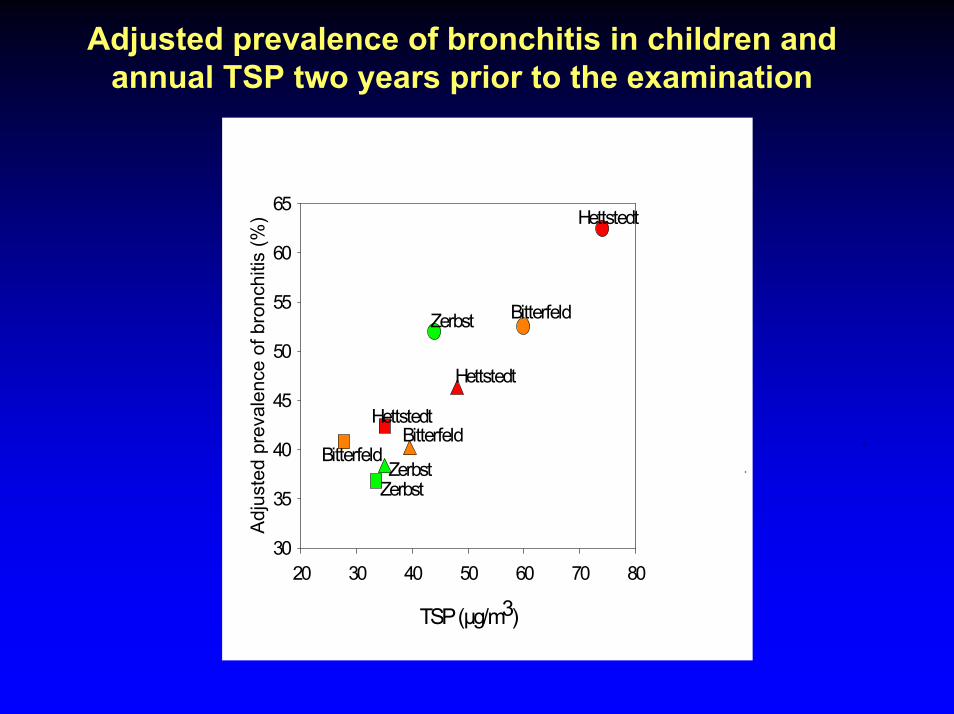
Adjusted prevalence of bronchitis in children andannual TSP two years prior to the examination
TSP (µg/m3)
20 30 40 50 60 70 80
Adj
uste
d pr
eval
ence
of b
ronc
hitis
(%)
30
35
40
45
50
55
60
65
Zerbst
ZerbstZerbst
Bitterfeld
BitterfeldBitterfeld
Hettstedt
Hettstedt
Hettstedt

Relative Risk of Death in Six US Cities during Two Follow-upPeriods
0.7
0.8
0.9
1
1.1
1.2
1.3
1.4
0 5 10 15 20 25 30 35PM2.5 µ/m3
Rate
Rat
io
W
LPT P
T WS
L
H
H
S