aims, scopes and methods
TRANSCRIPT
Eva lua t ing the Usage and Impact o f E-Journa ls in the UK – Page 1
CIBER
EVALUATING THE USAGE
AND IMPACT OF
E-JOURNALS IN THE UK
AIMS, SCOPE, METHODS AND RESEARCH CONTEXT
CIBER WORKING PAPER 1
February 2009
Eva lua t ing the Usage and Impact o f E-Journa ls in the UK – Page 2
CIBER
Table of Contents
1. Introduction ...............................................................................................................3
2. Aims and objectives .................................................................................................4
3. Scope, detail and definitions ...................................................................................5
a) Information seeking and usage...............................................................................5 b) Research community ..............................................................................................5
Researchers ............................................................................................................5
Type of research institution .....................................................................................7 Subject (department)...............................................................................................7
Case study departments .........................................................................................9
c) Journal platforms...................................................................................................10 d) Comparative and contextual data .........................................................................12
e) Outcomes, journal spend etc ................................................................................12
4. Methods ...................................................................................................................14
5. Research context ....................................................................................................16
6. Pilot and exploratory work .....................................................................................21
Sub-network analysis ................................................................................................21
7. References ...............................................................................................................23
Eva lua t ing the Usage and Impact o f E-Journa ls in the UK – Page 3
CIBER
1. Introduction
This working paper provides a description of the aims, scope and methodology
of the Research Information Network (RIN) funded project ‘Evaluating the
usage and impact of e-journals in the UK’. In order to provide build and context
for the RIN study a literature review has also been furnished, which focuses on
a detailed review of the results of two extremely relevant CIBER studies
(MaxData, an Institute of Museum and Library Services funded project1 and
Authors as Users, a study of ScienceDirect, funded by Elsevier2) and a briefer
review of the RIN funded Study on Researchers and Discovery Services3.
Journals were among the very first occupants of the virtual scholarly
information space, and having been there for well over a decade, are now well
entrenched in that space. Partly because of this and partly because of their
strong research credentials, they dominate the scholarly information and
publishing agenda (e.g. open access, institutional repositories, Big Deals, peer
review). It is therefore very timely to establish their impact on the UK research
community, in particular to determine what:
1. Generous and unprecedented levels of access to e-journals have led to in
terms of information seeking behaviour, usage and outcomes?
2. Digital journals have delivered in the way of identifiable and
measurable research outcomes?
Librarians and publishers clearly believe that increased and enhanced (24/7)
access to journals has benefited the research community enormously and
numerous user surveys attest to this fact (for instance see Tenopir et al, 2007).
However, what is lacking in terms of research is a joined-up, evidence-based
study that provides the detailed portrayal of information seeking behaviour
and usage of UK researchers that can only come from a deep log analysis of
usage data, which then can be related to research outputs, resource investment
and user opinion. This is precisely what the Research Information Network
project ‘Evaluating the usage and impact of e-journals in the UK’ sought to do.
There are two stages to the project. The first stage, conducted during January –
November 2008, constitutes the quantitative, mapping stage, the purpose of
which is to relate the information seeking behaviour and usage of researchers
to scholarly outputs and resource inputs. The second stage, the qualitative
1 http://web.utk.edu/~tenopir/maxdata/index.htm 2 http://www.publishing.ucl.ac.uk/authors.html 3 http://www.rin.ac.uk/researchers-discovery-services
Eva lua t ing the Usage and Impact o f E-Journa ls in the UK – Page 4
CIBER
stage, due to start March 2009, will seek to explain and provide context for the
data obtained in the quantitative stage. This paper covers the first stage.
2. Aims and objectives
The main aim of the first phase of the project is to:
i. establish how the provision of a major digital research resource – journals,
has shaped the information seeking behaviour and usage of UK
researchers in a variety of subjects and at a range of institutions
The secondary aims of the study are to:
ii. relate researcher information seeking behaviour and usage to a range of
downstream research outcomes (e.g. paper productivity and citations)
with the objective of discovering whether particular patterns of
information seeking were associated with research success and
represented good practice.
iii. investigate whether the level of the investment in journal provision was
influential in respect to information seeking behaviour and usage and
research outcomes.
iv. demonstrate what research leading on deep log analysis can offer in terms
of describing scholarly information seeking and usage and identifying
research outcomes..
With so much money, time and words spent on journals, it is important to
examine the information seeking behaviour and usage associated with them, if
only to determine whether the services providing access to journals are being
used in ways that publishers and librarians envisage. In the current data
vacuum, the topic is hardly ever mentioned and it is hoped that the results of
this project will start a debate that surely has to take place.
A ten-month study of this complexity could only be accomplished by focusing
on a number of case study institutions, journal platforms and subject fields.
Therefore, much and the work reported here should be regarded as exploratory
and pioneering.
Eva lua t ing the Usage and Impact o f E-Journa ls in the UK – Page 5
CIBER
3. Scope, detail and definitions
The project concerns actions (information seeking and usage) by a particular
user community (researchers) in respect to a particular resource (journals). This is
a key section as it defines the key concepts and terms employed.
a) Information seeking and usage
Deep log analysis provides a very high level of detail in respect to documenting
information seeking behaviour and use, and, significantly, does not rely on the
user’s memory. The precise details depend on the nature of the server logs and
in respect to this study the main characteristics of information seeking and
usage studied were:
o levels of usage (e.g. page views, sessions conducted, time online) and
patterns of usage (e.g. time of day, day of the week, month of the year);
o navigational behaviour (e.g. gateway use, searching or browsing; use of
advanced search, use of Google)
o content viewed (e.g. full-text, review articles and abstracts, age of articles);
o journals viewed (e.g. rank and concentration of use)
Logs on their own do not provide direct evidence of satisfaction or success (that
is the province of questionnaires and interviews) but they do provide indirect
evidence, which can provide pointers for questioning users later. Thus the fact
that a service was used would indicate it was helpful in some way and the
greater the use the more helpful it was likely to be (hence the value of site
penetration metric). For more information on usage metrics see Nicholas et al
(2008a).
b) Research community
Researchers
Logs do not generally identify individuals, just computers, and sometimes not
even one computer; what they provide is a user trace. (Although this was
possible in the case of the Authors and Users study reviewed in the research
context section). This presents a problem in the case of the universities, but not
Eva lua t ing the Usage and Impact o f E-Journa ls in the UK – Page 6
CIBER
the Government laboratories, because the focus of the research was the research
community and there was a need to filter out student and teaching use. By
choosing research active institutions, of course, the problem was reduced.
However, researchers in case study institutions were broadly and roughly
identified. In some ways that was just as well as publishers, because of privacy
concerns and COUNTER compliancy, would be unwilling to share their data
otherwise.
Filtering out student use is really only possible if student computers can be
identified through sub-network identification and this proved possible in the
SuperBook (Nicholas et al, 2007a) and OhioLINK (Nicholas et al, 2007b) studies.
For it to work universities have to employ persistent, meaningful and specific
sub-network labels. However, an exploratory investigation showed that, with
the exception of Manchester, this could not be done with any degree of
accuracy, and even in the case of Manchester the accuracy was still wanting.
Even if a sub-net analysis had been possible there would still be problems:
1. There was a risk that PhD students would have been excluded as they
are likely to be big library users and reside in halls of residence (sub-
network labels that would have been excluded in order to remove
student use).
2. Postgraduate dissertations are generally heavily researched and
information seeking behaviour associated with that activity would have
been excluded if a student filter had been employed.
Of course, the choice of journals as the information resource to be investigated
meant inevitably that a student (course work) information seeking filter was
partly being introduced anyway. Elsevier believe that researchers are
ScienceDirect’s key constituency. This was also confirmed by an exploratory
sub-network analysis conducted at the University of Manchester, which
showed that student usage is relatively low (see Section 6).
There are greater difficulties in distinguishing between journal usage associated
with teaching and research in the case of university staff that have teaching
responsibilities - research often informs teaching and teaching is usually
conducted in areas of research. Furthermore, even pure researchers, like
Eva lua t ing the Usage and Impact o f E-Journa ls in the UK – Page 7
CIBER
research fellows and PhD students teach. Furthermore, staff in research active
universities and departments were clearly likely to undertake more research.
Type of research institution
Given the time confines of the research project it was not possible to investigate
the information seeking and usage of researchers from all kinds of research
institutions in the UK. Commercial organizations were excluded. As regard the
rest there was a need to look at both universities and Government research
laboratories – the latter a much neglected research community. In respect to
universities, because researchers were the object of the study, it was the
research active ones that we were mainly interested in. Research active was
defined as having a case study department (see following section) with a rating
of 4 or more according to RAE 2001.
Subject (department)
Subject selection is a far more difficult issue as studies show that scholarly
information behaviour varies, sometimes dramatically, between subject
disciplines (Nicholas et al, 2008). It follows therefore that decisions about which
subjects to include in the study were critically important if the findings were to
prove representative of UK research. In order to produce a systematic and
realistic sample that would stand scrutiny a technique called `subject
fingerprinting’, which applies clustering techniques to large collections of
scholarly behavioural and attitudinal data, was employed. A summary
database was constructed that consolidated information from the CIBER author
survey, the Elsevier Core Trends dataset, and bibliometric data from ISI’s
Journal Citation Report (JCR). This set included data on self-reported behaviour
across a wide range of issues: from how often researchers consult publishers’
web sites, to the value they place on alerting services; from the reliance they
place on Google, to the place that physical libraries still have in their day-to-day
work. The database also included attitudes and perceptions: what they thought
about open access business models or how much they value and respect peer
review. Bibliometric data were also included, and this offered clues as to the
dynamics of each disciplinary group: how fast-moving, how much value is
placed on the historic archive of older papers, how relatively tight or diverse
the research community.
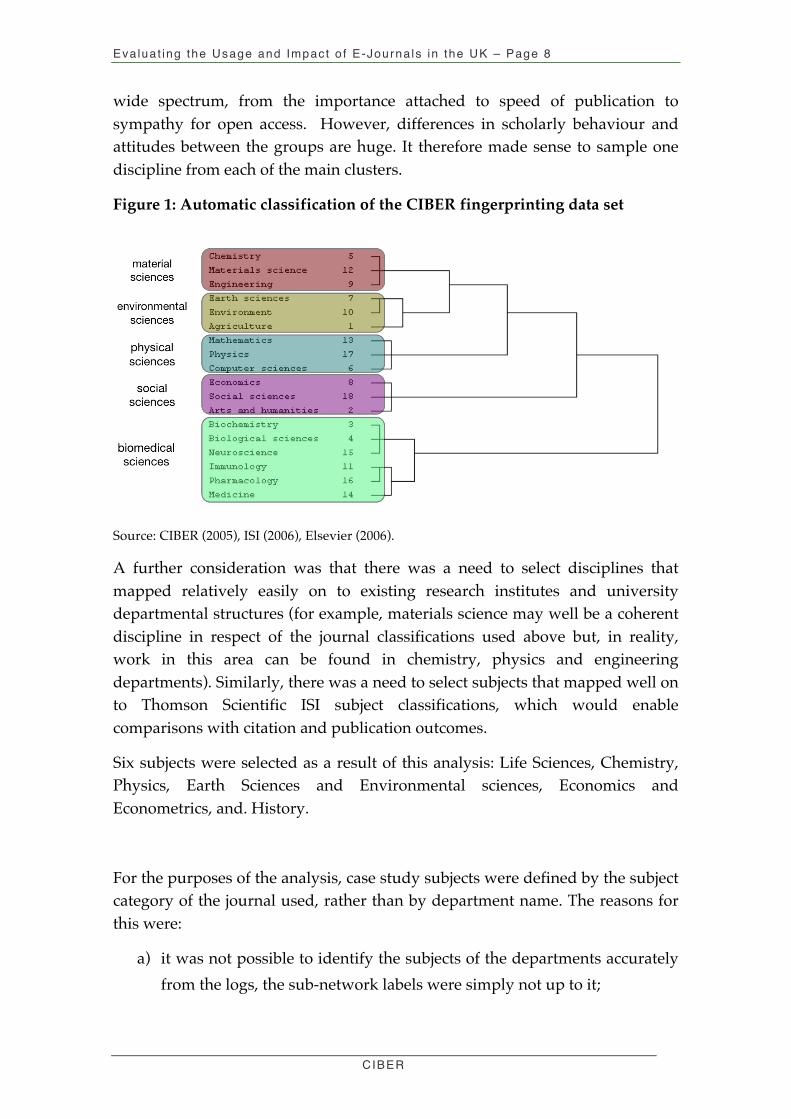
The five main clusters derived (Figure 1) were statistically very distinct: within
each group, there is much less variation: in behaviour and attitudes across a
Eva lua t ing the Usage and Impact o f E-Journa ls in the UK – Page 8
CIBER
wide spectrum, from the importance attached to speed of publication to
sympathy for open access. However, differences in scholarly behaviour and
attitudes between the groups are huge. It therefore made sense to sample one
discipline from each of the main clusters.
Figure 1: Automatic classification of the CIBER fingerprinting data set
Source: CIBER (2005), ISI (2006), Elsevier (2006).
A further consideration was that there was a need to select disciplines that
mapped relatively easily on to existing research institutes and university
departmental structures (for example, materials science may well be a coherent
discipline in respect of the journal classifications used above but, in reality,
work in this area can be found in chemistry, physics and engineering
departments). Similarly, there was a need to select subjects that mapped well on
to Thomson Scientific ISI subject classifications, which would enable
comparisons with citation and publication outcomes.
Six subjects were selected as a result of this analysis: Life Sciences, Chemistry,
Physics, Earth Sciences and Environmental sciences, Economics and
Econometrics, and. History.
For the purposes of the analysis, case study subjects were defined by the subject
category of the journal used, rather than by department name. The reasons for
this were:
a) it was not possible to identify the subjects of the departments accurately
from the logs, the sub-network labels were simply not up to it;
Eva lua t ing the Usage and Impact o f E-Journa ls in the UK – Page 9
CIBER
b) it would allow for the existence of documentary scatter, whereby a good
proportion of departmental publications appear in journals outside the
subject of the researcher’s home department because of widespread
collaborative and problem-driven research;
c) the subject scatter of usage we have observed in previous CIBER
investigations would be allowed for – this scatter arises from the blurring
of disciplines; partly for the reason stated above, that the nature of
research is changing, partly as a result of the primacy of multi-
disciplinary information platforms like ScienceDirect.
d) it would add additional value to the citation analysis. It would be
feasible, by using journal impact factor as the key metric, to quality
profile and compare both an institution’s reading and publishing
behaviour in a given subject.
Case study departments
Taking together the institutional and subject requirements of the project, the
following ten institutions were selected: 1) Centre for Ecology and Hydrology -
CEH; 2) Rothamsted Research (Agricultural Research Centre); 3) University
College London; 4) University of Aberdeen; 5) University of Bangor; 6)
University of Cambridge; 7) University of Edinburgh; 8) University of
Manchester; 9) University of Strathclyde; 10) University of Swansea.
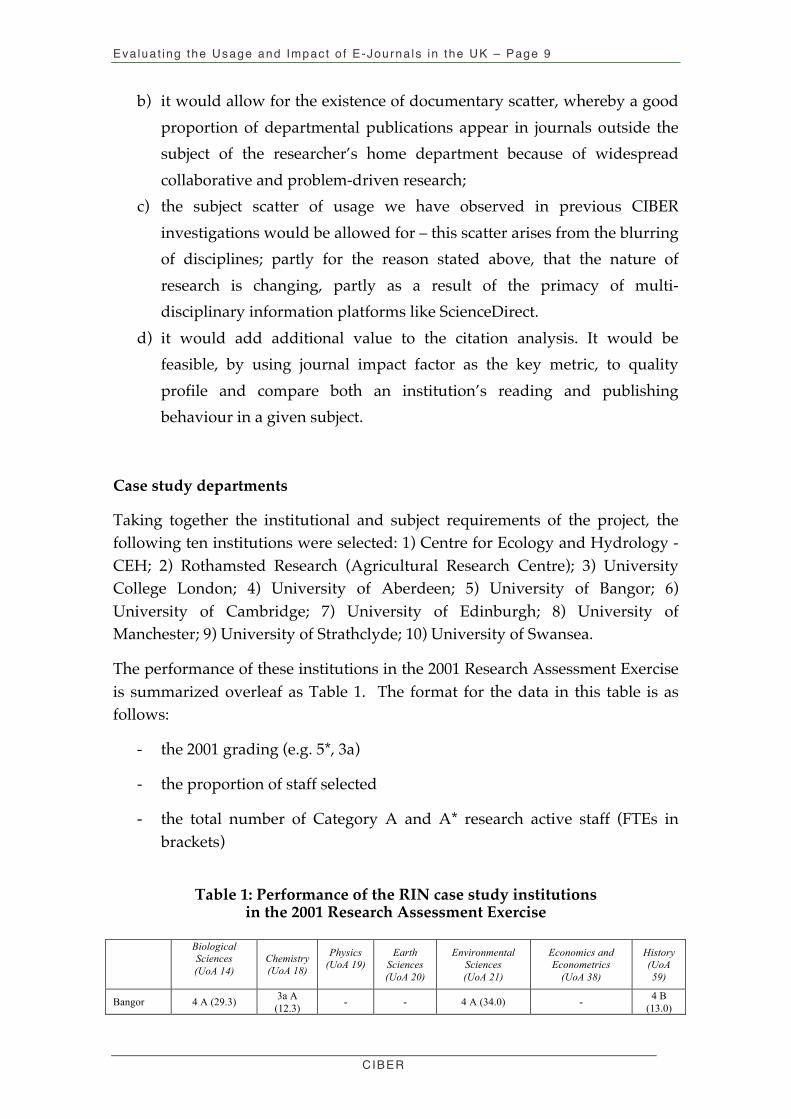
The performance of these institutions in the 2001 Research Assessment Exercise
is summarized overleaf as Table 1. The format for the data in this table is as
follows:
- the 2001 grading (e.g. 5*, 3a)
- the proportion of staff selected
- the total number of Category A and A* research active staff (FTEs in
brackets)
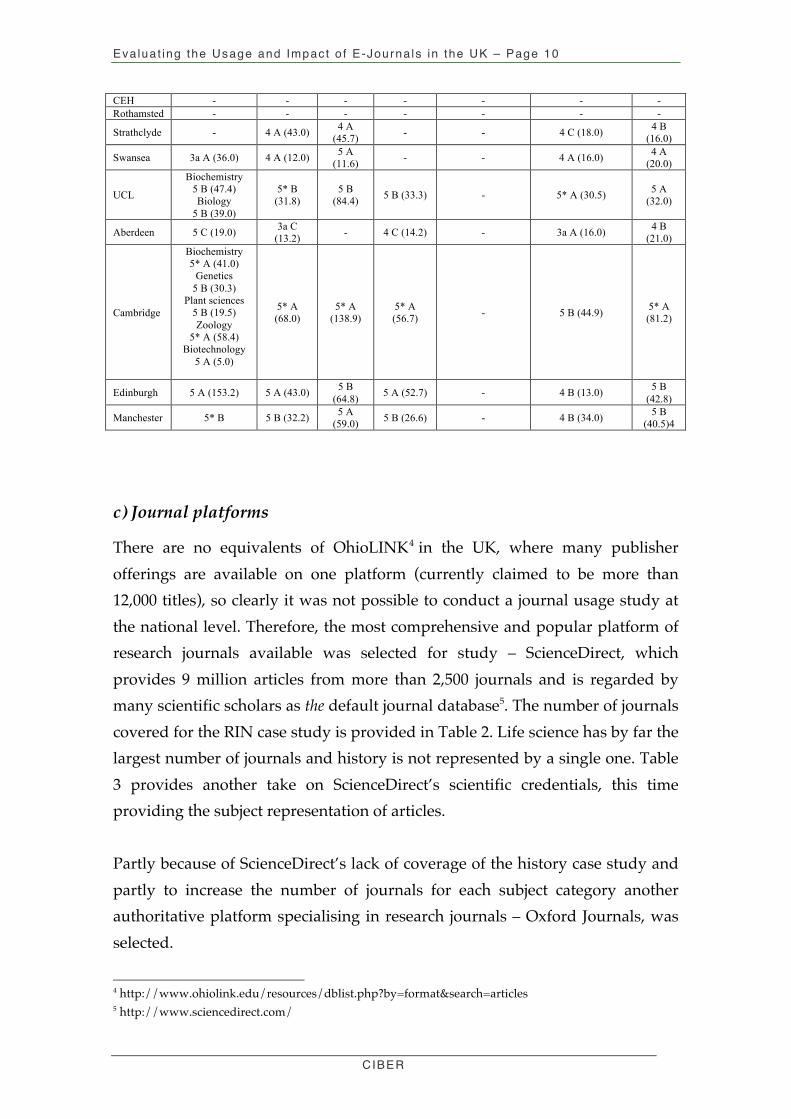
Table 1: Performance of the RIN case study institutions
in the 2001 Research Assessment Exercise
Biological
Sciences
(UoA 14)
Chemistry
(UoA 18)
Physics
(UoA 19)
Earth
Sciences
(UoA 20)
Environmental
Sciences
(UoA 21)
Economics and
Econometrics
(UoA 38)
History
(UoA
59)
Bangor 4 A (29.3) 3a A
(12.3) - - 4 A (34.0) -
4 B
(13.0)
Eva lua t ing the Usage and Impact o f E-Journa ls in the UK – Page 10
CIBER
CEH - - - - - - -
Rothamsted - - - - - - -
Strathclyde - 4 A (43.0) 4 A
(45.7) - - 4 C (18.0)
4 B
(16.0)
Swansea 3a A (36.0) 4 A (12.0) 5 A
(11.6) - - 4 A (16.0)
4 A
(20.0)
UCL
Biochemistry
5 B (47.4)
Biology
5 B (39.0)
5* B
(31.8)
5 B
(84.4) 5 B (33.3) - 5* A (30.5)
5 A
(32.0)
Aberdeen 5 C (19.0) 3a C
(13.2) - 4 C (14.2) - 3a A (16.0)
4 B
(21.0)
Cambridge
Biochemistry
5* A (41.0)
Genetics
5 B (30.3)
Plant sciences
5 B (19.5)
Zoology
5* A (58.4)
Biotechnology
5 A (5.0)
5* A
(68.0)
5* A
(138.9)
5* A
(56.7) - 5 B (44.9)
5* A
(81.2)
Edinburgh 5 A (153.2) 5 A (43.0) 5 B
(64.8) 5 A (52.7) - 4 B (13.0)
5 B
(42.8)
Manchester 5* B 5 B (32.2) 5 A
(59.0) 5 B (26.6) - 4 B (34.0)
5 B
(40.5)4
c) Journal platforms
There are no equivalents of OhioLINK4 in the UK, where many publisher
offerings are available on one platform (currently claimed to be more than
12,000 titles), so clearly it was not possible to conduct a journal usage study at
the national level. Therefore, the most comprehensive and popular platform of
research journals available was selected for study – ScienceDirect, which
provides 9 million articles from more than 2,500 journals and is regarded by
many scientific scholars as the default journal database5. The number of journals
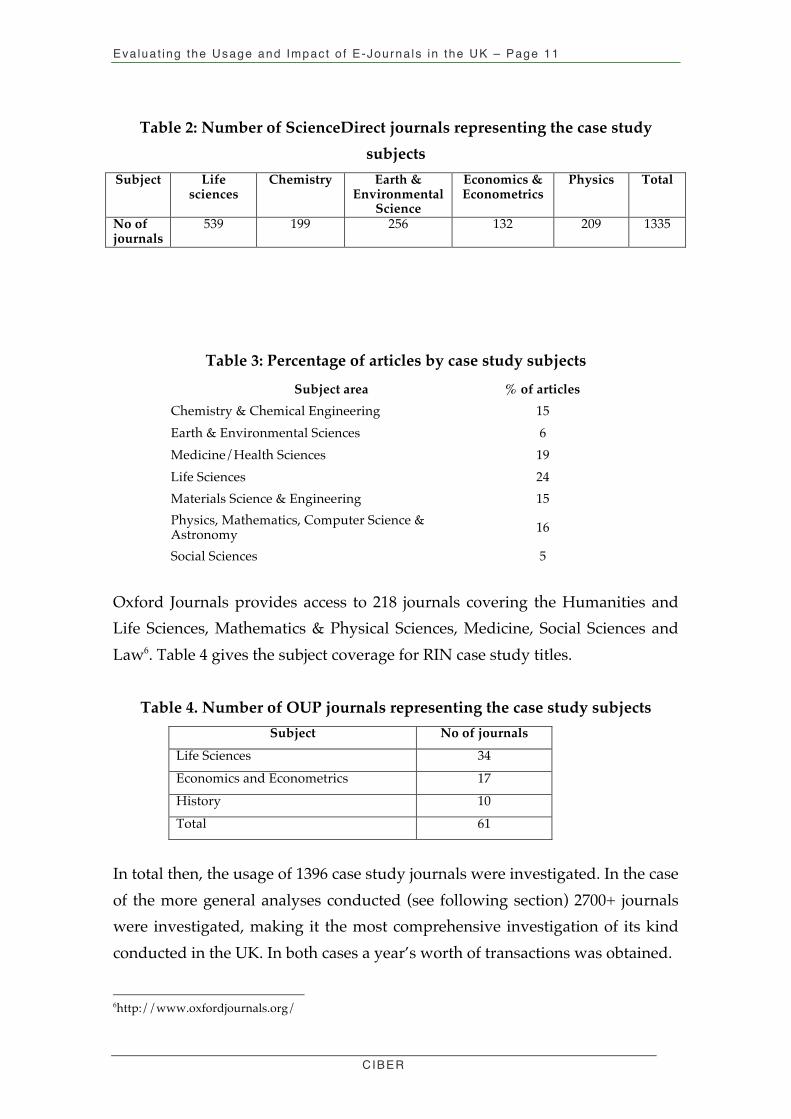
covered for the RIN case study is provided in Table 2. Life science has by far the
largest number of journals and history is not represented by a single one. Table
3 provides another take on ScienceDirect’s scientific credentials, this time
providing the subject representation of articles.
Partly because of ScienceDirect’s lack of coverage of the history case study and
partly to increase the number of journals for each subject category another
authoritative platform specialising in research journals – Oxford Journals, was
selected.
4 http://www.ohiolink.edu/resources/dblist.php?by=format&search=articles 5 http://www.sciencedirect.com/
Eva lua t ing the Usage and Impact o f E-Journa ls in the UK – Page 11
CIBER
Table 2: Number of ScienceDirect journals representing the case study
subjects
Subject Life sciences
Chemistry Earth & Environmental
Science
Economics & Econometrics
Physics Total
No of journals
539 199 256 132 209 1335
Table 3: Percentage of articles by case study subjects
Subject area % of articles
Chemistry & Chemical Engineering 15
Earth & Environmental Sciences 6
Medicine/Health Sciences 19
Life Sciences 24
Materials Science & Engineering 15
Physics, Mathematics, Computer Science & Astronomy 16
Social Sciences 5
Oxford Journals provides access to 218 journals covering the Humanities and
Life Sciences, Mathematics & Physical Sciences, Medicine, Social Sciences and
Law6. Table 4 gives the subject coverage for RIN case study titles.
Table 4. Number of OUP journals representing the case study subjects
Subject No of journals
Life Sciences 34
Economics and Econometrics 17
History 10
Total 61
In total then, the usage of 1396 case study journals were investigated. In the case
of the more general analyses conducted (see following section) 2700+ journals
were investigated, making it the most comprehensive investigation of its kind
conducted in the UK. In both cases a year’s worth of transactions was obtained.
6http://www.oxfordjournals.org/
Eva lua t ing the Usage and Impact o f E-Journa ls in the UK – Page 12
CIBER
Of course, by examining two publishers’ logs we are not witnessing everything
the scholar did during an Internet session in connection with their research.
What we are in fact witnessing is what occurs during a particular site visit.
Therefore, we are only shining the torch on a part of journal information
seeking and usage related to research activity. Whereas, in the case of the
OhioLINK study, of course, because all publishers were represented on the
platform, a fairly comprehensive view of the information seeking and usage
related to research activity could be obtained.
d) Comparative and contextual data
As mentioned earlier the study has to be regarded as exploratory in that we were
not studying a statistically representative sample of UK research institutions or
researchers – there are after all several hundred of them containing many
thousands of researchers who are studying dozen of diverse subjects. What we
have produced instead is data from scholars from six representative subject
fields in eleven institutions who have engaged with the two research resource
platforms during 2007. However, conscious of the need to contextualise these
data and because outcome and investment data (see next section) sometimes
can only be matched at the institutional (and not subject level), a top-line (full-
text download) analysis was undertaken for all UK universities and
government laboratories using the two journal platforms.
e) Outcomes, journal spend etc
The aim of this stage of the research is to explore possible relationships between
group productivity, research outcomes and measurable aspects of information
behaviour.
Work is ongoing to create subject-level productivity and citation impact metrics
for each of the case study institutions. These are being compared with a range
of information behaviour indicators obtained from the deep log analysis (e.g.
levels of activity, search/navigational approach).
Online techniques (using Scopus and ISI) are being used to capture publications
lists for each subject/institution for the period 2006-2008 and this data will
generate production curves (cumulative authors vs. cumulated papers) for each
Eva lua t ing the Usage and Impact o f E-Journa ls in the UK – Page 13
CIBER
institution as well as for the discipline as a whole. This will facilitate a simple
visualization of the group productivity of each institution relative to its
disciplinary norm. From those curves we can also generate a single indicator, a
Herfindhal index, that summarises an institution’s relative productivity in a
particular discipline: a value of 100 would mean that performance is completely
average for the discipline: 120 that it is 20% more productive, and so on.
Citation impact is being measured using another new CIBER concept: the
virtual impact factor. What this means is that we will treat the entire subject
output of an institution as though it were a `virtual journal’ in its own right,
thus enabling easy comparison with the discipline. This data will again be
presented as an index, with 100 representing average citation performance for
the discipline. The way these indicators are constructed mean that valid
comparisons can be made between different disciplines.
The findings of this work package will be exploratory in nature. We will use
graphical techniques (such as clustering and correspondence analysis) to bring
the data to life visually. The limitations of data collection mean that, in the
strictest sense, the findings of this package will not be statistically valid across
the whole of the UK, but they will nevertheless be very useful in terms of
starting to investigate what relationships there might be between how
researchers use online journals and the value that this brings to their research.
It will certainly raise issues and questions for the qualitative research strand.
This would enable us to begin answering the question that is on so many
people’s lips: whether top flight research groups use e-journals differently (for
example lower bouncing rates, longer session averages).
The relationship between library spending on journals and use is an important
issue, but one that is plagued by practical problems in data collection and
interpretation7. We have attacked this question by mining secondary data from
HESA, SCONUL and LISU. Elsevier has provided us with indexed data on
2007 use by UK institutions based on full-text downloads, and this has enabled
some very interesting modeling of the relationships between journal
expenditures, journal use and `downstream’ measures of research impact as
indicated, inter alia, by numbers of PhD completions, success in attracting
research grant and contract income, and total QR income at the institutional
level. The fit of the correlation models we have developed is excellent and there
appears to be some support for the hypothesis that journal spending and
research outcomes are tightly geared. The direction of this relationship is very
7 See, for example, Shepherd, P., COUNTER: Usage statistics for performance measurement. Performance Measurement and Metrics 7(3), 2006, pp142-152.
Eva lua t ing the Usage and Impact o f E-Journa ls in the UK – Page 14
CIBER
difficult to establish, but we are currently working on similar usage data from
OUP (and Blackwell data have been promised) so that we can see whether these
relationships persist with a broader range of usage indicators.
4. Methods
Only deep log analysis (DLA) can provide detailed profiles of information
seeking and usage. DLA, an evidence based methodology, also provides the
reach, robustness and the user attribution required by the study. DLA works
with raw server logs. These logs are records of actual web pages viewed. These
records occur as a result of requests made by the clients’ computer and provide
a record of pages delivered from the web server to the clients’ computer. The
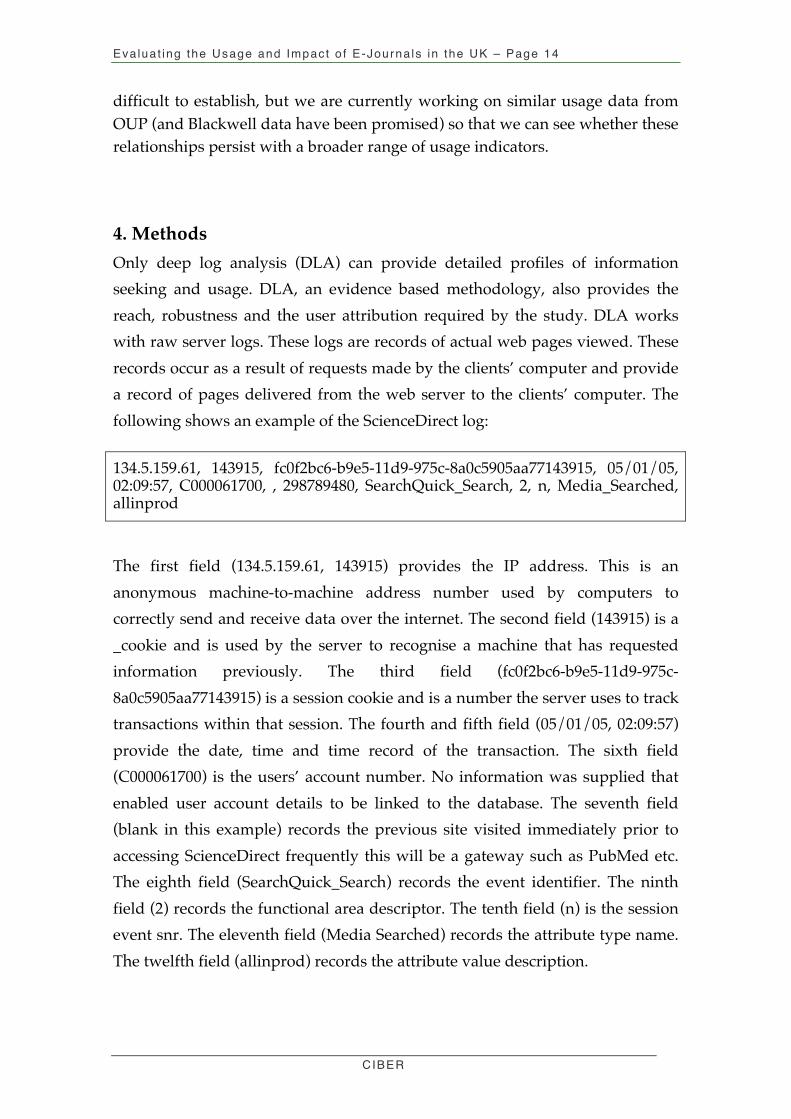
following shows an example of the ScienceDirect log:
134.5.159.61, 143915, fc0f2bc6-b9e5-11d9-975c-8a0c5905aa77143915, 05/01/05, 02:09:57, C000061700, , 298789480, SearchQuick_Search, 2, n, Media_Searched, allinprod
The first field (134.5.159.61, 143915) provides the IP address. This is an
anonymous machine-to-machine address number used by computers to
correctly send and receive data over the internet. The second field (143915) is a
_cookie and is used by the server to recognise a machine that has requested
information previously. The third field (fc0f2bc6-b9e5-11d9-975c-
8a0c5905aa77143915) is a session cookie and is a number the server uses to track
transactions within that session. The fourth and fifth field (05/01/05, 02:09:57)
provide the date, time and time record of the transaction. The sixth field
(C000061700) is the users’ account number. No information was supplied that
enabled user account details to be linked to the database. The seventh field
(blank in this example) records the previous site visited immediately prior to
accessing ScienceDirect frequently this will be a gateway such as PubMed etc.
The eighth field (SearchQuick_Search) records the event identifier. The ninth
field (2) records the functional area descriptor. The tenth field (n) is the session
event snr. The eleventh field (Media Searched) records the attribute type name.
The twelfth field (allinprod) records the attribute value description.
Eva lua t ing the Usage and Impact o f E-Journa ls in the UK – Page 15
CIBER
The raw log files were loaded into SPSS (Software Package for Social Sciences)
for analysis.
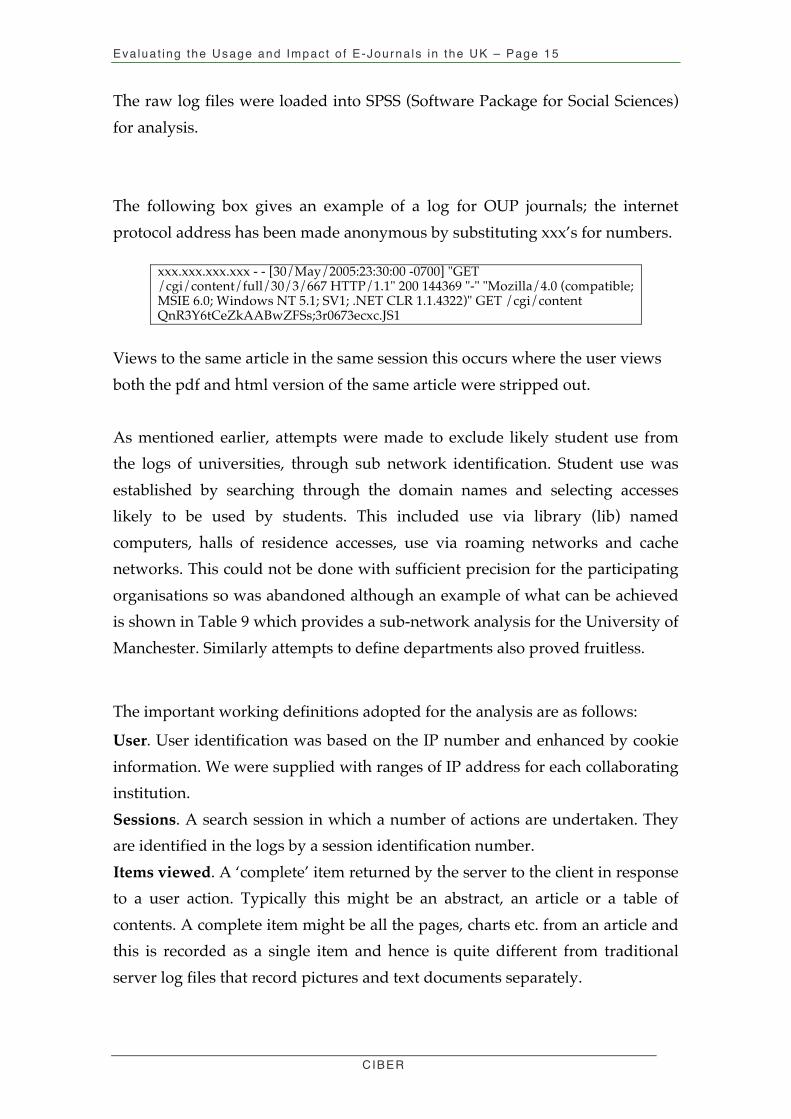
The following box gives an example of a log for OUP journals; the internet
protocol address has been made anonymous by substituting xxx’s for numbers.
xxx.xxx.xxx.xxx - - [30/May/2005:23:30:00 -0700] "GET /cgi/content/full/30/3/667 HTTP/1.1" 200 144369 "-" "Mozilla/4.0 (compatible; MSIE 6.0; Windows NT 5.1; SV1; .NET CLR 1.1.4322)" GET /cgi/content QnR3Y6tCeZkAABwZFSs;3r0673ecxc.JS1
Views to the same article in the same session this occurs where the user views
both the pdf and html version of the same article were stripped out.
As mentioned earlier, attempts were made to exclude likely student use from
the logs of universities, through sub network identification. Student use was
established by searching through the domain names and selecting accesses
likely to be used by students. This included use via library (lib) named
computers, halls of residence accesses, use via roaming networks and cache
networks. This could not be done with sufficient precision for the participating
organisations so was abandoned although an example of what can be achieved
is shown in Table 9 which provides a sub-network analysis for the University of
Manchester. Similarly attempts to define departments also proved fruitless.
The important working definitions adopted for the analysis are as follows:
User. User identification was based on the IP number and enhanced by cookie
information. We were supplied with ranges of IP address for each collaborating
institution.
Sessions. A search session in which a number of actions are undertaken. They
are identified in the logs by a session identification number.
Items viewed. A ‘complete’ item returned by the server to the client in response
to a user action. Typically this might be an abstract, an article or a table of
contents. A complete item might be all the pages, charts etc. from an article and
this is recorded as a single item and hence is quite different from traditional
server log files that record pictures and text documents separately.
Eva lua t ing the Usage and Impact o f E-Journa ls in the UK – Page 16
CIBER
Metrics are compromised by caching. This occurs when the client views
previously requested pages from the cache on their computer. Caching is the
storing of previously viewed pages on to the client’s computer; repeat in-
session accesses to these pages are made from the cache and are not requested
from the web site’s server and hence not recorded in the logs. This impacts on
views as a result of backward navigation. Caching results in the underreporting
of the number of pages viewed, which also impacts on number of views in a
session calculation.
5. Research context
Two CIBER studies (MaxData, an Institute of Museum and Library Services
funded project8 and Authors as Users, a study of ScienceDirect, funded by
Elsevier9) and the RIN funded Study on Researchers and Discovery Services10
provide an important context for the study. The most recent and directly
relevant study was the MaxData study (Nicholas et al, 2006b), which sought to
develop and test methods, which would help university librarians evaluate
their journal usage. The study focused on four American universities, a mixture
of research and teaching, and large and big ones. The study employed both
quantitative and qualitative methods. The quantitative part consisted of a deep
log analysis of journal usage over 15 months on the OhioLINK platform.
Altogether 339,000 sessions conducted. The most interesting finding was the
differences found between information seeking and use in teaching and
research universities, which was largely a function of research activity and the
size of the academic community. Significantly, the two research active
universities in the sample did not record long session times or had particularly
busy sessions (those viewing many pages), behaviour appeared to be much
more focussed – relatively low use of abstracts, fewer journals viewed in a
session and search pages support this connection. The most research active
university also recorded the highest percentage of: a) views to current journals;
8 http://web.utk.edu/~tenopir/maxdata/index.htm 9 http://www.publishing.ucl.ac.uk/authors.html 10 http://www.rin.ac.uk/researchers-discovery-services
Eva lua t ing the Usage and Impact o f E-Journa ls in the UK – Page 17
CIBER
b) browsing sessions; c) sessions which saw the advanced search facility used; d)
pages that were articles.
Analyses were available for 5 subjects that could be associated to the RIN case
study fields - Business and Economics, Chemistry, Earth Sciences, Life Sciences
and Physics. Health and Medicine journals recorded the highest number of
page views. Chemistry came a long second. Users of Physics journals conducted
the most active sessions – 37% of session saw 11 or more pages viewed.
Business and Economics (28%) recorded the highest proportion of bouncers –
visitors who only used a single page. Contrast that to the bouncer rate (13%) for
Physics. In terms of session time those viewing Social Science journals recorded
the longest session times, with 31% lasting over fifteen minutes. Physics
journals were also viewed for relatively long times, 30% lasting over 15 minutes.
Physics recorded the highest average (median) page view time of 25 seconds. In
terms of article and abstract viewing, Chemistry and Life Sciences recorded the
longest article view times, respectively, 77 and 73 seconds; Business and
Economics (49 seconds) saw some of the shortest article view time. Abstract
reading time also varied across subjects with Physics (32 seconds) having the
longest times.
With regard to type of journal content viewed in a session, those viewing
Physics titles were proportionately more likely just to view abstracts (22%) and
articles and abstracts (38%). Over three quarters of users viewing Health and
Medicine pages just viewed articles. In terms of navigation those people
viewing Earth Science, Physics and Social Science titles made greater use of the
search facility and those viewing Chemistry titles were more likely to use
alphabetical/subject lists.
The questionnaire study, which employed a critical incident methodology, shed
light on the outcomes that arose as a result of reading a journal article.
Significantly, only one person described their reading as not helpful, all the
other respondents resulted in positive outcomes. Article reading lead to many
outcomes but, interestingly, inspiration turned out to be the main outcome,
with over half of respondents citing this outcome.
Eva lua t ing the Usage and Impact o f E-Journa ls in the UK – Page 18
CIBER
The Authors as Users project (Nicholas et al, 2008a) is of great relevance
because it examined log use of ScienceDirect and undertook subject
comparisons. The aim of the project was to obtain a comprehensive and
detailed understanding of the virtual scholar by linking together an Elsevier-
produced author survey about attitudes towards scholarly publishing activities
with their use of ScienceDirect. Seven hundred and fifty of the authors who
filled in the questionnaire were matched with accuracy to the logs. The study is
especially important because it covered researchers. Logs were collected for an
eighteen month period and during this time the authors conducted 16,865
sessions. There were very real differences between authors in regard to their
subject field. In regard to the RIN case study subjects, which were identically
identified the following was found:
• Life Sciences. Recorded: a) the highest article views; b) the lowest views to
the journal homepages; c) the highest views to both PDF & Full-text
articles in the same session; d) the lowest views to articles in print; e) the
highest rate of views to regular articles (based on journal subject); f) the
highest views to declining articles (based on journal subject); g) the
highest rate of sessions recording one page views; h) the highest
proportion of sessions recording over 20 views; i) the highest proportion
of sessions recording an abandoned search.
• Chemistry: Recorded: a) the lowest rate of views to search pages; b) the
highest rate of views to journal list pages; c) the lowest rate of abstract
views; d) the highest rate of PDF views; d) the lowest rate of views to
current articles (based on journal subject); e) the highest rate of sessions
with 11-20 views; f) the highest rate of sessions with 5-10 searches; g) the
lowest rate of dropped searches; h) the highest rate of searches with 51
and over returned hits.
• Physics. Recorded; a) the highest views to main homepages; b) the lowest
rate of full-text views; c) the lowest views to current articles; d) the highest
views to old articles (based on user subject), e) the highest number of
sessions with views to 2-4 and 4-10 unique journals, f) the lowest number
of sessions with one page views; g) the highest with 6-15 page views; h)
the highest number of searches with 10-50 returned hits;
Eva lua t ing the Usage and Impact o f E-Journa ls in the UK – Page 19
CIBER
• Earth and Environmental Sciences. Recorded: a) the lowest views to
journal list pages; b) the highest full-text views; c) the highest views to old
articles (based on journal subject); d) the lowest number of sessions where
one page was viewed; e) the lowest number of cases where searches were
dropped; g) the lowest number of searches with 1-2 returned hits; h) the
highest average number of articles viewed.
• Economics and Econometrics. Recorded: a) the lowest views to article list
and journal list pages; b) the highest views to journal issue pages; c) the
highest abstract views; d) the highest rate of articles in print viewed
(based on journal subjects); e) the lowest rate of articles in print viewed
(based on user subject); e) the highest views to current articles; f) the
lowest views to old articles (based both on user and journal subject); g) the
highest number of sessions with over 20 views; h) the lowest number of
sessions with views to over 20 unique journals; i) the highest number of
sessions with one search conducted and the lowest number of sessions
with 5 and over searches; j) the highest number of searches with zero hits
returned and the lowest number of searches with 3-10 returned hits; k) the
lowest average number of article viewed.
Making comparisons between the two sets of findings is problematic given the
fact that:
a) The Ohio study covered a much larger and more diverse population of
journals;
b) There were differences in the scope of the subject groupings employed;
c) Most of the subject groupings employed in the ScienceDirect study were
based on user selected categories, while for Ohio subjects were based on
journal subject categories;
d) The logs were slightly different, which gave rise to slightly different
metrics (navigational options, for instance);
e) The OhioLINK service was a popular student resource, whereas
ScienceDirect’s scientific bias inevitably means its main constituency is
researchers;
f) The OhioLINK study concerned just scholars from Ohio, whereas the
ScienceDirect one was international in scope;
g) The two platforms were different in design and architecture.
Eva lua t ing the Usage and Impact o f E-Journa ls in the UK – Page 20
CIBER
Not surprisingly then the two studies came up with different findings. Thus, for
instance, Business and Economics users recorded the highest rate of abstract
views in the ScienceDirect study, but their use of abstracts were one of the
lowest in the Ohio study. Nevertheless, where comparison was possible, the
two studies lent support for each other in the following areas:
a) Chemistry users in both studies made low use of search facilities; they
tended to be browsers. Thus in the case of ScienceDirect, Chemistry users
recorded the lowest views to search pages and the highest views to the
journal and article lists. For the Ohio study Chemistry users recorded the
lowest use of search and highest use of the alphabetical list.
b) Life Science users made relatively low use of abstracts.
c) Physicists record the highest percent of ‘busy’ sessions – those recording
over 20 views.
The RIN study Researchers and discovery services was a relatively small scale
qualitative study of less than 500 UK researchers. Most of the data came from
telephone interviews. Thirty-seven percent of interviewees regarded themselves
as being interdisciplinary and were treated as a separate subject group, which is
perhaps surprising. The rest were classified by very broad subject field –
physical science, life sciences, social sciences and arts and humanities.
Inevitably, a study ranging so widely and employing these methods could only
come up with very general findings:
o articles were the most relied upon source for research: 96% of
interviewees looked for journal articles during the course of research,
with 71% ranking them as the important resource.
o life and physical sciences researchers made more use of general
search engines and less use of library browsing; arts and humanities
researchers made less use of services such as citation indexes and
bibliographic/A&I databases
o social science researchers shared some of the traits of both sciences
and arts and humanities researchers: they were users of citation
indexes and bibliographic services, and also of library services and
facilities.

Eva lua t ing the Usage and Impact o f E-Journa ls in the UK – Page 21
CIBER
ScienceDirect and OUP journals were covered by the study and listed under the
heading large e-journal collections. However, the Report just lists them and no
analysis regarding them is provided.
6. Pilot and exploratory work
Sub-network analysis
Sub-network data for four months, January – April 2008, for the University of
Manchester was supplied and reconciled and the results are given in the
following table. 52% of views could not be attributed to a department. Leaving
the Library aside (9.9%), the most important subject was Chemistry (5.6%).
However the subject list is quite fragmented and if we stitch together all the
bioscience use (Biochemistry, Immunology, the hospital, Medical and Human
sciences and various relevant specialist centres) the figure for bioscience, usage
would exceed 10%.
Table 10. Exploratory sub-network analysis of ScienceDirect usage: University of Manchester
Department Frequency Percent
Rank
Top ten
RAE
Ranking Architecture 37 .0
Arts cluster 904 .1
Astronomy 57 .0
Biochemistry 12339 1.9 7
Bioscience Education 21104 3.3 4
Cell Immunology 590 .1
Centre for Excellence in Enqui 69 .0
Centre for Primary Care 2152 .3
Centre for Research on Innovation 149 .0
Chemical Engineering 8818 1.4
Chemical Engineering and Analysis 3949 .6
Chemistry 36547 5.6 2 5
Christie Hospital - Patterson Institute 13535 2.1 6 Computation / Medical 177 .0
Dentistry 6634 1.0 4
Drug Misuse Research Unit 34 .0
Earth Sciences 10466 1.6 =9 5

Eva lua t ing the Usage and Impact o f E-Journa ls in the UK – Page 22
CIBER
Economics / Sociology 7177 1.1 4 / 5*
Education 593 .1 4
Electrical Engineering 7096 1.1
EM Unit 146 .0
Engineering and Physical Science 179 .0
English Language Teaching Centre 16 .0
5*
Environment cluster 558 .1
Health Services Management 101 .0
Library 64350 9.9 1
Management Computing Information 873 .1
Manchester Interdisciplinary Biocentre 17159 2.6
5
Manchester Royal Infirmary 10619 1.6
=9
Manchester University Press 12 .0
Mathematics 4595 .7 5
Mechanical Engineering 23805 3.7 3 5
Medical and Human Sciences 11502 1.8
8
MRC Hearing and communication Group 6 .0
Museum 109 .0
Neuroscience 1502 .2
Optometry 2990 .5
Paper Science 1633 .3
Pathological Sciences 766 .1
Pharmacy 9040 1.4 5*
Physics 5463 .8
Physiology 633 .1
Plants and Microbes 1664 .3
Precinct Library 13 .0
PREST 712 .1
Psychiatry 544 .1
Religion / Geography 118 .0 5* / 4
Rheumatology 86 .0
School of Mechanical, Aerospace and Civil Engineer 6914 1.1
5
Science and Technology 1518 .2
Textiles / Total Technology 1628 .3
Tyndall Centre for Climate Change Research 411 .1
Whitworth Art Gallery 229 .0
Wolfson Molecular Imaging Centre 100 .0
Wythenshawe Hospital 4894 .8
Zochonis Builiding 500 .1
Eva lua t ing the Usage and Impact o f E-Journa ls in the UK – Page 23
CIBER
Other 340061 52.5
Total 647876 100.0
7. References
CIBER (2005). New Journal Publishing Models: An International Survey of Senior Researchers. London: City University, 2005.
Elsevier (2006). Elsevier Core Trends dataset. Oxford: Elsevier, 2006.
Huntington P, Nicholas D, Jamali HR, Watkinson A (2006a). Obtaining subject data from log files using deep log analysis: case study OhioLINK. Journal of Information Science, 32(4), 2006, pp299-308.
ISI (2006). Journal Citations Report. Philadelphia: Institute for Scientific Information, 2006.
Nicholas D, Huntington P, Jamali HR (2007b). Diversity in the information seeking behaviour of the virtual scholar: institutional comparisons, Journal of Academic Librarianship, 33(6), December 2007, pp629-638
Nicholas D, Huntington P, Jamali HR (2008a). User diversity: as demonstrated by deep log analysis. Electronic Library, 26(1), 2008, pp21-38
Nicholas D, Huntington P, Jamali H, Dobrowolski T (2008b). The information seeking behaviour of the digital consumer: case study the virtual scholar in Nicholas D, Rowlands I Editors, Digital Consumers. London: Facet, 2008
Nicholas D, Huntington P, Jamali HR, Tenopir, C (2006a). Finding information in (very large) digital libraries: a deep log approach to determining differences in use according to method of access. Journal of Academic Librarianship, 32 (2), March 2006, pp119-126
Nicholas D, Huntington P, Jamali HR, Tenopir C (2006b). OhioLINK – ten years on: what deep log analysis tells us about the impact of Big Deals. Journal of Documentation, 62 (4) July 2006, 482-50
Nicholas D, Huntington P, Rowlands I (2007a). E-books: how are users responding? Update 6(11), November 2007, pp29-31
Tenopir C, Reid G, Manoff M, Baker G, Nicholas D, King D (2008). MaxData research project. http://web.utk.edu/~tenopir/maxdata/project_docu.htm
Tenopir C, Reid G, Manoff M, Baker G, Nicholas D, King D (2007). What does usage data tell us about our users? Online Information 2007 Proceedings, pp80-86