ahlstrom corporation october-december 2011 & financial ... · + rightsizing program progressing...
TRANSCRIPT

Ahlstrom January-June 2014
Marco Levi President & CEO
Sakari Ahdekivi CFO
Helsinki August 6, 2014
–8/6/2014 –© 2014 Ahlstrom Corporation –Page 1

8/6/2014 © 2013 Ahlstrom Corporation Page 2
Agenda
• April-June 2014 • Business area review • Cash flow and debt development • Income statement and balance sheet • Rightsizing & future prospects
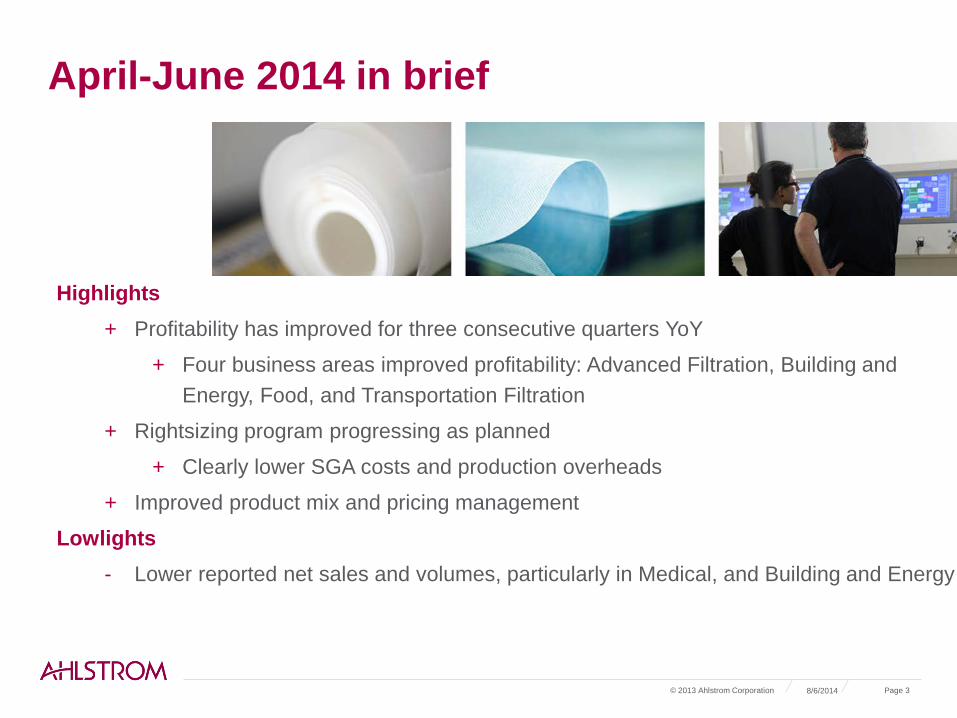
April-June 2014 in brief
8/6/2014 © 2013 Ahlstrom Corporation Page 3
Highlights + Profitability has improved for three consecutive quarters YoY
+ Four business areas improved profitability: Advanced Filtration, Building and Energy, Food, and Transportation Filtration
+ Rightsizing program progressing as planned
+ Clearly lower SGA costs and production overheads
+ Improved product mix and pricing management
Lowlights - Lower reported net sales and volumes, particularly in Medical, and Building and Energy

Key figures
8/6/2014 © 2013 Ahlstrom Corporation Page 4
*Including discontinued operations
EUR million Q2/2014 Q2/2013 Change,
% Q1-
Q2/2014 Q1-
Q2/2013 Change,
%
Net sales 253.0 265.0 -4.5 502.2 520.3 -3.5 Operating profit excl. NRI 13.4 7.9 69.5 20.6 14.4 43.5
% of net sales 5.3 3.0 4.1 2.8
Gearing* 85.8 83.7 85.8 83.7
ROCE, % 5.4 1.0 4.4 3.2
8/6/2014 © 2013 Ahlstrom Corporation Page 5
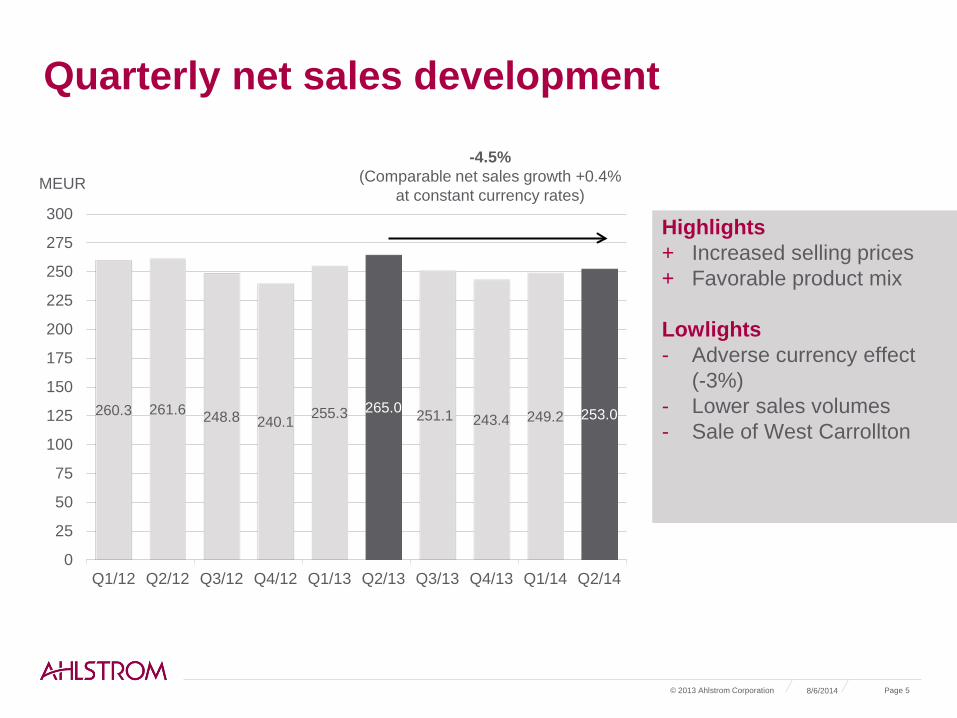
Quarterly net sales development
260.3 261.6 248.8 240.1 255.3 265.0 251.1 243.4 249.2 253.0
0
25
50
75
100
125
150
175
200
225
250
275
300
Q1/12 Q2/12 Q3/12 Q4/12 Q1/13 Q2/13 Q3/13 Q4/13 Q1/14 Q2/14
MEUR -4.5%
(Comparable net sales growth +0.4% at constant currency rates)
Highlights + Increased selling prices + Favorable product mix Lowlights - Adverse currency effect
(-3%) - Lower sales volumes - Sale of West Carrollton

Quarterly operating profit development Profitability has improved for three consecutive quarters YoY
10.5
7.4 7.3
-4.1
6.5 7.9
1.5
-2.5
7.2
13.4
-3%
-2%
-1%
0%
1%
2%
3%
4%
5%
6%
7%
-6
-4
-2
0
2
4
6
8
10
12
14
Q1/12 Q2/12 Q3/12 Q4/12 Q1/13 Q2/13 Q3/13 Q4/13 Q1/14 Q2/14
MEUR Operating profit excl. NRI % of net sales
Highlights + Pricing and product mix
management + Cost savings in production
overheads and SGAs Lowlights - Increased energy costs - Lower volumes - Three focus units:
Chirnside production line, Mundra, Longkou
8/6/2014 © 2013 Ahlstrom Corporation Page 6

Operating profit* supported by higher selling prices / product mix and lower costs
8/6/2014 © 2013 Ahlstrom Corporation Page 7
7.9
13.4
5.1 3.9
1.7
5.8
0.2
0123456789
101112131415
OP excl. NRIQ2/2013
Selling price &mix
Volume RM andEnergy
Other costs FX OP excl. NRIQ2/2014
MEUR
*Continuing operations, excluding non-recurring items
+ Price increases and
favorable product mix – Lower sales volumes – Higher energy costs,
mainly related to natural gas
+ Cost savings from the rightsizing program in production overheads and SGAs

Business area review

26.2 26.2
0
5
10
15
20
25
30
Q2/2013 Q2/2014
Net sales
Advanced Filtration
Q2/14: Net sales EUR 26.2 million (EUR 26.2 million)
+ Higher sales of industrial and gas turbine applications
+ Increased selling prices - Adverse currency effect - Softer market for laboratory & life
science, high efficiency air applications
Q2/14: Operating profit ex. NRI EUR 4.2 million (EUR 3.7 million)
+ Higher sales volumes + Favorable pricing + Lower fixed costs
8/6/2014 © 2013 Ahlstrom Corporation Page 9
-0.1%, volumes +2.4% (comparable net sales
+2.1%)
3.7
4.2
11
12
13
14
15
16
17
0
1
2
3
4
5
6
Q2/2013 Q2/2014
Operating profit ex. NRI MEUR
MEUR
% of net sales

-7.7%, volumes -9.8% (Comparable net sales
-4.2%)
71.0 65.5
0
10
20
30
40
50
60
70
80
Q2/2013 Q2/2014
Net sales
8/6/2014 © 2013 Ahlstrom Corporation Page 10
Building and Energy
Q2/14: Net sales EUR 65.5 million (EUR 71.0 million)
- Lower sales of wallcoverings - Lower sales of flooring applications in
Russia - Lower sales of wind energy applications + Higher construction and automotive
related material sales in Europe
Q2/14: Operating profit ex. NRI EUR 2.0 million (EUR 1.6 million)
+ Lower fixed costs + Improved operational efficiency – Lower volumes
1.6 2.0
0
1
2
3
4
0
1
2
3
4
Q2/2013 Q2/2014
Operating profit ex. NRI
MEUR
MEUR % of net sales

8/6/2014 © 2013 Ahlstrom Corporation Page 11
Food
Q2/14: Net sales EUR 58.4 million (EUR 63.7 million)
+ Higher volumes of single-use coffee and tape materials
- Divestment of West Carrollton
Q2/14: Operating profit ex. NRI EUR 2.5 million (EUR 1.4 million)
+ Lower fixed costs + Product mix optimization - Focus units: Longkou plant, Chirnside
production line
63.7 58.4
0
10
20
30
40
50
60
70
Q2/2013 Q2/2014
Net sales
1.4
2.5
0
1
2
3
4
5
0
1
2
3
4
5
Q2/2013 Q2/2014
Operating profit ex. NRI
-8.2%, volumes -2.1% (Comparable net sales
-0.6%)
MEUR
MEUR
% of net sales

8/6/2014 © 2013 Ahlstrom Corporation Page 12
Medical
Q2/14: Net sales EUR 32.8 million (EUR 38.5 million)
- Lower volumes - Reduction in business with a large
customer - Exit from certain drape products
- Adverse currency effect + Higher sales of SMS-based drape and
gown products
Q2/14: Operating profit ex. NRI EUR -0.8 million (EUR 0.3 million)
- Adverse product mix and lower volumes + Focus unit: Mundra plant + Lower fixed costs
38.5 32.8
05
10152025303540
Q2/2013 Q2/2014
Net sales
0.3
-0.8
-8
-6
-4
-2
0
2
-2
-1
0
1
2
3
Q2/2013 Q2/2014
Operating profit ex. NRI
-14.6%, volumes -5.1% (Comparable net sales
-9.0%)
MEUR
MEUR
% of net sales
81.0 82.9
0102030405060708090
Q2/2013 Q2/2014
Net sales
8/6/2014 © 2013 Ahlstrom Corporation Page 13
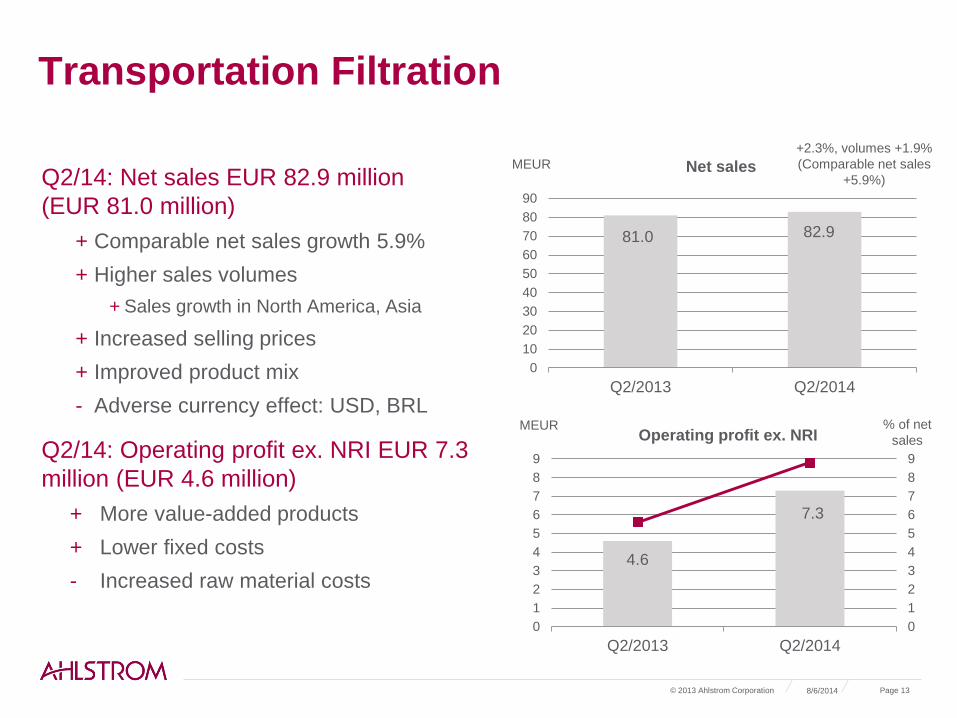
Transportation Filtration
Q2/14: Net sales EUR 82.9 million (EUR 81.0 million)
+ Comparable net sales growth 5.9% + Higher sales volumes
+ Sales growth in North America, Asia
+ Increased selling prices + Improved product mix - Adverse currency effect: USD, BRL
Q2/14: Operating profit ex. NRI EUR 7.3 million (EUR 4.6 million)
+ More value-added products + Lower fixed costs - Increased raw material costs
+2.3%, volumes +1.9% (Comparable net sales
+5.9%)
4.6
7.3
0123456789
0123456789
Q2/2013 Q2/2014
Operating profit ex. NRI
MEUR
MEUR % of net sales

Cash flow and debt development
06/08/2014 © 2014 Ahlstrom Corporation Page 14

Net cash from operating activities (including discontinued operations)
14.6
27.5 21.2
15.5
-21.4
35.5
23.2
3.7
-6.1
14.2
-25
-20
-15
-10
-5
0
5
10
15
20
25
30
35
40
Q1/12 Q2/12 Q3/12 Q4/12 Q1/13 Q2/13 Q3/13 Q4/13 Q1/14 Q2/14
8/6/2014 © 2013 Ahlstrom Corporation Page 15
MEUR

8/6/2014 © 2013 Ahlstrom Corporation Page 16
Development of operating working capital (including discontinued operations)
179.1 171.8 169.9 169.3
198.3
155.5
132.7
108.0 120.5 125.6
25
30
35
40
45
50
0
50
100
150
200
250
Q1/12 Q2/12 Q3/12 Q4/12 Q1/13 Q2/13 Q3/13 Q4/13 Q1/14 Q2/14
Days MEUR
Operative working capital* Turnover rate in days
– Stable development of working capital QoQ
– 12-month rolling turnover rate increased to 45 days at the end of Q2/2014 from 42 days at the end Q2/2013
Operating working capital was released due to the LP Europe demerger in Q2/2013 and Coated Specialties
demerger in Q4/2013
*Operative working capital = Accounts receivables + inventories – accounts payable
8/6/2014 © 2013 Ahlstrom Corporation Page 17
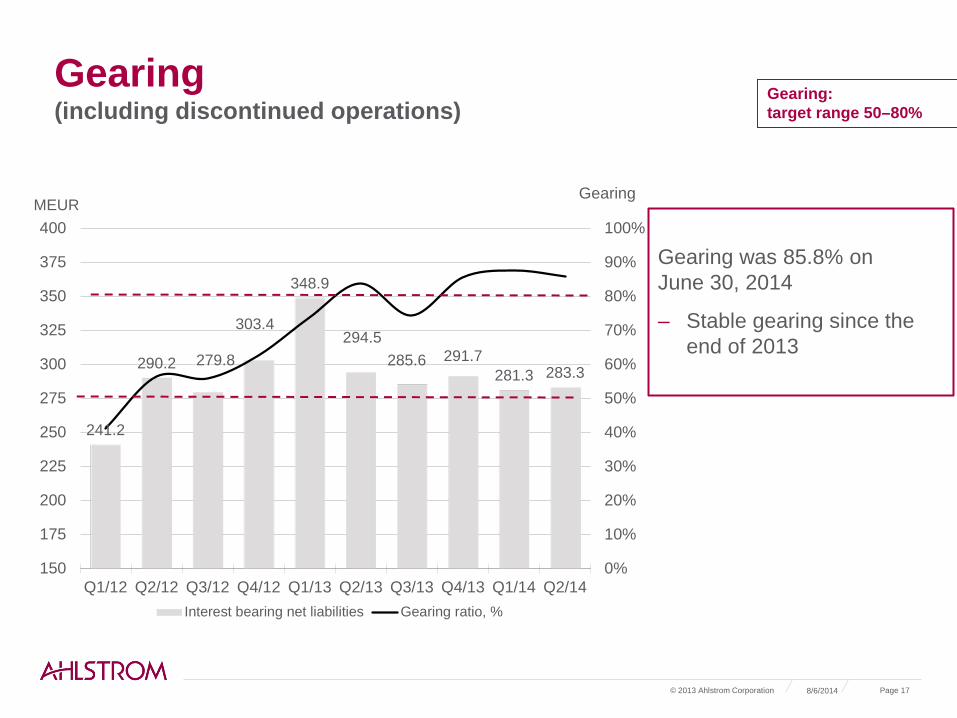
Gearing (including discontinued operations)
Gearing was 85.8% on June 30, 2014
– Stable gearing since the end of 2013
241.2
290.2 279.8
303.4
348.9
294.5 285.6 291.7
281.3 283.3
0%
10%
20%
30%
40%
50%
60%
70%
80%
90%
100%
150
175
200
225
250
275
300
325
350
375
400
Q1/12 Q2/12 Q3/12 Q4/12 Q1/13 Q2/13 Q3/13 Q4/13 Q1/14 Q2/14
MEUR
Interest bearing net liabilities Gearing ratio, %
Gearing: target range 50–80%
Gearing

8/6/2014 © 2013 Ahlstrom Corporation Page 18
Maturity profile of medium/long-term credit facilities
– Total liquidity, including cash and unused committed credit facilities was EUR 308.0 million at the end of Q2/2014
– In addition, Ahlstrom had undrawn uncommitted credit facilities and cash pool overdraft limits of EUR 138.4 million available
0
25
50
75
100
125
150
175
200
225
2014 2015 2016 2017 2018
MEUR
Mid-term and long-term loans Undrawn credit facilities EUR 100 million bond
Income statement and balance sheet

Income statement
8/6/2014 © 2013 Ahlstrom Corporation Page 20
Q2/2014 Q2/2013 EUR million
Net sales 253.0 265.0 Cost of goods sold -207.8 -222.3
Gross profit
45.2
42.7
Sales, administrative and research & development expenses
Other income and expenses
-36.8
1.2
-36.7
0.4 Operating profit
9.6
6.4
Operating profit excl. NRI Net financial expenses Share of profit / loss of equity accounted investments
13.4 -9.5 -0.5
7.9 -4.9 -5.0
Profit / loss before taxes Income taxes Profit / loss for the period from continuing operations Profit for the period from discontinued operations Profit for the period
-0.4 -1.8
-2.2
9.2
7.0
-3.5 -1.4
-4.9
66.7
61.8
– Adverse currency rate effect, divestments, lower volumes
+ Increased selling prices and improved product mix
NRIs: EUR -3.8 million in Q2/14 vs. EUR -1.5 million in Q2/13
Suominen Oyj – Jujo Thermal included in Q2/13
Includes Munksjö Oyj’s contribution to Osnabrück separation costs – Q2/13 includes demerger effects
SGA excl. NRI: EUR 33.0 million, or 13.0%, in Q2/14 vs EUR 35.4 million, or 13.4%, in Q2/13
Includes EUR 5.0 million net financial expense related to Munksjö Oyj shares
Lower production overheads

Balance sheet
8/6/2014 © 2013 Ahlstrom Corporation Page 21
June 30, 2014 Dec. 31, 2013 EUR million
Total non-current assets Inventories Trade and other receivables Income tax receivables Cash and cash equivalents Assets classified as held for sale and
distribution to owners Total assets
Total equity Provisions Interest bearing loans and borrowings Employee benefit obligations Trade and other payables Others Liabilities classified as held for sale and
distribution to owners Total equity and liabilities
611.9 120.6 189.8
0.5 56.0
-
978.8
330.2 11.2
339.3 75.2
214.1 8.9
-
978.8
633.4 106.6 173.0
0.6 38.2
18.9
970.6
341.4 8.3
330.4 76.1
200.2 8.3
5.9
970.6
Gearing
85.8
85.5
Includes EUR 100 million hybrid bond.
Market value of shareholding in Munksjö Oyj EUR 38.9 million and Suominen Oyj EUR 36.7 million (June 30, 2014)
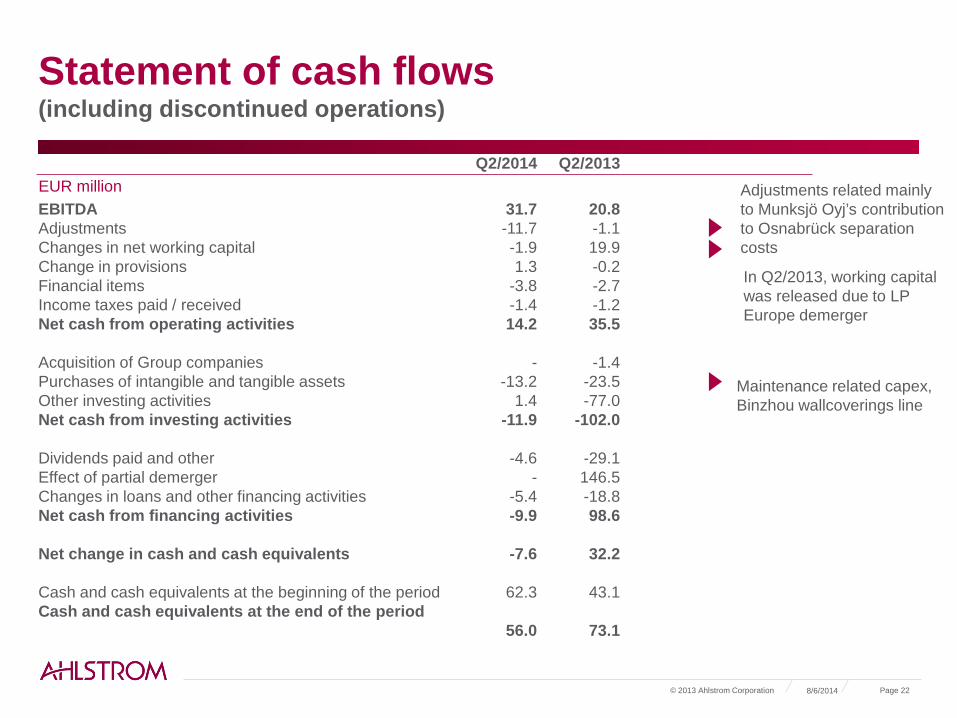
Statement of cash flows (including discontinued operations)
8/6/2014 © 2013 Ahlstrom Corporation Page 22
Q2/2014 Q2/2013 EUR million EBITDA Adjustments Changes in net working capital Change in provisions Financial items Income taxes paid / received Net cash from operating activities Acquisition of Group companies Purchases of intangible and tangible assets Other investing activities Net cash from investing activities Dividends paid and other Effect of partial demerger Changes in loans and other financing activities Net cash from financing activities
Net change in cash and cash equivalents Cash and cash equivalents at the beginning of the period Cash and cash equivalents at the end of the period
31.7 -11.7 -1.9 1.3
-3.8 -1.4 14.2
-
-13.2 1.4
-11.9
-4.6 -
-5.4 -9.9
-7.6
62.3
56.0
20.8 -1.1 19.9 -0.2 -2.7 -1.2 35.5
-1.4
-23.5 -77.0
-102.0
-29.1 146.5 -18.8 98.6
32.2
43.1
73.1
Maintenance related capex, Binzhou wallcoverings line
Adjustments related mainly to Munksjö Oyj’s contribution to Osnabrück separation costs
In Q2/2013, working capital was released due to LP Europe demerger

Future prospects
06/08/2014 © 2014 Ahlstrom Corporation Page 23

Update on rightsizing program
– Target to reach annual costs savings of EUR 50 million by the end 2015 • Approximately EUR 39 million derived from continuing operations
– Personnel reductions of about 400 globally
– Ahlstrom to book non-recurring items of approximately EUR 15 million in 2013-15
– Achieved by the end of Q2/2014: • Approximately EUR 27 million in cost savings have been achieved, of which about EUR 11 million
were transferred to Munksjö Oyj • Approximately EUR 16 million realized in continuing operations
• Personnel reductions of approximately 285 • Non-recurring costs: EUR 8.9 million, of which EUR 5.8 million in Q1-Q2/2014
8/6/2014 © 2013 Ahlstrom Corporation Page 24

Outlook for 2014
© 2013 Ahlstrom Corporation Page 25
– Net sales are expected to be EUR 930-1,090 million ‒ Operating profit margin excluding non-recurring items is expected to
be 2-5% of net sales ‒ Investments excluding acquisitions are estimated to amount to
approximately EUR 50 million
8/6/2014

Thank you
Ahlstrom Group P.O. Box 329, Alvar Aallon katu 3C FI-00100 Helsinki, Finland T: +358 (0)10 888 0 F: +358 (0)10 888 4709 [email protected] www.ahlstrom.com
8/6/2014 © 2013 Ahlstrom Corporation Page 26