agriculture and the world trade …faculty.haas.berkeley.edu/arose/boysgrant.pdf · agriculture and...
TRANSCRIPT
AGRICULTURE AND THE WORLD TRADE ORGANIZATION:
DOES MEMBERSHIP MAKE A DIFFERENCE?
Jason H. Granta,* , Kathryn A. Boysb
a Dept. of Agricultural & Applied Economics, Virginia Polytechnic Institute & State University, Blacksburg, VA
a Dept. of Applied Economics and Statistics, Clemson University, Clemson, SC
Comments Welcome. Please Do Not Quote Without Permission. Abstract
Recent empirical studies have estimated the trade flow effect of membership in the World Trade Organization (WTO) and its predecessor, the General Agreement on Tariffs and Trade (GATT). One important, although largely untested, conclusion from this literature is that the GATT/WTO has worked well if we ignore trade in agriculture ‐ one of the institution’s seemingly apparent failures. This article investigates this conclusion using a large panel of agricultural and non‐agricultural trade flows, the latter of which serves as our benchmark. The results are impressive: the multilateral institution has delivered significant positive effects on members’ agricultural trade relative to trade between non‐members. Further, despite their special and differential treatment, membership has provided important trade flow benefits for developing and least‐developed country agricultural exports. These findings are robust across a large number of specifications and slices of the data. Although there are few sectors as politically sensitive, participation in the GATT/WTO appears to be a significant determinant of agricultural trade flows.
This draft last updated: April 7, 2010
* Tel.: +1 540 231 7559; fax: +1 540 231 7417. E‐mail address: [email protected]. This paper has benefited from seminar participants at the Economic Research Service of the United States Dept. of Agriculture, as well as attendees at the International Agricultural Trade Research Consortium Meetings in Fort Meyers, FL and the Annual Meeting of the American Agricultural Economics Association in Milwaukee, WI. Special thanks go to Thomas Vollrath, Karl Meilke, and Dave Orden for helpful comments.

1
1. Introduction “Almost nobody doubts that the WTO and its predecessor, the General Agreement on
Tariffs and Trade (GATT), have helped to boost global trade, by encouraging countries to
lower their tariff barriers in successive rounds of trade negotiations.” (The Economist,
2002)
The World Trade Organization (WTO) and its predecessor the General Agreement on Tariffs and Trade
(GATT) (henceforth GATT/WTO) is often heralded as one of the most successful multilateral institutions
in the post‐war era (see, for example, Bagwell and Staiger 2002, Bhagwati 1991, and Irwin 1995).
Celebrating its 60th anniversary on January 1, 2008, the GATT/WTO published a World Trade Report
titled “Six decades of multilateral cooperation: What have we learnt?” Among its many
accomplishments, the GATT/WTO notes that: “… since 1950 world trade has grown more than twenty‐
seven fold in volume terms and this expansion is more than three times as large as the growth in world
output which expanded eight‐fold during the same period” (WTO 2007, pg. 243). Similar praise has
recently been offered by WTO Director General, Pascal Lamy: “The World Trade Organization remains
the most efficient and most legitimate forum to open and regulate world trade”.1 The impressive growth
in world trade is often attributed to the GATT/WTO’s efforts, largely due to its visible role in reducing
barriers to trade through successive rounds of negotiation.
Recently, however, the GATT/WTO has become the focal point of a growing body of empirical
literature exploring the relationship between membership and trade flows. Rose (2004a) opened this
discussion with an article in the American Economic Review claiming membership in the GATT/WTO was
not associated with higher trade flows relative to outsiders. Rose’s result, which counters much
conventional wisdom, came as a big shock to international trade economists and policy‐makers alike.
Why would the leaders of the global economy promote membership into an organization that failed to
deliver on the promise of increased trade? Indeed, Rose (2004a) finds his (non) result “… an interesting
mystery” (pp. 112).
Rose’s findings sparked a growing body of literature (Subramanian and Wei (SW) 2007; Tomz,
Goldstein, and Rivers (TGR) 2007; Herz and Wagner 2006; Chang and Lee 2007; Liu 2009; Engelbrecht
and Pearce 2007; Eicher and Henn 2009; Balding 2010). TGR (2007) overturned Rose’s (2004a) result by
including informal GATT/WTO participation by dependent colonies or provisional members, thereby
altering the treatment and control groups by which GATT/WTO membership is judged. Yet the results in
1 See http://www.wto.org/english/thewto_e/dg_e/dg_e.htm

2
TGR (2007) are problematic because it is not clear why informal membership consistently matters more
for trade than formal membership (Rose 2007).2 Alternatively, SW (2007) published what is perhaps the
definitive critique of Rose’s (2004a) work. Their analysis is based on the asymmetric structure and
institutional theory of the GATT/WTO (Bagwell and Staiger 1999). That is, the benefits of membership
do not extend equally to all signatories and sectors covered by the multilateral organization. Rather, the
trade promoting role of the GATT/WTO depends on how actively a country engages in trade
liberalization, with whom trade liberalization is negotiated, and what products are covered by the
negotiations (SW 2007).
SW (2007) modified the specification in Rose (2004a) and report two noteworthy results. First,
the GATT/WTO promotes trade “strongly”, but only for industrialized countries who have actively
participated in trade liberalization efforts. Developing countries, on the other hand, were largely
exempt from trade liberalization under the umbrella of Special and Differential Treatment (SDT).
Second, SW (2007) report a large, and significantly negative, GATT/WTO effect for agricultural trade
because, like developing economies, this sector was also exempt from decades of trade liberalization.
Indeed, SW (2007) are particularly critical of the GATT/WTO’s treatment of agriculture: “It appears that
the exemption of agriculture from WTO disciplines has provided the freedom for industrial countries to
throttle trade by introducing very high levels of protection. This permissiveness toward agriculture has
proved very costly…” (pp. 169). In a reply to SW (2007), Rose (2006a) similarly calls attention to
agriculture as one of the GATT/WTO’s failures: “If the GATT/WTO has been a successful liberalizer, can
one simply ignore its failures in agriculture? (pp.6, italics added).3
In this article, we reconcile the apparent belief – that membership in the GATT/WTO has
“throttled” agricultural trade ‐ with the data. Virtually every study following Rose (2004a) has used total
merchandise trade which makes it impossible to say anything about whether and to what extent the
GATT/WTO has promoted (or failed to increase) members’ agricultural trade. Although SW (2007)
looked at agricultural trade in passing, their selection rule to define the sector is not innocuous. The
authors chose just six products at the 4‐digit level of the harmonized system (HS4) ‐ cabbages, frozen
vegetables, margarine, malt extract, tomatoes (prepared), and manufactured tobacco (see SW 2003).
2 For example, TGR’s (2007) results (column 3, Table 2) imply that formal members trade 19% more, informal members traded 51% more, while a formal member traded an astounding 123% more with an informal member. 3 It is not hard to find other critics of the GATT/WTO’s treatment of agricultural trade. After the celebrated Uruguay Round (UR) agreement which brought agriculture under the disciplines of the multilateral organization for the first time, Josling (1998) noted that “…the agreement did little to liberalize agricultural trade because tariffs are three times as high as industrial goods” (pp. 1). Empirical evidence in Ingco (1995), Gibson et al. (2001), and OECD (2004) report that agricultural tariffs are several times larger than non‐agricultural tariff levels.
3
Not only do these six products face some of the highest tariffs in world trade (based on US and EU tariff
information) their definition falls far short of the more than 200 HS4‐digit products comprising the
sector (according to the WTO’s classification).4 This begs the following question: Do we really know that
the GATT/WTO has failed to promote agricultural trade? Or, did SW’s (2007) selection rule make
participation in the GATT/WTO appear like a dismal failure?
We demonstrate that SW’s (2007) conclusion seriously misrepresents the impact of GATT/WTO
membership on agricultural trade. First, we gather a number of tariff policy indicators and test for
differences in these metrics between members and non‐members within a given sector. Second, we
assemble a large panel of agricultural trade flows, as opposed to the six (protected) products used in SW
(2007). We then consider agricultural and non‐agricultural trade separately in the empirical analysis, the
latter of which serves as our benchmark. To ensure consistency and facilitate comparison, we follow
closely the framework of Rose (2004a) and SW (2007). Finally, due to their exemption from agricultural
trade liberalization commitments, we consider least‐developed countries as a separate group from
developing countries.
The remainder of this paper is organized as follows. Section two develops our empirical strategy,
while section three describes the data. Section four offers a casual look at trade policy and trade flow
data to gauge whether there are systematic differences in these metrics between members and non‐
members. Section five presents the formal econometric results, and in the final section, we conclude.
2. Empirics
The gravity equation continues to be the workhorse model in international economics. Its continued
popularity is not only due to its consistent results, but also because of its relatively compact
specification which makes it appealing for analyzing trade and policy issues (Eichengreen and Irwin
1998; Baier and Bergstrand 2007; Grant and Lambert 2008; Vollrath, Gehlhar, and Hallahan 2009). The
model predicts that trade flows are proportional to the economic size of the importing and exporting
nations, the distance between them, and a host of other factors which are known to either promote or
impede trade. Conditional on these factors, researchers then look for positive or negative deviations in
trade that may be due to membership in international or regional associations and currency unions
(Rose 2004a, Glick and Rose 2002; Frankel 1997).
4 As further evidence that this selection is not representative of total agricultural trade, consider the United Nation’s COMTRADE data. Total agricultural trade (world imports + world exports) totaled US $1.8 trillion in 2007. World trade in SW’s (2007) six products (cabbages, frozen vegetables, margarine, malt extract, tomatoes (prepared), and manufactured tobacco) totaled $47.7 billion. Thus, trade in these six products as a share of total agricultural trade was just 2.7 percent in 2007.

4
Recent studies have called attention to the importance of international prices in the gravity
equation (Anderson and van Wincoop (AvW) 2003; Feenstra 2004; Baier and Bergstrand 2007, Grant and
Lambert 2008; SW 2007). AvW (2003) showed that the traditional gravity equation has no theoretical
foundation because it does not control for a country’s “multilateral resistance” faced with their partners
in the rest of the world. To address this limitation, AvW (2003) proposed the following theoretically
consistent version of the gravity equation:
(1) ijjiijji
ij ZGDPGDP
Tεγβ σσ +Π−Π−+=
⎥⎥⎦
⎤
⎢⎢⎣
⎡ −− 110 lnlnln
subject to N equilibrium conditions for i and j:
(2) ∑=
−− ⋅⎟⎟⎠
⎞⎜⎜⎝
⎛Π=Π
N
i
Z
W
iij
ijeGDPGDP
1
11 γσσ ; ∑=
−− ⋅⎟⎟⎠
⎞⎜⎜⎝
⎛Π=Π
N
j
Z
W
jji
ijeGDPGDP
1
11 γσσ
where, Tijt is the value of (unidirectional) bilateral trade from country i to country j, GDPit (GDPjt) is the
gross domestic product of the exporting (importing) country, Zij is a vector of additional trade cost
factors (i.e., distance, borders, and language), GDPW denotes world GDP (constant across
countries), σ−Π1i and σ−Π1
j are exporter and importer price indices (multilateral resistance) respectively, σ
is the elasticity of substitution in demand between traded goods from different countries, and εij is a log‐
normal error term.
Because multilateral prices are largely unobservable, AvW (2003) used a nonlinear procedure to
recover estimates of the model’s parameters. However, a computationally easier method as suggested
by both AvW (2003) and Feenstra (2004) is to estimate equation (2) using exporter (i) and importer (j)
fixed effects in the cross‐section, or exporter‐by‐time and importer‐by‐time specific fixed effects in a
panel setting since the multilateral price terms are potentially time‐varying (SW 2007).
This study adopts the (core) panel gravity equations used in Rose (2004a) and SW (2007) but
allows the trade flow effect of membership to differ between agricultural and non‐agricultural sectors.
If, as SW (2007) concluded, membership provides no benefit for agricultural trade then this result should
show up in the data. We begin with Rose’s (2004a) benchmark model applied to agricultural and non‐
agricultural trade flows as follows:
(3) )(210 )ln()ln()ln( tijk
jtk
itkk
tkk
ijt ZGDPGDPT γββαα ++++=
kijtijt
kijt
kijt
k OneEXPinOneIMPinBothin ελλλ ++++ 321

5
where, k denotes one of two sectors (agriculture or non‐agriculture), ktα is a comprehensive set of year
fixed effects, and Zij(t) is a vector of additional proxies to control for many of the natural factors either
promoting or impeding bilateral trade, including:
• A dummy variable for country pairs that share a contiguous border (Borderij);
• A dummy variable for country pairs that speak the same language (Langij);
• Five colonial dummies indicating whether i and j were colonized by the same country (Comcolij);
whether i and j have ever had a colony link (Colonyij); whether i and j have had a colonial
relationship after 1945 (Colony_1945ij); whether i and j are currently in a colonial relationship
(Curcolij); and whether countries i and j were ever the same country (Smctryij);
• The natural logarithm of the product of country i and j’s land area (Areai*Areaj);
• Two indicator variables denoting the number of landlocked and island countries in the country‐
pair (Landlockedij and Islandij, respectively);
• A dummy variable for country pairs that are part of the same regional trade agreement in year t
(RTAijt); and
• A dummy variable for country pairs that are part of the same currency union in year t (CUijt).
The coefficients of interest in equation (3) are λ1‐λ3, which measure the trade flow effects of
joint GATT/WTO membership (λ1) as well as asymmetric effects associated with only the importing (λ2)
or exporting (λ3) country being a member. Bothinijt is a dummy variable equal to one when trade takes
place between two members of the GATT/WTO, and zero otherwise. OneIMPinijt (OneEXPinijt) is a
dummy variable equal to one when a member imports (exports) from (to) a non‐member, and zero
otherwise. These latter variables are designed to capture possible import and export diversion. If trade
is redirected towards other GATT/WTO members following accession, at the expense of trade with non‐
members, then this will be reflected as either import diversion (λ2<0), export diversion (λ3<0), or both.
Secondly, we turn to the theoretically consistent gravity equation as suggested by SW (2007):
(4) ijtcckctij
kkjt
kit
jtit
kijt EXPINIMPINZGDPGDP
T)(ln )( −+++=⎟
⎟⎠
⎞⎜⎜⎝
⎛λγαα
kijtijtcc
kc EXPNOTINIMPIN εθ +−+ )(
where, kitα and k
jtα are the time‐varying exporter and importer specific fixed effects, and Zij(t) are the
previously described additional controls that vary over country‐pairs.5 The variables (IMPINc‐EXPINc)ijt
5 Variables which are country (and time) specific are absorbed into the time‐varying fixed effects.
6
and (IMPINc‐EXPNOTINc)ijt are two GATT/WTO dummy variables equal to one if importer j is a member
and exporter i is a member (IMPINc‐EXPINc)ijt or a non‐member (IMPINc‐EXPNOTINc)ijt. Note that these
variables are also indexed by the subscript c, which is used to denote: (i) developed countries (DCs); (ii)
developing (DING) countries; (iii) LDCs; and (iv) newly acceded members (NEW).6
The specification in equation (4) allows us to shed light on two issues resulting from SW’s (2007)
paper:
(1) Has GATT/WTO leniency towards agricultural trade really “throttled” members’ trade in this
sector? And,
(2) Is there really no benefit to membership for low‐income countries whose export interests lie
predominantly in agricultural goods?
SW (2007) argue that the GATT/WTO is a club for developed countries with little or no benefit for
developing nations since the latter have been largely exempt from liberalization commitments and are
often afforded special and differential treatment (SDT). While it is true that developing nations are
often afforded more flexibility in reforming agriculture and other sensitive sectors, it is not the case that
these countries have been exempt from liberalization. Rather, it is the least‐developed countries (LDCs)
who have been sheltered from trade policy reform.7 The question of whether SW’s (2007) conclusions
can be generalized to all low‐income countries, and across both agricultural and non‐agricultural sectors,
is an issue we examine empirically.
Four possible asymmetries in the GATT/WTO’s effect on agricultural and non‐agricultural trade are
investigated:
(a) Exporters’ access to DC, DING, and LDC import markets,
(b) Exporters’ access to DC, DING, and LDC import markets conditional on the exporters’
membership status,
(c) Exporters’ access to DC import markets conditional on both the exporter’s level of development
and its membership status, and
(d) Possible asymmetries in new versus old GATT/WTO members.
Low‐income exporters have repeatedly called for greater access to developed country markets
(see Diaz‐Bonilla et al. 2001; OECD 2001). Given the relative importance of agriculture in low‐income
6 Appendix Table 1 lists all countries in the database, their accession date and development status. 7 For example, in the UR, developed countries committed to reduce their tariffs by an average of 36 percent over six years. Developing countries committed to reduce their tariffs by two‐thirds the level of developed countries over ten years, whereas least‐developed countries were exempt from tariff reduction commitments. The Doha Development Agenda proposals are similar in structure (WTO 2008).

7
economies, results that substantiate the benefits of GATT/WTO membership would be particularly
useful in shoring up support for multilateral agreements as an effective means to promote trade and
economic growth in these nations.
3. Data
Bilateral trade data over the period 1980‐2004 are gathered from the World Bank’s Trade, Production
and Protection (TPP) dataset developed by Nicita and Olarreaga (2006)8. This dataset is different from
that used in conventional studies examining aggregate merchandise trade using the Direction of Trade
Statistics from the International Monetary Fund (IMF) (see Rose (2004a), SW (2007), TGR (2006) among
others). The TPP dataset contains an extensive matrix of trade flows for 28 International Standard
Industrial Classification (ISIC) industries (ISIC, Revision 2), and (incomplete) data on country production
and protection. This sectoral detail permits a clean delineation of agricultural (including beverages and
tobacco) and non‐agricultural trade flows.9
The TPP dataset employs mirrored trade flows where exports statistics reported by the partner
country are used if the reporting country’s imports are recorded as missing.10 The data cover 215
reporting and partner countries (with gaps), which ensures a considerable amount of variation in the
membership status of country pairs (Appendix Table 1). For example, sixty‐eight (32%) of the 215
countries are not GATT/WTO members at any point in the sample period, 81 (38%) were members prior
to 1980 and remained so throughout the sample, and 66 (30%) countries become GATT/WTO members
at some point during the 1980‐2004 period. Membership is coded based on the GATT/WTO’s
notifications of members’ official dates of accession which are available from the WTO’s website.11
Production values by ISIC industry are available in the TPP dataset. However, sectoral‐level
production values are severely incomplete. Thus, we employ Gross Domestic Product (GDP) data (in US
8 Available at: http://econ.worldbank.org/WBSITE/EXTERNAL/EXTDEC/EXTRESEARCH/0,,contentMDK:21085384~pagePK:64214825~piPK:64214943~theSitePK:469382,00.html 9 The 28 three‐digit ISIC industries are: Agricultural Food and Livestock (311), Beverages (313), Tobacco (314), Textiles (321), Wearing Apparel (322), Leather Products (323), Footwear (324), Wood Products (331), Furniture (332), Paper Products (341), Printing and Publishing (342), Industrial Chemicals (351), Other Chemicals (352), Petroleum Refineries (353), Miscellaneous Petroleum and Coal Products (354), Rubber Products (355), Plastic Products (356), Pottery China (361), Glass Products (362), Other non‐metal products (369), Iron and Steel (371), Non‐Ferrous Metals (372), Fabricated Metal Products (381), Non‐Electrical Machinery (382), Electrical Machinery (383), Transport Equipment (384), Professional and Scientific Equipment (385), Other Manufactured Products not Elsewhere Specified (390) 10 Feenstra et al. (2005) also employ mirrored trade flows when trade flow statistics of the reporting country are incomplete or missing. 11 Our definition of GATT/WTO membership is akin to Rose (2004a). We do not control for de facto or provisional membership as in TGR (2007). A list of members prior to and after the formation of the WTO can be found at: http://www.wto.org/English/thewto_e/gattmem_e.htm.

8
dollars) obtained from the World Bank (WB) Development Indicators and the United Nations (UN)
National Accounts. GDP data are far more complete and are available for almost all countries and time
periods.12
Data for the standard covariates ‐ distance, contiguity, common language, colonial ties,
landlocked countries, island nations, and land areas ‐ are taken from the Centre d’Etudes Prospectives et
d’Informations Internationales (CEPII) geo‐distance dataset (Mayer and Zignago 2006).13 Information
regarding membership in currency unions was obtained from Rose (2004a). Twelve regional trade
agreements (RTAs) are considered (dates of entry into force in parentheses): Andean Pact (1992), the
Association of Southeast Asian Nations (ASEAN, 1992), the Central American Common Market (1960),
Central European Free Trade Agreement (1993), the Closer Economic Relations (CER, 1983), the North
American Free Trade Agreement (NAFTA including the original 1989 Canada‐US agreement, 1994),
European Free Trade Association (EFTA, 1961), the various European Communities expansions from nine
to 25 members over the sample period (EU, various years), the Mercado Común del Sur (Mercosur,
1991), South African Customs Union (SACU, original 1910, amended 1969), South African Development
Community (SADC, 1992), and the South Asian Association for Regional Cooperation (SAARC, 1985).
The International Monetary Fund’s (IMF) classification of countries is used to define a country’s
level of development along with the WTO’s list of LDCs. IMF high‐income economies are defined as DCs,
and upper middle and lower middle income countries correspond to DING nations. LDCs include the
WTO’s list as well as those classified by the IMF’s list of low‐income economies.14 We also consider
newly acceded members (NEW). While it is not possible to capture very recent accessions (i.e., Viet Nam
in 2007, Ukraine in 2008, etc.), we do, however, attempt to shed light on the institution’s impact on
“new” versus “old” members by defining the former (latter) as the set of countries that acceded to the
WTO on or after (before) the year 1995. This includes China’s accession in 2001, and Taiwan’s accession
in 2002.
12 In some cases (i.e., Taiwan), we use GDP data from the Penn World Tables (6.3) to supplement WB and UN data when it is incomplete or missing. WB Development Indicators Data can be accessed (with subscription) at: http://ddp‐ext.worldbank.org/ext/DDPQQ/member.do?method=getMembers&userid=1&queryId=135, and UN GDP data can be retrieved at: http://unstats.un.org/unsd/snaama/dnllist.asp. Penn World Tables can be accessed at the Center for International Comparisons at the University of Pennsylvania’s website: http://pwt.econ.upenn.edu/ 13 CEPII is an independent European research institute on the international economy stationed in Paris, France. CEPII’s research program and datasets can be accessed at www.cepii.com. CEPII uses the great circle formula to calculate the geographic distance between countries, referenced by latitudes and longitudes of the largest urban agglomerations in terms of population. 14 The WTO’s list of LDCs is available online at: http://www.wto.org/english/theWTO_e/whatis_e/tif_e/org7_e.htm

9
The completed (unbalanced) agricultural and non‐agricultural panel datasets span 1980‐2004
(the end of the Uruguay Round (UR) of trade commitments for developing countries) at four year
intervals (1980, 1984,…, 2004). The agricultural and non‐agricultural datasets contain 70,876 and
102,457 observations, respectively.15
4. Evidence from Tariffs and Trade Flows
Before turning to the formal econometric results, we take a casual look at tariffs and trade flow
differences between members and non‐members within each sector. While most tariff profile studies
often report differences in the levels of protection between agricultural and non‐agricultural sectors
(Gibson et al. 2001; OECD 2004), virtually no attention has been paid to differences in tariff rates
between members and non‐members within a sector. If the GATT/WTO has worked well, then this
should be reflected by more liberal trade policies of its members.16 While this approach fails to control
for a host of other factors that may influence tariffs (as in a political economy model) or trade flows (as
in the gravity equation), an initial look at the data can be quite instructive.
4.1. Tariff Rates
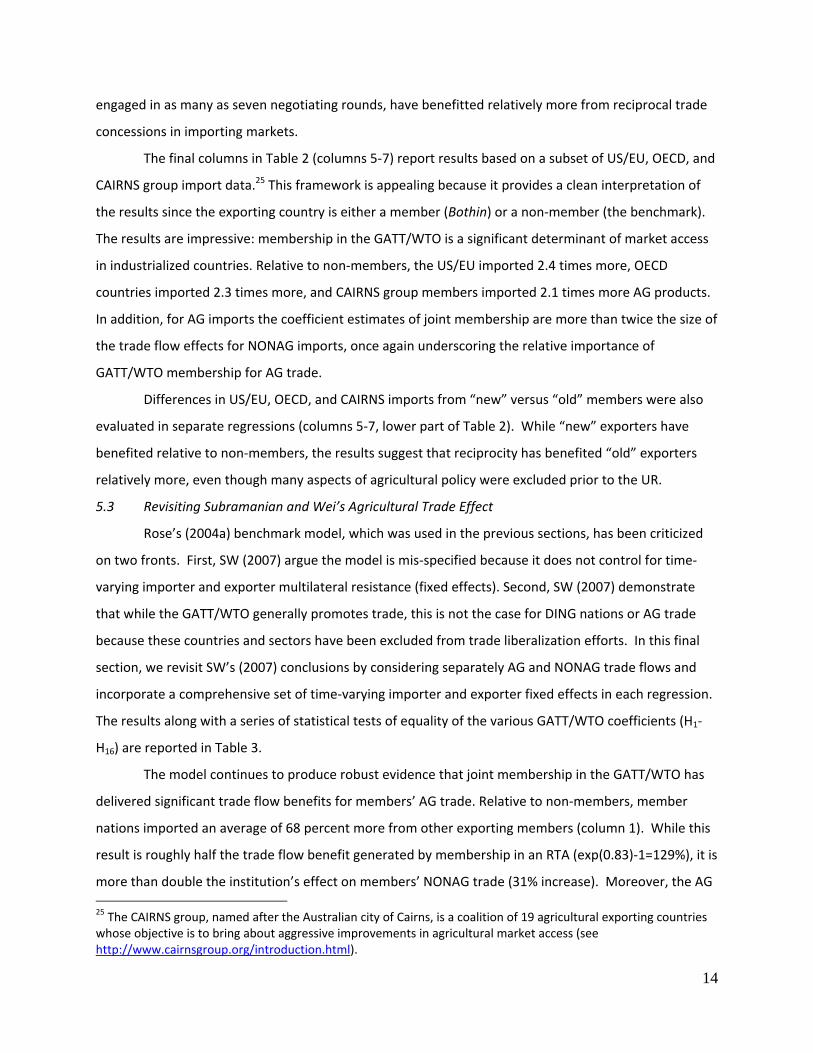
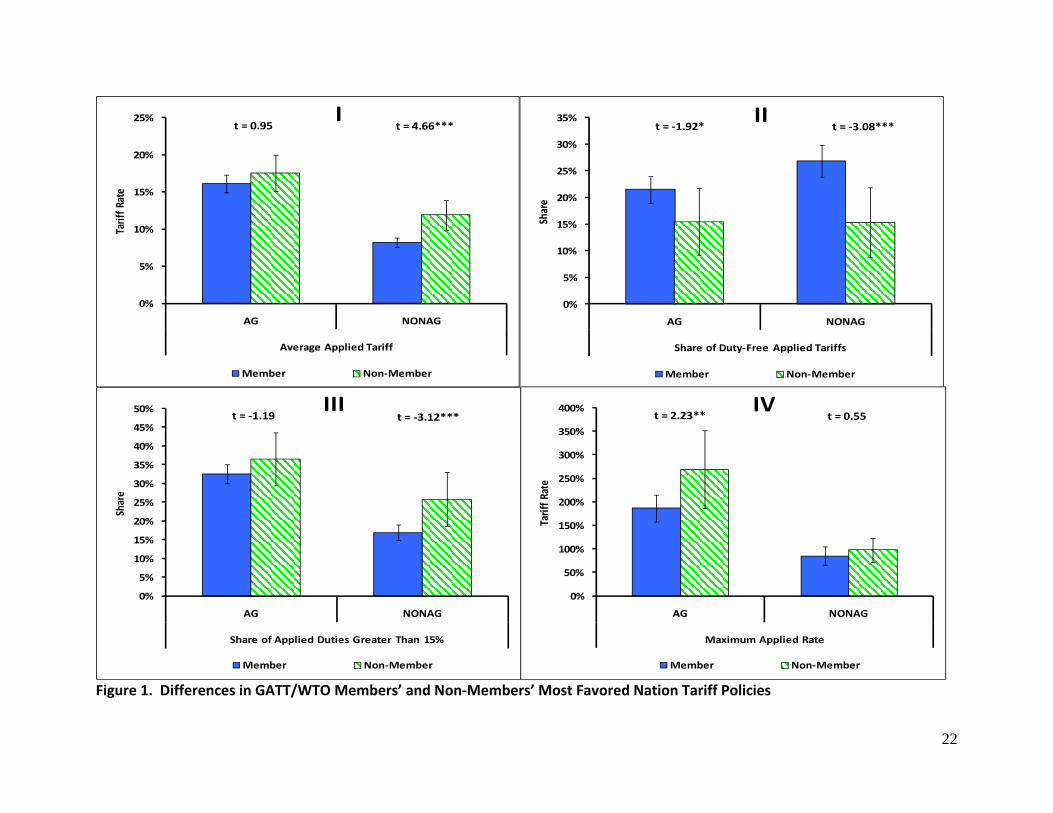
Figure 1 plots four summary indicators of members’ and non‐members’ tariff policies in each of
the AG and NONAG sectors: (I) the average applied tariff, (II) the share of duty‐free applied tariffs, (III)
the share of applied tariffs greater than 15 percent, and (IV) the maximum applied tariff. These plots are
based on Most Favored Nation (MFN) applied rates from the WTO’s World Trade Profiles database for
the years 2006 and 2007.17 Confidence intervals for each point estimate and the difference in means t‐
test with the usual asterisks to denote significance are also included. 18
15 This assumes missing or zero trade flow records do not exist which is typically not the case (Helpman, Melitz, and Rubinstein 2008). However, we do not address the “zeros” issue in this paper for two reasons. First, we would like our analysis to be as consistent as possible with previous studies that disregard zero trade flows (specifically, Rose 2004a and SW 2007). Second, the World Bank’s TPP data includes only positive trade flows making it impossible to distinguish between missing versus (legitimate) zero trade flows. 16 Rose (2004b) presents the definitive analysis of the effect of the GATT/WTO on trade policy. The trade policies Rose (2006) considers, however, are aggregate measures such as a nation’s openness or the Heritage Index of Economic Freedom. These policies do not vary over AG and NONAG sectors which is an essential feature of this study. Thus, we restrict our attention to tariffs which vary widely across sectors and membership status. 17 The AG and NONAG tariff datasets contain information for 179 countries in 2007 and 174 countries in 2006. As such, each dataset has a total of 353 observations. The tariff profiles data for each WTO member, all observer countries, and all non‐members looking to become observers are taken from: http://stat.wto.org/TariffProfile/WSDBTariffPFHome.aspx?Language=E 18 The AG and NONAG datasets contain tariff information for 179 countries in 2007 and 174 countries in 2006. As such, each dataset has a total of 353 observations. Tariff profiles for each WTO member, all observer countries, and all non‐members looking to become observers are taken from: http://stat.wto.org/TariffProfile/WSDBTariffPFHome.aspx?Language=E

10
The results support the fact that GATT/WTO members have more liberal tariff policies (Figure 1).
Compared to non‐members, GATT/WTO members apply lower tariff rates on average (16% (8%) versus
17.5% (12%) in AG (NONAG)); they have a higher share of duty free applied rates (22% (27%) versus 15%
(15%) in AG (NONAG)); they have a lower share of applied duties greater than 15 percent (32% (17%)
versus 37% (26%) in AG (NONAG)); and the average maximum tariff they apply is over 100 percentage
points lower than non‐members (186% (84%) versus 269% (98%) in AG (NONAG). Statistically, these
differences in tariff policies are significant in two out of four cases in AG (share of duty free applied
tariffs and maximum tariffs) and three out of four cases in NONAG (the exception being the maximum
duty rate).
4.2. Evidence from Trade Flows and Gravity Equation Residuals
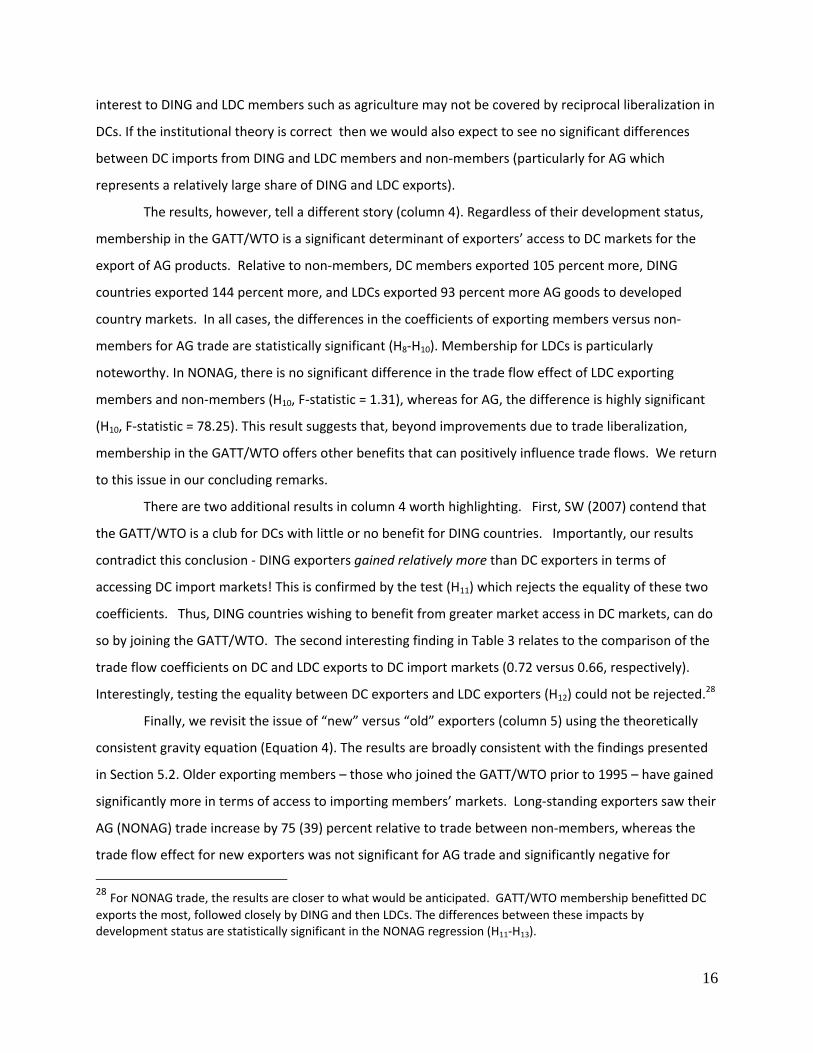
Figure 2 plots four summary measures of trade flows along with the associated t‐tests for
differences in means within each industry (AG and NONAG). The top left panel (I) plots the mean value
of (log) bilateral trade between members (Bothin) and trade involving at least one non‐member (Onein,
Nonein). The remaining panels in Figure 2 (II, III, and IV) plot the mean value of the gravity equation
residuals conditional on GATT/WTO membership. That is, following Rose (2004a) we regress the log of
trade on all right‐hand side variables discussed in equation (3) (including year fixed effects) but
purposefully omit the GATT/WTO treatment effects. We then save the residuals. If the GATT/WTO has
worked well then we might expect to see systematic differences in the residuals of members and
outsiders.
Results presented in Figure 2 suggest that the GATT/WTO has a significant impact on members’
trade, particularly for agricultural goods. First, the mean value of log trade is higher between members
than it is between a member and a nonmember (Onein) or between outsiders (Nonein) (panel I of Figure
2). This result is also confirmed by the gravity equation residuals (panel II), where differences in the
residuals between members and non‐members is easily rejected in both sectors.
The remaining panels (III and IV) examine subsets of the data. In panel III, DC imports from
members and non‐members are compared, while panel IV is based on the subset of gravity equation
residuals reflecting DC imports from DING country members and non‐members. Based on these plots, a
slightly different story emerges when comparing AG and NONAG sectors. First, for AG trade, the mean
residuals for DC imports from a generic member (panel III) as well as for a DING country member (panel
IV) are positive, whereas the residuals are negative for DC imports of NONAG products from generic and
DING country members (panels III and IV, respectively). Second, membership appears to make a big
difference in terms of DING countries’ access to DC markets for the export of their AG products (panel

11
IV). This is an important result given the AG export interests of DING nations. In the next section we
explore the robustness of these findings using a formal model of trade flows.
5. Econometric Results
The econometric results are organized in three sub‐sections. Section 5.1 presents the core results using
Rose’s (2004a) benchmark model along with alternative sets of fixed effects commonly employed in the
literature. Section 5.2 examines several asymmetries in members’ trade. This analysis proceeds using
Rose’s (2004a) model in which pre‐ and post‐Uruguay round, new versus old members, and subsets of
imports by industrial countries are examined. Finally, the issues raised in SW (2007) regarding whether
the GATT/WTO has “throttled” agricultural trade and whether GATT/WTO membership benefits DING
countries are explored in Section 5.3.
5.1 The Rose Model Applied to AG and NONAG Trade
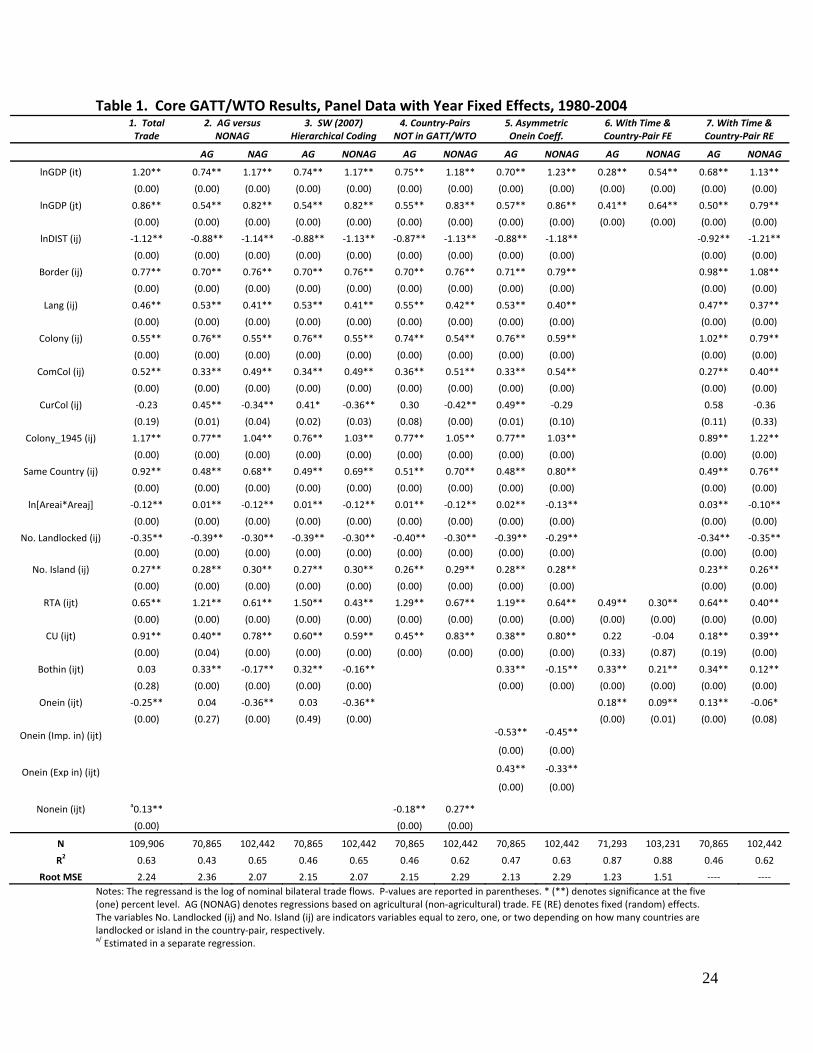
Table 1 presents the results. All regressions are based on a four‐year panel of trade flows spanning the
period 1980‐2004. Seven regressions are reported (columns 1‐7). Column one reproduces Rose’s (2004)
default model based on total merchandise trade.19 In columns (2) through (7), we allow the GATT/WTO
coefficients (Bothin and Onein) to differ between AG and NONAG trade.
Rose’s (2004a) ‘mysterious’ GATT/WTO effect on members’ trade continues to show up in the
data (column 1). Joint membership (Bothin) results in a coefficient (0.03) that is economically small and
statistically insignificant, especially when compared to the effects of free trade agreements or customs
unions. Re‐estimating the benchmark model replacing Bothin and Onein with a single dummy to denote
country‐pairs for which neither the importer nor the exporter is a member (Nonein) (column 1), results
in a coefficient (0.13) that is positive and significant suggesting that trade between non‐members is 14
percent higher ((exp(0.13)‐1)*100) relative to trade involving at least one member. However, these
results are for total merchandise trade and likely mask considerable variation in the institution’s effect
at the sectoral level.
Columns 2‐7 consider AG and NONAG trade. The standard gravity equation coefficients are
economically plausible, statistically significant, and of the correct sign. Economic size (GDP) is
consistently positive but less elastic for AG trade as expected, distance (DIST) has the typical negative
coefficient close to unity, and sharing a border (Border), speaking a common language (Lang) and
colonial relationships all stimulate trade. Landlocked (island) countries trade less (more). Interestingly,
19 That is, for each country‐pair and year we summed the value of AG and NONAG trade to arrive at total merchandise trade flows.
12
the product of importer and exporter land area tends to stimulate (reduce) AG (NONAG) trade. Regional
trade agreements and currency unions have large, positive effects on trade20.
A key element of this analysis is the question of whether membership in the GATT/WTO
facilitates members’ AG trade. A casual glance at the effects of joint membership (Bothin) in columns 2‐
7 (Table 1) suggests that the answer to this question is a resounding ‐ Yes! In all specifications, the trade
flow effect of GATT/WTO membership on agricultural trade is positive and significant. Further, the
effects of GATT/WTO membership is consistently larger for trade in AG compared to NONAG. Results in
column 2 indicate that joint membership in the multilateral institution is associated with a 39 percent
increase in AG trade. This result is particularly striking when compared to the 16 percent decrease in
members’ NONAG trade. Using SW’s (2007) hierarchical coding (column 3) does not change this result.21
In column 4, a single dummy variable is used to denote trade between non‐members (Nonein). The
results further corroborate our findings. Column 5 splits the Onein variable into two indicator variables
depending on whether the importer (Imp. in) or exporter (Exp. in) is a member. It turns out that this
asymmetry is quite important. For AG trade, the results suggest that some trade diversion is occurring as
a result of GATT/WTO membership but only in the form of import diversion. For example, members
imported 41 percent less from the average non‐member exporting country relative to AG trade between
non‐members. Columns 6 and 7 use time and country‐pair fixed and random effects, respectively. The
results for AG trade are unchanged even with the inclusion of these extra controls for unobservable
country‐pair heterogeneity (24,212 and 28,171 bilateral pair fixed and random effects in the AG and
NONAG regressions, respectively).
The results support the hypothesis that GATT/WTO membership has differential impacts at the
sectoral level. Tariffs are relatively high in AG trade and a few sensitive product lines face prohibitive
tariffs. However, if pre‐existing distortions to AG trade were high, even relatively modest liberalization
of these policies following GATT/WTO accession could generate a sizeable trade response, which is why
we make the important distinction between AG and NONAG trade in the empirical analysis.
5.2 Exploring Asymmetries in the Benchmark Model
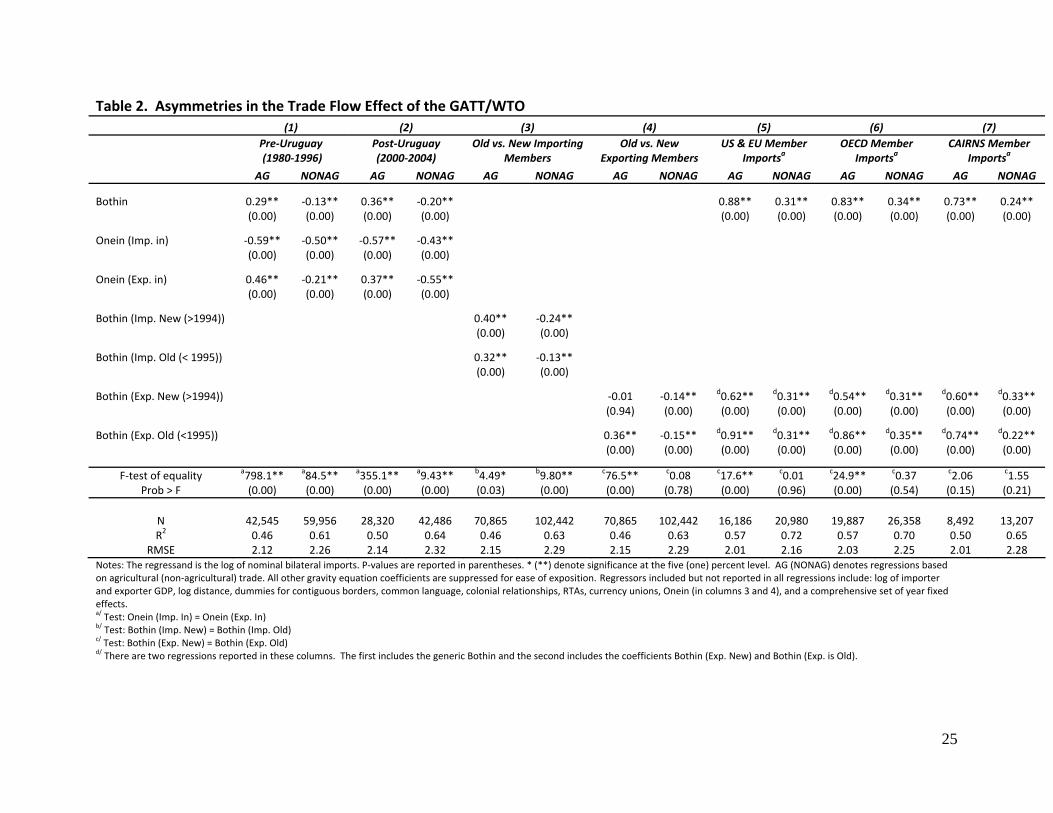
This section explores possible asymmetries in GATT/WTO membership. The results are presented in
Table 2. To save on space, the standard gravity equation coefficients are suppressed for ease of
20 For a discussion of the effect of RTAs on trade see Baier and Bergstrand 2007 or Grant and Lambert 2008. The trade impacts of customs unions are explored in Glick and Rose 2006. 21 SW’s (2007) hierarchical coding defines GATT/WTO membership mutually exclusive from membership in RTAs or currency unions. Under this assumption, when GATT/WTO members participate in RTAs or currency unions contemporaneously, the Bothin coefficient is coded as zero to reflect the fact that RTAs or currency unions represent the culmination of economic integration and liberalization.

13
exposition.22 We also limit the majority of our discussion to the results for AG trade. The majority of the
GATT/WTO coefficients for NONAG trade remain negative and significant or statistically insignificant.
Columns 1 and 2 investigate whether the previous results (Table 1) are driven by the implementation of
the UR which brought AG under the disciplines of the GATT/WTO for the first time. Columns 3 and 4
examine differences in “new” (> 1994) versus “old” (< 1995) importing members. Finally, in columns 5,
6, and 7, we investigate exporter access to some of the largest importing markets in world trade ‐
US/EU, OECD, and the CAIRNS group – conditional on exporter membership status.
The UR is deemed to have offered little progress in liberalizing agricultural trade policies (Josling
1998; Meilke et al. 2001). Empirically, however, members’ AG trade was 43 percent higher relative to
non‐members after the implementation of the UR (column 2) compared to 34 percent higher prior to
the agreement (column 1). While this difference is relatively modest, it is statistically significant.23 The
pattern of trade diversion in both the pre‐ and post‐UR samples is similar to that reported in the
previous section. Members imported 43 ((exp((‐0.59‐0.57)/2)‐1)*100) percent less from the average
non‐member exporter (Onein (Imp. In)) pre‐ and post‐UR, whereas member exporters traded 51
((exp((0.46+0.37)/2)‐1)*100) percent more with non‐member importers (relative to AG trade between
two similar non‐members). The latter finding suggests that non‐members are more inclined to source
their AG products from partner countries that are GATT/WTO members.
Columns 3 and 4 consider the case of “new” (WTO) versus “old” (GATT) importing and exporting
members, respectively.24 While “old” members have participated in as many as seven rounds of trade
negotiations (up to the UR) and may thus be relatively more open to trade than newer members, since
its creation in 1995, the WTO as subsequently demanded more concessions from its “new” members.
For “new” importing members, the coefficient estimate of 0.40 implies a 49 percent increase in trade
which is higher than the 38 percent increase in trade between older GATT members. This difference is
statistically significant and is consistent with Tang and Wei (2006) who show that the WTO has required
more stringent commitments from its members than were required of GATT members. The reverse is
true for exporters: long‐standing exporters enjoy greater access to members’ import markets (column
4). This result is consistent with GATT/WTO reciprocity: older exporting members, those who have
22 The standard gravity coefficients omitted in Table 2 are statistically significant, are of the correct sign, and remain so throughout. 23 We ran an additional regression on all years (1980‐2004) with two separate Bothin variables: one for the pre‐UR period (Bothinpre‐UR) and one for the post‐UR period (Bothinpost‐UR). A test of equality of the coefficients on Bothinpre‐UR and Bothinpost‐UR was rejected (p‐value = 0.02). 24 For each regression in columns 3 and 4, the variable Onein is included to retain Nonein as the benchmark but its coefficient has been suppressed for ease of exposition.
14
engaged in as many as seven negotiating rounds, have benefitted relatively more from reciprocal trade
concessions in importing markets.
The final columns in Table 2 (columns 5‐7) report results based on a subset of US/EU, OECD, and
CAIRNS group import data.25 This framework is appealing because it provides a clean interpretation of
the results since the exporting country is either a member (Bothin) or a non‐member (the benchmark).
The results are impressive: membership in the GATT/WTO is a significant determinant of market access
in industrialized countries. Relative to non‐members, the US/EU imported 2.4 times more, OECD
countries imported 2.3 times more, and CAIRNS group members imported 2.1 times more AG products.
In addition, for AG imports the coefficient estimates of joint membership are more than twice the size of
the trade flow effects for NONAG imports, once again underscoring the relative importance of
GATT/WTO membership for AG trade.
Differences in US/EU, OECD, and CAIRNS imports from “new” versus “old” members were also
evaluated in separate regressions (columns 5‐7, lower part of Table 2). While “new” exporters have
benefited relative to non‐members, the results suggest that reciprocity has benefited “old” exporters
relatively more, even though many aspects of agricultural policy were excluded prior to the UR.
5.3 Revisiting Subramanian and Wei’s Agricultural Trade Effect
Rose’s (2004a) benchmark model, which was used in the previous sections, has been criticized
on two fronts. First, SW (2007) argue the model is mis‐specified because it does not control for time‐
varying importer and exporter multilateral resistance (fixed effects). Second, SW (2007) demonstrate
that while the GATT/WTO generally promotes trade, this is not the case for DING nations or AG trade
because these countries and sectors have been excluded from trade liberalization efforts. In this final
section, we revisit SW’s (2007) conclusions by considering separately AG and NONAG trade flows and
incorporate a comprehensive set of time‐varying importer and exporter fixed effects in each regression.
The results along with a series of statistical tests of equality of the various GATT/WTO coefficients (H1‐
H16) are reported in Table 3.
The model continues to produce robust evidence that joint membership in the GATT/WTO has
delivered significant trade flow benefits for members’ AG trade. Relative to non‐members, member
nations imported an average of 68 percent more from other exporting members (column 1). While this
result is roughly half the trade flow benefit generated by membership in an RTA (exp(0.83)‐1=129%), it is
more than double the institution’s effect on members’ NONAG trade (31% increase). Moreover, the AG 25 The CAIRNS group, named after the Australian city of Cairns, is a coalition of 19 agricultural exporting countries whose objective is to bring about aggressive improvements in agricultural market access (see http://www.cairnsgroup.org/introduction.html).

15
trade flow effect of members’ imports from a non‐member (Exp. Not In) is insignificant, and a test of
equality of the membership status of the exporting country is easily rejected (H1, lower portion of Table
3). Thus, SW’s (2007) (negative) conclusion regarding the GATT/WTO’s impact on AG trade as a whole
has seriously underestimated the institution’s role in this sector.
Column 2 relaxes the restriction that the GATT/WTO has promoted trade equally for all
importing members. In this scenario, importers are divided into DC, DING country, and LDC members.
The results are consistent with the asymmetric structure of the GATT/WTO (SW 2007). DCs have
witnessed larger increases in their AG and NONAG imports as a result of GATT/WTO membership (127%
and 146% for AG and NONAG, respectively) and the paired F‐tests reported in the lower portion of
Table 3 (column 2) support this result (H2‐H4). Where our results differ from SW (2007) is in the
comparison of DING and LDCs across AG and NONAG sectors. When considering AG trade, the
coefficient estimates on DING and LDC imports are positive and marginally significant. For NONAG
imports by DING and LDC members, however, the coefficients are both negative and significantly so in
the case of LDCs.26
Column 3 considers the development status of importing members, and also the membership
status of the exporting country. In this scenario, DC AG and NONAG imports are even larger when the
exporting nation is also a member of the GATT/WTO (Exp. Also In). Joint membership raises DC AG and
NONAG trade by a remarkable 148 and 186 percent, respectively, suggesting that exporting members
have a significant advantage in terms of accessing DC import markets.27. Relative to this, the benefits
accrued to exporters accessing DING and LDC import markets, who are relatively less open to trade,
reflect a smaller trade benefit. This result is consistent with SW (2007) and confirmed, at least for LDC
imports, by the hypothesis test, H7 (Table 3).
Column 4 further investigates exporters’ access to DC markets. The previous specification
(column 3) found that DC members imported significantly more from the average exporting member.
However, the question remains: do all exporting members benefit equally in terms of their access to DC
import markets? The institutional design of the GATT/WTO offers some answers to this question (SW
2007). If DING and LDC countries have not liberalized their markets to the extent DCs have, then these
countries may not benefit from reciprocal access to DC markets. Similarly, those products of export
26 It should be noted, however, that the positive and significant LDC trade effect for AG imports could be picking up an omitted variable effect. Trade liberalization on the part of LDCs was often a precondition for financing from the IMF and World Bank. Thus, the AG trade effects for LDCs should be prefaced with this in mind. 27 For DC importing members, the test of equality of exporting members versus non‐members is strongly rejected (H5, F‐statistic = 229.1; Table 3).
16
interest to DING and LDC members such as agriculture may not be covered by reciprocal liberalization in
DCs. If the institutional theory is correct then we would also expect to see no significant differences
between DC imports from DING and LDC members and non‐members (particularly for AG which
represents a relatively large share of DING and LDC exports).
The results, however, tell a different story (column 4). Regardless of their development status,
membership in the GATT/WTO is a significant determinant of exporters’ access to DC markets for the
export of AG products. Relative to non‐members, DC members exported 105 percent more, DING
countries exported 144 percent more, and LDCs exported 93 percent more AG goods to developed
country markets. In all cases, the differences in the coefficients of exporting members versus non‐
members for AG trade are statistically significant (H8‐H10). Membership for LDCs is particularly
noteworthy. In NONAG, there is no significant difference in the trade flow effect of LDC exporting
members and non‐members (H10, F‐statistic = 1.31), whereas for AG, the difference is highly significant
(H10, F‐statistic = 78.25). This result suggests that, beyond improvements due to trade liberalization,
membership in the GATT/WTO offers other benefits that can positively influence trade flows. We return
to this issue in our concluding remarks.
There are two additional results in column 4 worth highlighting. First, SW (2007) contend that
the GATT/WTO is a club for DCs with little or no benefit for DING countries. Importantly, our results
contradict this conclusion ‐ DING exporters gained relatively more than DC exporters in terms of
accessing DC import markets! This is confirmed by the test (H11) which rejects the equality of these two
coefficients. Thus, DING countries wishing to benefit from greater market access in DC markets, can do
so by joining the GATT/WTO. The second interesting finding in Table 3 relates to the comparison of the
trade flow coefficients on DC and LDC exports to DC import markets (0.72 versus 0.66, respectively).
Interestingly, testing the equality between DC exporters and LDC exporters (H12) could not be rejected.28
Finally, we revisit the issue of “new” versus “old” exporters (column 5) using the theoretically
consistent gravity equation (Equation 4). The results are broadly consistent with the findings presented
in Section 5.2. Older exporting members – those who joined the GATT/WTO prior to 1995 – have gained
significantly more in terms of access to importing members’ markets. Long‐standing exporters saw their
AG (NONAG) trade increase by 75 (39) percent relative to trade between non‐members, whereas the
trade flow effect for new exporters was not significant for AG trade and significantly negative for
28 For NONAG trade, the results are closer to what would be anticipated. GATT/WTO membership benefitted DC exports the most, followed closely by DING and then LDCs. The differences between these impacts by development status are statistically significant in the NONAG regression (H11‐H13).
17
NONAG trade. Because trade policy commitments are often implemented over time, older members –
many whom have benefitted from decades of GATT/WTO liberalization efforts – appear to reap most of
the benefits of mutually agreed reductions in trade barriers.29
6. Conclusions
Agricultural trade is often at the forefront of the multilateral trade negotiations, and the Doha
Development Agenda is no exception. The special treatment afforded to agriculture has cast doubt on
the usefulness of the multilateral organization as a forum to liberalize trade (SW 2007; Rose 2006b). This
article questioned recent empirical studies criticizing the GATT/WTO’s role in promoting agricultural
trade. Despite relatively high levels of protection and its exclusion from many negotiating rounds,
GATT/WTO membership has significantly boosted members’ agricultural trade, including developing
country exports. By more broadly characterizing agricultural trade as opposed to focusing attention on
specific and highly protected product lines (as in SW 2007), results suggest that joint membership in the
GATT/WTO increased agricultural trade by a remarkable 68 percent, on average, using our preferred
specification (Table 3, column 1). By comparison, the increase in members’ non‐agricultural trade was
31 percent.
Developing economies, those countries that have a vested interest in expanding agricultural
exports, gained substantially from membership in the GATT/WTO. Although the GATT/WTO has made
few demands on these countries to open their markets, membership increased the agricultural exports
of developing and least‐developed countries to developed‐country markets by 144 and 93 percent
respectively. Moreover, the percentage increase in developing country exports to developed country
import markets was larger (both statistically and economically) than that of developed country exports.
This important result stands out against the SW (2007) and Balding (2010) analysis based on total
merchandise trade. Both sets of authors found that developing members have only slightly higher trade
flows to developed economies compared to developing non‐members. Thus, participation in the
GATT/WTO clearly “has its privileges”.
29 Additional regressions (not reported) were conducted to gauge the robustness of the cutoff date (1995) that distinguishes new versus old members. First, we searched for breakpoints by defining “new” as those members that joined on or after 1992; on or after 1988; on or after 1984; and on or after 1980. The results are robust although trade flow differences in “new” versus “old” exporters falls as we approach 1980. Second, we restricted the sample to 1996‐2004 and included only those observations for which an US/EU/OECD importing member trades with an “new” exporter along with all non‐members. In this case “new” members benefit relative to non‐members, but the magnitude of the GATT/WTO effect is not nearly as large as that reported in Table 3 (column (5)). This suggests that it may take a decade, or more, before membership has a noticeable effect on trade. The results for “new” members likely reflect the lower bound of potential trade benefits from joining the GATT/WTO.

18
One final question remains. If the GATT/WTO has been unable to solve the problem of
agricultural protection and liberalization commitments were lenient for developing countries, why does
membership have such a strong impact? First, if pre‐existing distortions in agriculture were excessive,
even small reductions in protection from a relatively large base could generate a sizeable trade
response. Second, the GATT/WTO is more than just a forum to negotiate trade policy reductions. The
assumption that membership promotes trade through tariff cuts alone misses other channels through
which the multilateral organization has an impact. The GATT/WTO establishes procedures that reduce
uncertainty in international transactions, makes rules that render non‐tariff barriers more transparent,
and provides legal means to circumvent discriminatory action. Moreover, membership facilitates
coordination that provides incentives for countries to invest in trading relationships—incentives that
may not even exist when trade takes place with, or between, non‐members.
Countries that wish to expand their agricultural trade can do so by joining the GATT/WTO.
Accession generates sizeable trade flow gains, and more importantly, it establishes an atmosphere
conducive to commercial exchange. Not only does membership inhibit back‐sliding on trade
liberalization commitments, it also sets the stage for future negotiations that promise further reforms
and more trade.

19
References
[1] Anderson, J.E., and E. van Wincoop. 2003. “Gravity with Gravitas: A Solution to the Border
Puzzle.” American Economic Review 93(1): 170‐92.
[2] Bagwell, K., and R.W. Staiger. 1999. “An Economic Theory of GATT,” American Economic Review, 89(1): 214‐248.
[3] Bagwell, K., and R.W. Staiger. 2002. The Economics of the World Trading System. MIT Press,
Cambridge, Massachusetts and London, England. [4] Baier, S.L., and J.H. Bergstrand. 2007. “Do Free Trade Agreements Actually Increase Members’
International Trade?” Journal of International Economics 71(1): 72‐95. [5] Balding, C. 2010. “Joining the World Trade Organization: What is the Impact?,” Review of
International Economics, 18(1): 193‐206. [6] Bhagwati, J. 1991. The World Trading System at Risk. Princeton, N.J.: Princeton University Press. [7] Chang, P. L. and M.J. Lee. 2007. “The WTO Trade Effect,” Singapore Management University,
School of Economics Working Paper No. 06‐2007, Singapore, September. [8] Diaz‐Bonilla, E., S. Robinson, M. Thomas, and Y. Yanoma. 2001. “WTO, Agriculture and
Developing Countries,” Paper prepared for the Advisory Group, WTO Negotiations and Changes in National Agricultural and Trade Policies: Consequences for Developing Countries, IFPRI, Washington, DC., March.
[9] Eicher, T. S. and C. Henn. 2009. “In Search of WTO Trade Effects: Preferential Trade Agreements
Promote Trade Strongly, But Unevenly,” International Monetary Fund (IMF) Working Paper No. 0931, Washington, DC, March.
[10] Eichengreen, B., and D. Irwin. 1998. “The Role of History in Bilateral Trade Flows,” In The
Regionalization of the World Economy, edited by Jeffrey A. Frankel. Chicago: University of Chicago Press, pp. 33‐57.
[11] Engelbrecht, B., and C. Pearce. 2007. “The GATT/WTO has Promoted Trade, but Only in Capital‐
Intensive Commodities,” Applied Economics, 39(12): 1573‐1581. [12] Feenstra, R. 2004. Advanced International Trade: Theory and Evidence. Princeton, NJ: Princeton
University Press. [13] Feenstra, R., R.E. Lipsey, H. Deng, A.C. Ma, and H. Mo. 2005. “World Trade Flows: 1962‐2000”.
NBER Working Paper No. 11040.
[14] Frankel, J.A. 1997. Regional Trading Blocs in the World Economic System. Washington, DC: Institute for International Economics.
20
[15] Gibson, P., J. Wainio, D. Whitley, and M. Bohman. 2001. “Profiles of Tariffs in Global Agricultural Markets,” Agricultural Economic Report (AER) No. 796. Economic Research Service , United States Department of Agriculture, Washington, D.C.
[16] Glick, R. and A. Rose. 2002. “Does a Currency Union Affect Trade? The Time‐Series Evidence,” European Economic Review, 46(6): 1125‐1151.
[17] Grant, J.H. and D.M. Lambert. 2008. “Do Regional Trade Agreements Increase Members’
Agricultural Trade?” American Journal of Agricultural Economics, 90(3): 765‐782 [18] Helpman, E., M. Melitz, and Y. Rubinstein. 2008. “Estimating trade Flows: Trading Partners and
Trading Volumes,” Quarterly Journal of Economics, 123(2): 441‐487. [19] Herz, B., and M. Wagner. 2006. “Does the World Trade Organization and the Generalized
System of Preferences Foster Bilateral Trade?” Department of Economics Working Paper 12‐2006, Bayreuth University, Germany.
[20] Ingco, M.D. 1995. "Agricultural Liberalization in the Uruguay Round: One Step Forward, One
Step Back?" World Bank Policy Research Working Paper No. 1500, Washington, D.C. [21] Irwin, D.A. 1995. “The GATT in Historical Perspective,” American Economic Review, 85(2): 232‐
328. [22] Josling, T. 1998. “The Uruguay Round Agreement on Agriculture: A Forward‐Looking
Assessment.” OECD Workshop on Emerging Trade Issues in Agriculture, Paris, October 26‐28. [23] Liu, X. 2009. “GATT/WTO Promotes Trade Strongly: Sample Selection and Model Specification,”
Review of International Economics, 17(3): 428‐446. [24] Mayer, T. and S. Zignago. 2006. “Notes on CEPII’s Distance Measures,” unpublished
manuscript, Paris France, May. [25] Meilke, K., J. Rude, M. Burfisher, and M. Bredahl. 2001. “Market Access: Issues and Options in
the Agricultural Negotiations,” International Agricultural Trade Research Consortium Commissioned Paper No. 14625, University of Minnesota, Minneapolis, MN.
[26] Nicita A. and M. Olarreaga (2006), Trade, Production and Protection 1976‐2004, World Bank
Economic Review 21(1). [27] OECD (Organisation for Economic Co‐operation and Development). 2001. The Uruguay Round
Agreement on Agriculture: an evaluation of its implementation in OECD countries. OECD, Paris. [28] —. 2004. Agricultural Policies in OECD Countries: Monitoring and Evaluation in 2004. Paris,
September. [29] Rose, A. 2004a. “Do We Really Know That the WTO Increases Trade?” American Economic
Review 94(1): 8‐114.

21
[30] Rose, A. 2004b. “Do WTO Members have More Liberal Trade Policy?” Journal of International Economics, 63(2): 209‐235.
[31] Rose, A. 2006a. “Response to Subramanian and Wei,” Unpublished manuscript, University of
California, Berkeley, available at: http://faculty.haas.berkeley.edu/arose. [32] Rose, A. 2006b. “The Effect of Membership in the GATT/WTO on Trade: Where do we Stand?”
Unpublished manuscript, University of California, Berkeley, available at: http://faculty.haas.berkeley.edu/arose.
[33] Rose, A. 2007. “Do We Really Know That the WTO Increases Trade? Reply,” American Economic
Review, 97(5): 2019‐2025. [34] Subramanian, A., and S‐J. Wei. 2003. “The WTO Promotes Trade, Strongly but Unevenly," NBER
working paper # 10024. [35] Subramanian A., and S.J. Wei. 2007. The WTO Promotes Trade Strongly but Unevenly,” Journal
of International Economics, 72(1): 151‐175. [36] Tang, M.K. and Wei, S.J. 2006. “Is Bitter Medicine Good for You? The Economic
Consequences of WTO/GATT Accessions,” Paper presented at the Trade Conference, IMF, Washington, DC, April.
[37] Tomz, M., J.L. Goldstein, and D. Rivers. 2007. “Do We Really Know that the WTO Increases
Trade? Comment,” American Economic Review, 97(5): 2005‐2018. [38] Vollrath, T.L., M.J. Gehlhar, and C.B. Hallahan. 2009. “Bilateral Import Protection, Free Trade
Agreements, and Other Factors Influencing Trade Flows in Agriculture and Clothing,” Journal of Agricultural Economics, 60(2): 298‐317.
[39] WTO. 2007. World Trade Report 2007. Six Decades of Multilateral Trade Cooperation: What
have we Learnt? WTO Document WT/REG/E/37, March 2007. [40] —. 2008. “Revised Draft for Modalities for Agriculture,” World Trade Organization,
TN/AG/W/4/Rev.3, 10 July 2008.
22
t = 0.95 t = 4.66***
0%
5%
10%
15%
20%
25%
AG NONAG
Average Applied Tariff
Tariff R
ate
I
Member Non‐Member
t = ‐1.92* t = ‐3.08***
0%
5%
10%
15%
20%
25%
30%
35%
AG NONAG
Share of Duty‐Free Applied Tariffs
Share
II
Member Non‐Member
t = ‐1.19 t = ‐3.12***
0%
5%
10%
15%
20%
25%
30%
35%
40%
45%
50%
AG NONAG
Share of Applied Duties Greater Than 15%
Share
III
Member Non‐Member
t = 2.23** t = 0.55
0%
50%
100%
150%
200%
250%
300%
350%
400%
AG NONAG
Maximum Applied Rate
Tariff R
ate
IV
Member Non‐Member
Figure 1. Differences in GATT/WTO Members’ and Non‐Members’ Most Favored Nation Tariff Policies

23
t = ‐46.5*** t = ‐67.1***
0.00
1.00
2.00
3.00
4.00
5.00
6.00
7.00
8.00
AG NONAG
I. Differences in Mean of Log Trade
Log Trade
I
Bothin Onein or Nonein
t = ‐14.7*** t = ‐12.7***
‐0.20
‐0.15
‐0.10
‐0.05
0.00
0.05
0.10
0.15
AG NONAG
II. Differences In Mean Gravity Equation Residual, With Year Fixed Effects
Gravity Equation Residual
II
Bothin Onein or Nonein
t = ‐21.3*** t = ‐13.2***
‐0.40
‐0.30
‐0.20
‐0.10
0.00
0.10
0.20
0.30
AG NONAG
III. Difference In Means of Gravity Equation Residual, With Year Fixed Effects
Gravity Equation Residual
III
Developed Country In, Exporter Also In Exporter Not In
t = ‐23.2*** t = ‐13.1
‐0.80
‐0.60
‐0.40
‐0.20
0.00
0.20
0.40
0.60
AG NONAG
IV. Difference In Means of Gravity Equation Residual, With Year Fixed Effects
Gravity Equation Residual
IV
Developed Importer In, Developing Exporter Also In Exporter Developing Country Not In
Figure 2. Differences in GATT/WTO Members’ and Non‐Members’ Trade Flows and Gravity Equation Residuals
24
Table 1. Core GATT/WTO Results, Panel Data with Year Fixed Effects, 1980‐2004
1. Total Trade
2. AG versus NONAG
3. SW (2007) Hierarchical Coding
4. Country‐Pairs NOT in GATT/WTO
5. Asymmetric Onein Coeff.
6. With Time & Country‐Pair FE
7. With Time & Country‐Pair RE
AG NAG AG NONAG AG NONAG AG NONAG AG NONAG AG NONAG
lnGDP (it) 1.20** 0.74** 1.17** 0.74** 1.17** 0.75** 1.18** 0.70** 1.23** 0.28** 0.54** 0.68** 1.13** (0.00) (0.00) (0.00) (0.00) (0.00) (0.00) (0.00) (0.00) (0.00) (0.00) (0.00) (0.00) (0.00)
lnGDP (jt) 0.86** 0.54** 0.82** 0.54** 0.82** 0.55** 0.83** 0.57** 0.86** 0.41** 0.64** 0.50** 0.79** (0.00) (0.00) (0.00) (0.00) (0.00) (0.00) (0.00) (0.00) (0.00) (0.00) (0.00) (0.00) (0.00)
lnDIST (ij) ‐1.12** ‐0.88** ‐1.14** ‐0.88** ‐1.13** ‐0.87** ‐1.13** ‐0.88** ‐1.18** ‐0.92** ‐1.21** (0.00) (0.00) (0.00) (0.00) (0.00) (0.00) (0.00) (0.00) (0.00) (0.00) (0.00)
Border (ij) 0.77** 0.70** 0.76** 0.70** 0.76** 0.70** 0.76** 0.71** 0.79** 0.98** 1.08** (0.00) (0.00) (0.00) (0.00) (0.00) (0.00) (0.00) (0.00) (0.00) (0.00) (0.00)
Lang (ij) 0.46** 0.53** 0.41** 0.53** 0.41** 0.55** 0.42** 0.53** 0.40** 0.47** 0.37** (0.00) (0.00) (0.00) (0.00) (0.00) (0.00) (0.00) (0.00) (0.00) (0.00) (0.00)
Colony (ij) 0.55** 0.76** 0.55** 0.76** 0.55** 0.74** 0.54** 0.76** 0.59** 1.02** 0.79** (0.00) (0.00) (0.00) (0.00) (0.00) (0.00) (0.00) (0.00) (0.00) (0.00) (0.00)
ComCol (ij) 0.52** 0.33** 0.49** 0.34** 0.49** 0.36** 0.51** 0.33** 0.54** 0.27** 0.40** (0.00) (0.00) (0.00) (0.00) (0.00) (0.00) (0.00) (0.00) (0.00) (0.00) (0.00)
CurCol (ij) ‐0.23 0.45** ‐0.34** 0.41* ‐0.36** 0.30 ‐0.42** 0.49** ‐0.29 0.58 ‐0.36 (0.19) (0.01) (0.04) (0.02) (0.03) (0.08) (0.00) (0.01) (0.10) (0.11) (0.33)
Colony_1945 (ij) 1.17** 0.77** 1.04** 0.76** 1.03** 0.77** 1.05** 0.77** 1.03** 0.89** 1.22** (0.00) (0.00) (0.00) (0.00) (0.00) (0.00) (0.00) (0.00) (0.00) (0.00) (0.00)
Same Country (ij) 0.92** 0.48** 0.68** 0.49** 0.69** 0.51** 0.70** 0.48** 0.80** 0.49** 0.76** (0.00) (0.00) (0.00) (0.00) (0.00) (0.00) (0.00) (0.00) (0.00) (0.00) (0.00)
ln[Areai*Areaj] ‐0.12** 0.01** ‐0.12** 0.01** ‐0.12** 0.01** ‐0.12** 0.02** ‐0.13** 0.03** ‐0.10** (0.00) (0.00) (0.00) (0.00) (0.00) (0.00) (0.00) (0.00) (0.00) (0.00) (0.00)
No. Landlocked (ij) ‐0.35** ‐0.39** ‐0.30** ‐0.39** ‐0.30** ‐0.40** ‐0.30** ‐0.39** ‐0.29** ‐0.34** ‐0.35** (0.00) (0.00) (0.00) (0.00) (0.00) (0.00) (0.00) (0.00) (0.00) (0.00) (0.00)
No. Island (ij) 0.27** 0.28** 0.30** 0.27** 0.30** 0.26** 0.29** 0.28** 0.28** 0.23** 0.26** (0.00) (0.00) (0.00) (0.00) (0.00) (0.00) (0.00) (0.00) (0.00) (0.00) (0.00)
RTA (ijt) 0.65** 1.21** 0.61** 1.50** 0.43** 1.29** 0.67** 1.19** 0.64** 0.49** 0.30** 0.64** 0.40** (0.00) (0.00) (0.00) (0.00) (0.00) (0.00) (0.00) (0.00) (0.00) (0.00) (0.00) (0.00) (0.00)
CU (ijt) 0.91** 0.40** 0.78** 0.60** 0.59** 0.45** 0.83** 0.38** 0.80** 0.22 ‐0.04 0.18** 0.39** (0.00) (0.04) (0.00) (0.00) (0.00) (0.00) (0.00) (0.00) (0.00) (0.33) (0.87) (0.19) (0.00)
Bothin (ijt) 0.03 0.33** ‐0.17** 0.32** ‐0.16** 0.33** ‐0.15** 0.33** 0.21** 0.34** 0.12** (0.28) (0.00) (0.00) (0.00) (0.00) (0.00) (0.00) (0.00) (0.00) (0.00) (0.00)
Onein (ijt) ‐0.25** 0.04 ‐0.36** 0.03 ‐0.36** 0.18** 0.09** 0.13** ‐0.06* (0.00) (0.27) (0.00) (0.49) (0.00) (0.00) (0.01) (0.00) (0.08)
Onein (Imp. in) (ijt) ‐0.53** ‐0.45** (0.00) (0.00)
Onein (Exp in) (ijt) 0.43** ‐0.33** (0.00) (0.00)
Nonein (ijt) a0.13** ‐0.18** 0.27** (0.00) (0.00) (0.00)
N 109,906 70,865 102,442 70,865 102,442 70,865 102,442 70,865 102,442 71,293 103,231 70,865 102,442
R2 0.63 0.43 0.65 0.46 0.65 0.46 0.62 0.47 0.63 0.87 0.88 0.46 0.62
Root MSE 2.24 2.36 2.07 2.15 2.07 2.15 2.29 2.13 2.29 1.23 1.51 ‐‐‐‐ ‐‐‐‐ Notes: The regressand is the log of nominal bilateral trade flows. P‐values are reported in parentheses. * (**) denotes significance at the five (one) percent level. AG (NONAG) denotes regressions based on agricultural (non‐agricultural) trade. FE (RE) denotes fixed (random) effects. The variables No. Landlocked (ij) and No. Island (ij) are indicators variables equal to zero, one, or two depending on how many countries are landlocked or island in the country‐pair, respectively. a/ Estimated in a separate regression.
25
Table 2. Asymmetries in the Trade Flow Effect of the GATT/WTO (1) (2) (3) (4) (5) (6) (7)
Pre‐Uruguay (1980‐1996)
Post‐Uruguay (2000‐2004)
Old vs. New Importing Members
Old vs. New Exporting Members
US & EU Member Importsa
OECD Member Importsa
CAIRNS Member Importsa
AG NONAG AG NONAG AG NONAG AG NONAG AG NONAG AG NONAG AG NONAG
Bothin 0.29** ‐0.13** 0.36** ‐0.20** 0.88** 0.31** 0.83** 0.34** 0.73** 0.24** (0.00) (0.00) (0.00) (0.00) (0.00) (0.00) (0.00) (0.00) (0.00) (0.00)
Onein (Imp. in) ‐0.59** ‐0.50** ‐0.57** ‐0.43** (0.00) (0.00) (0.00) (0.00)
Onein (Exp. in) 0.46** ‐0.21** 0.37** ‐0.55** (0.00) (0.00) (0.00) (0.00)
Bothin (Imp. New (>1994)) 0.40** ‐0.24** (0.00) (0.00)
Bothin (Imp. Old (< 1995)) 0.32** ‐0.13** (0.00) (0.00)
Bothin (Exp. New (>1994)) ‐0.01 ‐0.14** d0.62** d0.31** d0.54** d0.31** d0.60** d0.33** (0.94) (0.00) (0.00) (0.00) (0.00) (0.00) (0.00) (0.00)
Bothin (Exp. Old (<1995)) 0.36** ‐0.15** d0.91** d0.31** d0.86** d0.35** d0.74** d0.22** (0.00) (0.00) (0.00) (0.00) (0.00) (0.00) (0.00) (0.00)
F‐test of equality a798.1** a84.5** a355.1** a9.43** b4.49* b9.80** c76.5** c0.08 c17.6** c0.01 c24.9** c0.37 c2.06 c1.55 Prob > F (0.00) (0.00) (0.00) (0.00) (0.03) (0.00) (0.00) (0.78) (0.00) (0.96) (0.00) (0.54) (0.15) (0.21)
N 42,545 59,956 28,320 42,486 70,865 102,442 70,865 102,442 16,186 20,980 19,887 26,358 8,492 13,207 R2 0.46 0.61 0.50 0.64 0.46 0.63 0.46 0.63 0.57 0.72 0.57 0.70 0.50 0.65
RMSE 2.12 2.26 2.14 2.32 2.15 2.29 2.15 2.29 2.01 2.16 2.03 2.25 2.01 2.28 Notes: The regressand is the log of nominal bilateral imports. P‐values are reported in parentheses. * (**) denote significance at the five (one) percent level. AG (NONAG) denotes regressions based on agricultural (non‐agricultural) trade. All other gravity equation coefficients are suppressed for ease of exposition. Regressors included but not reported in all regressions include: log of importer and exporter GDP, log distance, dummies for contiguous borders, common language, colonial relationships, RTAs, currency unions, Onein (in columns 3 and 4), and a comprehensive set of year fixed effects. a/ Test: Onein (Imp. In) = Onein (Exp. In) b/ Test: Bothin (Imp. New) = Bothin (Imp. Old) c/ Test: Bothin (Exp. New) = Bothin (Exp. Old) d/ There are two regressions reported in these columns. The first includes the generic Bothin and the second includes the coefficients Bothin (Exp. New) and Bothin (Exp. is Old).

26
Table 3. Asymmetric Effects of GATT/WTO Membership by Development Status (1) (2) (3) (4) (5)
Importing Member; Exporter In/Not In
DC, DING, & LDC Member Imports
DC/DING/LDC Member Imports; Exporter is
In/Not In DC/DING/LDC Access
to DC Members New vs. Old Exporters
AG NONAG AG NONAG AG NONAG AG NONAG AG NONAG lnDIST (ij) ‐1.22** ‐1.49** ‐1.22** ‐1.50** ‐1.22** ‐1.50** ‐1.23** ‐1.49** ‐1.22** ‐1.49** (0.00) (0.00) (0.00) (0.00) (0.00) (0.00) (0.00) (0.00) (0.00) (0.00) Border (ij) 0.59** 0.51** 0.60** 0.50** 0.56** 0.46** 0.56** 0.46** 0.59** 0.51** (0.00) (0.00) (0.00) (0.00) (0.00) (0.00) (0.00) (0.00) (0.00) (0.00) Lang (ij) 0.44** 0.50** 0.44** 0.51** 0.43** 0.49** 0.44** 0.51** 0.43** 0.50** (0.00) (0.00) (0.00) (0.00) (0.00) (0.00) (0.00) (0.00) (0.00) (0.00) Colony (ij) 0.64** 0.50** 0.64** 0.50** 0.64** 0.50** 0.63** 0.49** 0.64** 0.50** (0.00) (0.00) (0.00) (0.00) (0.00) (0.00) (0.00) (0.00) (0.00) (0.00) ComCol (ij) 0.83** 0.78** 0.83** 0.77** 0.82** 0.77** 0.81** 0.76** 0.82** 0.78** (0.00) (0.00) (0.00) (0.00) (0.00) (0.00) (0.00) (0.00) (0.00) (0.00) CurCol (ij) 0.29 ‐0.11 0.34* ‐0.01 0.34* 0.02 0.34* ‐0.04 0.29* ‐0.10 (0.05) (0.46) (0.02) (0.94) (0.02) (0.91) (0.02) (0.80) (0.05) (0.50) Colony_1945 (ij) 0.80** 1.02** 0.81** 1.02** 0.81** 1.02** 0.82** 1.04** 0.80** 1.01** (0.00) (0.00) (0.00) (0.00) (0.00) (0.00) (0.00) (0.00) (0.00) (0.00) Same Country (ij) 0.47** 0.57** 0.41** 0.48** 0.43** 0.50** 0.43** 0.48** 0.46** 0.56** (0.00) (0.00) (0.00) (0.00) (0.00) (0.00) (0.00) (0.00) (0.00) (0.00) RTA (ijt) 0.83** 0.05 0.99** 0.41** 0.96** 0.39** 0.84** 0.57** 0.83** 0.05 (0.00) (0.69) (0.00) (0.00) (0.00) (0.00) (0.00) (0.00) (0.00) (0.68) CU (ijt) 0.73** 1.02** 0.72** 0.80** 0.64** 0.73** 0.51** 1.03** 0.74** 1.04** (0.00) (0.00) (0.00) (0.00) (0.00) (0.00) (0.00) (0.00) (0.00) (0.00) Imp. In; Exp. Also In 0.52** 0.27* (0.00) (0.04) Imp. In; Exp. Not in 0.08 ‐0.29* 0.09 ‐0.28* (0.55) (0.03) (0.51) (0.04) DC Imp. In 0.82** 0.90** (0.00) (0.00) DING Imp. In 0.20 ‐0.02 (0.16) (0.87) LDC Imp. In 0.36* ‐0.60** (0.03) (0.00) Imp. is DC In; Exp. Also In 0.91** 1.05** (0.00) (0.00) Imp. is DC In; Exp. Not In 0.24 0.22 (0.10) (0.13) Imp. is DING In; Exp. Also In 0.15 ‐0.04 (0.30) (0.76) Imp. is DING In; Exp. Not In ‐0.04 ‐0.45** (0.78) (0.00) Imp. is LDC In; Exp. Also In 0.22 ‐0.75** (0.20) (0.00) Imp. is LDC In; Exp. Not In 0.30 ‐0.88** (0.10) (0.00) Imp. is DC In; Exp. is DC Also In 0.72** 1.32** (0.00) (0.00) Imp. is DC In; Exp. DC Not In 0.08 0.94** (0.47) (0.00) Imp. is DC In; Exp. is DING Also In 0.89** 1.25** (0.00) (0.00) Imp. is DC In; Exp. DING Not In 0.32** 0.40** (0.00) (0.00) Imp. is DC In; Exp. is LDC Also In 0.66** 0.73** (0.00) (0.00) Imp. is DC In; Exp. LDC Not In ‐0.20 0.64** (0.09) (0.00) Imp. In, Exp. is NEW Member 0.01 ‐0.33* (0.94) (0.02)

27
Imp. In, Exp. is OLD Member 0.56** 0.33* (0.00) (0.01) H1: Exp. In = Exp. Not In 115.3** 271.8** Prob > F (0.00) (0.00) H2: DC Imp. In = DING Imp. In 44.6** 94.2** Prob > F (0.00) (0.00) H3:DC Imp. In = LDC Imp. In 10.5** 123.6** Prob > F (0.00) (0.00) H4: DING Imp. In = LDC Imp. In 1.28 18.85** Prob > F (0.26) (0.00) H5 (DC Imp. In): Exp. In = Exp. Not In 229.1** 473.9** Prob > F (0.00) (0.00) H6 (DING Imp. In): Exp.In =Exp.Not In 14.5** 99.69** Prob > F (0.00) (0.00) H7 (LDC Imp. In): Exp.In = Exp.Not In 1.12 5.38* Prob > F (0.29) (0.02) H8 (DC Imp. In): DC Exp.In =DC Exp. Not In 86.3** 44.7** Prob > F (0.00) (0.00) H9(DC Imp. In): DINGExp.In=DINGExp.Not In 140.5** 418.8** Prob > F (0.00) (0.00) H10 (DC Imp. In): LDC Exp.In = LDC Exp. Not In 78.25** 1.31 Prob > F (0.00) (0.25) H11: DC Exp. In = DING Exp. In 21.4** 4.21* Prob > F (0.00) (0.04) H12: DC Exp. In = LDC Exp. In 1.08 142.7** Prob > F (0.30) (0.00) H13: DING Exp. In = LDC Exp. In 14.6** 116.5** Prob > F (0.00) (0.00) H14: Exp. New = Exp. Old 61.2** 117.3** Prob > F (0.00) (0.00) H15: Exp. New = Exp. Not In 1.04 0.51 Prob > F (0.31) (0.48) H16: Exp. Old = Exp. Not In 131.5** 313.9** Prob > F (0.00) (0.00)
N 70,865 102,442 70,865 102,442 70,865 102,442 70,865 102,442 70,865 102,442 R2 0.62 0.55 0.62 0.54 0.62 0.55 0.62 0.55 0.62 0.55
RMSE 1.72 1.90 1.72 1.90 1.72 1.89 1.72 1.89 1.72 1.89
Notes: Notes: The regressand is the log of nominal bilateral trade flows. P‐values are reported in parentheses. * (**) denotes significance at the five (one) percent level. AG (NONAG) denotes regressions based on agricultural (non‐agricultural) trade. FE (RE) denotes fixed (random) effects. The variables No. Landlocked (ij) and No. Island (ij) are indicators variables equal to zero, one, or two depending on how many countries are landlocked or island in the country‐pair, respectively.

28
Appendix Table 1: Countries in Sample (Accession Date), [Development and New Members] Developed Countries (DC)
Andorra(‐‐‐)[DC] Czech Republic(1993)[DC] Ireland(1967)[DC] Portugal(1962)[DC]
Antigua and Barbuda(1987)[DC] Denmark(1950)[DC] Israel(1962)[DC] Qatar(1996)[DC & NEW]
Aruba(‐‐‐)[DC] Equatorial Guinea(‐‐‐)[DC] Italy(1950)[DC] Saudi Arabia(‐‐‐)[DC]
Australia(1948)[DC ] Estonia(1999)[DC & NEW] Japan(1955)[DC] Singapore(1973)[DC]
Austria(1951)[DC] Faroe Islands(‐‐‐)[DC] Kuwait(1963)[DC] Slovakia(1993)[DC]
Bahamas(‐‐‐)[DC] Finland(1950)[DC] Macau (Aomen)(1991)[DC] Slovenia(1995)[DC & NEW]
Bahrain(1993)[DC] France(1948)[DC] Malta(1964)[DC] South Korea(1967)[DC]
Barbados(1967)[DC] French Polynesia(‐‐‐)[DC] Mariana Islands(‐‐‐)[DC] Spain(1963)[DC]
Belgium and Luxembourg(1948)[DC] Germany(1951)[DC] Martinique(‐‐‐)[DC] Sweden(1950)[DC]
Bermuda(‐‐‐)[DC] Greece(1950)[DC] Monaco(‐‐‐)[DC] Switzerland(1966)[DC]
British Virgin Islands(‐‐‐)[DC] Greenland(‐‐‐)[DC] Netherland Antilles(1995)[DC & NEW] Taiwan(2002)[DC & NEW]
Brunei Darussalam(1993)[DC] Guadeloupe(‐‐‐)[DC] Netherlands(1948)[DC] Trinidad and Tobago(1962)[DC]
Canada(1948)[DC] Guam(‐‐‐)[DC] New Caledonia(‐‐‐)[DC] U.S. Virgini Islands(‐‐‐)[DC]
Cayman Islands(‐‐‐)[DC] Hong Kong(1986)[DC] New Zealand(1948)[DC] United Arab Emirates(1994)[DC]
Croatia(2000)[DC & NEW] Hungary(1973)[DC] Norway(1948)[DC] United Kingdom(1948)[DC]
Cyprus(1963)[DC] Iceland(1968)[DC] Oman(2000)[DC] United States of America(1948)[DC]
Developing Countries (DING) Albania(2000)[DING & NEW] Dominica(1993)[DING] Macedonia (former Yugoslav Rep.)(2003)[DING & NEW] Russian Federation(‐‐‐)[DING]
Algeria(‐‐‐)[DING] Dominican Republic(1950)[DING] Malaysia(1957)[DING] Saint Lucia(1993)[DING]
American Somoa(‐‐‐)[DING] East Timor(‐‐‐)[DING] Maldives(1983)[DING] Samoa(‐‐‐)[DING]
Angola(1996)[DING & NEW] Ecuador(1996)[DING & NEW] Marshall Islands(‐‐‐)[DING] Sao Tome and Principe(‐‐‐)[DING]
Anguilla(‐‐‐)[DING] Egypt(1970)[DING] Mauritius(1970)[DING] Serbia and Montenegro(‐‐‐)[DING]
Argentina(1967)[DING] El Salvador(1991)[DING] Mayotte(‐‐‐)[DING] Seychelles(‐‐‐)[DING]
Armenia(2003)[DING & NEW] Fiji(1993)[DING] Mexico(1986)[DING] Solomon Islands(1996)[DING & NEW]
Azerbaijan(‐‐‐)[DING] Gabon(1963)[DING] Micronesia (Federated States of)(‐‐‐)[DING] South Africa(1948)[DING]
Belarus(‐‐‐)[DING] Georgia(2000)[DING & NEW] Moldova, Rep.of(2001)[DING & NEW] Sri Lanka(1948)[DING]
Belize(1983)[DING] Gibraltar(‐‐‐)[DING] Mongolia(1997)[DING & NEW] St. Kitts and Nevis(1996)[DING & NEW]
Bhutan(‐‐‐)[DING] Grenada(1996)[DING & NEW] Montserrat(‐‐‐)[DING] St. Vincent /Grenadines(1993)[DING]
Bolivia(1990)[DING] Guatemala(1991)[DING] Morocco(1987)[DING] Sudan(‐‐‐)[DING]
Bosnia and Herzegovina(‐‐‐)[DING] Guyana(1966)[DING] Namibia(1992)[DING] Suriname(1978)[DING]
Botswana(1987)[DING] Honduras(1995)[DING & NEW] Nauru(‐‐‐)[DING] Swaziland(1995)[DING & NEW]
Brazil(1948)[DING] India(1948)[DING] Nicaragua(1950)[DING] Syrian Arab Republic(‐‐‐)[DING]
Bulgaria(1996)[DING & NEW] Indonesia(1950)[DING] Nigeria(1960)[DING] Thailand(1982)[DING]
Cameroon(1963)[DING] Iran(‐‐‐)[DING] Pakistan(1948)[DING] Tonga(‐‐‐)[DING]
Cape Verde(‐‐‐)[DING] Iraq(‐‐‐)[DING] Palau(‐‐‐)[DING] Tunisia(1990)[DING]
Chile(1949)[DING] Jamaica(1963)[DING] Palestine(‐‐‐)[DING] Turkey(1951)[DING]
China(2001)[DING & NEW] Jordan(2000)[DING & NEW] Panama(1997)[DING & NEW] Turkmenistan(‐‐‐)[DING]
Colombia(1981)[DING] Kazakstan(‐‐‐)[DING] Papua New Guinea(1996)[DING & NEW] Turks and Caicos Islands(‐‐‐)[DING]
Congo(1963)[DING] Kiribati(‐‐‐)[DING] Paraguay(1995)[DING & NEW] Tuvalu(‐‐‐)[DING]
Cook Islands(‐‐‐)[DING] Latvia(1999)[DING & NEW] Peru(1951)[DING] Ukraine(‐‐‐)[DING]
Costa Rica(1990)[DING] Lebanon(‐‐‐)[DING] Philippines(1979)[DING] Uruguay(1953)[DING]
Côte d'Ivoire(1963)[DING] Lesotho(1988)[DING] Poland(1967)[DING] Vanuatu(‐‐‐)[DING]
Cuba(1948)[DING] Libyan Arab Jamahiriya(‐‐‐)[DING] Reunion(‐‐‐)[DING] Venezuela(1990)[DING]
Djibouti(1995)[DING & NEW] Lithuania(2001)[DING & NEW] Romania(1971)[DING] Yugoslavia(1966)[DING]
Least‐Developed Countries (LDCs) Afghanistan(‐‐‐)[LDC] Eritrea(‐‐‐)[LDC] Madagascar(1963)[LDC] Somalia(‐‐‐)[LDC]
Bangladesh(1972)[LDC] Ethiopia(‐‐‐)[LDC] Malawi(1964)[LDC] Tajikistan(‐‐‐)[LDC]
Benin(1963)[LDC] Gambia(1965)[LDC] Mali(1993)[LDC] Tanzania, United Rep. of(1961)[LDC]
Burkina Faso(1963)[LDC] Ghana(1957)[LDC] Mauritania(1963)[LDC] Togo(1964)[LDC]
Burma(1995)[LDC & NEW] Guinea(1995)[LDC & NEW] Mozambique(1992)[LDC] Uganda(1962)[LDC]
Burundi(1965)[LDC] Guinea‐Bissau(1995)[LDC & NEW] Nepal(2004)[LDC & NEW] Uzbekistan(‐‐‐)[LDC]
Cambodia(2004)[LDC & NEW] Haiti(1950)[LDC] Niger(1963)[LDC] Viet Nam(‐‐‐)[LDC]
Central African Republic(1963)[LDC] Kenya(1964)[LDC] North Korea(‐‐‐)[LDC] Yemen(‐‐‐)[LDC]
Chad(1963)[LDC] Kyrgyzstan(1998)[LDC & NEW] Rwanda(1966)[LDC] Zambia(1982)[LDC]
Comoros(‐‐‐)[LDC] Lao People's Dem. Republic(‐‐‐)[LDC] Senegal(1963)[LDC] Zimbabwe(1948)[LDC]
Congo (Dem. Republic)(1997)[LDC & G33] Liberia(‐‐‐)[LDC] Sierra Leone(1961)[LDC]