agricultural land use dynamics in the brazilian amazon ... · agricultural land use dynamics in the...
TRANSCRIPT
lable at ScienceDirect
Applied Geography 32 (2011) 240e252
Contents lists avai
Applied Geography
journal homepage: www.elsevier .com/locate/apgeog
Agricultural land use dynamics in the Brazilian Amazon based on remote sensingand census data
Giovana M. de Espindola a,*, Ana Paula D. de Aguiar a, Edzer Pebesma b, Gilberto Câmara a, Leila Fonseca c
a Earth System Science Center, National Institute for Space Research (INPE), Av dos Astronautas 1758, 12227-010 São José dos Campos, Brazilb Institute for Geoinformatics, University of Münster, Weseler Straße 253, 48151 Münster, Germanyc Image Processing Division, National Institute for Space Research (INPE), Av dos Astronautas 1758, 12227-010 São José dos Campos, Brazil
Keywords:Brazilian AmazonDeforestationLand use dynamicAgricultural land usesSpatial regression analysis
* Corresponding author. Tel.: þ55 12 3208 7135; faE-mail address: [email protected] (G.M. de Esp
0143-6228/$ e see front matter � 2011 Elsevier Ltd.doi:10.1016/j.apgeog.2011.04.003
a b s t r a c t
The potential impact of deforestation in the Brazilian Amazon on greenhouse gas emissions to theatmosphere calls for policies that take account of changes in forest cover. Although much research hasfocused on the location and effects of deforestation, little is known about the distribution and reasons forthe agricultural uses that replace forest cover. We used Landsat TM-based deforestation and agriculturalcensus data to generate maps of the distribution and proportion of four major agricultural land usesthroughout the Brazilian Amazon in 1997 and 2007. We built linear and spatial regression models toassess the determinant factors of deforestation and those major agricultural land uses e pasture,temporary agriculture and permanent agriculture e for the states of Pará, Rondônia, and Mato Grosso.The data include 30 determinant factors that were grouped into two years (1996 and 2006) and in fourcategories: accessibility to markets, public policies, agrarian structure, and environment. We found anoverall expansion of the total agricultural area between 1997 and 2007, and notable differences betweenthe states of Pará, Rondônia, and Mato Grosso in land use changes during this period. Regression modelsfor deforestation and pasture indicated that determinant factors such as distance to roads were moreinfluential in 1997 than in 2007. The number of settled families played an important role in the defor-estation and pasture, the effect was stronger in 2007 than 1997. Indigenous lands were significant inpreventing deforestation in high-pressure areas in 2007. For temporary and permanent agricultures, ourresults show that in 1997 the effect of small farms was stronger than in 2007. The mapped land use timeseries and the models explain empirically the effects of land use changes across the region over onedecade.
� 2011 Elsevier Ltd. All rights reserved.
Introduction
Deforestation is considered to be one of the largest sources ofgreenhouse gas emissions into the atmosphere. Using the estimatedemissions from land use change deforestation and other land usedata it has been calculated that carbon dioxide (CO2) from land usechange contributed to 12% (in terms of CO2 equivalents) of the totalanthropogenic greenhouse gas emissions in 2008 (Quéré et al.,2009). From 2000e2009 the rate of tropical deforestation in theBrazilian Amazon was amongst the fastest in the world, averaging17,486 sq kmper year (INPE, 2010). Significant negative externalitieshave been created as a result, such as loss of biodiversity, erosion,floods, lowered water tables, as well as increased release of carboninto the atmosphere (Fearnside, 1996; Shukla, Nobre, & Sellers,1990). All these effects make the Brazilian Amazon region one of
x: þ55 12 3208 6468.indola).
All rights reserved.
the hotspots of global environmental change (Achard et al., 2002;IPCC, 2007a, 2007b; Laurance, Albernaz, Fearnside, Vasconcelos, &Ferreira, 2004).
Critical problems, such as tropical deforestation, are relativelywell understood at regional level. At this level, considerableresearch has focused on estimating rates of forest conversion(mainly by using satellite remote sensing) and on evaluating thefactors that influence these rates (Alves, 2002; Chambers et al.,2007; Fearnside, 1990; Fearnside, Tardin, & Filho, 1990; Margulis,2004; Skole & Tucker, 1993). The most frequently mentioneddeterminant factors of deforestation include regional variants ofdriver combinations in which economic factors, institutions andnational policies are prominent (Geist & Lambin, 2001; Geist et al.,2006; Lambin, 1994; Margulis, 2004). It is clear that multipleprocesses influence the spatial and temporal dynamics of defor-estation, and that there are significant gaps in knowledge to befilled (Dietz, Ostrom, & Stern, 2003; Gibson, McKean, & Ostrom,2000).
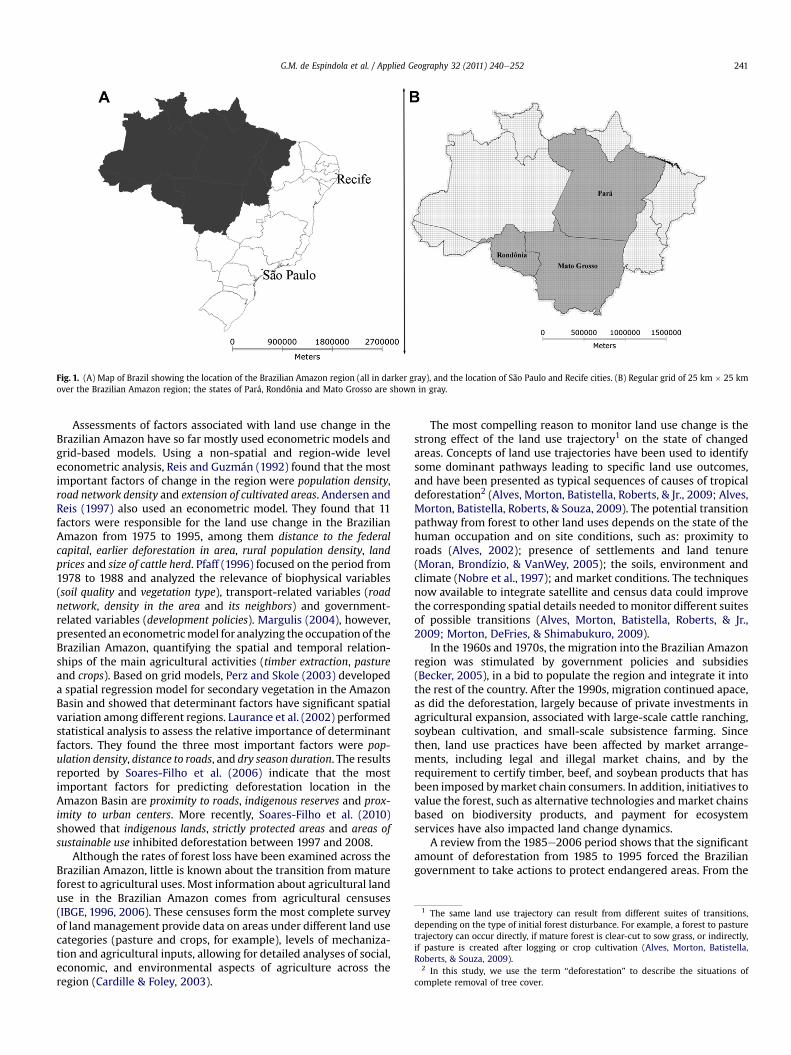
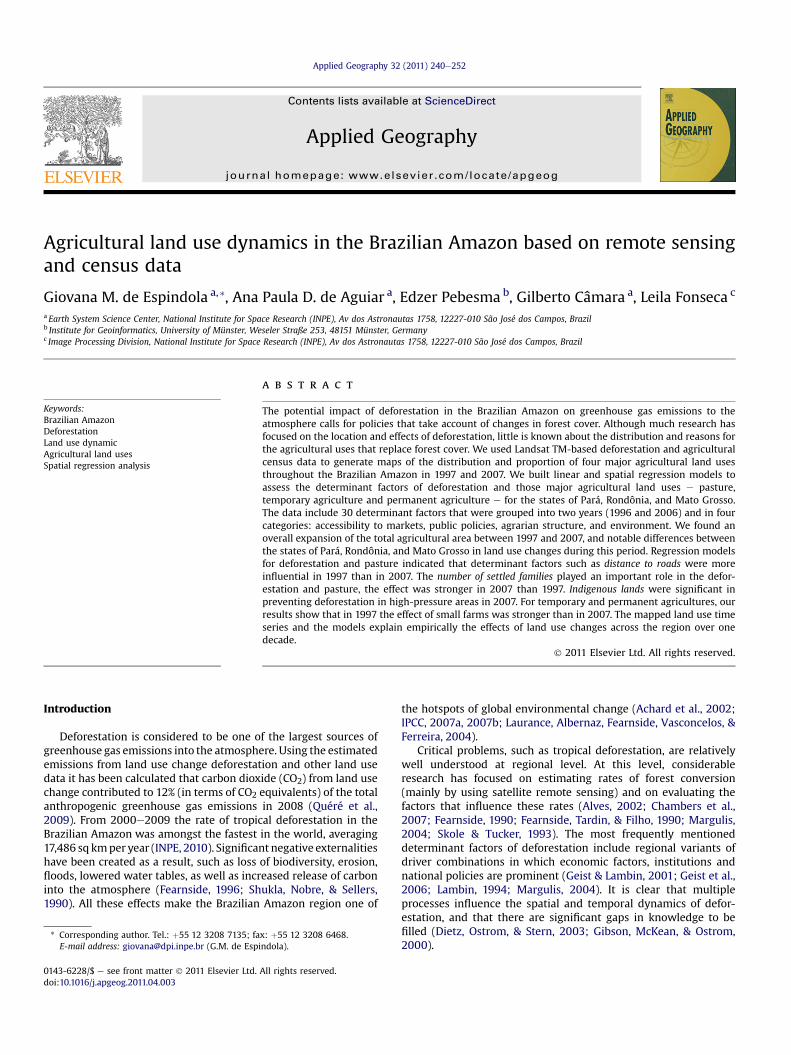
Fig. 1. (A) Map of Brazil showing the location of the Brazilian Amazon region (all in darker gray), and the location of São Paulo and Recife cities. (B) Regular grid of 25 km � 25 kmover the Brazilian Amazon region; the states of Pará, Rondônia and Mato Grosso are shown in gray.
1 The same land use trajectory can result from different suites of transitions,depending on the type of initial forest disturbance. For example, a forest to pasturetrajectory can occur directly, if mature forest is clear-cut to sow grass, or indirectly,if pasture is created after logging or crop cultivation (Alves, Morton, Batistella,Roberts, & Souza, 2009).
2 In this study, we use the term “deforestation” to describe the situations ofcomplete removal of tree cover.
G.M. de Espindola et al. / Applied Geography 32 (2011) 240e252 241
Assessments of factors associated with land use change in theBrazilian Amazon have so far mostly used econometric models andgrid-based models. Using a non-spatial and region-wide leveleconometric analysis, Reis and Guzmán (1992) found that the mostimportant factors of change in the region were population density,road network density and extension of cultivated areas. Andersen andReis (1997) also used an econometric model. They found that 11factors were responsible for the land use change in the BrazilianAmazon from 1975 to 1995, among them distance to the federalcapital, earlier deforestation in area, rural population density, landprices and size of cattle herd. Pfaff (1996) focused on the period from1978 to 1988 and analyzed the relevance of biophysical variables(soil quality and vegetation type), transport-related variables (roadnetwork, density in the area and its neighbors) and government-related variables (development policies). Margulis (2004), however,presented an econometricmodel for analyzing the occupation of theBrazilian Amazon, quantifying the spatial and temporal relation-ships of the main agricultural activities (timber extraction, pastureand crops). Based on grid models, Perz and Skole (2003) developeda spatial regression model for secondary vegetation in the AmazonBasin and showed that determinant factors have significant spatialvariation among different regions. Laurance et al. (2002) performedstatistical analysis to assess the relative importance of determinantfactors. They found the three most important factors were pop-ulation density, distance to roads, and dry season duration. The resultsreported by Soares-Filho et al. (2006) indicate that the mostimportant factors for predicting deforestation location in theAmazon Basin are proximity to roads, indigenous reserves and prox-imity to urban centers. More recently, Soares-Filho et al. (2010)showed that indigenous lands, strictly protected areas and areas ofsustainable use inhibited deforestation between 1997 and 2008.
Although the rates of forest loss have been examined across theBrazilian Amazon, little is known about the transition from matureforest to agricultural uses. Most information about agricultural landuse in the Brazilian Amazon comes from agricultural censuses(IBGE, 1996, 2006). These censuses form the most complete surveyof land management provide data on areas under different land usecategories (pasture and crops, for example), levels of mechaniza-tion and agricultural inputs, allowing for detailed analyses of social,economic, and environmental aspects of agriculture across theregion (Cardille & Foley, 2003).
The most compelling reason to monitor land use change is thestrong effect of the land use trajectory1 on the state of changedareas. Concepts of land use trajectories have been used to identifysome dominant pathways leading to specific land use outcomes,and have been presented as typical sequences of causes of tropicaldeforestation2 (Alves, Morton, Batistella, Roberts, & Jr., 2009; Alves,Morton, Batistella, Roberts, & Souza, 2009). The potential transitionpathway from forest to other land uses depends on the state of thehuman occupation and on site conditions, such as: proximity toroads (Alves, 2002); presence of settlements and land tenure(Moran, Brondízio, & VanWey, 2005); the soils, environment andclimate (Nobre et al., 1997); and market conditions. The techniquesnow available to integrate satellite and census data could improvethe corresponding spatial details needed tomonitor different suitesof possible transitions (Alves, Morton, Batistella, Roberts, & Jr.,2009; Morton, DeFries, & Shimabukuro, 2009).
In the 1960s and 1970s, the migration into the Brazilian Amazonregion was stimulated by government policies and subsidies(Becker, 2005), in a bid to populate the region and integrate it intothe rest of the country. After the 1990s, migration continued apace,as did the deforestation, largely because of private investments inagricultural expansion, associated with large-scale cattle ranching,soybean cultivation, and small-scale subsistence farming. Sincethen, land use practices have been affected by market arrange-ments, including legal and illegal market chains, and by therequirement to certify timber, beef, and soybean products that hasbeen imposed bymarket chain consumers. In addition, initiatives tovalue the forest, such as alternative technologies andmarket chainsbased on biodiversity products, and payment for ecosystemservices have also impacted land change dynamics.
A review from the 1985e2006 period shows that the significantamount of deforestation from 1985 to 1995 forced the Braziliangovernment to take actions to protect endangered areas. From the
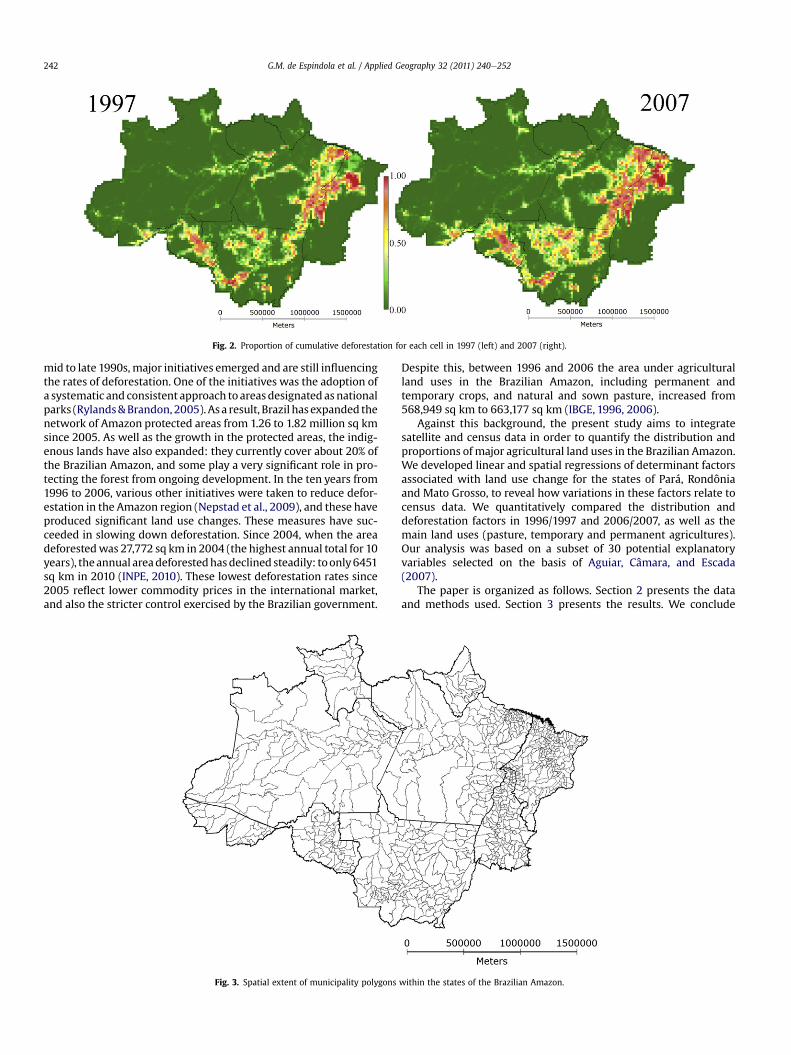
Fig. 2. Proportion of cumulative deforestation for each cell in 1997 (left) and 2007 (right).
G.M. de Espindola et al. / Applied Geography 32 (2011) 240e252242
mid to late 1990s, major initiatives emerged and are still influencingthe rates of deforestation. One of the initiatives was the adoption ofa systematic and consistent approach toareasdesignated asnationalparks (Rylands&Brandon, 2005). Asa result, Brazil hasexpanded thenetwork of Amazon protected areas from 1.26 to 1.82 million sq kmsince 2005. As well as the growth in the protected areas, the indig-enous lands have also expanded: they currently cover about 20% ofthe Brazilian Amazon, and some play a very significant role in pro-tecting the forest from ongoing development. In the ten years from1996 to 2006, various other initiatives were taken to reduce defor-estation in the Amazon region (Nepstad et al., 2009), and these haveproduced significant land use changes. These measures have suc-ceeded in slowing down deforestation. Since 2004, when the areadeforestedwas 27,772 sq km in 2004 (the highest annual total for 10years), theannual areadeforestedhasdeclined steadily: toonly6451sq km in 2010 (INPE, 2010). These lowest deforestation rates since2005 reflect lower commodity prices in the international market,and also the stricter control exercised by the Brazilian government.
Fig. 3. Spatial extent of municipality polygons
Despite this, between 1996 and 2006 the area under agriculturalland uses in the Brazilian Amazon, including permanent andtemporary crops, and natural and sown pasture, increased from568,949 sq km to 663,177 sq km (IBGE, 1996, 2006).
Against this background, the present study aims to integratesatellite and census data in order to quantify the distribution andproportions of major agricultural land uses in the Brazilian Amazon.We developed linear and spatial regressions of determinant factorsassociated with land use change for the states of Pará, Rondôniaand Mato Grosso, to reveal how variations in these factors relate tocensus data. We quantitatively compared the distribution anddeforestation factors in 1996/1997 and 2006/2007, as well as themain land uses (pasture, temporary and permanent agricultures).Our analysis was based on a subset of 30 potential explanatoryvariables selected on the basis of Aguiar, Câmara, and Escada(2007).
The paper is organized as follows. Section 2 presents the dataand methods used. Section 3 presents the results. We conclude
within the states of the Brazilian Amazon.
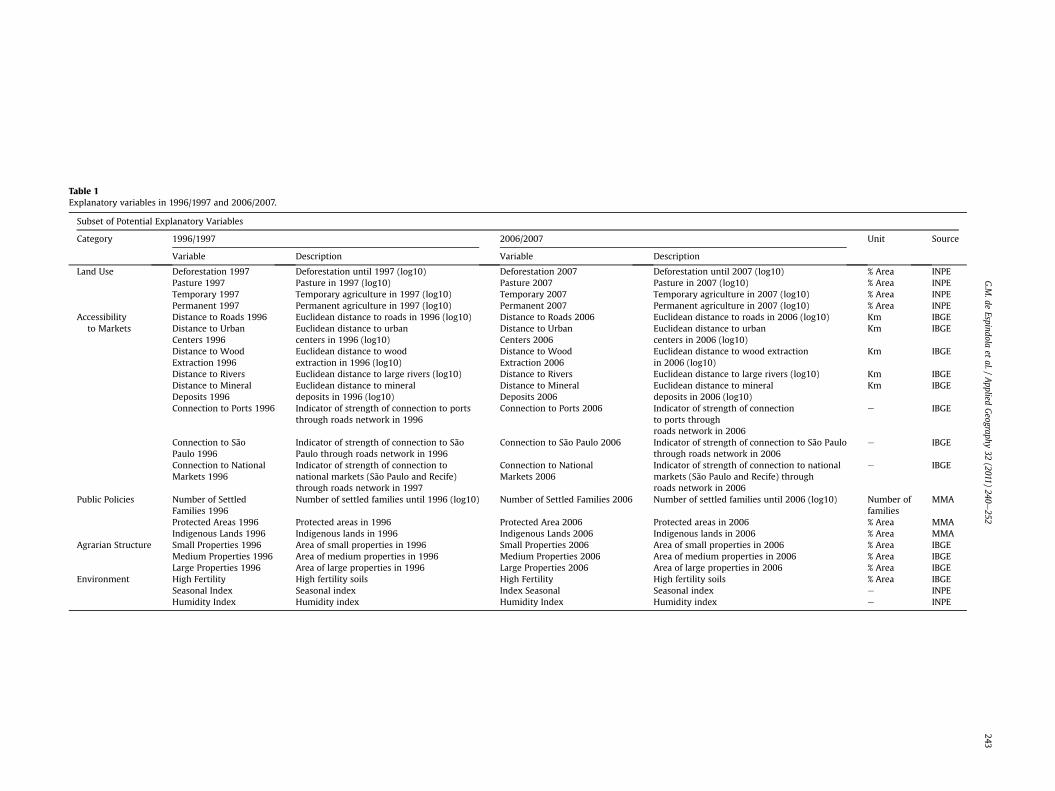
Table 1Explanatory variables in 1996/1997 and 2006/2007.
Subset of Potential Explanatory Variables
Category 1996/1997 2006/2007 Unit Source
Variable Description Variable Description
Land Use Deforestation 1997 Deforestation until 1997 (log10) Deforestation 2007 Deforestation until 2007 (log10) % Area INPEPasture 1997 Pasture in 1997 (log10) Pasture 2007 Pasture in 2007 (log10) % Area INPETemporary 1997 Temporary agriculture in 1997 (log10) Temporary 2007 Temporary agriculture in 2007 (log10) % Area INPEPermanent 1997 Permanent agriculture in 1997 (log10) Permanent 2007 Permanent agriculture in 2007 (log10) % Area INPE
Accessibilityto Markets
Distance to Roads 1996 Euclidean distance to roads in 1996 (log10) Distance to Roads 2006 Euclidean distance to roads in 2006 (log10) Km IBGEDistance to UrbanCenters 1996
Euclidean distance to urbancenters in 1996 (log10)
Distance to UrbanCenters 2006
Euclidean distance to urbancenters in 2006 (log10)
Km IBGE
Distance to WoodExtraction 1996
Euclidean distance to woodextraction in 1996 (log10)
Distance to WoodExtraction 2006
Euclidean distance to wood extractionin 2006 (log10)
Km IBGE
Distance to Rivers Euclidean distance to large rivers (log10) Distance to Rivers Euclidean distance to large rivers (log10) Km IBGEDistance to MineralDeposits 1996
Euclidean distance to mineraldeposits in 1996 (log10)
Distance to MineralDeposits 2006
Euclidean distance to mineraldeposits in 2006 (log10)
Km IBGE
Connection to Ports 1996 Indicator of strength of connection to portsthrough roads network in 1996
Connection to Ports 2006 Indicator of strength of connectionto ports throughroads network in 2006
e IBGE
Connection to SãoPaulo 1996
Indicator of strength of connection to SãoPaulo through roads network in 1996
Connection to São Paulo 2006 Indicator of strength of connection to São Paulothrough roads network in 2006
e IBGE
Connection to NationalMarkets 1996
Indicator of strength of connection tonational markets (São Paulo and Recife)through roads network in 1997
Connection to NationalMarkets 2006
Indicator of strength of connection to nationalmarkets (São Paulo and Recife) throughroads network in 2006
e IBGE
Public Policies Number of SettledFamilies 1996
Number of settled families until 1996 (log10) Number of Settled Families 2006 Number of settled families until 2006 (log10) Number offamilies
MMA
Protected Areas 1996 Protected areas in 1996 Protected Area 2006 Protected areas in 2006 % Area MMAIndigenous Lands 1996 Indigenous lands in 1996 Indigenous Lands 2006 Indigenous lands in 2006 % Area MMA
Agrarian Structure Small Properties 1996 Area of small properties in 1996 Small Properties 2006 Area of small properties in 2006 % Area IBGEMedium Properties 1996 Area of medium properties in 1996 Medium Properties 2006 Area of medium properties in 2006 % Area IBGELarge Properties 1996 Area of large properties in 1996 Large Properties 2006 Area of large properties in 2006 % Area IBGE
Environment High Fertility High fertility soils High Fertility High fertility soils % Area IBGESeasonal Index Seasonal index Index Seasonal Seasonal index e INPEHumidity Index Humidity index Humidity Index Humidity index e INPE
G.M
.deEspindola
etal./
Applied
Geography
32(2011)
240e252
243
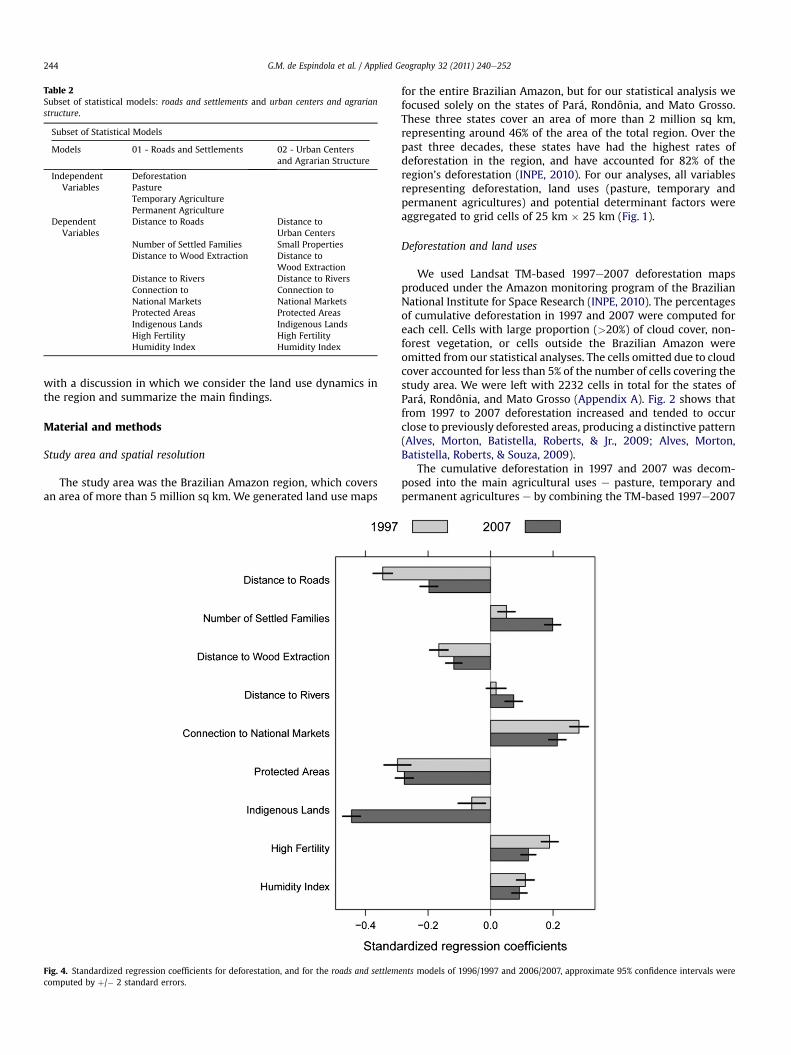
Table 2Subset of statistical models: roads and settlements and urban centers and agrarianstructure.
Subset of Statistical Models
Models 01 - Roads and Settlements 02 - Urban Centersand Agrarian Structure
IndependentVariables
DeforestationPastureTemporary AgriculturePermanent Agriculture
DependentVariables
Distance to Roads Distance toUrban Centers
Number of Settled Families Small PropertiesDistance to Wood Extraction Distance to
Wood ExtractionDistance to Rivers Distance to RiversConnection toNational Markets
Connection toNational Markets
Protected Areas Protected AreasIndigenous Lands Indigenous LandsHigh Fertility High FertilityHumidity Index Humidity Index
G.M. de Espindola et al. / Applied Geography 32 (2011) 240e252244
with a discussion in which we consider the land use dynamics inthe region and summarize the main findings.
Material and methods
Study area and spatial resolution
The study area was the Brazilian Amazon region, which coversan area of more than 5 million sq km. We generated land use maps
Fig. 4. Standardized regression coefficients for deforestation, and for the roads and settlemcomputed by þ/� 2 standard errors.
for the entire Brazilian Amazon, but for our statistical analysis wefocused solely on the states of Pará, Rondônia, and Mato Grosso.These three states cover an area of more than 2 million sq km,representing around 46% of the area of the total region. Over thepast three decades, these states have had the highest rates ofdeforestation in the region, and have accounted for 82% of theregion’s deforestation (INPE, 2010). For our analyses, all variablesrepresenting deforestation, land uses (pasture, temporary andpermanent agricultures) and potential determinant factors wereaggregated to grid cells of 25 km � 25 km (Fig. 1).
Deforestation and land uses
We used Landsat TM-based 1997e2007 deforestation mapsproduced under the Amazon monitoring program of the BrazilianNational Institute for Space Research (INPE, 2010). The percentagesof cumulative deforestation in 1997 and 2007 were computed foreach cell. Cells with large proportion (>20%) of cloud cover, non-forest vegetation, or cells outside the Brazilian Amazon wereomitted from our statistical analyses. The cells omitted due to cloudcover accounted for less than 5% of the number of cells covering thestudy area. We were left with 2232 cells in total for the states ofPará, Rondônia, and Mato Grosso (Appendix A). Fig. 2 shows thatfrom 1997 to 2007 deforestation increased and tended to occurclose to previously deforested areas, producing a distinctive pattern(Alves, Morton, Batistella, Roberts, & Jr., 2009; Alves, Morton,Batistella, Roberts, & Souza, 2009).
The cumulative deforestation in 1997 and 2007 was decom-posed into the main agricultural uses e pasture, temporary andpermanent agricultures e by combining the TM-based 1997e2007
ents models of 1996/1997 and 2006/2007, approximate 95% confidence intervals were
G.M. de Espindola et al. / Applied Geography 32 (2011) 240e252 245
deforestation maps from INPE (2010), and census information fromthe agricultural censuses in 1996 and 2006 (IBGE, 1996, 2006).Municipality-based census data (Fig. 3) was converted frompolygon-based information to grid cells of 25 km� 25 km. The totalagricultural area for each municipality was taken from the defor-estation maps; the proportion of each agricultural use was takenfrom the census data. This computation assumed that the propor-tion of land use types was uniformly distributed over the defor-ested areas of each municipality.
Potential determinant factors
For each of the two years 1996/1997 and 2006/2007, the dataincluded 30 variables that were grouped into four main categories:accessibility to markets, public policies, agrarian structure, andenvironment. According to Aguiar et al. (2007), these variablescould potentially explain differences in land use in 1997. As pointedout in the Introduction, so far, most studies in the Brazilian Amazonhave been restricted to deforestation, though Aguiar et al. (2007)also decomposed deforestation into the main agricultural landuses. In addition, Aguiar et al. (2007) included the socioeconomicand biophysical factors adopted in previous work, added measuresof connectivity to ports and to markets, and introduced agrarianstructure indicators that had not been used before. Summarizing,Table 1 shows our subset of potential explanatory variables in 1996/1997 and 2006/2007. All the variables were aggregated to the gridcells of 25 km � 25 km. Appendix A contains maps of the maindeterminant factors used in our statistical analyses.
The accessibility to markets initially included Euclidean distanceto roads, distance to urban centers, distance to wood extraction (or
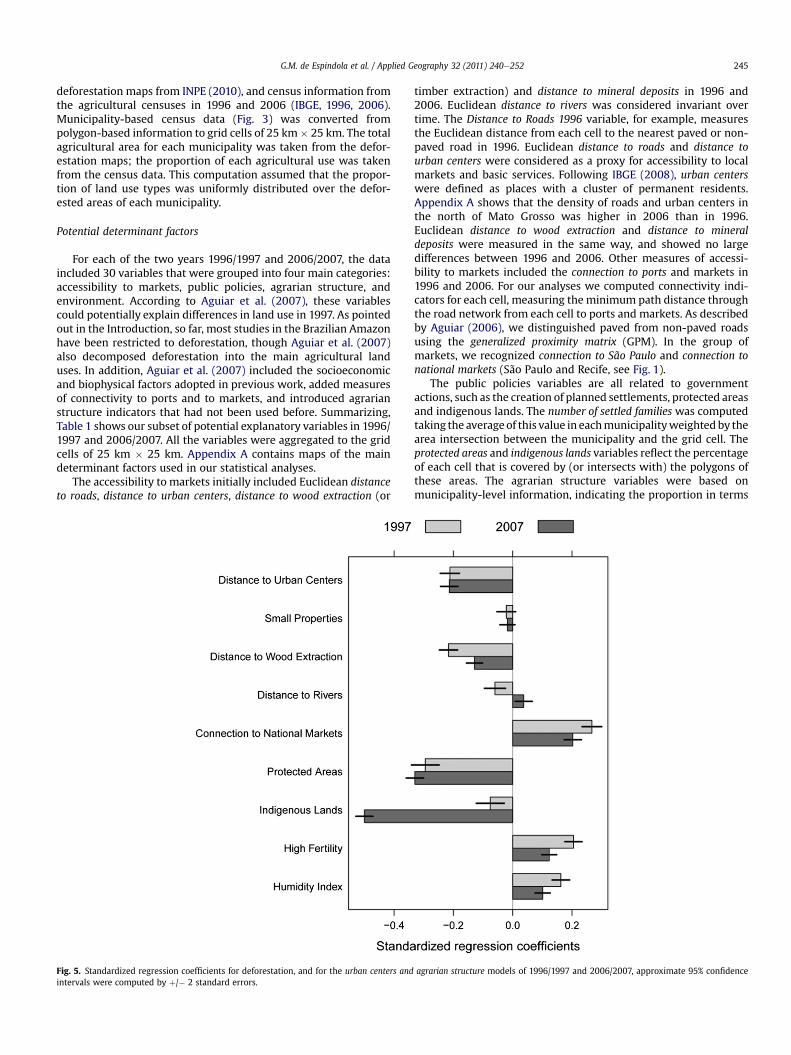
Fig. 5. Standardized regression coefficients for deforestation, and for the urban centers andintervals were computed by þ/� 2 standard errors.
timber extraction) and distance to mineral deposits in 1996 and2006. Euclidean distance to rivers was considered invariant overtime. The Distance to Roads 1996 variable, for example, measuresthe Euclidean distance from each cell to the nearest paved or non-paved road in 1996. Euclidean distance to roads and distance tourban centers were considered as a proxy for accessibility to localmarkets and basic services. Following IBGE (2008), urban centerswere defined as places with a cluster of permanent residents.Appendix A shows that the density of roads and urban centers inthe north of Mato Grosso was higher in 2006 than in 1996.Euclidean distance to wood extraction and distance to mineraldeposits were measured in the same way, and showed no largedifferences between 1996 and 2006. Other measures of accessi-bility to markets included the connection to ports and markets in1996 and 2006. For our analyses we computed connectivity indi-cators for each cell, measuring the minimum path distance throughthe road network from each cell to ports and markets. As describedby Aguiar (2006), we distinguished paved from non-paved roadsusing the generalized proximity matrix (GPM). In the group ofmarkets, we recognized connection to São Paulo and connection tonational markets (São Paulo and Recife, see Fig. 1).
The public policies variables are all related to governmentactions, such as the creation of planned settlements, protected areasand indigenous lands. The number of settled families was computedtaking the averageof this value in eachmunicipalityweightedby thearea intersection between the municipality and the grid cell. Theprotected areas and indigenous lands variables reflect the percentageof each cell that is covered by (or intersects with) the polygons ofthese areas. The agrarian structure variables were based onmunicipality-level information, indicating the proportion in terms
agrarian structure models of 1996/1997 and 2006/2007, approximate 95% confidence
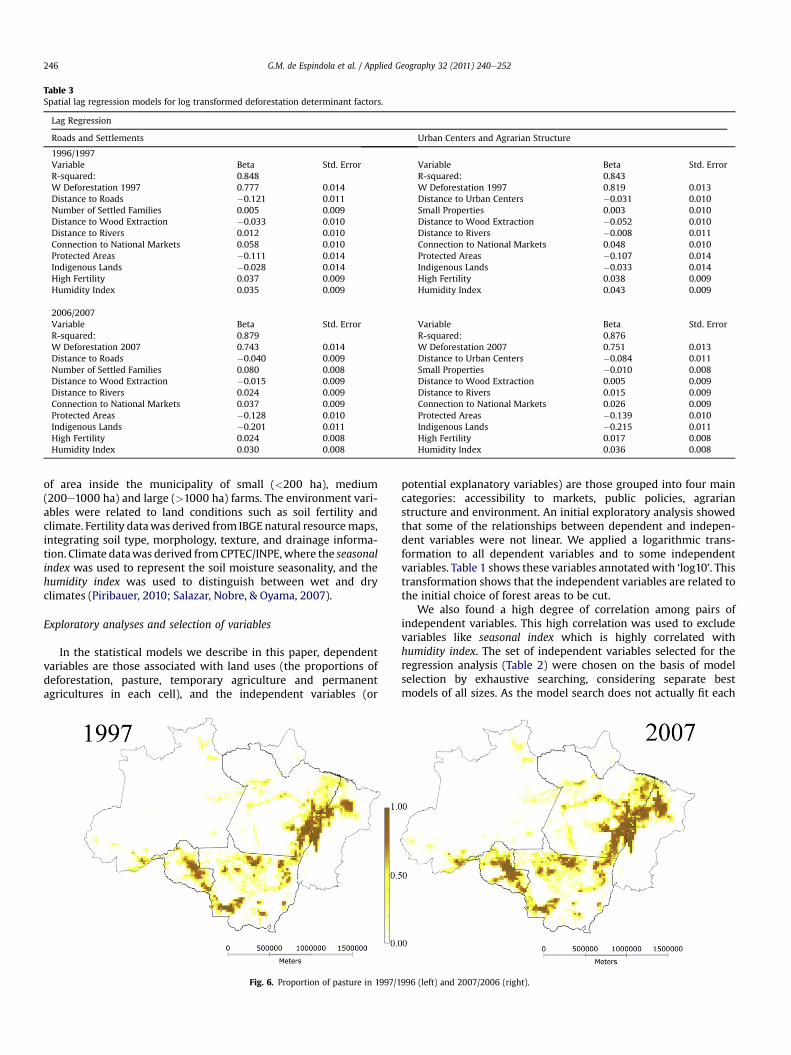
Table 3Spatial lag regression models for log transformed deforestation determinant factors.
Lag Regression
Roads and Settlements Urban Centers and Agrarian Structure
1996/1997Variable Beta Std. Error Variable Beta Std. ErrorR-squared: 0.848 R-squared: 0.843W Deforestation 1997 0.777 0.014 W Deforestation 1997 0.819 0.013Distance to Roads �0.121 0.011 Distance to Urban Centers �0.031 0.010Number of Settled Families 0.005 0.009 Small Properties 0.003 0.010Distance to Wood Extraction �0.033 0.010 Distance to Wood Extraction �0.052 0.010Distance to Rivers 0.012 0.010 Distance to Rivers �0.008 0.011Connection to National Markets 0.058 0.010 Connection to National Markets 0.048 0.010Protected Areas �0.111 0.014 Protected Areas �0.107 0.014Indigenous Lands �0.028 0.014 Indigenous Lands �0.033 0.014High Fertility 0.037 0.009 High Fertility 0.038 0.009Humidity Index 0.035 0.009 Humidity Index 0.043 0.009
2006/2007Variable Beta Std. Error Variable Beta Std. ErrorR-squared: 0.879 R-squared: 0.876W Deforestation 2007 0.743 0.014 W Deforestation 2007 0.751 0.013Distance to Roads �0.040 0.009 Distance to Urban Centers �0.084 0.011Number of Settled Families 0.080 0.008 Small Properties �0.010 0.008Distance to Wood Extraction �0.015 0.009 Distance to Wood Extraction 0.005 0.009Distance to Rivers 0.024 0.009 Distance to Rivers 0.015 0.009Connection to National Markets 0.037 0.009 Connection to National Markets 0.026 0.009Protected Areas �0.128 0.010 Protected Areas �0.139 0.010Indigenous Lands �0.201 0.011 Indigenous Lands �0.215 0.011High Fertility 0.024 0.008 High Fertility 0.017 0.008Humidity Index 0.030 0.008 Humidity Index 0.036 0.008
G.M. de Espindola et al. / Applied Geography 32 (2011) 240e252246
of area inside the municipality of small (<200 ha), medium(200e1000 ha) and large (>1000 ha) farms. The environment vari-ables were related to land conditions such as soil fertility andclimate. Fertility datawas derived from IBGE natural resourcemaps,integrating soil type, morphology, texture, and drainage informa-tion. Climate datawas derived fromCPTEC/INPE,where the seasonalindex was used to represent the soil moisture seasonality, and thehumidity index was used to distinguish between wet and dryclimates (Piribauer, 2010; Salazar, Nobre, & Oyama, 2007).
Exploratory analyses and selection of variables
In the statistical models we describe in this paper, dependentvariables are those associated with land uses (the proportions ofdeforestation, pasture, temporary agriculture and permanentagricultures in each cell), and the independent variables (or
Fig. 6. Proportion of pasture in 1997/1
potential explanatory variables) are those grouped into four maincategories: accessibility to markets, public policies, agrarianstructure and environment. An initial exploratory analysis showedthat some of the relationships between dependent and indepen-dent variables were not linear. We applied a logarithmic trans-formation to all dependent variables and to some independentvariables. Table 1 shows these variables annotatedwith ‘log10’. Thistransformation shows that the independent variables are related tothe initial choice of forest areas to be cut.
We also found a high degree of correlation among pairs ofindependent variables. This high correlation was used to excludevariables like seasonal index which is highly correlated withhumidity index. The set of independent variables selected for theregression analysis (Table 2) were chosen on the basis of modelselection by exhaustive searching, considering separate bestmodels of all sizes. As the model search does not actually fit each
996 (left) and 2007/2006 (right).
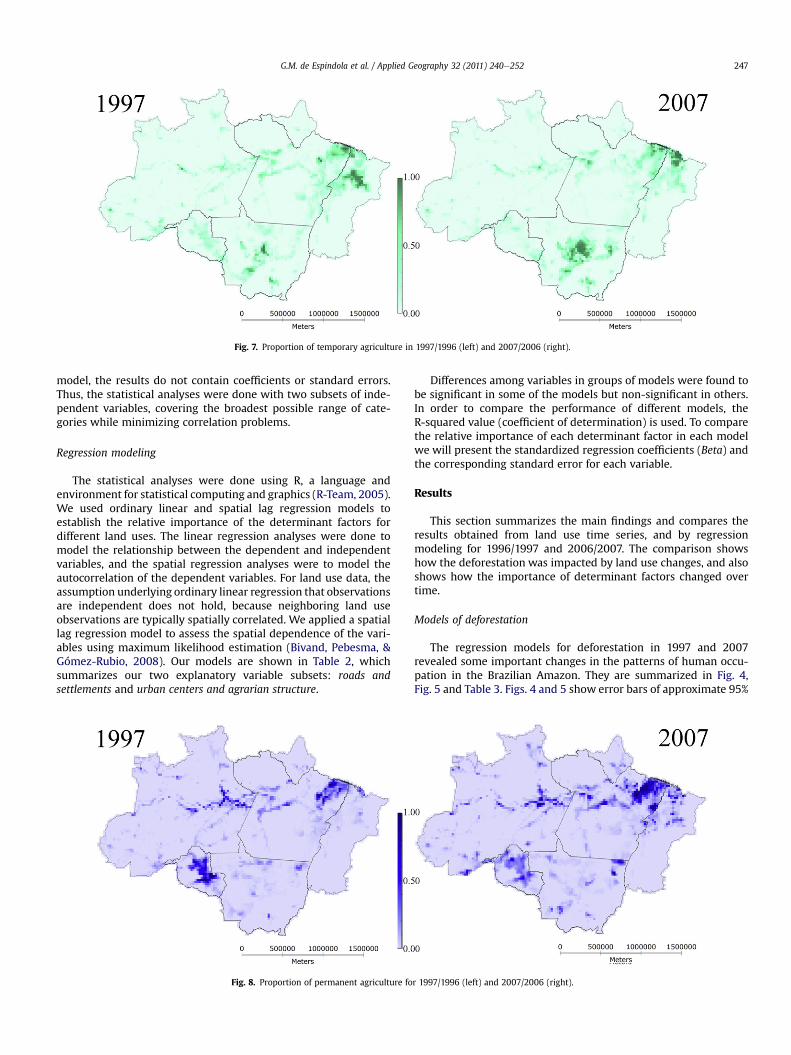
Fig. 7. Proportion of temporary agriculture in 1997/1996 (left) and 2007/2006 (right).
G.M. de Espindola et al. / Applied Geography 32 (2011) 240e252 247
model, the results do not contain coefficients or standard errors.Thus, the statistical analyses were done with two subsets of inde-pendent variables, covering the broadest possible range of cate-gories while minimizing correlation problems.
Regression modeling
The statistical analyses were done using R, a language andenvironment for statistical computing and graphics (R-Team, 2005).We used ordinary linear and spatial lag regression models toestablish the relative importance of the determinant factors fordifferent land uses. The linear regression analyses were done tomodel the relationship between the dependent and independentvariables, and the spatial regression analyses were to model theautocorrelation of the dependent variables. For land use data, theassumption underlying ordinary linear regression that observationsare independent does not hold, because neighboring land useobservations are typically spatially correlated. We applied a spatiallag regression model to assess the spatial dependence of the vari-ables using maximum likelihood estimation (Bivand, Pebesma, &Gómez-Rubio, 2008). Our models are shown in Table 2, whichsummarizes our two explanatory variable subsets: roads andsettlements and urban centers and agrarian structure.
Fig. 8. Proportion of permanent agriculture fo
Differences among variables in groups of models were found tobe significant in some of the models but non-significant in others.In order to compare the performance of different models, theR-squared value (coefficient of determination) is used. To comparethe relative importance of each determinant factor in each modelwe will present the standardized regression coefficients (Beta) andthe corresponding standard error for each variable.
Results
This section summarizes the main findings and compares theresults obtained from land use time series, and by regressionmodeling for 1996/1997 and 2006/2007. The comparison showshow the deforestation was impacted by land use changes, and alsoshows how the importance of determinant factors changed overtime.
Models of deforestation
The regression models for deforestation in 1997 and 2007revealed some important changes in the patterns of human occu-pation in the Brazilian Amazon. They are summarized in Fig. 4,Fig. 5 and Table 3. Figs. 4 and 5 show error bars of approximate 95%
r 1997/1996 (left) and 2007/2006 (right).
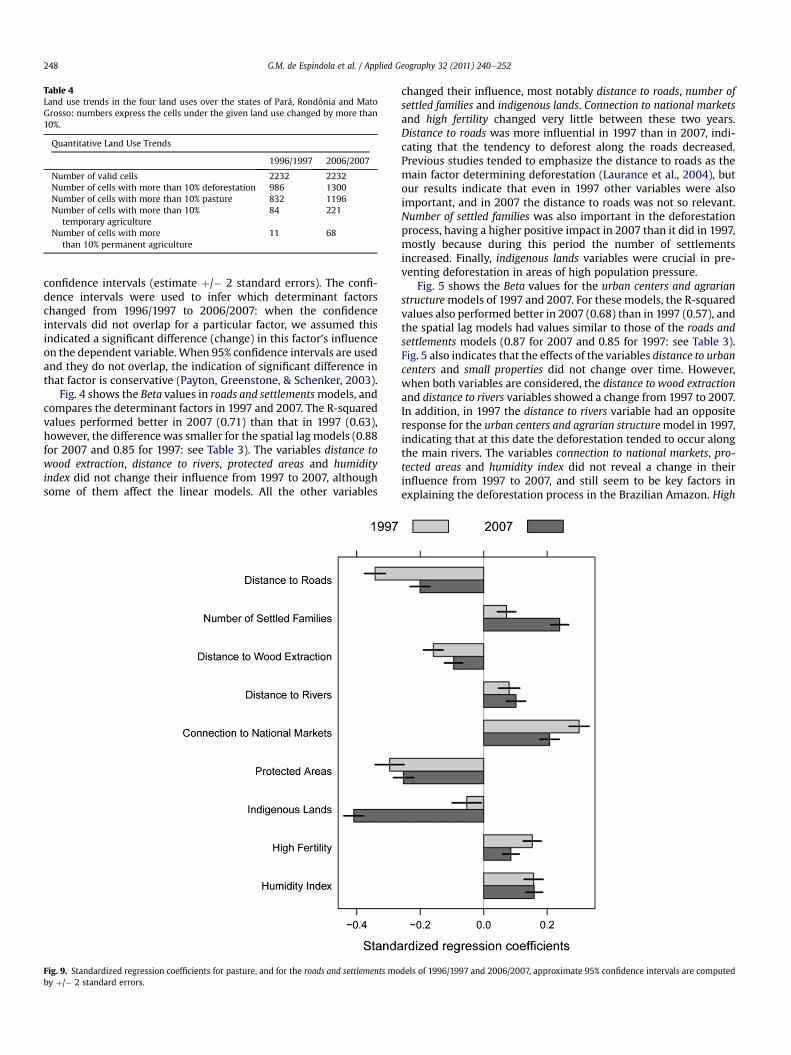
Table 4Land use trends in the four land uses over the states of Pará, Rondônia and MatoGrosso: numbers express the cells under the given land use changed by more than10%.
Quantitative Land Use Trends
1996/1997 2006/2007
Number of valid cells 2232 2232Number of cells with more than 10% deforestation 986 1300Number of cells with more than 10% pasture 832 1196Number of cells with more than 10%
temporary agriculture84 221
Number of cells with morethan 10% permanent agriculture
11 68
G.M. de Espindola et al. / Applied Geography 32 (2011) 240e252248
confidence intervals (estimate þ/� 2 standard errors). The confi-dence intervals were used to infer which determinant factorschanged from 1996/1997 to 2006/2007: when the confidenceintervals did not overlap for a particular factor, we assumed thisindicated a significant difference (change) in this factor’s influenceon the dependent variable. When 95% confidence intervals are usedand they do not overlap, the indication of significant difference inthat factor is conservative (Payton, Greenstone, & Schenker, 2003).
Fig. 4 shows the Beta values in roads and settlementsmodels, andcompares the determinant factors in 1997 and 2007. The R-squaredvalues performed better in 2007 (0.71) than that in 1997 (0.63),however, the difference was smaller for the spatial lag models (0.88for 2007 and 0.85 for 1997: see Table 3). The variables distance towood extraction, distance to rivers, protected areas and humidityindex did not change their influence from 1997 to 2007, althoughsome of them affect the linear models. All the other variables
Fig. 9. Standardized regression coefficients for pasture, and for the roads and settlements moby þ/� 2 standard errors.
changed their influence, most notably distance to roads, number ofsettled families and indigenous lands. Connection to national marketsand high fertility changed very little between these two years.Distance to roads was more influential in 1997 than in 2007, indi-cating that the tendency to deforest along the roads decreased.Previous studies tended to emphasize the distance to roads as themain factor determining deforestation (Laurance et al., 2004), butour results indicate that even in 1997 other variables were alsoimportant, and in 2007 the distance to roads was not so relevant.Number of settled families was also important in the deforestationprocess, having a higher positive impact in 2007 than it did in 1997,mostly because during this period the number of settlementsincreased. Finally, indigenous lands variables were crucial in pre-venting deforestation in areas of high population pressure.
Fig. 5 shows the Beta values for the urban centers and agrarianstructuremodels of 1997 and 2007. For these models, the R-squaredvalues also performed better in 2007 (0.68) than in 1997 (0.57), andthe spatial lag models had values similar to those of the roads andsettlements models (0.87 for 2007 and 0.85 for 1997: see Table 3).Fig. 5 also indicates that the effects of the variables distance to urbancenters and small properties did not change over time. However,when both variables are considered, the distance to wood extractionand distance to rivers variables showed a change from 1997 to 2007.In addition, in 1997 the distance to rivers variable had an oppositeresponse for the urban centers and agrarian structuremodel in 1997,indicating that at this date the deforestation tended to occur alongthe main rivers. The variables connection to national markets, pro-tected areas and humidity index did not reveal a change in theirinfluence from 1997 to 2007, and still seem to be key factors inexplaining the deforestation process in the Brazilian Amazon. High
dels of 1996/1997 and 2006/2007, approximate 95% confidence intervals are computed
G.M. de Espindola et al. / Applied Geography 32 (2011) 240e252 249
fertility did not change much either during the period considered,but indigenous lands variables were crucial in 2007.
The results are similar for the spatial lag regression models.They included one additional variable (W Deforestation), whichindicates the degree to which the dependent variable is spatiallyautocorrelated. The R-squared values of the spatial lag modelsare significant and in all the models of deforestation they arehigher than 0.84 (see Table 3). This is the quantitative evidencethat corroborates earlier assessments that indicated that theregional pattern of deforestation is a diffusive process, and tendsto occur close to previously cleared areas. As expected, when thespatial lag regression models are used, all betas decrease, but notuniformly.
Maps and models of land uses
This section presents the maps representing 1996/1997 and2006/2007 agricultural distribution and density for the entireBrazilian Amazon. At the end, we present the results for the bestmodel (roads and settlements versus urban centers and agrarianstructure) for the states of Pará, Rondônia, and Mato Grosso whenthe dependent variables are pasture, temporary agriculture andpermanent agriculture. Our analyses in this section are based onthose discussed in Section 3.1.
Table 5Spatial lag regression models for log-transformed land uses determinant factors.
Lag Regression
1996/1997
Pasture - Roads and SettlementsVariable Beta Std. ErrorR-squared: 0.854W Pasture 1997 0.807 0.012Distance to Roads �0.111 0.010Number of Settled Families 0.008 0.009Distance to Wood Extraction �0.029 0.009Distance to Rivers 0.025 0.010Connection to National Markets 0.054 0.010Protected Areas �0.104 0.014Indigenous Lands �0.024 0.014High Fertility 0.022 0.009Humidity Index 0.046 0.009
Temporary Agriculture - Urban Centers and Agrarian StructureVariable Beta Std. ErrorR-squared: 0.814W Temporary Agriculture 1997 0.831 0.013Distance to Urban Centers �0.020 0.011Small Properties 0.071 0.011Distance to Wood Extraction �0.054 0.011Distance to Rivers �0.005 0.012Connection to National Markets 0.042 0.011Protected Areas �0.100 0.016Indigenous Lands 0.004 0.015High Fertility 0.043 0.010Humidity Index 0.026 0.010
Permanent Agriculture - Urban Centers and Agrarian StructureVariable Beta Std. ErrorR-squared: 0.838W Permanent Agriculture 1997 0.871 0.011Distance to Urban Centers �0.026 0.010Small Properties 0.079 0.010Distance to Wood Extraction �0.051 0.010Distance to Rivers 0.013 0.011Connection to National Markets 0.005 0.010Protected Areas �0.083 0.014Indigenous Lands 0.024 0.014High Fertility 0.026 0.009Humidity Index 0.024 0.009
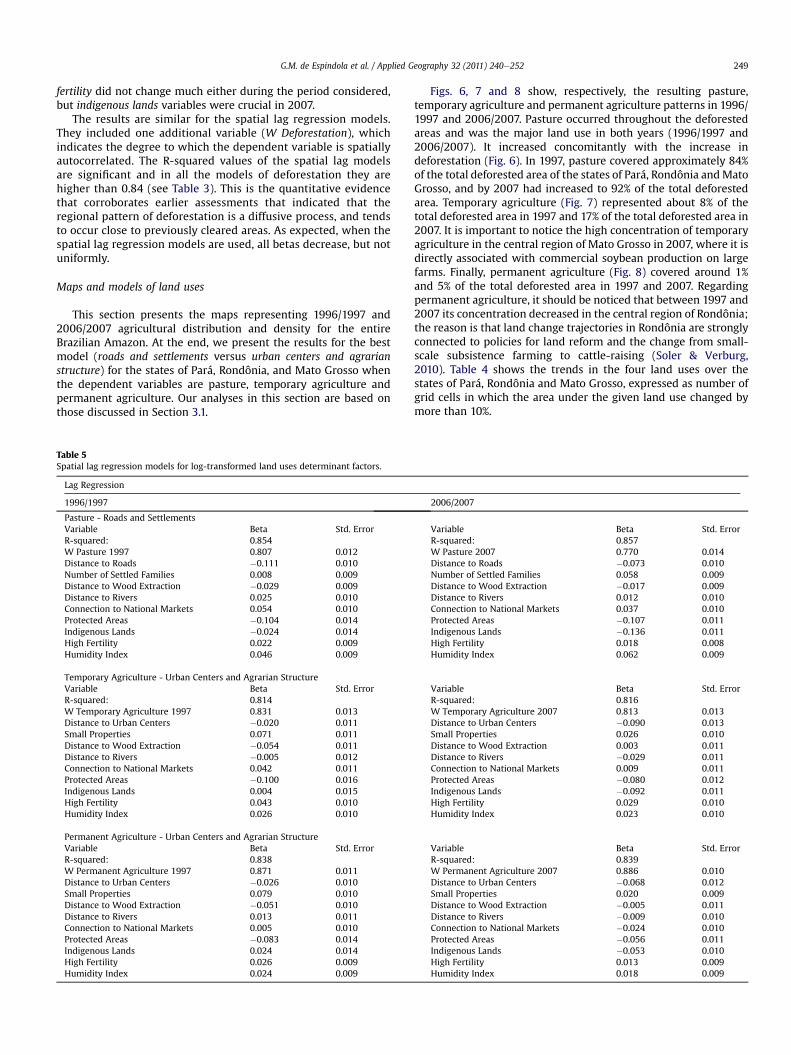
Figs. 6, 7 and 8 show, respectively, the resulting pasture,temporary agriculture and permanent agriculture patterns in 1996/1997 and 2006/2007. Pasture occurred throughout the deforestedareas and was the major land use in both years (1996/1997 and2006/2007). It increased concomitantly with the increase indeforestation (Fig. 6). In 1997, pasture covered approximately 84%of the total deforested area of the states of Pará, Rondônia andMatoGrosso, and by 2007 had increased to 92% of the total deforestedarea. Temporary agriculture (Fig. 7) represented about 8% of thetotal deforested area in 1997 and 17% of the total deforested area in2007. It is important to notice the high concentration of temporaryagriculture in the central region of Mato Grosso in 2007, where it isdirectly associated with commercial soybean production on largefarms. Finally, permanent agriculture (Fig. 8) covered around 1%and 5% of the total deforested area in 1997 and 2007. Regardingpermanent agriculture, it should be noticed that between 1997 and2007 its concentration decreased in the central region of Rondônia;the reason is that land change trajectories in Rondônia are stronglyconnected to policies for land reform and the change from small-scale subsistence farming to cattle-raising (Soler & Verburg,2010). Table 4 shows the trends in the four land uses over thestates of Pará, Rondônia and Mato Grosso, expressed as number ofgrid cells in which the area under the given land use changed bymore than 10%.
2006/2007
Variable Beta Std. ErrorR-squared: 0.857W Pasture 2007 0.770 0.014Distance to Roads �0.073 0.010Number of Settled Families 0.058 0.009Distance to Wood Extraction �0.017 0.009Distance to Rivers 0.012 0.010Connection to National Markets 0.037 0.010Protected Areas �0.107 0.011Indigenous Lands �0.136 0.011High Fertility 0.018 0.008Humidity Index 0.062 0.009
Variable Beta Std. ErrorR-squared: 0.816W Temporary Agriculture 2007 0.813 0.013Distance to Urban Centers �0.090 0.013Small Properties 0.026 0.010Distance to Wood Extraction 0.003 0.011Distance to Rivers �0.029 0.011Connection to National Markets 0.009 0.011Protected Areas �0.080 0.012Indigenous Lands �0.092 0.011High Fertility 0.029 0.010Humidity Index 0.023 0.010
Variable Beta Std. ErrorR-squared: 0.839W Permanent Agriculture 2007 0.886 0.010Distance to Urban Centers �0.068 0.012Small Properties 0.020 0.009Distance to Wood Extraction �0.005 0.011Distance to Rivers �0.009 0.010Connection to National Markets �0.024 0.010Protected Areas �0.056 0.011Indigenous Lands �0.053 0.010High Fertility 0.013 0.009Humidity Index 0.018 0.009
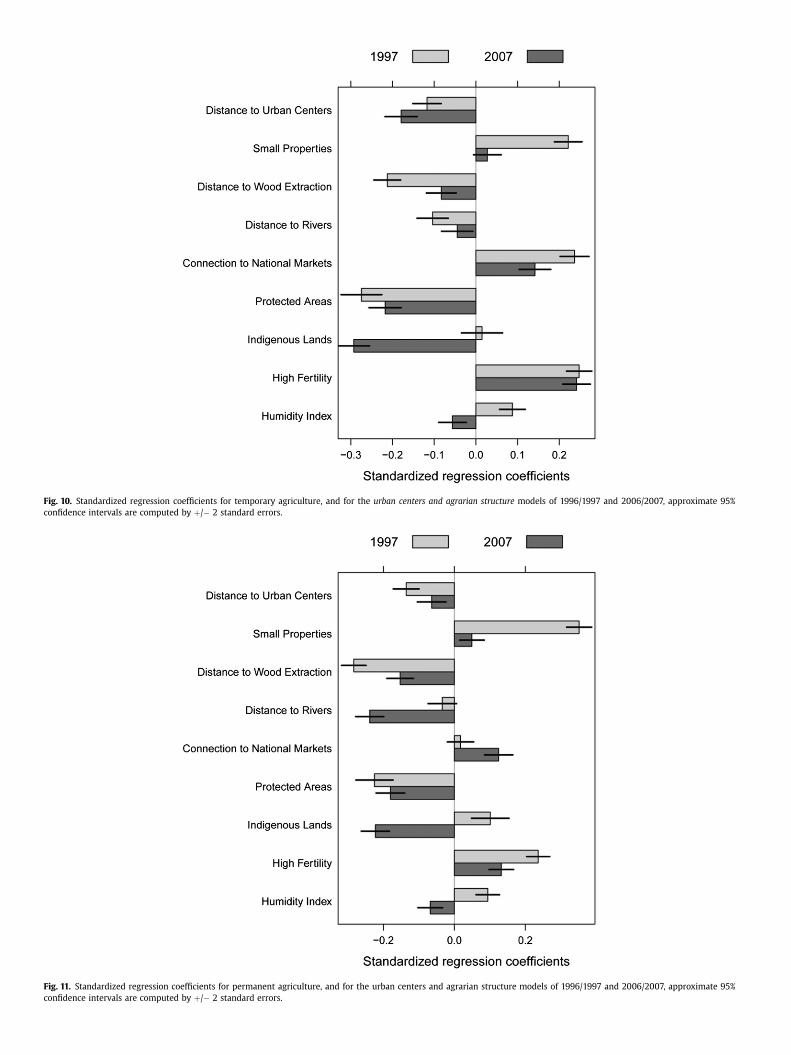
Fig. 10. Standardized regression coefficients for temporary agriculture, and for the urban centers and agrarian structure models of 1996/1997 and 2006/2007, approximate 95%confidence intervals are computed by þ/� 2 standard errors.
Fig. 11. Standardized regression coefficients for permanent agriculture, and for the urban centers and agrarian structure models of 1996/1997 and 2006/2007, approximate 95%confidence intervals are computed by þ/� 2 standard errors.
G.M. de Espindola et al. / Applied Geography 32 (2011) 240e252 251
The regression models also revealed that pasture was spreadthroughout the region; its determinant factors are very similar todeforestation ones (Fig. 9 and Table 5). This is not surprising, giventhe large deforested area converted into pasture. For these models,the R-squared values for the linear regressions were 0.58 in 1997and 0.65 in 2007; the corresponding values yielded by the spatiallag models were 0.85 in 1997 and 0.86 in 2007. Temporary andpermanent agricultures presented differentiated and concentratedpatterns (Figs. 10 and 11, and Table 5). The R-squared values forthese models were 0.52 and 0.45 for temporary agriculture in 1997and 2007, compared with 0.82 and 0.81 for the spatial lag models.For permanent agriculture they were 0.39 in 1997 and 0.45 in 2007(compared with 0.84 and 0.84 for the spatial lag models). Thevariables distance to urban centers and protected areas had the sametrend as the deforestation models, and their values did not differsignificantly between 1997 and 2007. Our results also indicatea tendency for temporary and permanent agriculture to occupyareas associated with small farms in 1997. This trend was strongerin 1997 than it was in 2007, which was caused by the fact that incertain locations small farms had been aggregated to formmediumand large farms. The distance to wood extraction variables showeda change from 1997 to 2007 that was similar to that yielded by thedeforestation models. The distance to rivers variable did not changefor temporary agriculture but did change for permanent agricul-ture. Connection to national markets played a role in both models,but hadmore influence on temporary agriculture, because this kindof agriculture is highly correlated with the expansion of thesoybean area in Mato Grosso. Contrary to the deforestation models,here indigenous lands variables followed an opposite trend in 1997,having a positive effect on temporary and permanent agricultures.In 2007, the humidity index variables also showed a trend oppositeto those of the deforestation models.
Discussion and conclusions
Although the maps in Figs. 6, 7 and 8 show an overall increase inagricultural area, some areas with agricultural activity expandedrapidly over the 1997e2007 period, while others showed little or nogrowth in agricultural activity. Pasture intensified and spread acrosseastern Pará, central Rondônia, and the north of Mato Grosso. Theinfluence of temporary agriculture decreased in those regions, andincreased in central Mato Grosso. Permanent agriculture remainedunchanged, but decreased in Rondônia. Eastern Pará and centralRondônia experienced a large increase in pasture and a decrease inthe area of land under crops. The results are consistent with obser-vations that in areas of pioneer occupation much cropland is con-verted into pasture, and in areas of recent frontier much forest isconverted intopasture (Leite, Costa, Lima,Ribeiro,&Sediyama, 2010).
The census data revealed that pasture was the most commonland use in the Brazilian Amazon, and that the conversion of newlydeforested areas to pasture increased from 70% in 1997 to 80% in2007. Of the three states investigated, Pará had the greatestintensification of pasture, increasing from 58,249 sq km in 1996 to90,433 sq km in 2006 (IBGE, 1996, 2006). Some factors help toexplain the continued predominance of pasture in land use changesin the Brazilian Amazon. For example, the expansion of the cattleherd shows that extensive cattle ranching is profitable in parts ofthe Brazilian Amazon (Margulis, 2004). Also, higher stocking ratesare more common found in most deforested areas, which suggestsan intensification of pasture use (Alves, Morton, Batistella, Roberts,& Souza Jr., 2009; Alves, Morton, Batistella, Roberts, & Souza, 2009).
In Mato Grosso the area under temporary agriculture increasedfrom 27,824 sq km in 1996 to 57,344 sq km in 2006 (IBGE, 1996,2006).The forest conversion to cropland in Mato Grosso is ofparticular interest because of the state’s specific socio-
demographic, economic, and bioclimatic conditions, whichincrease the probability that a different land use system will beestablished. Such growth in croplands is due to massive invest-ments by commercial soybean farmers as well as to the success offarming systems and crop breeding research. Despite that, the maindriver of forest loss in that state is large-scale cattle farming, eventhough the direct conversion of forest to cropland contributedsubstantially to the number of large deforested areas. The defor-estation in Mato Grosso is much more mechanized than in theother two states. This mechanization makes it more likely thatforest will be cleared and accelerates the deforestation.
With regard to the spatial dependence of our determinant vari-ables,weknow that land use tends to be spatially correlated, i.e. thatland use change in one area tends to be correlated with that inadjacent or nearby areas. In this paper, we interpreted the differ-ences between standardized regression coefficients for 1996/1997and 2006/2007 as temporal changes in the influence of factors ondeforestation and agricultural uses. Amore detailed study should bedone to find out to what extent this change can be attributed totemporal changes in dependentor independent variables, or both. Inour studywemade a number of simplifying assumptions, including:(i) a linear response between dependent (log cells proportion ofdeforestation or agricultural land uses) and the independent (partlylog-transformed) factors; (ii) absence of interactions between thefactors anddependent variable; (iii) absence of temporal correlationbetween the dependent variables for 1997 and 2007; and (iv)independent and identically distributed regression residuals. As ourdata were not derived from a controlled experiment, the resultsenotably the linear regression coefficients and their confidenceintervals e should be interpreted with care, and be seen as anapproximation. Using spatial lag regression modeling as an exten-sion to linear regression is a first step towards exploring spatio-temporal data more thoroughly by regression modeling.
In this paper we integrated information from agriculturecensuses with satellite data to provide additional information. Thiscombination enabled us to analyze the spatial patterns of defor-estation and agricultural uses within the Brazilian Amazon. Wehave shown that the extent and the rates of land use changesamong the three states studied are largely driven by a set ofconditions. Our mapped land uses time series and regressionmodels show the distribution and proportion of major agriculturalland uses, and also how these are influenced by several potentialdeterminant factors.
Acknowledgments
The authors would like to thank the aRT team. aRT is an Rpackage that integrates the statistical software R with the GISlibrary TerraLib (http://www.leg.ufpr.br/doku.php/software:art).We thank especially Pedro Ribeiro de Andrade for the developmentof the aRT functions needed to integrate the deforestation andcensus data into the cell-based database. We thank CAPES (Brazil)and DAAD (Germany) for providing scholarships to the first author.The authors’ editor was Joy Burrough.
Appendix. Supplementary material
Supplementary data associated with this article can be found, inthe online version, at doi:10.1016/j.apgeog.2011.04.003.
References
Achard, F., Eva, H. D., Stibig, H.-J., Mayaux, P., Gallego, J., Richards, T., et al. (2002).Determination of deforestation rates of the world’s humid tropical forests.Science, 297(5583), 999e1002.
G.M. de Espindola et al. / Applied Geography 32 (2011) 240e252252
Aguiar, A. P. D. (2006). Modeling land use change in the Brazilian Amazon: Exploringintra-regional heterogeneity. São José dos Campos: National Institute for SpaceResearch (INPE).
Aguiar, A. P. D., Câmara, G., & Escada, M. I. S. (2007). Spatial statistical analysis ofland-use determinants in the Brazilian Amazonia: exploring intra-regionalheterogeneity. Ecological Modelling, 209(2e4), 169e188.
Alves, D. S. (2002). Space-time dynamics of deforestation in Brazilian Amazonia.International Journal of Remote Sensing, 23(14), 2903e2908.
Alves, D. S., Morton, D. C., Batistella, M., Roberts, D. A., & Souza, C., Jr. (2009). Thechanging rates and patterns of deforestation and land use in Brazilian Ama-zonia. In Amazonia and global change. Geophysical Monograpf Series, Vol. 186.
Alves, D. S., Morton, D. C., Batistella, M., Roberts, D. A., & Souza, C. (2009). Thechanging rates and patterns of deforestation and land use in Brazilian Ama-zonia. In Amazonia and global change. Geophysical Monograph Series, Vol. 186.
Andersen, L. E., & Reis, E. J. (1997). Deforestation, development, and government policyin the Brazilian Amazo: An econometric analysis. Brasília, Brazil: IPEA.
Becker, B. (2005). Geopolítica da Amazônia. Journal of the Institute of AdvancedStudies of the University of Sao Paulo, 19, 71e86.
Bivand, R. S., Pebesma, E. J., & Gómez-Rubio, V. (2008). Applied spatial data analysiswith R. New York: Springer.
Cardille, J. A., & Foley, J. A. (2003). Agricultural land-use change in Brazilian Ama-zônia between 1980 and 1995: evidence from integrated satellite and censusdata. Remote Sensing of Environment, 87(4), 551e562.
Chambers, J. Q., Asner, G. P., Morton, D. C., Anderson, L. O., Saatchi, S. S., Espírito-Santo, F. D. B., et al. (2007). Regional ecosystem structure and function:ecological insights from remote sensing of tropical forests. Trends in Ecology &Evolution, 22(8), 414e423.
Dietz, T., Ostrom, E., & Stern, P. C. (2003). The Struggle to Govern the CommonsScience, 302(5652), 1907e1912.
Fearnside, P. M. (1990). The rate and extent of deforestation in Brazilian Amazonia.Environmental Conservation, 17, 213e226.
Fearnside, P. M. (1996). Amazonian deforestation and global warming: carbonstocks in vegetation replacing Brazil’s Amazon forest. Forest Ecology andManagement, 80, 21e34.
Fearnside, P. M., Tardin, A. T., & Filho, L. G. M. (1990). In Deforestation rate in BrazilianAmazonia. São José dos Campos, Brazil: Instituto Nacional de PesquisasEspaciais.
Geist, H. J., & Lambin, E. F. (2001). pp. 136pWhat drives tropical deforestation?, Vol. 37.LUCC Report Series No. 4.
Geist, H. J., McConnell, W., Lambin, E. F., Moran, E., Alves, D., & Rudel, T. (2006).Causes and trajectories of land-use/cover change. In E. F. Lambin, & H. Geist(Eds.), Land-use and land-cover change, local process and global impacts. BerlinHeidelberg: Springer.
Gibson, C., McKean, M. A., & Ostrom, E. (2000). People and forests. Cambridge andLondon: Communities, Institutions and Governance.
IBGE. (1996). In Censo Agropecuário 1996 Insituto Brasileiro de Geografia eEstatística.
IBGE. (2006). In Censo Agropecuário 2006 Insituto Brasileiro de Geografia eEstatística.
IBGE. (2008). In Population Count 2007 Rio de Janeiro: IBGE. Available on-line at.http://www.ibge.gov.br/home/estatistica/populacao/contagem2007/.
INPE. (2010). In PRODES - Amazon deforestation database São Jose dos Campos: INPE.Available online at. www.obt.inpe.br/prodes.
IPCC. (2007a). Climate change 2007: synthesis report. In An assessment of theIntergovernmental Panel on climate change Intergovernmental Panel on climatechange.
IPCC. (2007b). Summary for Policymakers. In B. Metz, O. R. Davidson, P. R. Bosch,R. Dave, & L. A. Meyer (Eds.), Climate change 2007: Mitigation. Cambridge, UnitedKingdom and New York, NY, USA: Cambridge University Press. Contribution ofworking group III to the Fourth assessment Report of the IntergovernmentalPanel on climate change.
Lambin, E. F. (1994). Modelling deforestation processes: a review. In Research Report1. Brussels: European Commission.
Laurance, W. F., Albernaz, A. K. M., Fearnside, P. M., Vasconcelos, H. L., &Ferreira, L. V. (2004). Deforestation in Amazonia. Science, 304(5674), 1109e1111.
Laurance, W. F., Albernaz, A. K. M., Schroth, G.t., Fearnside, P. M., Bergen, S.,Venticinque, E. M., et al. (2002). Predictors of deforestation in the BrazilianAmazon. Journal of Biogeography, 29, 737e748.
Leite, C. C., Costa, M. H., Lima, C. A., d., Ribeiro, C. A. A. S., & Sediyama, G. C. (2010).Historical reconstruction of land use in the Brazilian Amazon (1940e1995).Journal of Land Use Science1e20.
Margulis, S. (2004). Causes of deforestation of the Brazilian Amazon. In W. B. w.paper. World Bank working paper, Vol. 22.
Moran, E. F., Brondízio, E. S., & VanWey, L. K. (2005). Population and environment inAmazônia: landscape and household dynamics. In N. R. Council (Ed.), Pop-ulation, land use, and environment.
Morton, D. C., DeFries, R., & Shimabukuro, Y. E. (2009). Cropland expansion incerrado and transition forest ecosystems: quantifying habitat loss fromsatellite-based vegetation phenology. In R. S. D. C. Klink, & R. Cavalcanti (Eds.),Cerrado land-use and Conservation: Assessing Trade-off’s between human andEcological Needs. Washington D. C.
Nepstad, D., Soares-Filho, B. S., Merry, F., Lima, A., Moutinho, P., Carter, J., et al.(2009). The end of deforestation in the Brazilian Amazon. Science, 326(5958),1350e1351.
Nobre, A. C., Sebestyen, G. N., Gitelman, D. R., Mesulam, M. M., Frackowiak, R. S., &Frith, C. D. (1997). Functional localization of the system for visuospatial atten-tion using positron emission tomography. Brain, 120(3), 515e533.
Payton, M. E., Greenstone, M. H., & Schenker, N. (2003). Overlapping confidenceintervals or standard error intervals: what do they mean in terms of statisticalsignificance? Journal of Insect Science, 3(34).
Perz, S. G., & Skole, D. L. (2003). Social determinants of secondary forests in theBrazilian Amazon. Social Science Research, 32(1), 25e60.
Pfaff, A. S. P. (1996). What drives deforestation in the Brazilian Amazon? Evidence fromsatellite and socioeconomic data. New York: The World Bank, Policy ResearchDepartment.
Piribauer, T. (2010). Land-use change modeling in the Brazilian Amazon - Exploring theimpact of environmental factors. Vienna: Vienna University of Technology.
Quéré, C. L., Raupach, M. R., Canadell, J. G., Marland, G., Bopp, L., Ciais, P., et al.(2009). Trends in the sources and sinks of carbon dioxide. Nature Geoscience,Vol. 2.
R-Team, R. D. C. (2005). R: A language and environment for statistical computing. RFoundation for Statistical Computing.
Reis, E. J., & Guzmán, R. M. (1992). An econometric model of Amazon deforestation.Brazil: IPEA, Brasília.
Rylands, A. B., & Brandon, K. (2005). Brazilian protected areas. Conservation Biology,19(3), 612e618.
Salazar, L. F., Nobre, C. A., & Oyama, M. D. (2007). Climate change consequences onthe biome distribution in tropical South America. Geophysical Research Letters,43, 6.
Shukla, J., Nobre, C. A., & Sellers, P. (1990). Amazon deforestation and climatechange. Science, 247(4948), 1322e1325.
Skole, D., & Tucker, C. (1993). Tropical deforestation and habitat Fragmentation inthe Amazon: satellite data from 1978 to 1988. Science, 260(5116), 1905e1910.
Soares-Filho, B.,Moutinho, P., Nepstad, D., Anderson, A., Rodrigues, H., Garcia, R., et al.(2010). Role of Brazilian Amazon protected areas in climate change mitigation.Proceedings of the National Academy of Sciences, 107(24), 10821e10826.
Soares-Filho, B., Nepstad, D., Curran, L., Cerqueira, G., Garcia, R., Ramos, C. A., et al.(2006). Modelling conservation in the Amazon basin. Nature, 440(7083),520e523.
Soler, L.d. S., & Verburg, P. H. (2010). Combining remote sensing and household leveldata for regional scale analysis of land cover change in the Brazilian Amazon.Regional Environmental Change. doi:10.1007/s10113-009-0107-7.