agricultural field state and runoff risk: proposal of a...
TRANSCRIPT
This paper was peer-reviewed for scientific content. Pages 293-299. In: D.E. Stott, R.H. Mohtar and G.C. Steinhardt (eds). 2001. Sustaining the Global Farm. Selected papers from the 10th International Soil
Conservation Organization Meeting held May 24-29, 1999 at Purdue University and the USDA-ARS National Soil Erosion Research Laboratory.
Agricultural Field State and Runoff Risk: Proposal of a Simple Relation for the Silty-Loam-Soil Context of the Pays de Caux (France)
Philippe Martin*, François Papy, and Alain Capillon
*Philippe Martin, INA P-G, Dpt AGER, 16 rue Claude Bernard 75231 Paris cedex 05, France; *Corresponding author:
[email protected]; François Papy, INRA SAD INRA SAD Ile de France BP 01, 78850 Thiverval Grignon (France), [email protected]; Alain Capillon, CIRAD direction du dept des cultures annuelles Agropolis BP 5035 34032 Montpellier cedex 1, France, [email protected].
ABSTRACT In order to characterize the effects of agricultural
field state on runoff in the Pays de Caux (France), a range of actual agricultural practices has been tested under natural rainfall during two intercrop periods (1993-1994; 1994-1995). Work was conducted on 20 m² experimental plots. Plot state descriptors included soil surface descriptors (tortuosity index in the tillage direction (TI-L), percentage of surface covered by vegetation (COV), macroporosity (MAC)) and soil profile descriptors (percentage of the anthrophic horizon tilled during intercrop period (TSW), percentage of compacted zone in the anthrophic horizon (COMP)). Climate descriptors, defined for each rainfall sequence, included cumulative rainfall (CR), mean rainfall intensity (I) and cumulative daily climatic balance (precipitation minus evapotranspiration) during the three days preceding the maximum rainfall intensity (CB3). The LIFEREG linear regression method (SAS), chosen because it allowed taking into account collector tank overflowing. The LIFEREG method, conducted on 1993-1994 results, only excluded the MAC and TSW variables (0.01 probability level). The regression equation was:
Runoff (mm) = 0.419-0.200*(TI-L)-0.015*COV+0.018*COMP+
0.054*CR+0.530*I+0.018*CB3 A runoff grid composed of four classes has been set
up. After all runoff sequences had been split into these four classes the regression equation has been used to determine the runoff class of each runoff sequence. The calculated class was correct for respectively 52 % of the runoff sequences in 1993-1994 and 56 % in 1994-1995. More-than-one-class error frequency only reached 3 % in 1993-1994 and 9% in 1994-1995. The equation would be useful (i) to compare different plot state at the same time and (ii) to discuss the best way to decrease runoff risk on agricultural plots.
INTRODUCTION The Pays de Caux (Normandie, France) consist of an
extensive plateau with gentle slopes (less than 3%) covered by silty loams containing 10-12% clay. This region which is representative of the intensive agriculture of North-West
Europe where cash-crops (sugar-Beet, potatoes, flax…) predominate has experienced numerous floods over the last ten years (Boardman et al., 1994). These floods were generated by overland flow heavily laden with sediments eroded from homogeneous loamy soils of very poor structural stability. To decrease the flood frequency it is necessary to better understand the effects of the cultivation practices on the overland flow. As it is not possible to test every cultivation practice, modeling the cultivation practices effects on runoff would be helpful to decrease the flood frequency. The more common runoff models (WEPP, EPIC…), of American origin, have not been validated in the Pays de Caux context, which is very different from that of the USA (Grill and Duvoux, 1991). Some European models like EUROSEM, LISEM, would be interesting but they are still under construction. Several authors (Boiffin et Monnier, 1985; Ludwig et al., 1995) have built methods for the description of the soil conditions leading to runoff according to the soil surface roughness and the type of surface crust. These interesting characterizations are very simple and do not take into account important factors such as the vegetative cover. Our aim was to specify these characterizations, proposing statistical relations between the runoff, the soil conditions and the climatic events structure.
MATERIALS AND METHODS The statistical relation was built using results of field
trials. These trials were carried out during intercrop periods, which correspond to a high-level runoff risk due to compacted soil after harvest operations and crusted surface, by frequent medium intensity rainfall events. Field trials were conducted in the Pays de Caux over two intercrop periods (1993-1994 and 1994-1995). The 1993-1994 results were used to build the statistical relation, which was tested with the results of 1994-1995. Field trials were carried out on Orthic Luvisols in two different places, very similar for both texture and slope (Table 1).
Trials were conducted under natural rainfall on two-or-four replicates 20 m² (1,80 meters x 11,1 meters) experimental fields. Plots were delimited by earthen dikes and equipped with collector tanks of 75 litters. Rainfall amount and intensity were measured with an automatic rain gauge. Five cultural techniques were combined with four-post harvest conditions. The cultural techniques and the post
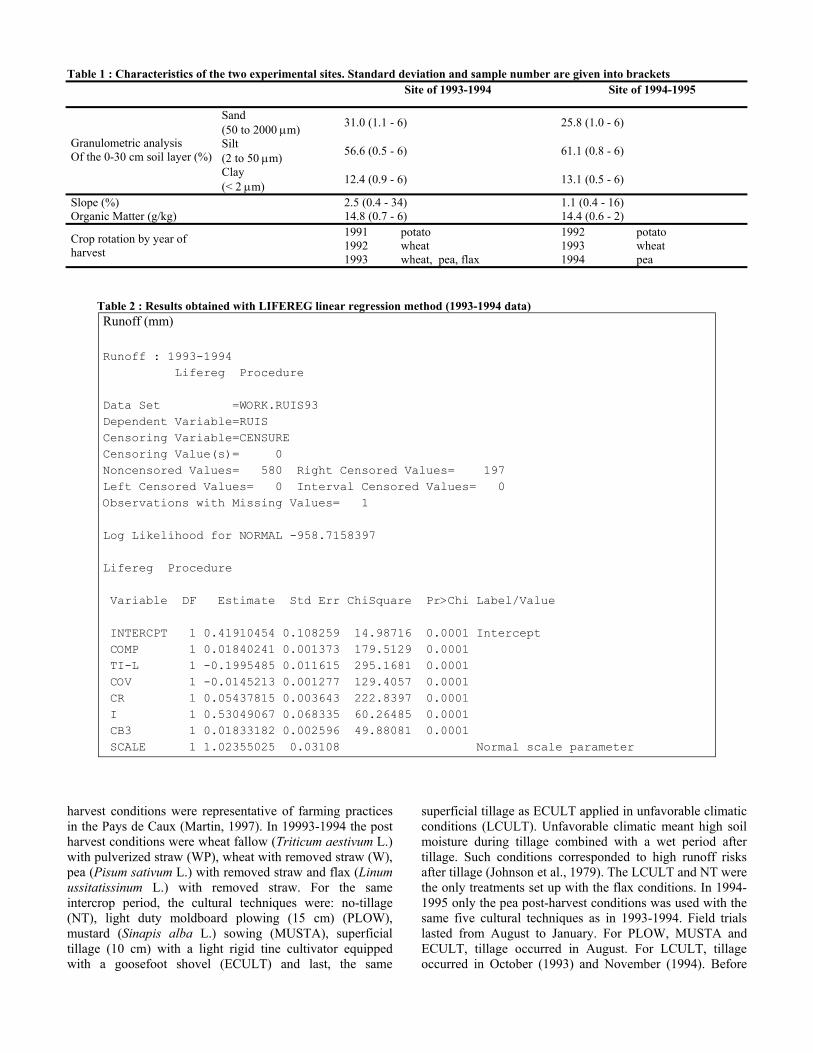
Table 1 : Characteristics of the two experimental sites. Standard deviation and sample number are given into brackets
Site of 1993-1994 Site of 1994-1995
Sand (50 to 2000 µm) 31.0 (1.1 - 6) 25.8 (1.0 - 6)
Silt (2 to 50 µm) 56.6 (0.5 - 6) 61.1 (0.8 - 6)
Granulometric analysis Of the 0-30 cm soil layer (%)
Clay (< 2 µm) 12.4 (0.9 - 6) 13.1 (0.5 - 6)
Slope (%) 2.5 (0.4 - 34) 1.1 (0.4 - 16) Organic Matter (g/kg) 14.8 (0.7 - 6) 14.4 (0.6 - 2)
Crop rotation by year of harvest
1991 1992 1993
potato wheat wheat, pea, flax
1992 1993 1994
potato wheat pea
Table 2 : Results obtained with LIFEREG linear regression method (1993-1994 data) Runoff (mm) Runoff : 1993-1994 Lifereg Procedure Data Set =WORK.RUIS93 Dependent Variable=RUIS Censoring Variable=CENSURE Censoring Value(s)= 0 Noncensored Values= 580 Right Censored Values= 197 Left Censored Values= 0 Interval Censored Values= 0 Observations with Missing Values= 1 Log Likelihood for NORMAL -958.7158397 Lifereg Procedure Variable DF Estimate Std Err ChiSquare Pr>Chi Label/Value INTERCPT 1 0.41910454 0.108259 14.98716 0.0001 Intercept COMP 1 0.01840241 0.001373 179.5129 0.0001 TI-L 1 -0.1995485 0.011615 295.1681 0.0001 COV 1 -0.0145213 0.001277 129.4057 0.0001 CR 1 0.05437815 0.003643 222.8397 0.0001 I 1 0.53049067 0.068335 60.26485 0.0001 CB3 1 0.01833182 0.002596 49.88081 0.0001 SCALE 1 1.02355025 0.03108 Normal scale parameter
harvest conditions were representative of farming practices in the Pays de Caux (Martin, 1997). In 19993-1994 the post harvest conditions were wheat fallow (Triticum aestivum L.) with pulverized straw (WP), wheat with removed straw (W), pea (Pisum sativum L.) with removed straw and flax (Linum ussitatissinum L.) with removed straw. For the same intercrop period, the cultural techniques were: no-tillage (NT), light duty moldboard plowing (15 cm) (PLOW), mustard (Sinapis alba L.) sowing (MUSTA), superficial tillage (10 cm) with a light rigid tine cultivator equipped with a goosefoot shovel (ECULT) and last, the same
superficial tillage as ECULT applied in unfavorable climatic conditions (LCULT). Unfavorable climatic meant high soil moisture during tillage combined with a wet period after tillage. Such conditions corresponded to high runoff risks after tillage (Johnson et al., 1979). The LCULT and NT were the only treatments set up with the flax conditions. In 1994-1995 only the pea post-harvest conditions was used with the same five cultural techniques as in 1993-1994. Field trials lasted from August to January. For PLOW, MUSTA and ECULT, tillage occurred in August. For LCULT, tillage occurred in October (1993) and November (1994). Before
tillage, LCULT behavior was identical to the NT. Runoff volumes were measured after each rain sequence
(from 5 mm to 87 mm per sequence). For LCULT, runoff was monitored only after tillage. In 1993-1994 we had 25 rain events (corresponding to 496 mm cumulative rainfall) for all treatments except for LCULT (only 18 rain events). The 5 treatments were used for W, WP and pea. For flax only NT and LCULT were present. With two replicates we should have had: (25*(5*3+1)+18)*2=836 runoff measurements in 1993-1994. Due to technical problems this number was limited to 778. In 1994-1995 we had 20 rain events (corresponding to 596 mm cumulative rainfall) and 5 treatments for one post harvest condition (pea). For this period we had four replicates for NT, LCULT and MUSTA and only 2 for PLOW and ECULT. We should have obtained (20*3)*4+(20*2)*2=320 runoff measurements. As for 1993-1994, some technical problems limited it to 251.
The structure of the 0-30 cm horizon of the soil was analyzed at the end of the intercrop period (January). The soil conditions (roughness, macroporosity, crop and residue cover) were monitored on a monthly time-step base. Statistical interpolations were used to determine the soil conditions corresponding to the rain sequences that occurred in between two dates of measurements.
The runoff predictive variables included descriptions of both the rain sequence and the soil conditions at the beginning of the rain sequence. Soil crusting is a major factor in runoff generation. However, for the 1993-1994 trials, runoff measurements begun only after crusting occurred on all treatments. This was why crusting stages were not taken into account in the soil condition variables. Surface roughness is another major factor. High random roughness (i.e. obtained with big clods) reduces runoff because it slows down crust extension and increases surface water detention and infiltration (Boiffin, 1985; Freebairn et al., 1991). Highly oriented roughness (i.e. obtained with ridge tillage) facilitates runoff if oriented in the same direction as the main slope of the field. The tortuosity index (TI) was used for soil roughness description. TI is defined for a one-dimensional transect (Boiffin, 1984).
00
LLLTI −
=
Where L is the actual length of the profile, and LO is the projected horizontal length of the profile curve. Bertuzzi et al., (1990) have shown that TI was appropriate to describe the decrease in microrelief under rainfall. In our experiment, TI was measured with a 2-meter-long frame equipped with 156 mobile needles. Two variables were defined using the tortuosity index:
− TI-L: tortuosity index (%) in the tillage direction that was also the main slope direction in the experiments. TI-L is an indicator of the random roughness
− TI-W: tortuosity index (%) perpendicularly to the tillage direction. TI-W is an indicator of the oriented roughness.
Ludwig et al. (1995) used a visual grading of surface that gave good results for runoff explanation at the watershed
scale, where, generally, many-contrasted surface roughness can be found. In our case, surface roughness in tillage direction rapidly decreased for all treatments. After a few rain sequence most of the treatments were in the same visual roughness class whereas differences in tortuosity index values were still significant. That was why the tortuosity index was chosen rather than the visual grading of surface roughness.
A residue or vegetation cover reduces runoff because it slows down the overland flow (McCalla and Army, 1961) and facilitates water infiltration at the stem base (de Ploey, 1982; Meek et al., 1992). To describe soil residue and vegetation cover we defined the COV variable as the soil surface percentage covered by vegetation and/or crop residues (%). (Maximum value = 100). The soil surface macroporosity was described using MAC, the number of macropores of more-than-one-centimeter diameter per soil surface m². MAC was visually determined. The sub surface soil structure also influences runoff. Piéri (1989) showed that deep tillage tends to reduce runoff compared to surface tillage, especially when the soil was previously compacted. Two variables were defined to take this into account. VTS was the proportion of the 0-30 cm horizon that was tilled during the intercrop period (%). COMP was the proportion of compacted zones (Manichon, 1987) in the 0-30 cm horizon1. For each plot, VTS and COMP were measured only at the end of the intercrop period and were considered as constant over all the intercrop period.
Climatic variables were defined at the rain sequence time step. CR was the cumulative rainfall (mm), I the mean rainfall intensity (mm h-1) and CB3 (mm) the cumulative daily balance (precipitation minus evapotranspiration) over the 3 days preceding the maximal rainfall intensity of the rain sequence.
A multiple linear regression method was used to express runoff as a linear function of both soil and climate variables. The runoff depth (mm) could not be determined exactly when the collector tanks overflowed. Interesting runoff data, corresponding to overflows, could not be used in a classical linear regression model. The LIFEREG procedure of the SAS software was used to solve this problem. This procedure allows integrating into the regression model one supplementary variable that indicates if datum is or not censored. Tank collector overflows correspond to censorship to the right (known value by default). With this type of model the test of Fisher is replaced by a test of credibility and the calculation of R ² is not possible. To test the value of the relation we used runoff classes. We distributed the runoff values into four classes according to the runoff depths: very low (< 0.05 mm), low (between 0.05 and 0.6 mm), high (between 0.6 and 3 mm), very high (> 3 mm). The value of
1For the NT treatment the 0-30 cm horizon corresponded to an
untilled area whereas for ECULT, LCULT and PLOW this corresponded to a mix of tilled and untilled areas. For the MUST treatment applied on the wheat fallow, the mustard intercrop was sown after deep plowing (30 cm). Then the 0-30 cm horizon was a tilled area. As direct sowing was used for pea, the 0-30 cm horizon was like ECULT, LCULT and PLOW a mix of tilled (5 cm) and untilled (25 cm) area.
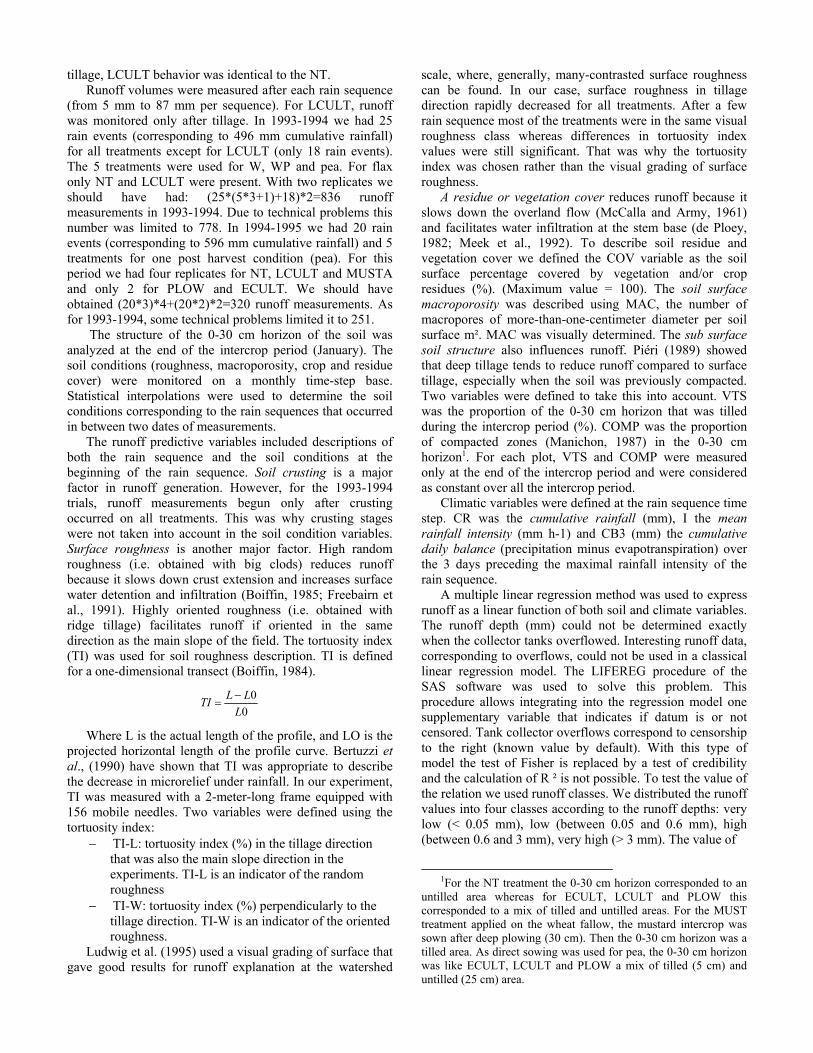
Correlation table (1993-1994 data)
CB3 CR I TI-L TI-W COV MAC COMP VTS CB3 -0.01 0.17* -0.03 0.04 0.02 0.05 -0.00 0.00 CR -0.01 0.50** 0.12* 0.07 0.02 0.11 0.01 -0.01 I 0.17* 0.50** 0.34* 0.14 -0.02 0.21* -0.01 -0.00 TI-L -0.03 0.12* 0.34* 0.43** 0.07 0.56** -0.07 0.09 TI-W 0.04 0.07 0.14 0.43** -0.25 0.37* -0.42** 0.59** COV 0.02 0.02 -0.02 0.07 -0.25 0.17 0.17* -0.45** MAC 0.05 0.11 0.21* 0.56** 0.37* 0.17 -0.40** 0.21* COMP -0.00 0.01 -0.01 -0.07 -0.42** 0.17* -0.40** -0.71*** VTS 0.00 -0.01 -0.00 0.09 0.59** -0.45** 0.21* -0.71*** Correlation significantly different from zero * : from 0.12 to 0.40; ** : from 0.40 to 0.75; *** : more than 0.75
Table 3a: Calculated runoff versus measured runoff (1993-1994 and 1994-1995). Numbers refer to the number of runoff events.
Measured Runoff Very Low Low High Very High TOTAL
Very low 33 41 2 0 76 Low 22 71 14 1 108 High 17 155 204 73 449 Very High 0 1 45 99 145 19
93-
Calculated runoff
TOTAL 72 268 265 173 778 Very low 61 22 4 3 90 Low 5 21 4 0 30 High 14 29 22 22 87 Very High 0 1 6 37 44 19
94-
Calculated runoff
TOTAL 80 73 36 62 251
Table3b : Calculated runoff versus measured runoff (random distribution) Measured Runoff
Very Low Low High Very High
Very low 1/16 1/16 1/16 1/16 Low 1/16 1/16 1/16 1/16 High 1/16 1/16 1/16 1/16 Very High 1/16 1/16 1/16 1/16 R
ando Calculated
runoff
Correct class : 4/16=25% A difference of only one class with reality : 6/16=37.5% A difference of more than one class with reality : 6/16=37.5 %
0.05 mm (1 liter) corresponded to the minimum volume that can be likened to "runoff". The value of 3 mm (60 l) corresponded to the minimum volume for which tank-collector overflow occurred (tank collectors of 75 liter volume were not always horizontal). The intermediate value of 0.6 mm (12 l) was chosen arbitrarily to have comparable number of runoff events in both "low "and "high runoff". The test of the relation consisted in comparing the calculated class distribution of the runoff events with the real distribution of these runoff events in the four classes. The so-obtained crossed table is discussed with regard to the crossed table obtained by substituting a random distribution to the calculated one.
RESULTS The statistical results of the multiple linear regression are
given in Tab. 2. Correlations are globally weak between
variables retained as explicatives of the runoff (COMP, TI-L, COV, CR, I and CB3). Only correlation between I and CR exceeds 0.4. According to the regression results, the calculated runoff was obtained using the equation
Runoff (mm)=0.419-0.200*TI-L-0.015*COV+0.018*COMP+0.054*CR+
0.530*I+0.018*CB3. Table 3a gives calculated distribution versus measured
distribution for both 1993-1994 and 1994-1995. From this table, it is possible to calculate the frequency of correct calculated class (diagonal, black color), the frequency of incorrect calculated class with a difference of only one class with reality (grey color boxes) and the frequency of incorrect calculated class with a difference of more than one class with reality (white color boxes). For the two years of experimentation Fig 1 gives the comparison between
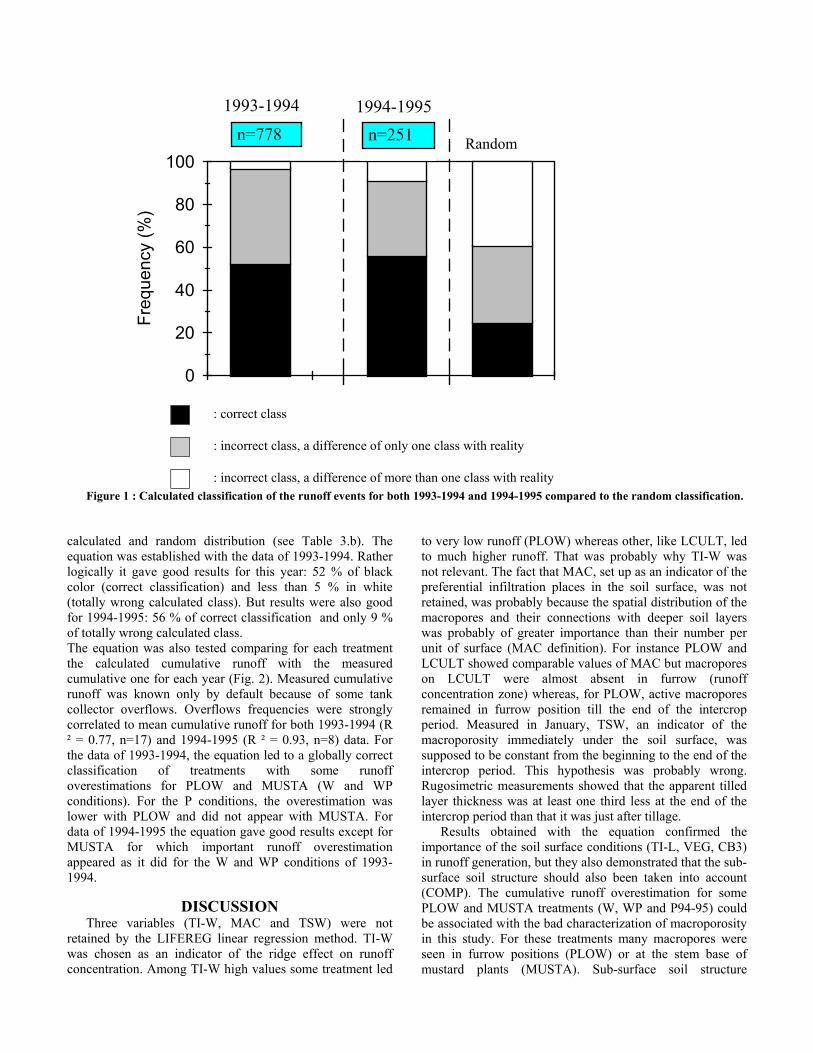
: correct class : incorrect class, a difference of only one class with reality : incorrect class, a difference of more than one class with reality
Figure 1 : Calculated classification of the runoff events for both 1993-1994 and 1994-1995 compared to the random classification.
calculated and random distribution (see Table 3.b). The equation was established with the data of 1993-1994. Rather logically it gave good results for this year: 52 % of black color (correct classification) and less than 5 % in white (totally wrong calculated class). But results were also good for 1994-1995: 56 % of correct classification and only 9 % of totally wrong calculated class. The equation was also tested comparing for each treatment the calculated cumulative runoff with the measured cumulative one for each year (Fig. 2). Measured cumulative runoff was known only by default because of some tank collector overflows. Overflows frequencies were strongly correlated to mean cumulative runoff for both 1993-1994 (R ² = 0.77, n=17) and 1994-1995 (R ² = 0.93, n=8) data. For the data of 1993-1994, the equation led to a globally correct classification of treatments with some runoff overestimations for PLOW and MUSTA (W and WP conditions). For the P conditions, the overestimation was lower with PLOW and did not appear with MUSTA. For data of 1994-1995 the equation gave good results except for MUSTA for which important runoff overestimation appeared as it did for the W and WP conditions of 1993-1994.
DISCUSSION Three variables (TI-W, MAC and TSW) were not
retained by the LIFEREG linear regression method. TI-W was chosen as an indicator of the ridge effect on runoff concentration. Among TI-W high values some treatment led
to very low runoff (PLOW) whereas other, like LCULT, led to much higher runoff. That was probably why TI-W was not relevant. The fact that MAC, set up as an indicator of the preferential infiltration places in the soil surface, was not retained, was probably because the spatial distribution of the macropores and their connections with deeper soil layers was probably of greater importance than their number per unit of surface (MAC definition). For instance PLOW and LCULT showed comparable values of MAC but macropores on LCULT were almost absent in furrow (runoff concentration zone) whereas, for PLOW, active macropores remained in furrow position till the end of the intercrop period. Measured in January, TSW, an indicator of the macroporosity immediately under the soil surface, was supposed to be constant from the beginning to the end of the intercrop period. This hypothesis was probably wrong. Rugosimetric measurements showed that the apparent tilled layer thickness was at least one third less at the end of the intercrop period than that it was just after tillage.
Results obtained with the equation confirmed the importance of the soil surface conditions (TI-L, VEG, CB3) in runoff generation, but they also demonstrated that the sub-surface soil structure should also been taken into account (COMP). The cumulative runoff overestimation for some PLOW and MUSTA treatments (W, WP and P94-95) could be associated with the bad characterization of macroporosity in this study. For these treatments many macropores were seen in furrow positions (PLOW) or at the stem base of mustard plants (MUSTA). Sub-surface soil structure
Calculatedn=2511994-1995
0
20
40
60
80
100 Fr
eque
ncy
(%)
Calculated
199
Randomn=778
1993-1994
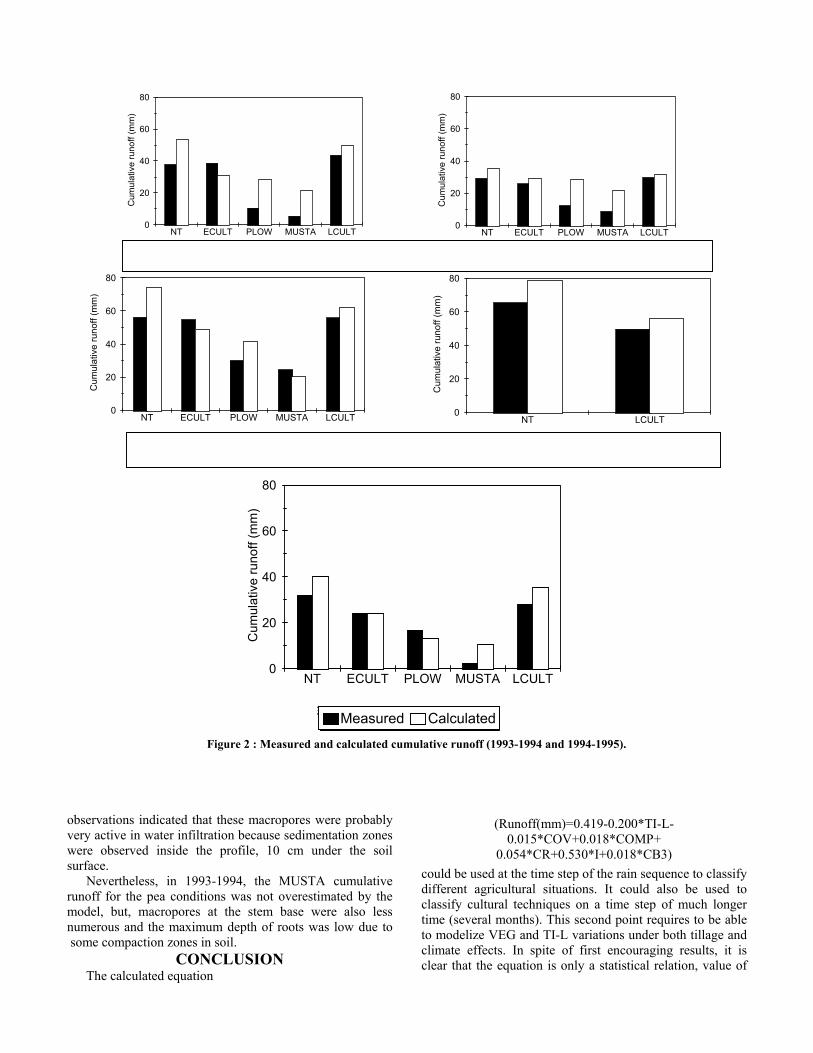
Figure 2 : Measured and calculated cumulative runoff (1993-1994 and 1994-1995).
observations indicated that these macropores were probably very active in water infiltration because sedimentation zones were observed inside the profile, 10 cm under the soil surface.
Nevertheless, in 1993-1994, the MUSTA cumulative runoff for the pea conditions was not overestimated by the model, but, macropores at the stem base were also less numerous and the maximum depth of roots was low due to some compaction zones in soil.
CONCLUSION The calculated equation
(Runoff(mm)=0.419-0.200*TI-L-0.015*COV+0.018*COMP+
0.054*CR+0.530*I+0.018*CB3) could be used at the time step of the rain sequence to classify different agricultural situations. It could also be used to classify cultural techniques on a time step of much longer time (several months). This second point requires to be able to modelize VEG and TI-L variations under both tillage and climate effects. In spite of first encouraging results, it is clear that the equation is only a statistical relation, value of
2.1 Wheat with removed straw. (1993-1994) 2.2: Wheat with pulverized straw (1993-1994)
2.3: Spring peas with removed straw (1993-1994) 2.4: Flax with removed straw (199301994)
0
20
40
60
80
Cum
ulat
ive
runo
ff (m
m)
NT ECULT PLOW MUSTA LCULT 0
20
40
60
80
Cum
ulat
ive
runo
ff (m
m)
NT LCULT
0
20
40
60
80
Cum
ulat
ive
runo
ff (m
m)
NT ECULT PLOW MUSTA LCULT0
20
40
60
80
Cum
ulat
ive
runo
ff (m
m)
NT ECULT PLOW MUSTA LCULT
0
20
40
60
80
Cum
ulat
ive
runo
ff (m
m)
NT ECULT PLOW MUSTA LCULT
Measured CalculatedE
which is very dependent on conditions in which it was established (crusted surfaces, mean rain intensity under 10 mm h-1). Some improvements could be made through better macroporosity characterization.
REFERENCES Boardman J., Ligneau L., de Roo Ad., Vandaele K., 1994.
Flooding of property by runoff from agricultural land in northwestern Europe. Geomorphology 10: 183-196.
Bertuzzi P., Rauws G., Courault D., 1990. Testing roughness indices to estimate soil surface roughness changes due to simulated rainfall. Soil Tillage Res., 17: 87-99.
Boiffin J., 1984. La dégradation structurale des couches superficielles du sol sous l’action des pluies. Thèse de docteur ingénieur. INAPG. 320 pp. + annexes.
Boiffin J., 1985. Stages and time-dependency of soil crusting in situ. International symposium on the assessment of soil surface sealing and crusting. Ghent, Belgium, 1985. pp 91-98.
Boiffin J., Monnier G., 1985. Infiltration rate as affected by soil surface crusting caused by rainfall. International symposium on the assessment of soil surface sealing and crusting. Ghent, Belgium 1985. pp 210-217.
De Ploey J., 1982. A stemflow equation for grasses and similar vegetation. CATENA, 9: 135-146.
Freebairn D.M., Gupta S.C., Rawls W.J., 1991. Influence of agregate size and microrelief on development of surface soil crusts. Soil. Sci. Soc. Am. J., 55: 188-195.
Gril J. J., Duvoux B., 1991. Maîtrise du ruissellement et de l'érosion. Conditions d'adaptation des méthodes américaines. CEMAGREF DICOVA. 157 pp.
Johnson C.B., Mannering J.V., Moldenhauer W.C., 1979. Influence of surface roughness and clod size and stability on soil and water losses. Soil Sci. Soc. Am. J., 43: 772-777.
Ludwig B., Boiffin J., Chadoeuf J., Auzet A.V., 1995. Hydrological structure and erosion damage caused by concentrated flow in cultivated catchments. Catena 25: 227-252.
McCalla T.M., Army T.J., 1961. Stubble mulch farming. Advances in Agronomy, 13: 125-196.
Manichon H., 1987. Observation de l'état structural et mise en évidence d'effet de compactage des horizons travaillés. In G. Monnier and M.J. Goss (Editors) "Soil compaction and regeneration", Balkema, Rotterdam, Netherlands pp 39-52.
Martin P., 1997. Pratiques culturales, ruissellement et érosion diffuse sur les plateaux limoneux du Nord-Ouest de l’Europe. Application aux intercultures du Pays de Caux. Thèse de docteur de l’INA-PG. 184 p + annexes.
Meek BD., Rechel ER., Carter LM., De Tar WR., Urie AL., 1992. Infiltration rate of a sandy loam soil: effect of traffic, tillage, and plant roots. Soil. Sci. Am. J. 56,: 908-913.
Piéri, C., 1989. La fertilité des terres de savane. Bilan de trente ans de recherche et de développement agricoles au sud du Sahara. Paris, Ministère de la Coopération et du Développement/CIRAD, 433 pp