agricultural conservation and …€“1 chapter xii agricultural conservation and forestry...
TRANSCRIPT
XII–1
CHAPTER XII
AGRICULTURAL CONSERVATION AND FORESTRYSTATISTICS
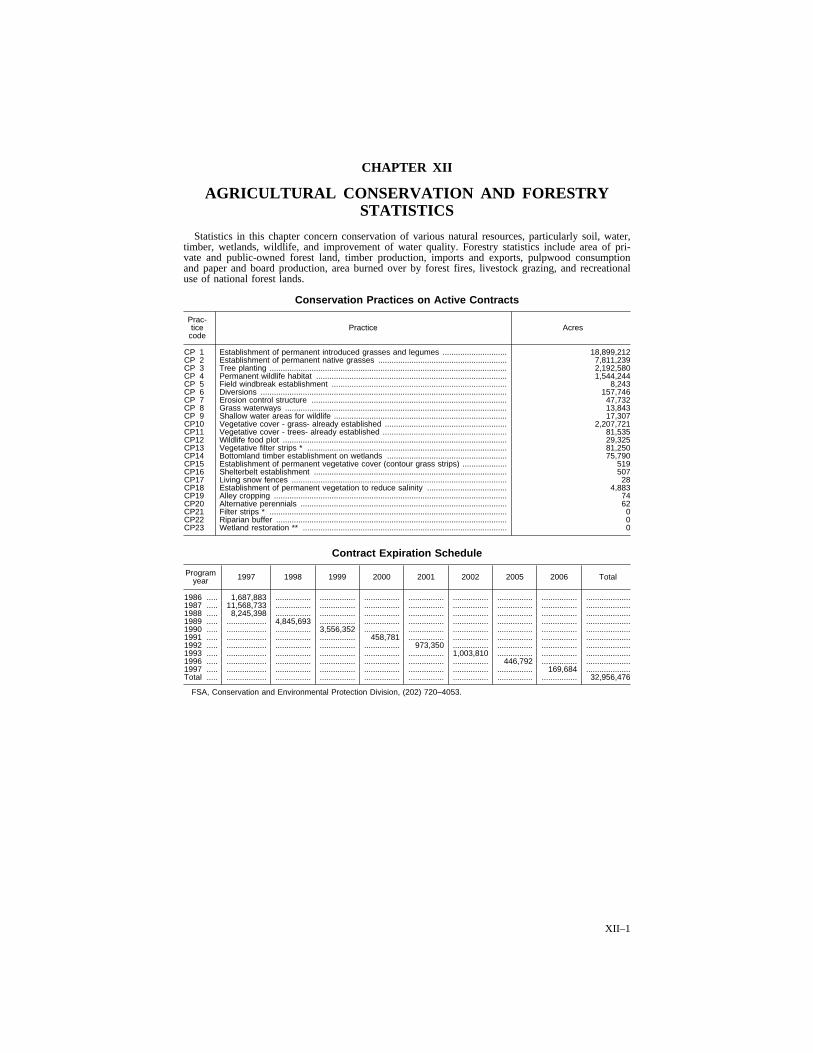
Statistics in this chapter concern conservation of various natural resources, particularly soil, water,timber, wetlands, wildlife, and improvement of water quality. Forestry statistics include area of pri-vate and public-owned forest land, timber production, imports and exports, pulpwood consumptionand paper and board production, area burned over by forest fires, livestock grazing, and recreationaluse of national forest lands.
Conservation Practices on Active Contracts
Prac-tice
codePractice Acres
CP 1 Establishment of permanent introduced grasses and legumes ............................. 18,899,212CP 2 Establishment of permanent native grasses .......................................................... 7,811,239CP 3 Tree planting ........................................................................................................... 2,192,580CP 4 Permanent wildlife habitat ...................................................................................... 1,544,244CP 5 Field windbreak establishment ............................................................................... 8,243CP 6 Diversions ............................................................................................................... 157,746CP 7 Erosion control structure ........................................................................................ 47,732CP 8 Grass waterways .................................................................................................... 13,843CP 9 Shallow water areas for wildlife .............................................................................. 17,307CP10 Vegetative cover - grass- already established ....................................................... 2,207,721CP11 Vegetative cover - trees- already established ........................................................ 81,535CP12 Wildlife food plot ..................................................................................................... 29,325CP13 Vegetative filter strips * .......................................................................................... 81,250CP14 Bottomland timber establishment on wetlands ...................................................... 75,790CP15 Establishment of permanent vegetative cover (contour grass strips) .................... 519CP16 Shelterbelt establishment ....................................................................................... 507CP17 Living snow fences ................................................................................................. 28CP18 Establishment of permanent vegetation to reduce salinity .................................... 4,883CP19 Alley cropping ......................................................................................................... 74CP20 Alternative perennials ............................................................................................. 62CP21 Filter strips * ........................................................................................................... 0CP22 Riparian buffer ........................................................................................................ 0CP23 Wetland restoration ** ............................................................................................ 0
Contract Expiration Schedule
Programyear 1997 1998 1999 2000 2001 2002 2005 2006 Total
1986 ..... 1,687,883 ................ ................ ................ ................ ................ ................ ................ ....................1987 ..... 11,568,733 ................ ................ ................ ................ ................ ................ ................ ....................1988 ..... 8,245,398 ................ ................ ................ ................ ................ ................ ................ ....................1989 ..... .................. 4,845,693 ................ ................ ................ ................ ................ ................ ....................1990 ..... .................. ................ 3,556,352 ................ ................ ................ ................ ................ ....................1991 ..... .................. ................ ................ 458,781 ................ ................ ................ ................ ....................1992 ..... .................. ................ ................ ................ 973,350 ................ ................ ................ ....................1993 ..... .................. ................ ................ ................ ................ 1,003,810 ................ ................ ....................1996 ..... .................. ................ ................ ................ ................ ................ 446,792 ................ ....................1997 ..... .................. ................ ................ ................ ................ ................ ................ 169,684 ....................Total ..... .................. ................ ................ ................ ................ ................ ................ ................ 32,956,476
FSA, Conservation and Environmental Protection Division, (202) 720–4053.
XII–2 AGRICULTURAL CONSERVATION AND FORESTRY STATISTICS
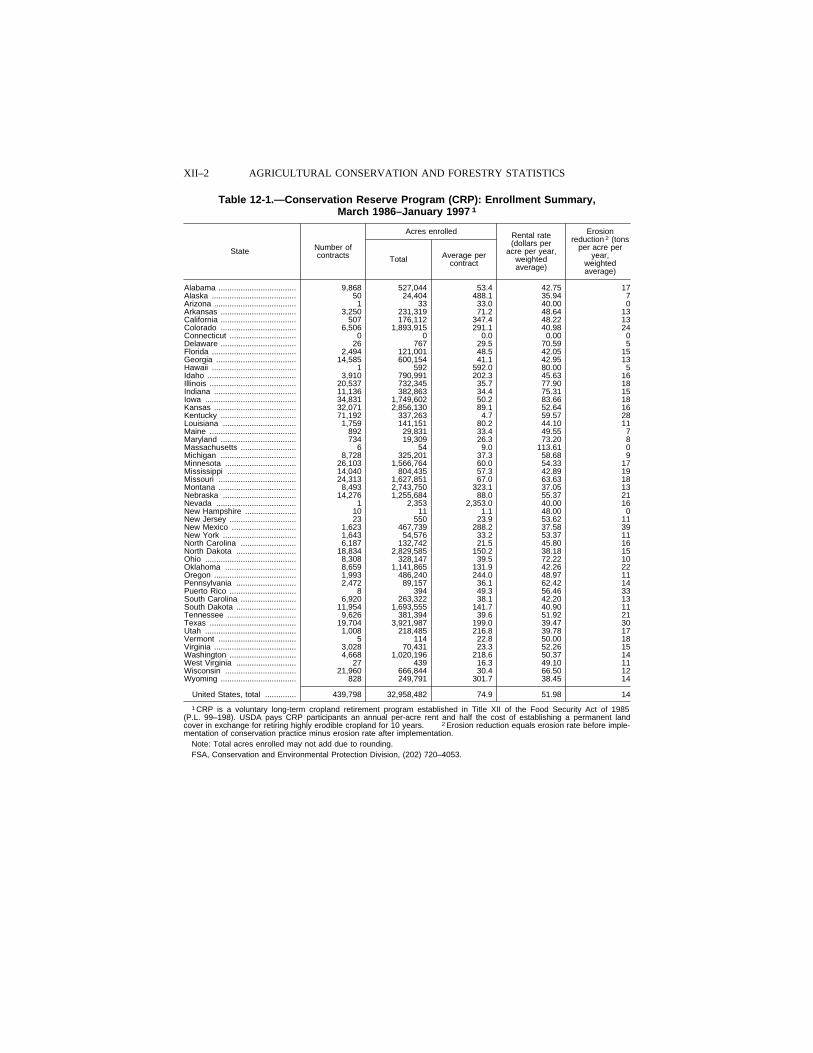
Table 12-1.—Conservation Reserve Program (CRP): Enrollment Summary,March 1986–January 1997 1
State Number ofcontracts
Acres enrolled Rental rate(dollars per
acre per year,weightedaverage)
Erosionreduction 2 (tons
per acre peryear,
weightedaverage)
Total Average percontract
Alabama ................................... 9,868 527,044 53.4 42.75 17Alaska ...................................... 50 24,404 488.1 35.94 7Arizona ..................................... 1 33 33.0 40.00 0Arkansas .................................. 3,250 231,319 71.2 48.64 13California .................................. 507 176,112 347.4 48.22 13Colorado .................................. 6,506 1,893,915 291.1 40.98 24Connecticut .............................. 0 0 0.0 0.00 0Delaware .................................. 26 767 29.5 70.59 5Florida ...................................... 2,494 121,001 48.5 42.05 15Georgia .................................... 14,585 600,154 41.1 42.95 13Hawaii ...................................... 1 592 592.0 80.00 5Idaho ........................................ 3,910 790,991 202.3 45.63 16Illinois ....................................... 20,537 732,345 35.7 77.90 18Indiana ..................................... 11,136 382,863 34.4 75.31 15Iowa ......................................... 34,831 1,749,602 50.2 83.66 18Kansas ..................................... 32,071 2,856,130 89.1 52.64 16Kentucky .................................. 71,192 337,263 4.7 59.57 28Louisiana ................................. 1,759 141,151 80.2 44.10 11Maine ....................................... 892 29,831 33.4 49.55 7Maryland .................................. 734 19,309 26.3 73.20 8Massachusetts ......................... 6 54 9.0 113.61 0Michigan .................................. 8,728 325,201 37.3 58.68 9Minnesota ................................ 26,103 1,566,764 60.0 54.33 17Mississippi ............................... 14,040 804,435 57.3 42.89 19Missouri ................................... 24,313 1,627,851 67.0 63.63 18Montana ................................... 8,493 2,743,750 323.1 37.05 13Nebraska ................................. 14,276 1,255,684 88.0 55.37 21Nevada .................................... 1 2,353 2,353.0 40.00 16New Hampshire ....................... 10 11 1.1 48.00 0New Jersey .............................. 23 550 23.9 53.62 11New Mexico ............................. 1,623 467,739 288.2 37.58 39New York ................................. 1,643 54,576 33.2 53.37 11North Carolina ......................... 6,187 132,742 21.5 45.80 16North Dakota ........................... 18,834 2,829,585 150.2 38.18 15Ohio ......................................... 8,308 328,147 39.5 72.22 10Oklahoma ................................ 8,659 1,141,865 131.9 42.26 22Oregon ..................................... 1,993 486,240 244.0 48.97 11Pennsylvania ........................... 2,472 89,157 36.1 62.42 14Puerto Rico .............................. 8 394 49.3 56.46 33South Carolina ......................... 6,920 263,322 38.1 42.20 13South Dakota ........................... 11,954 1,693,555 141.7 40.90 11Tennessee ............................... 9,626 381,394 39.6 51.92 21Texas ....................................... 19,704 3,921,987 199.0 39.47 30Utah ......................................... 1,008 218,485 216.8 39.78 17Vermont ................................... 5 114 22.8 50.00 18Virginia ..................................... 3,028 70,431 23.3 52.26 15Washington .............................. 4,668 1,020,196 218.6 50.37 14West Virginia ........................... 27 439 16.3 49.10 11Wisconsin ................................ 21,960 666,844 30.4 66.50 12Wyoming .................................. 828 249,791 301.7 38.45 14
United States, total .............. 439,798 32,958,482 74.9 51.98 14
1 CRP is a voluntary long-term cropland retirement program established in Title XII of the Food Security Act of 1985(P.L. 99–198). USDA pays CRP participants an annual per-acre rent and half the cost of establishing a permanent landcover in exchange for retiring highly erodible cropland for 10 years. 2 Erosion reduction equals erosion rate before imple-mentation of conservation practice minus erosion rate after implementation.
Note: Total acres enrolled may not add due to rounding.FSA, Conservation and Environmental Protection Division, (202) 720–4053.
XII–3AGRICULTURAL STATISTICS 1998
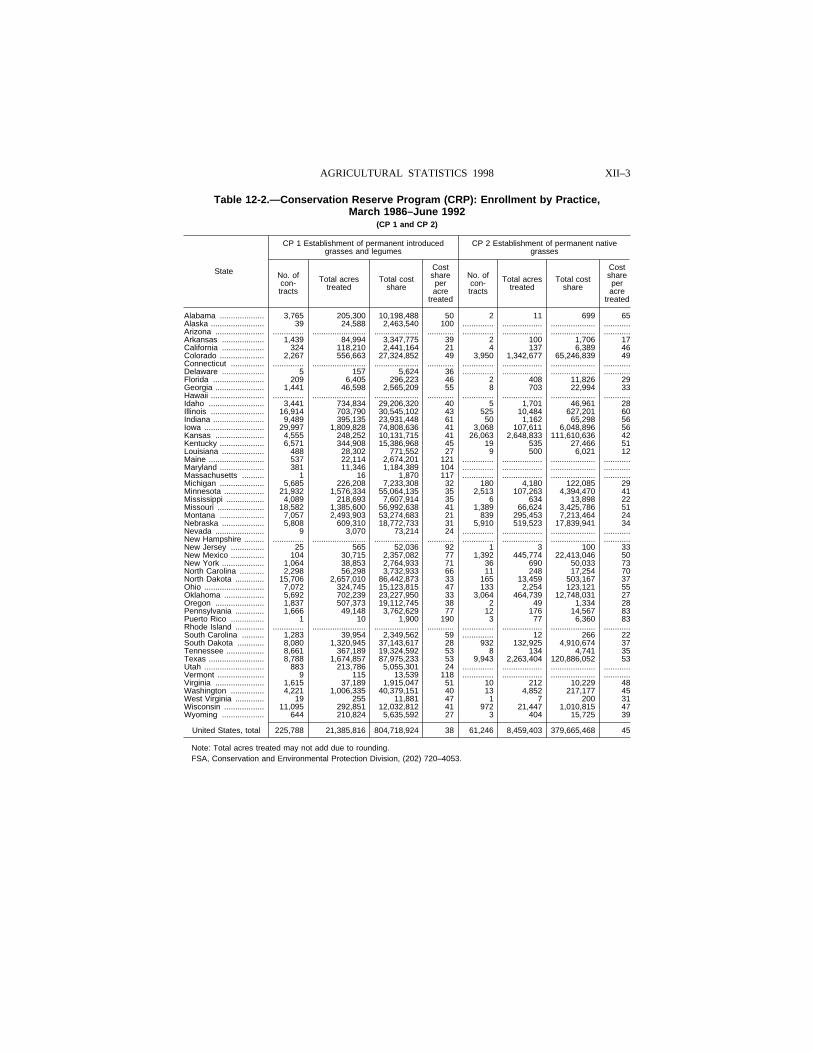
Table 12-2.—Conservation Reserve Program (CRP): Enrollment by Practice,March 1986–June 1992
(CP 1 and CP 2)
State
CP 1 Establishment of permanent introducedgrasses and legumes
CP 2 Establishment of permanent nativegrasses
No. ofcon-tracts
Total acrestreated
Total costshare
Costshareperacre
treated
No. ofcon-tracts
Total acrestreated
Total costshare
Costshareperacre
treated
Alabama .................... 3,765 205,300 10,198,488 50 2 11 699 65Alaska ........................ 39 24,588 2,463,540 100 .............. .................. .................... ............Arizona ...................... .............. ........................ .................... ............ .............. .................. .................... ............Arkansas ................... 1,439 84,994 3,347,775 39 2 100 1,706 17California ................... 324 118,210 2,441,164 21 4 137 6,389 46Colorado .................... 2,267 556,663 27,324,852 49 3,950 1,342,677 65,246,839 49Connecticut ............... .............. ........................ .................... ............ .............. .................. .................... ............Delaware ................... 5 157 5,624 36 .............. .................. .................... ............Florida ....................... 209 6,405 296,223 46 2 408 11,826 29Georgia ...................... 1,441 46,598 2,565,209 55 8 703 22,994 33Hawaii ........................ .............. ........................ .................... ............ .............. .................. .................... ............Idaho ......................... 3,441 734,834 29,206,320 40 5 1,701 46,961 28Illinois ........................ 16,914 703,790 30,545,102 43 525 10,484 627,201 60Indiana ....................... 9,489 395,135 23,931,448 61 50 1,162 65,298 56Iowa ........................... 29,997 1,809,828 74,808,636 41 3,068 107,611 6,048,896 56Kansas ...................... 4,555 248,252 10,131,715 41 26,063 2,648,833 111,610,636 42Kentucky .................... 6,571 344,908 15,386,968 45 19 535 27,466 51Louisiana ................... 488 28,302 771,552 27 9 500 6,021 12Maine ......................... 537 22,114 2,674,201 121 .............. .................. .................... ............Maryland .................... 381 11,346 1,184,389 104 .............. .................. .................... ............Massachusetts .......... 1 16 1,870 117 .............. .................. .................... ............Michigan .................... 5,685 226,208 7,233,308 32 180 4,180 122,085 29Minnesota .................. 21,932 1,576,334 55,064,135 35 2,513 107,263 4,394,470 41Mississippi ................. 4,089 218,693 7,607,914 35 6 634 13,898 22Missouri ..................... 18,582 1,385,600 56,992,638 41 1,389 66,624 3,425,786 51Montana .................... 7,057 2,493,903 53,274,683 21 839 295,453 7,213,464 24Nebraska ................... 5,808 609,310 18,772,733 31 5,910 519,523 17,839,941 34Nevada ...................... 9 3,070 73,214 24 .............. .................. .................... ............New Hampshire ......... .............. ........................ .................... ............ .............. .................. .................... ............New Jersey ............... 25 565 52,036 92 1 3 100 33New Mexico ............... 104 30,715 2,357,082 77 1,392 445,774 22,413,046 50New York ................... 1,064 38,853 2,764,933 71 36 690 50,033 73North Carolina ........... 2,298 56,298 3,732,933 66 11 248 17,254 70North Dakota ............. 15,706 2,657,010 86,442,873 33 165 13,459 503,167 37Ohio ........................... 7,072 324,745 15,123,815 47 133 2,254 123,121 55Oklahoma .................. 5,692 702,239 23,227,950 33 3,064 464,739 12,748,031 27Oregon ...................... 1,837 507,373 19,112,745 38 2 49 1,334 28Pennsylvania ............. 1,666 49,148 3,762,629 77 12 176 14,567 83Puerto Rico ............... 1 10 1,900 190 3 77 6,360 83Rhode Island ............. .............. ........................ .................... ............ .............. .................. .................... ............South Carolina .......... 1,283 39,954 2,349,562 59 .............. 12 266 22South Dakota ............ 8,080 1,320,945 37,143,617 28 932 132,925 4,910,674 37Tennessee ................. 8,661 367,189 19,324,592 53 8 134 4,741 35Texas ......................... 8,788 1,674,857 87,975,233 53 9,943 2,263,404 120,886,052 53Utah ........................... 883 213,786 5,055,301 24 .............. .................. .................... ............Vermont ..................... 9 115 13,539 118 .............. .................. .................... ............Virginia ...................... 1,615 37,189 1,915,047 51 10 212 10,229 48Washington ............... 4,221 1,006,335 40,379,151 40 13 4,852 217,177 45West Virginia ............. 19 255 11,881 47 1 7 200 31Wisconsin .................. 11,095 292,851 12,032,812 41 972 21,447 1,010,815 47Wyoming ................... 644 210,824 5,635,592 27 3 404 15,725 39
United States, total 225,788 21,385,816 804,718,924 38 61,246 8,459,403 379,665,468 45
Note: Total acres treated may not add due to rounding.FSA, Conservation and Environmental Protection Division, (202) 720–4053.
XII–4 AGRICULTURAL CONSERVATION AND FORESTRY STATISTICS
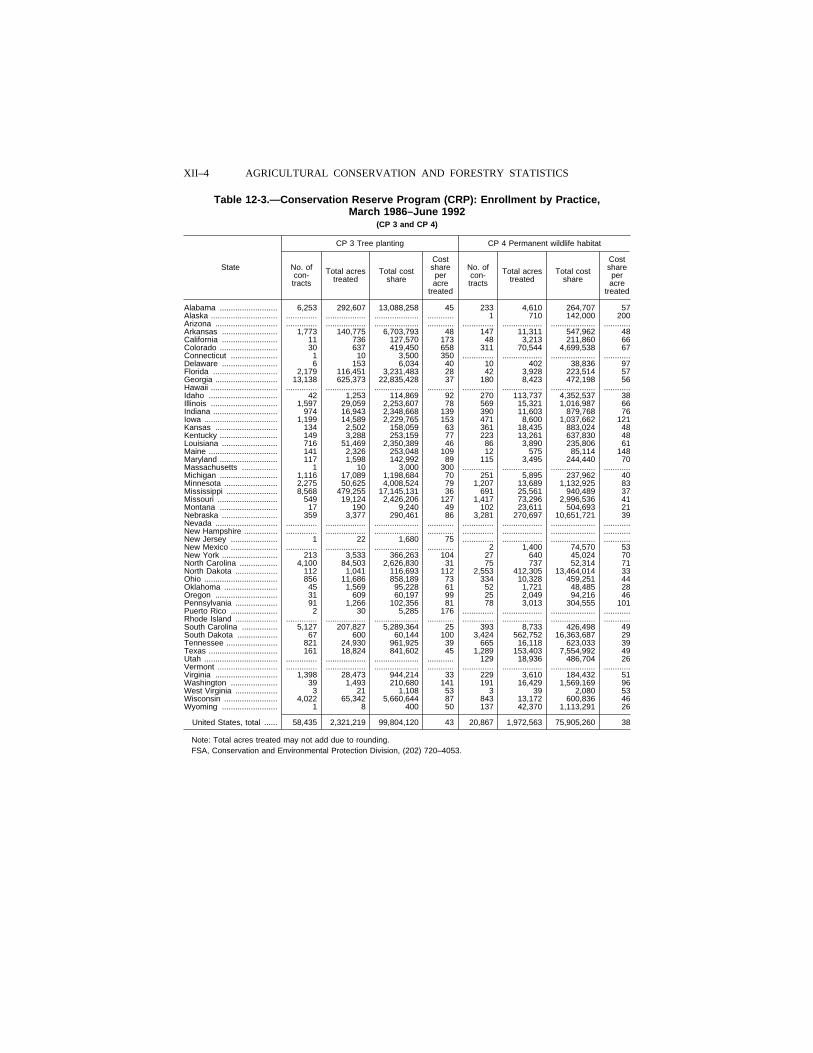
Table 12-3.—Conservation Reserve Program (CRP): Enrollment by Practice,March 1986–June 1992
(CP 3 and CP 4)
State
CP 3 Tree planting CP 4 Permanent wildlife habitat
No. ofcon-tracts
Total acrestreated
Total costshare
Costshareperacre
treated
No. ofcon-tracts
Total acrestreated
Total costshare
Costshareperacre
treated
Alabama .......................... 6,253 292,607 13,088,258 45 233 4,610 264,707 57Alaska .............................. .............. .................. .................... ............ 1 710 142,000 200Arizona ............................ .............. .................. .................... ............ .............. .................. .................... ............Arkansas ......................... 1,773 140,775 6,703,793 48 147 11,311 547,962 48California ......................... 11 736 127,570 173 48 3,213 211,860 66Colorado .......................... 30 637 419,450 658 311 70,544 4,699,538 67Connecticut ..................... 1 10 3,500 350 .............. .................. .................... ............Delaware ......................... 6 153 6,034 40 10 402 38,836 97Florida ............................. 2,179 116,451 3,231,483 28 42 3,928 223,514 57Georgia ............................ 13,138 625,373 22,835,428 37 180 8,423 472,198 56Hawaii .............................. .............. .................. .................... ............ .............. .................. .................... ............Idaho ............................... 42 1,253 114,869 92 270 113,737 4,352,537 38Illinois .............................. 1,597 29,059 2,253,607 78 569 15,321 1,016,987 66Indiana ............................. 974 16,943 2,348,668 139 390 11,603 879,768 76Iowa ................................. 1,199 14,589 2,229,765 153 471 8,600 1,037,662 121Kansas ............................ 134 2,502 158,059 63 361 18,435 883,024 48Kentucky .......................... 149 3,288 253,159 77 223 13,261 637,830 48Louisiana ......................... 716 51,469 2,350,389 46 86 3,890 235,806 61Maine ............................... 141 2,326 253,048 109 12 575 85,114 148Maryland .......................... 117 1,598 142,992 89 115 3,495 244,440 70Massachusetts ................ 1 10 3,000 300 .............. .................. .................... ............Michigan .......................... 1,116 17,089 1,198,684 70 251 5,895 237,962 40Minnesota ........................ 2,275 50,625 4,008,524 79 1,207 13,689 1,132,925 83Mississippi ....................... 8,568 479,255 17,145,131 36 691 25,561 940,489 37Missouri ........................... 549 19,124 2,426,206 127 1,417 73,296 2,996,536 41Montana .......................... 17 190 9,240 49 102 23,611 504,693 21Nebraska ......................... 359 3,377 290,461 86 3,281 270,697 10,651,721 39Nevada ............................ .............. .................. .................... ............ .............. .................. .................... ............New Hampshire ............... .............. .................. .................... ............ .............. .................. .................... ............New Jersey ..................... 1 22 1,680 75 .............. .................. .................... ............New Mexico ..................... .............. .................. .................... ............ 2 1,400 74,570 53New York ......................... 213 3,533 366,263 104 27 640 45,024 70North Carolina ................. 4,100 84,503 2,626,830 31 75 737 52,314 71North Dakota ................... 112 1,041 116,693 112 2,553 412,305 13,464,014 33Ohio ................................. 856 11,686 858,189 73 334 10,328 459,251 44Oklahoma ........................ 45 1,569 95,228 61 52 1,721 48,485 28Oregon ............................ 31 609 60,197 99 25 2,049 94,216 46Pennsylvania ................... 91 1,266 102,356 81 78 3,013 304,555 101Puerto Rico ..................... 2 30 5,285 176 .............. .................. .................... ............Rhode Island ................... .............. .................. .................... ............ .............. .................. .................... ............South Carolina ................ 5,127 207,827 5,289,364 25 393 8,733 426,498 49South Dakota .................. 67 600 60,144 100 3,424 562,752 16,363,687 29Tennessee ....................... 821 24,930 961,925 39 665 16,118 623,033 39Texas ............................... 161 18,824 841,602 45 1,289 153,403 7,554,992 49Utah ................................. .............. .................. .................... ............ 129 18,936 486,704 26Vermont ........................... .............. .................. .................... ............ .............. .................. .................... ............Virginia ............................ 1,398 28,473 944,214 33 229 3,610 184,432 51Washington ..................... 39 1,493 210,680 141 191 16,429 1,569,169 96West Virginia ................... 3 21 1,108 53 3 39 2,080 53Wisconsin ........................ 4,022 65,342 5,660,644 87 843 13,172 600,836 46Wyoming ......................... 1 8 400 50 137 42,370 1,113,291 26
United States, total ...... 58,435 2,321,219 99,804,120 43 20,867 1,972,563 75,905,260 38
Note: Total acres treated may not add due to rounding.FSA, Conservation and Environmental Protection Division, (202) 720–4053.
XII–5AGRICULTURAL STATISTICS 1998
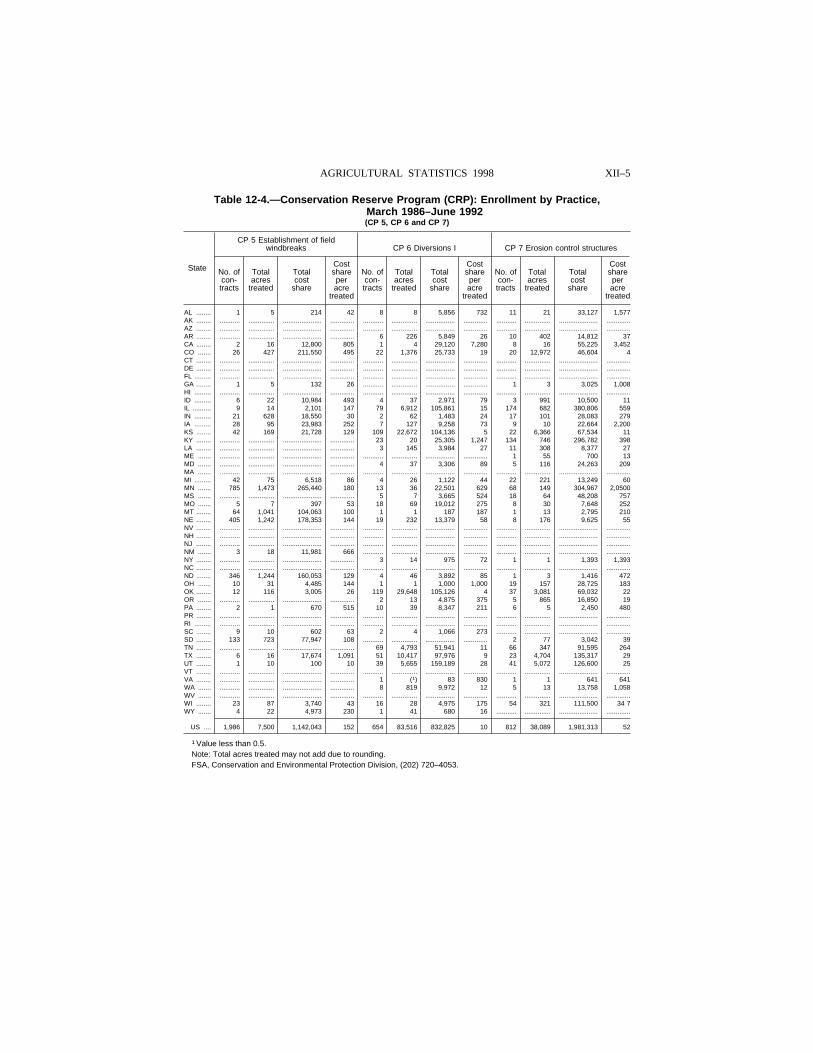
Table 12-4.—Conservation Reserve Program (CRP): Enrollment by Practice,March 1986–June 1992(CP 5, CP 6 and CP 7)
State
CP 5 Establishment of fieldwindbreaks CP 6 Diversions I CP 7 Erosion control structures
No. ofcon-tracts
Totalacres
treated
Totalcost
share
Costshareperacre
treated
No. ofcon-tracts
Totalacres
treated
Totalcost
share
Costshareperacre
treated
No. ofcon-tracts
Totalacres
treated
Totalcost
share
Costshareperacre
treated
AL ........ 1 5 214 42 8 8 5,856 732 11 21 33,127 1,577AK ........ ........... .............. ..................... ............. ........... .............. ................ ............. ........... .............. ..................... .............AZ ........ ........... .............. ..................... ............. ........... .............. ................ ............. ........... .............. ..................... .............AR ........ ........... .............. ..................... ............. 6 226 5,849 26 10 402 14,812 37CA ........ 2 16 12,800 805 1 4 29,120 7,280 8 16 55,225 3,452CO ....... 26 427 211,550 495 22 1,376 25,733 19 20 12,972 46,604 4CT ........ ........... .............. ..................... ............. ........... .............. ................ ............. ........... .............. ..................... .............DE ........ ........... .............. ..................... ............. ........... .............. ................ ............. ........... .............. ..................... .............FL ......... ........... .............. ..................... ............. ........... .............. ................ ............. ........... .............. ..................... .............GA ........ 1 5 132 26 ........... .............. ................ ............. 1 3 3,025 1,008HI ......... ........... .............. ..................... ............. ........... .............. ................ ............. ........... .............. ..................... .............ID ......... 6 22 10,984 493 4 37 2,971 79 3 991 10,500 11IL .......... 9 14 2,101 147 79 6,912 105,861 15 174 682 380,806 559IN ......... 21 628 18,550 30 2 62 1,483 24 17 101 28,083 279IA ......... 28 95 23,983 252 7 127 9,258 73 9 10 22,664 2,200KS ........ 42 169 21,728 129 109 22,672 104,136 5 22 6,366 67,534 11KY ........ ........... .............. ..................... ............. 23 20 25,305 1,247 134 746 296,782 398LA ........ ........... .............. ..................... ............. 3 145 3,984 27 11 308 8,377 27ME ....... ........... .............. ..................... ............. ........... .............. ................ ............. 1 55 700 13MD ....... ........... .............. ..................... ............. 4 37 3,306 89 5 116 24,263 209MA ....... ........... .............. ..................... ............. ........... .............. ................ ............. ........... .............. ..................... .............MI ......... 42 75 6,518 86 4 26 1,122 44 22 221 13,249 60MN ....... 785 1,473 265,440 180 13 36 22,501 629 68 149 304,967 2,0500MS ....... ........... .............. ..................... ............. 5 7 3,665 524 18 64 48,208 757MO ....... 5 7 397 53 18 69 19,012 275 8 30 7,648 252MT ........ 64 1,041 104,063 100 1 1 187 187 1 13 2,795 210NE ........ 405 1,242 178,353 144 19 232 13,379 58 8 176 9,625 55NV ........ ........... .............. ..................... ............. ........... .............. ................ ............. ........... .............. ..................... .............NH ........ ........... .............. ..................... ............. ........... .............. ................ ............. ........... .............. ..................... .............NJ ........ ........... .............. ..................... ............. ........... .............. ................ ............. ........... .............. ..................... .............NM ....... 3 18 11,981 666 ........... .............. ................ ............. ........... .............. ..................... .............NY ........ ........... .............. ..................... ............. 3 14 975 72 1 1 1,393 1,393NC ........ ........... .............. ..................... ............. ........... .............. ................ ............. ........... .............. ..................... .............ND ........ 346 1,244 160,053 129 4 46 3,892 85 1 3 1,416 472OH ....... 10 31 4,485 144 1 1 1,000 1,000 19 157 28,725 183OK ........ 12 116 3,005 26 119 29,648 105,126 4 37 3,081 69,032 22OR ....... ........... .............. ..................... ............. 2 13 4,875 375 5 865 16,850 19PA ........ 2 1 670 515 10 39 8,347 211 6 5 2,450 480PR ........ ........... .............. ..................... ............. ........... .............. ................ ............. ........... .............. ..................... .............RI ......... ........... .............. ..................... ............. ........... .............. ................ ............. ........... .............. ..................... .............SC ........ 9 10 602 63 2 4 1,066 273 ........... .............. ..................... .............SD ........ 133 723 77,947 108 ........... .............. ................ ............. 2 77 3,042 39TN ........ ........... .............. ..................... ............. 69 4,793 51,941 11 66 347 91,595 264TX ........ 6 16 17,674 1,091 51 10,417 97,976 9 23 4,704 135,317 29UT ........ 1 10 100 10 39 5,655 159,189 28 41 5,072 126,600 25VT ........ ........... .............. ..................... ............. ........... .............. ................ ............. ........... .............. ..................... .............VA ........ ........... .............. ..................... ............. 1 (1) 83 830 1 1 641 641WA ....... ........... .............. ..................... ............. 8 819 9,972 12 5 13 13,758 1,058WV ....... ........... .............. ..................... ............. ........... .............. ................ ............. ........... .............. ..................... .............WI ........ 23 87 3,740 43 16 28 4,975 175 54 321 111,500 34 7WY ....... 4 22 4,973 230 1 41 680 16 ........... .............. ..................... .............
US .... 1,986 7,500 1,142,043 152 654 83,516 832,825 10 812 38,089 1,981,313 52
1 Value less than 0.5.Note: Total acres treated may not add due to rounding.FSA, Conservation and Environmental Protection Division, (202) 720–4053.
XII–6 AGRICULTURAL CONSERVATION AND FORESTRY STATISTICS
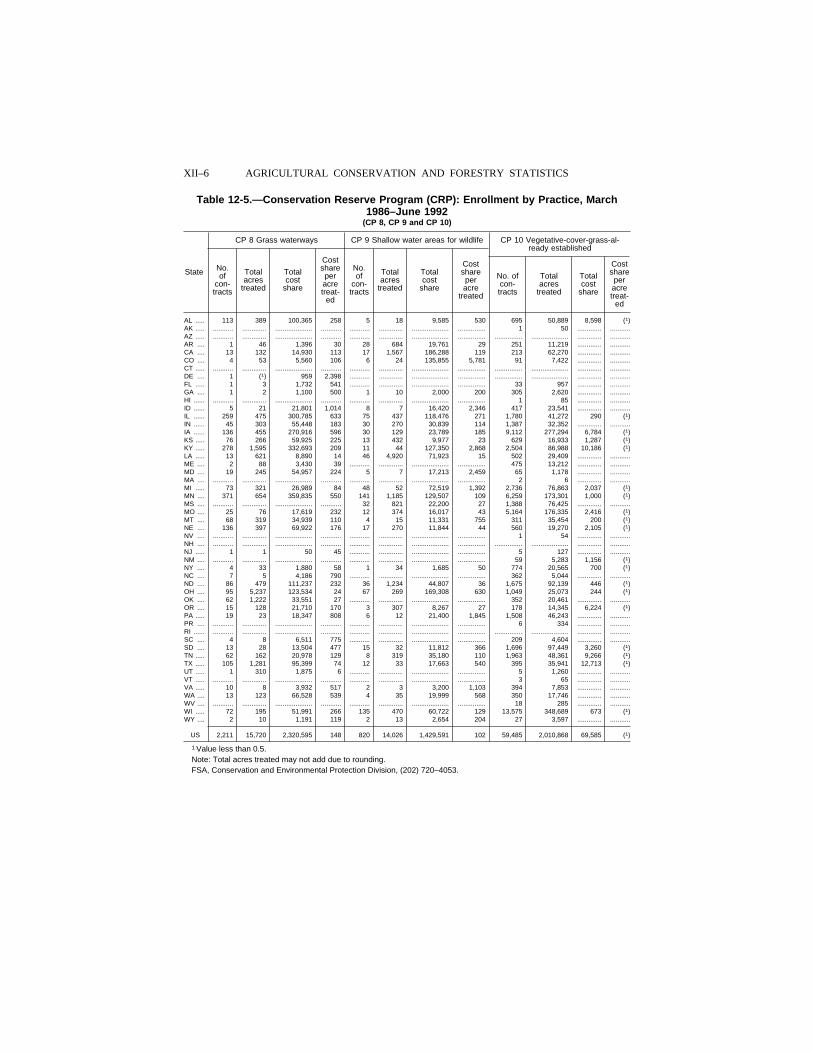
Table 12-5.—Conservation Reserve Program (CRP): Enrollment by Practice, March1986–June 1992
(CP 8, CP 9 and CP 10)
State
CP 8 Grass waterways CP 9 Shallow water areas for wildlife CP 10 Vegetative-cover-grass-al-ready established
No.of
con-tracts
Totalacres
treated
Totalcost
share
Costshareperacretreat-
ed
No.of
con-tracts
Totalacres
treated
Totalcost
share
Costshareperacre
treated
No. ofcon-tracts
Totalacres
treated
Totalcost
share
Costshareperacretreat-
ed
AL ..... 113 389 100,365 258 5 18 9,585 530 695 50,889 8,598 (1)AK ..... ........... ............. .................... ........... ........... ............. .................... ............... 1 50 ............. ...........AZ ..... ........... ............. .................... ........... ........... ............. .................... ............... ............... .................... ............. ...........AR .... 1 46 1,396 30 28 684 19,761 29 251 11,219 ............. ...........CA .... 13 132 14,930 113 17 1,567 186,288 119 213 62,270 ............. ...........CO .... 4 53 5,560 106 6 24 135,855 5,781 91 7,422 ............. ...........CT ..... ........... ............. .................... ........... ........... ............. .................... ............... ............... .................... ............. ...........DE .... 1 (1) 959 2,398 ........... ............. .................... ............... ............... .................... ............. ...........FL ..... 1 3 1,732 541 ........... ............. .................... ............... 33 957 ............. ...........GA .... 1 2 1,100 500 1 10 2,000 200 305 2,620 ............. ...........HI ...... ........... ............. .................... ........... ........... ............. .................... ............... 1 85 ............. ...........ID ...... 5 21 21,801 1,014 8 7 16,420 2,346 417 23,541 ............. ...........IL ...... 259 475 300,785 633 75 437 118,476 271 1,780 41,272 290 (1)IN ...... 45 303 55,448 183 30 270 30,839 114 1,387 32,352 ............. ...........IA ...... 136 455 270,916 596 30 129 23,789 185 9,112 277,294 6,784 (1)KS ..... 76 266 59,925 225 13 432 9,977 23 629 16,933 1,287 (1)KY ..... 278 1,595 332,693 209 11 44 127,350 2,868 2,504 86,988 10,186 (1)LA ..... 13 621 8,890 14 46 4,920 71,923 15 502 29,409 ............. ...........ME .... 2 88 3,430 39 ........... ............. .................... ............... 475 13,212 ............. ...........MD .... 19 245 54,957 224 5 7 17,213 2,459 65 1,178 ............. ...........MA .... ........... ............. .................... ........... ........... ............. .................... ............... 2 6 ............. ...........MI ..... 73 321 26,989 84 48 52 72,519 1,392 2,736 76,863 2,037 (1)MN .... 371 654 359,835 550 141 1,185 129,507 109 6,259 173,301 1,000 (1)MS .... ........... ............. .................... ........... 32 821 22,200 27 1,388 76,425 ............. ...........MO .... 25 76 17,619 232 12 374 16,017 43 5,164 176,335 2,416 (1)MT .... 68 319 34,939 110 4 15 11,331 755 311 35,454 200 (1)NE .... 136 397 69,922 176 17 270 11,844 44 560 19,270 2,105 (1)NV .... ........... ............. .................... ........... ........... ............. .................... ............... 1 54 ............. ...........NH .... ........... ............. .................... ........... ........... ............. .................... ............... ............... .................... ............. ...........NJ ..... 1 1 50 45 ........... ............. .................... ............... 5 127 ............. ...........NM .... ........... ............. .................... ........... ........... ............. .................... ............... 59 5,283 1,156 (1)NY .... 4 33 1,880 58 1 34 1,685 50 774 20,565 700 (1)NC .... 7 5 4,186 790 ........... ............. .................... ............... 362 5,044 ............. ...........ND .... 86 479 111,237 232 36 1,234 44,807 36 1,675 92,139 446 (1)OH .... 95 5,237 123,534 24 67 269 169,308 630 1,049 25,073 244 (1)OK .... 62 1,222 33,551 27 ........... ............. .................... ............... 352 20,461 ............. ...........OR .... 15 128 21,710 170 3 307 8,267 27 178 14,345 6,224 (1)PA ..... 19 23 18,347 808 6 12 21,400 1,845 1,508 46,243 ............. ...........PR .... ........... ............. .................... ........... ........... ............. .................... ............... 6 334 ............. ...........RI ...... ........... ............. .................... ........... ........... ............. .................... ............... ............... .................... ............. ...........SC .... 4 8 6,511 775 ........... ............. .................... ............... 209 4,604 ............. ...........SD .... 13 28 13,504 477 15 32 11,812 366 1,696 97,449 3,260 (1)TN ..... 62 162 20,978 129 8 319 35,180 110 1,963 48,361 9,266 (1)TX ..... 105 1,281 95,399 74 12 33 17,663 540 395 35,941 12,713 (1)UT ..... 1 310 1,875 6 ........... ............. .................... ............... 5 1,260 ............. ...........VT ..... ........... ............. .................... ........... ........... ............. .................... ............... 3 65 ............. ...........VA ..... 10 8 3,932 517 2 3 3,200 1,103 394 7,853 ............. ...........WA .... 13 123 66,528 539 4 35 19,999 568 350 17,746 ............. ...........WV .... ........... ............. .................... ........... ........... ............. .................... ............... 18 285 ............. ...........WI ..... 72 195 51,991 266 135 470 60,722 129 13,575 348,689 673 (1)WY .... 2 10 1,191 119 2 13 2,654 204 27 3,597 ............. ...........
US 2,211 15,720 2,320,595 148 820 14,026 1,429,591 102 59,485 2,010,868 69,585 (1)
1 Value less than 0.5.Note: Total acres treated may not add due to rounding.FSA, Conservation and Environmental Protection Division, (202) 720–4053.
XII–7AGRICULTURAL STATISTICS 1998
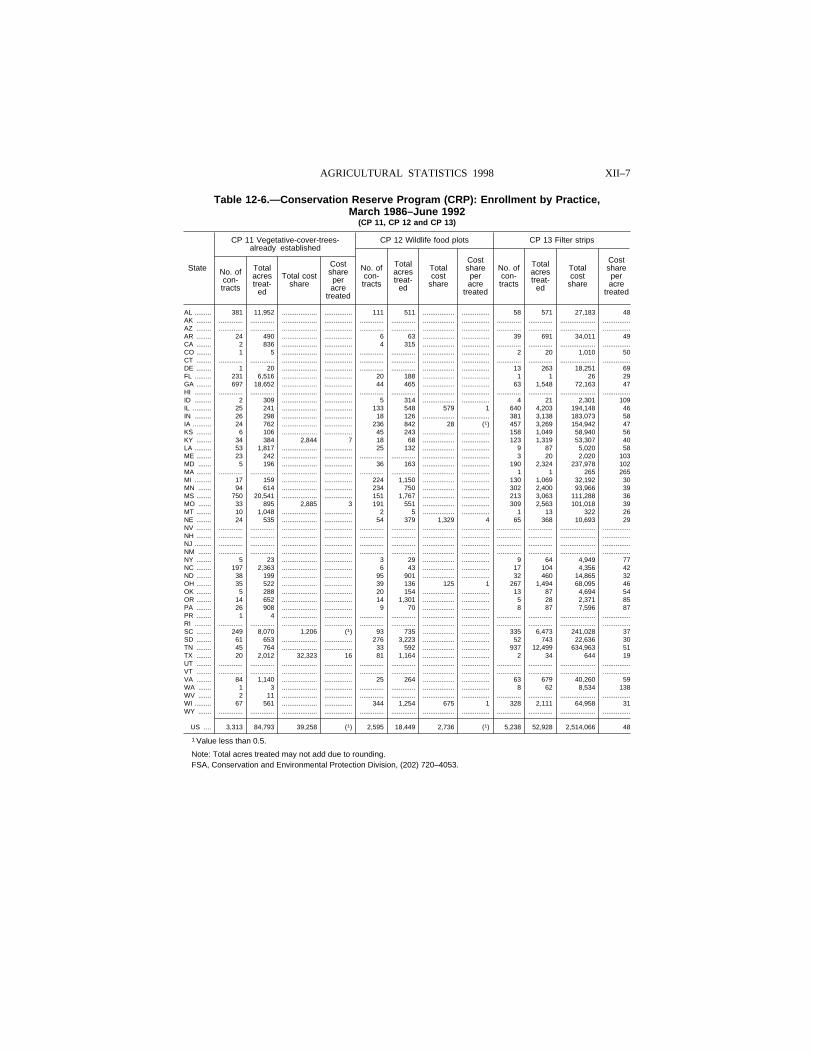
Table 12-6.—Conservation Reserve Program (CRP): Enrollment by Practice,March 1986–June 1992
(CP 11, CP 12 and CP 13)
State
CP 11 Vegetative-cover-trees-already established
CP 12 Wildlife food plots CP 13 Filter strips
No. ofcon-tracts
Totalacrestreat-
ed
Total costshare
Costshareperacre
treated
No. ofcon-tracts
Totalacrestreat-
ed
Totalcost
share
Costshareperacre
treated
No. ofcon-tracts
Totalacrestreat-
ed
Totalcost
share
Costshareperacre
treated
AL ......... 381 11,952 ................... ............... 111 511 ................. ............... 58 571 27,183 48AK ........ ............. ............. ................... ............... ............. ............. ................. ............... ............. ............. ................... ...............AZ ........ ............. ............. ................... ............... ............. ............. ................. ............... ............. ............. ................... ...............AR ........ 24 490 ................... ............... 6 63 ................. ............... 39 691 34,011 49CA ........ 2 836 ................... ............... 4 315 ................. ............... ............. ............. ................... ...............CO ........ 1 5 ................... ............... ............. ............. ................. ............... 2 20 1,010 50CT ........ ............. ............. ................... ............... ............. ............. ................. ............... ............. ............. ................... ...............DE ........ 1 20 ................... ............... ............. ............. ................. ............... 13 263 18,251 69FL ......... 231 6,516 ................... ............... 20 188 ................. ............... 1 1 26 29GA ........ 697 18,652 ................... ............... 44 465 ................. ............... 63 1,548 72,163 47HI ......... ............. ............. ................... ............... ............. ............. ................. ............... ............. ............. ................... ...............ID ......... 2 309 ................... ............... 5 314 ................. ............... 4 21 2,301 109IL .......... 25 241 ................... ............... 133 548 579 1 640 4,203 194,148 46IN ......... 26 298 ................... ............... 18 126 ................. ............... 381 3,138 183,073 58IA .......... 24 762 ................... ............... 236 842 28 (1) 457 3,269 154,942 47KS ........ 6 106 ................... ............... 45 243 ................. ............... 158 1,049 58,940 56KY ........ 34 384 2,844 7 18 68 ................. ............... 123 1,319 53,307 40LA ......... 53 1,817 ................... ............... 25 132 ................. ............... 9 87 5,020 58ME ........ 23 242 ................... ............... ............. ............. ................. ............... 3 20 2,020 103MD ....... 5 196 ................... ............... 36 163 ................. ............... 190 2,324 237,978 102MA ........ ............. ............. ................... ............... ............. ............. ................. ............... 1 1 265 265MI ......... 17 159 ................... ............... 224 1,150 ................. ............... 130 1,069 32,192 30MN ....... 94 614 ................... ............... 234 750 ................. ............... 302 2,400 93,966 39MS ........ 750 20,541 ................... ............... 151 1,767 ................. ............... 213 3,063 111,288 36MO ....... 33 895 2,885 3 191 551 ................. ............... 309 2,563 101,018 39MT ........ 10 1,048 ................... ............... 2 5 ................. ............... 1 13 322 26NE ........ 24 535 ................... ............... 54 379 1,329 4 65 368 10,693 29NV ........ ............. ............. ................... ............... ............. ............. ................. ............... ............. ............. ................... ...............NH ........ ............. ............. ................... ............... ............. ............. ................. ............... ............. ............. ................... ...............NJ ......... ............. ............. ................... ............... ............. ............. ................. ............... ............. ............. ................... ...............NM ....... ............. ............. ................... ............... ............. ............. ................. ............... ............. ............. ................... ...............NY ........ 5 23 ................... ............... 3 29 ................. ............... 9 64 4,949 77NC ........ 197 2,363 ................... ............... 6 43 ................. ............... 17 104 4,356 42ND ........ 38 199 ................... ............... 95 901 ................. ............... 32 460 14,865 32OH ........ 35 522 ................... ............... 39 136 125 1 267 1,494 68,095 46OK ........ 5 288 ................... ............... 20 154 ................. ............... 13 87 4,694 54OR ........ 14 652 ................... ............... 14 1,301 ................. ............... 5 28 2,371 85PA ........ 26 908 ................... ............... 9 70 ................. ............... 8 87 7,596 87PR ........ 1 4 ................... ............... ............. ............. ................. ............... ............. ............. ................... ...............RI ......... ............. ............. ................... ............... ............. ............. ................. ............... ............. ............. ................... ...............SC ........ 249 8,070 1,206 (1) 93 735 ................. ............... 335 6,473 241,028 37SD ........ 61 653 ................... ............... 276 3,223 ................. ............... 52 743 22,636 30TN ........ 45 764 ................... ............... 33 592 ................. ............... 937 12,499 634,963 51TX ........ 20 2,012 32,323 16 81 1,164 ................. ............... 2 34 644 19UT ........ ............. ............. ................... ............... ............. ............. ................. ............... ............. ............. ................... ...............VT ........ ............. ............. ................... ............... ............. ............. ................. ............... ............. ............. ................... ...............VA ........ 84 1,140 ................... ............... 25 264 ................. ............... 63 679 40,260 59WA ....... 1 3 ................... ............... ............. ............. ................. ............... 8 62 8,534 138WV ....... 2 11 ................... ............... ............. ............. ................. ............... ............. ............. ................... ...............WI ......... 67 561 ................... ............... 344 1,254 675 1 328 2,111 64,958 31WY ....... ............. ............. ................... ............... ............. ............. ................. ............... ............. ............. ................... ...............
US .... 3,313 84,793 39,258 (1) 2,595 18,449 2,736 (1) 5,238 52,928 2,514,066 48
1 Value less than 0.5.
Note: Total acres treated may not add due to rounding.FSA, Conservation and Environmental Protection Division, (202) 720–4053.
XII–8 AGRICULTURAL CONSERVATION AND FORESTRY STATISTICS
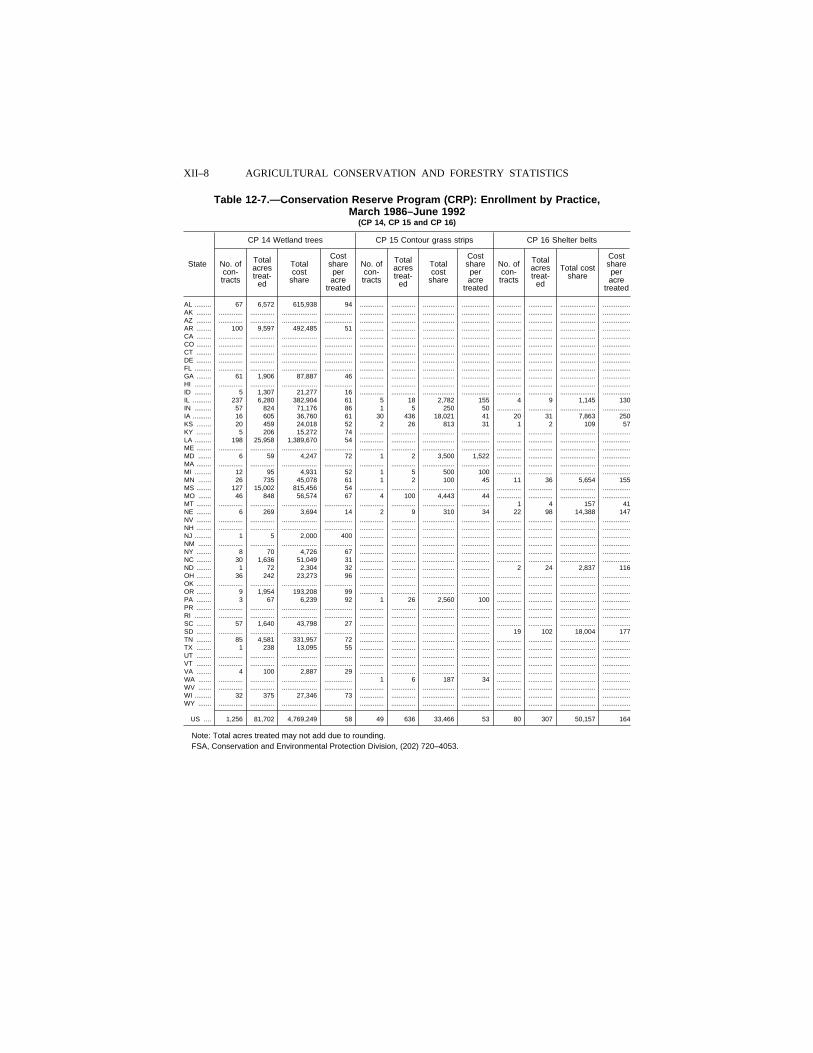
Table 12-7.—Conservation Reserve Program (CRP): Enrollment by Practice,March 1986–June 1992
(CP 14, CP 15 and CP 16)
State
CP 14 Wetland trees CP 15 Contour grass strips CP 16 Shelter belts
No. ofcon-tracts
Totalacrestreat-
ed
Totalcost
share
Costshareperacre
treated
No. ofcon-tracts
Totalacrestreat-
ed
Totalcost
share
Costshareperacre
treated
No. ofcon-tracts
Totalacrestreat-
ed
Total costshare
Costshareperacre
treated
AL ......... 67 6,572 615,938 94 ............. ............. ................. ............... ............. ............. ................... ...............AK ........ ............. ............. ................... ............... ............. ............. ................. ............... ............. ............. ................... ...............AZ ........ ............. ............. ................... ............... ............. ............. ................. ............... ............. ............. ................... ...............AR ........ 100 9,597 492,485 51 ............. ............. ................. ............... ............. ............. ................... ...............CA ........ ............. ............. ................... ............... ............. ............. ................. ............... ............. ............. ................... ...............CO ........ ............. ............. ................... ............... ............. ............. ................. ............... ............. ............. ................... ...............CT ........ ............. ............. ................... ............... ............. ............. ................. ............... ............. ............. ................... ...............DE ........ ............. ............. ................... ............... ............. ............. ................. ............... ............. ............. ................... ...............FL ......... ............. ............. ................... ............... ............. ............. ................. ............... ............. ............. ................... ...............GA ........ 61 1,906 87,887 46 ............. ............. ................. ............... ............. ............. ................... ...............HI ......... ............. ............. ................... ............... ............. ............. ................. ............... ............. ............. ................... ...............ID ......... 5 1,307 21,277 16 ............. ............. ................. ............... ............. ............. ................... ...............IL .......... 237 6,280 382,904 61 5 18 2,782 155 4 9 1,145 130IN ......... 57 824 71,176 86 1 5 250 50 ............. ............. ................... ...............IA .......... 16 605 36,760 61 30 436 18,021 41 20 31 7,863 250KS ........ 20 459 24,018 52 2 26 813 31 1 2 109 57KY ........ 5 206 15,272 74 ............. ............. ................. ............... ............. ............. ................... ...............LA ......... 198 25,958 1,389,670 54 ............. ............. ................. ............... ............. ............. ................... ...............ME ........ ............. ............. ................... ............... ............. ............. ................. ............... ............. ............. ................... ...............MD ....... 6 59 4,247 72 1 2 3,500 1,522 ............. ............. ................... ...............MA ........ ............. ............. ................... ............... ............. ............. ................. ............... ............. ............. ................... ...............MI ......... 12 95 4,931 52 1 5 500 100 ............. ............. ................... ...............MN ....... 26 735 45,078 61 1 2 100 45 11 36 5,654 155MS ........ 127 15,002 815,456 54 ............. ............. ................. ............... ............. ............. ................... ...............MO ....... 46 848 56,574 67 4 100 4,443 44 ............. ............. ................... ...............MT ........ ............. ............. ................... ............... ............. ............. ................. ............... 1 4 157 41NE ........ 6 269 3,694 14 2 9 310 34 22 98 14,388 147NV ........ ............. ............. ................... ............... ............. ............. ................. ............... ............. ............. ................... ...............NH ........ ............. ............. ................... ............... ............. ............. ................. ............... ............. ............. ................... ...............NJ ......... 1 5 2,000 400 ............. ............. ................. ............... ............. ............. ................... ...............NM ....... ............. ............. ................... ............... ............. ............. ................. ............... ............. ............. ................... ...............NY ........ 8 70 4,726 67 ............. ............. ................. ............... ............. ............. ................... ...............NC ........ 30 1,636 51,049 31 ............. ............. ................. ............... ............. ............. ................... ...............ND ........ 1 72 2,304 32 ............. ............. ................. ............... 2 24 2,837 116OH ........ 36 242 23,273 96 ............. ............. ................. ............... ............. ............. ................... ...............OK ........ ............. ............. ................... ............... ............. ............. ................. ............... ............. ............. ................... ...............OR ........ 9 1,954 193,208 99 ............. ............. ................. ............... ............. ............. ................... ...............PA ........ 3 67 6,239 92 1 26 2,560 100 ............. ............. ................... ...............PR ........ ............. ............. ................... ............... ............. ............. ................. ............... ............. ............. ................... ...............RI ......... ............. ............. ................... ............... ............. ............. ................. ............... ............. ............. ................... ...............SC ........ 57 1,640 43,798 27 ............. ............. ................. ............... ............. ............. ................... ...............SD ........ ............. ............. ................... ............... ............. ............. ................. ............... 19 102 18,004 177TN ........ 85 4,581 331,957 72 ............. ............. ................. ............... ............. ............. ................... ...............TX ........ 1 238 13,095 55 ............. ............. ................. ............... ............. ............. ................... ...............UT ........ ............. ............. ................... ............... ............. ............. ................. ............... ............. ............. ................... ...............VT ........ ............. ............. ................... ............... ............. ............. ................. ............... ............. ............. ................... ...............VA ........ 4 100 2,887 29 ............. ............. ................. ............... ............. ............. ................... ...............WA ....... ............. ............. ................... ............... 1 6 187 34 ............. ............. ................... ...............WV ....... ............. ............. ................... ............... ............. ............. ................. ............... ............. ............. ................... ...............WI ......... 32 375 27,346 73 ............. ............. ................. ............... ............. ............. ................... ...............WY ....... ............. ............. ................... ............... ............. ............. ................. ............... ............. ............. ................... ...............
US .... 1,256 81,702 4,769,249 58 49 636 33,466 53 80 307 50,157 164
Note: Total acres treated may not add due to rounding.FSA, Conservation and Environmental Protection Division, (202) 720–4053.
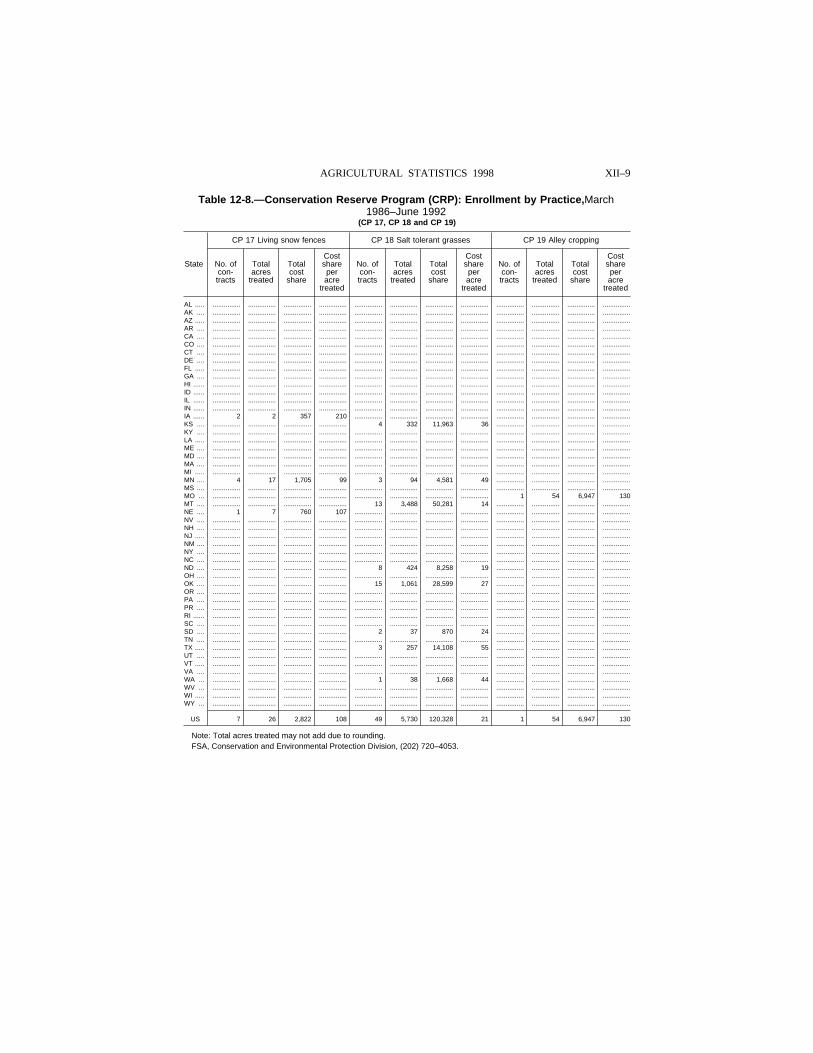
XII–9AGRICULTURAL STATISTICS 1998
Table 12-8.—Conservation Reserve Program (CRP): Enrollment by Practice,March1986–June 1992
(CP 17, CP 18 and CP 19)
State
CP 17 Living snow fences CP 18 Salt tolerant grasses CP 19 Alley cropping
No. ofcon-tracts
Totalacres
treated
Totalcost
share
Costshareperacre
treated
No. ofcon-tracts
Totalacres
treated
Totalcost
share
Costshareperacre
treated
No. ofcon-tracts
Totalacres
treated
Totalcost
share
Costshareperacre
treated
AL ..... ............... ............... ............... ............... ............... ............... ............... ............... ............... ............... ............... ...............AK .... ............... ............... ............... ............... ............... ............... ............... ............... ............... ............... ............... ...............AZ ..... ............... ............... ............... ............... ............... ............... ............... ............... ............... ............... ............... ...............AR .... ............... ............... ............... ............... ............... ............... ............... ............... ............... ............... ............... ...............CA .... ............... ............... ............... ............... ............... ............... ............... ............... ............... ............... ............... ...............CO .... ............... ............... ............... ............... ............... ............... ............... ............... ............... ............... ............... ...............CT .... ............... ............... ............... ............... ............... ............... ............... ............... ............... ............... ............... ...............DE .... ............... ............... ............... ............... ............... ............... ............... ............... ............... ............... ............... ...............FL ..... ............... ............... ............... ............... ............... ............... ............... ............... ............... ............... ............... ...............GA .... ............... ............... ............... ............... ............... ............... ............... ............... ............... ............... ............... ...............HI ...... ............... ............... ............... ............... ............... ............... ............... ............... ............... ............... ............... ...............ID ...... ............... ............... ............... ............... ............... ............... ............... ............... ............... ............... ............... ...............IL ...... ............... ............... ............... ............... ............... ............... ............... ............... ............... ............... ............... ...............IN ...... ............... ............... ............... ............... ............... ............... ............... ............... ............... ............... ............... ...............IA ...... 2 2 357 210 ............... ............... ............... ............... ............... ............... ............... ...............KS .... ............... ............... ............... ............... 4 332 11,963 36 ............... ............... ............... ...............KY .... ............... ............... ............... ............... ............... ............... ............... ............... ............... ............... ............... ...............LA ..... ............... ............... ............... ............... ............... ............... ............... ............... ............... ............... ............... ...............ME .... ............... ............... ............... ............... ............... ............... ............... ............... ............... ............... ............... ...............MD .... ............... ............... ............... ............... ............... ............... ............... ............... ............... ............... ............... ...............MA .... ............... ............... ............... ............... ............... ............... ............... ............... ............... ............... ............... ...............MI ..... ............... ............... ............... ............... ............... ............... ............... ............... ............... ............... ............... ...............MN .... 4 17 1,705 99 3 94 4,581 49 ............... ............... ............... ...............MS .... ............... ............... ............... ............... ............... ............... ............... ............... ............... ............... ............... ...............MO ... ............... ............... ............... ............... ............... ............... ............... ............... 1 54 6,947 130MT .... ............... ............... ............... ............... 13 3,488 50,281 14 ............... ............... ............... ...............NE .... 1 7 760 107 ............... ............... ............... ............... ............... ............... ............... ...............NV .... ............... ............... ............... ............... ............... ............... ............... ............... ............... ............... ............... ...............NH .... ............... ............... ............... ............... ............... ............... ............... ............... ............... ............... ............... ...............NJ ..... ............... ............... ............... ............... ............... ............... ............... ............... ............... ............... ............... ...............NM .... ............... ............... ............... ............... ............... ............... ............... ............... ............... ............... ............... ...............NY .... ............... ............... ............... ............... ............... ............... ............... ............... ............... ............... ............... ...............NC .... ............... ............... ............... ............... ............... ............... ............... ............... ............... ............... ............... ...............ND .... ............... ............... ............... ............... 8 424 8,258 19 ............... ............... ............... ...............OH .... ............... ............... ............... ............... ............... ............... ............... ............... ............... ............... ............... ...............OK .... ............... ............... ............... ............... 15 1,061 28,599 27 ............... ............... ............... ...............OR .... ............... ............... ............... ............... ............... ............... ............... ............... ............... ............... ............... ...............PA .... ............... ............... ............... ............... ............... ............... ............... ............... ............... ............... ............... ...............PR .... ............... ............... ............... ............... ............... ............... ............... ............... ............... ............... ............... ...............RI ...... ............... ............... ............... ............... ............... ............... ............... ............... ............... ............... ............... ...............SC .... ............... ............... ............... ............... ............... ............... ............... ............... ............... ............... ............... ...............SD .... ............... ............... ............... ............... 2 37 870 24 ............... ............... ............... ...............TN .... ............... ............... ............... ............... ............... ............... ............... ............... ............... ............... ............... ...............TX ..... ............... ............... ............... ............... 3 257 14,108 55 ............... ............... ............... ...............UT .... ............... ............... ............... ............... ............... ............... ............... ............... ............... ............... ............... ...............VT ..... ............... ............... ............... ............... ............... ............... ............... ............... ............... ............... ............... ...............VA .... ............... ............... ............... ............... ............... ............... ............... ............... ............... ............... ............... ...............WA ... ............... ............... ............... ............... 1 38 1,668 44 ............... ............... ............... ...............WV ... ............... ............... ............... ............... ............... ............... ............... ............... ............... ............... ............... ...............WI ..... ............... ............... ............... ............... ............... ............... ............... ............... ............... ............... ............... ...............WY ... ............... ............... ............... ............... ............... ............... ............... ............... ............... ............... ............... ...............
US 7 26 2,822 108 49 5,730 120,328 21 1 54 6,947 130
Note: Total acres treated may not add due to rounding.FSA, Conservation and Environmental Protection Division, (202) 720–4053.
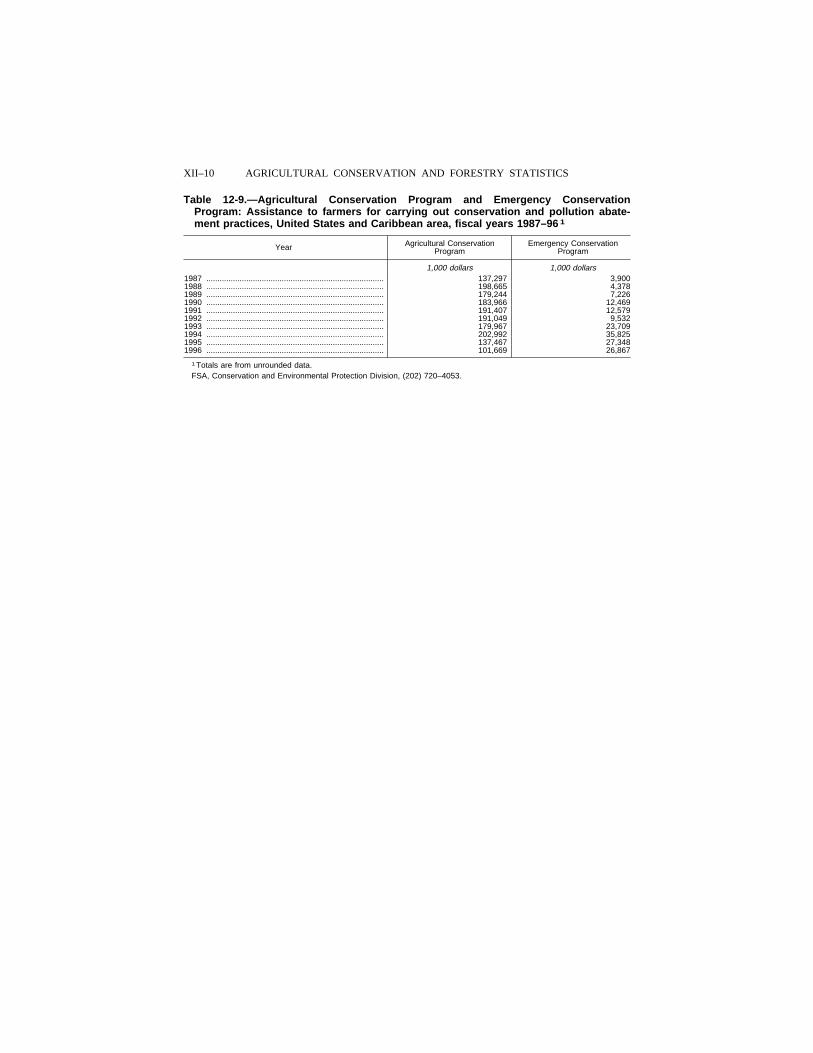
XII–10 AGRICULTURAL CONSERVATION AND FORESTRY STATISTICS
Table 12-9.—Agricultural Conservation Program and Emergency ConservationProgram: Assistance to farmers for carrying out conservation and pollution abate-ment practices, United States and Caribbean area, fiscal years 1987–96 1
Year Agricultural ConservationProgram
Emergency ConservationProgram
1,000 dollars 1,000 dollars1987 ................................................................................ 137,297 3,9001988 ................................................................................ 198,665 4,3781989 ................................................................................ 179,244 7,2261990 ................................................................................ 183,966 12,4691991 ................................................................................ 191,407 12,5791992 ................................................................................ 191,049 9,5321993 ................................................................................ 179,967 23,7091994 ................................................................................ 202,992 35,8251995 ................................................................................ 137,467 27,3481996 ................................................................................ 101,669 26,867
1 Totals are from unrounded data.FSA, Conservation and Environmental Protection Division, (202) 720–4053.
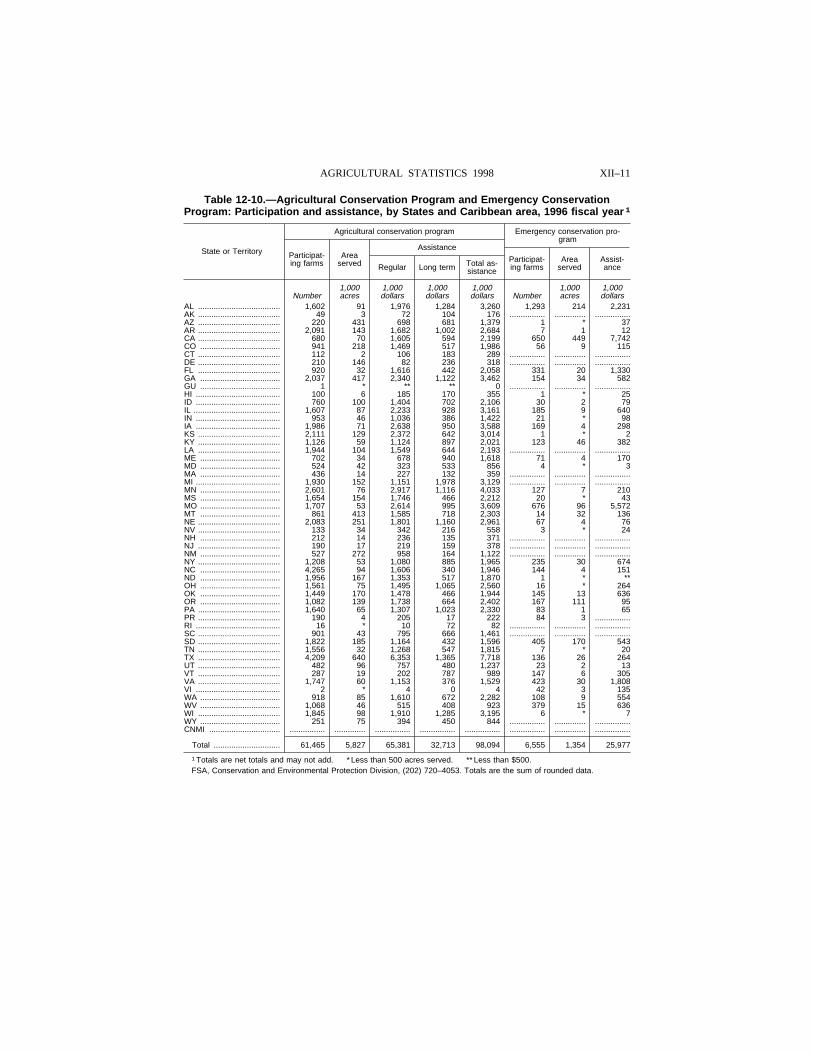
XII–11AGRICULTURAL STATISTICS 1998
Table 12-10.—Agricultural Conservation Program and Emergency ConservationProgram: Participation and assistance, by States and Caribbean area, 1996 fiscal year 1
State or Territory
Agricultural conservation program Emergency conservation pro-gram
Participat-ing farms
Areaserved
Assistance
Participat-ing farms
Areaserved
Assist-anceRegular Long term Total as-
sistance
1,000 1,000 1,000 1,000 1,000 1,000Number acres dollars dollars dollars Number acres dollars
AL ..................................... 1,602 91 1,976 1,284 3,260 1,293 214 2,231AK ..................................... 49 3 72 104 176 ................ .............. ................AZ ..................................... 220 431 698 681 1,379 1 * 37AR ..................................... 2,091 143 1,682 1,002 2,684 7 1 12CA ..................................... 680 70 1,605 594 2,199 650 449 7,742CO .................................... 941 218 1,469 517 1,986 56 9 115CT ..................................... 112 2 106 183 289 ................ .............. ................DE ..................................... 210 146 82 236 318 ................ .............. ................FL ..................................... 920 32 1,616 442 2,058 331 20 1,330GA .................................... 2,037 417 2,340 1,122 3,462 154 34 582GU .................................... 1 * ** ** 0 ................ .............. ................HI ...................................... 100 6 185 170 355 1 * 25ID ...................................... 760 100 1,404 702 2,106 30 2 79IL ....................................... 1,607 87 2,233 928 3,161 185 9 640IN ...................................... 953 46 1,036 386 1,422 21 * 98IA ...................................... 1,986 71 2,638 950 3,588 169 4 298KS ..................................... 2,111 129 2,372 642 3,014 1 * 2KY ..................................... 1,126 59 1,124 897 2,021 123 46 382LA ..................................... 1,944 104 1,549 644 2,193 ................ .............. ................ME .................................... 702 34 678 940 1,618 71 4 170MD .................................... 524 42 323 533 856 4 * 3MA .................................... 436 14 227 132 359 ................ .............. ................MI ...................................... 1,930 152 1,151 1,978 3,129 ................ .............. ................MN .................................... 2,601 76 2,917 1,116 4,033 127 7 210MS .................................... 1,654 154 1,746 466 2,212 20 * 43MO .................................... 1,707 53 2,614 995 3,609 676 96 5,572MT .................................... 861 413 1,585 718 2,303 14 32 136NE ..................................... 2,083 251 1,801 1,160 2,961 67 4 76NV ..................................... 133 34 342 216 558 3 * 24NH .................................... 212 14 236 135 371 ................ .............. ................NJ ..................................... 190 17 219 159 378 ................ .............. ................NM .................................... 527 272 958 164 1,122 ................ .............. ................NY ..................................... 1,208 53 1,080 885 1,965 235 30 674NC .................................... 4,265 94 1,606 340 1,946 144 4 151ND .................................... 1,956 167 1,353 517 1,870 1 * **OH .................................... 1,561 75 1,495 1,065 2,560 16 * 264OK .................................... 1,449 170 1,478 466 1,944 145 13 636OR .................................... 1,082 139 1,738 664 2,402 167 111 95PA ..................................... 1,640 65 1,307 1,023 2,330 83 1 65PR ..................................... 190 4 205 17 222 84 3 ................RI ...................................... 16 * 10 72 82 ................ .............. ................SC ..................................... 901 43 795 666 1,461 ................ .............. ................SD ..................................... 1,822 185 1,164 432 1,596 405 170 543TN ..................................... 1,556 32 1,268 547 1,815 7 * 20TX ..................................... 4,209 640 6,353 1,365 7,718 136 26 264UT ..................................... 482 96 757 480 1,237 23 2 13VT ..................................... 287 19 202 787 989 147 6 305VA ..................................... 1,747 60 1,153 376 1,529 423 30 1,808VI ...................................... 2 * 4 0 4 42 3 135WA .................................... 918 85 1,610 672 2,282 108 9 554WV .................................... 1,068 46 515 408 923 379 15 636WI ..................................... 1,845 98 1,910 1,285 3,195 6 * 7WY .................................... 251 75 394 450 844 ................ .............. ................CNMI ................................ ................ .............. ................ ................ ................ ................ .............. ................
Total .............................. 61,465 5,827 65,381 32,713 98,094 6,555 1,354 25,977
1 Totals are net totals and may not add. * Less than 500 acres served. ** Less than $500.FSA, Conservation and Environmental Protection Division, (202) 720–4053. Totals are the sum of rounded data.
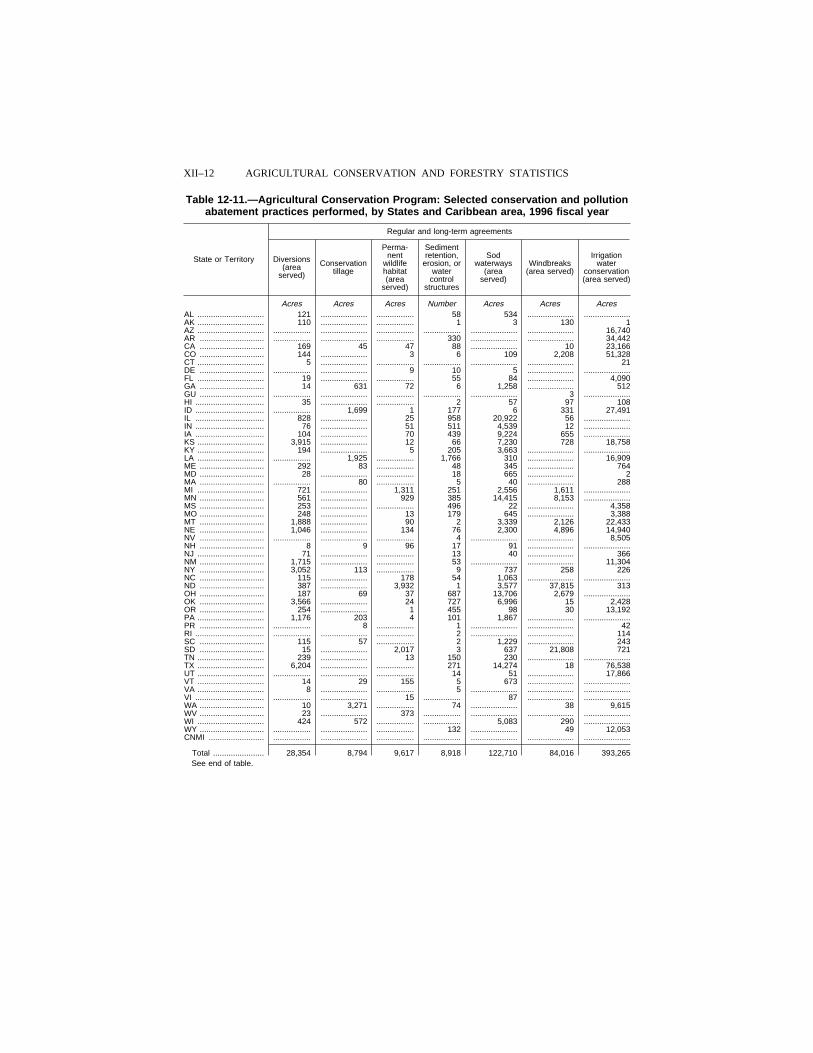
XII–12 AGRICULTURAL CONSERVATION AND FORESTRY STATISTICS
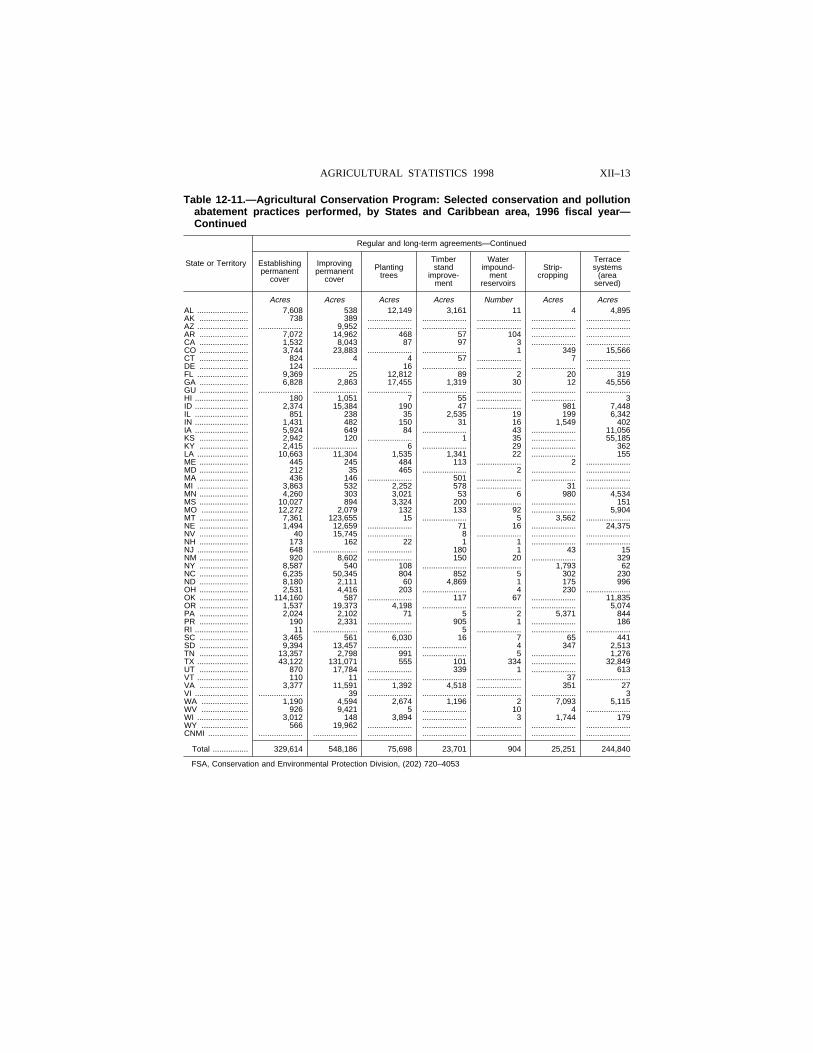
Table 12-11.—Agricultural Conservation Program: Selected conservation and pollutionabatement practices performed, by States and Caribbean area, 1996 fiscal year
State or Territory
Regular and long-term agreements
Diversions(area
served)
Conservationtillage
Perma-nent
wildlifehabitat(area
served)
Sedimentretention,
erosion, orwatercontrol
structures
Sodwaterways
(areaserved)
Windbreaks(area served)
Irrigationwater
conservation(area served)
Acres Acres Acres Number Acres Acres AcresAL .............................. 121 ..................... ................. 58 534 ..................... .....................AK .............................. 110 ..................... ................. 1 3 130 1AZ .............................. ................. ..................... ................. ................. ..................... ..................... 16,740AR ............................. ................. ..................... ................. 330 ..................... ..................... 34,442CA ............................. 169 45 47 88 ..................... 10 23,166CO ............................. 144 ..................... 3 6 109 2,208 51,328CT .............................. 5 ..................... ................. ................. ..................... ..................... 21DE ............................. ................. ..................... 9 10 5 ..................... .....................FL .............................. 19 ..................... ................. 55 84 ..................... 4,090GA ............................. 14 631 72 6 1,258 ..................... 512GU ............................. ................. ..................... ................. ................. ..................... 3 .....................HI ............................... 35 ..................... ................. 2 57 97 108ID ............................... ................. 1,699 1 177 6 331 27,491IL ............................... 828 ..................... 25 958 20,922 56 .....................IN ............................... 76 ..................... 51 511 4,539 12 .....................IA ............................... 104 ..................... 70 439 9,224 655 .....................KS .............................. 3,915 ..................... 12 66 7,230 728 18,758KY .............................. 194 ..................... 5 205 3,663 ..................... .....................LA .............................. ................. 1,925 ................. 1,766 310 ..................... 16,909ME ............................. 292 83 ................. 48 345 ..................... 764MD ............................. 28 ..................... ................. 18 665 ..................... 2MA ............................. ................. 80 ................. 5 40 ..................... 288MI .............................. 721 ..................... 1,311 251 2,556 1,611 .....................MN ............................. 561 ..................... 929 385 14,415 8,153 .....................MS ............................. 253 ..................... ................. 496 22 ..................... 4,358MO ............................. 248 ..................... 13 179 645 ..................... 3,388MT ............................. 1,888 ..................... 90 2 3,339 2,126 22,433NE ............................. 1,046 ..................... 134 76 2,300 4,896 14,940NV ............................. ................. ..................... ................. 4 ..................... ..................... 8,505NH ............................. 8 9 96 17 91 ..................... .....................NJ .............................. 71 ..................... ................. 13 40 ..................... 366NM ............................. 1,715 ..................... ................. 53 ..................... ..................... 11,304NY ............................. 3,052 113 ................. 9 737 258 226NC ............................. 115 ..................... 178 54 1,063 ..................... .....................ND ............................. 387 ..................... 3,932 1 3,577 37,815 313OH ............................. 187 69 37 687 13,706 2,679 .....................OK ............................. 3,566 ..................... 24 727 6,996 15 2,428OR ............................. 254 ..................... 1 455 98 30 13,192PA .............................. 1,176 203 4 101 1,867 ..................... .....................PR ............................. ................. 8 ................. 1 ..................... ..................... 42RI ............................... ................. ..................... ................. 2 ..................... ..................... 114SC ............................. 115 57 ................. 2 1,229 ..................... 243SD ............................. 15 ..................... 2,017 3 637 21,808 721TN .............................. 239 ..................... 13 150 230 ..................... .....................TX .............................. 6,204 ..................... ................. 271 14,274 18 76,538UT .............................. ................. ..................... ................. 14 51 ..................... 17,866VT .............................. 14 29 155 5 673 ..................... .....................VA .............................. 8 ..................... ................. 5 ..................... ..................... .....................VI ............................... ................. ..................... 15 ................. 87 ..................... .....................WA ............................. 10 3,271 ................. 74 ..................... 38 9,615WV ............................. 23 ..................... 373 ................. ..................... ..................... .....................WI .............................. 424 572 ................. ................. 5,083 290 .....................WY ............................. ................. ..................... ................. 132 ..................... 49 12,053CNMI ......................... ................. ..................... ................. ................. ..................... ..................... .....................
Total ....................... 28,354 8,794 9,617 8,918 122,710 84,016 393,265See end of table.
XII–13AGRICULTURAL STATISTICS 1998
Table 12-11.—Agricultural Conservation Program: Selected conservation and pollutionabatement practices performed, by States and Caribbean area, 1996 fiscal year—Continued
State or Territory
Regular and long-term agreements—Continued
Establishingpermanent
cover
Improvingpermanent
cover
Plantingtrees
Timberstand
improve-ment
Waterimpound-
mentreservoirs
Strip-cropping
Terracesystems
(areaserved)
Acres Acres Acres Acres Number Acres AcresAL ....................... 7,608 538 12,149 3,161 11 4 4,895AK ...................... 738 389 .................... .................... .................... .................... ....................AZ ....................... .................... 9,952 .................... .................... .................... .................... ....................AR ...................... 7,072 14,962 468 57 104 .................... ....................CA ...................... 1,532 8,043 87 97 3 .................... ....................CO ...................... 3,744 23,883 .................... .................... 1 349 15,566CT ...................... 824 4 4 57 .................... 7 ....................DE ...................... 124 .................... 16 .................... .................... .................... ....................FL ....................... 9,369 25 12,812 89 2 20 319GA ...................... 6,828 2,863 17,455 1,319 30 12 45,556GU ...................... .................... .................... .................... .................... .................... .................... ....................HI ........................ 180 1,051 7 55 .................... .................... 3ID ........................ 2,374 15,384 190 47 .................... 981 7,448IL ........................ 851 238 35 2,535 19 199 6,342IN ........................ 1,431 482 150 31 16 1,549 402IA ........................ 5,924 649 84 .................... 43 .................... 11,056KS ...................... 2,942 120 .................... 1 35 .................... 55,185KY ...................... 2,415 .................... 6 .................... 29 .................... 362LA ....................... 10,663 11,304 1,535 1,341 22 .................... 155ME ...................... 445 245 484 113 .................... 2 ....................MD ...................... 212 35 465 .................... 2 .................... ....................MA ...................... 436 146 .................... 501 .................... .................... ....................MI ....................... 3,863 532 2,252 578 .................... 31 ....................MN ...................... 4,260 303 3,021 53 6 980 4,534MS ...................... 10,027 894 3,324 200 .................... .................... 151MO ..................... 12,272 2,079 132 133 92 .................... 5,904MT ...................... 7,361 123,655 15 .................... 5 3,562 ....................NE ...................... 1,494 12,659 .................... 71 16 .................... 24,375NV ...................... 40 15,745 .................... 8 .................... .................... ....................NH ...................... 173 162 22 1 1 .................... ....................NJ ....................... 648 .................... .................... 180 1 43 15NM ...................... 920 8,602 .................... 150 20 .................... 329NY ...................... 8,587 540 108 .................... .................... 1,793 62NC ...................... 6,235 50,345 804 852 5 302 230ND ...................... 8,180 2,111 60 4,869 1 175 996OH ...................... 2,531 4,416 203 .................... 4 230 ....................OK ...................... 114,160 587 .................... 117 67 .................... 11,835OR ...................... 1,537 19,373 4,198 .................... .................... .................... 5,074PA ...................... 2,024 2,102 71 5 2 5,371 844PR ...................... 190 2,331 .................... 905 1 .................... 186RI ........................ 11 .................... .................... 5 .................... .................... ....................SC ...................... 3,465 561 6,030 16 7 65 441SD ...................... 9,394 13,457 .................... .................... 4 347 2,513TN ...................... 13,357 2,798 991 .................... 5 .................... 1,276TX ....................... 43,122 131,071 555 101 334 .................... 32,849UT ...................... 870 17,784 .................... 339 1 .................... 613VT ....................... 110 11 .................... .................... .................... 37 ....................VA ...................... 3,377 11,591 1,392 4,518 .................... 351 27VI ........................ .................... 39 .................... .................... .................... .................... 3WA ..................... 1,190 4,594 2,674 1,196 2 7,093 5,115WV ..................... 926 9,421 5 .................... 10 4 ....................WI ....................... 3,012 148 3,894 .................... 3 1,744 179WY ..................... 566 19,962 .................... .................... .................... .................... ....................CNMI .................. .................... .................... .................... .................... .................... .................... ....................
Total ................ 329,614 548,186 75,698 23,701 904 25,251 244,840
FSA, Conservation and Environmental Protection Division, (202) 720–4053
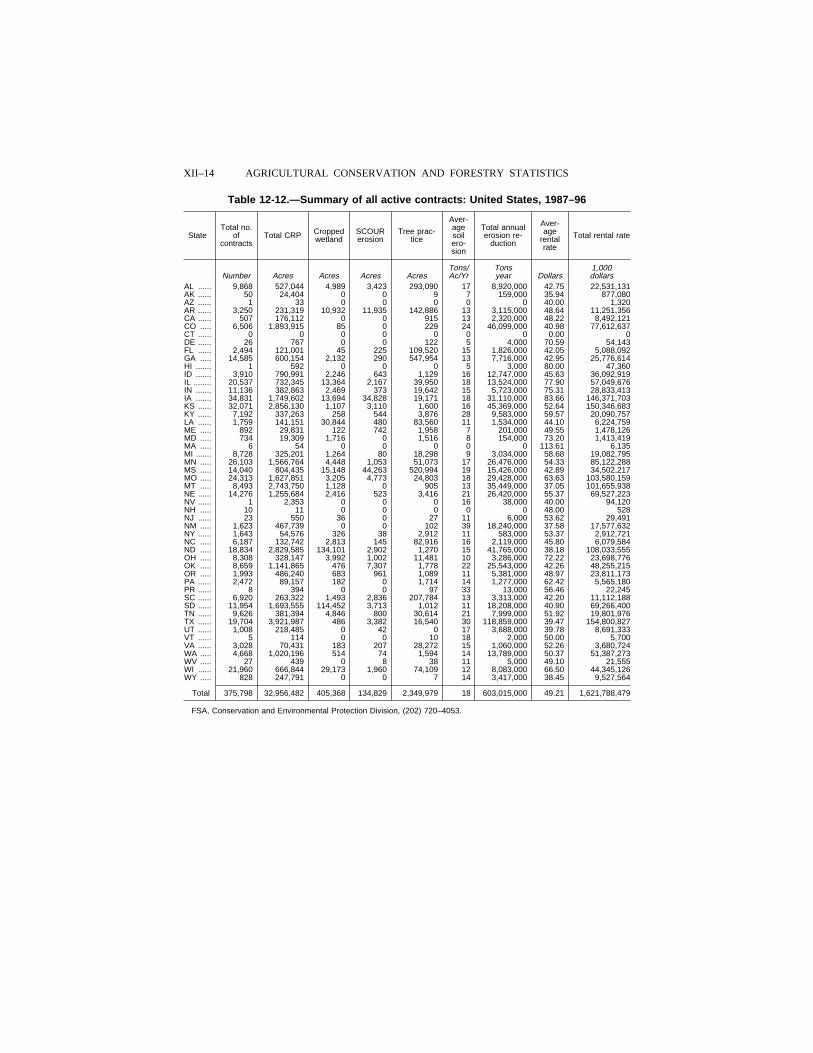
XII–14 AGRICULTURAL CONSERVATION AND FORESTRY STATISTICS
Table 12-12.—Summary of all active contracts: United States, 1987–96
StateTotal no.
ofcontracts
Total CRP Croppedwetland
SCOURerosion
Tree prac-tice
Aver-agesoilero-sion
Total annualerosion re-
duction
Aver-age
rentalrate
Total rental rate
Tons/ Tons 1,000Number Acres Acres Acres Acres Ac/Yr year Dollars dollars
AL ...... 9,868 527,044 4,989 3,423 293,090 17 8,920,000 42.75 22,531,131AK ...... 50 24,404 0 0 9 7 159,000 35.94 877,080AZ ...... 1 33 0 0 0 0 0 40.00 1,320AR ...... 3,250 231,319 10,932 11,935 142,886 13 3,115,000 48.64 11,251,356CA ...... 507 176,112 0 0 915 13 2,320,000 48.22 8,492,121CO ..... 6,506 1,893,915 85 0 229 24 46,099,000 40.98 77,612,637CT ...... 0 0 0 0 0 0 0 0.00 0DE ...... 26 767 0 0 122 5 4,000 70.59 54,143FL ...... 2,494 121,001 45 225 109,520 15 1,826,000 42.05 5,088,092GA ..... 14,585 600,154 2,132 290 547,954 13 7,716,000 42.95 25,776,614HI ....... 1 592 0 0 0 5 3,000 80.00 47,360ID ....... 3,910 790,991 2,246 643 1,129 16 12,747,000 45.63 36,092,919IL ........ 20,537 732,345 13,364 2,167 39,950 18 13,524,000 77.90 57,049,676IN ....... 11,136 382,863 2,469 373 19,642 15 5,723,000 75.31 28,833,413IA ....... 34,831 1,749,602 13,694 34,828 19,171 18 31,110,000 83.66 146,371,703KS ...... 32,071 2,856,130 1,107 3,110 1,600 16 45,369,000 52.64 150,346,683KY ...... 7,192 337,263 258 544 3,876 28 9,583,000 59.57 20,090,757LA ...... 1,759 141,151 30,844 480 83,560 11 1,534,000 44.10 6,224,759ME ..... 892 29,831 122 742 1,958 7 201,000 49.55 1,478,126MD ..... 734 19,309 1,716 0 1,516 8 154,000 73.20 1,413,419MA ..... 6 54 0 0 0 0 0 113.61 6,135MI ....... 8,728 325,201 1,264 80 18,298 9 3,034,000 58.68 19,082,795MN ..... 26,103 1,566,764 4,448 1,053 51,073 17 26,476,000 54.33 85,122,288MS ..... 14,040 804,435 15,148 44,263 520,994 19 15,426,000 42.89 34,502,217MO ..... 24,313 1,627,851 3,205 4,773 24,803 18 29,428,000 63.63 103,580,159MT ..... 8,493 2,743,750 1,128 0 905 13 35,449,000 37.05 101,655,938NE ...... 14,276 1,255,684 2,416 523 3,416 21 26,420,000 55.37 69,527,223NV ...... 1 2,353 0 0 0 16 38,000 40.00 94,120NH ..... 10 11 0 0 0 0 0 48.00 528NJ ...... 23 550 36 0 27 11 6,000 53.62 29,491NM ..... 1,623 467,739 0 0 102 39 18,240,000 37.58 17,577,632NY ...... 1,643 54,576 326 38 2,912 11 583,000 53.37 2,912,721NC ..... 6,187 132,742 2,813 145 82,916 16 2,119,000 45.80 6,079,584ND ..... 18,834 2,829,585 134,101 2,902 1,270 15 41,765,000 38.18 108,033,555OH ..... 8,308 328,147 3,992 1,002 11,481 10 3,286,000 72.22 23,698,776OK ..... 8,659 1,141,865 476 7,307 1,778 22 25,543,000 42.26 48,255,215OR ..... 1,993 486,240 683 961 1,089 11 5,381,000 48.97 23,811,173PA ...... 2,472 89,157 182 0 1,714 14 1,277,000 62.42 5,565,180PR ...... 8 394 0 0 97 33 13,000 56.46 22,245SC ...... 6,920 263,322 1,493 2,836 207,784 13 3,313,000 42.20 11,112,188SD ...... 11,954 1,693,555 114,452 3,713 1,012 11 18,208,000 40.90 69,266,400TN ...... 9,626 381,394 4,846 800 30,614 21 7,999,000 51.92 19,801,976TX ...... 19,704 3,921,987 486 3,382 16,540 30 118,859,000 39.47 154,800,827UT ...... 1,008 218,485 0 42 0 17 3,688,000 39.78 8,691,333VT ...... 5 114 0 0 10 18 2,000 50.00 5,700VA ...... 3,028 70,431 183 207 28,272 15 1,060,000 52.26 3,680,724WA ..... 4,668 1,020,196 514 74 1,594 14 13,789,000 50.37 51,387,273WV ..... 27 439 0 8 38 11 5,000 49.10 21,555WI ...... 21,960 666,844 29,173 1,960 74,109 12 8,083,000 66.50 44,345,126WY ..... 828 247,791 0 0 7 14 3,417,000 38.45 9,527,564
Total 375,798 32,956,482 405,368 134,829 2,349,979 18 603,015,000 49.21 1,621,788,479
FSA, Conservation and Environmental Protection Division, (202) 720–4053.
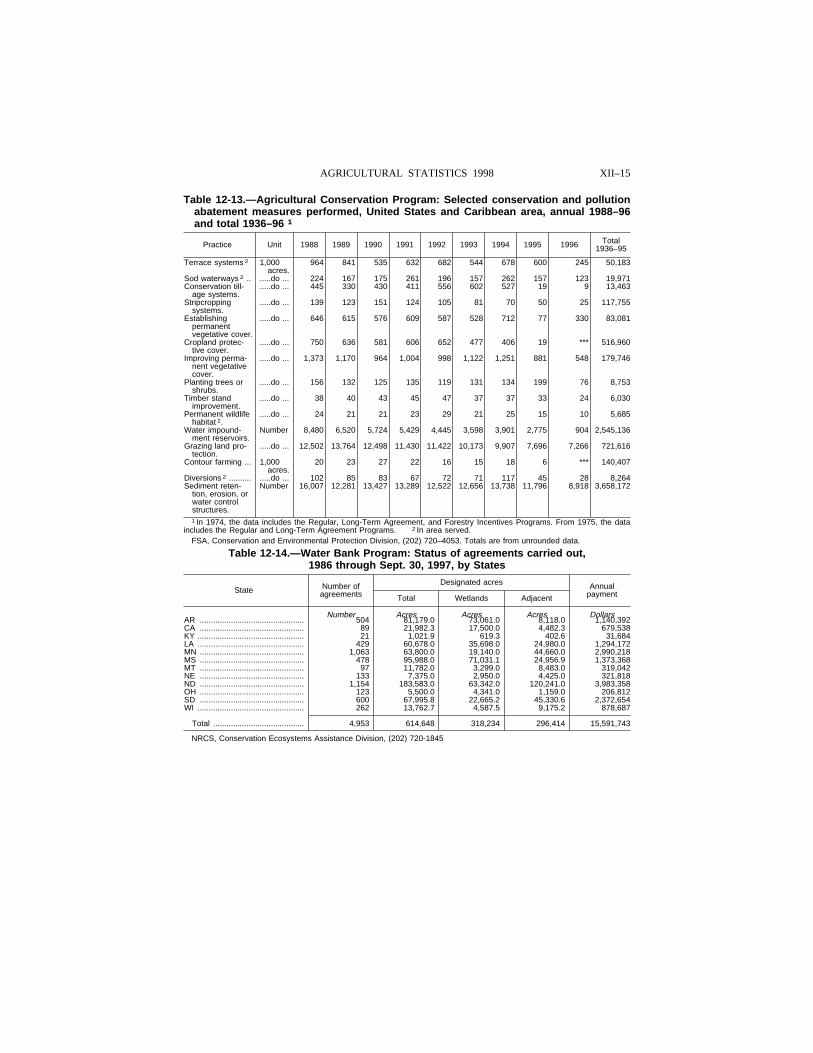
XII–15AGRICULTURAL STATISTICS 1998
Table 12-13.—Agricultural Conservation Program: Selected conservation and pollutionabatement measures performed, United States and Caribbean area, annual 1988–96and total 1936–96 1
Practice Unit 1988 1989 1990 1991 1992 1993 1994 1995 1996 Total1936–95
Terrace systems 2 1,000acres.
964 841 535 632 682 544 678 600 245 50,183
Sod waterways 2 .. .....do ... 224 167 175 261 196 157 262 157 123 19,971Conservation till-
age systems......do ... 445 330 430 411 556 602 527 19 9 13,463
Stripcroppingsystems.
.....do ... 139 123 151 124 105 81 70 50 25 117,755
Establishingpermanentvegetative cover.
.....do ... 646 615 576 609 587 528 712 77 330 83,081
Cropland protec-tive cover.
.....do ... 750 636 581 606 652 477 406 19 *** 516,960
Improving perma-nent vegetativecover.
.....do ... 1,373 1,170 964 1,004 998 1,122 1,251 881 548 179,746
Planting trees orshrubs.
.....do ... 156 132 125 135 119 131 134 199 76 8,753
Timber standimprovement.
.....do ... 38 40 43 45 47 37 37 33 24 6,030
Permanent wildlifehabitat 2.
.....do ... 24 21 21 23 29 21 25 15 10 5,685
Water impound-ment reservoirs.
Number 8,480 6,520 5,724 5,429 4,445 3,598 3,901 2,775 904 2,545,136
Grazing land pro-tection.
.....do ... 12,502 13,764 12,498 11,430 11,422 10,173 9,907 7,696 7,266 721,616
Contour farming ... 1,000acres.
20 23 27 22 16 15 18 6 *** 140,407
Diversions 2 .......... .....do ... 102 85 83 67 72 71 117 45 28 8,264Sediment reten-
tion, erosion, orwater controlstructures.
Number 16,007 12,281 13,427 13,289 12,522 12,656 13,738 11,796 8,918 3,658,172
1 In 1974, the data includes the Regular, Long-Term Agreement, and Forestry Incentives Programs. From 1975, the dataincludes the Regular and Long-Term Agreement Programs. 2 In area served.
FSA, Conservation and Environmental Protection Division, (202) 720–4053. Totals are from unrounded data.
Table 12-14.—Water Bank Program: Status of agreements carried out,1986 through Sept. 30, 1997, by States
State Number ofagreements
Designated acres AnnualpaymentTotal Wetlands Adjacent
Number Acres Acres Acres DollarsAR ............................................... 504 81,179.0 73,061.0 8,118.0 1,140,392CA ............................................... 89 21,982.3 17,500.0 4,482.3 679,538KY ................................................ 21 1,021.9 619.3 402.6 31,684LA ................................................ 429 60,678.0 35,698.0 24,980.0 1,294,172MN ............................................... 1,063 63,800.0 19,140.0 44,660.0 2,990,218MS ............................................... 478 95,988.0 71,031.1 24,956.9 1,373,368MT ............................................... 97 11,782.0 3,299.0 8,483.0 319,042NE ............................................... 133 7,375.0 2,950.0 4,425.0 321,818ND ............................................... 1,154 183,583.0 63,342.0 120,241.0 3,983,358OH ............................................... 123 5,500.0 4,341.0 1,159.0 206,812SD ............................................... 600 67,995.8 22,665.2 45,330.6 2,372,654WI ................................................ 262 13,762.7 4,587.5 9,175.2 878,687
Total ......................................... 4,953 614,648 318,234 296,414 15,591,743
NRCS, Conservation Ecosystems Assistance Division, (202) 720-1845
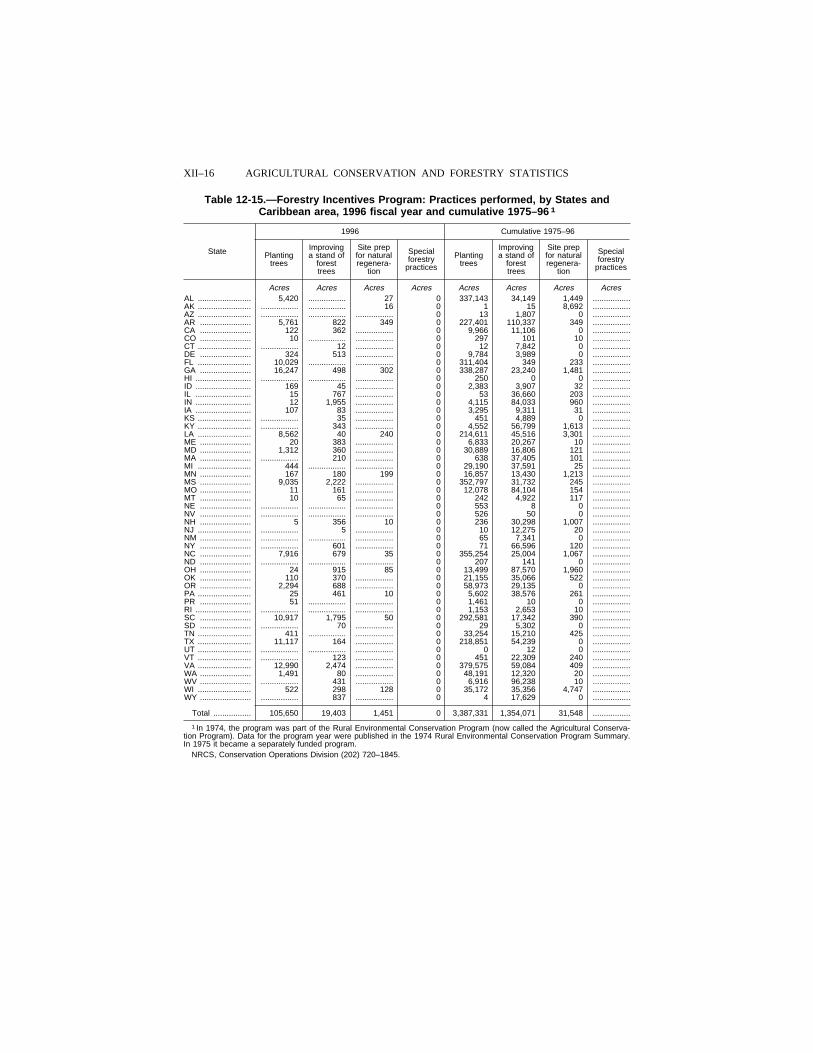
XII–16 AGRICULTURAL CONSERVATION AND FORESTRY STATISTICS
Table 12-15.—Forestry Incentives Program: Practices performed, by States andCaribbean area, 1996 fiscal year and cumulative 1975–96 1
State
1996 Cumulative 1975–96
Plantingtrees
Improvinga stand of
foresttrees
Site prepfor naturalregenera-
tion
Specialforestry
practices
Plantingtrees
Improvinga stand of
foresttrees
Site prepfor naturalregenera-
tion
Specialforestry
practices
Acres Acres Acres Acres Acres Acres Acres AcresAL ........................ 5,420 ................. 27 0 337,143 34,149 1,449 .................AK ........................ ................. ................. 16 0 1 15 8,692 .................AZ ........................ ................. ................. ................. 0 13 1,807 0 .................AR ....................... 5,761 822 349 0 227,401 110,337 349 .................CA ....................... 122 362 ................. 0 9,966 11,106 0 .................CO ....................... 10 ................. ................. 0 297 101 10 .................CT ........................ ................. 12 ................. 0 12 7,842 0 .................DE ....................... 324 513 ................. 0 9,784 3,989 0 .................FL ........................ 10,029 ................. ................. 0 311,404 349 233 .................GA ....................... 16,247 498 302 0 338,287 23,240 1,481 .................HI ......................... ................. ................. ................. 0 250 0 0 .................ID ......................... 169 45 ................. 0 2,383 3,907 32 .................IL ......................... 15 767 ................. 0 53 36,660 203 .................IN ......................... 12 1,955 ................. 0 4,115 84,033 960 .................IA ......................... 107 83 ................. 0 3,295 9,311 31 .................KS ........................ ................. 35 ................. 0 451 4,889 0 .................KY ........................ ................. 343 ................. 0 4,552 56,799 1,613 .................LA ........................ 8,562 40 240 0 214,611 45,516 3,301 .................ME ....................... 20 383 ................. 0 6,833 20,267 10 .................MD ....................... 1,312 360 ................. 0 30,889 16,806 121 .................MA ....................... ................. 210 ................. 0 638 37,405 101 .................MI ........................ 444 ................. ................. 0 29,190 37,591 25 .................MN ....................... 167 180 199 0 16,857 13,430 1,213 .................MS ....................... 9,035 2,222 ................. 0 352,797 31,732 245 .................MO ....................... 11 161 ................. 0 12,078 84,104 154 .................MT ....................... 10 65 ................. 0 242 4,922 117 .................NE ....................... ................. ................. ................. 0 553 8 0 .................NV ....................... ................. ................. ................. 0 526 50 0 .................NH ....................... 5 356 10 0 236 30,298 1,007 .................NJ ........................ ................. 5 ................. 0 10 12,275 20 .................NM ....................... ................. ................. ................. 0 65 7,341 0 .................NY ....................... ................. 601 ................. 0 71 66,596 120 .................NC ....................... 7,916 679 35 0 355,254 25,004 1,067 .................ND ....................... ................. ................. ................. 0 207 141 0 .................OH ....................... 24 915 85 0 13,499 87,570 1,960 .................OK ....................... 110 370 ................. 0 21,155 35,066 522 .................OR ....................... 2,294 688 ................. 0 58,973 29,135 0 .................PA ........................ 25 461 10 0 5,602 38,576 261 .................PR ....................... 51 ................. ................. 0 1,461 10 0 .................RI ......................... ................. ................. ................. 0 1,153 2,653 10 .................SC ....................... 10,917 1,795 50 0 292,581 17,342 390 .................SD ....................... ................. 70 ................. 0 29 5,302 0 .................TN ........................ 411 ................. ................. 0 33,254 15,210 425 .................TX ........................ 11,117 164 ................. 0 218,851 54,239 0 .................UT ........................ ................. ................. ................. 0 0 12 0 .................VT ........................ ................. 123 ................. 0 451 22,309 240 .................VA ........................ 12,990 2,474 ................. 0 379,575 59,084 409 .................WA ....................... 1,491 80 ................. 0 48,191 12,320 20 .................WV ....................... ................. 431 ................. 0 6,916 96,238 10 .................WI ........................ 522 298 128 0 35,172 35,356 4,747 .................WY ....................... ................. 837 ................. 0 4 17,629 0 .................
Total ................. 105,650 19,403 1,451 0 3,387,331 1,354,071 31,548 .................
1 In 1974, the program was part of the Rural Environmental Conservation Program (now called the Agricultural Conserva-tion Program). Data for the program year were published in the 1974 Rural Environmental Conservation Program Summary.In 1975 it became a separately funded program.
NRCS, Conservation Operations Division (202) 720–1845.
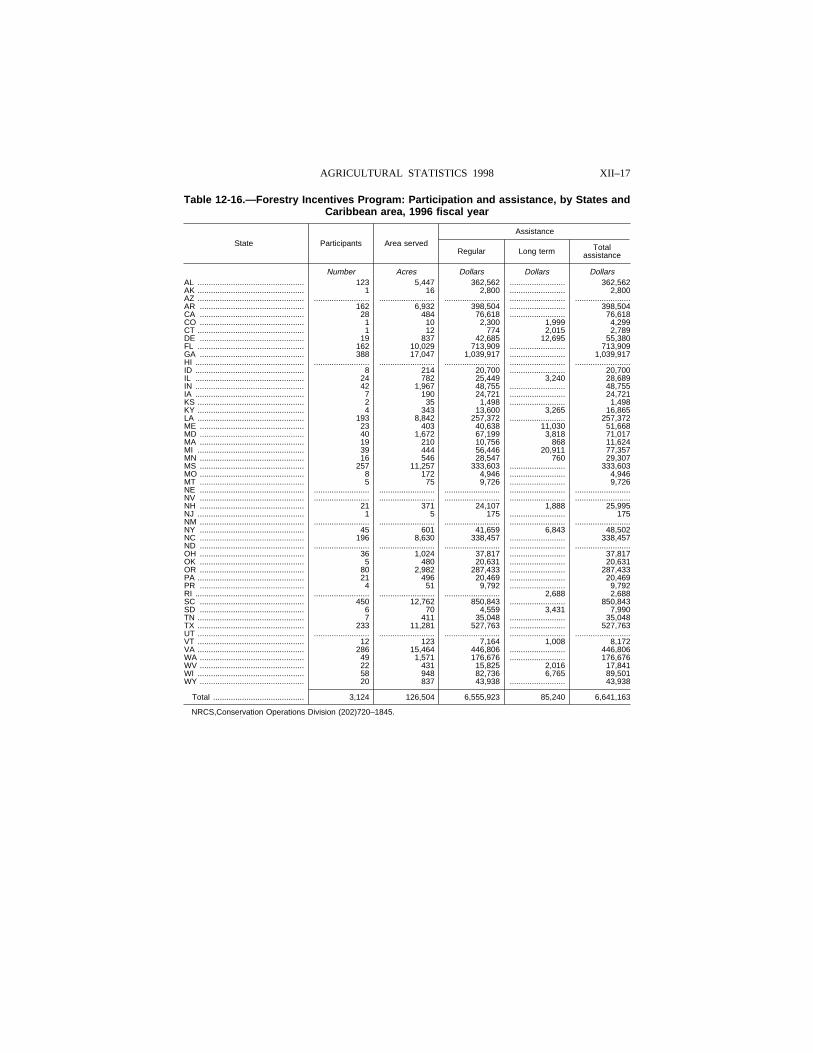
XII–17AGRICULTURAL STATISTICS 1998
Table 12-16.—Forestry Incentives Program: Participation and assistance, by States andCaribbean area, 1996 fiscal year
State Participants Area served
Assistance
Regular Long term Totalassistance
Number Acres Dollars Dollars DollarsAL ................................................ 123 5,447 362,562 ......................... 362,562AK ................................................ 1 16 2,800 ......................... 2,800AZ ................................................ ......................... ......................... ......................... ......................... .........................AR ............................................... 162 6,932 398,504 ......................... 398,504CA ............................................... 28 484 76,618 ......................... 76,618CO ............................................... 1 10 2,300 1,999 4,299CT ................................................ 1 12 774 2,015 2,789DE ............................................... 19 837 42,685 12,695 55,380FL ................................................ 162 10,029 713,909 ......................... 713,909GA ............................................... 388 17,047 1,039,917 ......................... 1,039,917HI ................................................. ......................... ......................... ......................... ......................... .........................ID ................................................. 8 214 20,700 ......................... 20,700IL ................................................. 24 782 25,449 3,240 28,689IN ................................................. 42 1,967 48,755 ......................... 48,755IA ................................................. 7 190 24,721 ......................... 24,721KS ................................................ 2 35 1,498 ......................... 1,498KY ................................................ 4 343 13,600 3,265 16,865LA ................................................ 193 8,842 257,372 ......................... 257,372ME ............................................... 23 403 40,638 11,030 51,668MD ............................................... 40 1,672 67,199 3,818 71,017MA ............................................... 19 210 10,756 868 11,624MI ................................................ 39 444 56,446 20,911 77,357MN ............................................... 16 546 28,547 760 29,307MS ............................................... 257 11,257 333,603 ......................... 333,603MO ............................................... 8 172 4,946 ......................... 4,946MT ............................................... 5 75 9,726 ......................... 9,726NE ............................................... ......................... ......................... ......................... ......................... .........................NV ............................................... ......................... ......................... ......................... ......................... .........................NH ............................................... 21 371 24,107 1,888 25,995NJ ................................................ 1 5 175 ......................... 175NM ............................................... ......................... ......................... ......................... ......................... .........................NY ............................................... 45 601 41,659 6,843 48,502NC ............................................... 196 8,630 338,457 ......................... 338,457ND ............................................... ......................... ......................... ......................... ......................... .........................OH ............................................... 36 1,024 37,817 ......................... 37,817OK ............................................... 5 480 20,631 ......................... 20,631OR ............................................... 80 2,982 287,433 ......................... 287,433PA ................................................ 21 496 20,469 ......................... 20,469PR ............................................... 4 51 9,792 ......................... 9,792RI ................................................. ......................... ......................... ......................... 2,688 2,688SC ............................................... 450 12,762 850,843 ......................... 850,843SD ............................................... 6 70 4,559 3,431 7,990TN ................................................ 7 411 35,048 ......................... 35,048TX ................................................ 233 11,281 527,763 ......................... 527,763UT ................................................ ......................... ......................... ......................... ......................... .........................VT ................................................ 12 123 7,164 1,008 8,172VA ................................................ 286 15,464 446,806 ......................... 446,806WA ............................................... 49 1,571 176,676 ......................... 176,676WV ............................................... 22 431 15,825 2,016 17,841WI ................................................ 58 948 82,736 6,765 89,501WY ............................................... 20 837 43,938 ......................... 43,938
Total ......................................... 3,124 126,504 6,555,923 85,240 6,641,163
NRCS,Conservation Operations Division (202)720–1845.
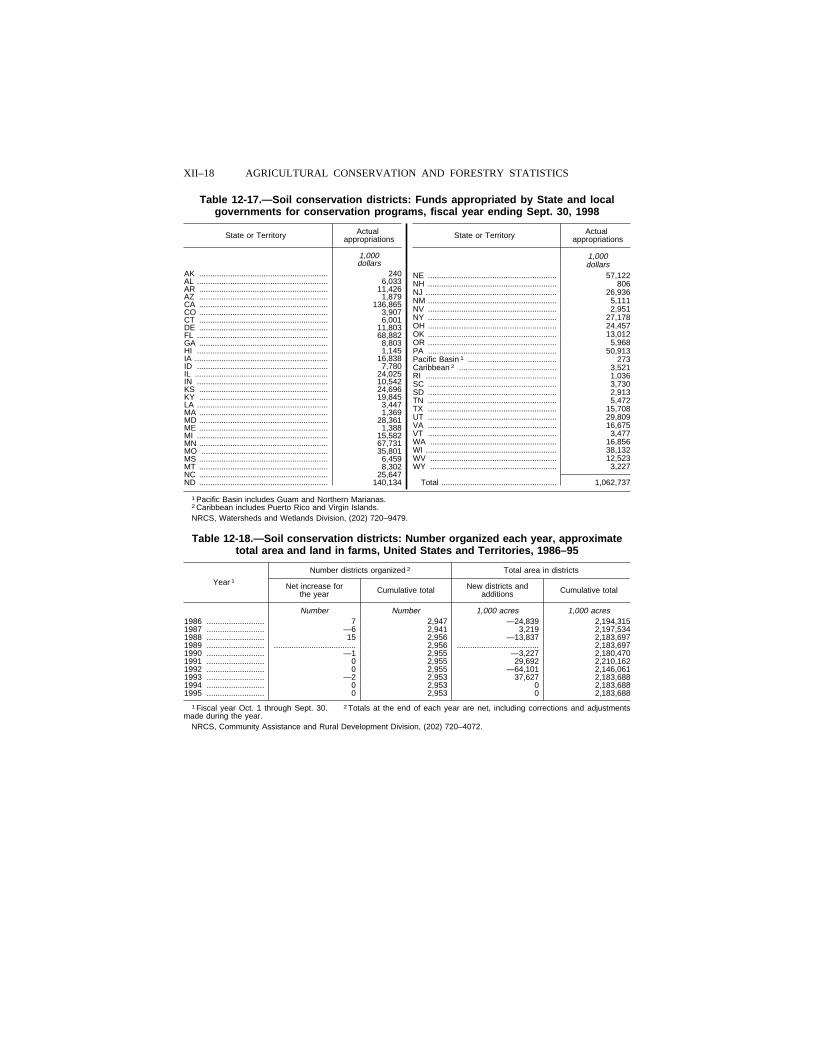
XII–18 AGRICULTURAL CONSERVATION AND FORESTRY STATISTICS
Table 12-17.—Soil conservation districts: Funds appropriated by State and localgovernments for conservation programs, fiscal year ending Sept. 30, 1998
State or Territory Actualappropriations
1,000dollars
AK .......................................................... 240AL ........................................................... 6,033AR .......................................................... 11,426AZ .......................................................... 1,879CA .......................................................... 136,865CO .......................................................... 3,907CT .......................................................... 6,001DE .......................................................... 11,803FL ........................................................... 68,882GA .......................................................... 8,803HI ........................................................... 1,145IA ............................................................ 16,838ID ........................................................... 7,780IL ............................................................ 24,025IN ........................................................... 10,542KS .......................................................... 24,696KY .......................................................... 19,845LA ........................................................... 3,447MA .......................................................... 1,369MD .......................................................... 28,361ME .......................................................... 1,388MI ........................................................... 15,582MN .......................................................... 67,731MO ......................................................... 35,801MS .......................................................... 6,459MT .......................................................... 8,302NC .......................................................... 25,647ND .......................................................... 140,134
State or Territory Actualappropriations
1,000dollars
NE .......................................................... 57,122NH .......................................................... 806NJ ........................................................... 26,936NM .......................................................... 5,111NV .......................................................... 2,951NY .......................................................... 27,178OH .......................................................... 24,457OK .......................................................... 13,012OR .......................................................... 5,968PA .......................................................... 50,913Pacific Basin 1 ........................................ 273Caribbean 2 ............................................ 3,521RI ........................................................... 1,036SC .......................................................... 3,730SD .......................................................... 2,913TN .......................................................... 5,472TX .......................................................... 15,708UT .......................................................... 29,809VA .......................................................... 16,675VT .......................................................... 3,477WA ......................................................... 16,856WI ........................................................... 38,132WV ......................................................... 12,523WY ......................................................... 3,227
Total .................................................... 1,062,737
1 Pacific Basin includes Guam and Northern Marianas.2 Caribbean includes Puerto Rico and Virgin Islands.NRCS, Watersheds and Wetlands Division, (202) 720–9479.
Table 12-18.—Soil conservation districts: Number organized each year, approximatetotal area and land in farms, United States and Territories, 1986–95
Year 1
Number districts organized 2 Total area in districts
Net increase forthe year Cumulative total New districts and
additions Cumulative total
Number Number 1,000 acres 1,000 acres1986 .......................... 7 2,947 —24,839 2,194,3151987 .......................... —6 2,941 3,219 2,197,5341988 .......................... 15 2,956 —13,837 2,183,6971989 .......................... ..................................... 2,956 ..................................... 2,183,6971990 .......................... —1 2,955 —3,227 2,180,4701991 .......................... 0 2,955 29,692 2,210,1621992 .......................... 0 2,955 —64,101 2,146,0611993 .......................... —2 2,953 37,627 2,183,6881994 .......................... 0 2,953 0 2,183,6881995 .......................... 0 2,953 0 2,183,688
1 Fiscal year Oct. 1 through Sept. 30. 2 Totals at the end of each year are net, including corrections and adjustmentsmade during the year.
NRCS, Community Assistance and Rural Development Division, (202) 720–4072.
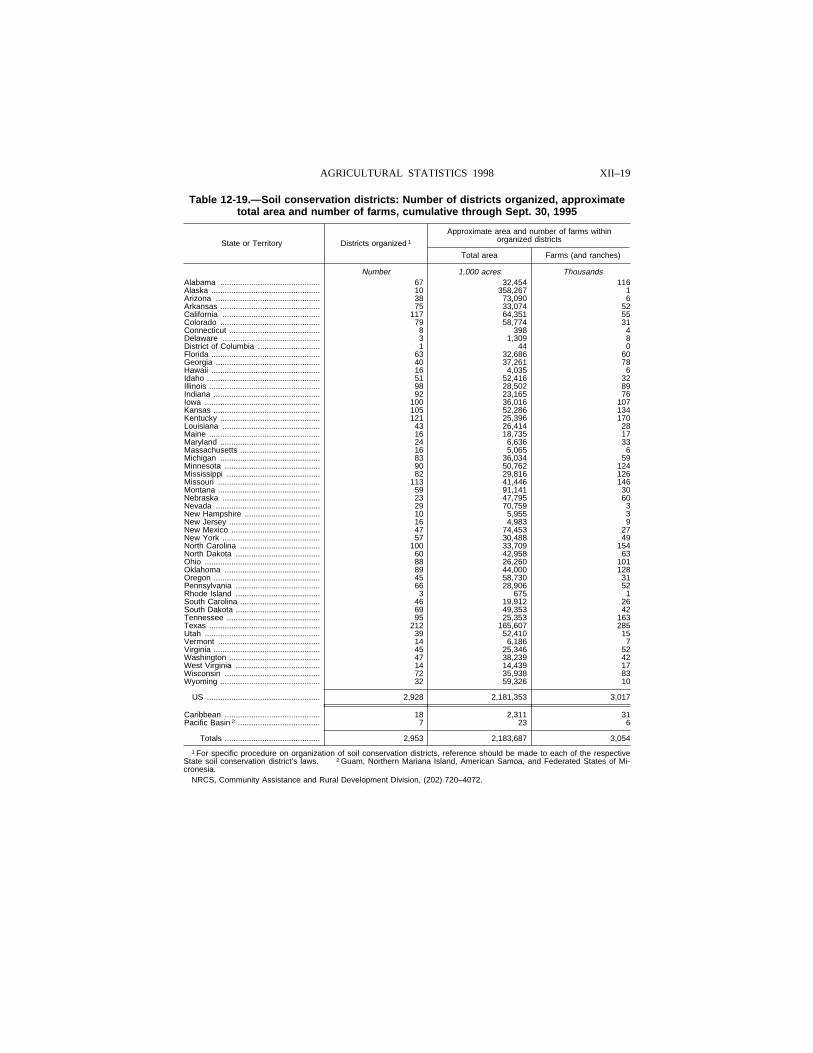
XII–19AGRICULTURAL STATISTICS 1998
Table 12-19.—Soil conservation districts: Number of districts organized, approximatetotal area and number of farms, cumulative through Sept. 30, 1995
State or Territory Districts organized 1
Approximate area and number of farms withinorganized districts
Total area Farms (and ranches)
Number 1,000 acres ThousandsAlabama ............................................. 67 32,454 116Alaska ................................................. 10 358,267 1Arizona ............................................... 38 73,090 6Arkansas ............................................. 75 33,074 52California ............................................ 117 64,351 55Colorado ............................................. 79 58,774 31Connecticut ......................................... 8 398 4Delaware ............................................ 3 1,309 8District of Columbia ............................ 1 44 0Florida ................................................. 63 32,686 60Georgia ............................................... 40 37,261 78Hawaii ................................................. 16 4,035 6Idaho ................................................... 51 52,416 32Illinois .................................................. 98 28,502 89Indiana ................................................ 92 23,165 76Iowa .................................................... 100 36,016 107Kansas ................................................ 105 52,286 134Kentucky ............................................. 121 25,396 170Louisiana ............................................ 43 26,414 28Maine .................................................. 16 18,735 17Maryland ............................................. 24 6,636 33Massachusetts .................................... 16 5,065 6Michigan ............................................. 83 36,034 59Minnesota ........................................... 90 50,762 124Mississippi .......................................... 82 29,816 126Missouri .............................................. 113 41,446 146Montana .............................................. 59 91,141 30Nebraska ............................................ 23 47,795 60Nevada ............................................... 29 70,759 3New Hampshire .................................. 10 5,955 3New Jersey ......................................... 16 4,983 9New Mexico ........................................ 47 74,453 27New York ............................................ 57 30,488 49North Carolina .................................... 100 33,709 154North Dakota ...................................... 60 42,958 63Ohio .................................................... 88 26,260 101Oklahoma ........................................... 89 44,000 128Oregon ................................................ 45 58,730 31Pennsylvania ...................................... 66 28,906 52Rhode Island ...................................... 3 675 1South Carolina .................................... 46 19,912 26South Dakota ...................................... 69 49,353 42Tennessee .......................................... 95 25,353 163Texas .................................................. 212 165,607 285Utah .................................................... 39 52,410 15Vermont .............................................. 14 6,186 7Virginia ................................................ 45 25,346 52Washington ......................................... 47 38,239 42West Virginia ...................................... 14 14,439 17Wisconsin ........................................... 72 35,938 83Wyoming ............................................. 32 59,326 10
US ................................................... 2,928 2,181,353 3,017
Caribbean ........................................... 18 2,311 31Pacific Basin 2 ..................................... 7 23 6
Totals ........................................... 2,953 2,183,687 3,054
1 For specific procedure on organization of soil conservation districts, reference should be made to each of the respectiveState soil conservation district’s laws. 2 Guam, Northern Mariana Island, American Samoa, and Federated States of Mi-cronesia.
NRCS, Community Assistance and Rural Development Division, (202) 720–4072.
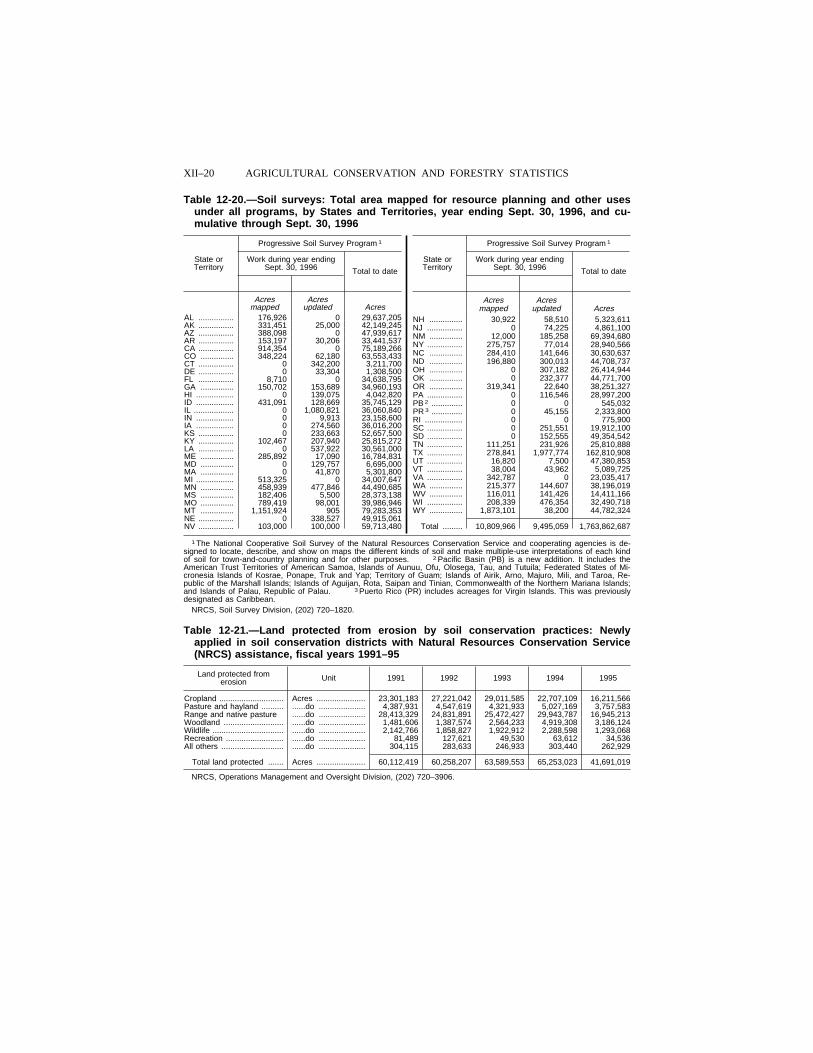
XII–20 AGRICULTURAL CONSERVATION AND FORESTRY STATISTICS
Table 12-20.—Soil surveys: Total area mapped for resource planning and other usesunder all programs, by States and Territories, year ending Sept. 30, 1996, and cu-mulative through Sept. 30, 1996
State orTerritory
Progressive Soil Survey Program 1
Work during year endingSept. 30, 1996 Total to date
Acres Acresmapped updated Acres
AL ................ 176,926 0 29,637,205AK ................ 331,451 25,000 42,149,245AZ ................ 388,098 0 47,939,617AR ................ 153,197 30,206 33,441,537CA ................ 914,354 0 75,189,266CO ............... 348,224 62,180 63,553,433CT ................ 0 342,200 3,211,700DE ................ 0 33,304 1,308,500FL ................ 8,710 0 34,638,795GA ............... 150,702 153,689 34,960,193HI ................. 0 139,075 4,042,820ID ................. 431,091 128,669 35,745,129IL .................. 0 1,080,821 36,060,840IN ................. 0 9,913 23,158,600IA ................. 0 274,560 36,016,200KS ................ 0 233,663 52,657,500KY ................ 102,467 207,940 25,815,272LA ................ 0 537,922 30,561,000ME ............... 285,892 17,090 16,784,831MD ............... 0 129,757 6,695,000MA ............... 0 41,870 5,301,800MI ................. 513,325 0 34,007,647MN ............... 458,939 477,846 44,490,685MS ............... 182,406 5,500 28,373,138MO ............... 789,419 98,001 39,986,946MT ............... 1,151,924 905 79,283,353NE ................ 0 338,527 49,915,061NV ................ 103,000 100,000 59,713,480
State orTerritory
Progressive Soil Survey Program 1
Work during year endingSept. 30, 1996 Total to date
Acres Acresmapped updated Acres
NH ............... 30,922 58,510 5,323,611NJ ................ 0 74,225 4,861,100NM ............... 12,000 185,258 69,394,680NY ................ 275,757 77,014 28,940,566NC ............... 284,410 141,646 30,630,637ND ............... 196,880 300,013 44,708,737OH ............... 0 307,182 26,414,944OK ............... 0 232,377 44,771,700OR ............... 319,341 22,640 38,251,327PA ................ 0 116,546 28,997,200PB 2 .............. 0 0 545,032PR 3 .............. 0 45,155 2,333,800RI ................. 0 0 775,900SC ................ 0 251,551 19,912,100SD ................ 0 152,555 49,354,542TN ................ 111,251 231,926 25,810,888TX ................ 278,841 1,977,774 162,810,908UT ................ 16,820 7,500 47,380,853VT ................ 38,004 43,962 5,089,725VA ................ 342,787 0 23,035,417WA ............... 215,377 144,607 38,196,019WV ............... 116,011 141,426 14,411,166WI ................ 208,339 476,354 32,490,718WY ............... 1,873,101 38,200 44,782,324
Total ......... 10,809,966 9,495,059 1,763,862,687
1 The National Cooperative Soil Survey of the Natural Resources Conservation Service and cooperating agencies is de-signed to locate, describe, and show on maps the different kinds of soil and make multiple-use interpretations of each kindof soil for town-and-country planning and for other purposes. 2 Pacific Basin (PB) is a new addition. It includes theAmerican Trust Territories of American Samoa, Islands of Aunuu, Ofu, Olosega, Tau, and Tutuila; Federated States of Mi-cronesia Islands of Kosrae, Ponape, Truk and Yap; Territory of Guam; Islands of Airik, Arno, Majuro, Mili, and Taroa, Re-public of the Marshall Islands; Islands of Aguijan, Rota, Saipan and Tinian, Commonwealth of the Northern Mariana Islands;and Islands of Palau, Republic of Palau. 3 Puerto Rico (PR) includes acreages for Virgin Islands. This was previouslydesignated as Caribbean.
NRCS, Soil Survey Division, (202) 720–1820.
Table 12-21.—Land protected from erosion by soil conservation practices: Newlyapplied in soil conservation districts with Natural Resources Conservation Service(NRCS) assistance, fiscal years 1991–95
Land protected fromerosion Unit 1991 1992 1993 1994 1995
Cropland ............................. Acres ...................... 23,301,183 27,221,042 29,011,585 22,707,109 16,211,566Pasture and hayland .......... ......do ..................... 4,387,931 4,547,619 4,321,933 5,027,169 3,757,583Range and native pasture ......do ..................... 28,413,329 24,831,891 25,472,427 29,943,787 16,945,213Woodland ........................... ......do ..................... 1,481,606 1,387,574 2,564,233 4,919,308 3,186,124Wildlife ................................ ......do ..................... 2,142,766 1,858,827 1,922,912 2,288,598 1,293,068Recreation .......................... ......do ..................... 81,489 127,621 49,530 63,612 34,536All others ............................ ......do ..................... 304,115 283,633 246,933 303,440 262,929
Total land protected ....... Acres ...................... 60,112,419 60,258,207 63,589,553 65,253,023 41,691,019
NRCS, Operations Management and Oversight Division, (202) 720–3906.
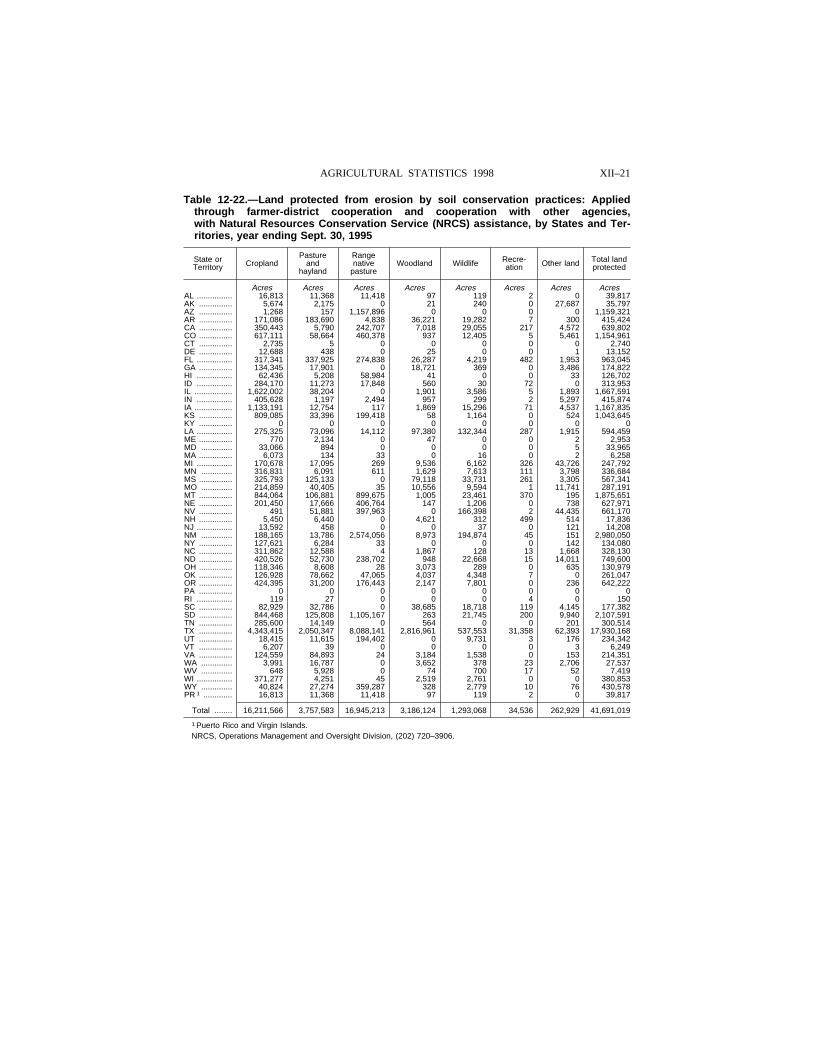
XII–21AGRICULTURAL STATISTICS 1998
Table 12-22.—Land protected from erosion by soil conservation practices: Appliedthrough farmer-district cooperation and cooperation with other agencies,with Natural Resources Conservation Service (NRCS) assistance, by States and Ter-ritories, year ending Sept. 30, 1995
State orTerritory Cropland
Pastureand
hayland
Rangenative
pastureWoodland Wildlife Recre-
ation Other land Total landprotected
Acres Acres Acres Acres Acres Acres Acres AcresAL ................ 16,813 11,368 11,418 97 119 2 0 39,817AK ............... 5,674 2,175 0 21 240 0 27,687 35,797AZ ............... 1,268 157 1,157,896 0 0 0 0 1,159,321AR ............... 171,086 183,690 4,838 36,221 19,282 7 300 415,424CA ............... 350,443 5,790 242,707 7,018 29,055 217 4,572 639,802CO ............... 617,111 58,664 460,378 937 12,405 5 5,461 1,154,961CT ............... 2,735 5 0 0 0 0 0 2,740DE ............... 12,688 438 0 25 0 0 1 13,152FL ................ 317,341 337,925 274,838 26,287 4,219 482 1,953 963,045GA ............... 134,345 17,901 0 18,721 369 0 3,486 174,822HI ................ 62,436 5,208 58,984 41 0 0 33 126,702ID ................ 284,170 11,273 17,848 560 30 72 0 313,953IL ................. 1,622,002 38,204 0 1,901 3,586 5 1,893 1,667,591IN ................ 405,628 1,197 2,494 957 299 2 5,297 415,874IA ................. 1,133,191 12,754 117 1,869 15,296 71 4,537 1,167,835KS ............... 809,085 33,396 199,418 58 1,164 0 524 1,043,645KY ............... 0 0 0 0 0 0 0 0LA ................ 275,325 73,096 14,112 97,380 132,344 287 1,915 594,459ME ............... 770 2,134 0 47 0 0 2 2,953MD .............. 33,066 894 0 0 0 0 5 33,965MA ............... 6,073 134 33 0 16 0 2 6,258MI ................ 170,678 17,095 269 9,536 6,162 326 43,726 247,792MN .............. 316,831 6,091 611 1,629 7,613 111 3,798 336,684MS ............... 325,793 125,133 0 79,118 33,731 261 3,305 567,341MO .............. 214,859 40,405 35 10,556 9,594 1 11,741 287,191MT ............... 844,064 106,881 899,675 1,005 23,461 370 195 1,875,651NE ............... 201,450 17,666 406,764 147 1,206 0 738 627,971NV ............... 491 51,881 397,963 0 166,398 2 44,435 661,170NH ............... 5,450 6,440 0 4,621 312 499 514 17,836NJ ................ 13,592 458 0 0 37 0 121 14,208NM .............. 188,165 13,786 2,574,056 8,973 194,874 45 151 2,980,050NY ............... 127,621 6,284 33 0 0 0 142 134,080NC ............... 311,862 12,588 4 1,867 128 13 1,668 328,130ND ............... 420,526 52,730 238,702 948 22,668 15 14,011 749,600OH ............... 118,346 8,608 28 3,073 289 0 635 130,979OK ............... 126,928 78,662 47,065 4,037 4,348 7 0 261,047OR ............... 424,395 31,200 176,443 2,147 7,801 0 236 642,222PA ............... 0 0 0 0 0 0 0 0RI ................ 119 27 0 0 0 4 0 150SC ............... 82,929 32,786 0 38,685 18,718 119 4,145 177,382SD ............... 844,468 125,808 1,105,167 263 21,745 200 9,940 2,107,591TN ............... 285,600 14,149 0 564 0 0 201 300,514TX ............... 4,343,415 2,050,347 8,088,141 2,816,961 537,553 31,358 62,393 17,930,168UT ............... 18,415 11,615 194,402 0 9,731 3 176 234,342VT ............... 6,207 39 0 0 0 0 3 6,249VA ............... 124,559 84,893 24 3,184 1,538 0 153 214,351WA .............. 3,991 16,787 0 3,652 378 23 2,706 27,537WV .............. 648 5,928 0 74 700 17 52 7,419WI ................ 371,277 4,251 45 2,519 2,761 0 0 380,853WY .............. 40,824 27,274 359,287 328 2,779 10 76 430,578PR 1 ............. 16,813 11,368 11,418 97 119 2 0 39,817
Total ........ 16,211,566 3,757,583 16,945,213 3,186,124 1,293,068 34,536 262,929 41,691,019
1 Puerto Rico and Virgin Islands.NRCS, Operations Management and Oversight Division, (202) 720–3906.
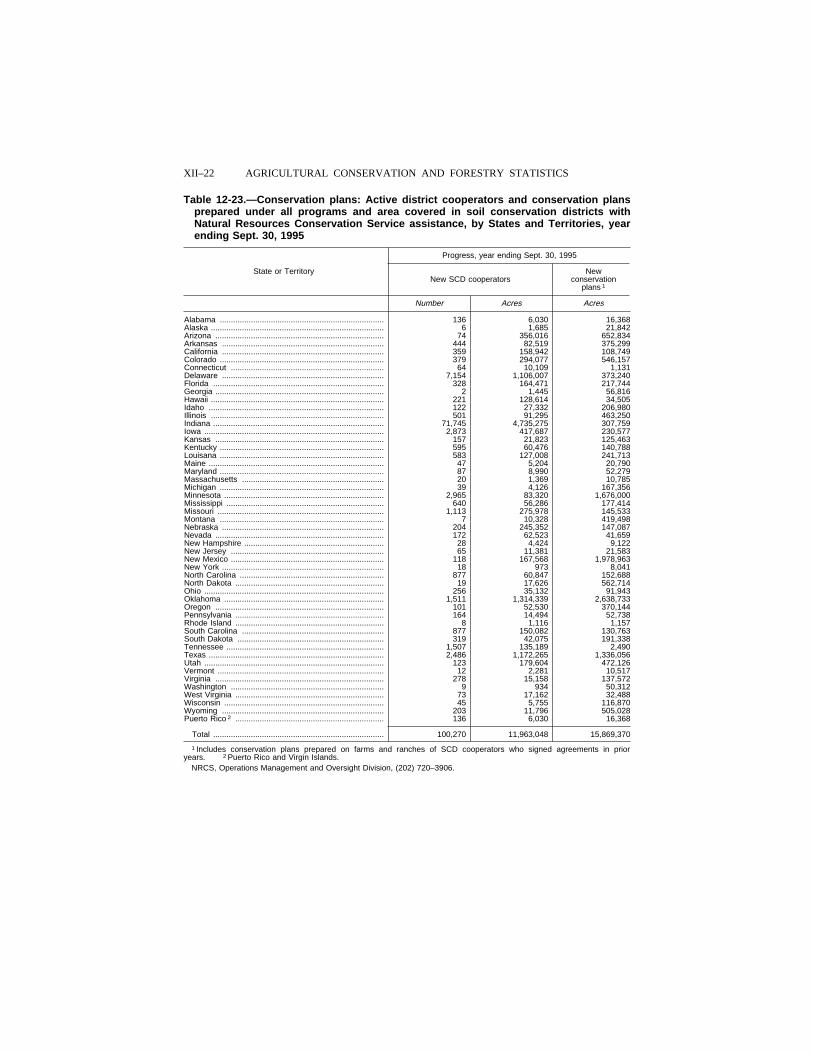
XII–22 AGRICULTURAL CONSERVATION AND FORESTRY STATISTICS
Table 12-23.—Conservation plans: Active district cooperators and conservation plansprepared under all programs and area covered in soil conservation districts withNatural Resources Conservation Service assistance, by States and Territories, yearending Sept. 30, 1995
State or Territory
Progress, year ending Sept. 30, 1995
New SCD cooperatorsNew
conservationplans 1
Number Acres Acres
Alabama .......................................................................... 136 6,030 16,368Alaska .............................................................................. 6 1,685 21,842Arizona ............................................................................ 74 356,016 652,834Arkansas ......................................................................... 444 82,519 375,299California ......................................................................... 359 158,942 108,749Colorado .......................................................................... 379 294,077 546,157Connecticut ..................................................................... 64 10,109 1,131Delaware ......................................................................... 7,154 1,106,007 373,240Florida ............................................................................. 328 164,471 217,744Georgia ............................................................................ 2 1,445 56,816Hawaii .............................................................................. 221 128,614 34,505Idaho ............................................................................... 122 27,332 206,980Illinois .............................................................................. 501 91,295 463,250Indiana ............................................................................. 71,745 4,735,275 307,759Iowa ................................................................................. 2,873 417,687 230,577Kansas ............................................................................ 157 21,823 125,463Kentucky .......................................................................... 595 60,476 140,788Louisana .......................................................................... 583 127,008 241,713Maine ............................................................................... 47 5,204 20,790Maryland .......................................................................... 87 8,990 52,279Massachusetts ................................................................ 20 1,369 10,785Michigan .......................................................................... 39 4,126 167,356Minnesota ........................................................................ 2,965 83,320 1,676,000Mississippi ....................................................................... 640 56,286 177,414Missouri ........................................................................... 1,113 275,978 145,533Montana .......................................................................... 7 10,328 419,498Nebraska ......................................................................... 204 245,352 147,087Nevada ............................................................................ 172 62,523 41,659New Hampshire ............................................................... 28 4,424 9,122New Jersey ..................................................................... 65 11,381 21,583New Mexico ..................................................................... 118 167,568 1,978,963New York ......................................................................... 18 973 8,041North Carolina ................................................................. 877 60,847 152,688North Dakota ................................................................... 19 17,626 562,714Ohio ................................................................................. 256 35,132 91,943Oklahoma ........................................................................ 1,511 1,314,339 2,638,733Oregon ............................................................................ 101 52,530 370,144Pennsylvania ................................................................... 164 14,494 52,738Rhode Island ................................................................... 8 1,116 1,157South Carolina ................................................................ 877 150,082 130,763South Dakota .................................................................. 319 42,075 191,338Tennessee ....................................................................... 1,507 135,189 2,490Texas ............................................................................... 2,486 1,172,265 1,336,056Utah ................................................................................. 123 179,604 472,126Vermont ........................................................................... 12 2,281 10,517Virginia ............................................................................ 278 15,158 137,572Washington ..................................................................... 9 934 50,312West Virginia ................................................................... 73 17,162 32,488Wisconsin ........................................................................ 45 5,755 116,870Wyoming ......................................................................... 203 11,796 505,028Puerto Rico 2 ................................................................... 136 6,030 16,368
Total ............................................................................. 100,270 11,963,048 15,869,370
1 Includes conservation plans prepared on farms and ranches of SCD cooperators who signed agreements in prioryears. 2 Puerto Rico and Virgin Islands.
NRCS, Operations Management and Oversight Division, (202) 720–3906.
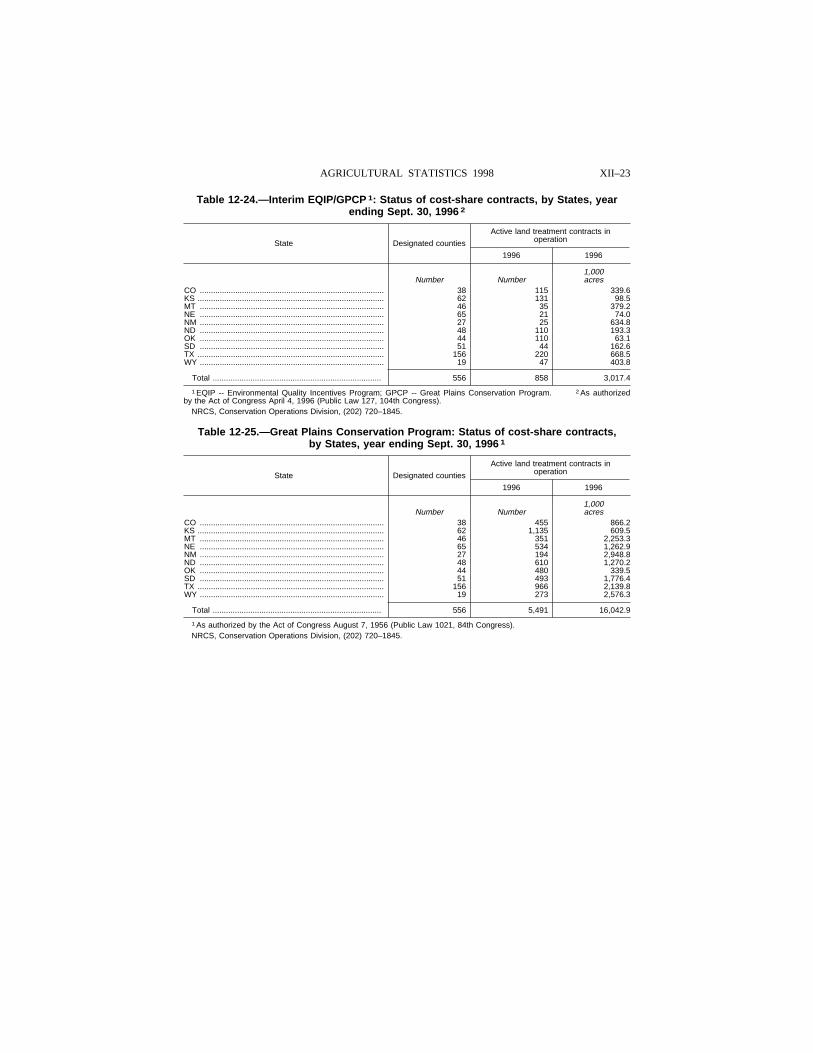
XII–23AGRICULTURAL STATISTICS 1998
Table 12-24.—Interim EQIP/GPCP 1: Status of cost-share contracts, by States, yearending Sept. 30, 1996 2
State Designated counties
Active land treatment contracts inoperation
1996 1996
1,000Number Number acres
CO ................................................................................... 38 115 339.6KS .................................................................................... 62 131 98.5MT ................................................................................... 46 35 379.2NE ................................................................................... 65 21 74.0NM ................................................................................... 27 25 634.8ND ................................................................................... 48 110 193.3OK ................................................................................... 44 110 63.1SD ................................................................................... 51 44 162.6TX .................................................................................... 156 220 668.5WY ................................................................................... 19 47 403.8
Total ............................................................................ 556 858 3,017.4
1 EQIP -- Environmental Quality Incentives Program; GPCP -- Great Plains Conservation Program. 2 As authorizedby the Act of Congress April 4, 1996 (Public Law 127, 104th Congress).
NRCS, Conservation Operations Division, (202) 720–1845.
Table 12-25.—Great Plains Conservation Program: Status of cost-share contracts,by States, year ending Sept. 30, 1996 1
State Designated counties
Active land treatment contracts inoperation
1996 1996
1,000Number Number acres
CO ................................................................................... 38 455 866.2KS .................................................................................... 62 1,135 609.5MT ................................................................................... 46 351 2,253.3NE ................................................................................... 65 534 1,262.9NM ................................................................................... 27 194 2,948.8ND ................................................................................... 48 610 1,270.2OK ................................................................................... 44 480 339.5SD ................................................................................... 51 493 1,776.4TX .................................................................................... 156 966 2,139.8WY ................................................................................... 19 273 2,576.3
Total ............................................................................ 556 5,491 16,042.9
1 As authorized by the Act of Congress August 7, 1956 (Public Law 1021, 84th Congress).NRCS, Conservation Operations Division, (202) 720–1845.
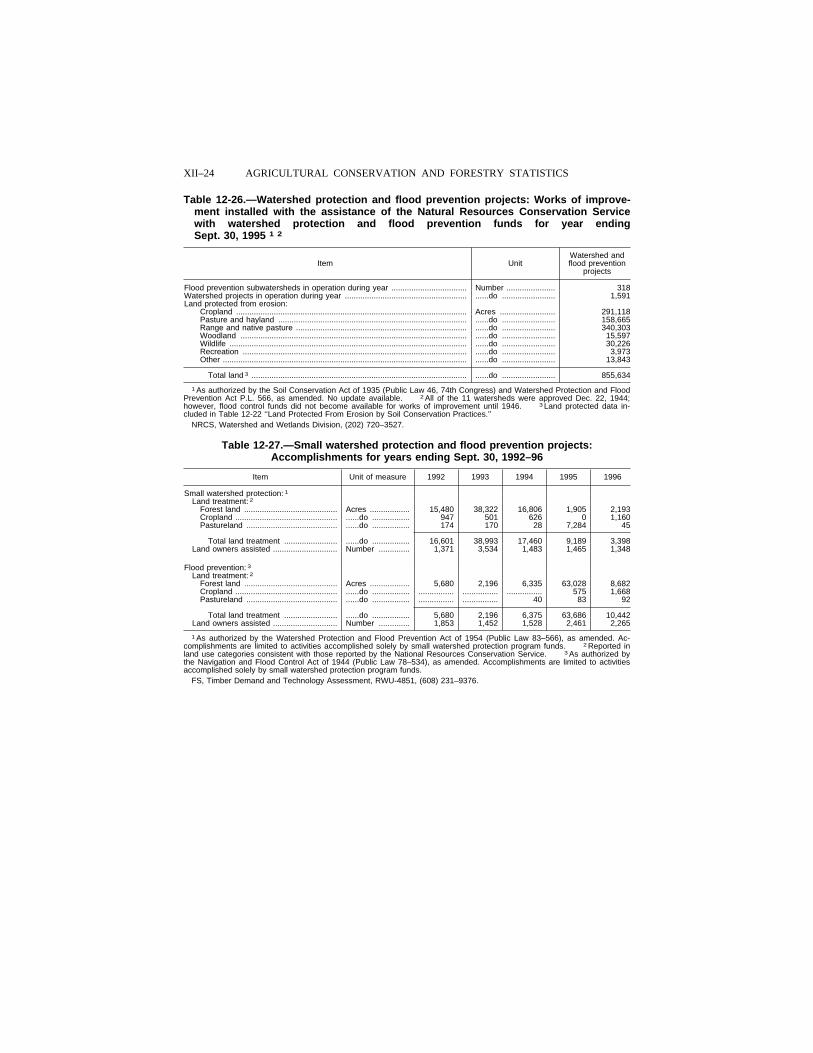
XII–24 AGRICULTURAL CONSERVATION AND FORESTRY STATISTICS
Table 12-26.—Watershed protection and flood prevention projects: Works of improve-ment installed with the assistance of the Natural Resources Conservation Servicewith watershed protection and flood prevention funds for year endingSept. 30, 1995 1 2
Item UnitWatershed andflood prevention
projects
Flood prevention subwatersheds in operation during year .................................. Number ...................... 318Watershed projects in operation during year ....................................................... ......do ........................ 1,591Land protected from erosion:
Cropland ........................................................................................................ Acres ......................... 291,118Pasture and hayland ..................................................................................... ......do ........................ 158,665Range and native pasture ............................................................................. ......do ........................ 340,303Woodland ...................................................................................................... ......do ........................ 15,597Wildlife ........................................................................................................... ......do ........................ 30,226Recreation ..................................................................................................... ......do ........................ 3,973Other .............................................................................................................. ......do ........................ 13,843
Total land 3 ................................................................................................. ......do ........................ 855,634
1 As authorized by the Soil Conservation Act of 1935 (Public Law 46, 74th Congress) and Watershed Protection and FloodPrevention Act P.L. 566, as amended. No update available. 2 All of the 11 watersheds were approved Dec. 22, 1944;however, flood control funds did not become available for works of improvement until 1946. 3 Land protected data in-cluded in Table 12-22 ‘‘Land Protected From Erosion by Soil Conservation Practices.’’
NRCS, Watershed and Wetlands Division, (202) 720–3527.
Table 12-27.—Small watershed protection and flood prevention projects:Accomplishments for years ending Sept. 30, 1992–96
Item Unit of measure 1992 1993 1994 1995 1996
Small watershed protection: 1
Land treatment: 2
Forest land .......................................... Acres .................. 15,480 38,322 16,806 1,905 2,193Cropland .............................................. ......do ................. 947 501 626 0 1,160Pastureland ......................................... ......do ................. 174 170 28 7,284 45
Total land treatment ........................ ......do ................. 16,601 38,993 17,460 9,189 3,398Land owners assisted ............................. Number .............. 1,371 3,534 1,483 1,465 1,348
Flood prevention: 3
Land treatment: 2
Forest land .......................................... Acres .................. 5,680 2,196 6,335 63,028 8,682Cropland .............................................. ......do ................. ................ ................ ................ 575 1,668Pastureland ......................................... ......do ................. ................ ................ 40 83 92
Total land treatment ........................ ......do ................. 5,680 2,196 6,375 63,686 10,442Land owners assisted ............................. Number .............. 1,853 1,452 1,528 2,461 2,265
1 As authorized by the Watershed Protection and Flood Prevention Act of 1954 (Public Law 83–566), as amended. Ac-complishments are limited to activities accomplished solely by small watershed protection program funds. 2 Reported inland use categories consistent with those reported by the National Resources Conservation Service. 3 As authorized bythe Navigation and Flood Control Act of 1944 (Public Law 78–534), as amended. Accomplishments are limited to activitiesaccomplished solely by small watershed protection program funds.
FS, Timber Demand and Technology Assessment, RWU-4851, (608) 231–9376.
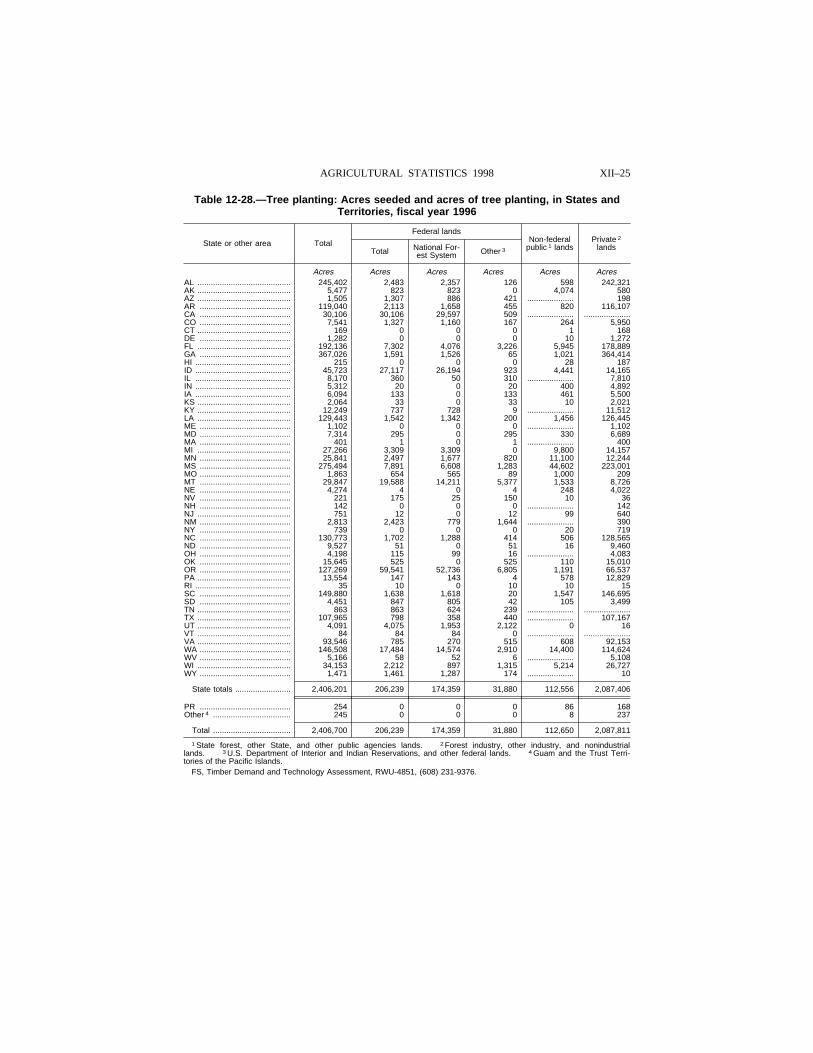
XII–25AGRICULTURAL STATISTICS 1998
Table 12-28.—Tree planting: Acres seeded and acres of tree planting, in States andTerritories, fiscal year 1996
State or other area Total
Federal landsNon-federal
public 1 landsPrivate 2
landsTotal National For-est System Other 3
Acres Acres Acres Acres Acres AcresAL .......................................... 245,402 2,483 2,357 126 598 242,321AK .......................................... 5,477 823 823 0 4,074 580AZ .......................................... 1,505 1,307 886 421 ..................... 198AR ......................................... 119,040 2,113 1,658 455 820 116,107CA ......................................... 30,106 30,106 29,597 509 ..................... .....................CO ......................................... 7,541 1,327 1,160 167 264 5,950CT .......................................... 169 0 0 0 1 168DE ......................................... 1,282 0 0 0 10 1,272FL .......................................... 192,136 7,302 4,076 3,226 5,945 178,889GA ......................................... 367,026 1,591 1,526 65 1,021 364,414HI ........................................... 215 0 0 0 28 187ID ........................................... 45,723 27,117 26,194 923 4,441 14,165IL ........................................... 8,170 360 50 310 ..................... 7,810IN ........................................... 5,312 20 0 20 400 4,892IA ........................................... 6,094 133 0 133 461 5,500KS .......................................... 2,064 33 0 33 10 2,021KY .......................................... 12,249 737 728 9 ..................... 11,512LA .......................................... 129,443 1,542 1,342 200 1,456 126,445ME ......................................... 1,102 0 0 0 ..................... 1,102MD ......................................... 7,314 295 0 295 330 6,689MA ......................................... 401 1 0 1 ..................... 400MI .......................................... 27,266 3,309 3,309 0 9,800 14,157MN ......................................... 25,841 2,497 1,677 820 11,100 12,244MS ......................................... 275,494 7,891 6,608 1,283 44,602 223,001MO ......................................... 1,863 654 565 89 1,000 209MT ......................................... 29,847 19,588 14,211 5,377 1,533 8,726NE ......................................... 4,274 4 0 4 248 4,022NV ......................................... 221 175 25 150 10 36NH ......................................... 142 0 0 0 ..................... 142NJ .......................................... 751 12 0 12 99 640NM ......................................... 2,813 2,423 779 1,644 ..................... 390NY ......................................... 739 0 0 0 20 719NC ......................................... 130,773 1,702 1,288 414 506 128,565ND ......................................... 9,527 51 0 51 16 9,460OH ......................................... 4,198 115 99 16 ..................... 4,083OK ......................................... 15,645 525 0 525 110 15,010OR ......................................... 127,269 59,541 52,736 6,805 1,191 66,537PA .......................................... 13,554 147 143 4 578 12,829RI ........................................... 35 10 0 10 10 15SC ......................................... 149,880 1,638 1,618 20 1,547 146,695SD ......................................... 4,451 847 805 42 105 3,499TN .......................................... 863 863 624 239 ..................... .....................TX .......................................... 107,965 798 358 440 ..................... 107,167UT .......................................... 4,091 4,075 1,953 2,122 0 16VT .......................................... 84 84 84 0 ..................... .....................VA .......................................... 93,546 785 270 515 608 92,153WA ......................................... 146,508 17,484 14,574 2,910 14,400 114,624WV ......................................... 5,166 58 52 6 ..................... 5,108WI .......................................... 34,153 2,212 897 1,315 5,214 26,727WY ......................................... 1,471 1,461 1,287 174 ..................... 10
State totals ......................... 2,406,201 206,239 174,359 31,880 112,556 2,087,406
PR ......................................... 254 0 0 0 86 168Other 4 ................................... 245 0 0 0 8 237
Total ................................... 2,406,700 206,239 174,359 31,880 112,650 2,087,811
1 State forest, other State, and other public agencies lands. 2 Forest industry, other industry, and nonindustriallands. 3 U.S. Department of Interior and Indian Reservations, and other federal lands. 4 Guam and the Trust Terri-tories of the Pacific Islands.
FS, Timber Demand and Technology Assessment, RWU-4851, (608) 231-9376.
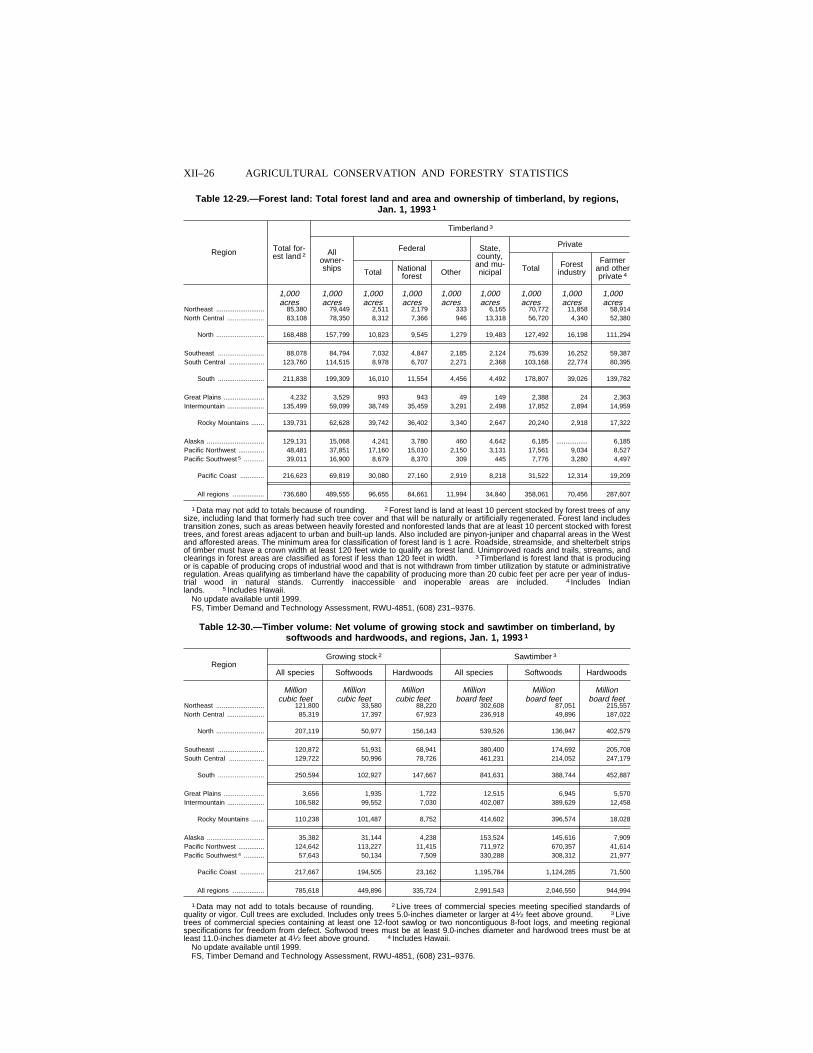
XII–26 AGRICULTURAL CONSERVATION AND FORESTRY STATISTICS
Table 12-29.—Forest land: Total forest land and area and ownership of timberland, by regions,Jan. 1, 1993 1
Region Total for-est land 2
Timberland 3
Allowner-ships
Federal State,county,and mu-nicipal
Private
Total Nationalforest Other Total Forest
industry
Farmerand otherprivate 4
1,000 1,000 1,000 1,000 1,000 1,000 1,000 1,000 1,000acres acres acres acres acres acres acres acres acres
Northeast .......................... 85,380 79,449 2,511 2,179 333 6,165 70,772 11,858 58,914North Central .................... 83,108 78,350 8,312 7,366 946 13,318 56,720 4,340 52,380
North .......................... 168,488 157,799 10,823 9,545 1,279 19,483 127,492 16,198 111,294
Southeast ......................... 88,078 84,794 7,032 4,847 2,185 2,124 75,639 16,252 59,387South Central ................... 123,760 114,515 8,978 6,707 2,271 2,368 103,168 22,774 80,395
South ......................... 211,838 199,309 16,010 11,554 4,456 4,492 178,807 39,026 139,782
Great Plains ...................... 4,232 3,529 993 943 49 149 2,388 24 2,363Intermountain .................... 135,499 59,099 38,749 35,459 3,291 2,498 17,852 2,894 14,959
Rocky Mountains ....... 139,731 62,628 39,742 36,402 3,340 2,647 20,240 2,918 17,322
Alaska ............................... 129,131 15,068 4,241 3,780 460 4,642 6,185 ................. 6,185Pacific Northwest .............. 48,481 37,851 17,160 15,010 2,150 3,131 17,561 9,034 8,527Pacific Southwest 5 ........... 39,011 16,900 8,679 8,370 309 445 7,776 3,280 4,497
Pacific Coast ............. 216,623 69,819 30,080 27,160 2,919 8,218 31,522 12,314 19,209
All regions ................. 736,680 489,555 96,655 84,661 11,994 34,840 358,061 70,456 287,607
1 Data may not add to totals because of rounding. 2 Forest land is land at least 10 percent stocked by forest trees of anysize, including land that formerly had such tree cover and that will be naturally or artificially regenerated. Forest land includestransition zones, such as areas between heavily forested and nonforested lands that are at least 10 percent stocked with foresttrees, and forest areas adjacent to urban and built-up lands. Also included are pinyon-juniper and chaparral areas in the Westand afforested areas. The minimum area for classification of forest land is 1 acre. Roadside, streamside, and shelterbelt stripsof timber must have a crown width at least 120 feet wide to qualify as forest land. Unimproved roads and trails, streams, andclearings in forest areas are classified as forest if less than 120 feet in width. 3 Timberland is forest land that is producingor is capable of producing crops of industrial wood and that is not withdrawn from timber utilization by statute or administrativeregulation. Areas qualifying as timberland have the capability of producing more than 20 cubic feet per acre per year of indus-trial wood in natural stands. Currently inaccessible and inoperable areas are included. 4 Includes Indianlands. 5 Includes Hawaii.
No update available until 1999.FS, Timber Demand and Technology Assessment, RWU-4851, (608) 231–9376.
Table 12-30.—Timber volume: Net volume of growing stock and sawtimber on timberland, bysoftwoods and hardwoods, and regions, Jan. 1, 1993 1
RegionGrowing stock 2 Sawtimber 3
All species Softwoods Hardwoods All species Softwoods Hardwoods
Million Million Million Million Million Millioncubic feet cubic feet cubic feet board feet board feet board feet
Northeast .......................... 121,800 33,580 88,220 302,608 87,051 215,557North Central .................... 85,319 17,397 67,923 236,918 49,896 187,022
North .......................... 207,119 50,977 156,143 539,526 136,947 402,579
Southeast ......................... 120,872 51,931 68,941 380,400 174,692 205,708South Central ................... 129,722 50,996 78,726 461,231 214,052 247,179
South ......................... 250,594 102,927 147,667 841,631 388,744 452,887
Great Plains ...................... 3,656 1,935 1,722 12,515 6,945 5,570Intermountain .................... 106,582 99,552 7,030 402,087 389,629 12,458
Rocky Mountains ....... 110,238 101,487 8,752 414,602 396,574 18,028
Alaska ............................... 35,382 31,144 4,238 153,524 145,616 7,909Pacific Northwest .............. 124,642 113,227 11,415 711,972 670,357 41,614Pacific Southwest 4 ........... 57,643 50,134 7,509 330,288 308,312 21,977
Pacific Coast ............. 217,667 194,505 23,162 1,195,784 1,124,285 71,500
All regions ................. 785,618 449,896 335,724 2,991,543 2,046,550 944,994
1 Data may not add to totals because of rounding. 2 Live trees of commercial species meeting specified standards ofquality or vigor. Cull trees are excluded. Includes only trees 5.0-inches diameter or larger at 41⁄2 feet above ground. 3 Livetrees of commercial species containing at least one 12-foot sawlog or two noncontiguous 8-foot logs, and meeting regionalspecifications for freedom from defect. Softwood trees must be at least 9.0-inches diameter and hardwood trees must be atleast 11.0-inches diameter at 41⁄2 feet above ground. 4 Includes Hawaii.
No update available until 1999.FS, Timber Demand and Technology Assessment, RWU-4851, (608) 231–9376.
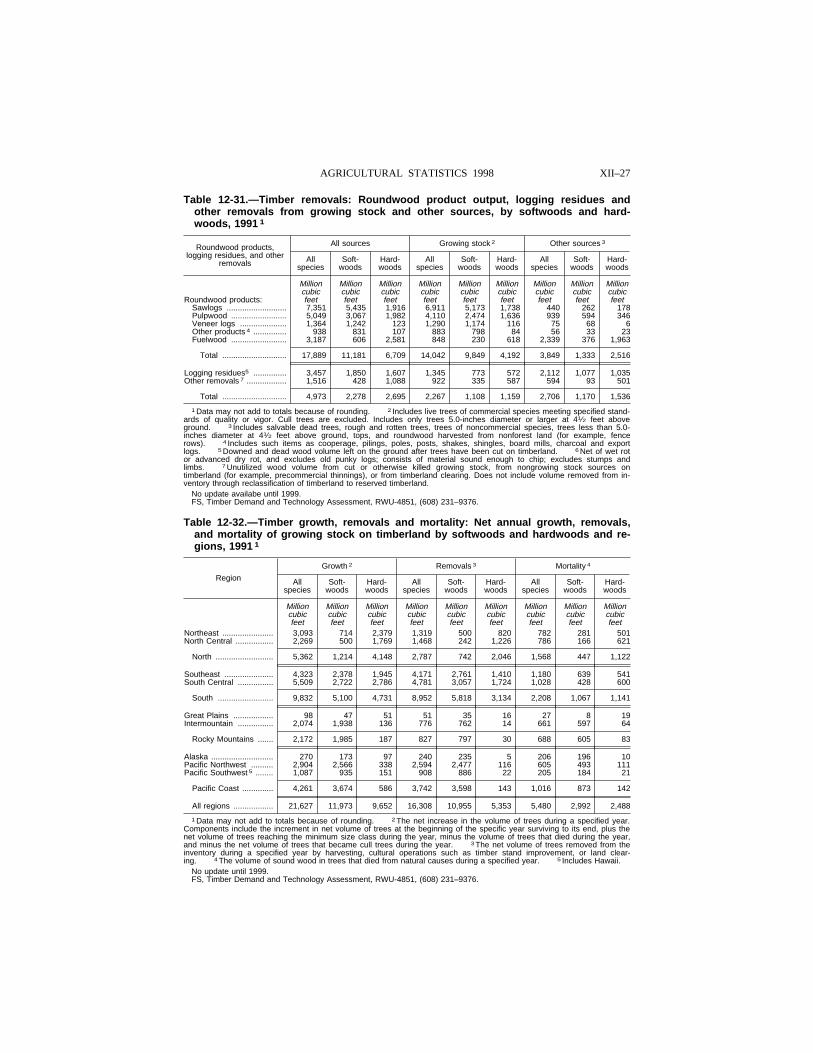
XII–27AGRICULTURAL STATISTICS 1998
Table 12-31.—Timber removals: Roundwood product output, logging residues andother removals from growing stock and other sources, by softwoods and hard-woods, 1991 1
Roundwood products,logging residues, and other
removals
All sources Growing stock 2 Other sources 3
Allspecies
Soft-woods
Hard-woods
Allspecies
Soft-woods
Hard-woods
Allspecies
Soft-woods
Hard-woods
Million Million Million Million Million Million Million Million Millioncubic cubic cubic cubic cubic cubic cubic cubic cubic
Roundwood products: feet feet feet feet feet feet feet feet feetSawlogs ........................... 7,351 5,435 1,916 6,911 5,173 1,738 440 262 178Pulpwood ......................... 5,049 3,067 1,982 4,110 2,474 1,636 939 594 346Veneer logs ..................... 1,364 1,242 123 1,290 1,174 116 75 68 6Other products 4 ............... 938 831 107 883 798 84 56 33 23Fuelwood ......................... 3,187 606 2,581 848 230 618 2,339 376 1,963
Total ............................. 17,889 11,181 6,709 14,042 9,849 4,192 3,849 1,333 2,516
Logging residues5 ............... 3,457 1,850 1,607 1,345 773 572 2,112 1,077 1,035Other removals 7 .................. 1,516 428 1,088 922 335 587 594 93 501
Total ............................. 4,973 2,278 2,695 2,267 1,108 1,159 2,706 1,170 1,536
1 Data may not add to totals because of rounding. 2 Includes live trees of commercial species meeting specified stand-ards of quality or vigor. Cull trees are excluded. Includes only trees 5.0-inches diameter or larger at 41⁄2 feet aboveground. 3 Includes salvable dead trees, rough and rotten trees, trees of noncommercial species, trees less than 5.0-inches diameter at 41⁄2 feet above ground, tops, and roundwood harvested from nonforest land (for example, fencerows). 4 Includes such items as cooperage, pilings, poles, posts, shakes, shingles, board mills, charcoal and exportlogs. 5 Downed and dead wood volume left on the ground after trees have been cut on timberland. 6 Net of wet rotor advanced dry rot, and excludes old punky logs; consists of material sound enough to chip; excludes stumps andlimbs. 7 Unutilized wood volume from cut or otherwise killed growing stock, from nongrowing stock sources ontimberland (for example, precommercial thinnings), or from timberland clearing. Does not include volume removed from in-ventory through reclassification of timberland to reserved timberland.
No update availabe until 1999.FS, Timber Demand and Technology Assessment, RWU-4851, (608) 231–9376.
Table 12-32.—Timber growth, removals and mortality: Net annual growth, removals,and mortality of growing stock on timberland by softwoods and hardwoods and re-gions, 1991 1
Region
Growth 2 Removals 3 Mortality 4
Allspecies
Soft-woods
Hard-woods
Allspecies
Soft-woods
Hard-woods
Allspecies
Soft-woods
Hard-woods
Million Million Million Million Million Million Million Million Millioncubic cubic cubic cubic cubic cubic cubic cubic cubicfeet feet feet feet feet feet feet feet feet
Northeast ....................... 3,093 714 2,379 1,319 500 820 782 281 501North Central ................. 2,269 500 1,769 1,468 242 1,226 786 166 621
North .......................... 5,362 1,214 4,148 2,787 742 2,046 1,568 447 1,122
Southeast ...................... 4,323 2,378 1,945 4,171 2,761 1,410 1,180 639 541South Central ................ 5,509 2,722 2,786 4,781 3,057 1,724 1,028 428 600
South ......................... 9,832 5,100 4,731 8,952 5,818 3,134 2,208 1,067 1,141
Great Plains .................. 98 47 51 51 35 16 27 8 19Intermountain ................ 2,074 1,938 136 776 762 14 661 597 64
Rocky Mountains ....... 2,172 1,985 187 827 797 30 688 605 83
Alaska ............................ 270 173 97 240 235 5 206 196 10Pacific Northwest .......... 2,904 2,566 338 2,594 2,477 116 605 493 111Pacific Southwest 5 ........ 1,087 935 151 908 886 22 205 184 21
Pacific Coast .............. 4,261 3,674 586 3,742 3,598 143 1,016 873 142
All regions .................. 21,627 11,973 9,652 16,308 10,955 5,353 5,480 2,992 2,488
1 Data may not add to totals because of rounding. 2 The net increase in the volume of trees during a specified year.Components include the increment in net volume of trees at the beginning of the specific year surviving to its end, plus thenet volume of trees reaching the minimum size class during the year, minus the volume of trees that died during the year,and minus the net volume of trees that became cull trees during the year. 3 The net volume of trees removed from theinventory during a specified year by harvesting, cultural operations such as timber stand improvement, or land clear-ing. 4 The volume of sound wood in trees that died from natural causes during a specified year. 5 Includes Hawaii.
No update until 1999.FS, Timber Demand and Technology Assessment, RWU-4851, (608) 231–9376.
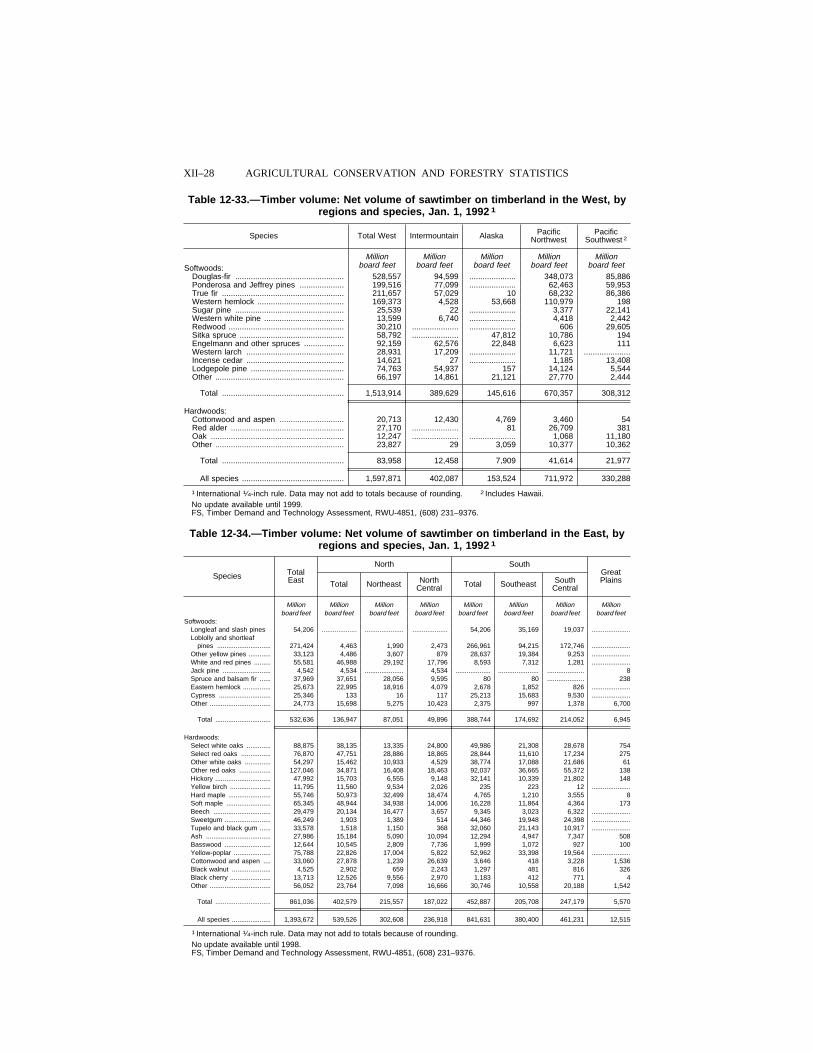
XII–28 AGRICULTURAL CONSERVATION AND FORESTRY STATISTICS
Table 12-33.—Timber volume: Net volume of sawtimber on timberland in the West, byregions and species, Jan. 1, 1992 1
Species Total West Intermountain Alaska PacificNorthwest
PacificSouthwest 2
Million Million Million Million Millionboard feet board feet board feet board feet board feetSoftwoods:
Douglas-fir ................................................. 528,557 94,599 ..................... 348,073 85,886Ponderosa and Jeffrey pines .................... 199,516 77,099 ..................... 62,463 59,953True fir ....................................................... 211,657 57,029 10 68,232 86,386Western hemlock ....................................... 169,373 4,528 53,668 110,979 198Sugar pine ................................................. 25,539 22 ..................... 3,377 22,141Western white pine .................................... 13,599 6,740 ..................... 4,418 2,442Redwood .................................................... 30,210 ..................... ..................... 606 29,605Sitka spruce ............................................... 58,792 ..................... 47,812 10,786 194Engelmann and other spruces .................. 92,159 62,576 22,848 6,623 111Western larch ............................................ 28,931 17,209 ..................... 11,721 .....................Incense cedar ............................................ 14,621 27 ..................... 1,185 13,408Lodgepole pine .......................................... 74,763 54,937 157 14,124 5,544Other .......................................................... 66,197 14,861 21,121 27,770 2,444
Total ....................................................... 1,513,914 389,629 145,616 670,357 308,312
Hardwoods:Cottonwood and aspen ............................. 20,713 12,430 4,769 3,460 54Red alder ................................................... 27,170 ..................... 81 26,709 381Oak ............................................................ 12,247 ..................... ..................... 1,068 11,180Other .......................................................... 23,827 29 3,059 10,377 10,362
Total ....................................................... 83,958 12,458 7,909 41,614 21,977
All species .............................................. 1,597,871 402,087 153,524 711,972 330,288
1 International 1⁄4-inch rule. Data may not add to totals because of rounding. 2 Includes Hawaii.No update available until 1999.FS, Timber Demand and Technology Assessment, RWU-4851, (608) 231–9376.
Table 12-34.—Timber volume: Net volume of sawtimber on timberland in the East, byregions and species, Jan. 1, 1992 1
Species TotalEast
North SouthGreatPlainsTotal Northeast North
Central Total Southeast SouthCentral
Million Million Million Million Million Million Million Millionboard feet board feet board feet board feet board feet board feet board feet board feet
Softwoods:Longleaf and slash pines 54,206 ................... ..................... ................... 54,206 35,169 19,037 .....................Loblolly and shortleaf
pines ............................. 271,424 4,463 1,990 2,473 266,961 94,215 172,746 .....................Other yellow pines ............ 33,123 4,486 3,607 879 28,637 19,384 9,253 .....................White and red pines ......... 55,581 46,988 29,192 17,796 8,593 7,312 1,281 .....................Jack pine .......................... 4,542 4,534 ..................... 4,534 ................... ...................... .................... 8Spruce and balsam fir ...... 37,969 37,651 28,056 9,595 80 80 .................... 238Eastern hemlock ............... 25,673 22,995 18,916 4,079 2,678 1,852 826 .....................Cypress ............................ 25,346 133 16 117 25,213 15,683 9,530 .....................Other ................................. 24,773 15,698 5,275 10,423 2,375 997 1,378 6,700
Total .............................. 532,636 136,947 87,051 49,896 388,744 174,692 214,052 6,945
Hardwoods:Select white oaks ............. 88,875 38,135 13,335 24,800 49,986 21,308 28,678 754Select red oaks ................ 76,870 47,751 28,886 18,865 28,844 11,610 17,234 275Other white oaks .............. 54,297 15,462 10,933 4,529 38,774 17,088 21,686 61Other red oaks ................. 127,046 34,871 16,408 18,463 92,037 36,665 55,372 138Hickory .............................. 47,992 15,703 6,555 9,148 32,141 10,339 21,802 148Yellow birch ...................... 11,795 11,560 9,534 2,026 235 223 12 .....................Hard maple ....................... 55,746 50,973 32,499 18,474 4,765 1,210 3,555 8Soft maple ........................ 65,345 48,944 34,938 14,006 16,228 11,864 4,364 173Beech ............................... 29,479 20,134 16,477 3,657 9,345 3,023 6,322 .....................Sweetgum ......................... 46,249 1,903 1,389 514 44,346 19,948 24,398 .....................Tupelo and black gum ...... 33,578 1,518 1,150 368 32,060 21,143 10,917 .....................Ash ................................... 27,986 15,184 5,090 10,094 12,294 4,947 7,347 508Basswood ......................... 12,644 10,545 2,809 7,736 1,999 1,072 927 100Yellow-poplar .................... 75,788 22,826 17,004 5,822 52,962 33,398 19,564 .....................Cottonwood and aspen .... 33,060 27,878 1,239 26,639 3,646 418 3,228 1,536Black walnut ..................... 4,525 2,902 659 2,243 1,297 481 816 326Black cherry ...................... 13,713 12,526 9,556 2,970 1,183 412 771 4Other ................................. 56,052 23,764 7,098 16,666 30,746 10,558 20,188 1,542
Total .............................. 861,036 402,579 215,557 187,022 452,887 205,708 247,179 5,570
All species ..................... 1,393,672 539,526 302,608 236,918 841,631 380,400 461,231 12,515
1 International 1⁄4-inch rule. Data may not add to totals because of rounding.No update available until 1998.FS, Timber Demand and Technology Assessment, RWU-4851, (608) 231–9376.
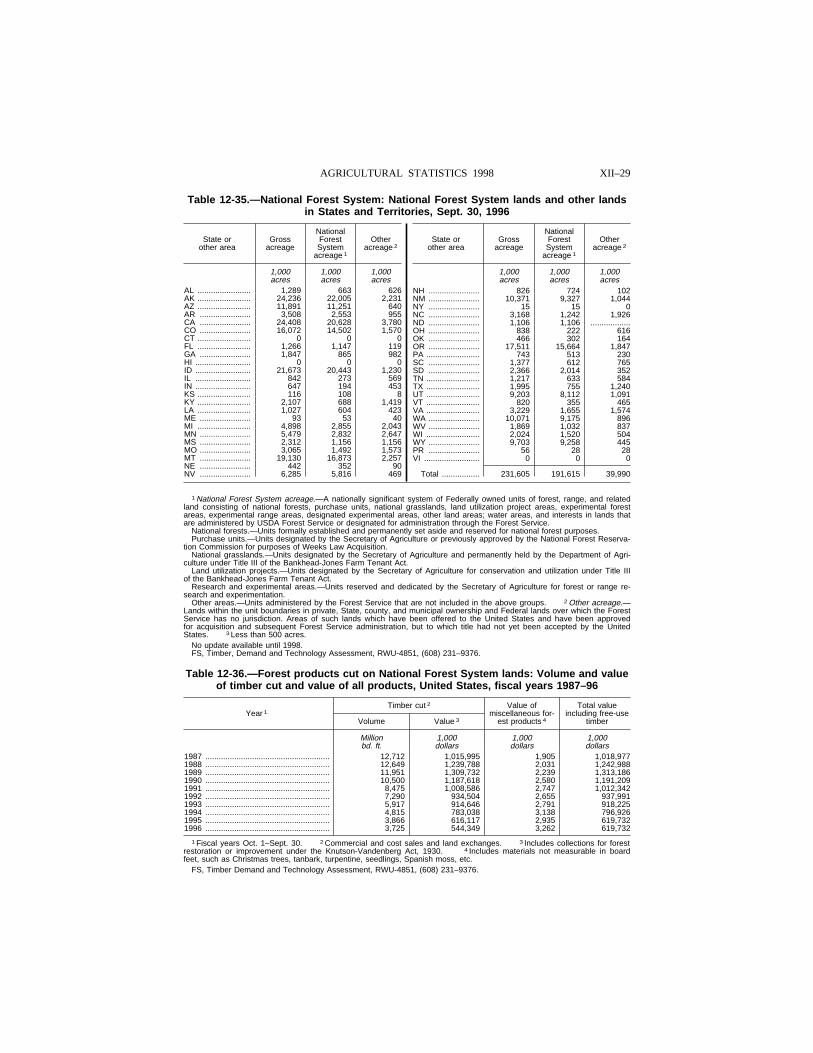
XII–29AGRICULTURAL STATISTICS 1998
Table 12-35.—National Forest System: National Forest System lands and other landsin States and Territories, Sept. 30, 1996
State orother area
Grossacreage
NationalForestSystem
acreage 1
Otheracreage 2
1,000 1,000 1,000acres acres acres
AL ........................ 1,289 663 626AK ........................ 24,236 22,005 2,231AZ ........................ 11,891 11,251 640AR ....................... 3,508 2,553 955CA ....................... 24,408 20,628 3,780CO ....................... 16,072 14,502 1,570CT ........................ 0 0 0FL ........................ 1,266 1,147 119GA ....................... 1,847 865 982HI ......................... 0 0 0ID ......................... 21,673 20,443 1,230IL ......................... 842 273 569IN ......................... 647 194 453KS ........................ 116 108 8KY ........................ 2,107 688 1,419LA ........................ 1,027 604 423ME ....................... 93 53 40MI ........................ 4,898 2,855 2,043MN ....................... 5,479 2,832 2,647MS ....................... 2,312 1,156 1,156MO ....................... 3,065 1,492 1,573MT ....................... 19,130 16,873 2,257NE ....................... 442 352 90NV ....................... 6,285 5,816 469
State orother area
Grossacreage
NationalForestSystem
acreage 1
Otheracreage 2
1,000 1,000 1,000acres acres acres
NH ....................... 826 724 102NM ....................... 10,371 9,327 1,044NY ....................... 15 15 0NC ....................... 3,168 1,242 1,926ND ....................... 1,106 1,106 ..................OH ....................... 838 222 616OK ....................... 466 302 164OR ....................... 17,511 15,664 1,847PA ........................ 743 513 230SC ....................... 1,377 612 765SD ....................... 2,366 2,014 352TN ........................ 1,217 633 584TX ........................ 1,995 755 1,240UT ........................ 9,203 8,112 1,091VT ........................ 820 355 465VA ........................ 3,229 1,655 1,574WA ....................... 10,071 9,175 896WV ....................... 1,869 1,032 837WI ........................ 2,024 1,520 504WY ....................... 9,703 9,258 445PR ....................... 56 28 28VI ......................... 0 0 0
Total ................. 231,605 191,615 39,990
1 National Forest System acreage.—A nationally significant system of Federally owned units of forest, range, and relatedland consisting of national forests, purchase units, national grasslands, land utilization project areas, experimental forestareas, experimental range areas, designated experimental areas, other land areas; water areas, and interests in lands thatare administered by USDA Forest Service or designated for administration through the Forest Service.
National forests.—Units formally established and permanently set aside and reserved for national forest purposes.Purchase units.—Units designated by the Secretary of Agriculture or previously approved by the National Forest Reserva-
tion Commission for purposes of Weeks Law Acquisition.National grasslands.—Units designated by the Secretary of Agriculture and permanently held by the Department of Agri-
culture under Title III of the Bankhead-Jones Farm Tenant Act.Land utilization projects.—Units designated by the Secretary of Agriculture for conservation and utilization under Title III
of the Bankhead-Jones Farm Tenant Act.Research and experimental areas.—Units reserved and dedicated by the Secretary of Agriculture for forest or range re-
search and experimentation.Other areas.—Units administered by the Forest Service that are not included in the above groups. 2 Other acreage.—
Lands within the unit boundaries in private, State, county, and municipal ownership and Federal lands over which the ForestService has no jurisdiction. Areas of such lands which have been offered to the United States and have been approvedfor acquisition and subsequent Forest Service administration, but to which title had not yet been accepted by the UnitedStates. 3 Less than 500 acres.
No update available until 1998.FS, Timber, Demand and Technology Assessment, RWU-4851, (608) 231–9376.
Table 12-36.—Forest products cut on National Forest System lands: Volume and valueof timber cut and value of all products, United States, fiscal years 1987–96
Year 1Timber cut 2 Value of
miscellaneous for-est products 4
Total valueincluding free-use
timberVolume Value 3
Millionbd. ft.
1,000dollars
1,000dollars
1,000dollars
1987 ........................................................ 12,712 1,015,995 1,905 1,018,9771988 ........................................................ 12,649 1,239,788 2,031 1,242,9881989 ........................................................ 11,951 1,309,732 2,239 1,313,1861990 ........................................................ 10,500 1,187,618 2,580 1,191,2091991 ........................................................ 8,475 1,008,586 2,747 1,012,3421992 ........................................................ 7,290 934,504 2,655 937,9911993 ........................................................ 5,917 914,646 2,791 918,2251994 ........................................................ 4,815 783,038 3,138 796,9261995 ........................................................ 3,866 616,117 2,935 619,7321996 ........................................................ 3,725 544,349 3,262 619,732
1 Fiscal years Oct. 1–Sept. 30. 2 Commercial and cost sales and land exchanges. 3 Includes collections for forestrestoration or improvement under the Knutson-Vandenberg Act, 1930. 4 Includes materials not measurable in boardfeet, such as Christmas trees, tanbark, turpentine, seedlings, Spanish moss, etc.
FS, Timber Demand and Technology Assessment, RWU-4851, (608) 231–9376.
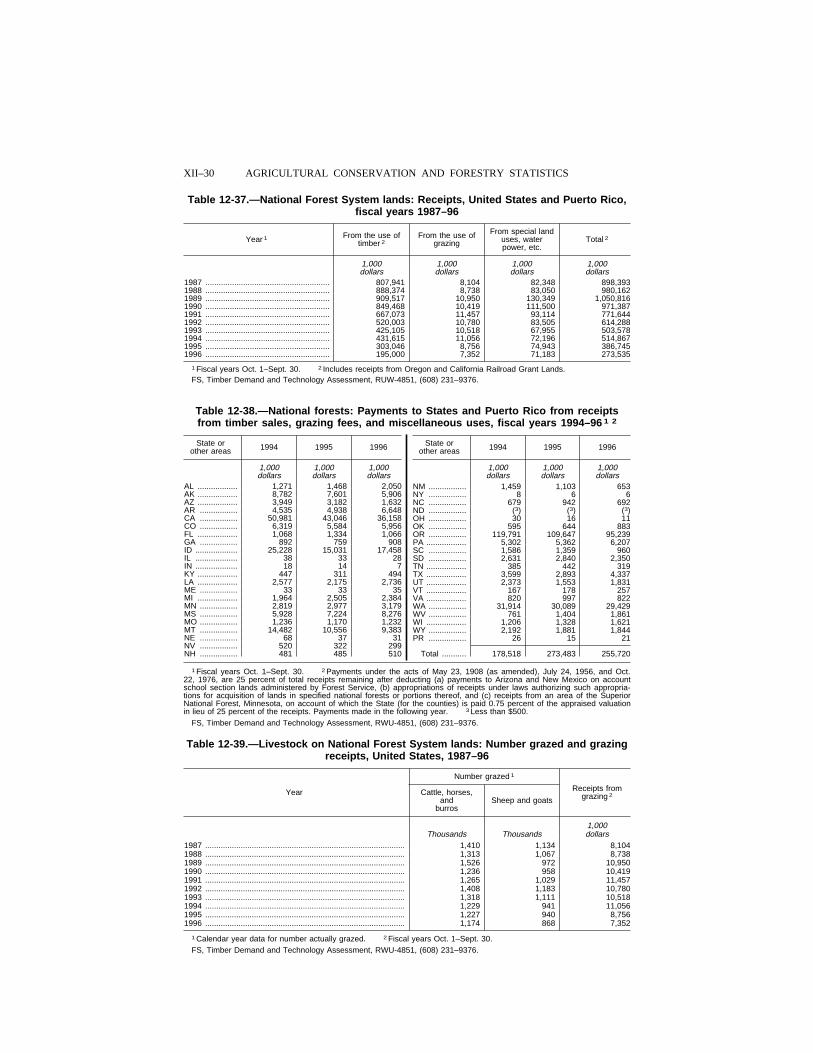
XII–30 AGRICULTURAL CONSERVATION AND FORESTRY STATISTICS
Table 12-37.—National Forest System lands: Receipts, United States and Puerto Rico,fiscal years 1987–96
Year 1 From the use oftimber 2
From the use ofgrazing
From special landuses, waterpower, etc.
Total 2
1,000 1,000 1,000 1,000dollars dollars dollars dollars
1987 ........................................................ 807,941 8,104 82,348 898,3931988 ........................................................ 888,374 8,738 83,050 980,1621989 ........................................................ 909,517 10,950 130,349 1,050,8161990 ........................................................ 849,468 10,419 111,500 971,3871991 ........................................................ 667,073 11,457 93,114 771,6441992 ........................................................ 520,003 10,780 83,505 614,2881993 ........................................................ 425,105 10,518 67,955 503,5781994 ........................................................ 431,615 11,056 72,196 514,8671995 ........................................................ 303,046 8,756 74,943 386,7451996 ........................................................ 195,000 7,352 71,183 273,535
1 Fiscal years Oct. 1–Sept. 30. 2 Includes receipts from Oregon and California Railroad Grant Lands.FS, Timber Demand and Technology Assessment, RUW-4851, (608) 231–9376.
Table 12-38.—National forests: Payments to States and Puerto Rico from receiptsfrom timber sales, grazing fees, and miscellaneous uses, fiscal years 1994–96 1 2
State orother areas 1994 1995 1996
1,000 1,000 1,000dollars dollars dollars
AL .................. 1,271 1,468 2,050AK .................. 8,782 7,601 5,906AZ .................. 3,949 3,182 1,632AR ................. 4,535 4,938 6,648CA ................. 50,981 43,046 36,158CO ................. 6,319 5,584 5,956FL .................. 1,068 1,334 1,066GA ................. 892 759 908ID ................... 25,228 15,031 17,458IL ................... 38 33 28IN ................... 18 14 7KY .................. 447 311 494LA .................. 2,577 2,175 2,736ME ................. 33 33 35MI .................. 1,964 2,505 2,384MN ................. 2,819 2,977 3,179MS ................. 5,928 7,224 8,276MO ................. 1,236 1,170 1,232MT ................. 14,482 10,556 9,383NE ................. 68 37 31NV ................. 520 322 299NH ................. 481 485 510
State orother areas 1994 1995 1996
1,000 1,000 1,000dollars dollars dollars
NM ................. 1,459 1,103 653NY ................. 8 6 6NC ................. 679 942 692ND ................. (3) (3) (3)OH ................. 30 16 11OK ................. 595 644 883OR ................. 119,791 109,647 95,239PA .................. 5,302 5,362 6,207SC ................. 1,586 1,359 960SD ................. 2,631 2,840 2,350TN .................. 385 442 319TX .................. 3,599 2,893 4,337UT .................. 2,373 1,553 1,831VT .................. 167 178 257VA .................. 820 997 822WA ................. 31,914 30,089 29,429WV ................. 761 1,404 1,861WI .................. 1,206 1,328 1,621WY ................. 2,192 1,881 1,844PR ................. 26 15 21
Total ........... 178,518 273,483 255,720
1 Fiscal years Oct. 1–Sept. 30. 2 Payments under the acts of May 23, 1908 (as amended), July 24, 1956, and Oct.22, 1976, are 25 percent of total receipts remaining after deducting (a) payments to Arizona and New Mexico on accountschool section lands administered by Forest Service, (b) appropriations of receipts under laws authorizing such appropria-tions for acquisition of lands in specified national forests or portions thereof, and (c) receipts from an area of the SuperiorNational Forest, Minnesota, on account of which the State (for the counties) is paid 0.75 percent of the appraised valuationin lieu of 25 percent of the receipts. Payments made in the following year. 3 Less than $500.
FS, Timber Demand and Technology Assessment, RWU-4851, (608) 231–9376.
Table 12-39.—Livestock on National Forest System lands: Number grazed and grazingreceipts, United States, 1987–96
Year
Number grazed 1
Receipts fromgrazing 2Cattle, horses,
andburros
Sheep and goats
1,000Thousands Thousands dollars
1987 .......................................................................................... 1,410 1,134 8,1041988 .......................................................................................... 1,313 1,067 8,7381989 .......................................................................................... 1,526 972 10,9501990 .......................................................................................... 1,236 958 10,4191991 .......................................................................................... 1,265 1,029 11,4571992 .......................................................................................... 1,408 1,183 10,7801993 .......................................................................................... 1,318 1,111 10,5181994 .......................................................................................... 1,229 941 11,0561995 .......................................................................................... 1,227 940 8,7561996 .......................................................................................... 1,174 868 7,352
1 Calendar year data for number actually grazed. 2 Fiscal years Oct. 1–Sept. 30.FS, Timber Demand and Technology Assessment, RWU-4851, (608) 231–9376.
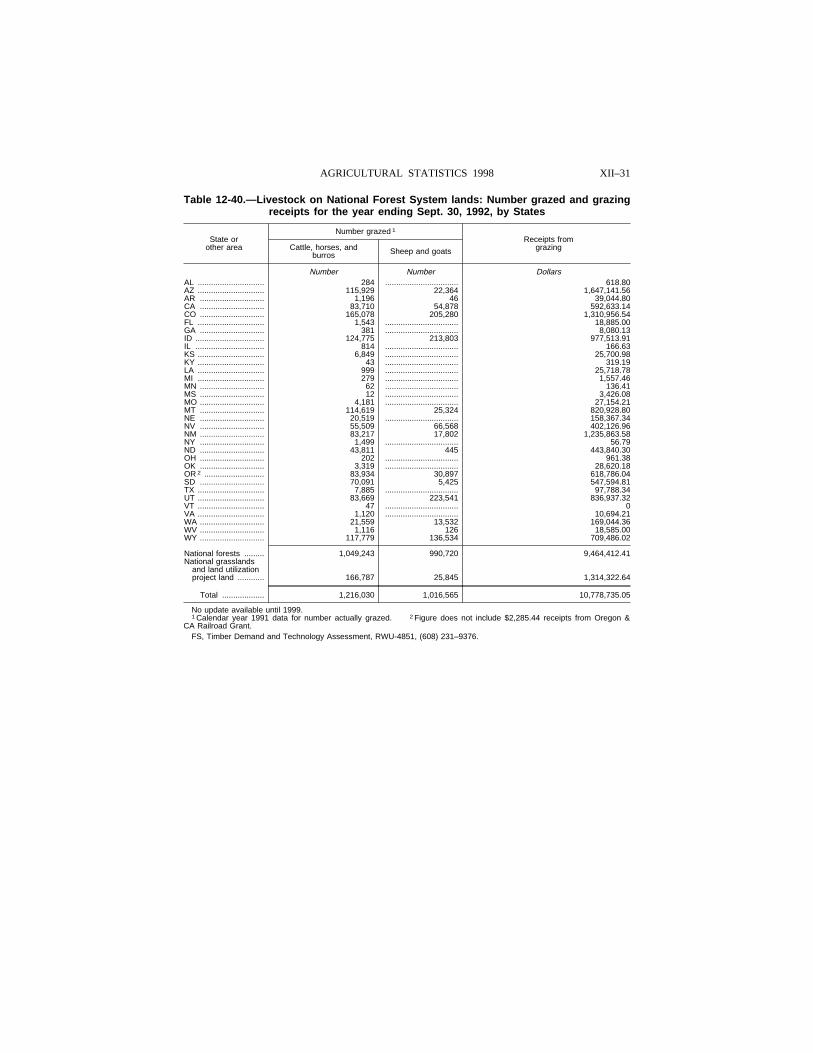
XII–31AGRICULTURAL STATISTICS 1998
Table 12-40.—Livestock on National Forest System lands: Number grazed and grazingreceipts for the year ending Sept. 30, 1992, by States
State orother area
Number grazed 1
Receipts fromgrazingCattle, horses, and
burros Sheep and goats
Number Number DollarsAL .............................. 284 ................................. 618.80AZ .............................. 115,929 22,364 1,647,141.56AR ............................. 1,196 46 39,044.80CA ............................. 83,710 54,878 592,633.14CO ............................. 165,078 205,280 1,310,956.54FL .............................. 1,543 ................................. 18,885.00GA ............................. 381 ................................. 8,080.13ID ............................... 124,775 213,803 977,513.91IL ............................... 814 ................................. 166.63KS .............................. 6,849 ................................. 25,700.98KY .............................. 43 ................................. 319.19LA .............................. 999 ................................. 25,718.78MI .............................. 279 ................................. 1,557.46MN ............................. 62 ................................. 136.41MS ............................. 12 ................................. 3,426.08MO ............................. 4,181 ................................. 27,154.21MT ............................. 114,619 25,324 820,928.80NE ............................. 20,519 ................................. 158,367.34NV ............................. 55,509 66,568 402,126.96NM ............................. 83,217 17,802 1,235,863.58NY ............................. 1,499 ................................. 56.79ND ............................. 43,811 445 443,840.30OH ............................. 202 ................................. 961.38OK ............................. 3,319 ................................. 28,620.18OR 2 ........................... 83,934 30,897 618,786.04SD ............................. 70,091 5,425 547,594.81TX .............................. 7,885 ................................. 97,788.34UT .............................. 83,669 223,541 836,937.32VT .............................. 47 ................................. 0VA .............................. 1,120 ................................. 10,694.21WA ............................. 21,559 13,532 169,044.36WV ............................. 1,116 126 18,585.00WY ............................. 117,779 136,534 709,486.02
National forests ......... 1,049,243 990,720 9,464,412.41National grasslands
and land utilizationproject land ............ 166,787 25,845 1,314,322.64
Total ................... 1,216,030 1,016,565 10,778,735.05
No update available until 1999.1 Calendar year 1991 data for number actually grazed. 2 Figure does not include $2,285.44 receipts from Oregon &
CA Railroad Grant.FS, Timber Demand and Technology Assessment, RWU-4851, (608) 231–9376.
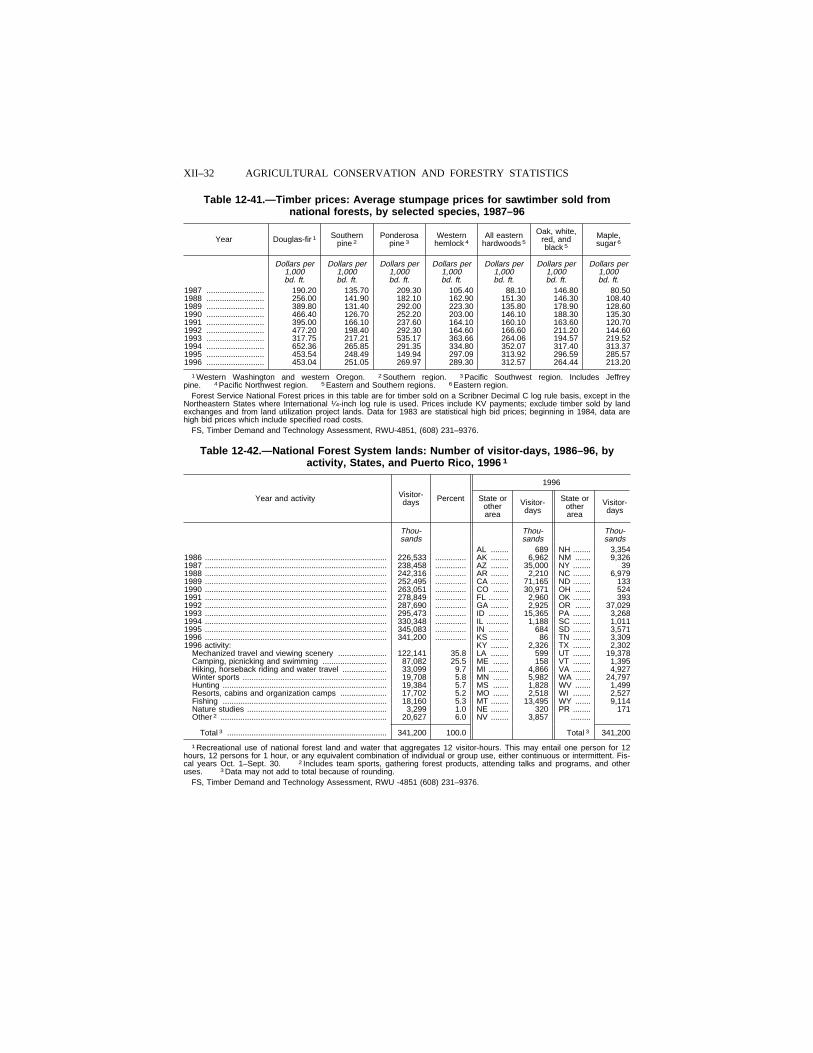
XII–32 AGRICULTURAL CONSERVATION AND FORESTRY STATISTICS
Table 12-41.—Timber prices: Average stumpage prices for sawtimber sold fromnational forests, by selected species, 1987–96
Year Douglas-fir 1 Southernpine 2
Ponderosapine 3
Westernhemlock 4
All easternhardwoods 5
Oak, white,red, andblack 5
Maple,sugar 6
Dollars per Dollars per Dollars per Dollars per Dollars per Dollars per Dollars per1,000 1,000 1,000 1,000 1,000 1,000 1,000bd. ft. bd. ft. bd. ft. bd. ft. bd. ft. bd. ft. bd. ft.
1987 .......................... 190.20 135.70 209.30 105.40 88.10 146.80 80.501988 .......................... 256.00 141.90 182.10 162.90 151.30 146.30 108.401989 .......................... 389.80 131.40 292.00 223.30 135.80 178.90 128.601990 .......................... 466.40 126.70 252.20 203.00 146.10 188.30 135.301991 .......................... 395.00 166.10 237.60 164.10 160.10 163.60 120.701992 .......................... 477.20 198.40 292.30 164.60 166.60 211.20 144.601993 .......................... 317.75 217.21 535.17 363.66 264.06 194.57 219.521994 .......................... 652.36 265.85 291.35 334.80 352.07 317.40 313.371995 .......................... 453.54 248.49 149.94 297.09 313.92 296.59 285.571996 .......................... 453.04 251.05 269.97 289.30 312.57 264.44 213.20
1 Western Washington and western Oregon. 2 Southern region. 3 Pacific Southwest region. Includes Jeffreypine. 4 Pacific Northwest region. 5 Eastern and Southern regions. 6 Eastern region.
Forest Service National Forest prices in this table are for timber sold on a Scribner Decimal C log rule basis, except in theNortheastern States where International 1⁄4-inch log rule is used. Prices include KV payments; exclude timber sold by landexchanges and from land utilization project lands. Data for 1983 are statistical high bid prices; beginning in 1984, data arehigh bid prices which include specified road costs.
FS, Timber Demand and Technology Assessment, RWU-4851, (608) 231–9376.
Table 12-42.—National Forest System lands: Number of visitor-days, 1986–96, byactivity, States, and Puerto Rico, 1996 1
Year and activity Visitor-days Percent
1996
State orotherarea
Visitor-days
State orotherarea
Visitor-days
Thou-sands
Thou-sands
Thou-sands
AL ........ 689 NH ........ 3,3541986 .................................................................................. 226,533 .............. AK ........ 6,962 NM ....... 9,3261987 .................................................................................. 238,458 .............. AZ ........ 35,000 NY ........ 391988 .................................................................................. 242,316 .............. AR ........ 2,210 NC ........ 6,9791989 .................................................................................. 252,495 .............. CA ........ 71,165 ND ........ 1331990 .................................................................................. 263,051 .............. CO ....... 30,971 OH ....... 5241991 .................................................................................. 278,849 .............. FL ......... 2,960 OK ........ 3931992 .................................................................................. 287,690 .............. GA ........ 2,925 OR ....... 37,0291993 .................................................................................. 295,473 .............. ID ......... 15,365 PA ........ 3,2681994 .................................................................................. 330,348 .............. IL .......... 1,188 SC ........ 1,0111995 .................................................................................. 345,083 .............. IN ......... 684 SD ........ 3,5711996 .................................................................................. 341,200 .............. KS ........ 86 TN ........ 3,3091996 activity: KY ........ 2,326 TX ........ 2,302
Mechanized travel and viewing scenery ...................... 122,141 35.8 LA ........ 599 UT ........ 19,378Camping, picnicking and swimming ............................. 87,082 25.5 ME ....... 158 VT ........ 1,395Hiking, horseback riding and water travel .................... 33,099 9.7 MI ......... 4,866 VA ........ 4,927Winter sports ................................................................. 19,708 5.8 MN ....... 5,982 WA ....... 24,797Hunting .......................................................................... 19,384 5.7 MS ....... 1,828 WV ....... 1,499Resorts, cabins and organization camps ..................... 17,702 5.2 MO ....... 2,518 WI ........ 2,527Fishing .......................................................................... 18,160 5.3 MT ........ 13,495 WY ....... 9,114Nature studies ............................................................... 3,299 1.0 NE ........ 320 PR ........ 171Other 2 ........................................................................... 20,627 6.0 NV ........ 3,857 .........
Total 3 ........................................................................ 341,200 100.0 Total 3 341,200
1 Recreational use of national forest land and water that aggregates 12 visitor-hours. This may entail one person for 12hours, 12 persons for 1 hour, or any equivalent combination of individual or group use, either continuous or intermittent. Fis-cal years Oct. 1–Sept. 30. 2 Includes team sports, gathering forest products, attending talks and programs, and otheruses. 3 Data may not add to total because of rounding.
FS, Timber Demand and Technology Assessment, RWU -4851 (608) 231–9376.
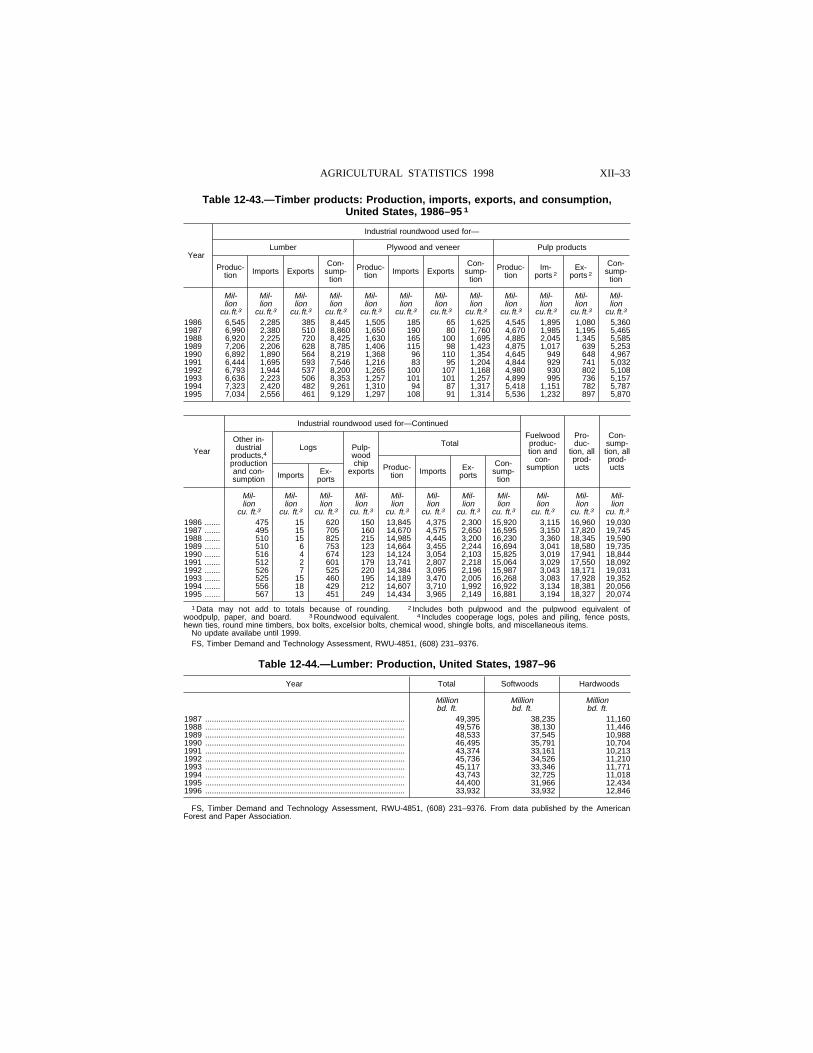
XII–33AGRICULTURAL STATISTICS 1998
Table 12-43.—Timber products: Production, imports, exports, and consumption,United States, 1986–95 1
Year
Industrial roundwood used for—
Lumber Plywood and veneer Pulp products
Produc-tion Imports Exports
Con-sump-
tion
Produc-tion Imports Exports
Con-sump-
tion
Produc-tion
Im-ports 2
Ex-ports 2
Con-sump-
tion
Mil- Mil- Mil- Mil- Mil- Mil- Mil- Mil- Mil- Mil- Mil- Mil-lion lion lion lion lion lion lion lion lion lion lion lion
cu. ft.3 cu. ft.3 cu. ft.3 cu. ft.3 cu. ft.3 cu. ft.3 cu. ft.3 cu. ft.3 cu. ft.3 cu. ft.3 cu. ft.3 cu. ft.3
1986 6,545 2,285 385 8,445 1,505 185 65 1,625 4,545 1,895 1,080 5,3601987 6,990 2,380 510 8,860 1,650 190 80 1,760 4,670 1,985 1,195 5,4651988 6,920 2,225 720 8,425 1,630 165 100 1,695 4,885 2,045 1,345 5,5851989 7,206 2,206 628 8,785 1,406 115 98 1,423 4,875 1,017 639 5,2531990 6,892 1,890 564 8,219 1,368 96 110 1,354 4,645 949 648 4,9671991 6,444 1,695 593 7,546 1,216 83 95 1,204 4,844 929 741 5,0321992 6,793 1,944 537 8,200 1,265 100 107 1,168 4,980 930 802 5,1081993 6,636 2,223 506 8,353 1,257 101 101 1,257 4,899 995 736 5,1571994 7,323 2,420 482 9,261 1,310 94 87 1,317 5,418 1,151 782 5,7871995 7,034 2,556 461 9,129 1,297 108 91 1,314 5,536 1,232 897 5,870
Year
Industrial roundwood used for—Continued
Fuelwoodproduc-tion and
con-sumption
Pro-duc-
tion, allprod-ucts
Con-sump-tion, allprod-ucts
Other in-dustrial
products,4productionand con-sumption
Logs Pulp-woodchip
exports
Total
Imports Ex-ports
Produc-tion Imports Ex-
ports
Con-sump-
tion
Mil- Mil- Mil- Mil- Mil- Mil- Mil- Mil- Mil- Mil- Mil-lion lion lion lion lion lion lion lion lion lion lion
cu. ft.3 cu. ft.3 cu. ft.3 cu. ft.3 cu. ft.3 cu. ft.3 cu. ft.3 cu. ft.3 cu. ft.3 cu. ft.3 cu. ft.3
1986 ....... 475 15 620 150 13,845 4,375 2,300 15,920 3,115 16,960 19,0301987 ....... 495 15 705 160 14,670 4,575 2,650 16,595 3,150 17,820 19,7451988 ....... 510 15 825 215 14,985 4,445 3,200 16,230 3,360 18,345 19,5901989 ....... 510 6 753 123 14,664 3,455 2,244 16,694 3,041 18,580 19,7351990 ....... 516 4 674 123 14,124 3,054 2,103 15,825 3,019 17,941 18,8441991 ....... 512 2 601 179 13,741 2,807 2,218 15,064 3,029 17,550 18,0921992 ....... 526 7 525 220 14,384 3,095 2,196 15,987 3,043 18,171 19,0311993 ....... 525 15 460 195 14,189 3,470 2,005 16,268 3,083 17,928 19,3521994 ....... 556 18 429 212 14,607 3,710 1,992 16,922 3,134 18,381 20,0561995 ....... 567 13 451 249 14,434 3,965 2,149 16,881 3,194 18,327 20,074
1 Data may not add to totals because of rounding. 2 Includes both pulpwood and the pulpwood equivalent ofwoodpulp, paper, and board. 3 Roundwood equivalent. 4 Includes cooperage logs, poles and piling, fence posts,hewn ties, round mine timbers, box bolts, excelsior bolts, chemical wood, shingle bolts, and miscellaneous items.
No update availabe until 1999.FS, Timber Demand and Technology Assessment, RWU-4851, (608) 231–9376.
Table 12-44.—Lumber: Production, United States, 1987–96
Year Total Softwoods Hardwoods
Million Million Millionbd. ft. bd. ft. bd. ft.
1987 .......................................................................................... 49,395 38,235 11,1601988 .......................................................................................... 49,576 38,130 11,4461989 .......................................................................................... 48,533 37,545 10,9881990 .......................................................................................... 46,495 35,791 10,7041991 .......................................................................................... 43,374 33,161 10,2131992 .......................................................................................... 45,736 34,526 11,2101993 .......................................................................................... 45,117 33,346 11,7711994 .......................................................................................... 43,743 32,725 11,0181995 .......................................................................................... 44,400 31,966 12,4341996 .......................................................................................... 33,932 33,932 12,846
FS, Timber Demand and Technology Assessment, RWU-4851, (608) 231–9376. From data published by the AmericanForest and Paper Association.
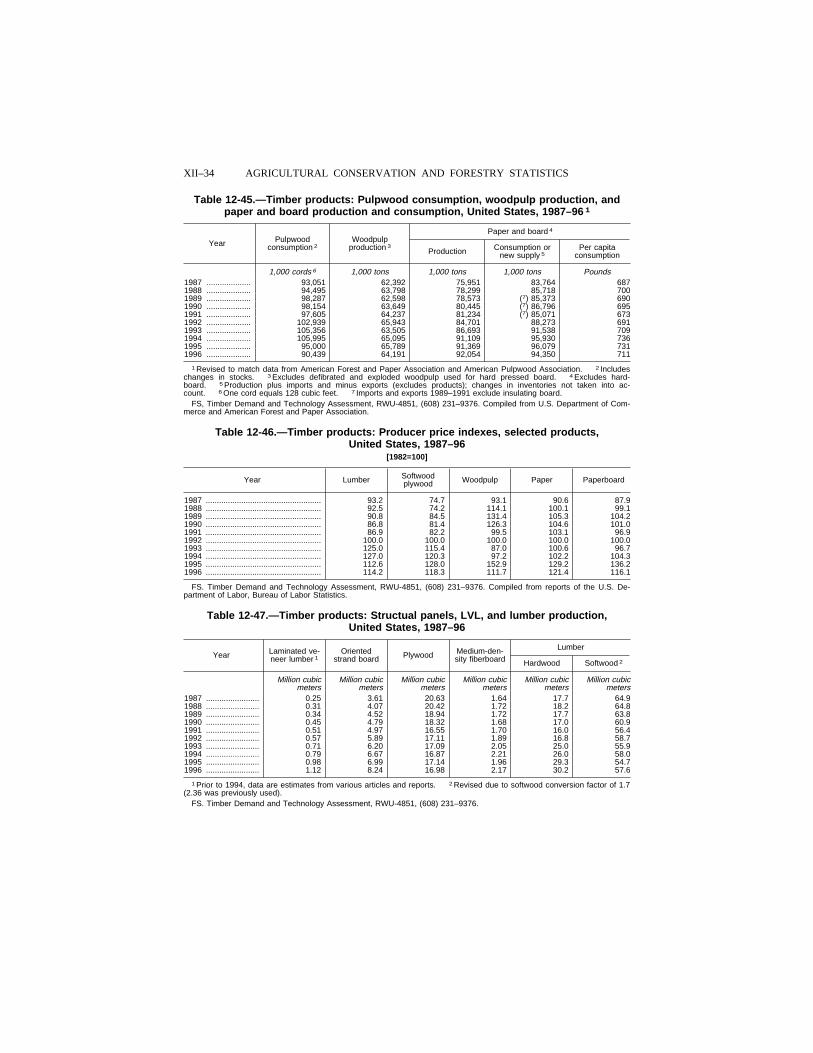
XII–34 AGRICULTURAL CONSERVATION AND FORESTRY STATISTICS
Table 12-45.—Timber products: Pulpwood consumption, woodpulp production, andpaper and board production and consumption, United States, 1987–96 1
Year Pulpwoodconsumption 2
Woodpulpproduction 3
Paper and board 4
Production Consumption ornew supply 5
Per capitaconsumption
1,000 cords 6 1,000 tons 1,000 tons 1,000 tons Pounds1987 .................... 93,051 62,392 75,951 83,764 6871988 .................... 94,495 63,798 78,299 85,718 7001989 .................... 98,287 62,598 78,573 (7) 85,373 6901990 .................... 98,154 63,649 80,445 (7) 86,796 6951991 .................... 97,605 64,237 81,234 (7) 85,071 6731992 .................... 102,939 65,943 84,701 88,273 6911993 .................... 105,356 63,505 86,693 91,538 7091994 .................... 105,995 65,095 91,109 95,930 7361995 .................... 95,000 65,789 91,369 96,079 7311996 .................... 90,439 64,191 92,054 94,350 711
1 Revised to match data from American Forest and Paper Association and American Pulpwood Association. 2 Includeschanges in stocks. 3 Excludes defibrated and exploded woodpulp used for hard pressed board. 4 Excludes hard-board. 5 Production plus imports and minus exports (excludes products); changes in inventories not taken into ac-count. 6 One cord equals 128 cubic feet. 7 Imports and exports 1989–1991 exclude insulating board.
FS, Timber Demand and Technology Assessment, RWU-4851, (608) 231–9376. Compiled from U.S. Department of Com-merce and American Forest and Paper Association.
Table 12-46.—Timber products: Producer price indexes, selected products,United States, 1987–96
[1982=100]
Year Lumber Softwoodplywood Woodpulp Paper Paperboard
1987 .................................................... 93.2 74.7 93.1 90.6 87.91988 .................................................... 92.5 74.2 114.1 100.1 99.11989 .................................................... 90.8 84.5 131.4 105.3 104.21990 .................................................... 86.8 81.4 126.3 104.6 101.01991 .................................................... 86.9 82.2 99.5 103.1 96.91992 .................................................... 100.0 100.0 100.0 100.0 100.01993 .................................................... 125.0 115.4 87.0 100.6 96.71994 .................................................... 127.0 120.3 97.2 102.2 104.31995 .................................................... 112.6 128.0 152.9 129.2 136.21996 .................................................... 114.2 118.3 111.7 121.4 116.1
FS. Timber Demand and Technology Assessment, RWU-4851, (608) 231–9376. Compiled from reports of the U.S. De-partment of Labor, Bureau of Labor Statistics.
Table 12-47.—Timber products: Structual panels, LVL, and lumber production,United States, 1987–96
Year Laminated ve-neer lumber 1
Orientedstrand board Plywood Medium-den-
sity fiberboard
Lumber
Hardwood Softwood 2
Million cubic Million cubic Million cubic Million cubic Million cubic Million cubicmeters meters meters meters meters meters
1987 ........................ 0.25 3.61 20.63 1.64 17.7 64.91988 ........................ 0.31 4.07 20.42 1.72 18.2 64.81989 ........................ 0.34 4.52 18.94 1.72 17.7 63.81990 ........................ 0.45 4.79 18.32 1.68 17.0 60.91991 ........................ 0.51 4.97 16.55 1.70 16.0 56.41992 ........................ 0.57 5.89 17.11 1.89 16.8 58.71993 ........................ 0.71 6.20 17.09 2.05 25.0 55.91994 ........................ 0.79 6.67 16.87 2.21 26.0 58.01995 ........................ 0.98 6.99 17.14 1.96 29.3 54.71996 ........................ 1.12 8.24 16.98 2.17 30.2 57.6
1 Prior to 1994, data are estimates from various articles and reports. 2 Revised due to softwood conversion factor of 1.7(2.36 was previously used).
FS. Timber Demand and Technology Assessment, RWU-4851, (608) 231–9376.