agricultural census 2010 - pakistan bureau of … · secretary . sohail ahmad . ... punjab gil gi t...
TRANSCRIPT
AGRICULTURAL CENSUS 2010
PAKISTAN REPORT
GOVERNMENT OF PAKISTAN STATISTICS DIVISION
AGRICULTURAL CENSUS ORGANIZATION
STATISTICS DIVISION
Secretary
Sohail Ahmad
AGRICULTURAL CENSUS ORGANIZATION
Agricultural Census Commissioner Muhammad Akram Khan
Joint Agricultural Census Commissioners Noor Muhammad Dharejo
Khurshid Ahmad Abdul Ghaffar
Deputy Agricultural Census Commissioners Muhammad Nawaz Arshad
Mirza Zahid Mahmood Naveed Iqbal
Khalil-ur-Rehman Rana (Admn.)
Senior Statistician Tariq Bashir
Gurumangat Road, Gulberg-III, Lahore – Pakistan. Tel: 042-99263180, 042-99263181Fax: 042-99263172
Email: [email protected] Website: statpak.gov.pk
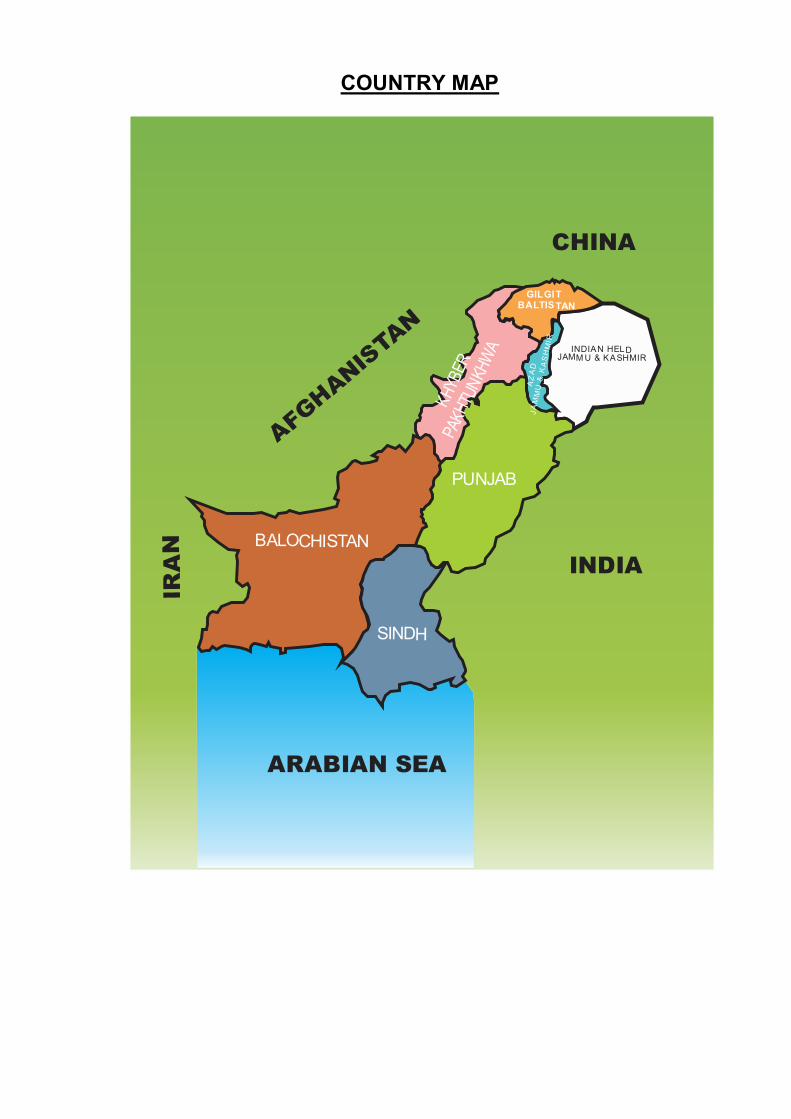
COUNTRY MAP
CHINA
INDIA
AFGH
ANIS
TAN
IR
AN
ARABIAN SEA
BALOCHISTAN
KH
YBER
PAK
HTU
NKH
WA
SINDH
PUNJAB
GILGIT BALTISTAN
AZ
AD
JA
MM
U &
KA
SH
MI R
INDIAN HELDJAMM U & KASHMIR
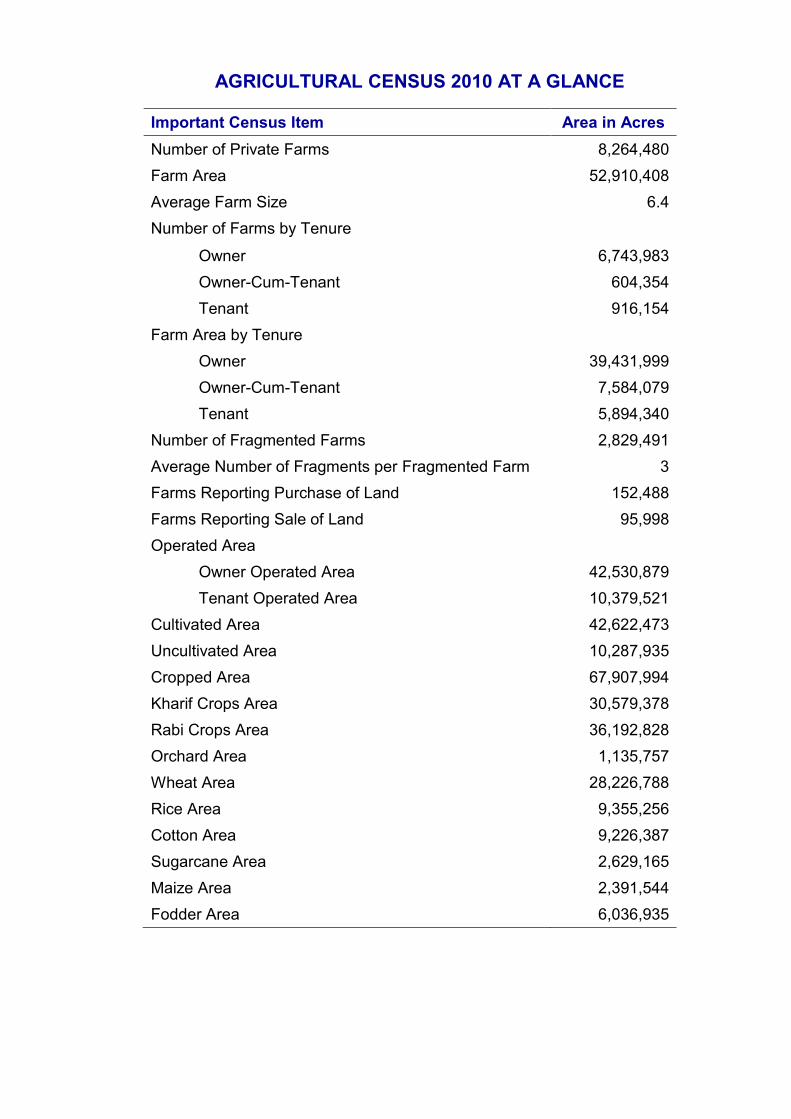
AGRICULTURAL CENSUS 2010 AT A GLANCE
Important Census Item Area in Acres
Number of Private Farms 8,264,480 Farm Area 52,910,408 Average Farm Size 6.4 Number of Farms by Tenure
Owner 6,743,983 Owner-Cum-Tenant 604,354 Tenant 916,154 Farm Area by Tenure Owner 39,431,999 Owner-Cum-Tenant 7,584,079 Tenant 5,894,340 Number of Fragmented Farms 2,829,491 Average Number of Fragments per Fragmented Farm 3 Farms Reporting Purchase of Land 152,488 Farms Reporting Sale of Land 95,998 Operated Area Owner Operated Area 42,530,879 Tenant Operated Area 10,379,521 Cultivated Area 42,622,473 Uncultivated Area 10,287,935 Cropped Area 67,907,994 Kharif Crops Area 30,579,378 Rabi Crops Area 36,192,828 Orchard Area 1,135,757 Wheat Area 28,226,788 Rice Area 9,355,256 Cotton Area 9,226,387 Sugarcane Area 2,629,165 Maize Area 2,391,544 Fodder Area 6,036,935
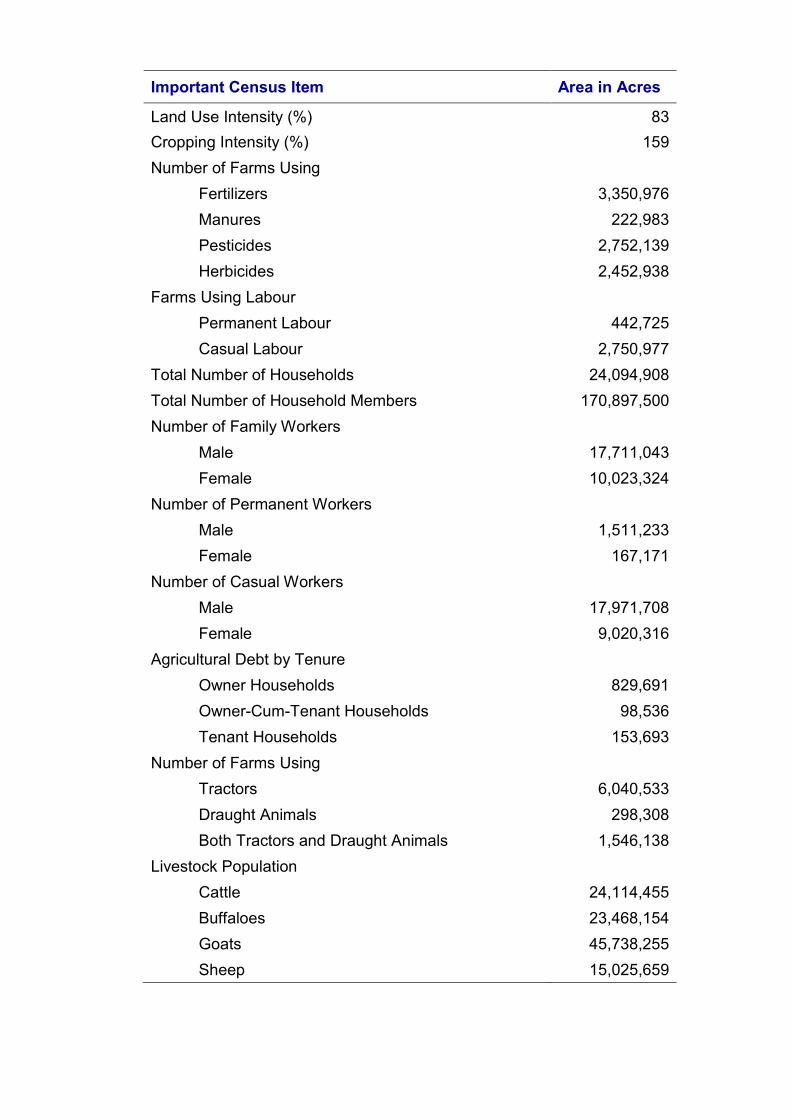
Important Census Item Area in Acres
Land Use Intensity (%) 83 Cropping Intensity (%) 159 Number of Farms Using Fertilizers 3,350,976 Manures 222,983 Pesticides 2,752,139 Herbicides 2,452,938 Farms Using Labour Permanent Labour 442,725 Casual Labour 2,750,977 Total Number of Households 24,094,908 Total Number of Household Members 170,897,500 Number of Family Workers Male 17,711,043 Female 10,023,324 Number of Permanent Workers Male 1,511,233 Female 167,171 Number of Casual Workers Male 17,971,708 Female 9,020,316 Agricultural Debt by Tenure Owner Households 829,691 Owner-Cum-Tenant Households 98,536 Tenant Households 153,693 Number of Farms Using Tractors 6,040,533 Draught Animals 298,308 Both Tractors and Draught Animals 1,546,138 Livestock Population Cattle 24,114,455 Buffaloes 23,468,154 Goats 45,738,255 Sheep 15,025,659
FOREWORD Agricultural Census Organization (ACO) is serving the nation in general and the
agricultural planners, researchers and academia in particular by providing detailed
information decennially on the structure of agriculture. This organization has
conducted six agricultural censuses since 1960 without any gap and provided very
useful data on agriculture.
The in-hand census report provides lot of latest information by size of farm and also
by tenure about the agriculture farms, farm fragmentation, land utilization, irrigated
area with sources of irrigation, area under different crops, usage of manures,
fertilizers and insecticides, farm labour and family workers, agricultural credit, use of
agricultural machinery, work animals and livestock population, land ownership, sale
and purchase of land etc. These data are very useful to boost up agriculture sector,
minimize poverty, particularly the rural poverty, and achieve the concerned
Millennium Development Goals (MDGs). In addition, the food security may be
ensured and current account balance may be improved by increasing agricultural
exports and minimizing agricultural imports. The researchers, academia and
students can take benefit from these data in multi-dimensional directions of their
interest.
My sincere appreciation goes to the Agricultural Census Organization for successful
and within schedule completion of such a gigantic exercise throughout the country
including Gilgit Baltistan and Azad Jammu & Kashmir in spite of meagre man-power,
material and financial resources.
It is expected that the census results presented in this report, will be put to effective
use by, both, agricultural policy makers as well as planners for the development of
agriculture in our country.
SOHAIL AHMAD Secretary
Statistics Division
PREFACE
Agricultural Census 2010 is the sixth in its series. This census was conducted in conjunction with World Census of Agriculture 2010 (WCA 2010) Program laid down by the United Nations Food & Agriculture Organization (FAO). This report basically, comprises of two main sections. In the first section introductory details and definitions about various variables of the census have been elucidated. It provides information about the objectives and scope of the census, its methodology, field operations, sampling plan & estimation procedure, processing of data, and concepts and definitions of different variables. The second section contains 90 statistical tables for each of the administrative units based on the census data pertaining to number, area, tenure and fragmentation of farms, structural changes, land utilization, irrigation, land use and cropping intensities, acreage of crops, use of manures, fertilizers and insecticides, casual and permanent hired labour, indebtedness, use and ownership of agricultural machines, livestock population, household members with educational level, their contribution to agriculture and sources of income for the household. These tables are given at the country and provincial levels in this report while district level data are available in the Provincial Reports (Vol. II), one for each of the province. This report portrays developments made in the agriculture sector since the last Agricultural Census in 2000 and provides basis of future planning. It is envisaged that the statistical information produced in this report will prove useful for planners, administrators, researchers, students and experts responsible for policy formulation aimed at the development of the agricultural community in the country. In the pursuit of this exercise, the hard work and dedication put in by the staff of the Agricultural Census Organization, Data Processing Centres of Lahore and Islamabad, Regional / Field Offices of Federal Bureau of Statistics and Provincial Revenue Departments are duly acknowledged. The whole hearted and above par contributions made by Mr. Amjad Javaid Sandhu, Assistant Agricultural Census Commissioner at all stages of this census are compelling enough to be appreciated. The cooperation extended and meticulous labour put in by Mr. Muhammad Ikram-Ul-Haq Rishi, Mr. Muhammad Iqbal Rana, Mr. Nafees Ahmad and Mr. Mujahid Islam of Data Processing Centre Lahore, for processing of the data of this report, is highly appreciated and worth mentioning.
MUHAMMAD AKRAM KHAN Agricultural Census Commissioner
Lahore April, 2012
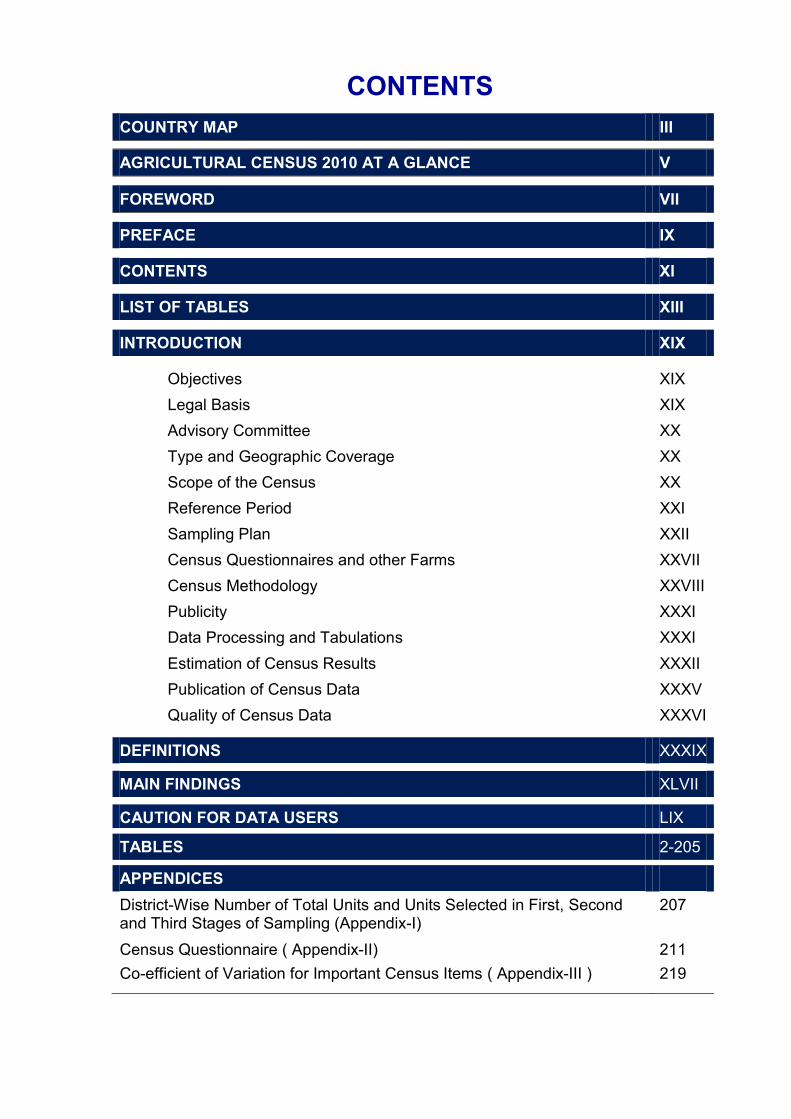
CONTENTS
COUNTRY MAP III AGRICULTURAL CENSUS 2010 AT A GLANCE V FOREWORD VII PREFACE IX CONTENTS XI LIST OF TABLES XIII INTRODUCTION XIX Objectives XIX Legal Basis XIX Advisory Committee XX Type and Geographic Coverage XX Scope of the Census XX Reference Period XXI Sampling Plan XXII Census Questionnaires and other Farms XXVII Census Methodology XXVIII Publicity XXXI Data Processing and Tabulations XXXI Estimation of Census Results XXXII Publication of Census Data XXXV Quality of Census Data XXXVI
DEFINITIONS XXXIX MAIN FINDINGS XLVII CAUTION FOR DATA USERS LIX TABLES 2-205 APPENDICES District-Wise Number of Total Units and Units Selected in First, Second and Third Stages of Sampling (Appendix-I)
207
Census Questionnaire ( Appendix-II) 211 Co-efficient of Variation for Important Census Items ( Appendix-III )
219
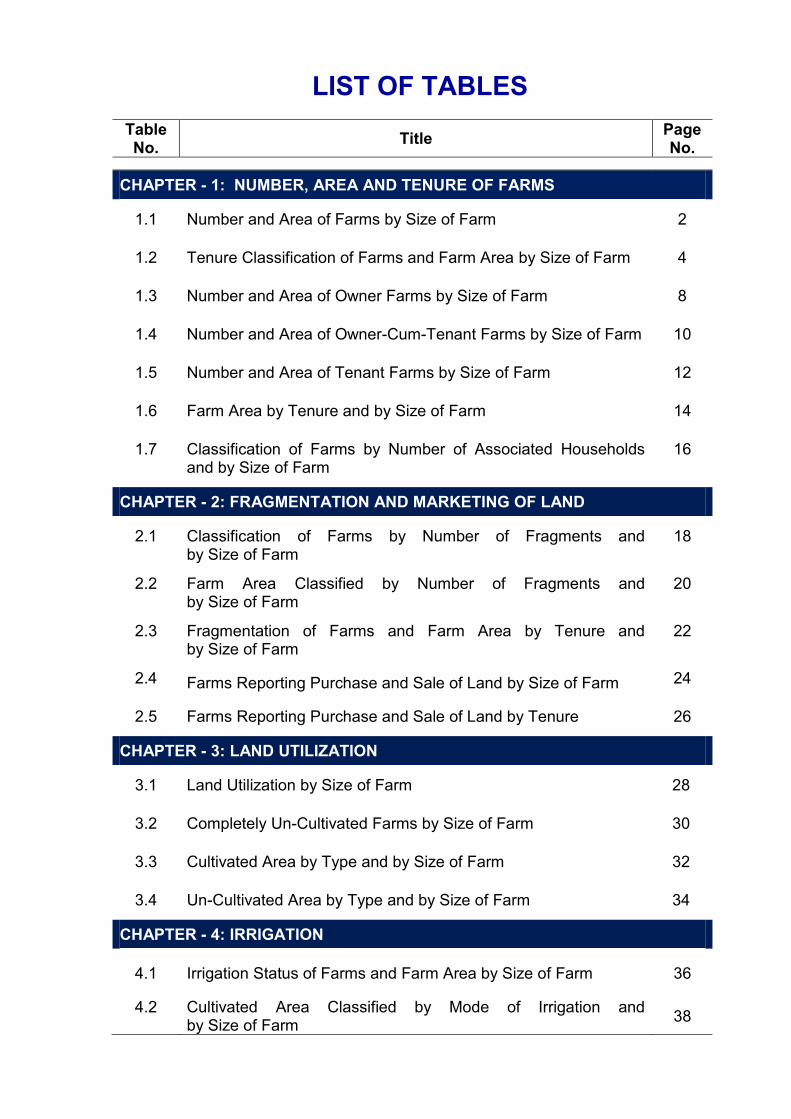
LIST OF TABLES
Table No. Title Page
No.
CHAPTER - 1: NUMBER, AREA AND TENURE OF FARMS
1.1 Number and Area of Farms by Size of Farm 2
1.2 Tenure Classification of Farms and Farm Area by Size of Farm 4
1.3 Number and Area of Owner Farms by Size of Farm 8
1.4 Number and Area of Owner-Cum-Tenant Farms by Size of Farm 10
1.5 Number and Area of Tenant Farms by Size of Farm 12
1.6 Farm Area by Tenure and by Size of Farm 14
1.7 Classification of Farms by Number of Associated Households and by Size of Farm
16
CHAPTER - 2: FRAGMENTATION AND MARKETING OF LAND
2.1 Classification of Farms by Number of Fragments and by Size of Farm
18
2.2 Farm Area Classified by Number of Fragments and by Size of Farm
20
2.3 Fragmentation of Farms and Farm Area by Tenure and by Size of Farm
22
2.4 Farms Reporting Purchase and Sale of Land by Size of Farm 24
2.5 Farms Reporting Purchase and Sale of Land by Tenure 26
CHAPTER - 3: LAND UTILIZATION
3.1 Land Utilization by Size of Farm 28
3.2 Completely Un-Cultivated Farms by Size of Farm 30
3.3 Cultivated Area by Type and by Size of Farm 32
3.4 Un-Cultivated Area by Type and by Size of Farm 34
CHAPTER - 4: IRRIGATION
4.1 Irrigation Status of Farms and Farm Area by Size of Farm 36
4.2 Cultivated Area Classified by Mode of Irrigation and by Size of Farm 38
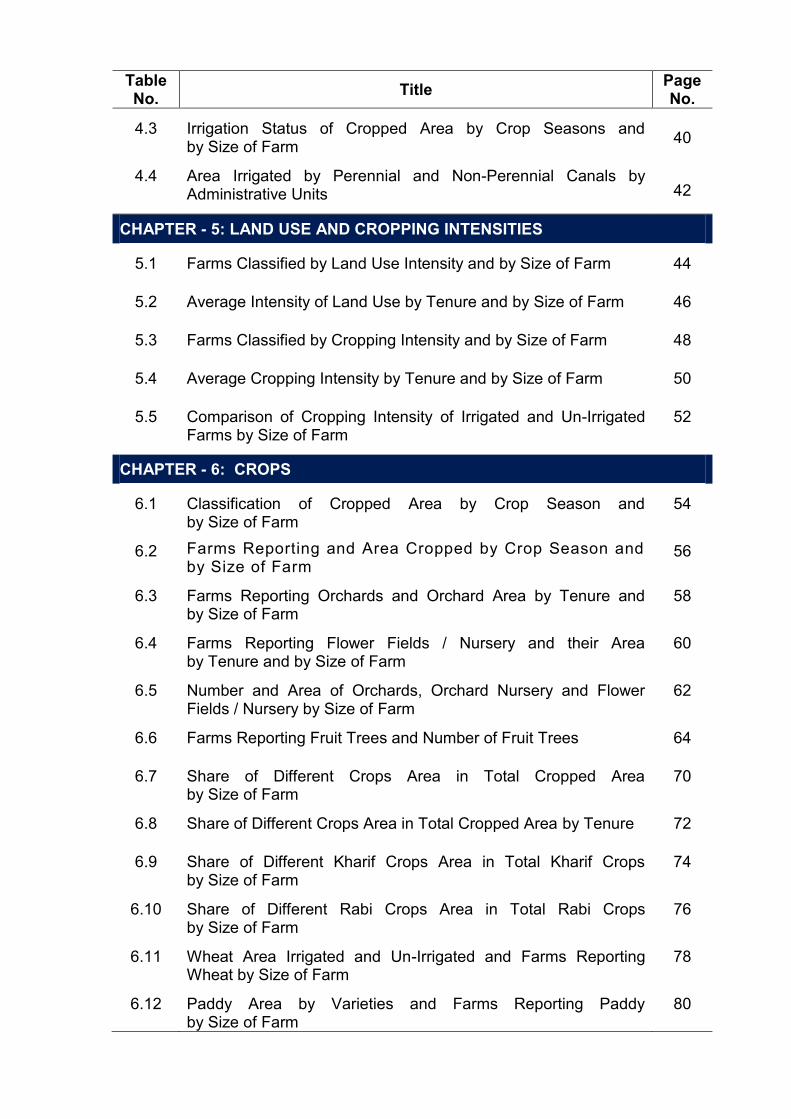
Table No. Title Page
No.
4.3 Irrigation Status of Cropped Area by Crop Seasons and by Size of Farm 40
4.4 Area Irrigated by Perennial and Non-Perennial Canals by Administrative Units 42
CHAPTER - 5: LAND USE AND CROPPING INTENSITIES
5.1 Farms Classified by Land Use Intensity and by Size of Farm 44
5.2 Average Intensity of Land Use by Tenure and by Size of Farm 46
5.3 Farms Classified by Cropping Intensity and by Size of Farm 48
5.4 Average Cropping Intensity by Tenure and by Size of Farm 50
5.5 Comparison of Cropping Intensity of Irrigated and Un-Irrigated Farms by Size of Farm
52
CHAPTER - 6: CROPS
6.1 Classification of Cropped Area by Crop Season and by Size of Farm
54
6.2 Farms Reporting and Area Cropped by Crop Season and by Size of Farm
56
6.3 Farms Reporting Orchards and Orchard Area by Tenure and by Size of Farm
58
6.4 Farms Reporting Flower Fields / Nursery and their Area by Tenure and by Size of Farm
60
6.5 Number and Area of Orchards, Orchard Nursery and Flower Fields / Nursery by Size of Farm
62
6.6 Farms Reporting Fruit Trees and Number of Fruit Trees 64
6.7 Share of Different Crops Area in Total Cropped Area by Size of Farm
70
6.8 Share of Different Crops Area in Total Cropped Area by Tenure 72
6.9 Share of Different Kharif Crops Area in Total Kharif Crops by Size of Farm
74
6.10 Share of Different Rabi Crops Area in Total Rabi Crops by Size of Farm
76
6.11 Wheat Area Irrigated and Un-Irrigated and Farms Reporting Wheat by Size of Farm
78
6.12 Paddy Area by Varieties and Farms Reporting Paddy by Size of Farm
80
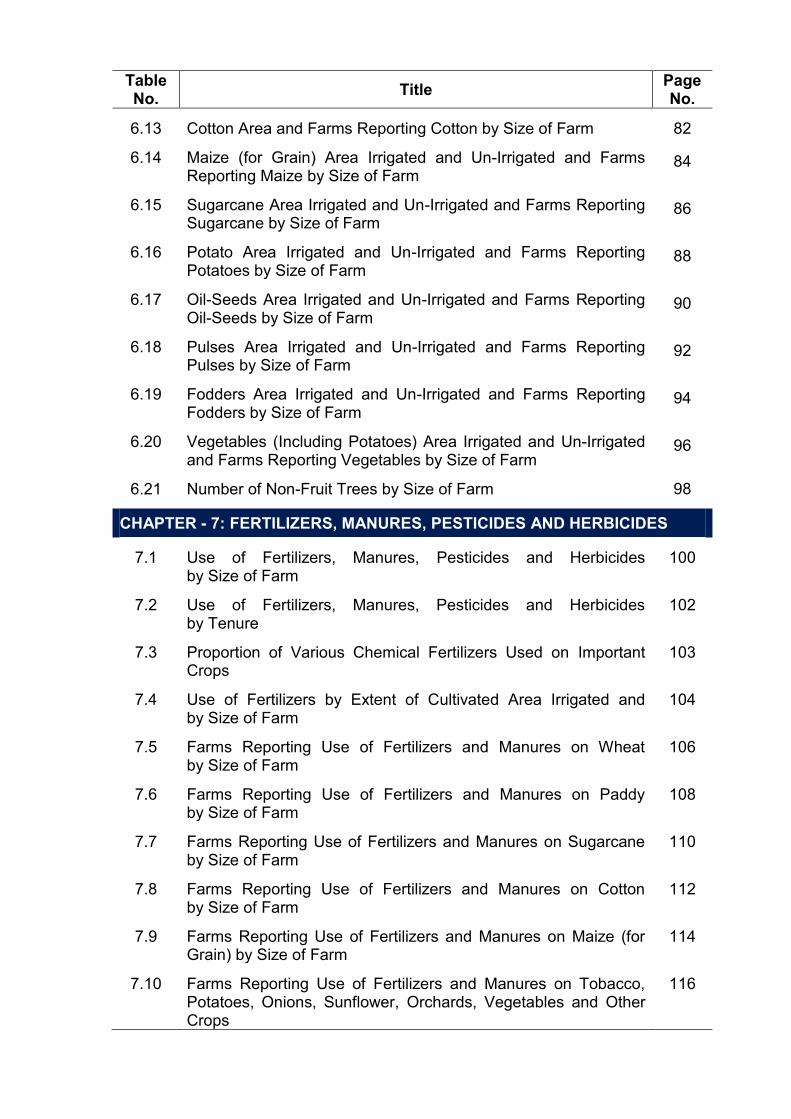
Table No. Title Page
No.
6.13 Cotton Area and Farms Reporting Cotton by Size of Farm 82
6.14 Maize (for Grain) Area Irrigated and Un-Irrigated and Farms Reporting Maize by Size of Farm
84
6.15 Sugarcane Area Irrigated and Un-Irrigated and Farms Reporting Sugarcane by Size of Farm
86
6.16 Potato Area Irrigated and Un-Irrigated and Farms Reporting Potatoes by Size of Farm
88
6.17 Oil-Seeds Area Irrigated and Un-Irrigated and Farms Reporting Oil-Seeds by Size of Farm
90
6.18 Pulses Area Irrigated and Un-Irrigated and Farms Reporting Pulses by Size of Farm
92
6.19 Fodders Area Irrigated and Un-Irrigated and Farms Reporting Fodders by Size of Farm
94
6.20 Vegetables (Including Potatoes) Area Irrigated and Un-Irrigated and Farms Reporting Vegetables by Size of Farm
96
6.21 Number of Non-Fruit Trees by Size of Farm 98
CHAPTER - 7: FERTILIZERS, MANURES, PESTICIDES AND HERBICIDES
7.1 Use of Fertilizers, Manures, Pesticides and Herbicides by Size of Farm
100
7.2 Use of Fertilizers, Manures, Pesticides and Herbicides by Tenure
102
7.3 Proportion of Various Chemical Fertilizers Used on Important Crops
103
7.4 Use of Fertilizers by Extent of Cultivated Area Irrigated and by Size of Farm
104
7.5 Farms Reporting Use of Fertilizers and Manures on Wheat by Size of Farm
106
7.6 Farms Reporting Use of Fertilizers and Manures on Paddy by Size of Farm
108
7.7 Farms Reporting Use of Fertilizers and Manures on Sugarcane by Size of Farm
110
7.8 Farms Reporting Use of Fertilizers and Manures on Cotton by Size of Farm
112
7.9 Farms Reporting Use of Fertilizers and Manures on Maize (for Grain) by Size of Farm
114
7.10 Farms Reporting Use of Fertilizers and Manures on Tobacco, Potatoes, Onions, Sunflower, Orchards, Vegetables and Other Crops
116
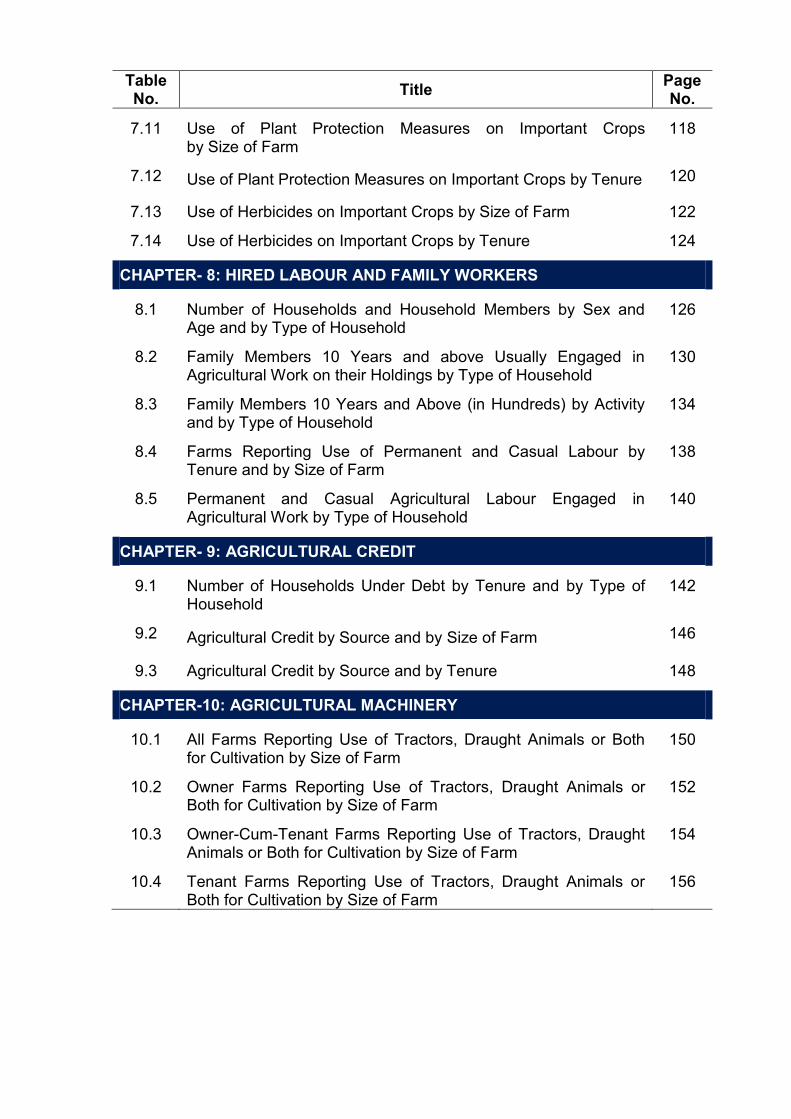
Table No. Title Page
No.
7.11 Use of Plant Protection Measures on Important Crops by Size of Farm
118
7.12 Use of Plant Protection Measures on Important Crops by Tenure 120
7.13 Use of Herbicides on Important Crops by Size of Farm 122
7.14 Use of Herbicides on Important Crops by Tenure 124
CHAPTER- 8: HIRED LABOUR AND FAMILY WORKERS
8.1 Number of Households and Household Members by Sex and Age and by Type of Household
126
8.2 Family Members 10 Years and above Usually Engaged in Agricultural Work on their Holdings by Type of Household
130
8.3 Family Members 10 Years and Above (in Hundreds) by Activity and by Type of Household
134
8.4 Farms Reporting Use of Permanent and Casual Labour by Tenure and by Size of Farm
138
8.5 Permanent and Casual Agricultural Labour Engaged in Agricultural Work by Type of Household
140
CHAPTER- 9: AGRICULTURAL CREDIT
9.1 Number of Households Under Debt by Tenure and by Type of Household
142
9.2 Agricultural Credit by Source and by Size of Farm 146
9.3 Agricultural Credit by Source and by Tenure 148
CHAPTER-10: AGRICULTURAL MACHINERY
10.1 All Farms Reporting Use of Tractors, Draught Animals or Both for Cultivation by Size of Farm
150
10.2 Owner Farms Reporting Use of Tractors, Draught Animals or Both for Cultivation by Size of Farm
152
10.3 Owner-Cum-Tenant Farms Reporting Use of Tractors, Draught Animals or Both for Cultivation by Size of Farm
154
10.4 Tenant Farms Reporting Use of Tractors, Draught Animals or Both for Cultivation by Size of Farm
156
Table No. Title Page
No.
10.5 Farms Reporting Use of Important Owned Agricultural Machinery by Size of Farm
158
10.6 Farms Reporting Use of Important Rented Agricultural Machinery by Size of Farm
160
10.7 Farms Reporting Non-Use of Important Agricultural Machinery by Size of Farm
162
CHAPTER - 11: LIVESTOCK
11.1 Farms Reporting Work Animals by Tenure and by Size of Farm 164
11.2 Relationship of Work Animals to Size of Farm 166
11.3 Livestock Population by Age and Sex 168
11.4 Number of Cattle and Buffaloes by Size of Herd 171
11.5 Number of Sheep and Goats by Size of Herd 172
11.6 Number of Cattle and Buffaloes by Category and by Type of Household
174
11.7 Number of Sheep and Goats by Category and by Type of Household
178
CHAPTER - 12: EDUCATION AND SOURCE OF INCOME OF HOUSEHOLD MEMBERS AND TYPE OF HOUSES
12.1 Farms Reporting Highest Education Level Among Family Members
182
12.2 Number of Households Reporting Residential Houses by Type of Occupancy and Structure and by Tenure
183
12.3 Education Level of Family Members (In Thousands) by Type of Household
184
12.4 Households (In Hundreds) Reporting Sources of Income Other Than Farming and Basic Source of Income by Type of Household
194
12.5 Number of Farm Households Reporting Residential Houses by Type of Occupancy and Structure and by Size of Farm
198
CHAPTER-13: LAND OWNERSHIP
13.1 Number and Area of Owners by Size of Area Owned 200
13.2 Operational Status of Land Ownership by Size of Area Owned 202
13.3 Reasons for Renting Out Owned Area by Size of Area Owned 204
INTRODUCTION .
Agriculture is an extremely important sector of Pakistan’s economy. It plays a vital role and lays down the foundation for economic development and growth in this country. Agriculture contributes more than 21 per cent to the Gross Domestic Product (GDP) and provides employment to 45 per cent of the total labour force of the country. It provides raw material to the industrial sector on one side and is a market of industrial products on the other side. In the export earnings, direct as well as indirect share of agriculture is very high. Thus, it is prudent to construe that agriculture plays a multidimensional role in the economy of Pakistan.
Almost 64 % of the population of Pakistan resides in rural areas and earns its livelihood, directly or indirectly, from agricultural activities e.g. crop cultivation, livestock rearing, labour in agriculture, agriculture input supply, transportation of agricultural output to the market etc. Therefore, development of agriculture is synonymous to the development of the country. The availability of timely, accurate and reliable data is precondition for sound agricultural planning and development. The data from the Agricultural Census thus provide a concrete basis from which the agriculture sector can ultimately develop through evidence-based policy designing. The Agricultural Census Organization (ACO) has conducted five Agricultural Censuses in Pakistan: 1960, 1972, 1980, 1990 and 2000. The present report is the sixth one in the series. The Agricultural Census 2010 was undertaken to fulfil the following objectives: OBJECTIVES 1. To generate basic information on the structure of agriculture.
2. To develop detailed basic information about the agricultural resources, state of
their utilization and to find out the degree of acceptability of modern farming practices among the farming community for the purpose of regional, provincial and national development, planning and research in the field of agriculture.
3. To collect information about livestock population. 4. To fulfil data needs of the international agencies like FAO which require the
country’s information for a worldwide study of agricultural resources in order to formulate international policies in matters relating to the supply of food and raw materials on sustainable basis.
LEGAL BASIS The defunct (now) Agricultural Census Act, 1958 ( Act No.XLI of 1958 ) provided the legal basis for census operations throughout the country. The Act made it binding on the Government of Pakistan for the collection of agricultural data and also on the respondents to cooperate with the census enumerators and to furnish information on or with respect to items specified in the said Act. At the same time, the Act assured the secrecy of the information supplied by the respondents. It also bound the interviewer and interviewee not to declare or use this information for any legal proceedings.
ADVISORY COMMITTEE The census taking exercise was guided by an Advisory Committee. This committee is comprised of about 50 official and non-official members drawn from the concerned Federal and Provincial Government Departments, Universities, Research Institutes, while non-official members come from the progressive farmers. The committee is also comprised of high-level government officials / technical experts from Gilgit Baltistan and Azad Jammu & Kashmir. TYPE & GEOGRAPHIC COVERAGE As per previous practice and approved procedures, the Agricultural Census 2010 was sample based. The sample design, however, varied for different regions of the country in accordance with the ground realities.
This census covered the entire country, i.e., Khyber Pakhtunkhwa (including Provincially and Federally Administered Tribal Areas, Frontier Regions and Agencies), Punjab (including Islamabad district), Sindh and Balochistan provinces. The geographic coverage was also extended to Gilgit Baltistan and Azad Jammu & Kashmir, each as a separate entity. SCOPE OF THE CENSUS The scope refers to the range / subjects / items covered by the census. For Agricultural Census 2010 the scope with reference to farm area was restricted to the agricultural farm(s) / holding(s) held and or operated by the Government or by private household(s), individually or collectively or under corporate arrangement at the time of census enumeration. Consequently, the undistributed government lands other than government farms, undistributed portion of the lands resumed by the Government under land reforms, built up areas, land under roads, rails, ravines, rivers, canals, government forests, parks, lakes, water bodies, shallow lands, hills and mountains, etc. falling under the category of non-farm area are outside the scope of the census.
The scope of the present census, as finally approved, included the collection of data on type, size, tenure and parcels of farms, land utilization, irrigation, area under crops and orchards, number of fruit and non-fruit trees, use of manures, fertilizers and plant protection measures, use of agricultural machinery, livestock population, loan and its sources, casual and permanent hired agricultural labour, household members by age, sex, qualification and their contribution towards agriculture, type of residential structures, economic activities of household members and their main source of income. To highlight the scope of census, details of total area, farm area, non-farm area and their further classifications are shown on the next page in a graph for the convenience of readers:
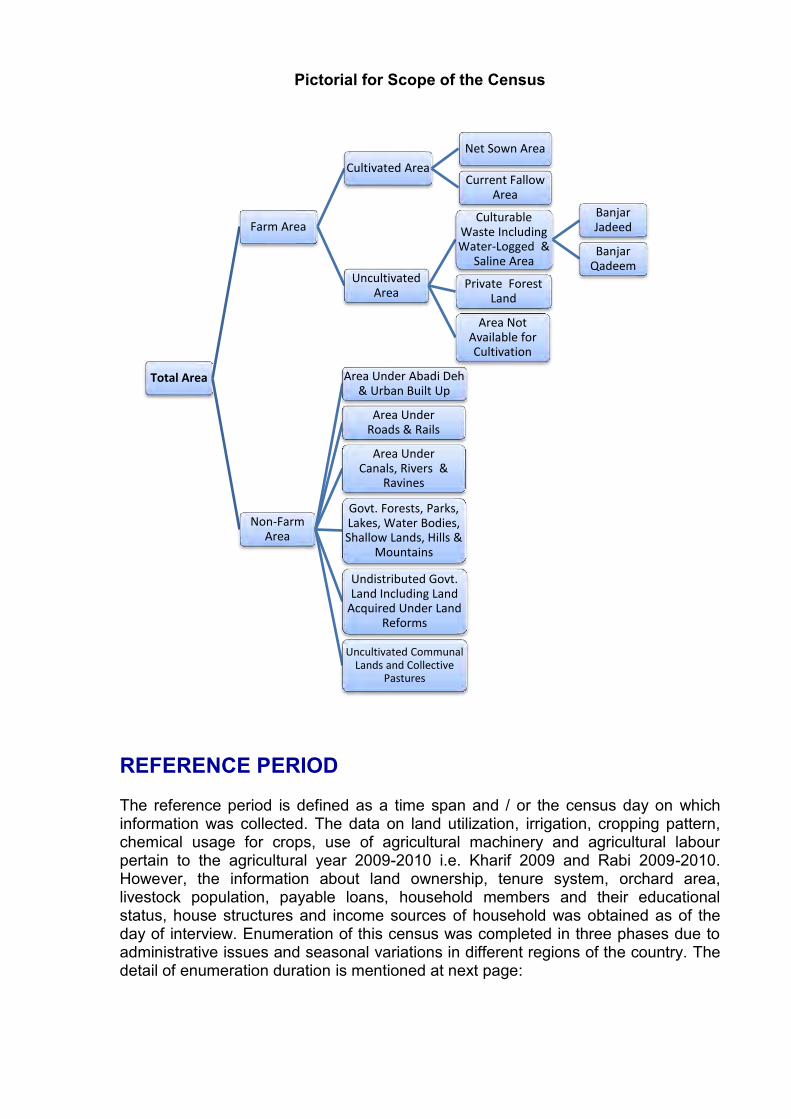
Pictorial for Scope of the Census
REFERENCE PERIOD The reference period is defined as a time span and / or the census day on which information was collected. The data on land utilization, irrigation, cropping pattern, chemical usage for crops, use of agricultural machinery and agricultural labour pertain to the agricultural year 2009-2010 i.e. Kharif 2009 and Rabi 2009-2010. However, the information about land ownership, tenure system, orchard area, livestock population, payable loans, household members and their educational status, house structures and income sources of household was obtained as of the day of interview. Enumeration of this census was completed in three phases due to administrative issues and seasonal variations in different regions of the country. The detail of enumeration duration is mentioned at next page:
Total Area
Farm Area
Cultivated Area
Net Sown Area
Current Fallow Area
Uncultivated Area
Culturable Waste Including Water-Logged &
Saline Area
Banjar Jadeed
Banjar Qadeem
Private Forest Land
Area Not Available for Cultivation
Non-Farm Area
Area Under Abadi Deh & Urban Built Up
Area Under Roads & Rails
Area Under Canals, Rivers &
Ravines
Govt. Forests, Parks, Lakes, Water Bodies, Shallow Lands, Hills &
Mountains
Undistributed Govt. Land Including Land
Acquired Under Land Reforms
Uncultivated Communal Lands and Collective
Pastures
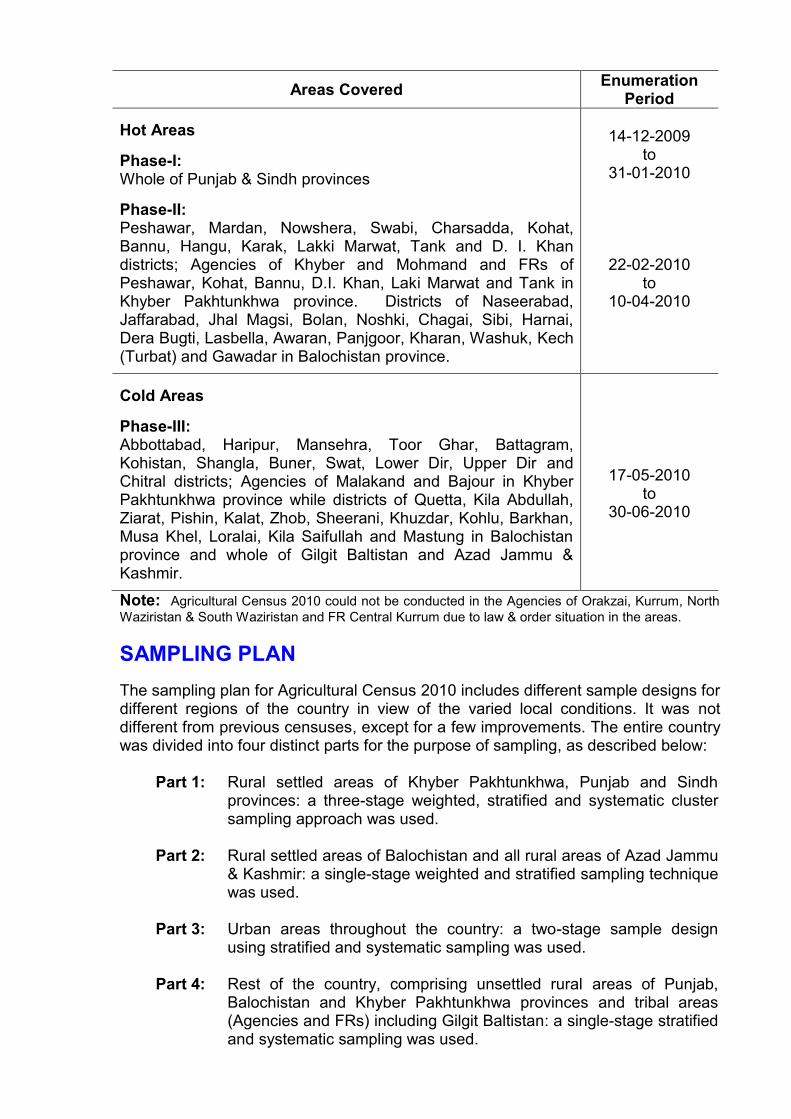
Areas Covered Enumeration Period
Hot Areas Phase-I: Whole of Punjab & Sindh provinces Phase-II: Peshawar, Mardan, Nowshera, Swabi, Charsadda, Kohat, Bannu, Hangu, Karak, Lakki Marwat, Tank and D. I. Khan districts; Agencies of Khyber and Mohmand and FRs of Peshawar, Kohat, Bannu, D.I. Khan, Laki Marwat and Tank in Khyber Pakhtunkhwa province. Districts of Naseerabad, Jaffarabad, Jhal Magsi, Bolan, Noshki, Chagai, Sibi, Harnai, Dera Bugti, Lasbella, Awaran, Panjgoor, Kharan, Washuk, Kech (Turbat) and Gawadar in Balochistan province.
14-12-2009
to 31-01-2010
22-02-2010 to
10-04-2010
Cold Areas Phase-III: Abbottabad, Haripur, Mansehra, Toor Ghar, Battagram, Kohistan, Shangla, Buner, Swat, Lower Dir, Upper Dir and Chitral districts; Agencies of Malakand and Bajour in Khyber Pakhtunkhwa province while districts of Quetta, Kila Abdullah, Ziarat, Pishin, Kalat, Zhob, Sheerani, Khuzdar, Kohlu, Barkhan, Musa Khel, Loralai, Kila Saifullah and Mastung in Balochistan province and whole of Gilgit Baltistan and Azad Jammu & Kashmir.
17-05-2010
to 30-06-2010
Note: Agricultural Census 2010 could not be conducted in the Agencies of Orakzai, Kurrum, North Waziristan & South Waziristan and FR Central Kurrum due to law & order situation in the areas. SAMPLING PLAN The sampling plan for Agricultural Census 2010 includes different sample designs for different regions of the country in view of the varied local conditions. It was not different from previous censuses, except for a few improvements. The entire country was divided into four distinct parts for the purpose of sampling, as described below:
Part 1: Rural settled areas of Khyber Pakhtunkhwa, Punjab and Sindh
provinces: a three-stage weighted, stratified and systematic cluster sampling approach was used.
Part 2: Rural settled areas of Balochistan and all rural areas of Azad Jammu
& Kashmir: a single-stage weighted and stratified sampling technique was used.
Part 3: Urban areas throughout the country: a two-stage sample design
using stratified and systematic sampling was used.
Part 4: Rest of the country, comprising unsettled rural areas of Punjab, Balochistan and Khyber Pakhtunkhwa provinces and tribal areas (Agencies and FRs) including Gilgit Baltistan: a single-stage stratified and systematic sampling was used.
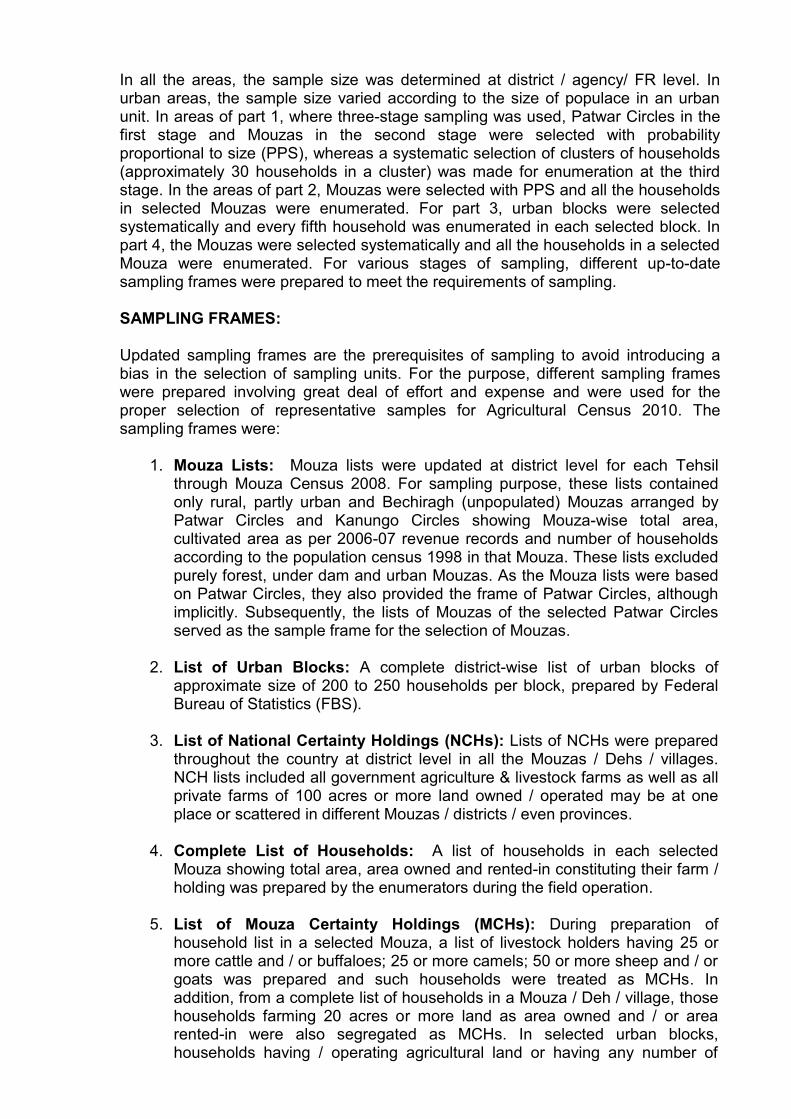
In all the areas, the sample size was determined at district / agency/ FR level. In urban areas, the sample size varied according to the size of populace in an urban unit. In areas of part 1, where three-stage sampling was used, Patwar Circles in the first stage and Mouzas in the second stage were selected with probability proportional to size (PPS), whereas a systematic selection of clusters of households (approximately 30 households in a cluster) was made for enumeration at the third stage. In the areas of part 2, Mouzas were selected with PPS and all the households in selected Mouzas were enumerated. For part 3, urban blocks were selected systematically and every fifth household was enumerated in each selected block. In part 4, the Mouzas were selected systematically and all the households in a selected Mouza were enumerated. For various stages of sampling, different up-to-date sampling frames were prepared to meet the requirements of sampling. SAMPLING FRAMES: Updated sampling frames are the prerequisites of sampling to avoid introducing a bias in the selection of sampling units. For the purpose, different sampling frames were prepared involving great deal of effort and expense and were used for the proper selection of representative samples for Agricultural Census 2010. The sampling frames were:
1. Mouza Lists: Mouza lists were updated at district level for each Tehsil through Mouza Census 2008. For sampling purpose, these lists contained only rural, partly urban and Bechiragh (unpopulated) Mouzas arranged by Patwar Circles and Kanungo Circles showing Mouza-wise total area, cultivated area as per 2006-07 revenue records and number of households according to the population census 1998 in that Mouza. These lists excluded purely forest, under dam and urban Mouzas. As the Mouza lists were based on Patwar Circles, they also provided the frame of Patwar Circles, although implicitly. Subsequently, the lists of Mouzas of the selected Patwar Circles served as the sample frame for the selection of Mouzas.
2. List of Urban Blocks: A complete district-wise list of urban blocks of
approximate size of 200 to 250 households per block, prepared by Federal Bureau of Statistics (FBS).
3. List of National Certainty Holdings (NCHs): Lists of NCHs were prepared throughout the country at district level in all the Mouzas / Dehs / villages. NCH lists included all government agriculture & livestock farms as well as all private farms of 100 acres or more land owned / operated may be at one place or scattered in different Mouzas / districts / even provinces.
4. Complete List of Households: A list of households in each selected
Mouza showing total area, area owned and rented-in constituting their farm / holding was prepared by the enumerators during the field operation.
5. List of Mouza Certainty Holdings (MCHs): During preparation of household list in a selected Mouza, a list of livestock holders having 25 or more cattle and / or buffaloes; 25 or more camels; 50 or more sheep and / or goats was prepared and such households were treated as MCHs. In addition, from a complete list of households in a Mouza / Deh / village, those households farming 20 acres or more land as area owned and / or area rented-in were also segregated as MCHs. In selected urban blocks, households having / operating agricultural land or having any number of
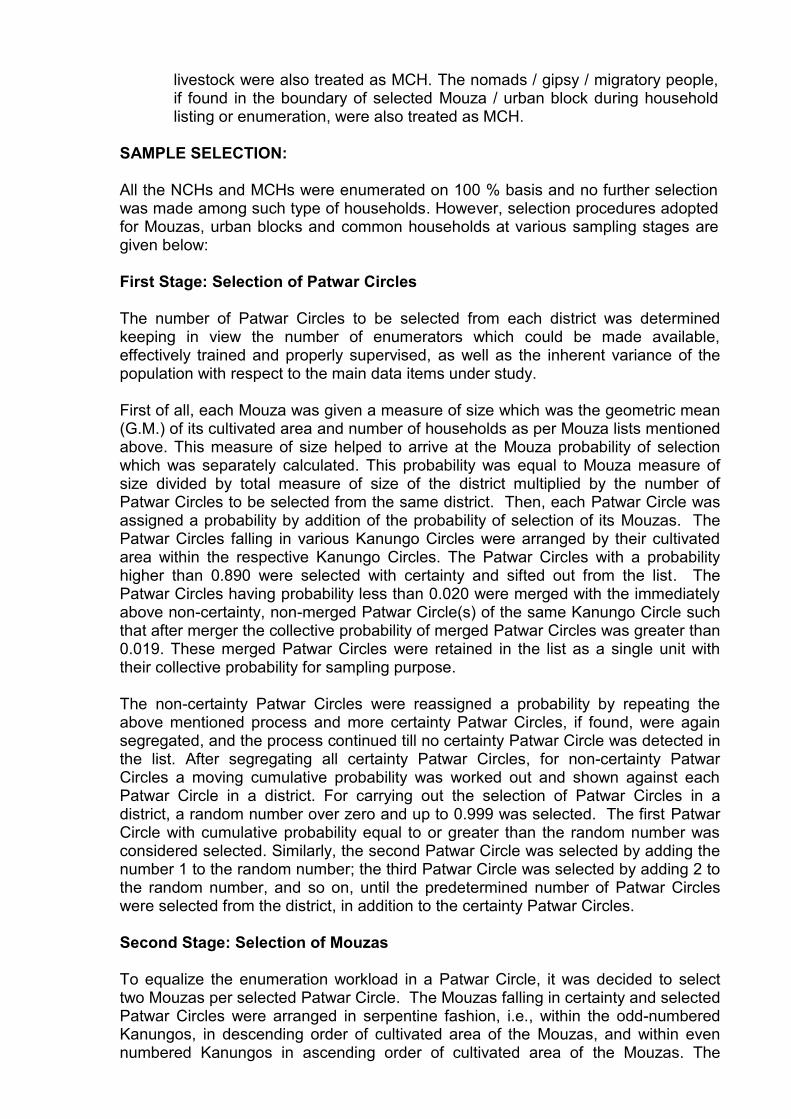
livestock were also treated as MCH. The nomads / gipsy / migratory people, if found in the boundary of selected Mouza / urban block during household listing or enumeration, were also treated as MCH.
SAMPLE SELECTION: All the NCHs and MCHs were enumerated on 100 % basis and no further selection was made among such type of households. However, selection procedures adopted for Mouzas, urban blocks and common households at various sampling stages are given below: First Stage: Selection of Patwar Circles The number of Patwar Circles to be selected from each district was determined keeping in view the number of enumerators which could be made available, effectively trained and properly supervised, as well as the inherent variance of the population with respect to the main data items under study. First of all, each Mouza was given a measure of size which was the geometric mean (G.M.) of its cultivated area and number of households as per Mouza lists mentioned above. This measure of size helped to arrive at the Mouza probability of selection which was separately calculated. This probability was equal to Mouza measure of size divided by total measure of size of the district multiplied by the number of Patwar Circles to be selected from the same district. Then, each Patwar Circle was assigned a probability by addition of the probability of selection of its Mouzas. The Patwar Circles falling in various Kanungo Circles were arranged by their cultivated area within the respective Kanungo Circles. The Patwar Circles with a probability higher than 0.890 were selected with certainty and sifted out from the list. The Patwar Circles having probability less than 0.020 were merged with the immediately above non-certainty, non-merged Patwar Circle(s) of the same Kanungo Circle such that after merger the collective probability of merged Patwar Circles was greater than 0.019. These merged Patwar Circles were retained in the list as a single unit with their collective probability for sampling purpose. The non-certainty Patwar Circles were reassigned a probability by repeating the above mentioned process and more certainty Patwar Circles, if found, were again segregated, and the process continued till no certainty Patwar Circle was detected in the list. After segregating all certainty Patwar Circles, for non-certainty Patwar Circles a moving cumulative probability was worked out and shown against each Patwar Circle in a district. For carrying out the selection of Patwar Circles in a district, a random number over zero and up to 0.999 was selected. The first Patwar Circle with cumulative probability equal to or greater than the random number was considered selected. Similarly, the second Patwar Circle was selected by adding the number 1 to the random number; the third Patwar Circle was selected by adding 2 to the random number, and so on, until the predetermined number of Patwar Circles were selected from the district, in addition to the certainty Patwar Circles. Second Stage: Selection of Mouzas To equalize the enumeration workload in a Patwar Circle, it was decided to select two Mouzas per selected Patwar Circle. The Mouzas falling in certainty and selected Patwar Circles were arranged in serpentine fashion, i.e., within the odd-numbered Kanungos, in descending order of cultivated area of the Mouzas, and within even numbered Kanungos in ascending order of cultivated area of the Mouzas. The
method employed at the first stage was repeated at Patwar Circle level for segregating the certainty Mouzas and also for the selection of the non-certainty Mouzas. Like the Patwar Circles with small probability of selection, the Mouzas with small probabilities were merged together by applying the principle mentioned in the first stage and treated as one Mouza for sampling purposes. However, only two Mouzas from one Patwar Circle were selected whether the selected Mouza was certainty or non-certainty. In the case where only one Mouza was found in a Patwar Circle, the same Mouza was selected with probability 1. A list of selected Mouzas and systematically selected urban blocks (without any weight) was prepared carefully at the district level for further use. Sub Stage: Sector Selection for Big Mouzas Only According to the list of selected Mouzas, all Mouzas with 900 or more households were divided into sectors as described below: During the field operation, listing and enumeration of so many households was expected to overburden the enumerators. Therefore, these selected Mouzas were termed as big Mouzas and a sub-stage of sector selection was introduced. Big Mouzas were divided into convenient number of sectors, each having approximately 300 – 500 households. The number of households in a sector was treated as the measure of size to work out the probability of selection of that sector which was subsequently incorporated in the probability of selection of that big Mouza and accordingly used for working out the census estimates. One sector from each big Mouza was selected with equal probability. The process of selecting a sector from big Mouzas could be treated as another stage in multistage sampling. For big Mouzas, a selected sector was treated as a full-fledged Mouza for settled areas and a full-fledged village / Killi / Basti for unsettled areas of the country. Third Stage: Selection of Clusters of Households A systematic selection of clusters of approximately 30 households, was made from list of households (Form-1) prepared by the enumerators during field operation. The number of clusters to be selected, with a minimum of two from each Mouza, was determined with regard to raising factor of the Mouza and the pre-fixed overall raising factor at cluster level for a particular Mouza. The limit of overall raising factor was fixed at 25 for all the rural settled areas. The ultimate sample of households selected for the census was as follows:
i. The households in the selected clusters at final stage of selection.
ii. In selected urban blocks, every fifth household.
iii. All the households located in the selected villages / Basties / Killies of unsettled areas, including the whole of Gilgit Baltistan.
iv. All households located in selected Mouzas of Azad Jammu & Kashmir and
settled areas of Balochistan.
v. The households located in the selected Mouzas / urban blocks designated as Mouza Certainty Holdings.
vi. The households located anywhere in the country designated as National Certainty Holdings.
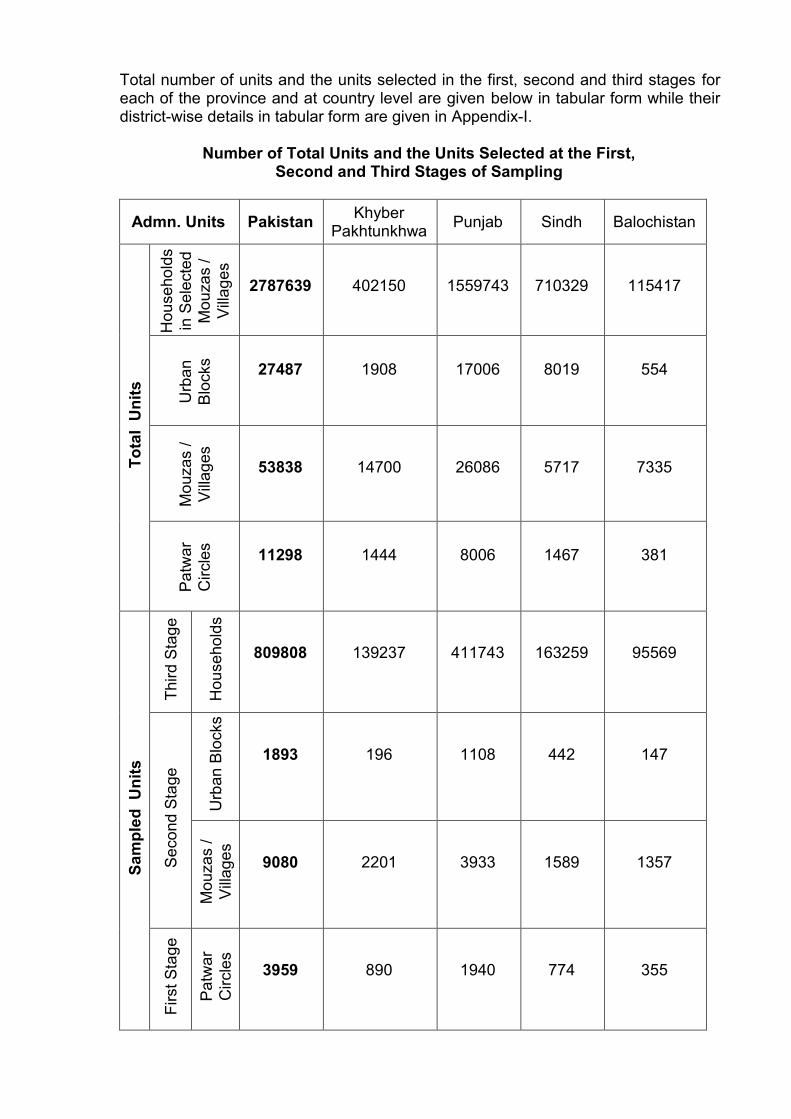
Total number of units and the units selected in the first, second and third stages for each of the province and at country level are given below in tabular form while their district-wise details in tabular form are given in Appendix-I.
Number of Total Units and the Units Selected at the First, Second and Third Stages of Sampling
Admn. Units Pakistan Khyber Pakhtunkhwa Punjab Sindh Balochistan
Tota
l U
nits
Hou
seho
lds
in S
elec
ted
Mou
zas
/ V
illage
s
2787639 402150 1559743 710329 115417
Urb
an
Blo
cks 27487 1908 17006 8019 554
Mou
zas
/ V
illage
s
53838 14700 26086 5717 7335
Pat
war
C
ircle
s 11298 1444 8006 1467 381
Sam
pled
Uni
ts
Third
Sta
ge
Hou
seho
lds
809808 139237 411743 163259 95569
Sec
ond
Stag
e
Urb
an B
lock
s
1893 196 1108 442 147
Mou
zas
/ V
illage
s
9080 2201 3933 1589 1357
Firs
t Sta
ge
Pat
war
C
ircle
s
3959 890 1940 774 355
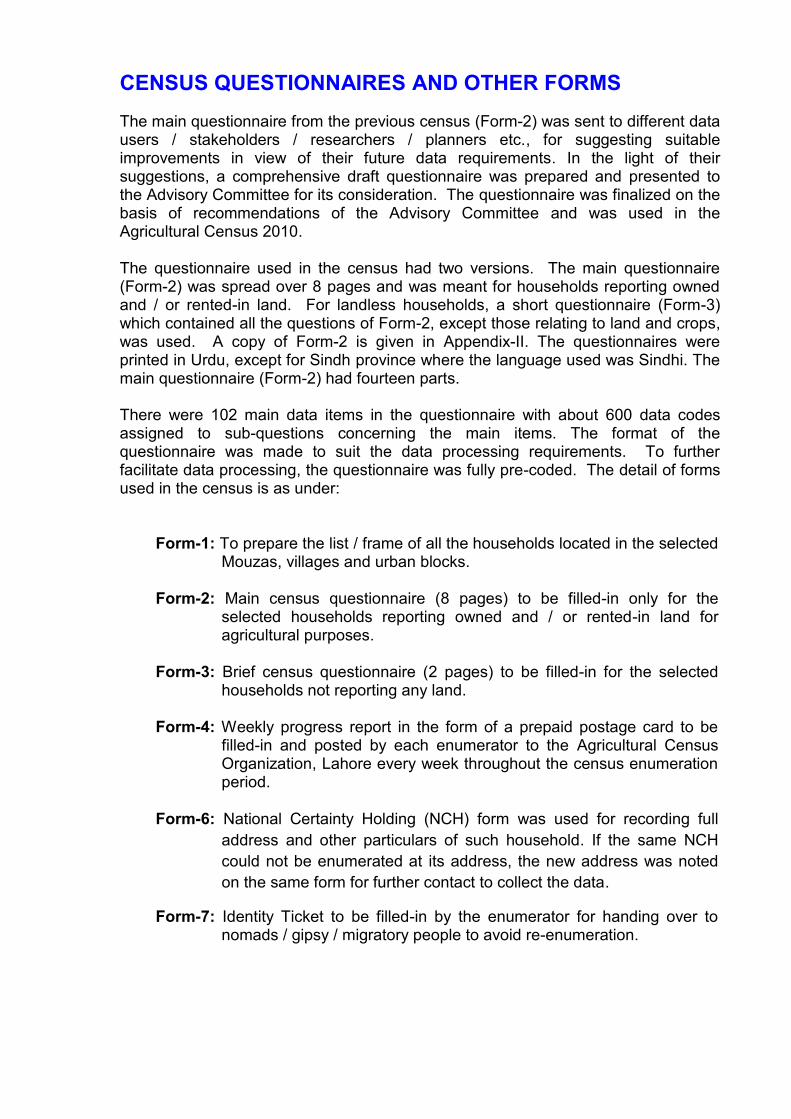
CENSUS QUESTIONNAIRES AND OTHER FORMS
The main questionnaire from the previous census (Form-2) was sent to different data users / stakeholders / researchers / planners etc., for suggesting suitable improvements in view of their future data requirements. In the light of their suggestions, a comprehensive draft questionnaire was prepared and presented to the Advisory Committee for its consideration. The questionnaire was finalized on the basis of recommendations of the Advisory Committee and was used in the Agricultural Census 2010. The questionnaire used in the census had two versions. The main questionnaire (Form-2) was spread over 8 pages and was meant for households reporting owned and / or rented-in land. For landless households, a short questionnaire (Form-3) which contained all the questions of Form-2, except those relating to land and crops, was used. A copy of Form-2 is given in Appendix-II. The questionnaires were printed in Urdu, except for Sindh province where the language used was Sindhi. The main questionnaire (Form-2) had fourteen parts. There were 102 main data items in the questionnaire with about 600 data codes assigned to sub-questions concerning the main items. The format of the questionnaire was made to suit the data processing requirements. To further facilitate data processing, the questionnaire was fully pre-coded. The detail of forms used in the census is as under:
Form-1: To prepare the list / frame of all the households located in the selected Mouzas, villages and urban blocks.
Form-2: Main census questionnaire (8 pages) to be filled-in only for the
selected households reporting owned and / or rented-in land for agricultural purposes.
Form-3: Brief census questionnaire (2 pages) to be filled-in for the selected
households not reporting any land. Form-4: Weekly progress report in the form of a prepaid postage card to be
filled-in and posted by each enumerator to the Agricultural Census Organization, Lahore every week throughout the census enumeration period.
Form-6: National Certainty Holding (NCH) form was used for recording full
address and other particulars of such household. If the same NCH could not be enumerated at its address, the new address was noted on the same form for further contact to collect the data.
Form-7: Identity Ticket to be filled-in by the enumerator for handing over to nomads / gipsy / migratory people to avoid re-enumeration.
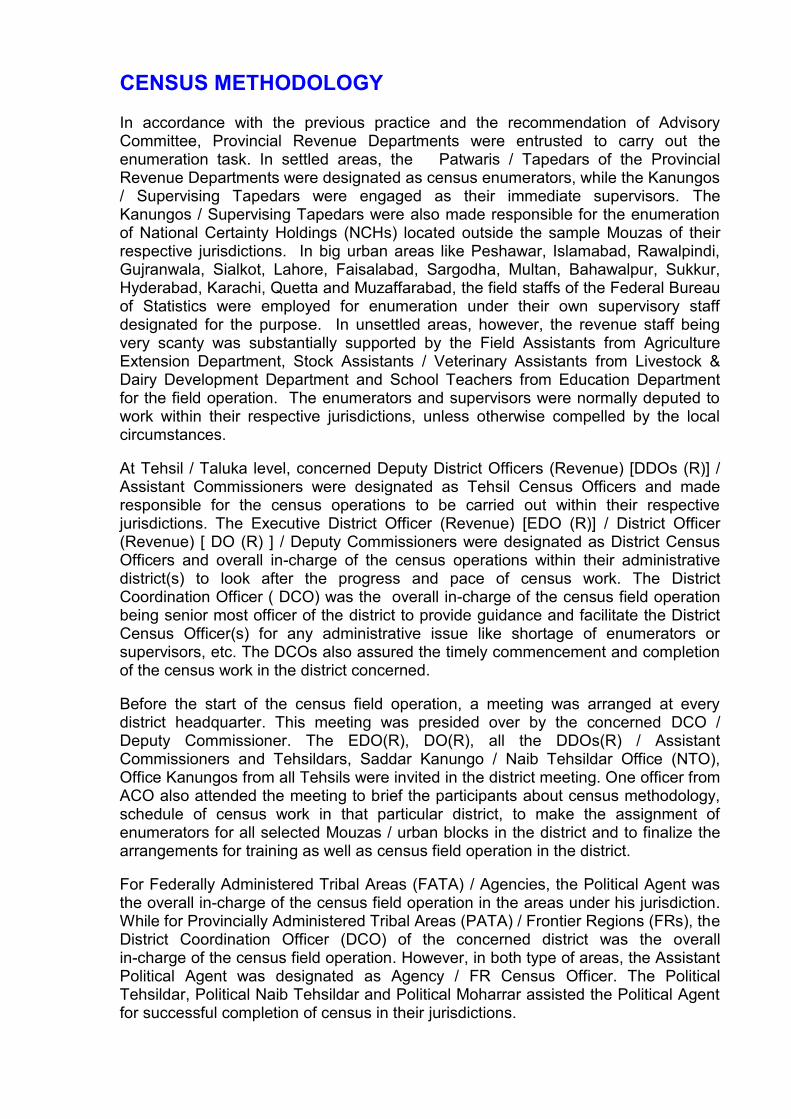
CENSUS METHODOLOGY In accordance with the previous practice and the recommendation of Advisory Committee, Provincial Revenue Departments were entrusted to carry out the enumeration task. In settled areas, the Patwaris / Tapedars of the Provincial Revenue Departments were designated as census enumerators, while the Kanungos / Supervising Tapedars were engaged as their immediate supervisors. The Kanungos / Supervising Tapedars were also made responsible for the enumeration of National Certainty Holdings (NCHs) located outside the sample Mouzas of their respective jurisdictions. In big urban areas like Peshawar, Islamabad, Rawalpindi, Gujranwala, Sialkot, Lahore, Faisalabad, Sargodha, Multan, Bahawalpur, Sukkur, Hyderabad, Karachi, Quetta and Muzaffarabad, the field staffs of the Federal Bureau of Statistics were employed for enumeration under their own supervisory staff designated for the purpose. In unsettled areas, however, the revenue staff being very scanty was substantially supported by the Field Assistants from Agriculture Extension Department, Stock Assistants / Veterinary Assistants from Livestock & Dairy Development Department and School Teachers from Education Department for the field operation. The enumerators and supervisors were normally deputed to work within their respective jurisdictions, unless otherwise compelled by the local circumstances. At Tehsil / Taluka level, concerned Deputy District Officers (Revenue) [DDOs (R)] / Assistant Commissioners were designated as Tehsil Census Officers and made responsible for the census operations to be carried out within their respective jurisdictions. The Executive District Officer (Revenue) [EDO (R)] / District Officer (Revenue) [ DO (R) ] / Deputy Commissioners were designated as District Census Officers and overall in-charge of the census operations within their administrative district(s) to look after the progress and pace of census work. The District Coordination Officer ( DCO) was the overall in-charge of the census field operation being senior most officer of the district to provide guidance and facilitate the District Census Officer(s) for any administrative issue like shortage of enumerators or supervisors, etc. The DCOs also assured the timely commencement and completion of the census work in the district concerned. Before the start of the census field operation, a meeting was arranged at every district headquarter. This meeting was presided over by the concerned DCO / Deputy Commissioner. The EDO(R), DO(R), all the DDOs(R) / Assistant Commissioners and Tehsildars, Saddar Kanungo / Naib Tehsildar Office (NTO), Office Kanungos from all Tehsils were invited in the district meeting. One officer from ACO also attended the meeting to brief the participants about census methodology, schedule of census work in that particular district, to make the assignment of enumerators for all selected Mouzas / urban blocks in the district and to finalize the arrangements for training as well as census field operation in the district. For Federally Administered Tribal Areas (FATA) / Agencies, the Political Agent was the overall in-charge of the census field operation in the areas under his jurisdiction. While for Provincially Administered Tribal Areas (PATA) / Frontier Regions (FRs), the District Coordination Officer (DCO) of the concerned district was the overall in-charge of the census field operation. However, in both type of areas, the Assistant Political Agent was designated as Agency / FR Census Officer. The Political Tehsildar, Political Naib Tehsildar and Political Moharrar assisted the Political Agent for successful completion of census in their jurisdictions.
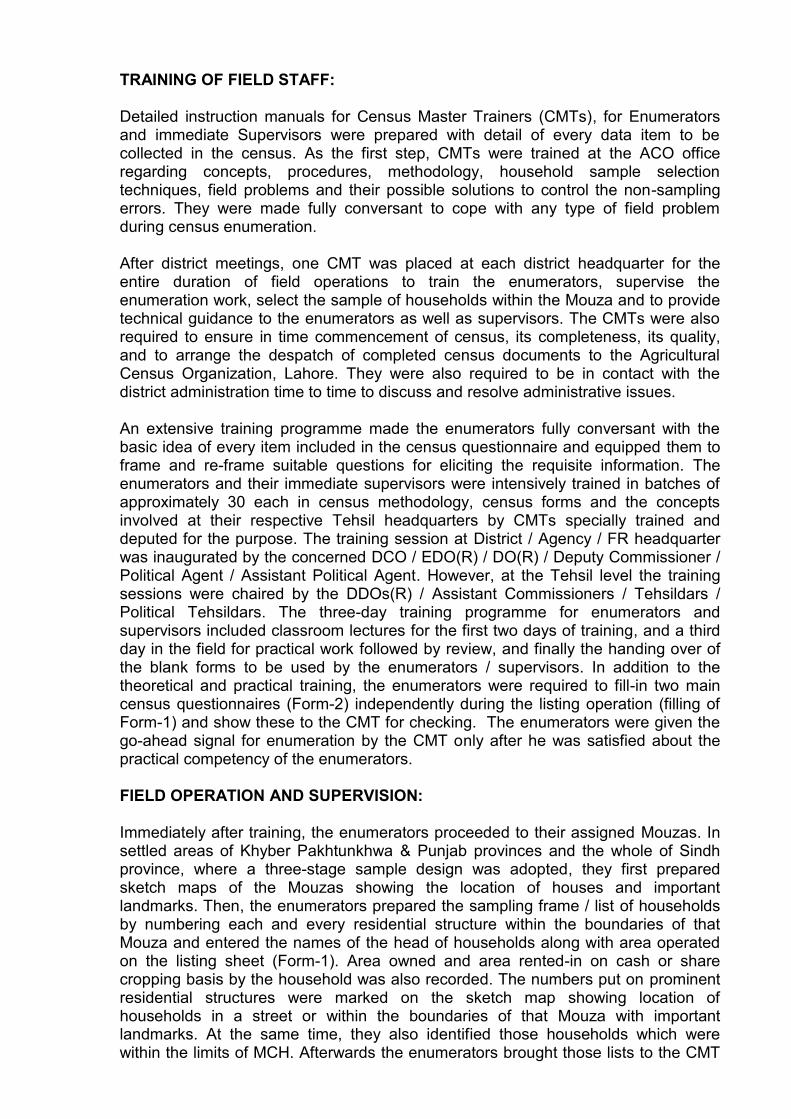
TRAINING OF FIELD STAFF: Detailed instruction manuals for Census Master Trainers (CMTs), for Enumerators and immediate Supervisors were prepared with detail of every data item to be collected in the census. As the first step, CMTs were trained at the ACO office regarding concepts, procedures, methodology, household sample selection techniques, field problems and their possible solutions to control the non-sampling errors. They were made fully conversant to cope with any type of field problem during census enumeration.
After district meetings, one CMT was placed at each district headquarter for the entire duration of field operations to train the enumerators, supervise the enumeration work, select the sample of households within the Mouza and to provide technical guidance to the enumerators as well as supervisors. The CMTs were also required to ensure in time commencement of census, its completeness, its quality, and to arrange the despatch of completed census documents to the Agricultural Census Organization, Lahore. They were also required to be in contact with the district administration time to time to discuss and resolve administrative issues.
An extensive training programme made the enumerators fully conversant with the basic idea of every item included in the census questionnaire and equipped them to frame and re-frame suitable questions for eliciting the requisite information. The enumerators and their immediate supervisors were intensively trained in batches of approximately 30 each in census methodology, census forms and the concepts involved at their respective Tehsil headquarters by CMTs specially trained and deputed for the purpose. The training session at District / Agency / FR headquarter was inaugurated by the concerned DCO / EDO(R) / DO(R) / Deputy Commissioner / Political Agent / Assistant Political Agent. However, at the Tehsil level the training sessions were chaired by the DDOs(R) / Assistant Commissioners / Tehsildars / Political Tehsildars. The three-day training programme for enumerators and supervisors included classroom lectures for the first two days of training, and a third day in the field for practical work followed by review, and finally the handing over of the blank forms to be used by the enumerators / supervisors. In addition to the theoretical and practical training, the enumerators were required to fill-in two main census questionnaires (Form-2) independently during the listing operation (filling of Form-1) and show these to the CMT for checking. The enumerators were given the go-ahead signal for enumeration by the CMT only after he was satisfied about the practical competency of the enumerators. FIELD OPERATION AND SUPERVISION: Immediately after training, the enumerators proceeded to their assigned Mouzas. In settled areas of Khyber Pakhtunkhwa & Punjab provinces and the whole of Sindh province, where a three-stage sample design was adopted, they first prepared sketch maps of the Mouzas showing the location of houses and important landmarks. Then, the enumerators prepared the sampling frame / list of households by numbering each and every residential structure within the boundaries of that Mouza and entered the names of the head of households along with area operated on the listing sheet (Form-1). Area owned and area rented-in on cash or share cropping basis by the household was also recorded. The numbers put on prominent residential structures were marked on the sketch map showing location of households in a street or within the boundaries of that Mouza with important landmarks. At the same time, they also identified those households which were within the limits of MCH. Afterwards the enumerators brought those lists to the CMT
at Tehsil / district headquarters for selection of households for detailed interviews. After getting identification of selected households by the CMT, the enumerators again went to the concerned areas to collect information through face-to-face interviews with the heads of households. This information was recorded on Form-2 (households operating agricultural land) or Form-3 (households not operating agricultural land). In unsettled areas of Khyber Pakhtunkhwa & Punjab provinces, the whole of Balochistan province, Gilgit Baltistan and Azad Jammu & Kashmir, where a single-stage sample design was adopted, listing (filling of Form-1) and enumeration work (filling of Form-2 / Form-3) was done side-by-side, because all the households in selected Mouzas / villages / Killies / Basties were enumerated. However, in all the selected urban blocks located anywhere in the country, every fifth household was enumerated in addition to all the households having land or livestock. The requisite information in the questionnaire for census purposes was collected through direct interview with the head of the selected household or, in case of his absence, with a very close associate of the head of the selected household.
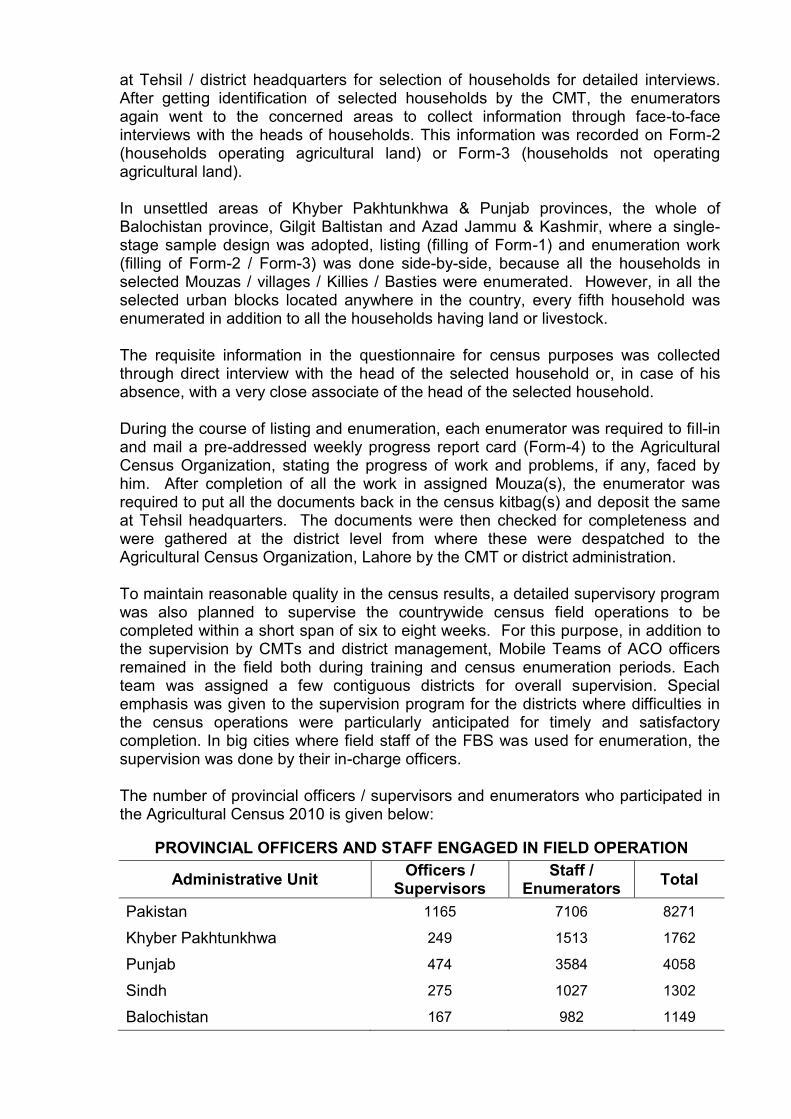
During the course of listing and enumeration, each enumerator was required to fill-in and mail a pre-addressed weekly progress report card (Form-4) to the Agricultural Census Organization, stating the progress of work and problems, if any, faced by him. After completion of all the work in assigned Mouza(s), the enumerator was required to put all the documents back in the census kitbag(s) and deposit the same at Tehsil headquarters. The documents were then checked for completeness and were gathered at the district level from where these were despatched to the Agricultural Census Organization, Lahore by the CMT or district administration. To maintain reasonable quality in the census results, a detailed supervisory program was also planned to supervise the countrywide census field operations to be completed within a short span of six to eight weeks. For this purpose, in addition to the supervision by CMTs and district management, Mobile Teams of ACO officers remained in the field both during training and census enumeration periods. Each team was assigned a few contiguous districts for overall supervision. Special emphasis was given to the supervision program for the districts where difficulties in the census operations were particularly anticipated for timely and satisfactory completion. In big cities where field staff of the FBS was used for enumeration, the supervision was done by their in-charge officers. The number of provincial officers / supervisors and enumerators who participated in the Agricultural Census 2010 is given below:
PROVINCIAL OFFICERS AND STAFF ENGAGED IN FIELD OPERATION
Administrative Unit Officers / Supervisors
Staff / Enumerators Total
Pakistan 1165 7106 8271
Khyber Pakhtunkhwa 249 1513 1762
Punjab 474 3584 4058
Sindh 275 1027 1302
Balochistan 167 982 1149
NATIONAL CERTAINTY HOLDINGS: During the field operation, the NCHs lying within the boundaries of the selected Mouzas / villages / Killies / Basties were enumerated by the deputed enumerators. However, the responsibility to fill out the forms for the NCHs in the non-selected Mouzas / villages / Killies / Basties fell on the immediate supervisors / Kanungos / supervising Tapedars, in addition to the supervision of the enumerator’s work progress within their respective jurisdiction. PUBLICITY
A well-planned media campaign is a prerequisite for any large statistical enterprise in order to raise a huge country level awareness and elicit the cooperation of the general public. However, due to a shortage of funds, the publicity campaign was of a limited level. It was launched in local as well as national newspapers to highlight the importance of the census and its objectives. Similarly, briefs on census and handouts were issued to the newspapers at appropriate junctures during the district meetings and census field operation for public awareness. The census was sample-based and the enumeration work was confined to the selected Mouzas / villages / urban blocks and within a Mouza to selected households. Therefore, most of the District Council Nazims, members of the District and Tehsil Councils, Nazims of the Union Councils and Councillors of the selected Mouzas / villages were individually contacted and addressed on the issue. In addition, specially prepared pamphlets were pasted at important visible public places / sites (like mosques, street crossings, entry points of the Mouza / village / block etc.) right in the beginning of the census operation in the selected Mouzas / villages / urban blocks. DATA PROCESSING AND TABULATIONS Data entry was done by the Federal Bureau of Statistics, Data Processing Centres, Lahore and Islamabad. However, data processing was performed only at DP Centre, Lahore. The data processing and tabulations were carried out through a number of steps devised in a logical scheme of work as: DOCUMENTS CONTROL: A well-planned control room was established in ACO for maintenance of census documents. After retrieval of documents from the field, these were checked in the control room regarding required and completed number of questionnaires. One kitbag was assured for each selected Mouza / urban block. Differences found were brought into the notice of concerned officers for proper treatment from the field. Then kitbags were arranged district and Tehsil wise in an array so that any Mouza / bag could be traced out without any difficulty. A coding plan for this census was prepared with the help of computer programmers showing one code for each and every Tehsil of the country and documents were arranged according to the coding plan. MANUAL CODING: Coding refers to the assignment of a specific number / code to the information asked in a particular question during enumeration to facilitate the data processing on computers. The data items of main questionnaires were pre-coded with the help of computer programmers. However, identification of every questionnaire and their
serial numbers within Mouza / urban block were given manually by the staff of ACO. Any serial number, Tehsil code missing or illegible was made correct during coding. Then the questionnaires were tagged together for one Mouza / urban block to make them ready for manual editing and further data processing steps. MANUAL EDITING: Manual editing is a process to make the data recorded on a questionnaire consistent if inconsistencies are found among data items within the questionnaire. For this purpose manual editing instructions were prepared on the basis of theoretical mutual relationships among data items. In the light of those instructions manual editing was performed by the staff of ACO to make the data ready for keying. Ambiguous and illegible writings were also made correct during this step. DATA ENTRY AND EDIT- CORRECTION: After manual editing the data were entered in computers at Data Processing Centre (DPC) by Keypunch Operators. Then the data were processed by the computer programmers through already developed computer programmes for the purpose. The programmers produced computer printouts as the first edits for each district. These edits were checked at ACO with source documents and errors were made correct, if found. The second edit was produced by the programmers after processing the errors found during the first edit and the process went on and on till the data of a particular district were declared error free. The correction of data through computer edits till the data are error free with the help of source documents is termed as edit-correction. After declaring data error free, tabulations were produced. TABULATIONS: Tabulations are the actual presentation of data for data users. A tabulation plan comprising of 90 tables was prepared at the time of census planning and preparation. In the light of instructions already conveyed to the programmers for each column and row of each table, they produced data tabulations for each district, province and at country level as requested by the ACO. ESTIMATION OF CENSUS RESULTS As the census was based on sample enumeration, the sample observations were to be extrapolated to the population level. Therefore, the raising factors determined at various sampling stages, representing the inverse of the probabilities of selection of the respective household, were fed to the computer along with the other data. In case of a joint farm, 1/2, 1/3, 1/4 of the farm (or as the case might be) was considered enumerated when one of the two, one of the three or one of the four partners of a farm, respectively, was enumerated. The terminology used in the estimation of aggregates along with the mathematical formulae (as given below) for developing census estimates for three-stage sampling plan (part-1 of the country) has been elucidated being the most complicated as compared to the areas / regions of the country falling in part-2, part-3 and part-4. Anyhow, the probability of selection as well as the procedure for working out census estimates for part-2, part-3 and part-4 are implicit and may well be understood from the elucidated methodological formulae.
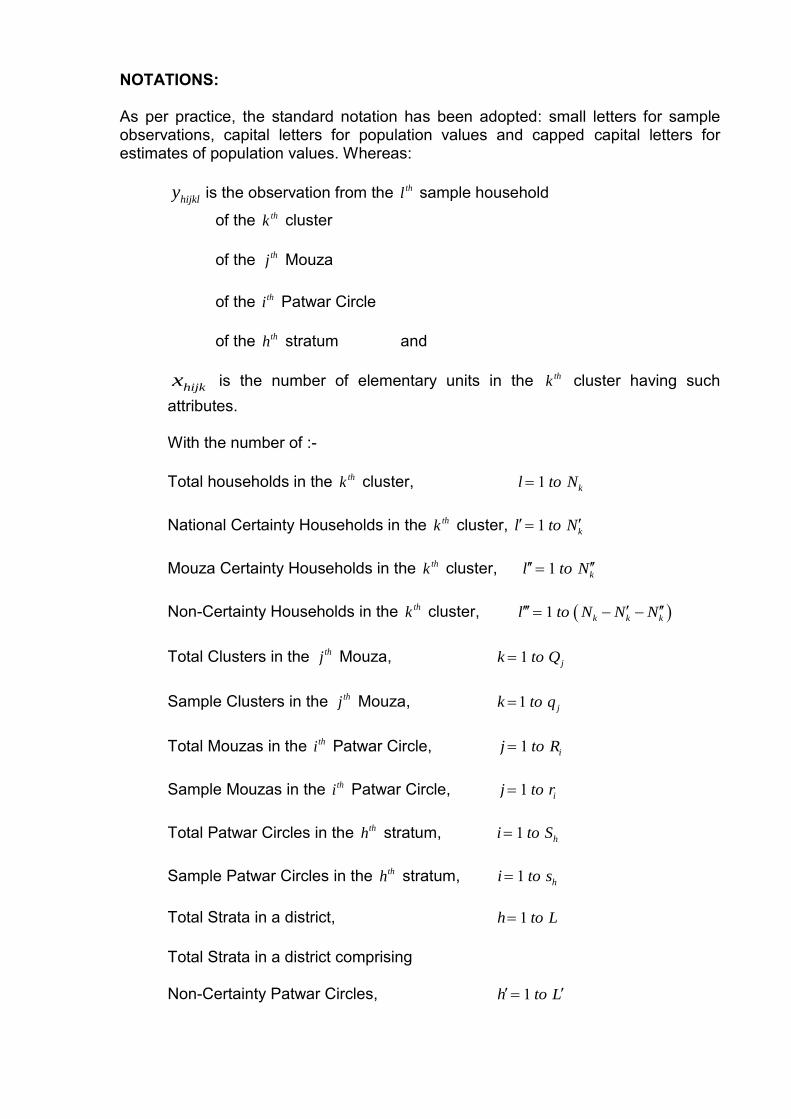
NOTATIONS: As per practice, the standard notation has been adopted: small letters for sample observations, capital letters for population values and capped capital letters for estimates of population values. Whereas:
hijkly is the observation from the thl sample household
of the thk cluster
of the thj Mouza of the thi Patwar Circle of the thh stratum and
hijkx is the number of elementary units in the thk cluster having such attributes.
With the number of :- Total households in the thk cluster, 1 kl to N
National Certainty Households in the thk cluster, 1 kl to N
Mouza Certainty Households in the thk cluster, 1 kl to N
Non-Certainty Households in the thk cluster, 1 k k kl to N N N
Total Clusters in the thj Mouza, 1 jk to Q
Sample Clusters in the thj Mouza, 1 jk to q
Total Mouzas in the thi Patwar Circle, 1 ij to R
Sample Mouzas in the thi Patwar Circle, 1 ij to r
Total Patwar Circles in the thh stratum, 1 hi to S
Sample Patwar Circles in the thh stratum, 1 hi to s
Total Strata in a district, 1h to L
Total Strata in a district comprising
Non-Certainty Patwar Circles, 1h to L
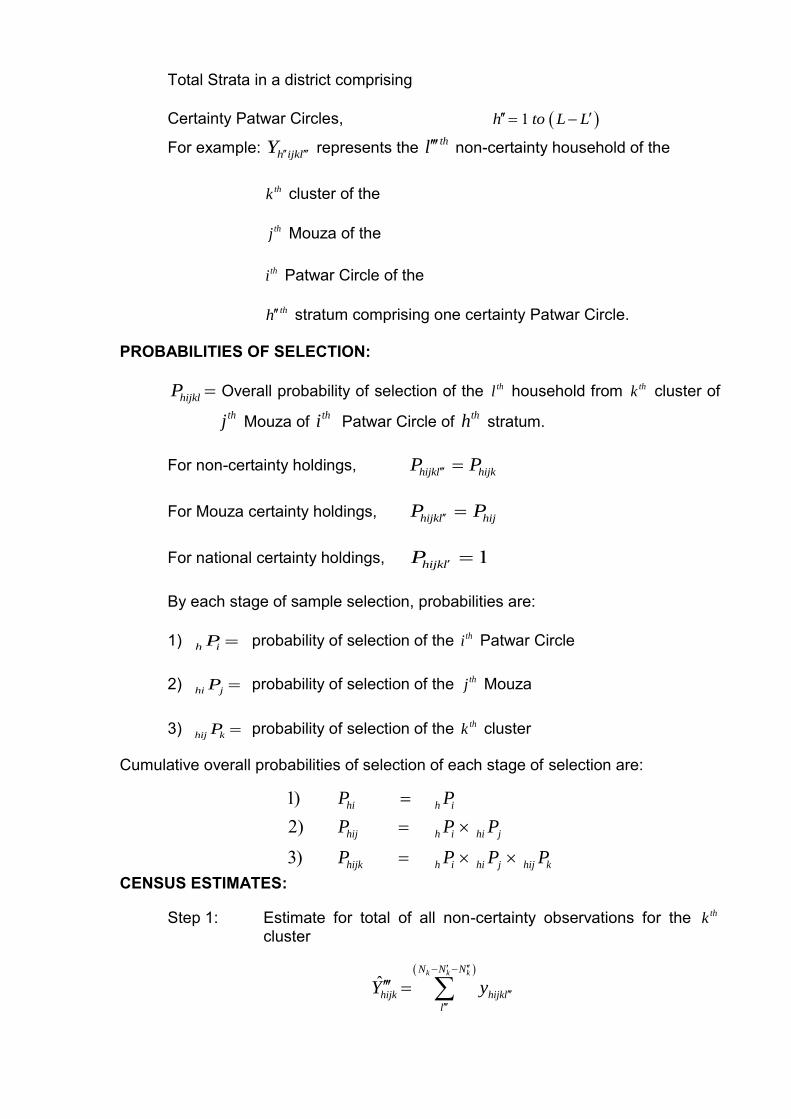
Total Strata in a district comprising
Certainty Patwar Circles, 1h to L L
For example: h ijklY represents the thl non-certainty household of the
thk cluster of the
thj Mouza of the
thi Patwar Circle of the
thh stratum comprising one certainty Patwar Circle.
PROBABILITIES OF SELECTION:
hijklP Overall probability of selection of the thl household from thk cluster of
thj Mouza of thi Patwar Circle of thh stratum. For non-certainty holdings, hijkl hijkP P For Mouza certainty holdings, hijkl hijP P For national certainty holdings, 1hijklP By each stage of sample selection, probabilities are: 1) h iP probability of selection of the thi Patwar Circle
2) hi jP probability of selection of the thj Mouza
3) hij kP probability of selection of the thk cluster
Cumulative overall probabilities of selection of each stage of selection are:
1)2)
3)
hi h i
hij h i hi j
hijk h i hi j hij k
P P
P P P
P P P P
CENSUS ESTIMATES: Step 1: Estimate for total of all non-certainty observations for the thk
cluster
ˆ
k k kN N N
hijk hijkl
l
Y y
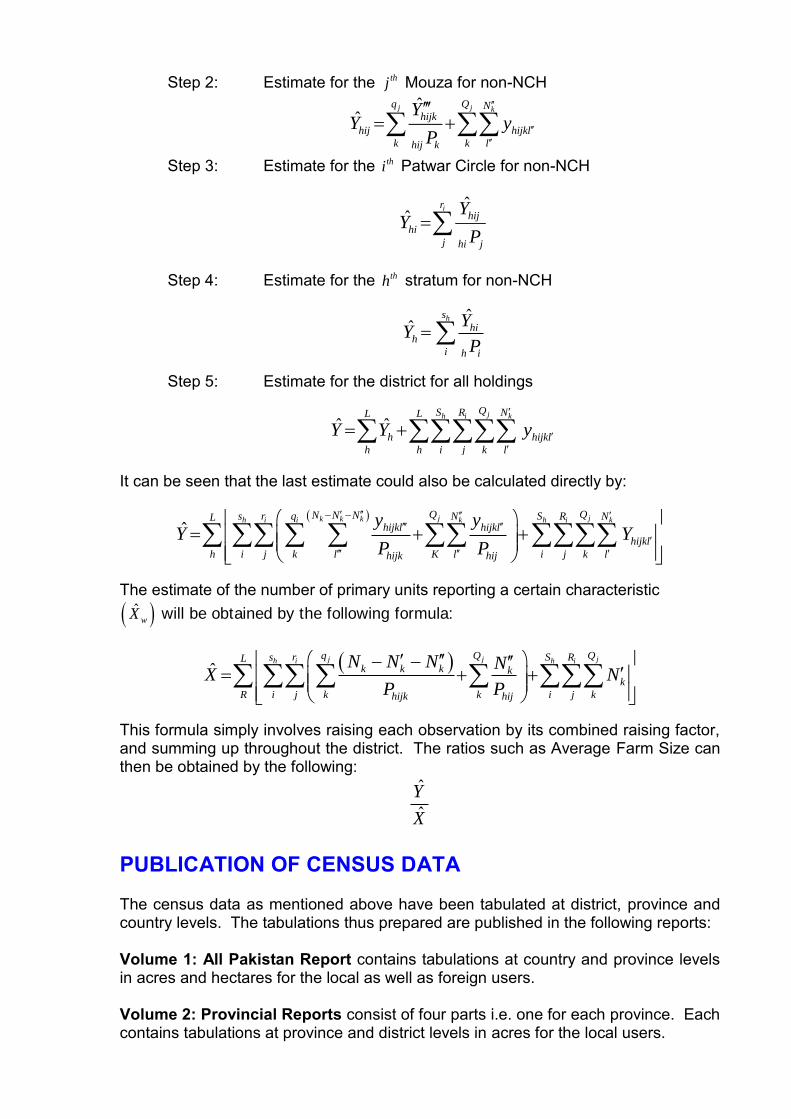
Step 2: Estimate for the thj Mouza for non-NCH ˆ
ˆj j k
q Q Nhijk
hij hijkl
k k lhij k
YY y
P
Step 3: Estimate for the thi Patwar Circle for non-NCH
ˆˆ
irhij
hi
j hi j
YY
P
Step 4: Estimate for the thh stratum for non-NCH
ˆˆhs
hih
i h i
YY
P
Step 5: Estimate for the district for all holdings
ˆ ˆjh i k
QS R NL L
h hijkl
h h i j k l
Y Y y
It can be seen that the last estimate could also be calculated directly by:
ˆ
j jk k kh i i k h i kQ QN N Ns r q N S R NL
hijkl hijkl
hijkl
h i j k l K l i j k lhijk hij
y yY Y
P P
The estimate of the number of primary units reporting a certain characteristic ˆ
wX will be obtained by the following formula:
ˆj j jh i h i
q Q Qs r S RLk k k k
k
R i j k k i j khijk hij
N N N NX N
P P
This formula simply involves raising each observation by its combined raising factor, and summing up throughout the district. The ratios such as Average Farm Size can then be obtained by the following:
ˆˆ
Y
X
PUBLICATION OF CENSUS DATA The census data as mentioned above have been tabulated at district, province and country levels. The tabulations thus prepared are published in the following reports: Volume 1: All Pakistan Report contains tabulations at country and province levels in acres and hectares for the local as well as foreign users. Volume 2: Provincial Reports consist of four parts i.e. one for each province. Each contains tabulations at province and district levels in acres for the local users.
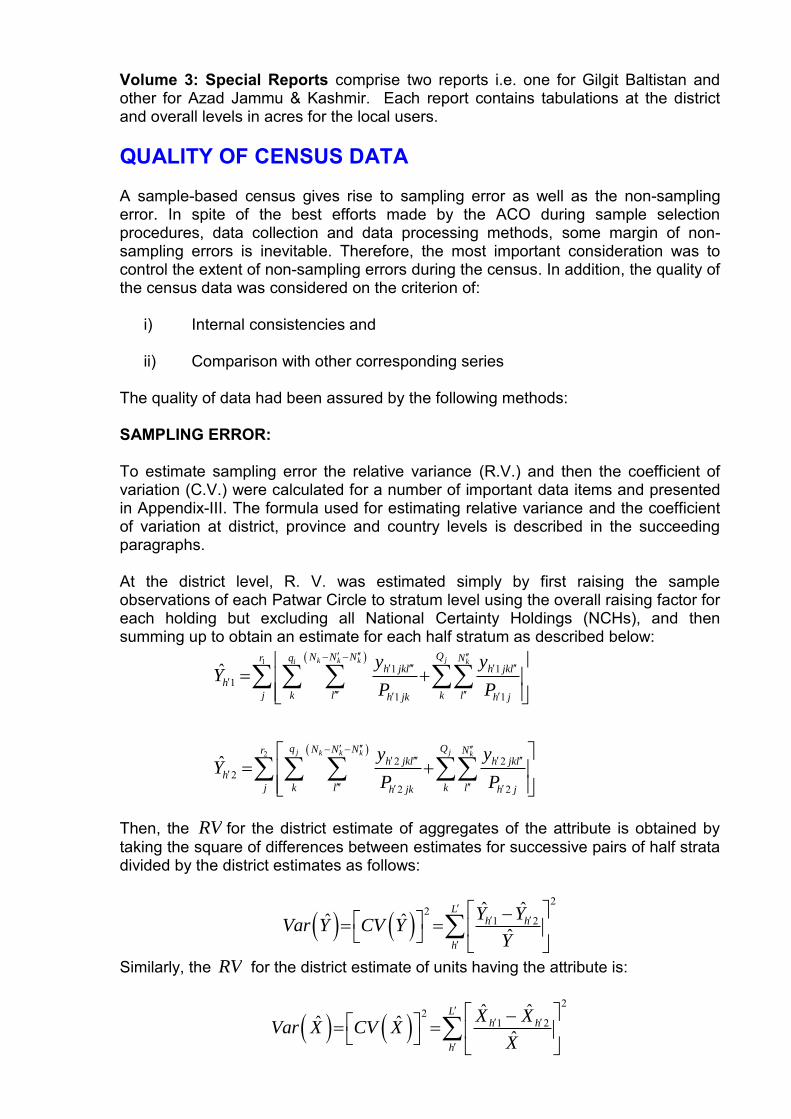
Volume 3: Special Reports comprise two reports i.e. one for Gilgit Baltistan and other for Azad Jammu & Kashmir. Each report contains tabulations at the district and overall levels in acres for the local users. QUALITY OF CENSUS DATA A sample-based census gives rise to sampling error as well as the non-sampling error. In spite of the best efforts made by the ACO during sample selection procedures, data collection and data processing methods, some margin of non-sampling errors is inevitable. Therefore, the most important consideration was to control the extent of non-sampling errors during the census. In addition, the quality of the census data was considered on the criterion of:
i) Internal consistencies and
ii) Comparison with other corresponding series The quality of data had been assured by the following methods: SAMPLING ERROR: To estimate sampling error the relative variance (R.V.) and then the coefficient of variation (C.V.) were calculated for a number of important data items and presented in Appendix-III. The formula used for estimating relative variance and the coefficient of variation at district, province and country levels is described in the succeeding paragraphs.
At the district level, R. V. was estimated simply by first raising the sample observations of each Patwar Circle to stratum level using the overall raising factor for each holding but excluding all National Certainty Holdings (NCHs), and then summing up to obtain an estimate for each half stratum as described below:
1
2
1 11
1 1
2 22
2 2
ˆ
ˆ
jk k ki k
j jk k k k
QN N Nq Nrh jkl h jkl
h
j k l k lh jk h j
q QN N N Nrh jkl h jkl
h
j k l k lh jk h j
y yY
P P
y yY
P P
Then, the RV for the district estimate of aggregates of the attribute is obtained by taking the square of differences between estimates for successive pairs of half strata divided by the district estimates as follows:
2
21 2
ˆ ˆˆ ˆˆ
Lh h
h
Y YVar Y CV Y
Y
Similarly, the RV for the district estimate of units having the attribute is:
2
21 2
ˆ ˆˆ ˆˆ
Lh h
h
X XVar X CV X
X
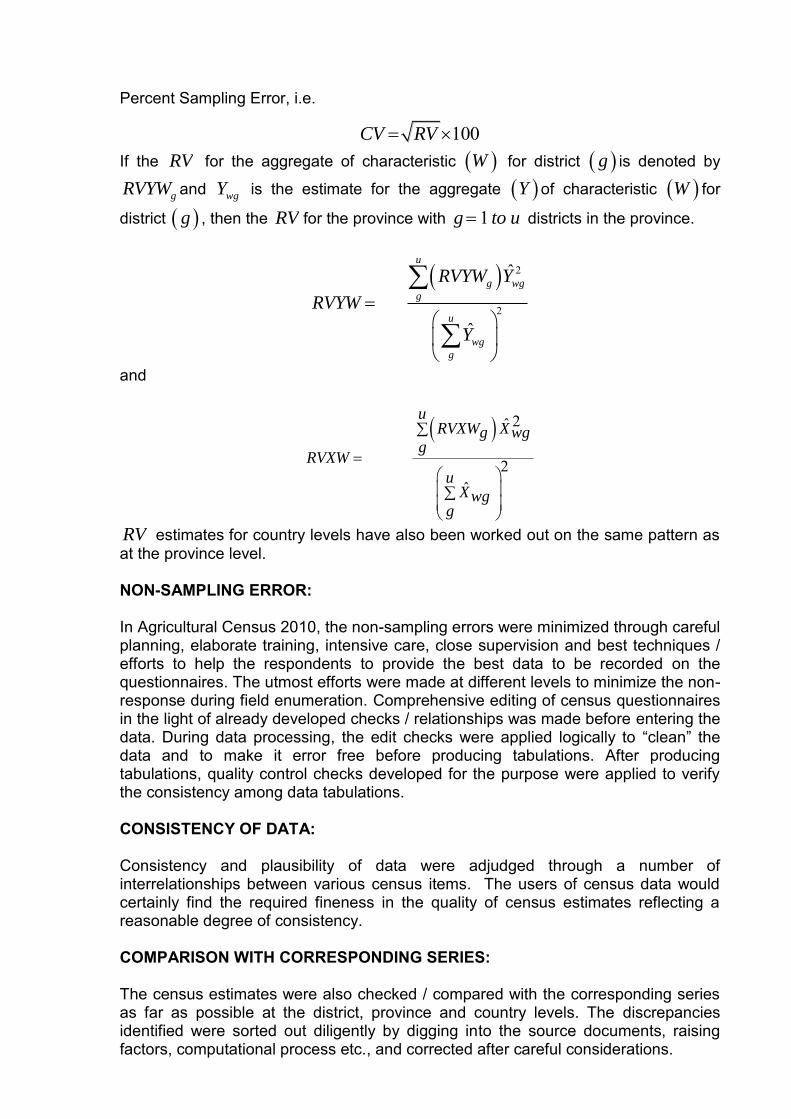
Percent Sampling Error, i.e.
100CV RV
If the RV for the aggregate of characteristic W for district g is denoted by
gRVYW and wgY is the estimate for the aggregate Y of characteristic W for
district g , then the RV for the province with 1g to u districts in the province.
2
2
ˆ
ˆ
u
g wg
g
u
wg
g
RVYW Y
RVYW
Y
and
2ˆ
2ˆ
uRVXW Xg wg
gRVXW
uXwg
g
RV estimates for country levels have also been worked out on the same pattern as at the province level. NON-SAMPLING ERROR: In Agricultural Census 2010, the non-sampling errors were minimized through careful planning, elaborate training, intensive care, close supervision and best techniques / efforts to help the respondents to provide the best data to be recorded on the questionnaires. The utmost efforts were made at different levels to minimize the non-response during field enumeration. Comprehensive editing of census questionnaires in the light of already developed checks / relationships was made before entering the data. During data processing, the edit checks were applied logically to “clean” the data and to make it error free before producing tabulations. After producing tabulations, quality control checks developed for the purpose were applied to verify the consistency among data tabulations. CONSISTENCY OF DATA: Consistency and plausibility of data were adjudged through a number of interrelationships between various census items. The users of census data would certainly find the required fineness in the quality of census estimates reflecting a reasonable degree of consistency. COMPARISON WITH CORRESPONDING SERIES: The census estimates were also checked / compared with the corresponding series as far as possible at the district, province and country levels. The discrepancies identified were sorted out diligently by digging into the source documents, raising factors, computational process etc., and corrected after careful considerations.
DEFINITIONS The definitions of different data items / variables on which data were collected in Agricultural Census 2010 are presented here. These definitions will help the data users to understand conceptual issues related to the data and are given in lexicographic order as below:
1. Agricultural Census means collection of information about agriculture sector and is called the Agricultural Census 2010.
2. Agricultural Households include Farm Households and / or Livestock
Holders.
3. Agricultural Work includes farm work or planning thereof. It includes work on the farm, e.g. ploughing, planting, hoeing, weeding, application of fertilizer(s) and plant protection material(s), harvesting, winnowing, feeding and caring of the livestock, supervision of agricultural workers, hauling farm produce to market and any other work related to the operation of the farm.
4. All Households include Farm Households and Non-Farm Households.
a. Farm Households include households operating any farm area for
agriculture purpose irrespective of its ownership and whether operated individually or jointly with other households. Farm household may or may not have any livestock.
b. Non-Farm Households include households not operating any
farm area for agriculture purposes. Households owning land but not operating for any agriculture purposes are also included in this category.
5. Area Fertilized means the area of a crop treated with chemical
fertilizer(s), before and / or after sowing, irrespective of the number of times it was fertilized during the census year.
6. Area not Available for Cultivation is that uncultivated area of the farm
which is under farm house, cattle shed, barn, storage, farm roads and channels, etc. and therefore not available for cultivation.
7. Area Owned includes the total area owned by all members of a
household irrespective of its location. It also includes the area held in owner-like possession; such as land temporarily allotted, the mortgaged land under possession, government land taken on lease, etc.
8. Area Self-operated includes the whole or only that part of the area
owned which is under the day-to-day operational control of a household on the census day.
9. Area Share Cropped means the rented-in area for which a pre-decided
share of the produce is paid by the tenant to the owner of the area.
10. Area Taken on Lease / Rent means the rented-in area for which a pre-decided fixed rent in cash or kind is paid by the tenant to the owner of the area.
11. Area under Fruit Trees Nursery is the farm area on which fruit trees
nurseries have been grown for any purpose.
12. Banjar Jadeed means that uncultivated area which was not sown / cultivated for the last two to four years.
13. Banjar Qadeem means that uncultivated area which was not sown /
cultivated for beyond the last four years.
14. Casual Labour means the labour employed occasionally on daily wage basis for a specific agricultural work.
15. Cattle is the collective name given to bovine animals.
16. Census Day refers to the day of enumeration of a household.
17. Census Year was the actual calendar year 2010. However, data were
collected for cropping seasons Kharif 2009 and Rabi 2009-10. In terms of the Agricultural year, it begins in April 2009 and ends on 31st March 2010.
18. Complete Kacha House means a residential place, walls of which are
made up of mud or unbaked bricks bonded with mud.
19. Complete Pakka House means a residential place, walls of which are made up of baked bricks / stones / concrete bonded with mud or cement.
20. Crop Area Covered with Plant Protection Measures means the area of
a crop on which plant protection chemicals insecticides / pesticides / fungicides / rodenticides etc. were applied / sprayed irrespective of the number of applications / sprays made during the census year. It does not include aerial spray and seed treatment.
21. Crop Area Irrigated means area of a crop actually irrigated at least once
by artificial mean(s) during the census year. It also includes one or more irrigations given as part of land preparation before sowing of the crop.
22. Crop Seasons define the cropping pattern in Pakistan. The cropping
pattern of the country is bifurcated as Kharif and Rabi and all types of crops are sown in these two seasons. Detail of both seasons is:
a. Kharif crops are sown in the summer from April to June and
harvested in late summer or early winter during October to December. The important Kharif crops are cotton, rice, sugarcane, maize, jowar, Bajra and Kharif vegetables.
b. Rabi crops are sown in the winter from October to December and
harvested in late winter or early summer from April to May. The important Rabi crops are wheat, gram, barley, rapeseed, mustard and Rabi vegetables.
23. Cropping Intensity represents the total cropped area in terms of total cultivated area multiplied by 100, i.e.
100TotalCropped AreaCropping Intensity
TotalCultivated Area
It indicates the extent to which the cultivated area was used for intensive cropping.
24. Cultivated Area is that farm area which was sown at least once during
the census year i.e. 2009-2010 or a year before. It is the sum of area Net Sown and Current Fallow.
25. Culturable Waste is that uncultivated farm area which is otherwise fit for
cultivation but was not cropped during the census year or in the year before due to presence of any of the constraints like water logging, non-availability of irrigation water, salinity, un-levelling of land, manpower and / or funds shortage, etc.
26. Current Fallow means that cultivated farm area which was not sown
during the census year for the purpose of regaining fertility and / or any other specific objective / reason but was cropped at least once during the preceding year i.e. 2008-09.
27. Economic Activity: The data on the type of economic activity are based
on the concept of “usual” activity using 12-months period as the reference period in contrast to labour force concept of “current” activity in which a short time reference of one week or less is generally used. Usually, it involves the activity that generates income either in cash or kind.
28. Economically Active Persons are those persons of either sex of 10
years or above in age who, during the reference period, participated in the production of economic goods or services.
29. Economically Inactive Persons are those persons of the household who
do not perform any work for profit or family gain in cash or in kind. Housewives and other members of the household who are mainly engaged in household duties in their own home, students attending any regular educational institution and other persons not economically active are generally included in this category.
30. Family Agricultural Workers include household members of 10 years
and above who do any kind of agricultural work on their farm / holding. Family workers have been classified into persons doing agricultural work on permanent basis or part time basis.
a. Permanent Family Workers include members of the household
who only do agricultural work of the holding at their own farm. They also include senior household members who may not be doing any physical work at the farm but carry out and / or participate in the planning, supervision and operation of farm.
b. Household Members Doing Part Time Work are those members of the household who in addition to the agricultural work
of the farm / holding also do some other work such as service, business, etc.
31. Farm is the aggregate area of land operated by member(s) of one
household alone or with the assistance of member(s) of other household(s) without regard to location, size or title and normally used for crop production. Farms wholly uncultivated during the census year are also included in this category. The term “farm” is synonymous to a holding.
32. Flowers and Their Nursery Area refers the farm area planted with
flowers and / or their nurseries.
33. Fodder Area includes the area under Rabi fodders as well as Kharif fodders.
34. Fragment or Parcel refers to any piece of land of a farm entirely
surrounded by land of other farm(s) and / or by land and / or water not forming part of that farm. One farm may have one or more fragments / parcels in it.
35. House means any type of structure / dwelling used for human
inhabitation.
36. Household means a person or a group of persons living together whether or not having blood relationship to each other and eating from the same kitchen. Hospitals, hostels, jails and hotels are not considered as household.
37. Household under Debt includes households reported under any type of
debt at the time of census enumeration. 38. Individual Farm means a farm operated by one or more persons of the
same household.
39. Irrigated Area includes the cultivated area actually irrigated at least once during the census year by artificial sources of irrigation.
40. Joint Farm means a farm jointly operated by persons belonging to two or
more different households.
41. Land Purchased means agricultural land purchased by the household anywhere in the country during the last 10 years.
42. Land Sold means agricultural land sold by the household anywhere in the
country during the last 10 years.
43. Land Tenure refers to the rights / arrangements under which the land is operated. Land tenure may be of following types:
a. Owner Farm: A farm in which the entire land is owned by the operator himself.
b. Tenant Farm: A farm in which the entire land is taken from other household(s) against a fixed rent in cash or kind or a share in the produce or against any other terms and conditions.
c. Owner- Cum-Tenant Farm: A farm in which a part of the land area
is owned by the operator household and the remaining is taken from other household(s) against rent or share of the produce or any other terms and conditions.
44. Land Use Intensity represents the cultivated area measured in terms of total culturable area multiplied by 100, i.e.
100TotalCultivated AreaLand use Intensity
TotalCulturable Area
It indicates the extent to which the culturable land was used for cultivation of crops.
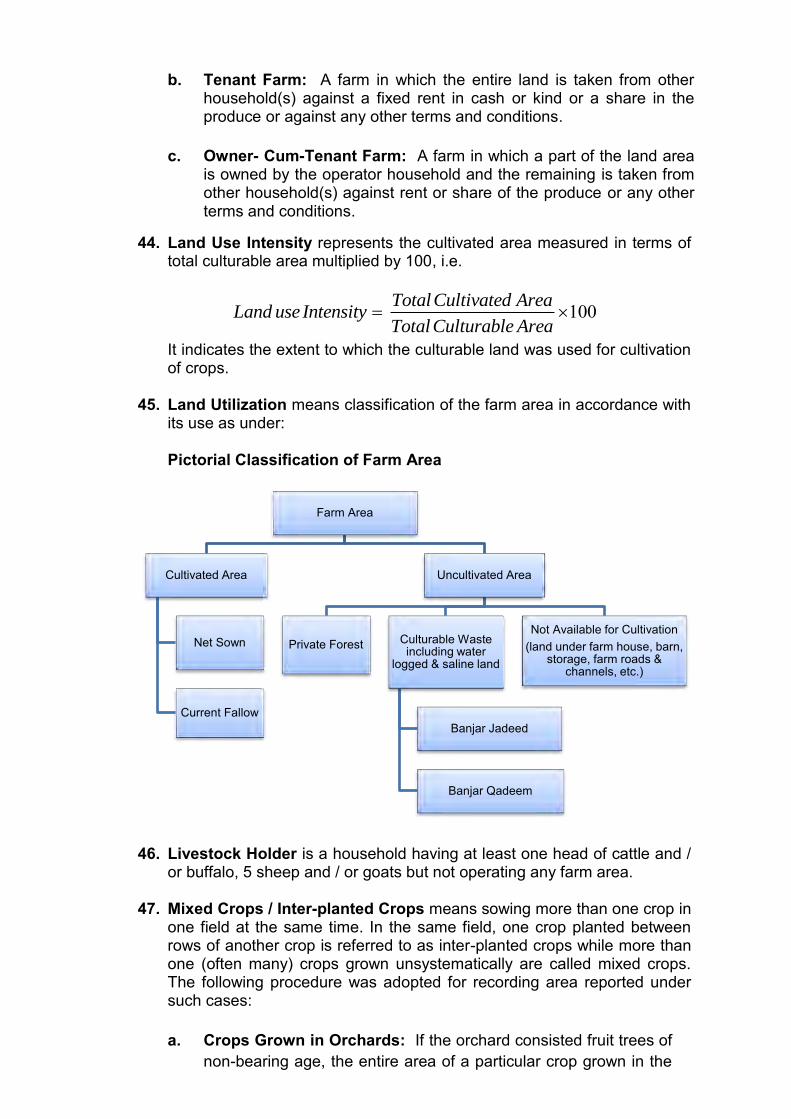
45. Land Utilization means classification of the farm area in accordance with
its use as under:
Pictorial Classification of Farm Area
46. Livestock Holder is a household having at least one head of cattle and /
or buffalo, 5 sheep and / or goats but not operating any farm area. 47. Mixed Crops / Inter-planted Crops means sowing more than one crop in
one field at the same time. In the same field, one crop planted between rows of another crop is referred to as inter-planted crops while more than one (often many) crops grown unsystematically are called mixed crops. The following procedure was adopted for recording area reported under such cases: a. Crops Grown in Orchards: If the orchard consisted fruit trees of
non-bearing age, the entire area of a particular crop grown in the
Farm Area
Cultivated Area
Net Sown
Current Fallow
Uncultivated Area
Private Forest Culturable Waste including water
logged & saline land
Banjar Jadeed
Banjar Qadeem
Not Available for Cultivation (land under farm house, barn,
storage, farm roads & channels, etc.)
orchard was reported as crop area. If the orchard consisted of fruit trees of bearing age, only half of the area of a particular crop grown in the orchard was recorded as crop area. The area under orchard was included as such in either case.
b. Crops Grown Together: If the two crops grown together were harvested at the same time, one half of the total area in the crops grown together was reported for each of the crops. If the two crops grown together were harvested at different times, the entire area of the crops grown together was reported for each of the crops.
c. Seed Ratio: In case of any other situation for mixed cropping, the
ratio of seeds sown for each crop will be the basis of area reporting for each crop.
48. Mouza or Deh is a demarcated territorial unit for which separate revenue record including a cadastral map is maintained by the provincial revenue departments. One Mouza / Deh may contain one or more population settlements or may have no settlement (Bechiragh).
49. Net Sown Area means the cultivated farm area which was actually sown
at least once during the census year regardless of becoming “Kharaba” (crop failure) and / or the number of crops raised. It also includes area under orchards.
50. Non-Agricultural Households include households which do not fall in
the categories of Farm Households and / or Livestock Holders.
51. Non-Agricultural Work refers to the work other than agricultural work, which may relate to trade, cottage industry, occupation of village functionaries, service with government or other agencies and non-agricultural labour, etc.
52. Non-Perennial Canal Irrigated Area means the area irrigated by canal
flowing not round the year but seasonally i.e. for a few months in a year.
53. Orchard Area is the farm area compactly planted with fruit trees and their nurseries. The important fruit trees are mango, citrus, guava, date, grape, apple, pear, plum, apricot and peach.
54. Other Area includes area operated by a household, other than the area
owned, without paying any rent in the usual form, e.g. Kacha area along the river side, etc.
55. Owned House means a household’s residential place with ownership or
equivalent rights.
56. Partially Kacha / Pakka House means a residential place having both Kacha and Pakka walls.
57. Perennial Canal Irrigated Area means the area irrigated by canal flowing round the year.
58. Permanent Hired Labour means persons who work on the farm on
whole time basis and are employed for longer periods. They get wages in cash and / or kind on a fixed period basis, i.e. monthly, quarterly and yearly etc.
59. Private Forest Area is that uncultivated farm area which is under forest
planted by the farmer himself or left for the purpose. It does not include area under government forests.
60. Pulses Area includes the area under gram, Rabi pulses as well as Kharif
pulses.
61. Sample Mouza / Deh / Village / Killi / Block is a sampling unit selected through sampling method for census enumeration. In settled areas, Mouza / Deh has been used as a sampling unit while in unsettled areas village / Basti / Killi and in urban areas, blocks have been taken as the sampling units.
62. Total Cropped Area means the aggregate area of crops raised at a farm
during the census year including the area under orchards / gardens / nurseries.
63. Total Culturable Area includes cultivated area and culturable waste.
64. Total Farm Area includes total cultivated and uncultivated area of a farm
but it does not include area outside the farm such as area under government forests, roads, railways, schools, playgrounds, canals, rivers, Abadi Deh, urban built-up area, undistributed government land, etc.
65. Uncultivated Area means that farm area which was not sown even for a
single crop during the last two years i.e. census year (2009-10) and a year before (2008-09).
66. Un-irrigated Area includes the cultivated area not artificially irrigated. It
depends for cultivation solely on rain fall (Barani or rain fed) or river floods and seepage water (Sailaba), etc.
67. Vegetable Area includes the area under sugar beet, potato, tomato,
onion, chilli, melon, other Rabi and Kharif vegetables.
68. Village / Basti / Killi 0means a chunk of houses known by a certain name. There may be one or more villages / Basties / Killies in a Mouza.
69. Work Animals include bullocks, male buffaloes and camels.
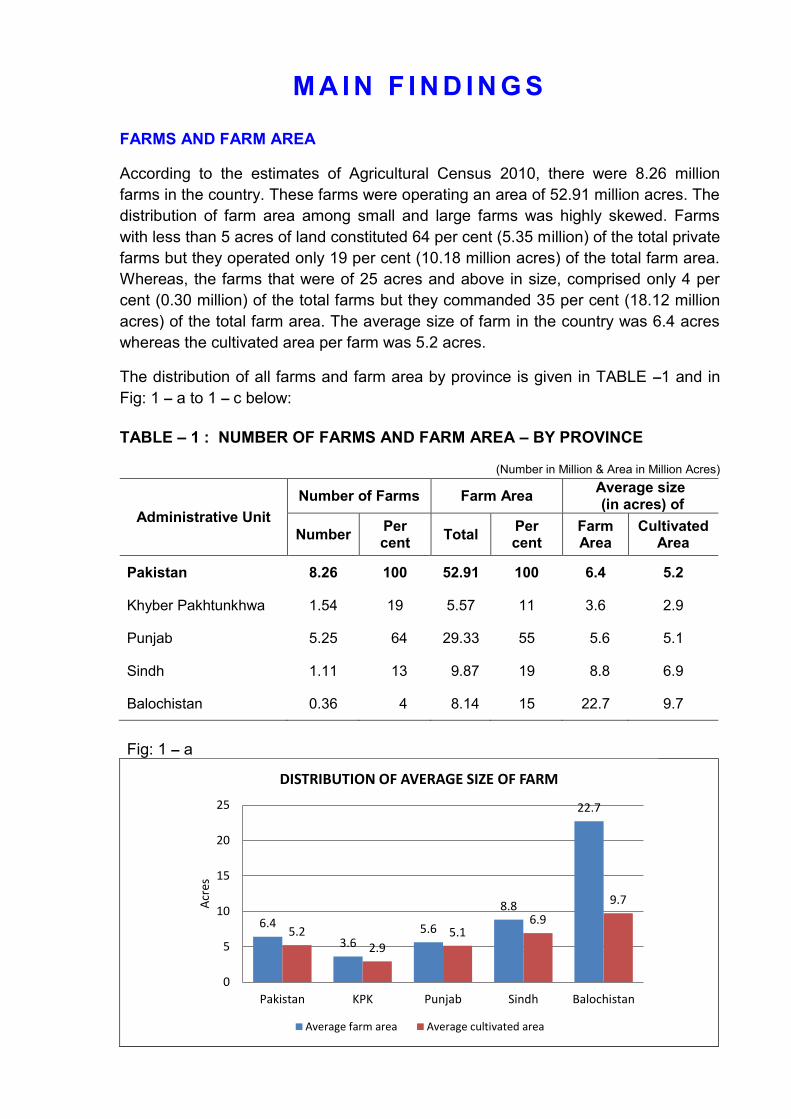
M A I N F I N D I N G S
FARMS AND FARM AREA
According to the estimates of Agricultural Census 2010, there were 8.26 million farms in the country. These farms were operating an area of 52.91 million acres. The distribution of farm area among small and large farms was highly skewed. Farms with less than 5 acres of land constituted 64 per cent (5.35 million) of the total private farms but they operated only 19 per cent (10.18 million acres) of the total farm area. Whereas, the farms that were of 25 acres and above in size, comprised only 4 per cent (0.30 million) of the total farms but they commanded 35 per cent (18.12 million acres) of the total farm area. The average size of farm in the country was 6.4 acres whereas the cultivated area per farm was 5.2 acres.
The distribution of all farms and farm area by province is given in TABLE –1 and in Fig: 1 – a to 1 – c below: TABLE – 1 : NUMBER OF FARMS AND FARM AREA – BY PROVINCE
(Number in Million & Area in Million Acres)
Administrative Unit Number of Farms Farm Area Average size
(in acres) of
Number Per cent Total Per
cent Farm Area
Cultivated Area
Pakistan 8.26 100 52.91 100 6.4 5.2
Khyber Pakhtunkhwa 1.54 19 5.57 11 3.6 2.9
Punjab 5.25 64 29.33 55 5.6 5.1
Sindh 1.11 13 9.87 19 8.8 6.9
Balochistan 0.36 4 8.14 15 22.7 9.7
Fig: 1 – a
6.4
3.6 5.6
8.8
22.7
5.2 2.9
5.1 6.9
9.7
0
5
10
15
20
25
Pakistan KPK Punjab Sindh Balochistan
Acr
es
DISTRIBUTION OF AVERAGE SIZE OF FARM
Average farm area Average cultivated area
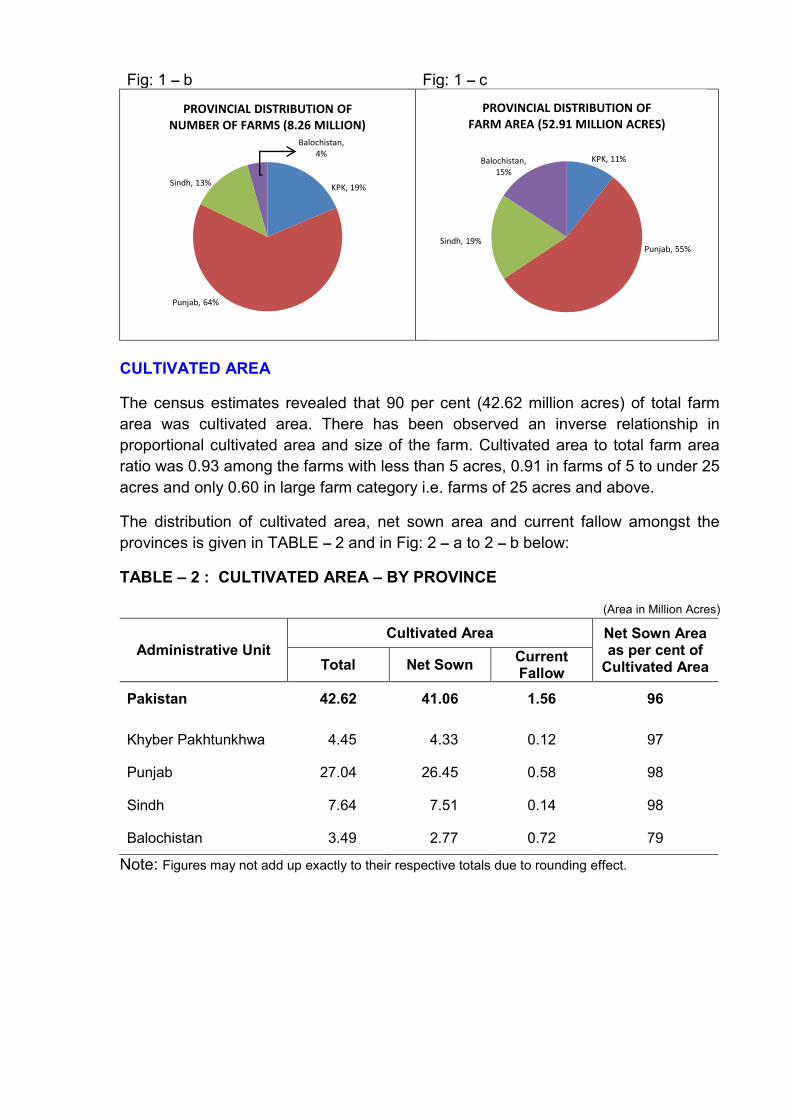
Fig: 1 – b Fig: 1 – c
CULTIVATED AREA
The census estimates revealed that 90 per cent (42.62 million acres) of total farm area was cultivated area. There has been observed an inverse relationship in proportional cultivated area and size of the farm. Cultivated area to total farm area ratio was 0.93 among the farms with less than 5 acres, 0.91 in farms of 5 to under 25 acres and only 0.60 in large farm category i.e. farms of 25 acres and above.
The distribution of cultivated area, net sown area and current fallow amongst the provinces is given in TABLE – 2 and in Fig: 2 – a to 2 – b below:
TABLE – 2 : CULTIVATED AREA – BY PROVINCE
(Area in Million Acres)
Administrative Unit Cultivated Area Net Sown Area
as per cent of Cultivated Area Total Net Sown Current
Fallow Pakistan 42.62 41.06 1.56 96
Khyber Pakhtunkhwa 4.45 4.33 0.12 97
Punjab 27.04 26.45 0.58 98
Sindh 7.64 7.51 0.14 98
Balochistan 3.49 2.77 0.72 79
Note: Figures may not add up exactly to their respective totals due to rounding effect.
KPK, 19%
Punjab, 64%
Sindh, 13%
Balochistan, 4%
PROVINCIAL DISTRIBUTION OF NUMBER OF FARMS (8.26 MILLION)
KPK, 11%
Punjab, 55% Sindh, 19%
Balochistan, 15%
PROVINCIAL DISTRIBUTION OF FARM AREA (52.91 MILLION ACRES)
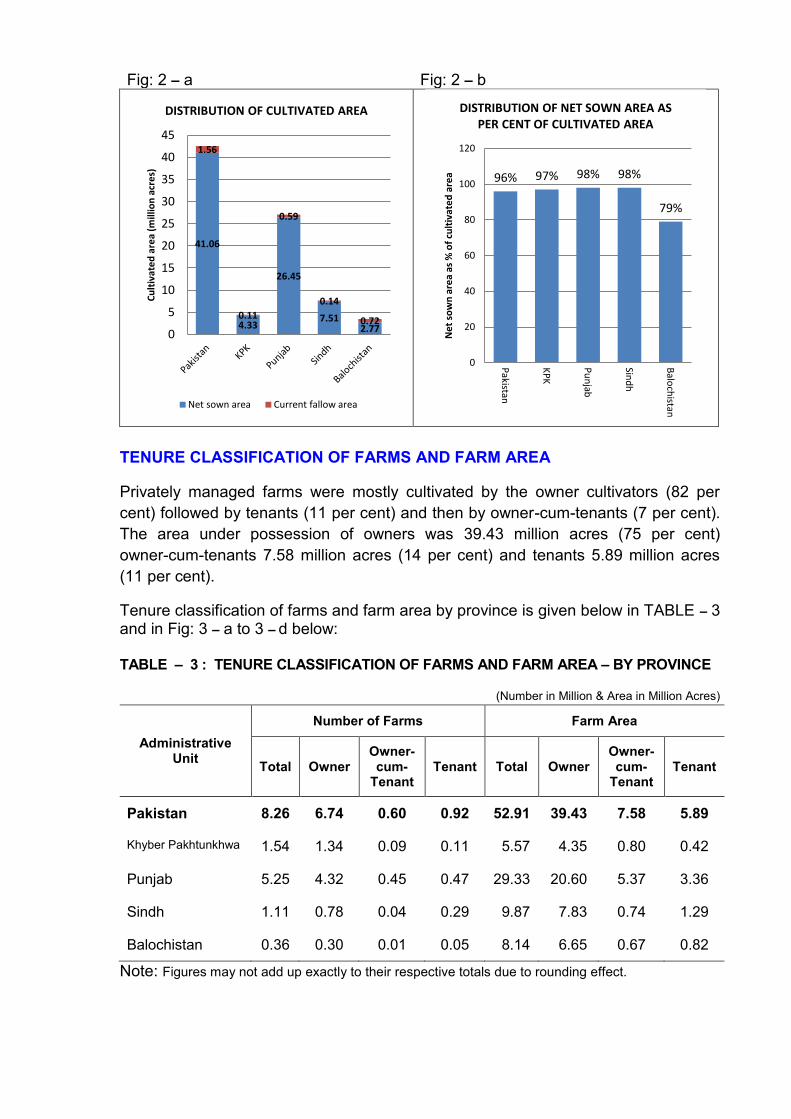
Fig: 2 – a Fig: 2 – b
TENURE CLASSIFICATION OF FARMS AND FARM AREA
Privately managed farms were mostly cultivated by the owner cultivators (82 per cent) followed by tenants (11 per cent) and then by owner-cum-tenants (7 per cent). The area under possession of owners was 39.43 million acres (75 per cent) owner-cum-tenants 7.58 million acres (14 per cent) and tenants 5.89 million acres (11 per cent).
Tenure classification of farms and farm area by province is given below in TABLE – 3 and in Fig: 3 – a to 3 – d below: TABLE – 3 : TENURE CLASSIFICATION OF FARMS AND FARM AREA – BY PROVINCE
(Number in Million & Area in Million Acres)
Administrative Unit
Number of Farms Farm Area
Total Owner Owner-cum-
Tenant Tenant Total Owner
Owner- cum-
Tenant Tenant
Pakistan 8.26 6.74 0.60 0.92 52.91 39.43 7.58 5.89
Khyber Pakhtunkhwa 1.54 1.34 0.09 0.11 5.57 4.35 0.80 0.42
Punjab 5.25 4.32 0.45 0.47 29.33 20.60 5.37 3.36
Sindh 1.11 0.78 0.04 0.29 9.87 7.83 0.74 1.29
Balochistan 0.36 0.30 0.01 0.05 8.14 6.65 0.67 0.82
Note: Figures may not add up exactly to their respective totals due to rounding effect.
41.06
4.33
26.45
7.51 2.77
1.56
0.11
0.59
0.14
0.72
0
5
10
15
20
25
30
35
40
45C
ult
ivat
ed
are
a (m
illio
n a
cre
s)
DISTRIBUTION OF CULTIVATED AREA
Net sown area Current fallow area
96% 97% 98% 98%
79%
0
20
40
60
80
100
120
Pakistan
KP
K
Pu
njab
Sind
h
Balo
chistan
Ne
t so
wn
are
a as
% o
f cu
ltiv
ate
d a
rea
DISTRIBUTION OF NET SOWN AREA AS PER CENT OF CULTIVATED AREA
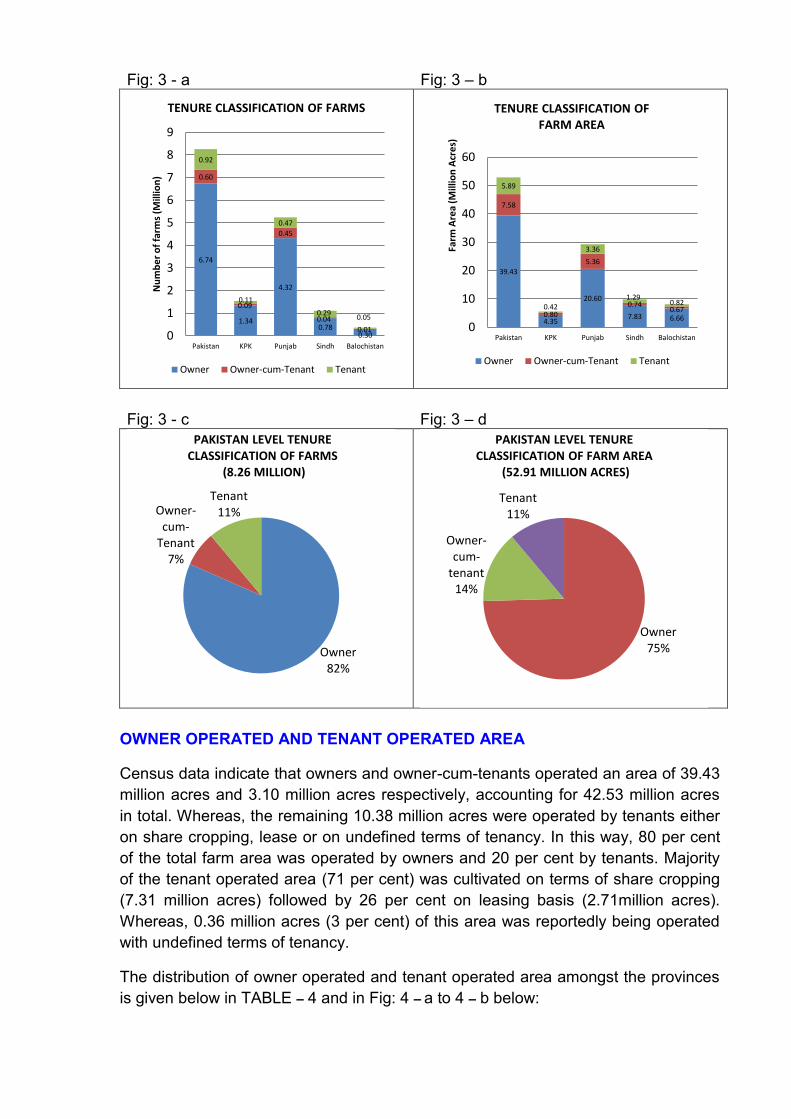
Fig: 3 - a Fig: 3 – b
Fig: 3 - c Fig: 3 – d
OWNER OPERATED AND TENANT OPERATED AREA
Census data indicate that owners and owner-cum-tenants operated an area of 39.43 million acres and 3.10 million acres respectively, accounting for 42.53 million acres in total. Whereas, the remaining 10.38 million acres were operated by tenants either on share cropping, lease or on undefined terms of tenancy. In this way, 80 per cent of the total farm area was operated by owners and 20 per cent by tenants. Majority of the tenant operated area (71 per cent) was cultivated on terms of share cropping (7.31 million acres) followed by 26 per cent on leasing basis (2.71million acres). Whereas, 0.36 million acres (3 per cent) of this area was reportedly being operated with undefined terms of tenancy.
The distribution of owner operated and tenant operated area amongst the provinces is given below in TABLE – 4 and in Fig: 4 – a to 4 – b below:
6.74
1.34
4.32
0.78 0.30
0.60
0.09
0.45
0.04
0.01
0.92
0.11
0.47
0.29 0.05
0
1
2
3
4
5
6
7
8
9
Pakistan KPK Punjab Sindh Balochistan
Nu
mb
er
of
farm
s (M
illio
n)
TENURE CLASSIFICATION OF FARMS
Owner Owner-cum-Tenant Tenant
39.43
4.35
20.60
7.83 6.66
7.58
0.80
5.36
0.74 0.67
5.89
0.42
3.36
1.29 0.82
0
10
20
30
40
50
60
Pakistan KPK Punjab Sindh Balochistan
Farm
Are
a (M
illio
n A
cre
s)
TENURE CLASSIFICATION OF FARM AREA
Owner Owner-cum-Tenant Tenant
Owner 82%
Owner-cum-
Tenant 7%
Tenant 11%
PAKISTAN LEVEL TENURE CLASSIFICATION OF FARMS
(8.26 MILLION)
Owner 75%
Owner- cum-
tenant 14%
Tenant 11%
PAKISTAN LEVEL TENURE CLASSIFICATION OF FARM AREA
(52.91 MILLION ACRES)
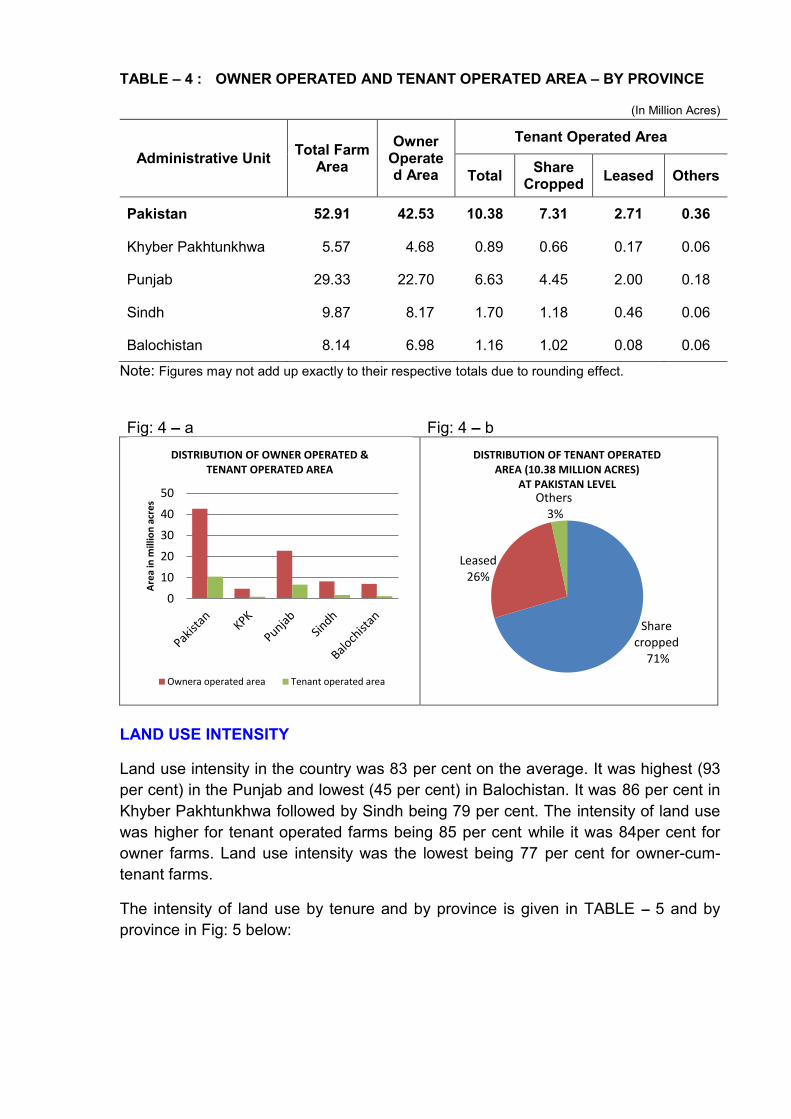
TABLE – 4 : OWNER OPERATED AND TENANT OPERATED AREA – BY PROVINCE
(In Million Acres)
Administrative Unit Total Farm Area
Owner Operated Area
Tenant Operated Area
Total Share Cropped Leased Others
Pakistan 52.91 42.53 10.38 7.31 2.71 0.36
Khyber Pakhtunkhwa 5.57 4.68 0.89 0.66 0.17 0.06
Punjab 29.33 22.70 6.63 4.45 2.00 0.18
Sindh 9.87 8.17 1.70 1.18 0.46 0.06
Balochistan 8.14 6.98 1.16 1.02 0.08 0.06
Note: Figures may not add up exactly to their respective totals due to rounding effect. Fig: 4 – a Fig: 4 – b
LAND USE INTENSITY
Land use intensity in the country was 83 per cent on the average. It was highest (93 per cent) in the Punjab and lowest (45 per cent) in Balochistan. It was 86 per cent in Khyber Pakhtunkhwa followed by Sindh being 79 per cent. The intensity of land use was higher for tenant operated farms being 85 per cent while it was 84per cent for owner farms. Land use intensity was the lowest being 77 per cent for owner-cum-tenant farms.
The intensity of land use by tenure and by province is given in TABLE – 5 and by province in Fig: 5 below:
0
10
20
30
40
50
Are
a in
mill
ion
acr
es
DISTRIBUTION OF OWNER OPERATED & TENANT OPERATED AREA
Ownera operated area Tenant operated area
Share cropped
71%
Leased 26%
Others 3%
DISTRIBUTION OF TENANT OPERATED AREA (10.38 MILLION ACRES)
AT PAKISTAN LEVEL
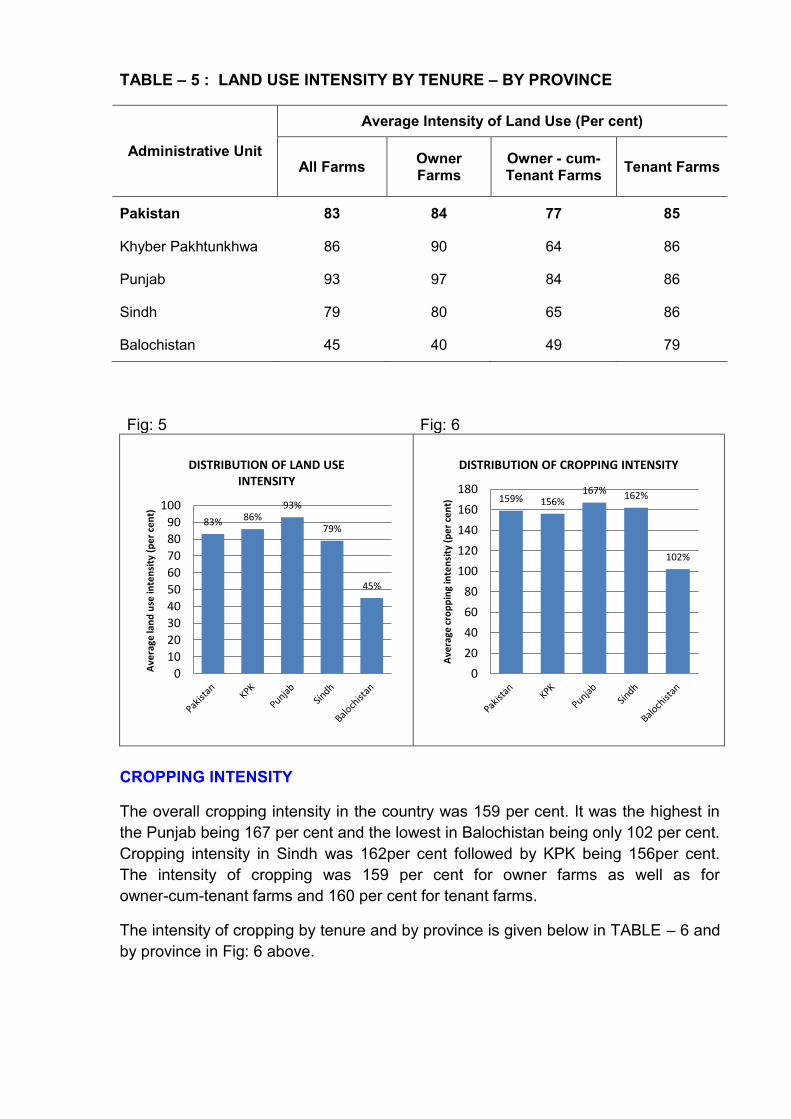
TABLE – 5 : LAND USE INTENSITY BY TENURE – BY PROVINCE
Administrative Unit
Average Intensity of Land Use (Per cent)
All Farms Owner Farms
Owner - cum-Tenant Farms Tenant Farms
Pakistan 83 84 77 85
Khyber Pakhtunkhwa 86 90 64 86
Punjab 93 97 84 86
Sindh 79 80 65 86
Balochistan 45 40 49 79
Fig: 5 Fig: 6
CROPPING INTENSITY
The overall cropping intensity in the country was 159 per cent. It was the highest in the Punjab being 167 per cent and the lowest in Balochistan being only 102 per cent. Cropping intensity in Sindh was 162per cent followed by KPK being 156per cent. The intensity of cropping was 159 per cent for owner farms as well as for owner-cum-tenant farms and 160 per cent for tenant farms.
The intensity of cropping by tenure and by province is given below in TABLE – 6 and by province in Fig: 6 above.
83% 86% 93%
79%
45%
0
10
20
30
40
50
60
70
80
90
100
Ave
rage
lan
d u
se in
ten
sity
(p
er
cen
t)
DISTRIBUTION OF LAND USE INTENSITY
159% 156% 167% 162%
102%
0
20
40
60
80
100
120
140
160
180
Ave
rage
cro
pp
ing
inte
nsi
ty (
pe
r ce
nt)
DISTRIBUTION OF CROPPING INTENSITY
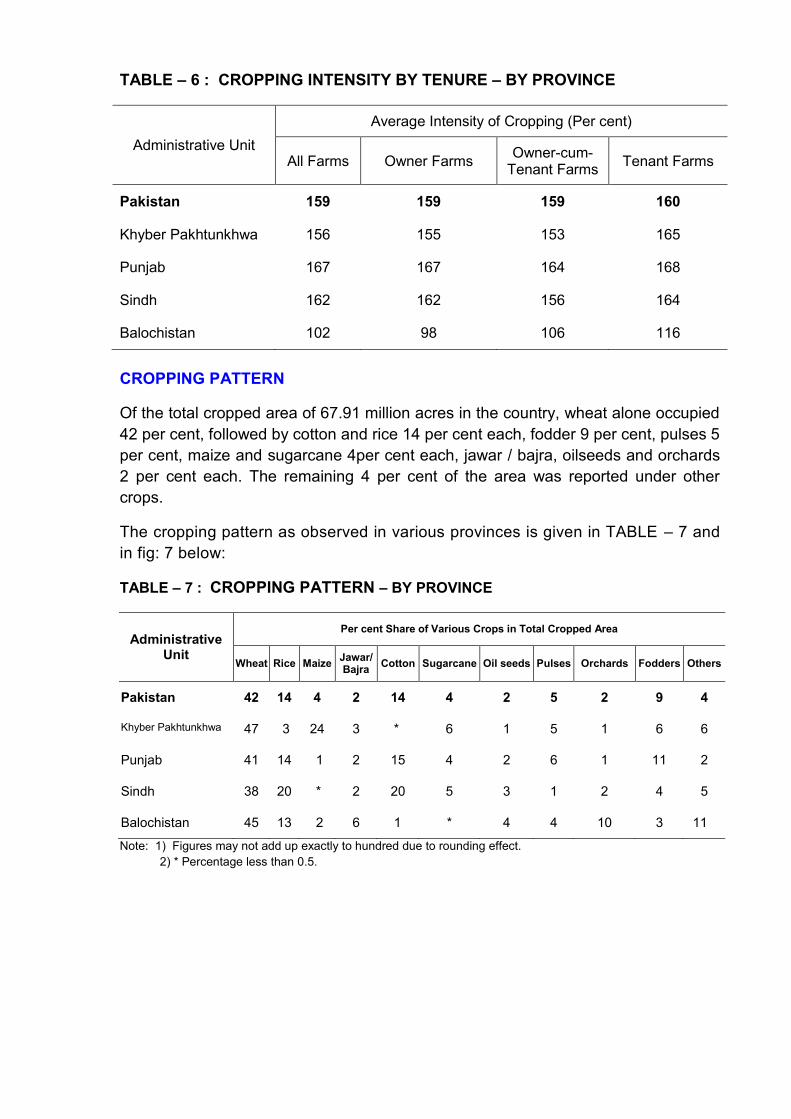
TABLE – 6 : CROPPING INTENSITY BY TENURE – BY PROVINCE
Administrative Unit Average Intensity of Cropping (Per cent)
All Farms Owner Farms Owner-cum- Tenant Farms Tenant Farms
Pakistan 159 159 159 160
Khyber Pakhtunkhwa 156 155 153 165
Punjab 167 167 164 168
Sindh 162 162 156 164
Balochistan 102 98 106 116
CROPPING PATTERN
Of the total cropped area of 67.91 million acres in the country, wheat alone occupied 42 per cent, followed by cotton and rice 14 per cent each, fodder 9 per cent, pulses 5 per cent, maize and sugarcane 4per cent each, jawar / bajra, oilseeds and orchards 2 per cent each. The remaining 4 per cent of the area was reported under other crops.
The cropping pattern as observed in various provinces is given in TABLE – 7 and in fig: 7 below:
TABLE – 7 : CROPPING PATTERN – BY PROVINCE
Administrative Unit
Per cent Share of Various Crops in Total Cropped Area
Wheat Rice Maize Jawar/Bajra Cotton Sugarcane Oil seeds Pulses Orchards Fodders Others
Pakistan 42 14 4 2 14 4 2 5 2 9 4
Khyber Pakhtunkhwa 47 3 24 3 * 6 1 5 1 6 6
Punjab 41 14 1 2 15 4 2 6 1 11 2
Sindh 38 20 * 2 20 5 3 1 2 4 5
Balochistan 45 13 2 6 1 * 4 4 10 3 11
Note: 1) Figures may not add up exactly to hundred due to rounding effect. 2) * Percentage less than 0.5.
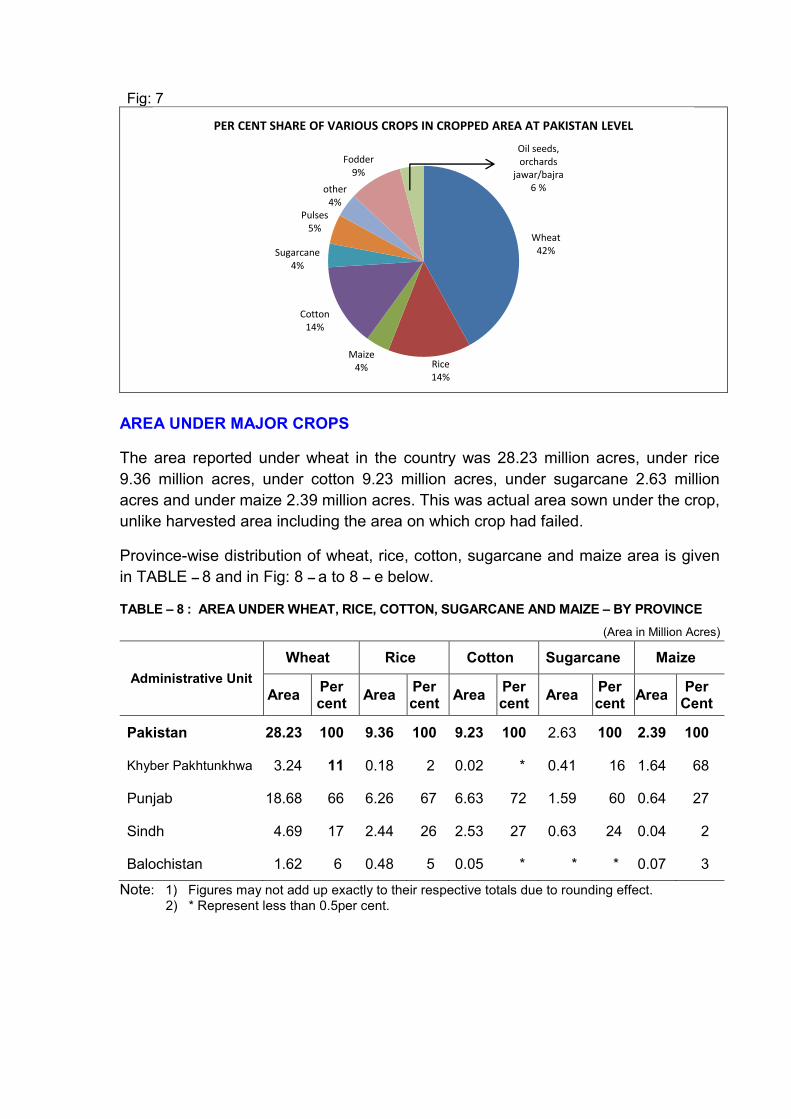
Fig: 7
AREA UNDER MAJOR CROPS
The area reported under wheat in the country was 28.23 million acres, under rice 9.36 million acres, under cotton 9.23 million acres, under sugarcane 2.63 million acres and under maize 2.39 million acres. This was actual area sown under the crop, unlike harvested area including the area on which crop had failed.
Province-wise distribution of wheat, rice, cotton, sugarcane and maize area is given in TABLE – 8 and in Fig: 8 – a to 8 – e below.
TABLE – 8 : AREA UNDER WHEAT, RICE, COTTON, SUGARCANE AND MAIZE – BY PROVINCE (Area in Million Acres)
Administrative Unit Wheat Rice Cotton Sugarcane Maize
Area Per cent Area Per
cent Area Per cent Area Per
cent Area Per Cent
Pakistan 28.23 100 9.36 100 9.23 100 2.63 100 2.39 100
Khyber Pakhtunkhwa 3.24 11 0.18 2 0.02 * 0.41 16 1.64 68
Punjab 18.68 66 6.26 67 6.63 72 1.59 60 0.64 27
Sindh 4.69 17 2.44 26 2.53 27 0.63 24 0.04 2
Balochistan 1.62 6 0.48 5 0.05 * * * 0.07 3
Note: 1) Figures may not add up exactly to their respective totals due to rounding effect. 2) * Represent less than 0.5per cent.
Wheat 42%
Rice 14%
Maize 4%
Cotton 14%
Sugarcane 4%
Pulses 5%
other 4%
Fodder 9%
Oil seeds, orchards
jawar/bajra 6 %
PER CENT SHARE OF VARIOUS CROPS IN CROPPED AREA AT PAKISTAN LEVEL
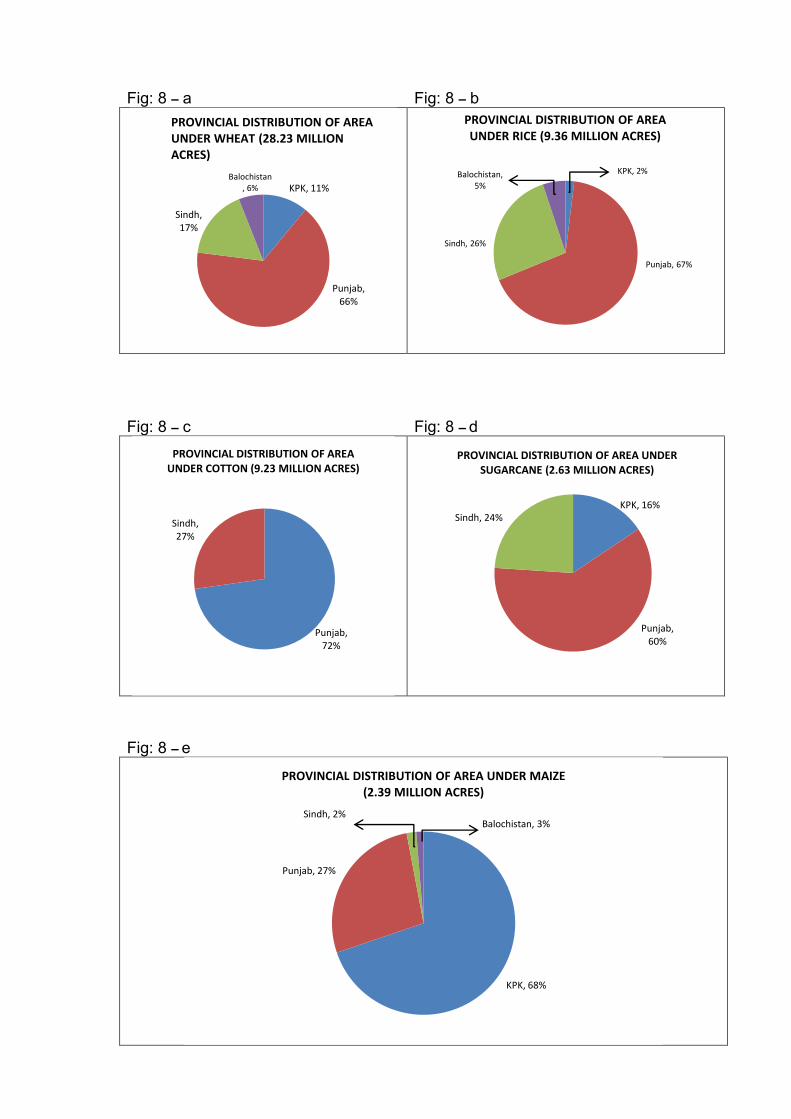
Fig: 8 – a Fig: 8 – b
Fig: 8 – c Fig: 8 – d
Fig: 8 – e
KPK, 11%
Punjab, 66%
Sindh, 17%
Balochistan, 6%
PROVINCIAL DISTRIBUTION OF AREA UNDER WHEAT (28.23 MILLION ACRES)
KPK, 2%
Punjab, 67%
Sindh, 26%
Balochistan, 5%
PROVINCIAL DISTRIBUTION OF AREA UNDER RICE (9.36 MILLION ACRES)
Punjab, 72%
Sindh, 27%
PROVINCIAL DISTRIBUTION OF AREA UNDER COTTON (9.23 MILLION ACRES)
KPK, 16%
Punjab, 60%
Sindh, 24%
PROVINCIAL DISTRIBUTION OF AREA UNDER SUGARCANE (2.63 MILLION ACRES)
KPK, 68%
Punjab, 27%
Sindh, 2% Balochistan, 3%
PROVINCIAL DISTRIBUTION OF AREA UNDER MAIZE (2.39 MILLION ACRES)
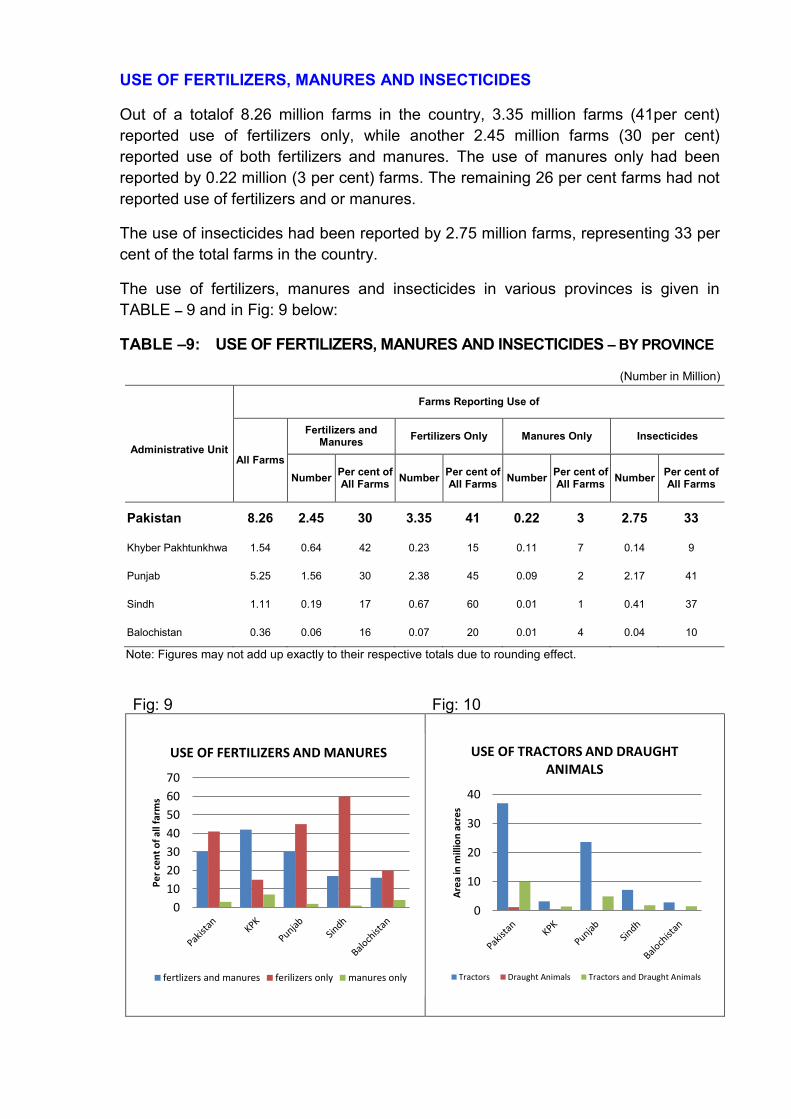
USE OF FERTILIZERS, MANURES AND INSECTICIDES
Out of a totalof 8.26 million farms in the country, 3.35 million farms (41per cent) reported use of fertilizers only, while another 2.45 million farms (30 per cent) reported use of both fertilizers and manures. The use of manures only had been reported by 0.22 million (3 per cent) farms. The remaining 26 per cent farms had not reported use of fertilizers and or manures.
The use of insecticides had been reported by 2.75 million farms, representing 33 per cent of the total farms in the country.
The use of fertilizers, manures and insecticides in various provinces is given in TABLE – 9 and in Fig: 9 below:
TABLE –9: USE OF FERTILIZERS, MANURES AND INSECTICIDES – BY PROVINCE
(Number in Million)
Administrative Unit
Farms Reporting Use of
All Farms
Fertilizers and Manures Fertilizers Only Manures Only Insecticides
Number Per cent of All Farms Number Per cent of
All Farms Number Per cent of All Farms Number Per cent of
All Farms
Pakistan 8.26 2.45 30 3.35 41 0.22 3 2.75 33
Khyber Pakhtunkhwa 1.54 0.64 42 0.23 15 0.11 7 0.14 9
Punjab 5.25 1.56 30 2.38 45 0.09 2 2.17 41
Sindh 1.11 0.19 17 0.67 60 0.01 1 0.41 37
Balochistan 0.36 0.06 16 0.07 20 0.01 4 0.04 10
Note: Figures may not add up exactly to their respective totals due to rounding effect.
Fig: 9 Fig: 10
0
10
20
30
40
50
60
70
Pe
r ce
nt
of
all f
arm
s
USE OF FERTILIZERS AND MANURES
fertlizers and manures ferilizers only manures only
0
10
20
30
40
Are
a in
mill
ion
acr
es
USE OF TRACTORS AND DRAUGHT ANIMALS
Tractors Draught Animals Tractors and Draught Animals
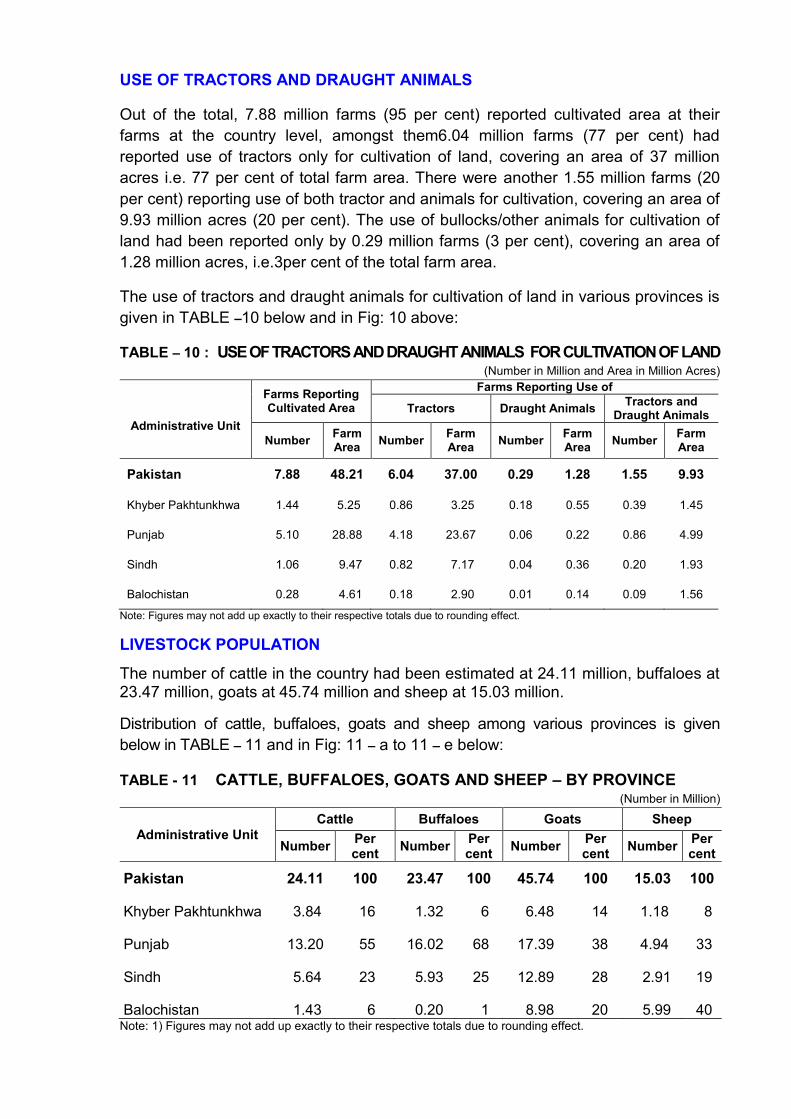
USE OF TRACTORS AND DRAUGHT ANIMALS
Out of the total, 7.88 million farms (95 per cent) reported cultivated area at their farms at the country level, amongst them6.04 million farms (77 per cent) had reported use of tractors only for cultivation of land, covering an area of 37 million acres i.e. 77 per cent of total farm area. There were another 1.55 million farms (20 per cent) reporting use of both tractor and animals for cultivation, covering an area of 9.93 million acres (20 per cent). The use of bullocks/other animals for cultivation of land had been reported only by 0.29 million farms (3 per cent), covering an area of 1.28 million acres, i.e.3per cent of the total farm area.
The use of tractors and draught animals for cultivation of land in various provinces is given in TABLE –10 below and in Fig: 10 above:
TABLE – 10 : USE OF TRACTORS AND DRAUGHT ANIMALS FOR CULTIVATION OF LAND (Number in Million and Area in Million Acres)
Administrative Unit
Farms Reporting Cultivated Area
Farms Reporting Use of
Tractors Draught Animals Tractors and Draught Animals
Number Farm Area Number Farm
Area Number Farm Area Number Farm
Area
Pakistan 7.88 48.21 6.04 37.00 0.29 1.28 1.55 9.93
Khyber Pakhtunkhwa 1.44 5.25 0.86 3.25 0.18 0.55 0.39 1.45
Punjab 5.10 28.88 4.18 23.67 0.06 0.22 0.86 4.99
Sindh 1.06 9.47 0.82 7.17 0.04 0.36 0.20 1.93
Balochistan 0.28 4.61 0.18 2.90 0.01 0.14 0.09 1.56
Note: Figures may not add up exactly to their respective totals due to rounding effect.
LIVESTOCK POPULATION
The number of cattle in the country had been estimated at 24.11 million, buffaloes at 23.47 million, goats at 45.74 million and sheep at 15.03 million.
Distribution of cattle, buffaloes, goats and sheep among various provinces is given below in TABLE – 11 and in Fig: 11 – a to 11 – e below:
TABLE - 11 CATTLE, BUFFALOES, GOATS AND SHEEP – BY PROVINCE (Number in Million)
Administrative Unit Cattle Buffaloes Goats Sheep
Number Per cent Number Per
cent Number Per cent Number Per
cent
Pakistan 24.11 100 23.47 100 45.74 100 15.03 100
Khyber Pakhtunkhwa 3.84 16 1.32 6 6.48 14 1.18 8
Punjab 13.20 55 16.02 68 17.39 38 4.94 33
Sindh 5.64 23 5.93 25 12.89 28 2.91 19
Balochistan 1.43 6 0.20 1 8.98 20 5.99 40 Note: 1) Figures may not add up exactly to their respective totals due to rounding effect.
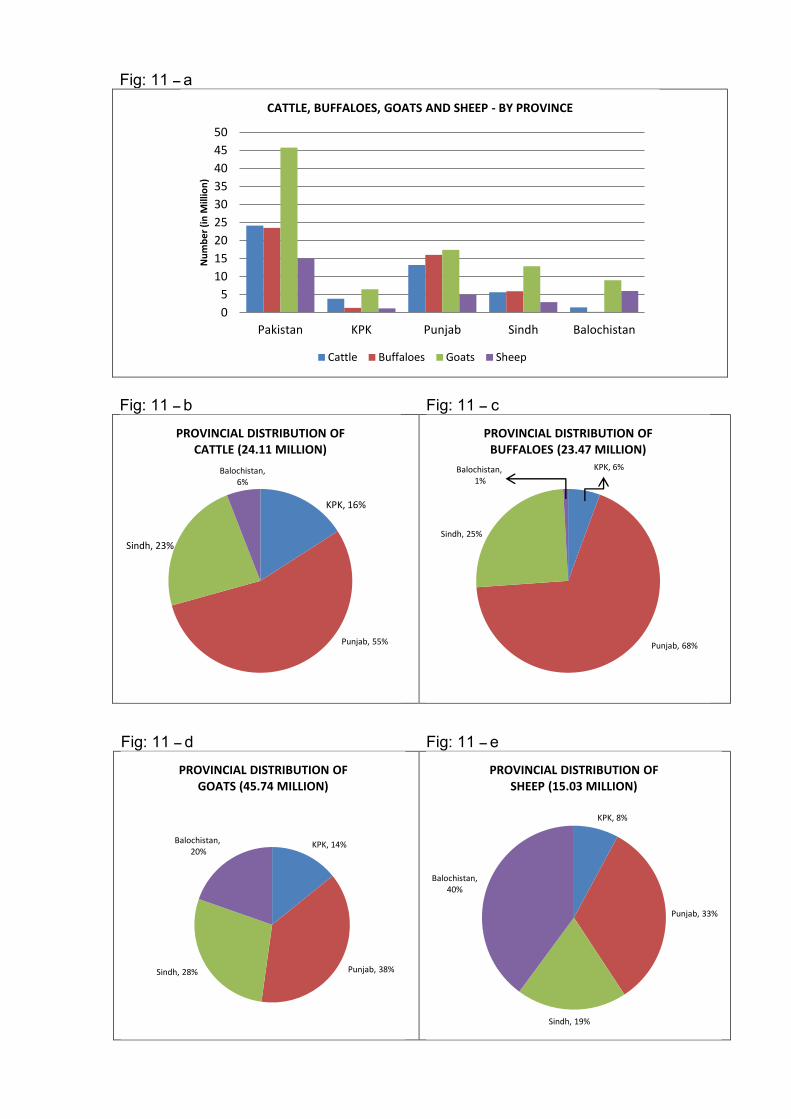
Fig: 11 – a
Fig: 11 – b Fig: 11 – c
Fig: 11 – d Fig: 11 – e
0
5
10
15
20
25
30
35
40
45
50
Pakistan KPK Punjab Sindh Balochistan
Nu
mb
er
(in
Mill
ion
)
CATTLE, BUFFALOES, GOATS AND SHEEP - BY PROVINCE
Cattle Buffaloes Goats Sheep
KPK, 16%
Punjab, 55%
Sindh, 23%
Balochistan, 6%
PROVINCIAL DISTRIBUTION OF CATTLE (24.11 MILLION)
KPK, 6%
Punjab, 68%
Sindh, 25%
Balochistan, 1%
PROVINCIAL DISTRIBUTION OF BUFFALOES (23.47 MILLION)
KPK, 14%
Punjab, 38% Sindh, 28%
Balochistan, 20%
PROVINCIAL DISTRIBUTION OF GOATS (45.74 MILLION)
KPK, 8%
Punjab, 33%
Sindh, 19%
Balochistan, 40%
PROVINCIAL DISTRIBUTION OF SHEEP (15.03 MILLION)
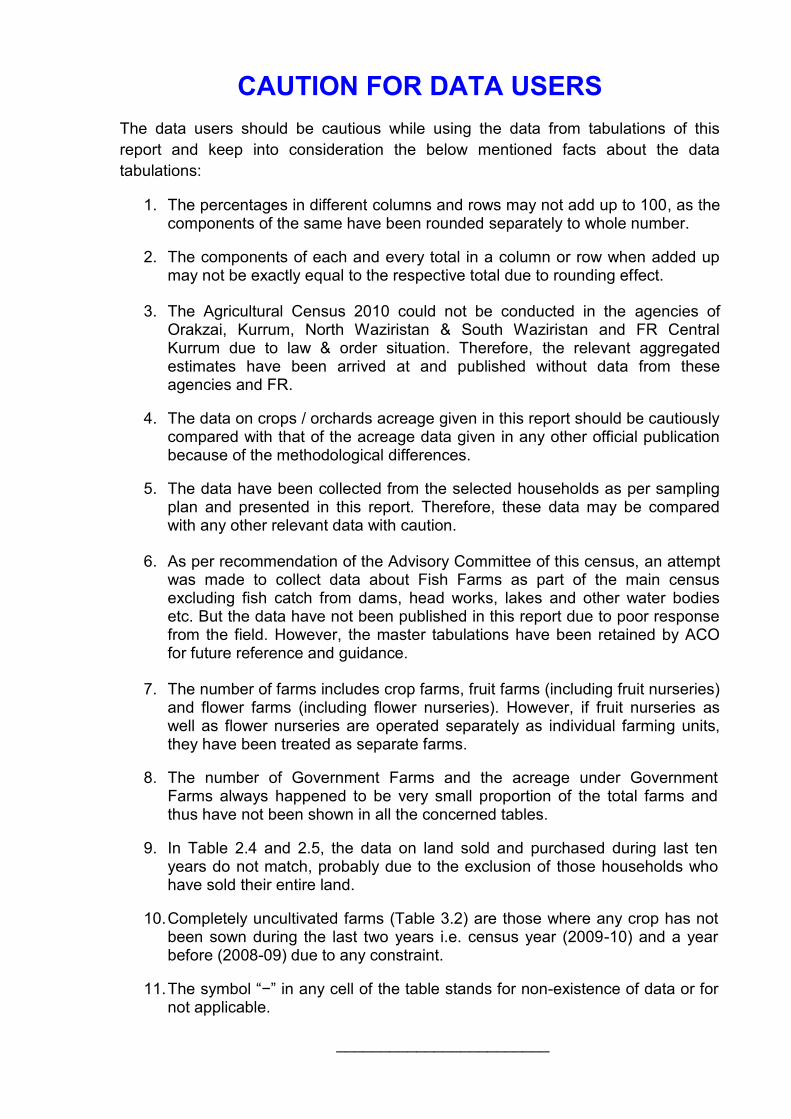
CAUTION FOR DATA USERS The data users should be cautious while using the data from tabulations of this report and keep into consideration the below mentioned facts about the data tabulations:
1. The percentages in different columns and rows may not add up to 100, as the components of the same have been rounded separately to whole number.
2. The components of each and every total in a column or row when added up may not be exactly equal to the respective total due to rounding effect.
3. The Agricultural Census 2010 could not be conducted in the agencies of Orakzai, Kurrum, North Waziristan & South Waziristan and FR Central Kurrum due to law & order situation. Therefore, the relevant aggregated estimates have been arrived at and published without data from these agencies and FR.
4. The data on crops / orchards acreage given in this report should be cautiously compared with that of the acreage data given in any other official publication because of the methodological differences.
5. The data have been collected from the selected households as per sampling plan and presented in this report. Therefore, these data may be compared with any other relevant data with caution.
6. As per recommendation of the Advisory Committee of this census, an attempt was made to collect data about Fish Farms as part of the main census excluding fish catch from dams, head works, lakes and other water bodies etc. But the data have not been published in this report due to poor response from the field. However, the master tabulations have been retained by ACO for future reference and guidance.
7. The number of farms includes crop farms, fruit farms (including fruit nurseries) and flower farms (including flower nurseries). However, if fruit nurseries as well as flower nurseries are operated separately as individual farming units, they have been treated as separate farms.
8. The number of Government Farms and the acreage under Government Farms always happened to be very small proportion of the total farms and thus have not been shown in all the concerned tables.
9. In Table 2.4 and 2.5, the data on land sold and purchased during last ten years do not match, probably due to the exclusion of those households who have sold their entire land.
10. Completely uncultivated farms (Table 3.2) are those where any crop has not been sown during the last two years i.e. census year (2009-10) and a year before (2008-09) due to any constraint.
11. The symbol “−” in any cell of the table stands for non-existence of data or for not applicable.
________________________