agnc q3 2020 shareholder presentation
TRANSCRIPT
© 2020 AGNC Investment Corp. All Rights Reserved.
Q3 2020 Stockholder PresentationOctober 27, 2020
Safe harbor statement under the private securities litigation reform act of 1995
2
Safe Harbor Statement
This presentation contains statements that, to the extent they are not recitations of historical fact, constitute "forward-looking statements" within the meaning of the Private Securities Litigation Reform Act of 1995 (the “Reform Act”). All such forward-looking statements are intended to be subject to the safe harbor protection provided by the Reform Act. Actual outcomes and results could differ materially from such forecasts due to the impact of many factors beyond the control of AGNC Investment Corp. (“AGNC” or the “Company”). All forward-looking statements included in this presentation are made only as of the date of this presentation and are subject to change without notice. Certain important factors that could cause actual results to differ materially from those contained in the forward-looking statements are included in our periodic reports filed with the Securities and Exchange Commission (“SEC”). Copies are available on the SEC’s website at www.sec.gov. AGNC disclaims any obligation to update such forward-looking statements unless required by law.
The following slides contain summaries of certain financial and statistical information about AGNC. They should be read in conjunction with our periodic reports that are filed from time to time with the SEC. Historical results discussed in this presentation are not indicative of future results.
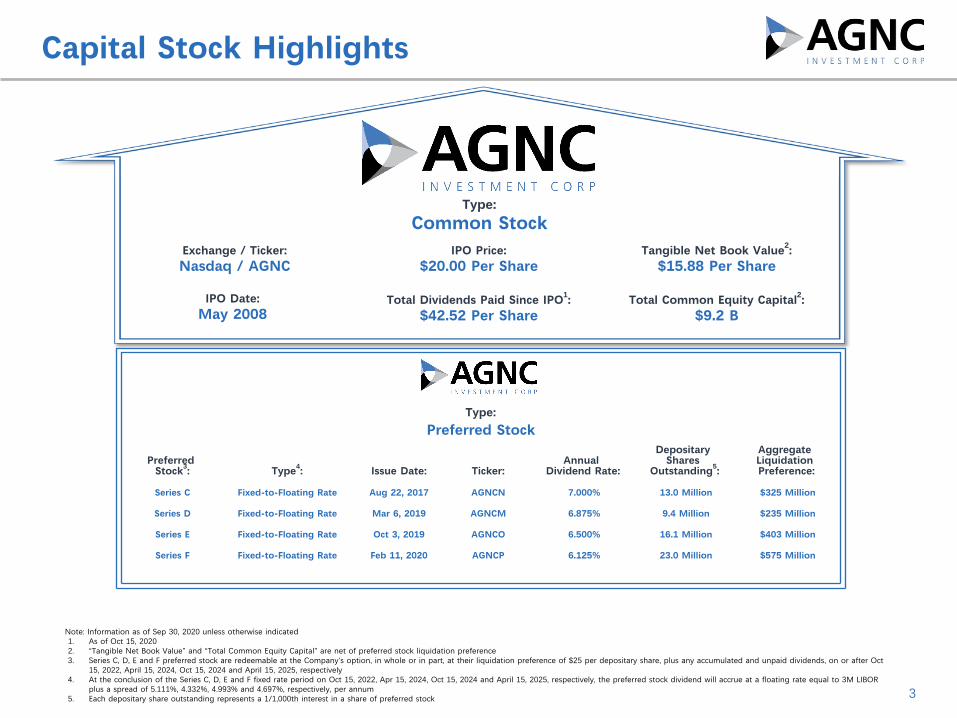
IPO Date:May 2008
Exchange / Ticker:Nasdaq / AGNC
Note: Information as of Sep 30, 2020 unless otherwise indicated1. As of Oct 15, 2020 2. “Tangible Net Book Value” and “Total Common Equity Capital” are net of preferred stock liquidation preference3. Series C, D, E and F preferred stock are redeemable at the Company's option, in whole or in part, at their liquidation preference of $25 per depositary share, plus any accumulated and unpaid dividends, on or after Oct
15, 2022, April 15, 2024, Oct 15, 2024 and April 15, 2025, respectively4. At the conclusion of the Series C, D, E and F fixed rate period on Oct 15, 2022, Apr 15, 2024, Oct 15, 2024 and April 15, 2025, respectively, the preferred stock dividend will accrue at a floating rate equal to 3M LIBOR
plus a spread of 5.111%, 4.332%, 4.993% and 4.697%, respectively, per annum5. Each depositary share outstanding represents a 1/1,000th interest in a share of preferred stock
Type:
Common StockTangible Net Book Value2:
$15.88 Per Share
Total Common Equity Capital2:$9.2 B
IPO Price:$20.00 Per Share
Total Dividends Paid Since IPO1:$42.52 Per Share
3
Capital Stock Highlights
Type:
Preferred Stock
Preferred Stock3: Type4: Issue Date: Ticker:
Annual Dividend Rate:
Depositary Shares
Outstanding5:
Aggregate Liquidation Preference:
Series C Fixed-to-Floating Rate Aug 22, 2017 AGNCN 7.000% 13.0 Million $325 Million
Series D Fixed-to-Floating Rate Mar 6, 2019 AGNCM 6.875% 9.4 Million $235 Million
Series E Fixed-to-Floating Rate Oct 3, 2019 AGNCO 6.500% 16.1 Million $403 Million
Series F Fixed-to-Floating Rate Feb 11, 2020 AGNCP 6.125% 23.0 Million $575 Million
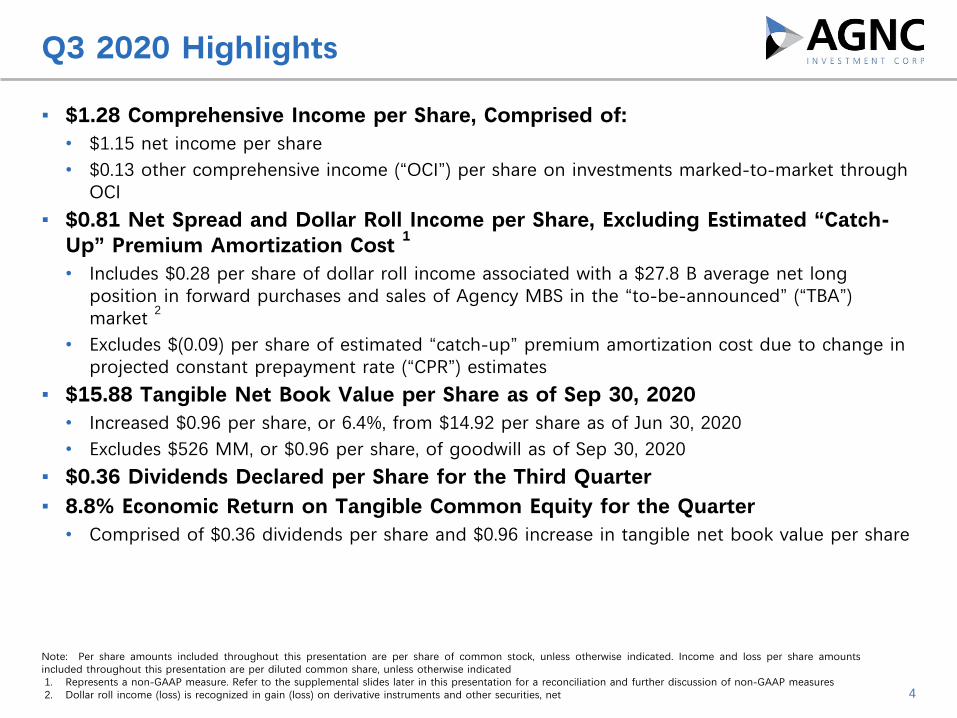
▪ $1.28 Comprehensive Income per Share, Comprised of:• $1.15 net income per share• $0.13 other comprehensive income (“OCI”) per share on investments marked-to-market through
OCI
▪ $0.81 Net Spread and Dollar Roll Income per Share, Excluding Estimated “Catch-Up” Premium Amortization Cost 1
• Includes $0.28 per share of dollar roll income associated with a $27.8 B average net long position in forward purchases and sales of Agency MBS in the “to-be-announced” (“TBA”) market 2
• Excludes $(0.09) per share of estimated “catch-up” premium amortization cost due to change in projected constant prepayment rate (“CPR”) estimates
▪ $15.88 Tangible Net Book Value per Share as of Sep 30, 2020• Increased $0.96 per share, or 6.4%, from $14.92 per share as of Jun 30, 2020• Excludes $526 MM, or $0.96 per share, of goodwill as of Sep 30, 2020
▪ $0.36 Dividends Declared per Share for the Third Quarter▪ 8.8% Economic Return on Tangible Common Equity for the Quarter• Comprised of $0.36 dividends per share and $0.96 increase in tangible net book value per share
Q3 2020 Highlights
Note: Per share amounts included throughout this presentation are per share of common stock, unless otherwise indicated. Income and loss per share amounts included throughout this presentation are per diluted common share, unless otherwise indicated1. Represents a non-GAAP measure. Refer to the supplemental slides later in this presentation for a reconciliation and further discussion of non-GAAP measures2. Dollar roll income (loss) is recognized in gain (loss) on derivative instruments and other securities, net 4
Q3 2020 Other Highlights
5
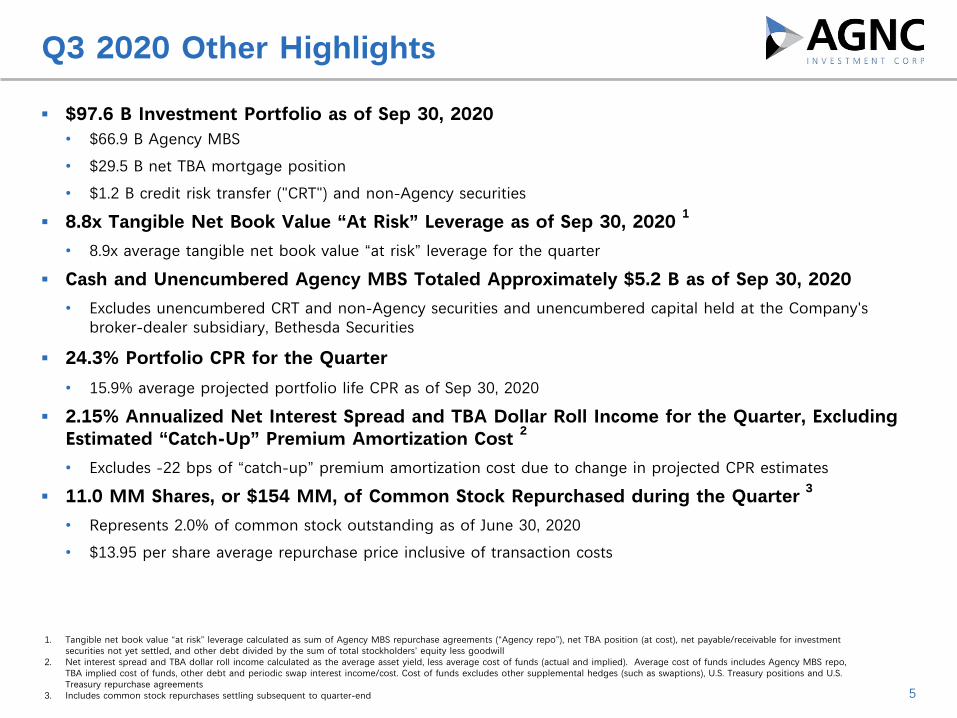
▪ $97.6 B Investment Portfolio as of Sep 30, 2020• $66.9 B Agency MBS
• $29.5 B net TBA mortgage position
• $1.2 B credit risk transfer ("CRT") and non-Agency securities
▪ 8.8x Tangible Net Book Value “At Risk” Leverage as of Sep 30, 2020 1
• 8.9x average tangible net book value “at risk” leverage for the quarter
▪ Cash and Unencumbered Agency MBS Totaled Approximately $5.2 B as of Sep 30, 2020
• Excludes unencumbered CRT and non-Agency securities and unencumbered capital held at the Company's broker-dealer subsidiary, Bethesda Securities
▪ 24.3% Portfolio CPR for the Quarter • 15.9% average projected portfolio life CPR as of Sep 30, 2020
▪ 2.15% Annualized Net Interest Spread and TBA Dollar Roll Income for the Quarter, Excluding Estimated “Catch-Up” Premium Amortization Cost 2
• Excludes -22 bps of “catch-up” premium amortization cost due to change in projected CPR estimates
▪ 11.0 MM Shares, or $154 MM, of Common Stock Repurchased during the Quarter 3
• Represents 2.0% of common stock outstanding as of June 30, 2020
• $13.95 per share average repurchase price inclusive of transaction costs
1. Tangible net book value “at risk” leverage calculated as sum of Agency MBS repurchase agreements (“Agency repo”), net TBA position (at cost), net payable/receivable for investment securities not yet settled, and other debt divided by the sum of total stockholders’ equity less goodwill
2. Net interest spread and TBA dollar roll income calculated as the average asset yield, less average cost of funds (actual and implied). Average cost of funds includes Agency MBS repo, TBA implied cost of funds, other debt and periodic swap interest income/cost. Cost of funds excludes other supplemental hedges (such as swaptions), U.S. Treasury positions and U.S. Treasury repurchase agreements
3. Includes common stock repurchases settling subsequent to quarter-end
6
Market Update
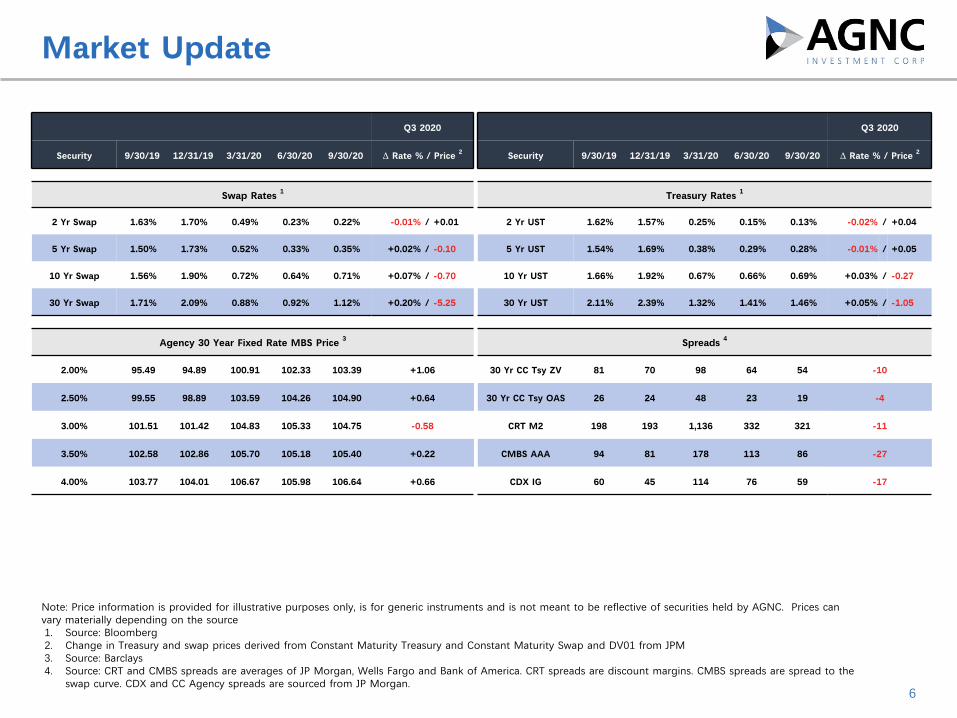
Note: Price information is provided for illustrative purposes only, is for generic instruments and is not meant to be reflective of securities held by AGNC. Prices can vary materially depending on the source1. Source: Bloomberg2. Change in Treasury and swap prices derived from Constant Maturity Treasury and Constant Maturity Swap and DV01 from JPM3. Source: Barclays4. Source: CRT and CMBS spreads are averages of JP Morgan, Wells Fargo and Bank of America. CRT spreads are discount margins. CMBS spreads are spread to the
swap curve. CDX and CC Agency spreads are sourced from JP Morgan.
Q3 2020 x Q3 2020
Security 9/30/19 12/31/19 3/31/20 6/30/20 9/30/20 🜂 Rate % / Price 2 x Security 9/30/19 12/31/19 3/31/20 6/30/20 9/30/20 🜂 Rate % / Price 2
Swap Rates 1 x Treasury Rates 1
2 Yr Swap 1.63% 1.70% 0.49% 0.23% 0.22% -0.01 % / +0.01 x 2 Yr UST 1.62% 1.57% 0.25% 0.15% 0.13% -0.02 % / +0.04
5 Yr Swap 1.50% 1.73% 0.52% 0.33% 0.35% +0.02 % / -0.10 x 5 Yr UST 1.54% 1.69% 0.38% 0.29% 0.28% -0.01 % / +0.05
10 Yr Swap 1.56% 1.90% 0.72% 0.64% 0.71% +0.07 % / -0.70 x 10 Yr UST 1.66% 1.92% 0.67% 0.66% 0.69% +0.03 % / -0.27
30 Yr Swap 1.71% 2.09% 0.88% 0.92% 1.12% +0.20 % / -5.25 x 30 Yr UST 2.11% 2.39% 1.32% 1.41% 1.46% +0.05 % / -1.05
x x x
Agency 30 Year Fixed Rate MBS Price 3 x Spreads 4
2.00% 95.49 94.89 100.91 102.33 103.39 +1.06 30 Yr CC Tsy ZV 81 70 98 64 54 -10
2.50% 99.55 98.89 103.59 104.26 104.90 +0.64 x 30 Yr CC Tsy OAS 26 24 48 23 19 -4
3.00% 101.51 101.42 104.83 105.33 104.75 -0.58 x CRT M2 198 193 1,136 332 321 -11
3.50% 102.58 102.86 105.70 105.18 105.40 +0.22 x CMBS AAA 94 81 178 113 86 -27
4.00% 103.77 104.01 106.67 105.98 106.64 +0.66 x CDX IG 60 45 114 76 59 -17
7
20YrFixed$2.8B3%
≤15YrFixed$12.0B12%
CRT&Non-Agency$1.3B1%
30YrFixed$80.9B83%
AgencyCMO,ARM&Other$0.7B1%20YrFixed$2.4B3%
≤15YrFixed$16.4B17% CRT&Non-Agency
$1.2B1%
30YrFixed$76.9B79%
AgencyCMO,ARM&Other$0.6B1%
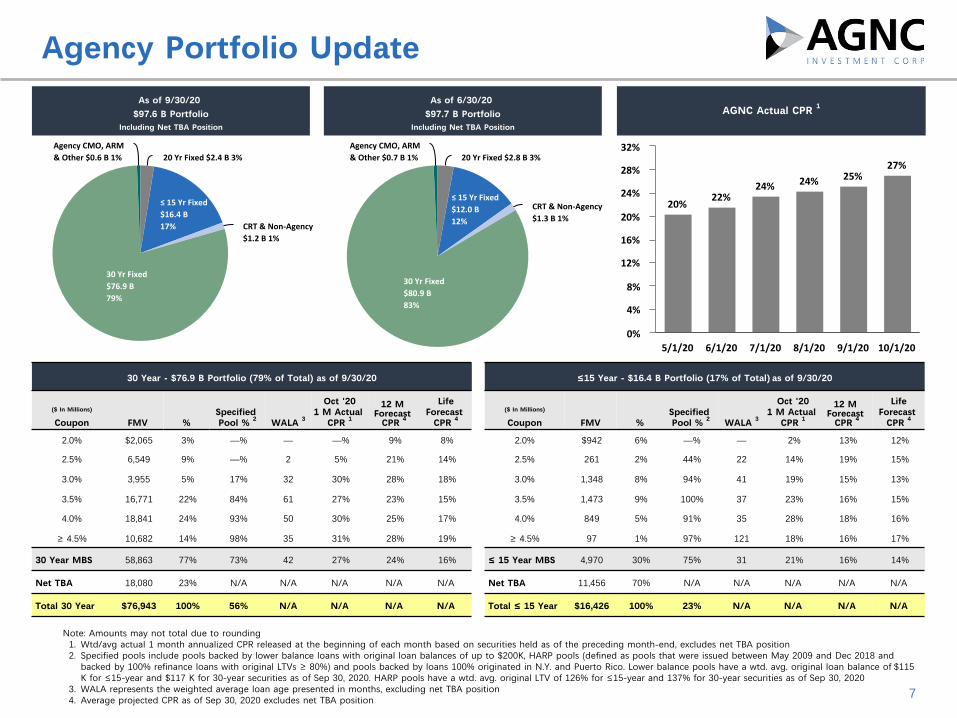
Note: Amounts may not total due to rounding1. Wtd/avg actual 1 month annualized CPR released at the beginning of each month based on securities held as of the preceding month-end, excludes net TBA position2. Specified pools include pools backed by lower balance loans with original loan balances of up to $200K, HARP pools (defined as pools that were issued between May 2009 and Dec 2018 and
backed by 100% refinance loans with original LTVs ≥ 80%) and pools backed by loans 100% originated in N.Y. and Puerto Rico. Lower balance pools have a wtd. avg. original loan balance of $115 K for ≤15-year and $117 K for 30-year securities as of Sep 30, 2020. HARP pools have a wtd. avg. original LTV of 126% for ≤15-year and 137% for 30-year securities as of Sep 30, 2020
3. WALA represents the weighted average loan age presented in months, excluding net TBA position4. Average projected CPR as of Sep 30, 2020 excludes net TBA position
Agency Portfolio UpdateAs of 9/30/20
$97.6 B PortfolioIncluding Net TBA Position
As of 6/30/20 $97.7 B Portfolio
Including Net TBA Position
AGNC Actual CPR 1
20%22%
24% 24% 25%27%
5/1/20 6/1/20 7/1/20 8/1/20 9/1/20 10/1/200%
4%
8%
12%
16%
20%
24%
28%
32%
30 Year - $76.9 B Portfolio (79% of Total) as of 9/30/20 ≤15 Year - $16.4 B Portfolio (17% of Total) as of 9/30/20
($ In Millions)
Coupon FMV %Specified Pool % 2 WALA 3
Oct '201 M Actual
CPR 112 M
Forecast CPR 4
LifeForecast
CPR 4($ In Millions)
Coupon FMV %Specified Pool % 2 WALA 3
Oct '201 M Actual
CPR 112 M
Forecast CPR 4
LifeForecast
CPR 4
2.0% $2,065 3% —% — —% 9% 8% 2.0% $942 6% —% — 2% 13% 12%
2.5% 6,549 9% —% 2 5% 21% 14% 2.5% 261 2% 44% 22 14% 19% 15%
3.0% 3,955 5% 17% 32 30% 28% 18% 3.0% 1,348 8% 94% 41 19% 15% 13%
3.5% 16,771 22% 84% 61 27% 23% 15% 3.5% 1,473 9% 100% 37 23% 16% 15%
4.0% 18,841 24% 93% 50 30% 25% 17% 4.0% 849 5% 91% 35 28% 18% 16%
≥ 4.5% 10,682 14% 98% 35 31% 28% 19% ≥ 4.5% 97 1% 97% 121 18% 16% 17%
30 Year MBS 58,863 77% 73% 42 27% 24% 16% ≤ 15 Year MBS 4,970 30% 75% 31 21% 16% 14%
Net TBA 18,080 23% N/A N/A N/A N/A N/A Net TBA 11,456 70% N/A N/A N/A N/A N/A
Total 30 Year $76,943 100% 56% N/A N/A N/A N/A Total ≤ 15 Year $16,426 100% 23% N/A N/A N/A N/A
1. As of Sep 30, 20202. Represents the lowest of Standard and Poor's ("S&P"), Moody's, Fitch, DBRS, Kroll Bond Rating Agency ("KBRA") and Morningstar credit ratings, stated in terms of the S&P equivalent rating3. Excludes interest only securities (face value of $59MM as of Sep 30, 2020) 8
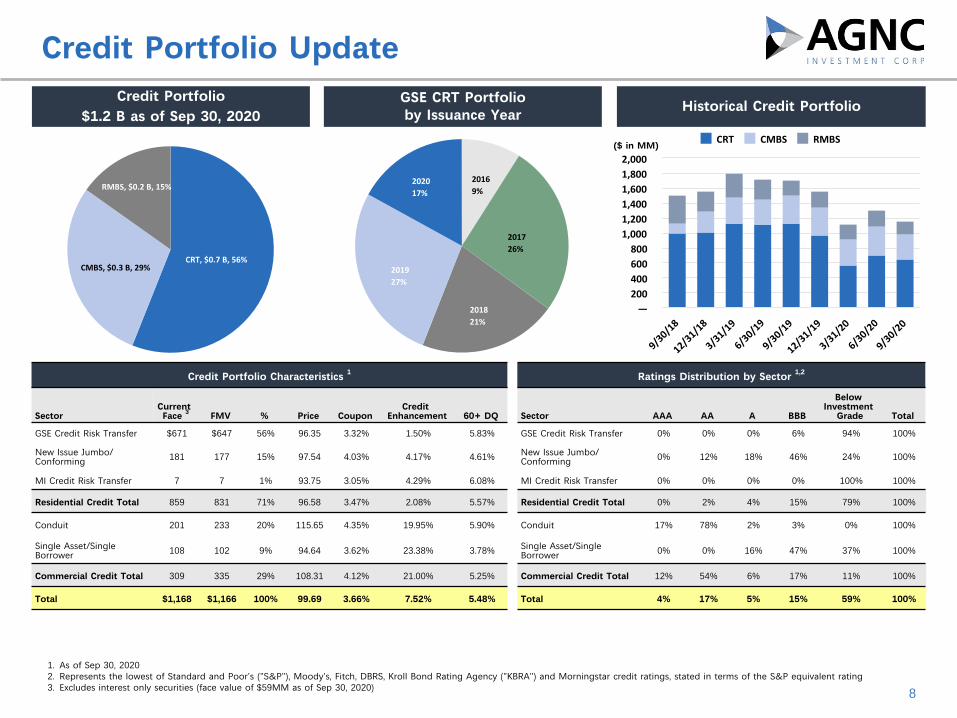
Credit Portfolio UpdateCredit Portfolio
$1.2 B as of Sep 30, 2020GSE CRT Portfolioby Issuance Year Historical Credit Portfolio
Credit Portfolio Characteristics 1x
Ratings Distribution by Sector 1,2
SectorCurrent Face 3 FMV % Price Coupon
Credit Enhancement 60+ DQ x Sector AAA AA A BBB
Below Investment
Grade Total
GSE Credit Risk Transfer $671 $647 56% 96.35 3.32% 1.50% 5.83%x
GSE Credit Risk Transfer 0% 0% 0% 6% 94% 100%
New Issue Jumbo/Conforming 181 177 15% 97.54 4.03% 4.17% 4.61%
x
New Issue Jumbo/Conforming 0% 12% 18% 46% 24% 100%
MI Credit Risk Transfer 7 7 1% 93.75 3.05% 4.29% 6.08%x
MI Credit Risk Transfer 0% 0% 0% 0% 100% 100%
Residential Credit Total 859 831 71% 96.58 3.47% 2.08% 5.57%x
Residential Credit Total 0% 2% 4% 15% 79% 100%
Conduit 201 233 20% 115.65 4.35% 19.95% 5.90%x
Conduit 17% 78% 2% 3% 0% 100%
Single Asset/Single Borrower 108 102 9% 94.64 3.62% 23.38% 3.78%
x
Single Asset/Single Borrower 0% 0% 16% 47% 37% 100%
Commercial Credit Total 309 335 29% 108.31 4.12% 21.00% 5.25%x
Commercial Credit Total 12% 54% 6% 17% 11% 100%
Total $1,168 $1,166 100% 99.69 3.66% 7.52% 5.48%x
Total 4% 17% 5% 15% 59% 100%
($ in MM)CRT CMBS RMBS
9/30/18
12/31/18
3/31/19
6/30/19
9/30/19
12/31/19
3/31/20
6/30/20
9/30/20
—200400600800
1,0001,2001,4001,6001,8002,000
CRT,$0.7B,56%CMBS,$0.3B,29%
RMBS,$0.2B,15%20169%
201726%
201821%
201927%
202017%
AGNC has access to attractive funding across a significant number of counterparties and a wide range of financing terms
9
Financing Summary
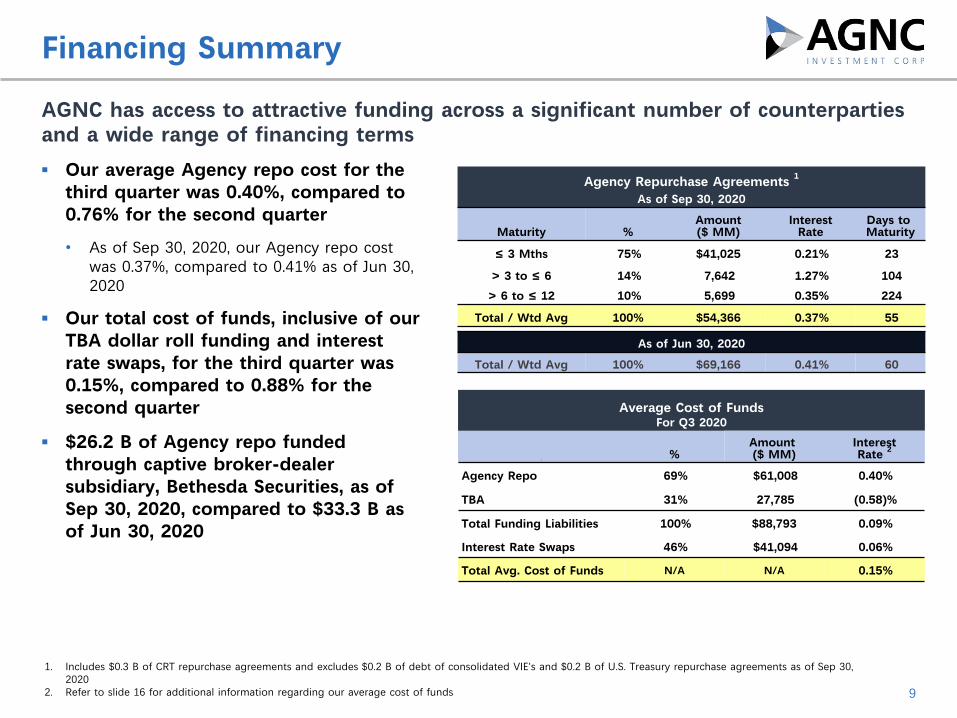
▪ Our average Agency repo cost for the third quarter was 0.40%, compared to 0.76% for the second quarter
• As of Sep 30, 2020, our Agency repo cost was 0.37%, compared to 0.41% as of Jun 30, 2020
▪ Our total cost of funds, inclusive of our TBA dollar roll funding and interest rate swaps, for the third quarter was 0.15%, compared to 0.88% for the second quarter
▪ $26.2 B of Agency repo funded through captive broker-dealer subsidiary, Bethesda Securities, as of Sep 30, 2020, compared to $33.3 B as of Jun 30, 2020
1. Includes $0.3 B of CRT repurchase agreements and excludes $0.2 B of debt of consolidated VIE's and $0.2 B of U.S. Treasury repurchase agreements as of Sep 30, 2020
2. Refer to slide 16 for additional information regarding our average cost of funds
Agency Repurchase Agreements 1
As of Sep 30, 2020
Maturity %Amount($ MM)
InterestRate
Days to Maturity
≤ 3 Mths 75% $41,025 0.21% 23
> 3 to ≤ 6 14% 7,642 1.27% 104
> 6 to ≤ 12 10% 5,699 0.35% 224
Total / Wtd Avg 100% $54,366 0.37% 55
x xx
x xAs of Jun 30, 2020
Total / Wtd Avg 100% $69,166 0.41% 60
Average Cost of FundsFor Q3 2020
x
%Amount ($ MM)
InterestRate 2
Agency Repo 69% $61,008 0.40%
TBA 31% 27,785 (0.58)%
Total Funding Liabilities 100% $88,793 0.09%
Interest Rate Swaps 46% $41,094 0.06%
Total Avg. Cost of Funds N/A N/A 0.15%
10
Hedging Summary
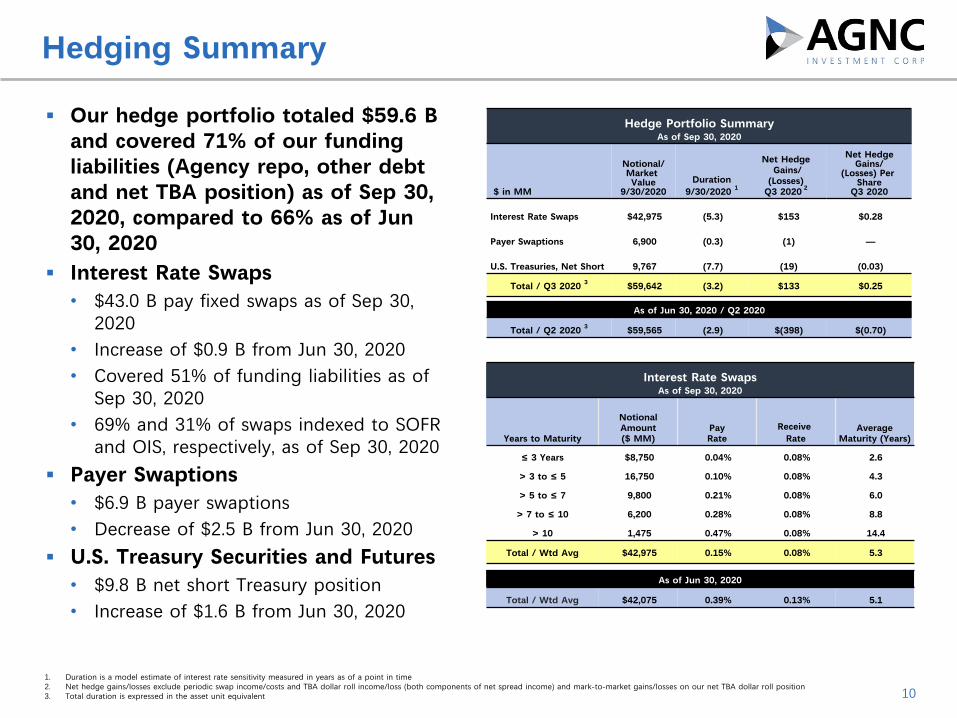
▪ Our hedge portfolio totaled $59.6 B and covered 71% of our funding liabilities (Agency repo, other debt and net TBA position) as of Sep 30, 2020, compared to 66% as of Jun 30, 2020
▪ Interest Rate Swaps • $43.0 B pay fixed swaps as of Sep 30,
2020• Increase of $0.9 B from Jun 30, 2020• Covered 51% of funding liabilities as of
Sep 30, 2020• 69% and 31% of swaps indexed to SOFR
and OIS, respectively, as of Sep 30, 2020
▪ Payer Swaptions• $6.9 B payer swaptions• Decrease of $2.5 B from Jun 30, 2020
▪ U.S. Treasury Securities and Futures• $9.8 B net short Treasury position• Increase of $1.6 B from Jun 30, 2020
1. Duration is a model estimate of interest rate sensitivity measured in years as of a point in time2. Net hedge gains/losses exclude periodic swap income/costs and TBA dollar roll income/loss (both components of net spread income) and mark-to-market gains/losses on our net TBA dollar roll position3. Total duration is expressed in the asset unit equivalent
Hedge Portfolio SummaryAs of Sep 30, 2020
$ in MM
Notional/Market Value
9/30/2020Duration
9/30/2020 1
Net Hedge Gains/
(Losses) Q3 2020 2
Net Hedge Gains/
(Losses) Per Share
Q3 2020
Interest Rate Swaps $42,975 (5.3) $153 $0.28
Payer Swaptions 6,900 (0.3) (1) —
U.S. Treasuries, Net Short 9,767 (7.7) (19) (0.03)
Total / Q3 2020 3 $59,642 (3.2) $133 $0.25x x
x
x x
As of Jun 30, 2020 / Q2 2020
Total / Q2 2020 3 $59,565 (2.9) $(398) $(0.70)
Interest Rate SwapsAs of Sep 30, 2020
Years to Maturity
NotionalAmount($ MM)
PayRate
Receive Rate
AverageMaturity (Years)
≤ 3 Years $8,750 0.04% 0.08% 2.6
> 3 to ≤ 5 16,750 0.10% 0.08% 4.3
> 5 to ≤ 7 9,800 0.21% 0.08% 6.0
> 7 to ≤ 10 6,200 0.28% 0.08% 8.8
> 10 1,475 0.47% 0.08% 14.4
Total / Wtd Avg $42,975 0.15% 0.08% 5.3x
As of Jun 30, 2020
Total / Wtd Avg $42,075 0.39% 0.13% 5.1
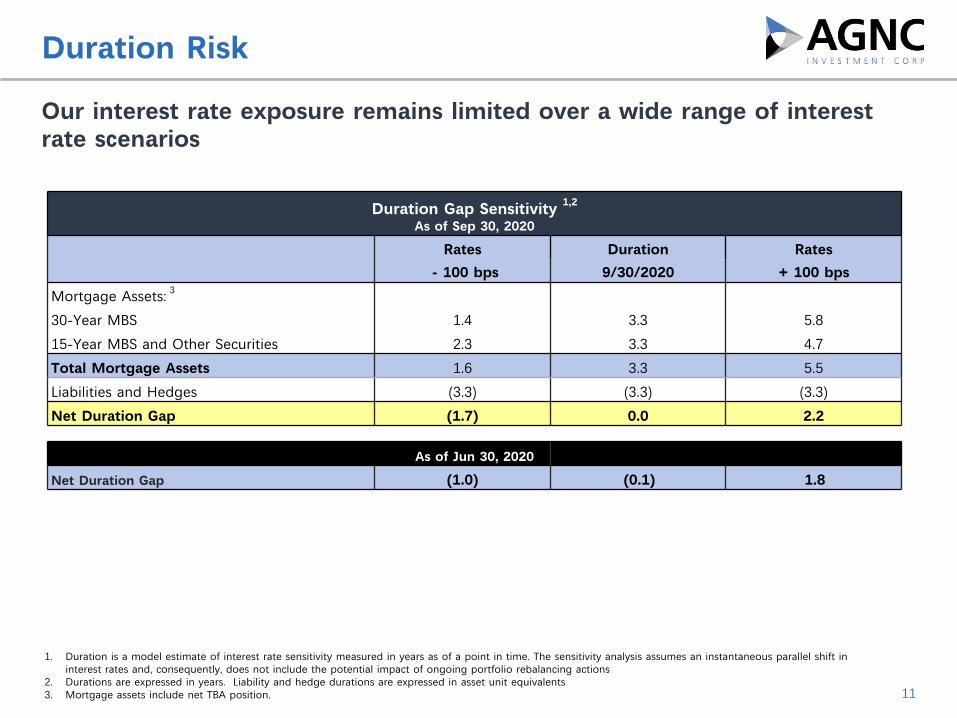
Our interest rate exposure remains limited over a wide range of interest rate scenarios
11
Duration Risk
Duration Gap Sensitivity 1,2
As of Sep 30, 2020
Rates Duration Rates
- 100 bps 9/30/2020 + 100 bps
Mortgage Assets: 3
30-Year MBS 1.4 3.3 5.8
15-Year MBS and Other Securities 2.3 3.3 4.7
Total Mortgage Assets 1.6 3.3 5.5
Liabilities and Hedges (3.3) (3.3) (3.3)
Net Duration Gap (1.7) 0.0 2.2x
As of Jun 30, 2020
Net Duration Gap (1.0) (0.1) 1.8
1. Duration is a model estimate of interest rate sensitivity measured in years as of a point in time. The sensitivity analysis assumes an instantaneous parallel shift in interest rates and, consequently, does not include the potential impact of ongoing portfolio rebalancing actions
2. Durations are expressed in years. Liability and hedge durations are expressed in asset unit equivalents3. Mortgage assets include net TBA position.

Financial Results
13
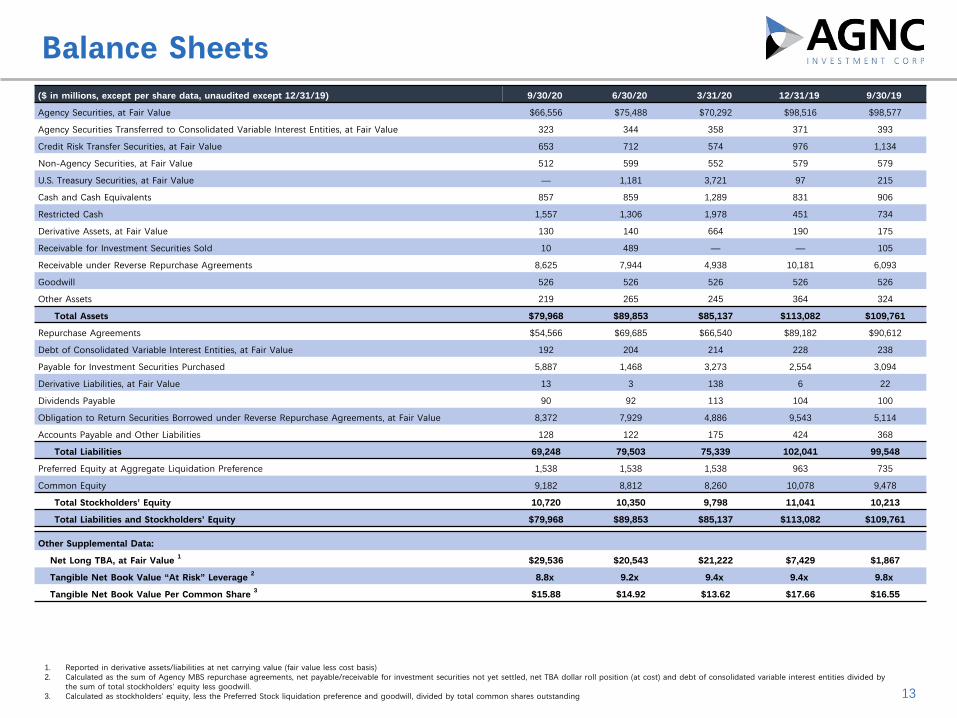
Balance Sheets
1. Reported in derivative assets/liabilities at net carrying value (fair value less cost basis)2. Calculated as the sum of Agency MBS repurchase agreements, net payable/receivable for investment securities not yet settled, net TBA dollar roll position (at cost) and debt of consolidated variable interest entities divided by
the sum of total stockholders’ equity less goodwill.3. Calculated as stockholders’ equity, less the Preferred Stock liquidation preference and goodwill, divided by total common shares outstanding
($ in millions, except per share data, unaudited except 12/31/19) 9/30/20 6/30/20 3/31/20 12/31/19 9/30/19
Agency Securities, at Fair Value $66,556 $75,488 $70,292 $98,516 $98,577
Agency Securities Transferred to Consolidated Variable Interest Entities, at Fair Value 323 344 358 371 393
Credit Risk Transfer Securities, at Fair Value 653 712 574 976 1,134
Non-Agency Securities, at Fair Value 512 599 552 579 579
U.S. Treasury Securities, at Fair Value — 1,181 3,721 97 215
Cash and Cash Equivalents 857 859 1,289 831 906
Restricted Cash 1,557 1,306 1,978 451 734
Derivative Assets, at Fair Value 130 140 664 190 175
Receivable for Investment Securities Sold 10 489 — — 105
Receivable under Reverse Repurchase Agreements 8,625 7,944 4,938 10,181 6,093
Goodwill 526 526 526 526 526
Other Assets 219 265 245 364 324
Total Assets $79,968 $89,853 $85,137 $113,082 $109,761
Repurchase Agreements $54,566 $69,685 $66,540 $89,182 $90,612
Debt of Consolidated Variable Interest Entities, at Fair Value 192 204 214 228 238
Payable for Investment Securities Purchased 5,887 1,468 3,273 2,554 3,094
Derivative Liabilities, at Fair Value 13 3 138 6 22
Dividends Payable 90 92 113 104 100
Obligation to Return Securities Borrowed under Reverse Repurchase Agreements, at Fair Value 8,372 7,929 4,886 9,543 5,114
Accounts Payable and Other Liabilities 128 122 175 424 368
Total Liabilities 69,248 79,503 75,339 102,041 99,548
Preferred Equity at Aggregate Liquidation Preference 1,538 1,538 1,538 963 735
Common Equity 9,182 8,812 8,260 10,078 9,478
Total Stockholders’ Equity 10,720 10,350 9,798 11,041 10,213
Total Liabilities and Stockholders’ Equity $79,968 $89,853 $85,137 $113,082 $109,761x x x x x x
Other Supplemental Data: x x x x x
Net Long TBA, at Fair Value 1 $29,536 $20,543 $21,222 $7,429 $1,867
Tangible Net Book Value “At Risk” Leverage 2 8.8x 9.2x 9.4x 9.4x 9.8x
Tangible Net Book Value Per Common Share 3 $15.88 $14.92 $13.62 $17.66 $16.55
14
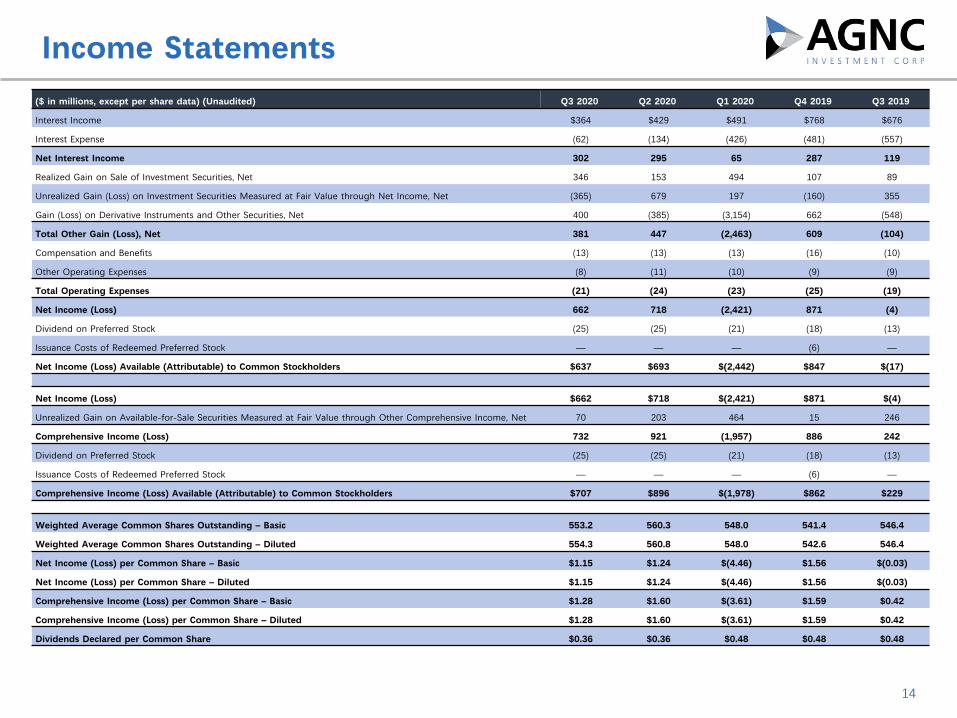
Income Statements($ in millions, except per share data) (Unaudited) Q3 2020 Q2 2020 Q1 2020 Q4 2019 Q3 2019
Interest Income $364 $429 $491 $768 $676
Interest Expense (62) (134) (426) (481) (557)
Net Interest Income 302 295 65 287 119
Realized Gain on Sale of Investment Securities, Net 346 153 494 107 89
Unrealized Gain (Loss) on Investment Securities Measured at Fair Value through Net Income, Net (365) 679 197 (160) 355
Gain (Loss) on Derivative Instruments and Other Securities, Net 400 (385) (3,154) 662 (548)
Total Other Gain (Loss), Net 381 447 (2,463) 609 (104)
Compensation and Benefits (13) (13) (13) (16) (10)
Other Operating Expenses (8) (11) (10) (9) (9)
Total Operating Expenses (21) (24) (23) (25) (19)
Net Income (Loss) 662 718 (2,421) 871 (4)
Dividend on Preferred Stock (25) (25) (21) (18) (13)
Issuance Costs of Redeemed Preferred Stock — — — (6) —
Net Income (Loss) Available (Attributable) to Common Stockholders $637 $693 $(2,442) $847 $(17)
x x x x x x
Net Income (Loss) $662 $718 $(2,421) $871 $(4)
Unrealized Gain on Available-for-Sale Securities Measured at Fair Value through Other Comprehensive Income, Net 70 203 464 15 246
Comprehensive Income (Loss) 732 921 (1,957) 886 242
Dividend on Preferred Stock (25) (25) (21) (18) (13)
Issuance Costs of Redeemed Preferred Stock — — — (6) —
Comprehensive Income (Loss) Available (Attributable) to Common Stockholders $707 $896 $(1,978) $862 $229
x x x x x x
Weighted Average Common Shares Outstanding – Basic 553.2 560.3 548.0 541.4 546.4
Weighted Average Common Shares Outstanding – Diluted 554.3 560.8 548.0 542.6 546.4
Net Income (Loss) per Common Share – Basic $1.15 $1.24 $(4.46) $1.56 $(0.03)
Net Income (Loss) per Common Share – Diluted $1.15 $1.24 $(4.46) $1.56 $(0.03)
Comprehensive Income (Loss) per Common Share – Basic $1.28 $1.60 $(3.61) $1.59 $0.42
Comprehensive Income (Loss) per Common Share – Diluted $1.28 $1.60 $(3.61) $1.59 $0.42
Dividends Declared per Common Share $0.36 $0.36 $0.48 $0.48 $0.48
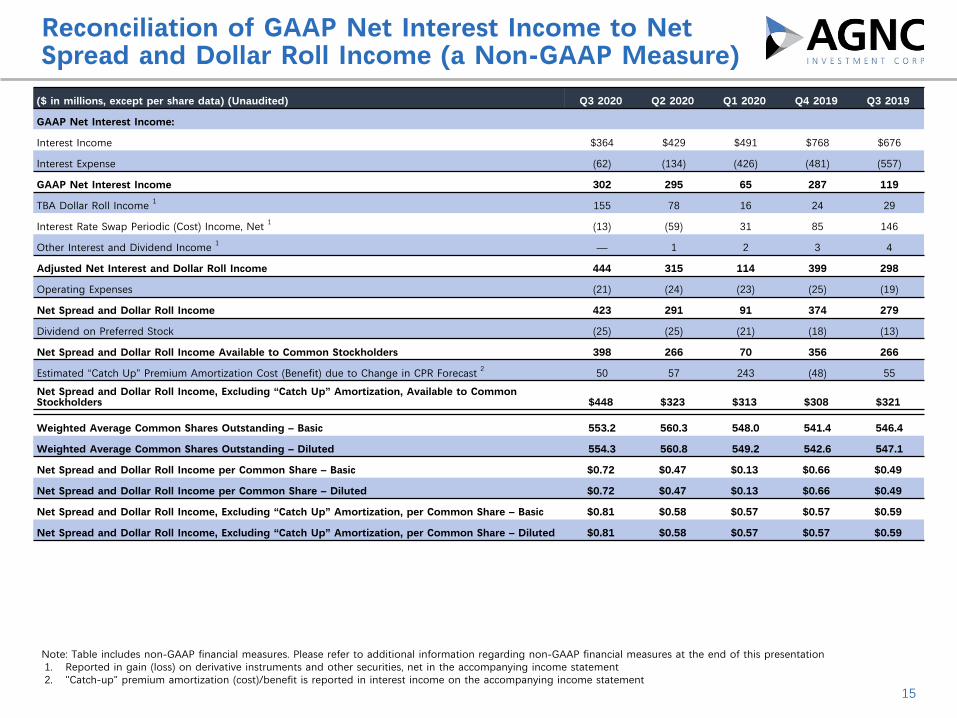
Reconciliation of GAAP Net Interest Income to Net Spread and Dollar Roll Income (a Non-GAAP Measure)
15
Note: Table includes non-GAAP financial measures. Please refer to additional information regarding non-GAAP financial measures at the end of this presentation1. Reported in gain (loss) on derivative instruments and other securities, net in the accompanying income statement2. "Catch-up" premium amortization (cost)/benefit is reported in interest income on the accompanying income statement
($ in millions, except per share data) (Unaudited) Q3 2020 Q2 2020 Q1 2020 Q4 2019 Q3 2019
GAAP Net Interest Income: x x x x x
Interest Income $364 $429 $491 $768 $676
Interest Expense (62) (134) (426) (481) (557)
GAAP Net Interest Income 302 295 65 287 119
TBA Dollar Roll Income 1 155 78 16 24 29
Interest Rate Swap Periodic (Cost) Income, Net 1 (13) (59) 31 85 146
Other Interest and Dividend Income 1 — 1 2 3 4
Adjusted Net Interest and Dollar Roll Income 444 315 114 399 298
Operating Expenses (21) (24) (23) (25) (19)
Net Spread and Dollar Roll Income 423 291 91 374 279
Dividend on Preferred Stock (25) (25) (21) (18) (13)
Net Spread and Dollar Roll Income Available to Common Stockholders 398 266 70 356 266
Estimated “Catch Up” Premium Amortization Cost (Benefit) due to Change in CPR Forecast 2 50 57 243 (48) 55
Net Spread and Dollar Roll Income, Excluding “Catch Up” Amortization, Available to Common Stockholders $448 $323 $313 $308 $321x x x x x x
Weighted Average Common Shares Outstanding – Basic 553.2 560.3 548.0 541.4 546.4
Weighted Average Common Shares Outstanding – Diluted 554.3 560.8 549.2 542.6 547.1
Net Spread and Dollar Roll Income per Common Share – Basic $0.72 $0.47 $0.13 $0.66 $0.49
Net Spread and Dollar Roll Income per Common Share – Diluted $0.72 $0.47 $0.13 $0.66 $0.49
Net Spread and Dollar Roll Income, Excluding “Catch Up” Amortization, per Common Share – Basic $0.81 $0.58 $0.57 $0.57 $0.59
Net Spread and Dollar Roll Income, Excluding “Catch Up” Amortization, per Common Share – Diluted $0.81 $0.58 $0.57 $0.57 $0.59
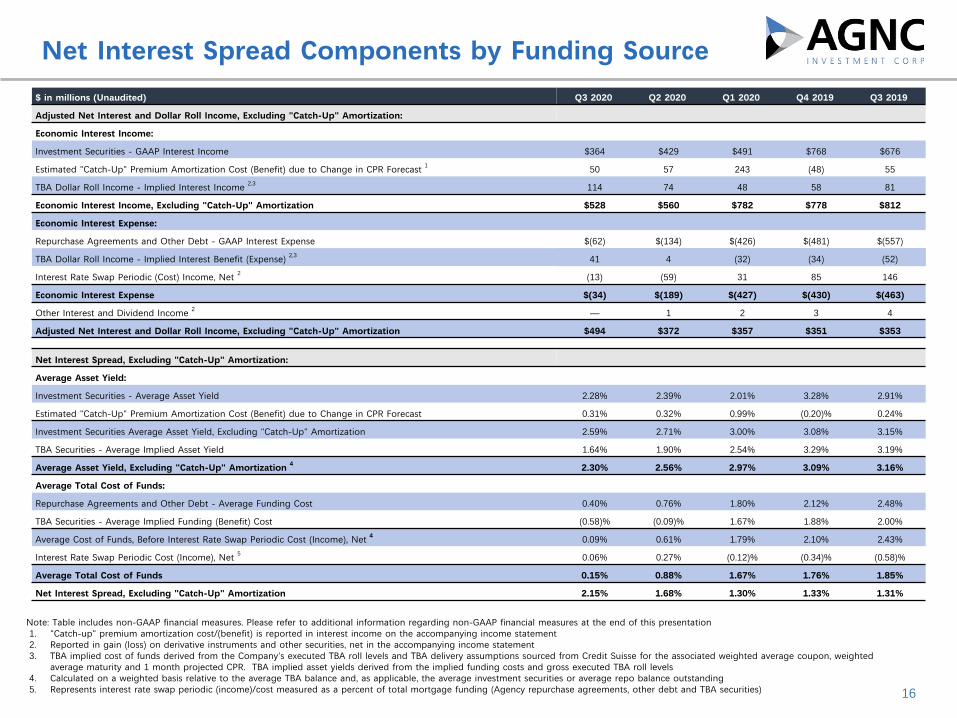
Net Interest Spread Components by Funding Source
16
$ in millions (Unaudited) Q3 2020 Q2 2020 Q1 2020 Q4 2019 Q3 2019
Adjusted Net Interest and Dollar Roll Income, Excluding "Catch-Up" Amortization: x x x x x
Economic Interest Income: x x x x x
Investment Securities - GAAP Interest Income $364 $429 $491 $768 $676
Estimated "Catch-Up" Premium Amortization Cost (Benefit) due to Change in CPR Forecast 1 50 57 243 (48) 55
TBA Dollar Roll Income - Implied Interest Income 2,3 114 74 48 58 81
Economic Interest Income, Excluding "Catch-Up" Amortization $528 $560 $782 $778 $812
Economic Interest Expense: x x x x x
Repurchase Agreements and Other Debt - GAAP Interest Expense $(62) $(134) $(426) $(481) $(557)
TBA Dollar Roll Income - Implied Interest Benefit (Expense) 2,3 41 4 (32) (34) (52)
Interest Rate Swap Periodic (Cost) Income, Net 2 (13) (59) 31 85 146
Economic Interest Expense $(34) $(189) $(427) $(430) $(463)
Other Interest and Dividend Income 2 — 1 2 3 4
Adjusted Net Interest and Dollar Roll Income, Excluding "Catch-Up" Amortization $494 $372 $357 $351 $353x x x x x x
Net Interest Spread, Excluding "Catch-Up" Amortization: x x x x x
Average Asset Yield: x x x x x
Investment Securities - Average Asset Yield 2.28% 2.39% 2.01% 3.28% 2.91%
Estimated "Catch-Up" Premium Amortization Cost (Benefit) due to Change in CPR Forecast 0.31% 0.32% 0.99% (0.20)% 0.24%
Investment Securities Average Asset Yield, Excluding "Catch-Up" Amortization 2.59% 2.71% 3.00% 3.08% 3.15%
TBA Securities - Average Implied Asset Yield 1.64% 1.90% 2.54% 3.29% 3.19%
Average Asset Yield, Excluding "Catch-Up" Amortization 4 2.30% 2.56% 2.97% 3.09% 3.16%
Average Total Cost of Funds: x x x x x
Repurchase Agreements and Other Debt - Average Funding Cost 0.40% 0.76% 1.80% 2.12% 2.48%
TBA Securities - Average Implied Funding (Benefit) Cost (0.58)% (0.09)% 1.67% 1.88% 2.00%
Average Cost of Funds, Before Interest Rate Swap Periodic Cost (Income), Net 4 0.09% 0.61% 1.79% 2.10% 2.43%
Interest Rate Swap Periodic Cost (Income), Net 5 0.06% 0.27% (0.12)% (0.34)% (0.58)%
Average Total Cost of Funds 0.15% 0.88% 1.67% 1.76% 1.85%
Net Interest Spread, Excluding "Catch-Up" Amortization 2.15% 1.68% 1.30% 1.33% 1.31%
Note: Table includes non-GAAP financial measures. Please refer to additional information regarding non-GAAP financial measures at the end of this presentation1. "Catch-up" premium amortization cost/(benefit) is reported in interest income on the accompanying income statement2. Reported in gain (loss) on derivative instruments and other securities, net in the accompanying income statement3. TBA implied cost of funds derived from the Company's executed TBA roll levels and TBA delivery assumptions sourced from Credit Suisse for the associated weighted average coupon, weighted
average maturity and 1 month projected CPR. TBA implied asset yields derived from the implied funding costs and gross executed TBA roll levels4. Calculated on a weighted basis relative to the average TBA balance and, as applicable, the average investment securities or average repo balance outstanding5. Represents interest rate swap periodic (income)/cost measured as a percent of total mortgage funding (Agency repurchase agreements, other debt and TBA securities)
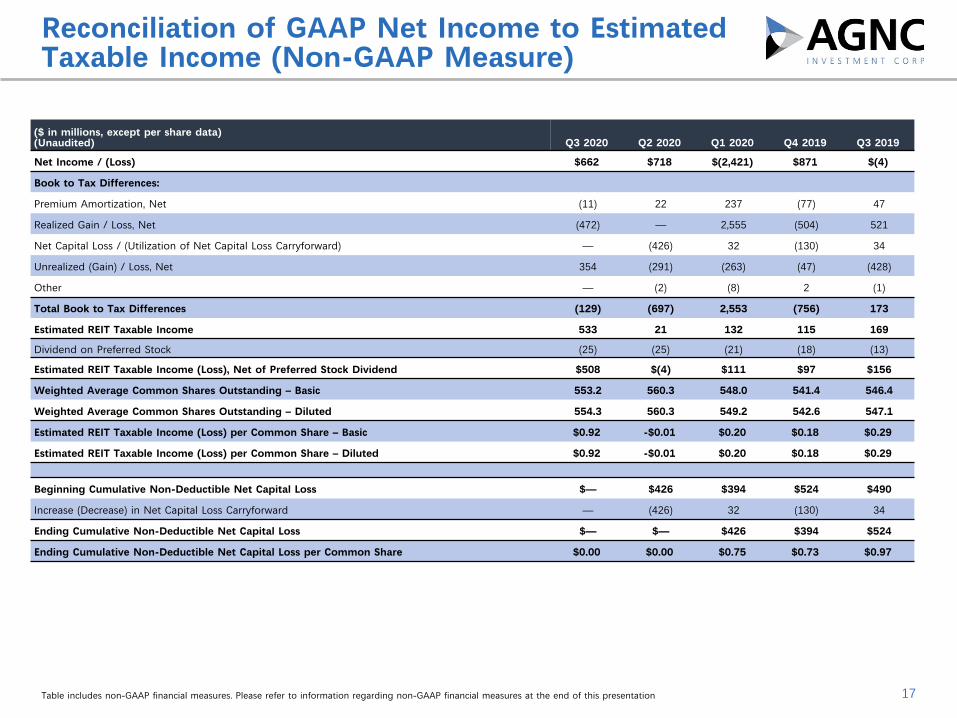
($ in millions, except per share data) (Unaudited) Q3 2020 Q2 2020 Q1 2020 Q4 2019 Q3 2019
Net Income / (Loss) $662 $718 $(2,421) $871 $(4)
Book to Tax Differences: x x x x x
Premium Amortization, Net (11) 22 237 (77) 47
Realized Gain / Loss, Net (472) — 2,555 (504) 521
Net Capital Loss / (Utilization of Net Capital Loss Carryforward) — (426) 32 (130) 34
Unrealized (Gain) / Loss, Net 354 (291) (263) (47) (428)
Other — (2) (8) 2 (1)
Total Book to Tax Differences (129) (697) 2,553 (756) 173
Estimated REIT Taxable Income 533 21 132 115 169
Dividend on Preferred Stock (25) (25) (21) (18) (13)
Estimated REIT Taxable Income (Loss), Net of Preferred Stock Dividend $508 $(4) $111 $97 $156
Weighted Average Common Shares Outstanding – Basic 553.2 560.3 548.0 541.4 546.4
Weighted Average Common Shares Outstanding – Diluted 554.3 560.3 549.2 542.6 547.1
Estimated REIT Taxable Income (Loss) per Common Share – Basic $0.92 -$0.01 $0.20 $0.18 $0.29
Estimated REIT Taxable Income (Loss) per Common Share – Diluted $0.92 -$0.01 $0.20 $0.18 $0.29x x x x x x
Beginning Cumulative Non-Deductible Net Capital Loss $— $426 $394 $524 $490
Increase (Decrease) in Net Capital Loss Carryforward — (426) 32 (130) 34
Ending Cumulative Non-Deductible Net Capital Loss $— $— $426 $394 $524
Ending Cumulative Non-Deductible Net Capital Loss per Common Share $0.00 $0.00 $0.75 $0.73 $0.97
Table includes non-GAAP financial measures. Please refer to information regarding non-GAAP financial measures at the end of this presentation 17
Reconciliation of GAAP Net Income to Estimated Taxable Income (Non-GAAP Measure)
18
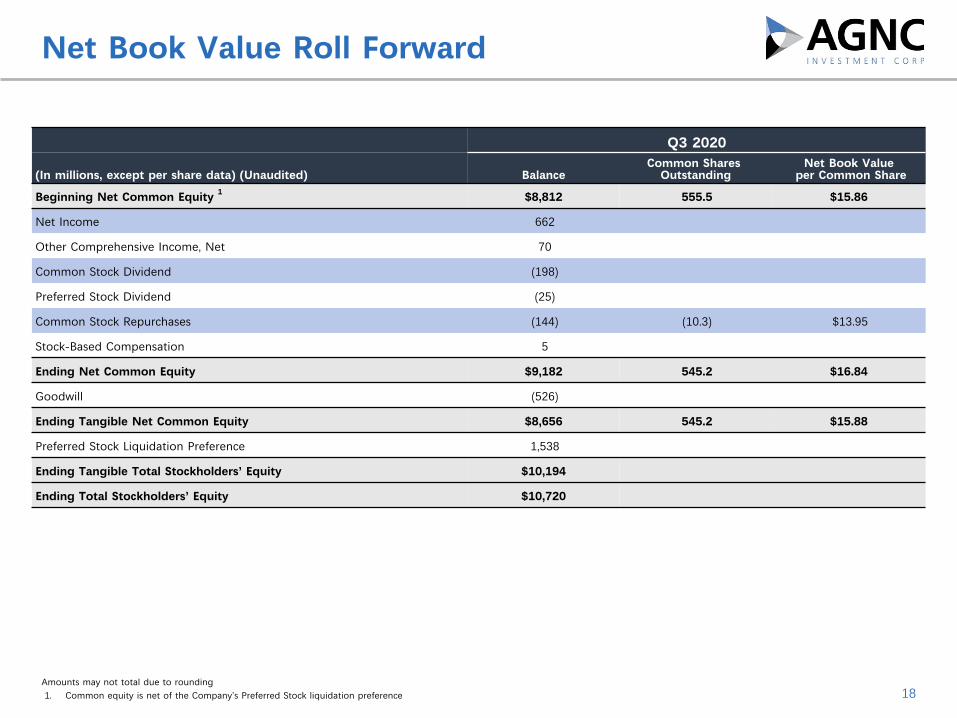
Net Book Value Roll Forward
Amounts may not total due to rounding1. Common equity is net of the Company’s Preferred Stock liquidation preference
Q3 2020
(In millions, except per share data) (Unaudited) BalanceCommon Shares
OutstandingNet Book Value
per Common Share
Beginning Net Common Equity 1 $8,812 555.5 $15.86
Net Income 662 x x
Other Comprehensive Income, Net 70 x x
Common Stock Dividend (198) x x
Preferred Stock Dividend (25) x x
Common Stock Repurchases (144) (10.3) $13.95
Stock-Based Compensation 5
Ending Net Common Equity $9,182 545.2 $16.84
Goodwill (526) x x
Ending Tangible Net Common Equity $8,656 545.2 $15.88
Preferred Stock Liquidation Preference 1,538 x x
Ending Tangible Total Stockholders’ Equity $10,194 x x
Ending Total Stockholders’ Equity $10,720 x x

Supplemental Slides
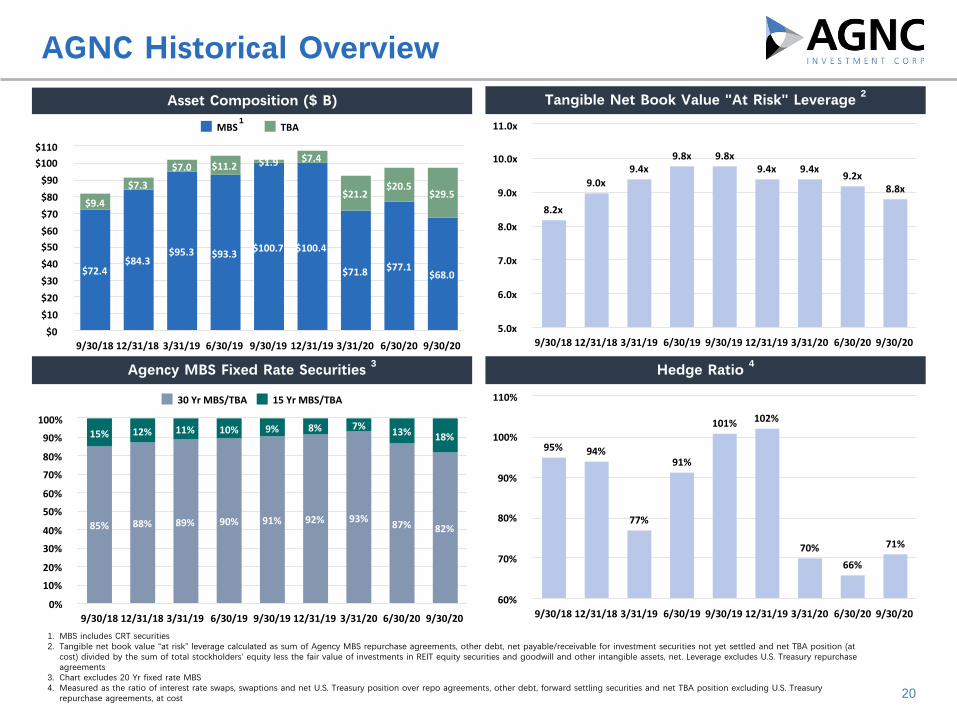
$72.4$84.3
$95.3 $93.3 $100.7 $100.4
$71.8 $77.1$68.0
$9.4
$7.3
$7.0 $11.2 $1.9 $7.4
$21.2$20.5
$29.5
MBS TBA
9/30/18 12/31/18 3/31/19 6/30/19 9/30/19 12/31/19 3/31/20 6/30/20 9/30/20$0
$10
$20
$30
$40
$50
$60
$70
$80
$90
$100
$110
1. MBS includes CRT securities2. Tangible net book value “at risk” leverage calculated as sum of Agency MBS repurchase agreements, other debt, net payable/receivable for investment securities not yet settled and net TBA position (at
cost) divided by the sum of total stockholders’ equity less the fair value of investments in REIT equity securities and goodwill and other intangible assets, net. Leverage excludes U.S. Treasury repurchase agreements
3. Chart excludes 20 Yr fixed rate MBS 4. Measured as the ratio of interest rate swaps, swaptions and net U.S. Treasury position over repo agreements, other debt, forward settling securities and net TBA position excluding U.S. Treasury
repurchase agreements, at cost 20
AGNC Historical OverviewTangible Net Book Value "At Risk" Leverage 2
Agency MBS Fixed Rate Securities 3 Hedge Ratio 4
1
Asset Composition ($ B)
8.2x
9.0x9.4x
9.8x 9.8x9.4x 9.4x
9.2x8.8x
9/30/18 12/31/18 3/31/19 6/30/19 9/30/19 12/31/19 3/31/20 6/30/20 9/30/205.0x
6.0x
7.0x
8.0x
9.0x
10.0x
11.0x
85% 88% 89% 90% 91% 92% 93% 87% 82%
15% 12% 11% 10% 9% 8% 7% 13% 18%
30YrMBS/TBA 15YrMBS/TBA
9/30/18 12/31/18 3/31/19 6/30/19 9/30/19 12/31/19 3/31/20 6/30/20 9/30/200%
10%
20%
30%
40%
50%
60%
70%
80%
90%
100%
95% 94%
77%
91%
101% 102%
70%
66%
71%
9/30/18 12/31/18 3/31/19 6/30/19 9/30/19 12/31/19 3/31/20 6/30/20 9/30/2060%
70%
80%
90%
100%
110%
1
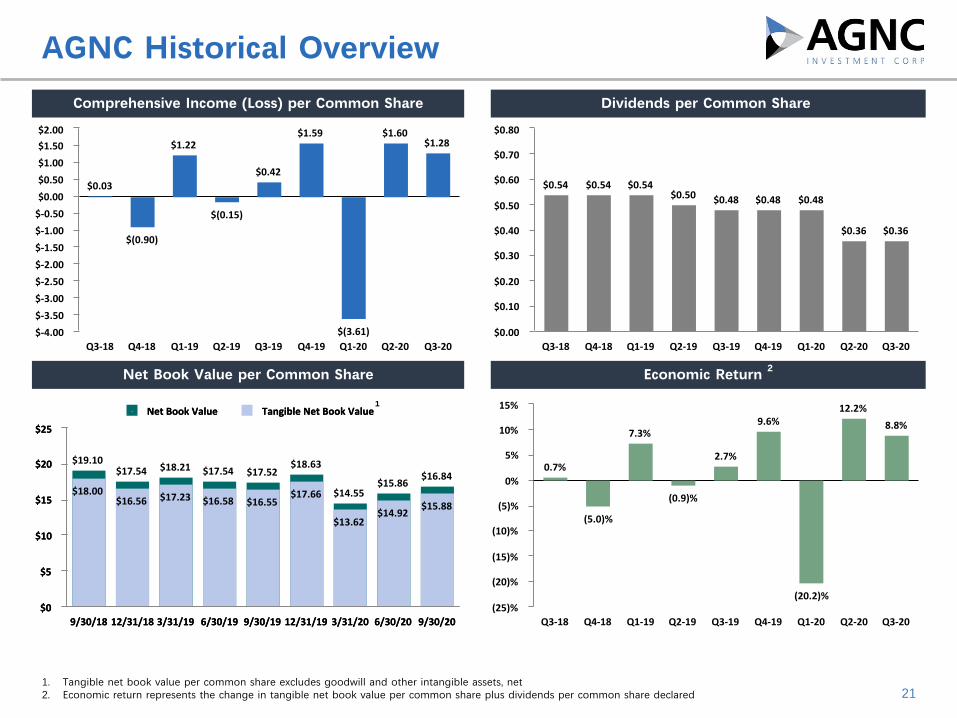
1. Tangible net book value per common share excludes goodwill and other intangible assets, net 2. Economic return represents the change in tangible net book value per common share plus dividends per common share declared 21
AGNC Historical Overview
Comprehensive Income (Loss) per Common Share Dividends per Common Share
Net Book Value per Common Share Economic Return 2
$0.03
$(0.90)
$1.22
$(0.15)
$0.42
$1.59
$(3.61)
$1.60$1.28
Q3-18 Q4-18 Q1-19 Q2-19 Q3-19 Q4-19 Q1-20 Q2-20 Q3-20$-4.00
$-3.50
$-3.00
$-2.50
$-2.00
$-1.50
$-1.00
$-0.50
$0.00
$0.50
$1.00
$1.50
$2.00
$0.54 $0.54 $0.54$0.50 $0.48 $0.48 $0.48
$0.36 $0.36
Q3-18 Q4-18 Q1-19 Q2-19 Q3-19 Q4-19 Q1-20 Q2-20 Q3-20$0.00
$0.10
$0.20
$0.30
$0.40
$0.50
$0.60
$0.70
$0.80
0.7%
(5.0)%
7.3%
(0.9)%
2.7%
9.6%
(20.2)%
12.2%
8.8%
Q3-18 Q4-18 Q1-19 Q2-19 Q3-19 Q4-19 Q1-20 Q2-20 Q3-20(25)%
(20)%
(15)%
(10)%
(5)%
0%
5%
10%
15%
$19.10$17.54 $18.21 $17.54 $17.52
$18.63
$14.55$15.86
$16.84
NetBookValue TangibleNetBookValue
9/30/18 12/31/18 3/31/19 6/30/19 9/30/19 12/31/19 3/31/20 6/30/20 9/30/20$0
$5
$10
$15
$20
$25
$18.00$16.56 $17.23 $16.58 $16.55
$17.66
$13.62$14.92
$15.88
NetBookValue TangibleNetBookValue
9/30/18 12/31/18 3/31/19 6/30/19 9/30/19 12/31/19 3/31/20 6/30/20 9/30/20$0
$5
$10
$15
$20
$25
22
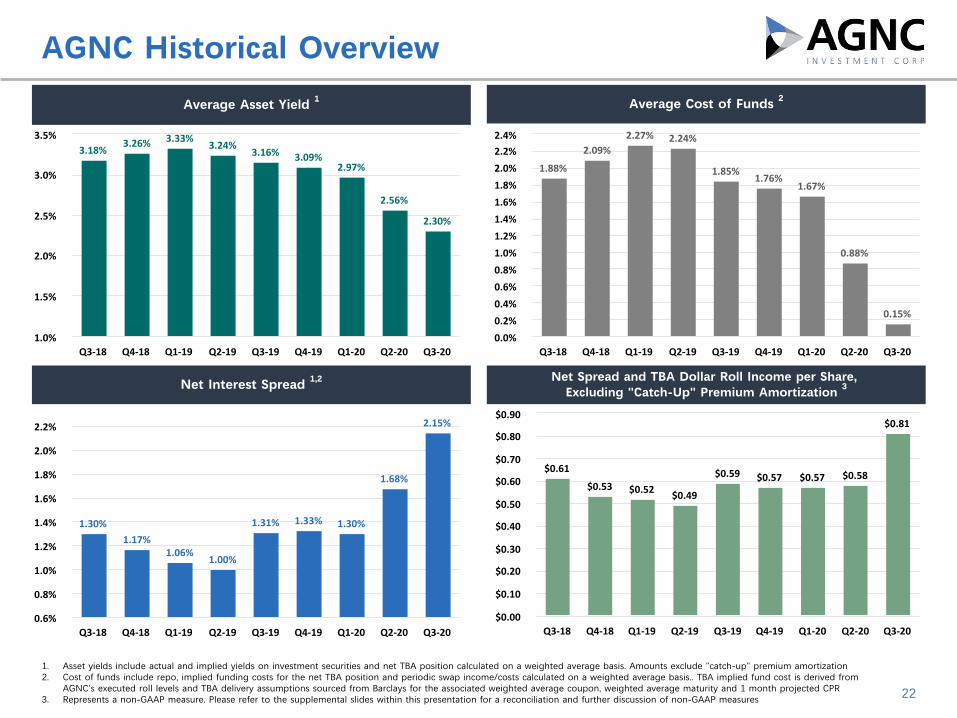
AGNC Historical Overview
Average Asset Yield 1 Average Cost of Funds 2
Net Interest Spread 1,2 Net Spread and TBA Dollar Roll Income per Share, Excluding "Catch-Up" Premium Amortization 3
1. Asset yields include actual and implied yields on investment securities and net TBA position calculated on a weighted average basis. Amounts exclude "catch-up" premium amortization2. Cost of funds include repo, implied funding costs for the net TBA position and periodic swap income/costs calculated on a weighted average basis.. TBA implied fund cost is derived from
AGNC's executed roll levels and TBA delivery assumptions sourced from Barclays for the associated weighted average coupon, weighted average maturity and 1 month projected CPR3. Represents a non-GAAP measure. Please refer to the supplemental slides within this presentation for a reconciliation and further discussion of non-GAAP measures
3.18%3.26% 3.33%
3.24%3.16% 3.09%
2.97%
2.56%
2.30%
Q3-18 Q4-18 Q1-19 Q2-19 Q3-19 Q4-19 Q1-20 Q2-20 Q3-201.0%
1.5%
2.0%
2.5%
3.0%
3.5%
1.88%
2.09%2.27% 2.24%
1.85%1.76%
1.67%
0.88%
0.15%
Q3-18 Q4-18 Q1-19 Q2-19 Q3-19 Q4-19 Q1-20 Q2-20 Q3-200.0%
0.2%
0.4%
0.6%
0.8%
1.0%
1.2%
1.4%
1.6%
1.8%
2.0%
2.2%
2.4%
1.30%
1.17%1.06%
1.00%
1.31% 1.33% 1.30%
1.68%
2.15%
Q3-18 Q4-18 Q1-19 Q2-19 Q3-19 Q4-19 Q1-20 Q2-20 Q3-200.6%
0.8%
1.0%
1.2%
1.4%
1.6%
1.8%
2.0%
2.2%
$0.61
$0.53 $0.52 $0.49
$0.59 $0.57 $0.57 $0.58
$0.81
Q3-18 Q4-18 Q1-19 Q2-19 Q3-19 Q4-19 Q1-20 Q2-20 Q3-20$0.00
$0.10
$0.20
$0.30
$0.40
$0.50
$0.60
$0.70
$0.80
$0.90
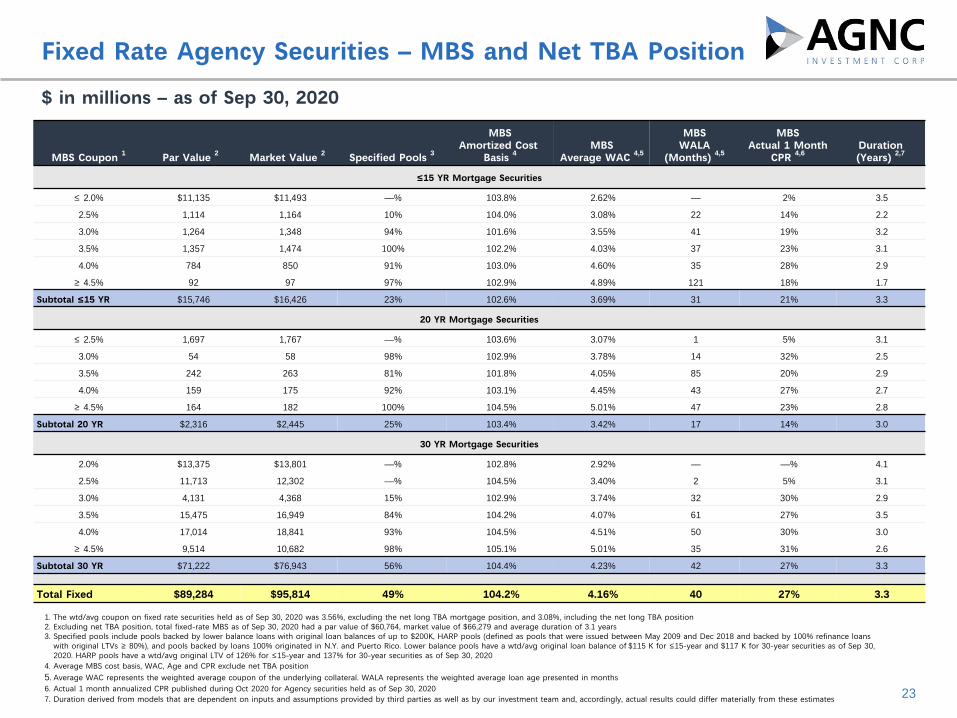
$ in millions – as of Sep 30, 2020
23
Fixed Rate Agency Securities – MBS and Net TBA Position
MBS Coupon 1 Par Value 2 Market Value 2 Specified Pools 3
MBSAmortized Cost
Basis 4MBS
Average WAC 4,5
MBSWALA
(Months) 4,5
MBSActual 1 Month
CPR 4,6Duration(Years) 2,7
≤15 YR Mortgage Securities
≤ 2.0% $11,135 $11,493 —% 103.8% 2.62% — 2% 3.5
2.5% 1,114 1,164 10% 104.0% 3.08% 22 14% 2.2
3.0% 1,264 1,348 94% 101.6% 3.55% 41 19% 3.2
3.5% 1,357 1,474 100% 102.2% 4.03% 37 23% 3.1
4.0% 784 850 91% 103.0% 4.60% 35 28% 2.9
≥ 4.5% 92 97 97% 102.9% 4.89% 121 18% 1.7
Subtotal ≤15 YR $15,746 $16,426 23% 102.6% 3.69% 31 21% 3.3
20 YR Mortgage Securities
≤ 2.5% 1,697 1,767 —% 103.6% 3.07% 1 5% 3.1
3.0% 54 58 98% 102.9% 3.78% 14 32% 2.5
3.5% 242 263 81% 101.8% 4.05% 85 20% 2.9
4.0% 159 175 92% 103.1% 4.45% 43 27% 2.7
≥ 4.5% 164 182 100% 104.5% 5.01% 47 23% 2.8
Subtotal 20 YR $2,316 $2,445 25% 103.4% 3.42% 17 14% 3.0
30 YR Mortgage Securities
2.0% $13,375 $13,801 —% 102.8% 2.92% — —% 4.1
2.5% 11,713 12,302 —% 104.5% 3.40% 2 5% 3.1
3.0% 4,131 4,368 15% 102.9% 3.74% 32 30% 2.9
3.5% 15,475 16,949 84% 104.2% 4.07% 61 27% 3.5
4.0% 17,014 18,841 93% 104.5% 4.51% 50 30% 3.0
≥ 4.5% 9,514 10,682 98% 105.1% 5.01% 35 31% 2.6
Subtotal 30 YR $71,222 $76,943 56% 104.4% 4.23% 42 27% 3.3x
Total Fixed $89,284 $95,814 49% 104.2% 4.16% 40 27% 3.3
1. The wtd/avg coupon on fixed rate securities held as of Sep 30, 2020 was 3.56%, excluding the net long TBA mortgage position, and 3.08%, including the net long TBA position 2. Excluding net TBA position, total fixed-rate MBS as of Sep 30, 2020 had a par value of $60,764, market value of $66,279 and average duration of 3.1 years3. Specified pools include pools backed by lower balance loans with original loan balances of up to $200K, HARP pools (defined as pools that were issued between May 2009 and Dec 2018 and backed by 100% refinance loans
with original LTVs ≥ 80%), and pools backed by loans 100% originated in N.Y. and Puerto Rico. Lower balance pools have a wtd/avg original loan balance of $115 K for ≤15-year and $117 K for 30-year securities as of Sep 30, 2020. HARP pools have a wtd/avg original LTV of 126% for ≤15-year and 137% for 30-year securities as of Sep 30, 2020
4. Average MBS cost basis, WAC, Age and CPR exclude net TBA position5. Average WAC represents the weighted average coupon of the underlying collateral. WALA represents the weighted average loan age presented in months6. Actual 1 month annualized CPR published during Oct 2020 for Agency securities held as of Sep 30, 2020 7. Duration derived from models that are dependent on inputs and assumptions provided by third parties as well as by our investment team and, accordingly, actual results could differ materially from these estimates
24
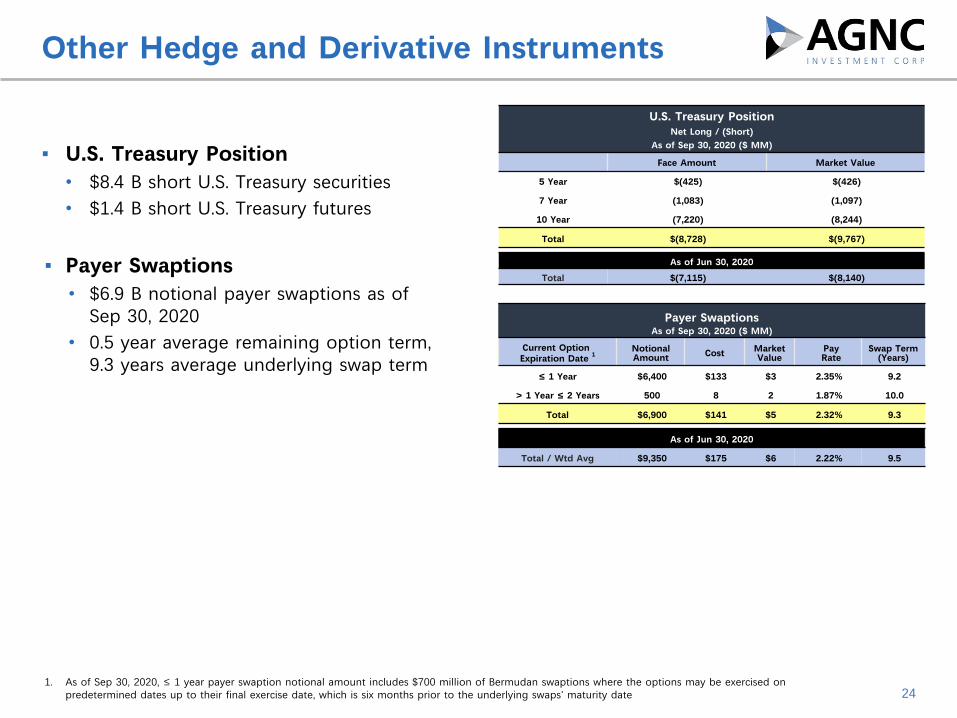
Other Hedge and Derivative Instruments
1. As of Sep 30, 2020, ≤ 1 year payer swaption notional amount includes $700 million of Bermudan swaptions where the options may be exercised on predetermined dates up to their final exercise date, which is six months prior to the underlying swaps' maturity date
U.S. Treasury PositionNet Long / (Short)
As of Sep 30, 2020 ($ MM)
Maturity Face Amount Market Value
5 Year $(425) $(426)
7 Year (1,083) (1,097)
10 Year (7,220) (8,244)
Total $(8,728) $(9,767)x x x
As of Jun 30, 2020
Total $(7,115) $(8,140)
Payer SwaptionsAs of Sep 30, 2020 ($ MM)
Current Option Expiration Date 1
NotionalAmount Cost Market
Value Pay Rate
Swap Term(Years)
≤ 1 Year $6,400 $133 $3 2.35% 9.2
> 1 Year ≤ 2 Years 500 8 2 1.87% 10.0
Total $6,900 $141 $5 2.32% 9.3x x x x x x
As of Jun 30, 2020
Total / Wtd Avg $9,350 $175 $6 2.22% 9.5
▪ U.S. Treasury Position• $8.4 B short U.S. Treasury securities• $1.4 B short U.S. Treasury futures
▪ Payer Swaptions• $6.9 B notional payer swaptions as of
Sep 30, 2020• 0.5 year average remaining option term,
9.3 years average underlying swap term

Changes in interest rates and MBS spreads relative to our hedges can impact the market value of our equity
25
NAV Sensitivity to Rates and MBS Spreads
▪ Interest Rate Sensitivity• The estimated change in the market
value of our asset portfolio, net of hedges, assuming no portfolio rebalancing actions
▪ MBS Spread Sensitivity (“Basis Risk”)• The MBS spread sensitivity is the
sensitivity of our assets to changes in MBS spreads
• The estimated change in the market value of our assets based on model predictions and assuming a spread duration of 4.5 years, based on interest rates and MBS prices as of Sep 30, 2020
1. Interest rate and MBS spread sensitivity are derived from models that are dependent on inputs and assumptions provided by third parties as well as by our investment team and, accordingly, actual results could differ materially from these estimates. Rates are floored at zero percent
2. Estimated dollar change in value expressed as a percentage of the total market value of “at risk” assets
Interest Rate Sensitivity 1 As of Sep 30, 2020
(based on instantaneous parallel shift in interest rates)
Interest RateShock (bps)
EstimatedChange in Portfolio
Market Value 2Estimated
Change in Tangible Common Equity
-100 0.0% (0.1)%
-75 0.0% 0.6%
-50 0.1% 0.8%
+50 (0.3)% (3.3)%
+75 (0.6)% (7.2)%
+100 (1.1)% (12.6)%
MBS Spread Sensitivity (“Basis Risk”) 1As of Sep 30, 2020
MBS SpreadShock (bps)
EstimatedChange in Portfolio
Market Value 2Estimated
Change in Tangible Common Equity
-50 2.3% 25.4%
-25 1.1% 12.7%
-10 0.5% 5.1%
+10 (0.5)% (5.1)%
+25 (1.1)% (12.7)%
+50 (2.3)% (25.4)%
26
Use of Non-GAAP Financial Information
In addition to the results presented in accordance with GAAP, the Company's results of operations discussed in this presentation include certain non-GAAP financial information, including "net spread and dollar roll income," "net spread and dollar roll income, excluding 'catch-up' premium amortization," "economic interest income" and "economic interest expense" (both components of "net spread and dollar roll income"), "estimated taxable income" and the related per common share measures and certain financial metrics derived from such non-GAAP information, such as "cost of funds" and "net interest spread."
"Net spread and dollar roll income" is measured as (i) net interest income (GAAP measure) adjusted to include TBA dollar roll income, interest rate swap periodic cost/income and other interest and dividend income (referred to as "adjusted net interest and dollar roll income"), less (ii) total operating expenses (GAAP measure). "Net spread and dollar roll income, excluding 'catch-up' premium amortization," further excludes retrospective "catch-up" adjustments to premium amortization due to changes in projected CPR estimates. Related amounts per common share exclude non-recurring issuance costs of redeemed preferred stock.
By providing users of our financial information with such measures in addition to the related GAAP measures, we believe users will have greater transparency into the information used by our management in its financial and operational decision-making. We also believe that it is important for users of our financial information to consider information related to our current financial performance without the effects of certain transactions that are not necessarily indicative of our current investment portfolio performance and operations.
Specifically, in the case of "adjusted net interest and dollar roll income," the we believe the inclusion of TBA dollar roll income is meaningful as TBAs, which are accounted for under GAAP as derivative instruments with gains and losses recognized in other gain (loss) in our statement of operations, are economically equivalent to holding and financing generic Agency MBS using short-term repurchase agreements. Similarly, we believe that the inclusion of interest rate swap periodic cost/income in such measure, which is recognized under GAAP in other gain (loss), is meaningful as interest rate swaps are the primary instrument we use to economically hedge against fluctuations in our borrowing costs and inclusion of interest rate swap periodic cost/income is more indicative of our total cost of funds than interest expense alone. In the case of "net spread and dollar roll income, excluding 'catch-up' premium amortization," we believe the exclusion of "catch-up" adjustments to premium amortization is meaningful as it excludes the cumulative effect from prior reporting periods due to current changes in future prepayment expectations and, therefore, exclusion of such cost or benefit is more indicative of the current earnings potential of our investment portfolio. We also believe the exclusion of issuance costs of redeemed preferred stock reported as reduction to net income available to common stockholders under GAAP is meaningful as it represents non-recurring costs associated with capital transactions and is not representative of our ongoing costs. In the case of estimated taxable income, we believe it is meaningful information as it is directly related to the amount of dividends we are required to distribute in order to maintain our REIT qualification status.
However, because such measures are incomplete measures of our financial performance and involve differences from results computed in accordance with GAAP, they should be considered as supplementary to, and not as a substitute for, results computed in accordance with GAAP. In addition, because not all companies use identical calculations, our presentation of such non-GAAP measures may not be comparable to other similarly-titled measures of other companies. Furthermore, estimated taxable income can include certain information that is subject to potential adjustments up to the time of filing our income tax returns, which occurs after the end of our fiscal year.
A reconciliation of GAAP net interest income to non-GAAP "net spread and dollar roll income, excluding 'catch-up' premium amortization" and a reconciliation of GAAP net income to non-GAAP "estimated taxable income" is included in this presentation.