agglomeration, backward and forward linkages: …...agglomeration, backward and forward linkages:...
TRANSCRIPT
Agglomeration, Backward and Forward Linkages:Evidence from South Korean Investment in China
Peter Debaere∗
Darden Business SchoolUniversity of Virginia
Joonhyung Lee†
Economics DepartmentUniversity of Texas at Austin
Myungho Paik‡
School of LawUniversity of Texas at Austin
April 29, 2009
Abstract
With a firm-level dataset, we study the location decision of South Korean multina-tionals across China’s regions. Our conditional logit estimates confirm agglomerationeffects along industry and along national lines. We add an upstream and downstream(backward and forward) linkage effect. We find that the presence of upstream anddownstream South Korean affiliates significantly increases the likelihood that a SouthKorean multinational invests in a particular region. However, linkages that do notdifferentiate by nationality do not seem to matter much. As such, our analysis of in-vestors’ location choice brings together two perspectives: linkages and agglomerationalong national lines.
JEL classification:F21, F23, R12
∗CEPR, Darden School of Business, University of Virginia, Charlottesville, Virginia 22906,Phone:434-243-2339, [email protected].
†Department of Economics, University of Texas at Austin, [email protected].‡Postdoctoral Fellow, Center for Law, Business, and Economics, School of Law, University of
Texas at Austin, [email protected].
1

1 Introduction
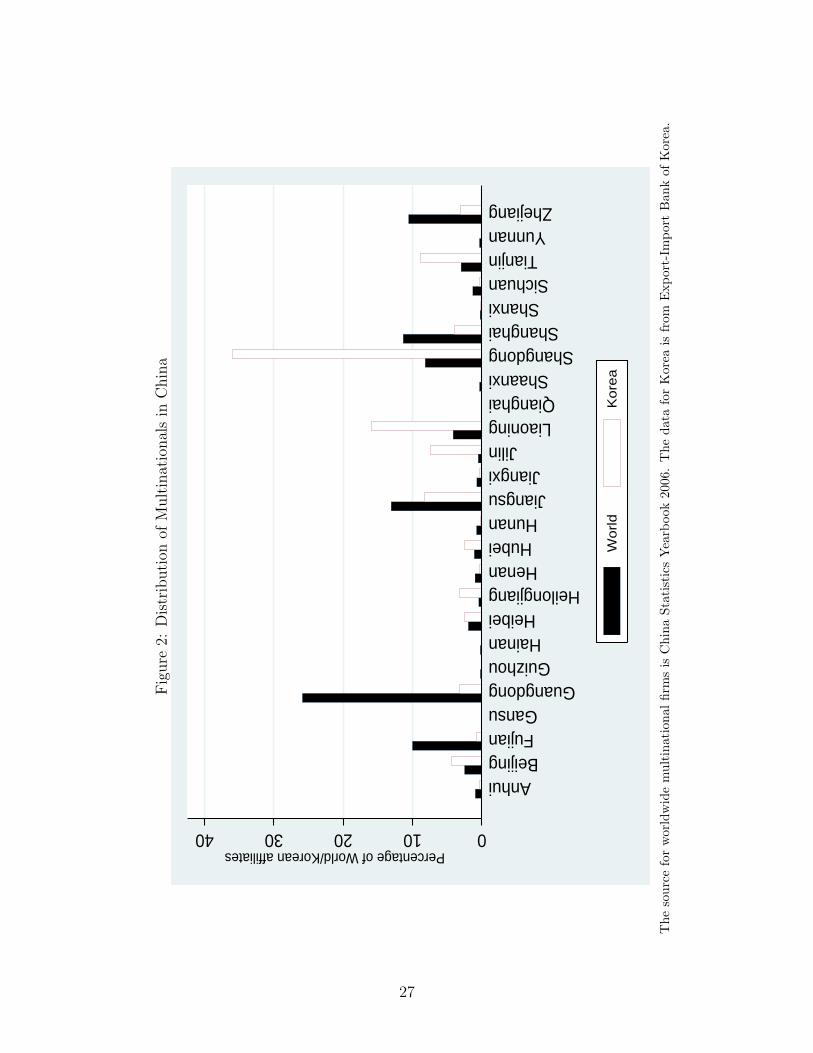
The distribution of South Korean affiliates across Chinese provinces is very uneven
and is also more concentrated than the overall distribution of foreign affiliates in
China. As Figures 1 and 2 indicate, four regions out of 26 cover roughly about 75
percent of South Korean affiliates in China. Moreover, this pronounced pattern is not
limited to China. As a matter of fact, if you turn to the U.S., another large country
with many regions, you find that almost 60 percent of South Korea’s affiliates are
concentrated in one state: California. In this paper we investigate these patterns of
clustering of multinationals along national lines for South Korean affiliates in China,
and we want to better understand what determines this type of agglomeration. That
affiliates of multinationals cluster along national lines is a well-known phenomenon
that has also been observed in other countries. It has triggered empirical work, among
others, by Head, Ries and Swenson (1995) that has been particularly influential. This
type of work is suggestive of the impact that agglomeration externalities along na-
tional lines may have on a firm’s decision to locate in a particular region. While the
evidence of agglomeration is abundant, however, it is not always clear what exactly is
driving the agglomeration. In this paper, we investigate the role that the availability
of backward and forward linkages can play in location decisions.
[Figure 1 and 2 here]
Important for the approach that we take is the work of Amiti and Javorcik (2008).
Amiti and Smarzynsak find that forward and backward linkages are an important
determining factor for multinationals from any country to invest in one of China’s re-
gions. Building on an economic geography model, they find that foreign firms choose
to locate in the regions where they can easily supply their intermediate goods to oth-
ers or purchase intermediate goods from other firms.1 To operationalize the upstream
and downstream links, the authors use input-output tables that were advocated long
ago by Hirschman (1958) and they interact these with total (local and foreign) re-
2
gional industry outputs. In their analysis, Amiti and Javorcik (2008) thus focus on
total (local and foreign) industry output and do not separately consider the linkages
through multinationals.2
In our study of South Korean investment decisions across Chinese regions, we
combine the approach of Head et al. (1995) and Amiti and Javorcik (2008). We let
the presence of South Korean firms in China affect the location decision of South
Korean multinationals in three ways. In addition to the regular agglomeration effect
that is captured by the number of South Korean affiliates in nearby industries, we use
input-output tables to investigate the extent to which the presence of South Korean
upstream or downstream affiliates in nearby industries increases the probability that
a South Korean multinational will invest in a particular Chinese region. At the same
time, we explicitly compare and contrast these linkage effects with the ones from
the total number of upstream and downstream companies in an industry irrespective
of their nationalities. In doing so, we insert a national dimension into the analysis
of Amiti and Javorcik (2008) and a linkages dimension into the work of Head et al.
(1995). Interestingly, we find that linkages along national lines matter most for South
Korean investors. However, the linkages at the industry level that do not differentiate
by nationality do not play much of a role.
FDI has been among the fastest growing international indicators and its growth
toward China and other emerging economies has been at the heart of many discussions
about globalization. Increasingly, the full scale of the reorganization of production
across national borders has become apparent and so are the many different ways in
which this takes shape. Since the 1980s when the first formal theories of multina-
tional activity were developed, empirical support has been found for the traditional
explanations for multinational activity.3 There is evidence that multinationals in-
deed relocate production to save transportation costs and to gain direct access to
large markets. Multinationals have also been found to open up affiliates in order
to jump tariffs or to move parts of their production to where resources are cheap.
The work on geographic agglomeration that emphasizes how a multinational’s loca-
tion decision depends on the decisions of other multinationals addresses the concern,
3
however, that the traditional factors do not exhaustively explain the full range of
multinational activities and the allocation decisions that firms make.4
Firms are known to cluster in one geographic area.5 Since Alfred Marshall, it has
been pointed out that there could be different types of external economies to ratio-
nalize the geographic clustering of firms. Clustering may bring about knowledge and
technology spillovers, the increasing availability of specialized labor and a growing
pool of specialized input providers. Agglomeration also takes place when firms invest
abroad. Foreign investors are more likely to choose locations where there are many
local firms, since their presence may suggest the mentioned external economies. Inter-
estingly, however, in the case of foreign direct investment, investors often agglomerate
around investors from the same country of origin. In their study of the location deci-
sion of U.S. firms in Ireland, Barry, Gorg and Strobl (2003) argue that investors may
exhibit a tendency to imitate each other’s location choice due to uncertainty. Since
foreign investors face greater uncertainty than local firms in the host country, they
may interpret the presence of firms from their home country as a positive signal of the
location’s attractiveness. It is this characteristic of foreign investment, in particular,
that we investigate.
In the empirical literature, agglomeration is typically interpreted as a positive
relation between a measure of the number of companies in a particular location and
the probability that investors choose that location, which is why the particular path
of history matters and why there is persistence in location decisions. We hypothesize
that the presence of more downstream or upstream establishments makes it more
likely that investors choose a particular location, which is quite intuitive. It suggests
less costly access to suppliers and buyers. Moreover, the hypothesis could be consis-
tent with earlier findings by Belderbos and Carree (2002) that smaller firms tend to
follow larger firms. In particular, our hypothesis provides the dependence on inputs
from other firms as the reason why this might be the case. Needless to say, building
clusters has been an integral part of the strategy to attract FDI in countries such
as Ireland or Costa Rica (Larrain, Lopez-Calva and Rodriguez-Clare, 2001). Note,
however, that the policy implications for attracting FDI may be different when the
4
presence of upstream or downstream establishments as such is important, irrespective
of their nationality, versus when these establishments have to be of the same national-
ity. If the latter holds, attracting some multinationals from a particular country may
help attract others, so there may be a payoff to bilateral strategies that specifically
target certain countries. At the same time, if linkages along national lines matter,
potential spillover gains could be internalized by affiliates of a particular country, and
attracting foreign firms, say, in order to have domestic firms benefit may be a lot
harder.
To study agglomeration and its upstream and downstream dimension, we focus
on South Korean multinationals and their initial investments in China. There are
two reasons for focusing on China. The first motivation is entirely pragmatic. South
Korean outward FDI is a recent phenomenon and still relatively limited (especially
when compared to outward FDI flows from the U.S. or Japan). Since China attracts
most of these new affiliates across regions, and since it has a sufficient number of
regions, we have enough observations to investigate the regional allocation decisions.
Note, however, that the pattern of agglomeration that we observe in China, seems
to follow a similar pattern in the U.S. for which we have far less observations.6 The
second reason why we focus on China, relates to its being, together with the United
States, the highest receiver of the world’s FDI. Already for this reason is it impor-
tant to better understand the location decisions in China. Moreover, FDI into China
has become one of the premier topics of policy debates in the region. It has fueled
anxieties of the “hollowing out of Korea’s production base as a result of the rush into
China”,7 as the South Korean investment promotion agency KOTRA puts it. In
this respect, it may be particularly relevant that South Korean affiliates abroad are
increasingly active in industries such as machinery, transportation, and electronics.
These industries use a wide range of intermediate goods. In addition, they have been
associated with international fragmentation of production.8 Therefore, the availabil-
ity of linkages may be particularly important for these sectors in the wake of the
Asian currency crisis and the increased liberalization of outward FDI in its wake.
We use a relatively new dataset of South Korean FDI in China for the empirical
5

analysis. Different from other datasets, ours is not limited in time span or scope, which
is, of course, related to the fact that China only opened up to South Korean FDI fairly
recently. The data covers all South Korean investment in China between 1988 and
2004. The advantage of studying the distribution of FDI within a country rather than
across countries is that country-specific factors can be taken as given. In addition,
we can study firm location at a less aggregate level, which is particularly relevant for
agglomeration issues. The challenge of empirical research on agglomeration is then to
properly control for alternative explanations that may explain the presence of clusters
of affiliates such as comparative advantage or government incentives to attract foreign
investors. In our preferred specification, we include region-time-specific effects. We
also include a specification with region-specific effects in addition to wages, a region’s
market potential, a measure for regional skill quality as well as controls for China’s
policy initiatives to attract FDI such as the foreign trade zones that have been created
with the explicit objective of attracting FDI.
Our study most closely relates to the work of Head et al. (1995) who, together
with Wheeler and Mody (1992), were among the first to study agglomeration effects
for FDI. In particular, Head et al. (1995) examined the location of Japanese manufac-
turing investment across the US states in the 1980s. They also use conditional logit
estimates that are well suited for an investigation into how the variation in location
(state) attributes affects the probability that a multinational will choose to set up
an affiliate in a particular state. Moreover, Head et al. (1995)’s specific analysis of
agglomeration externalities within vertical Keiretsu groupings for Japanese invest-
ment in the US paves the way for our more general analysis of forward and backward
linkages that probes whether the influence of linkages extends beyond national lines.9
As a matter of fact, we also investigate if our results are sensitive to whether firms
are part of larger Chaebols.
We first discuss the approach in the next section before we turn to the data that
we use in section 3. In the last two sections, we explain the results and state our
conclusions.
6
2 Empirical Implementation
Conditional logits with the particular place that is chosen by the investor as depen-
dent variable offer a straightforward way to implement location choice models. They
allow us to investigate how the characteristics of the various locations affect the like-
lihood of investors investing in a particular place at the time of the first investment.
We follow Head et al. (1995) who builds on McFadden (1974)’s result that logit choice
probabilities can be derived from individual firm maximization decisions. In partic-
ular, the place that offers the highest expected profitability is chosen as destination.
When the production function of the affiliate in a particular place is assumed Cobb-
Douglas, agglomeration externalities from other companies in the place, together with
other production inputs, will affect a firm’s output and profitability in a multiplica-
tive way. In this case, the expected profitability of an affiliate j in place p, Πjp, is a
log-linear function of the agglomeration measures and other attributes of the places,
which are all captured by the vector Xjp.(We drop the time-subscripts for simplicity.)
Πjp = β′Xjp + εjp (1)
If εjp is Type-I Extreme Value random error, following McFadden (1974), the
probability that j invests in place p equals the following expression:
pr(1j = p) =exp(β′Xjp)∑p exp(β′Xjp)
(2)
The most common formulation of equation (1) is as follows.
πp = θp + α ln Asp + β ln Zp + εp (3)
, where θp represents place-specific effects, Asp stands for agglomeration externali-
ties in sector s and place p, and Zp represents other attributes of the different places.
It could be argued that the geographic borders of provinces are arbitrary. Therefore,
we construct a distance-weighted agglomeration variable for each province that also
includes the agglomeration variables of the other provinces weighted by their relative
7

distance.
WAsp = As
p +P∑
l 6=p
Asl ∗
Dist−1lp
P∑
l 6=p
Dist−1lp
(4)
, where Distlp is the distance between capital cities. Hence, WAsp will be higher
where there are many firms nearby.
As indicated, to capture agglomeration, we consider WAsp from two different an-
gles. On the one hand, we take it to be the number of Korean affiliates within an
industry. On the other hand, we measure the total number of companies in an indus-
try irrespective of nationality (including local Chinese companies) that are already
active at the time that an investment decision is made.10 Including both measures in
the conditional logit will allow us to see which of the two types of agglomeration has
most traction.
Place-specific effects are captured by place-specific dummies that control for time-
invariant factors. These factors capture the geography, the proximity to South Korea,
the infrastructure, or the presence of a South Korean expatriate community that all
make a place more or less attractive to investors and that may be hard to measure. In
addition, we include economic and demographic variables such as a place’s education
levels, and its average wage rates that vary with the time of investment. These
variables are known determinants of multinational activity. Larger markets tend to
attract more (horizontal) FDI. Lower wages may be attractive for (vertical) FDI that
takes advantage of low production costs to relocate parts of the production process
that used to take place in the South Korean parent. We control for the variation
in efforts to attract foreign direct investment by including the number of economics
zones in the place. Since there is an issue about whether one can appropriately capture
all characteristics that vary over time and place, our preferred specification includes
place-time dummies. Needless to say, if there exists no agglomeration externality
and if all relevant factors that distinguish places are controlled for, the α coefficients
8
should be zero.
As indicated, we go beyond this baseline specification for agglomeration. Next to
the regular agglomeration effect we consider backward and forward linkages, in order
to capture the impact of increasing numbers of upstream suppliers of intermediate
goods and downstream buyers of such goods. To generate these measures of forward
and backward linkages, we use industry input-output tables and combine them with
the number of companies in a particular place/industry. For the linkages with South
Korean companies, we use the South Korean input-output tables and combine them
with the number of South Korean affiliates across the industries in the Chinese regions.
For the linkages at the industry level irrespective of nationality, we use the Chinese
input-output tables combined with the total number of companies in a particular
region/industry that are mostly of non-South Korean nationality.11 In each case do
we capture the strength of forward linkages as follows: FLmp =
∑n δmnA
np , where δmn
is the proportion of sector m output supplied to sector n and∑
n δmn = 1.12 Again,
to take into account spatial aspects, we construct distance-weighted forward linkages
variables in the following way.
WFLmp = FLm
p +∑
n
δmn
P∑
l 6=p
Asl ∗
Dist−1lp
P∑
l 6=p
Dist−1lp
(5)
Hence, WFL will be higher in any place where many downstream firms are al-
ready located nearby. The variable for backward linkages is analogously represented
by BLnp =
∑m γmnA
mp , where γmn is the proportion of sector m output supplied to
sector n and∑
m γmn = 1 and distance-weighted backward linkages, WBL, will be
higher where many upstream establishments are already located nearby. As indi-
cated, we will construct these upstream and downstream linkage variables specifically
for South Korean affiliates as well as for the total number of companies in an indus-
try irrespective of their nationality. Note that the variables differ by place/sector,
since the usage of intermediate goods varies by industry. Rewriting the profitability
9
equation (3), we obtain equation (6).
πp = θp+∑
i={SK,I}αia ln WAs
ip+∑
i={SK,I}αif ln WFLs
ip+∑
i={SK,I}αib ln WBLs
ip+β ln Zp+εp
(6)
The new coefficients αf and αb should be significantly positive if an investor
chooses a particular place because it has more South Korean (SK) upstream (down-
stream) affiliates for an industry or, more generally, because the total number of up-
stream (downstream) companies in this industry is higher irrespective of nationality
(I). Note that we purposefully include the linkages as well as the regular agglom-
eration variables for the South Korean affiliates as well as for all firms irrespective
of their destination. In this way, we can see whether the linkage effects that specify
why agglomeration should matter add something to the regular agglomeration effects.
Similarly, we should be able to figure out whether the South Korean linkages are more
or less important than the aggregate industry linkages.
3 Data and FDI from South Korea
The data of South Korean foreign affiliates is collected by the Export-Import Bank
of Korea that covers the full list of South Korean affiliates established worldwide.
Relevant for our analysis are the first-time investments of multinationals in Chinese
regions, which started in 1988. Figures 3 and 4 illustrate the dominant trends of
South Korean outward FDI into China in terms of the amount invested and the num-
ber of newly established affiliates. Before the mid 1990s FDI gradually increased.
Since then, there has been a significant outflow. The late 1990s were the only ex-
ception. At the time, South Korea was caught in the Asian financial crisis. As for
outward FDI going into China, the data shows a significant increase in the number
of affiliates established as well as in the amount of FDI since 1988. In particular,
there was a dramatic increase in FDI moving into China around 1992 when Korea
and China entered into diplomatic relations. Note that there may be some concern
10
that the investments prior to 1992 were not merely a function of economic interests.
Finally, as is clearly shown in Figures 3 and 4, a large percentage of foreign affiliates
from South Korea are located in China. As of 2004, more than 50 percent of its new
affiliates are established in China.13
[Figure 3 and 4 here]
Figures 5 and 6 present the industry characteristics of FDI into China in terms
of the number of affiliates. According to Figure 5, more than 80 percent of the affili-
ates over the entire period are active in manufacturing in China, which is significantly
higher than the worldwide share (a bit above 60 percent). This is in line with the per-
ception of China as the world’s factory. We also isolate the share of affiliates that are
active in machinery, transportation, and electronics. These sectors not only provide
and use many intermediate goods from other sectors. In addition they are sometimes
identified with international fragmentation of production.14 Of interest is to see that
the share of the affiliates in these industries has increased significantly after it had
been relatively stable before 1999. This could contribute to the importance of linkages.
[Figure 5 and 6 here]
China has 22 provinces (excluding Taiwan), 5 autonomous regions (Tibet, Xin-
jiang, Inner Mongolia, Ningxia, and Guangxi), and 4 municipalities (Beijing, Tianjin,
Shanghai, and Chongqing). As Figures 1 and 2 show, the South Korean affiliates in
China are quite concentrated and more concentrated than the distribution of the to-
tal number of affiliates of any nationality. Four regions account for about 75 percent
of the total population of South Korean affiliates. The investments in Guangdong
and Jiangsu, for example, amount to more than 40 percent of worldwide investment,
while those investments account for less than 12 percent for Korea. Shandong is the
premier destination for Korean investment. Interestingly, Liaoning, Jilin, and Hei-
longjiang seem to be attractive locations for Korean firms, but not for the other coun-
11
tries. This should perhaps not be so much of a surprise since many Korean-Chinese
who speak Korean live in these provinces, which are adjacent to North Korea.15 Note
that this concentration of South Korean affiliates is also found in the U.S., the other
large country in the dataset of which we have a regional distribution. Here again, we
find a higher concentration among South Korean affiliates than for all the affiliates
combined. Almost 60% of Korean FDI is concentrated in California, which is 5 times
higher than the world average.16
We end up working with 25 regions. Since the five autonomous regions are ge-
ographically separate entities and the investments are reported together, we cannot
include them in the analysis.17 At the same time, we merge the data for the munici-
pality of Chongqing with Sichuan Province, since it was separated only in 1997.
We measure agglomeration using the number of Korean affiliates already active
in the region in the same manufacturing industry in the year before an investment
takes place. The Export-Import Bank of Korea records South Korean outward FDI
according to a total of 69 manufacturing industries, which is similar to the Korea
Standard Industry Classification (KSIC) 4- digit level. Accordingly, the agglomera-
tion variable for South Korean affiliates is specified for 69 industries. For the total
number of companies at the industry level that are overwhelmingly of non-South Ko-
rean nationality, we use the data from the China Industry Statistics Yearbook series.
The data contains the total number of firms and output according to 18 manufac-
turing industries. In one specification, we will use both (different) classifications. In
another, we will match as closely as we can the Chinese classification with the South
Korean data by aggregating Korean data up to 18 (roughly) comparable industries.18
When we do the estimation, we will first focus on the period since 1999, before
we turn to the entire period after 1992. There are two reasons for doing so. The
period since the Asian financial crisis has seen the strongest increase in affiliates from
electronics, materials and transportation that are especially relevant for our analysis.
More importantly, a data issue complicates the analysis for the entire period. The
China statistics department changed the data collection classification between 1997
and 1998. Due to that change, the total number of companies in 1998 dropped to 1/3
12
of the 1997 data across all the industries. To control for this anomaly, we will interact
the aggregation variables with a dummy for the post 1998 years in our analysis when
we focus on the entire period since 1992. Finally, to avoid missing values in a log
transformation, we add one to this variable as previous studies have done.19
When we focus on the supply and demand of intermediate goods by South Korean
affiliates, we use the Korean input-output table from the year 2000 to measure firm
linkages.20 To merge input-output tables and Korean FDI data, we have to concord
the industry classifications as there is a slight variation between both sources.21 For
example, the input-output table specifies semiconductors (KSIC 3211) and other re-
lated devices (KSIC 3219) separately, while in the FDI data set, both industries are
classified as semiconductors and related devices. In this case, we combine KSIC 3211
and KSIC 3219 to match the FDI classification. When some industries are more finely
defined in the FDI data set than in the input-output table, we adjust the sectors ac-
cordingly. In the end, our adjusted input-output table consists of 53 industries. In
order to be able to construct the second agglomeration variable at the industry level
irrespective of nationality, we rely on the Chinese input-output table 1995, which
comprises 15 industries.22 Finally, in order to construct the linkage variables as de-
scribed in section 2, we interacted Korean input-output table with the number of
Korean affiliates and Chinese input-output table with the number of firms of all na-
tionalities, and also add one to them for the same reason as with the agglomeration
variable. While it is not feasible to exactly match the Chinese and South Korean in-
put output tables, we will also present estimates with a more aggregate South Korean
input output table of 18 sectors.
We control for regional economic and demographic factors in the estimation in two
ways. In our preferred specification, we include time-region dummies. We also show
results for an alternative specification that includes some of the known determinants of
FDI. It is well known, for example, that a larger regional economy attracts more FDI.
At the same time, as Head and Mayer (2004) suggest, market potential is an important
factor that may affect an investor’s location decision. To control for market potential
and a region’s size, we include the distance-weighted real GDPs of all regions. We take
13
the real GDP data from various issues of the China Statistical Yearbook. The distance
between regions is measured as the distance between the provincial capitals, which is
taken from yahoo.com. We control for the labor costs by including the average level
of regional staff and worker wages from the China Statistical Yearbook. Lower wage
rates could be more attractive to investors in search of cheap labor. Furthermore,
to control for the quality of workers, we include the ratio of high school graduates
to the total population. We compute this ratio from the China Statistical Yearbook.
Finally, we also consider a variable that reflect the government’s role in attracting
FDI. We choose the number of the special economic zones (SEZ) in a region that were
especially created for foreign companies.23 There are many different types of economic
zones such as Open coastal cities (OCCs), economic and technological development
zones (ETDZs), open coastal areas (OCAs), technology industry development zones
(TIDZs), bonded zones (BZs), border economic cooperation zones (BECZs), and
export processing zones (EPZs). As of 2004, there was a lot of variation in the total
number of zones in a region, with Guangdong having as many as 20 economics zones,
for example.
Table 1 reports the summary statistics for the main variables of our analysis after
taking into account spatial aspects. Agglomeration measures the total number of
firms in an industry, irrespective of their nationality. Agglomeration by SK affiliates
only counts the South Korean affiliates in an industry. Similarly, we have forward
and backward linkages involving all the firms in an industry as well as those only
involving the South Korean affiliates.
[Table 1 here]
4 Results
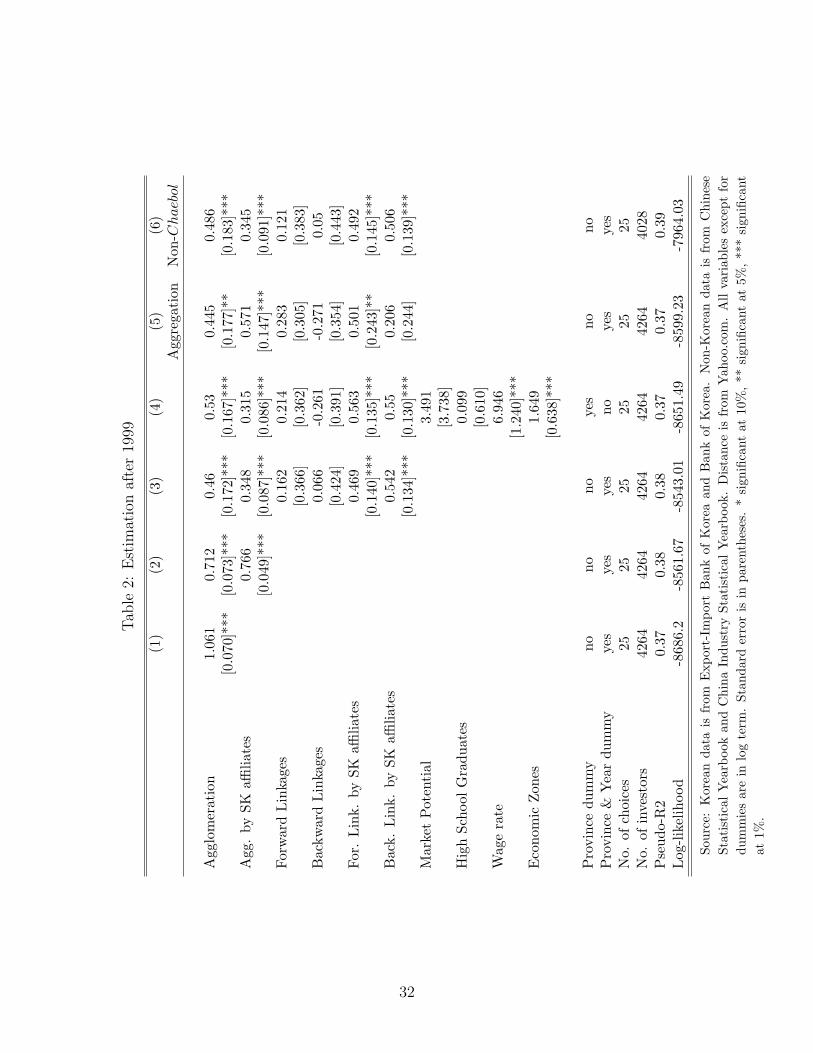
Table 2 reports the estimation results for the period after the Asian financial crisis.
As mentioned before, this period saw an increase in the share of affiliates from sectors
14
prone to vertical integration and keen on international fragmentation. At the same
time, as far as the total number of firms goes, the data is the most consistent for this
period. The results present the estimates of equation (6) that specifies the factors
that determine an investor’s decision to invest in a particular Chinese region. In all
columns, except for the fourth one, the equation includes time-region-specific effects.
The first two columns present familiar estimates of equation (6) that have been used
in previous studies. The estimates in the first column suggest that firms agglomerate
by industry regardless of nationalities. Those in the second column indicate that
the decision to invest in a particular Chinese region is determined not only by the
agglomeration of companies of any nationality in a given industry, but also in partic-
ular by the number of South Korean affiliates in that industry. The coefficients are
significantly positive and in the range of previous studies. The likelihood ratio test
between the specification in column (1) vs. (2) overwhelmingly rejects the hypothesis
that the South Korean agglomeration variables have no explanatory power.24 Note
that the interpretation of the coefficient estimate as the average probability elasticity
needs some care in a conditional logit model. It can be shown that the average prob-
ability of how any regressor impacts the location choice over all choosers and location
choices should be calculated as follows: (S − 1)/S times the regressor’s estimated
coefficient, where S is the number of location choices.25 Since there are 25 locations
in our study, our estimates show that a 10 percent increase in the distance-weighted
number of Korean affiliates in one region will increase the probability that investors
choose that region by around 10 percent (0.96 x 1.061 x 10).
[Table 2 here]
As argued before, there are various ways to interpret these findings, and it is
not clear why firms would agglomerate in a particular location. We therefore add
to the regular agglomeration effect the effect due to forward and backward linkages.
Moreover, we consider both the agglomeration linkages for South Korean affiliates
and the agglomeration linkages at the industry level for companies of any nationality
15
(including local Chinese companies). In the third column of Table 2, we include the
linkage variables that are described in section 2. The regular agglomeration exter-
nalities remain strongly positive. The result shows that both forward and backward
linkage effects are significant for South Korean establishments. The likelihood ratio
test prefers the specification in column (3) that includes the South Korean Link-
age variables over that in column (2).26 As expected, the magnitude of the regular
agglomeration effect decreases significantly as forward and backward linkages are in-
cluded. Interestingly enough, however, the linkage effects at the industry level across
nationalities are not significant. This suggests that, while the presence of many com-
panies in an industry matters, the nationality of the establishments is key for the
specific upstream and downstream links that are directly aligned with the specific
production process.
In the fourth column of Table 2, we drop the time-region effects and include
region-specific dummies together with other more traditional determinants of industry
location that vary over time. As noted, our measures of market potential, education,
and the wage and economic policies meant to attract multinationals all enter with
a positive sign. However, only the wage and the number of economic zones are
statistically significant. The positive coefficient on the wage runs counter to our
initial intuition that multinationals might seek low-wage regions. This may suggest
that the wage also picks up the quality/education level of the labor force.
As mentioned, there is an issue about the different classification of the industries
according to the Chinese versus the South Korean statistics. The fifth column reports
estimates when we (imperfectly) map the South Korean industry classification into
its Chinese counterpart and use a more aggregate South Korean input output table.
For most part, the results hold up. Only the backward South Korean link loses
significance, while maintaining the same sign.
Finally, we focus on the role of Chaebol for our results. It is well known that
Chaebol, South Korea’s conglomerates, play a prominent role in South Korea’s in-
dustrial texture. We want to investigate whether our results are driven by these large
corporations. It turns out that they are not. When we drop all the larger corpora-
16
tions from the sample, all variables of interest retain the same signs and significance.27
These findings then add an interesting dimension to the existing literature. As Belder-
bos and Carree (2002) have noted, small firms are followers. What our results show
is that smaller firms are followers especially because they go where suppliers of inputs
and buyers of their intermediate goods are more plentiful. Moreover, Figure 7 shows
that the fraction of big firms in total firms has been decreasing over time, suggesting
in addition that initially larger multinationals went abroad.
[Figure 7 here]
In Table 3, we extend the sample. We present estimates for the post-1992 period.
We estimate from 1992 onward rather than 1988, since there is some concern that
the location choice before the diplomatic relations between China and South Korea
were initiated in 1992 may not have been purely for economic reasons.28 Note that
we included early establishments going back to 1988 in the count of firms to construct
the agglomeration variables when we estimated the location decision after 1992. The
makeup of Table 3 mimics that of the previous table for the time since 1999, and the
results largely correspond to those of the more recent period.29 The main difference
is that the estimates are somewhat weaker and less precisely estimated.
[Table 3 here]
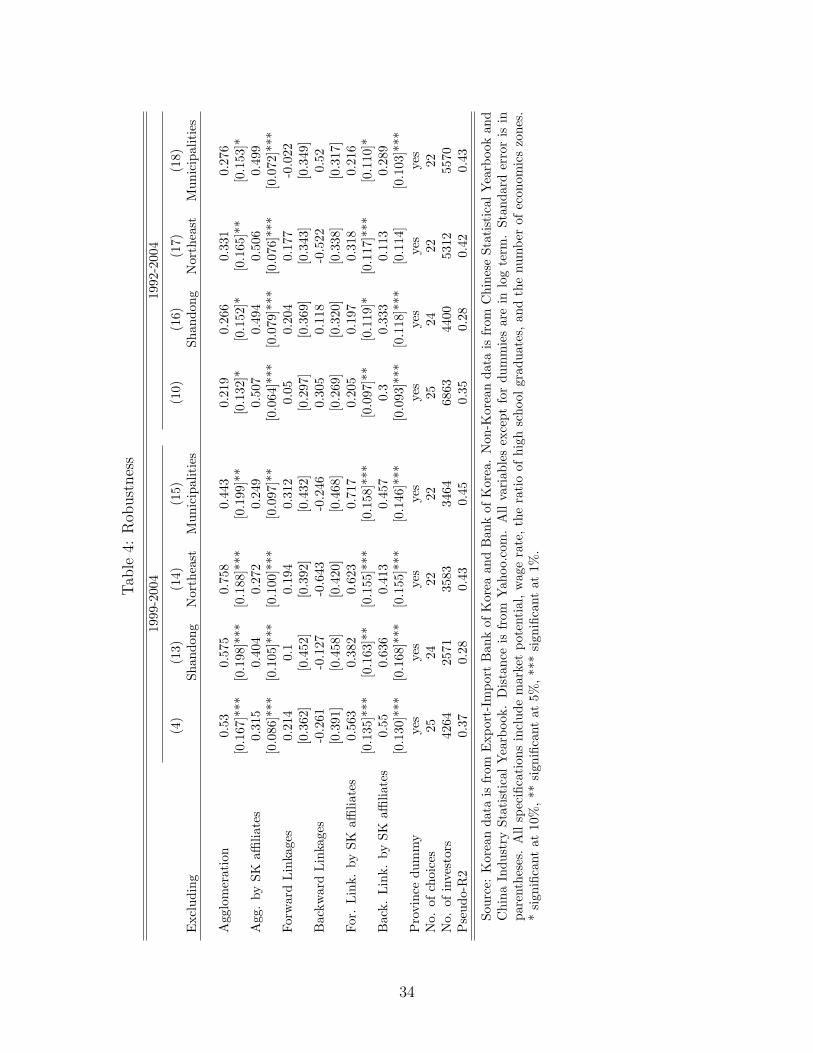
The last issue that we address is the robustness of the results. In particular, we
investigate the independence of irrelevant alternatives (IIA) assumption that is im-
plied in a conditional logit analysis. In a conditional logit, the relative probability
of choosing between two alternatives should not depend on the availability of a third
alternative. The IIA assumption hinges upon the identical and independent error
terms. As argued by Head et al. (1995), the inclusion of alternative specific constants
(in our case, regional dummies) allows for conditional logits in the presence of viola-
tions of IIA, as long as investors have uniform perceptions about the substitutability
17
between states. At the same time, the regional dummies complicate formal testing of
IIA since they yield different numbers of parameters across specifications. We there-
fore compare the estimates of the critical variables of interest as we exclude several
regions with the baseline estimates for the full set of choices. When the coefficients
and significance levels are relatively stable, we regard the IIA assumption as valid,
as is done in the previous studies. We exclude Shandong, three Northeast provinces
(Jilin, Liaoning, and Heilongjiang), and three municipalities (Beijing, Tianjin, and
Shanghai) in turn in the second and third column of Table 4. Note that the first
column for each time period is the standard estimate (4) from Tables 2 and (10)
from Table 3 that includes regional variables with region-specific dummies. For ref-
erence, Shandong is the location of most Korean firms ; the Northeast provinces are
attractive regions for Korean investors since there are many Korean Chinese; and the
municipality itself has economic significance. For the period after 1999, the coeffi-
cients and significance levels are relatively stable. For the entire period after 1992 we
have comparable results that, as before, tend to be somewhat smaller and somewhat
less precisely estimated.
[Table 4 here]
5 Conclusion
China, together with the United States, has topped the list of recipients of FDI for
a number of years. This has heightened the interest to gain a better understanding
of what drives multinationals into China and what explains the local dispersion of
multinationals as China is rapidly being integrated in the world economy. With an
unpublished data source for all of Korea’s affiliates across China’s regions, we inves-
tigate whether and how agglomeration affects the allocation decision along industry
lines and along national lines. In particular, we extend the usual agglomeration anal-
ysis and investigate next to the regular agglomeration effect the impact of backward
18
and forward linkages. Since the work by Hirschman (1958), there has been an active
interest in forward and backward linkages. Moreover, the idea of forming clusters of
economic activity has been central in the attempts to attract FDI in countries such
as Ireland and Costa Rica.
We find that forward and backward linkages interacted with the presence of other
Korean affiliates in China play a significant role in determining the location of Korean
FDI in China. At the same time, however, the general forward and backward linkages
at the industry level, irrespective of nationality, do not seem to matter much. These
findings are fairly robust and not driven by the South Korean Chaebol. Our results
imply the presence of multinationals from one country of origin attracts other firms
that country. From a policy perspective, this seems to imply a bilateral approach.
Indeed, if the objective of the Chinese government is to attract more multinationals,
it may be worthwhile to target specific countries. At the same time, our findings
also imply a note of caution. With clustering along national lines, potential spillovers
are likely to be internalized among the affiliates from one and the same country.
Consequently, if generating spillovers for the local industry is part of the reason for
attracting foreign companies, our results indicate that this may be a difficult objective
to realize. Interestingly enough, recent research by Girma and Gong (2008) and
Girma, Gong and Gorg (2008) indicates that there have been limited spillovers from
FDI in China on its state-owned enterprises, which is consistent with our analysis.
19

References
Amiti, Mary, and Beata Smarzynska Javorcik (2008) ‘Trade costs and location of
foreign firms in China.’ Journal of Development Economics 85(1-2), 129–149
Barry, Frank, Holger Gorg, and Eric Strobl (2003) ‘Foreign direct investment, agglom-
eration and demonstration effects: an empirical investigation.’ Review of World
Economics 139, 583–600
Belderbos, Rene, and Martin Carree (2002) ‘The location of Japanese investments in
China: Agglomeration effects, Keiretsu, and firm heterogeneity.’ Journal of the
Japanese and International Economics 16, 194–211
Blonigen, Bruce A. (2005) ‘A Review of the Empirical Literature on FDI Determi-
nants.’ Atlantic Economic Journal
Blonigen, Bruce A., Christopher J. Ellis, and Dietrich Fausten (2005) ‘Industrial
groupings and foreign direct investment.’ Journal of International Economics
65(1), 75–91
Brainard, S Lael (1997) ‘An Empirical Assessment of the Proximity-Concentration
Trade-off between Multinational Sales and Trade.’ American Economic Review
87(4), 520–44
Carr, David L., James R. Markusen, and Keith E. Maskus (2001) ‘Estimating the
Knowledge-Capital Model of the Multinational Enterprise.’ American Economic
Review 91(3), 693–708
Cheng, Leonard K., and Yum K. Kwan (2000) ‘What Are The Determinants of The
Location of Foreign Direct Investment? The Chinese Experience.’ Journal of In-
ternational Economics 51(2), 379–400
Girma, Sourafel, and Yundan Gong (2008) ‘FDI, Linkages and the Efficiency of State-
Owned Enterprises in China.’ The Journal of Development Studies 44(5), 728–749
20
Girma, Sourafel, Yundan Gong, and Holger Gorg (2008) ‘Foreign Direct Investment,
Access to Finance, and Innovation Activity in Chinese enterprises.’ World Bank
Economic Review 22(2), 367–382
Gorg, Holger, and Eric Strobl (2002) ‘Multinational companies and indigenous devel-
opment: An empirical analysis.’ European Economic Review 46(7), 1305–1322
Hanson, Gordon H., Raymond J. Mataloni, and Matthew J. Slaughter (2005) ‘Ver-
tical Production Networks in Multinational Firms.’ The Review of Economics and
Statistics 87, 664–678
Head, Keith, and Thierry Mayer (2004) ‘Market Potential and the Location of
Japanese Investment in the European Union.’ The Review of Economics and Statis-
tics 86(4), 959–972
Head, Keith, John Ries, and Deborah Swenson (1995) ‘Agglomeration benefits and
location choice: Evidence from Japanese manufacturing investments in the United
States.’ Journal of International Economics 38(3-4), 223–247
(1999) ‘Attracting foreign manufacturing: Investment promotion and agglomera-
tion.’ Regional Science and Urban Economics 29(2), 197–218
Helpman, Elhanan (1984) ‘A Simple Theory of International Trade with Multinational
Corporations.’ Journal of Political Economy 92(3), 451–71
Hirschman, Albert O. (1958) The Strategy of Economic Development (Yale University
Press)
Larrain, Felipe B., Luis F. Lopez-Calva, and Andres Rodriguez-Clare (2001) Intel:
A Case Study of Foreign Direct Investment in Central America (In Larrain, Felipe
(eds.), Growth and Internationalization, Harvard University Press)
Markusen, J, and A Venables (1999) ‘Foreign Direct Investment as a Catalyst for
Industrial Development.’ European Economic Review 43, 335–356
21
Markusen, James R. (1984) ‘Multinationals, Multi-plant Economies, and the Gains
from Trade.’ Journal of International Economics 16(3-4), 205–26
(2002) Multinational Firms and the Theory of International Trade (MIT Press,
Cambridge)
McFadden, Daniel S. (1974) Conditional logit analysis of qualitative choice behavior
(New York: In: Zarembka, P. (Ed), Frontiers in Econometrics, Academic Press)
Navaretti, Giorgio Barba, and Anthony J. Venables (2004) Multinational Firms in
the World Economy (Princeton University Press)
Porter, Micheal (1998) ‘Clusters and the New Economics of Competition.’ Harvard
Business Review
Wheeler, David, and Ashoka Mody (1992) ‘International investment location decisions
: The case of U.S. firms.’ Journal of International Economics 33(1-2), 57–76
Yeaple, Stephen Ross (2003) ‘The Role of Skill Endowments in the Structure of
U.S. Outward Foreign Direct Investment.’ The Review of Economics and Statistics
85(3), 726–734
22
Notes
0Lead footnote:An earlier version of the paper benefited from presentations at the Univ. of Not-
tingham, the Texas Econometric Camp, and the Darden Business School of University of Virginia.
The usual disclaimers apply.1Gorg and Strobl (2002) also study agglomeration effects and linkages in Ireland. Following
Markusen and Venables (1999), they investigate the extent to which the presence of multinationals
affects entry of indigenous firms in Ireland, and how the location choice is affected by downstream
linkages.2In robustness checks, Amiti and Javorcik (2008) find that the number of foreign firms in a region
also plays a role, in addition to the total linkage effects.3Helpman (1984) is a key theoretical paper on vertical integration that has labor-intensive parts
of production relocate to low-wage countries; Brainard (1997) and Markusen (1984) emphasize
horizontal integration and distance for which exports and affiliate production are substitutes. Carr,
Markusen and Maskus (2001) provides empirical evidence of horizontal multinational activity. Yeaple
(2003) and Hanson, Mataloni and Slaughter (2005) are two papers that document vertical links.
More detailed surveys of the literature are found in Navaretti and Venables (2004) and Markusen
(2002).4A recent survey by Blonigen (2005) emphasizes the need to go beyond the traditional theories
of the multinational.5See Porter (1998).6For a limited set of observations we have evidence from South Korean affiliates across U.S. states
that confirms regional clustering along national lines. Also, esp. forward linkages seem to matter
for location decisions of South Korean multinationals.7See, Economist, August 25, 2001.8See Hanson et al. (2005).9Head, Ries and Swenson (1999) extend their previous analysis as they explicitly control for
more factors that characterize the different regions - a key concern in conditional logit analysis.
Blonigen, Ellis and Fausten (2005) find agglomeration effects across both horizontal and vertical
Keiretsu groupings. However, their analysis of Japanese multinationals is across countries, rather
than states.10Because of a change in the Chinese data collection, see p.13, we cannot simply subtract the
number of South Korean firms from the Chinese firms. However, since the number of South Korean
establishments is small compared to the total number of companies in an industry, the industry
agglomeration variable corresponds roughly to the non-South Korean companies.11We assume that the link with Korean establishments are reflected in the Korean IO table while
23

that with non-Korean ones in the Chinese IO table. As a robustness check, however, we use either
the Korean or the Chinese IO table for both cases and the results do not depend on it.12Consumer demand can be a factor in considering forward linkages. It is not straightforward
to construct such a variable, however, because consumer demand will be expressed in monetary
terms while the current linkage variable is based on the number of establishment. Therefore, we will
include market potential as a control variable in some of the specifications.13If we compare the data for China and the U.S., we find that while the volume of FDI to the
U.S. is significant and comparable to China in later years, the flows go to far more affiliates in
China compared to the U.S., which is why China is better suited for a study of regional clustering
compared to the U.S.14Hanson et al. (2005) find strong vertical FDI activity in industries such as machinery, trans-
portation, and electronics.15As we will not use worldwide FDI in our conditional logits, but rather the number of companies
from other nationalities in a particular region/industry irrespective of their nationality, we want to
note that the correlation between the regional distribution of worldwide FDI and that of overall
manufacturing output is, as one would expect, fairly high at 74 percent.16When we construct a Herfindahl index to measure the concentration of affiliates across states,
the pattern for China and the U.S. is comparable. There is a higher concentration for South Korean
vs. total foreign affiliates across states in both cases: The Herfindahl indices for South Korean
affiliates in China and in the U.S. are respectively 0.182 and 0.338; for total foreign affiliates we find
0.129 in China and 0.043. in the U.S.17The investment into those regions is less than 10.18 The 18 industries are general industry machinery, other machinery, non-metal mineral, tex-
tile, synthetic fiber, food, grain-mill products, beverages, instruments, automobile, electronic and
electrical machinery, electronic and communication components, primary metal, fabricated metal
products, printing and allied products, coke and petroleum, chemical and drug.19An easy way to rationalize this is to argue that the investing firm does take its own presence in
the region into account as it decides whether to invest in a region. We follow Head et al. (1995).20Since the industry shares do not change much during the sample period, the 2000 table is used
for all years. Alternatively, one could use the IO tables that were published with 5-year intervals.
A drawback of going that route is that the classification also changes over the time period.21The input-output table is published by the Bank of Korea, while the FDI data come from the
Export-Import Bank.22We also used the table published by World Bank, which is based on GTAP 4 database. Input-
output coefficients are fairly stable and analysis using either table produced the similar results.23Cheng and Kwan (2000) provide evidence of the significant role of special economic policy.
24
24The test statistic is 249 and the critical value at 0.005 level is 8.25See Head et al. (1995).26The test statistic is 37 and the critical value at 0.005 is 15.27In the survey, the investing firms declare themselves large or not. Some 8 percent is large.28It turns out that estimates for the entire sample, starting from 1988 are qualitatively the same,
but somewhat weaker. Alternatively, one could argue that the early years of the data set are not of
major interest to uncover agglomeration effects, since there were no South Korean affiliates in 1988.29The likelihood ratio tests comparing the specification in column (7) vs. (8) and (8) vs. (9)
prefer column (8) and (9).
25

Fig
ure
1:D
istr
ibuti
onof
Sou
thK
orea
nin
vest
men
tin
Chin
a
0 -
5%
5 -
10%
10 -
25%
25 -
100%
Sour
ce:
Exp
ort-
Impo
rtB
ank
ofK
orea
26
Fig
ure
2:D
istr
ibuti
onof
Mult
inat
ional
sin
Chin
a
010203040Percentage of World/Korean affiliates
AnhuiBeijingFujianGansu
GuangdongGuizhouHainanHeibei
HeilongjiangHenanHubei
HunanJiangsuJiangxi
JilinLiaoningQianghaiShaanxi
ShangdongShanghai
ShanxiSichuan
TianjinYunnan
Zhejiang
Wo
rld
Ko
rea
The
sour
cefo
rw
orld
wid
em
ulti
nati
onal
firm
sis
Chi
naSt
atis
tics
Yea
rboo
k20
06.
The
data
for
Kor
eais
from
Exp
ort-
Impo
rtB
ank
ofK
orea
.
27
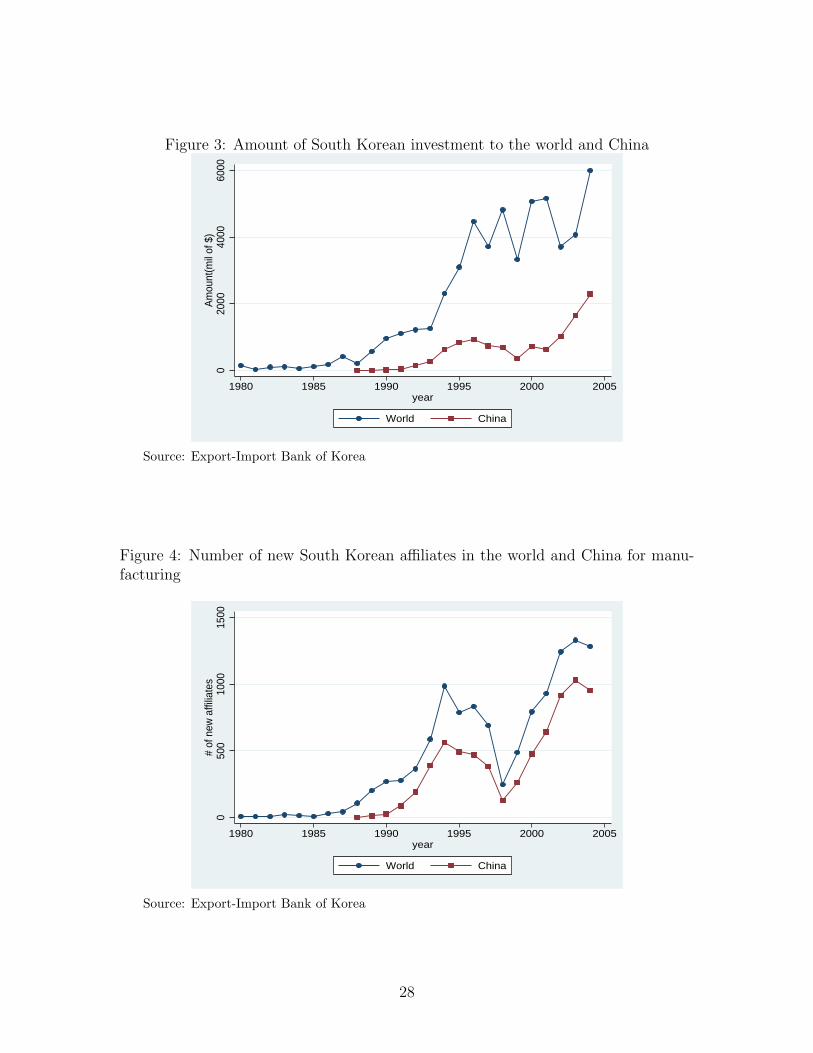
Figure 3: Amount of South Korean investment to the world and China
020
0040
0060
00A
mou
nt(m
il of
$)
1980 1985 1990 1995 2000 2005year
World China
Source: Export-Import Bank of Korea
Figure 4: Number of new South Korean affiliates in the world and China for manu-facturing
050
010
0015
00#
of n
ew a
ffilia
tes
1980 1985 1990 1995 2000 2005year
World China
Source: Export-Import Bank of Korea
28

Figure 5: Sectoral Shares of South Korea’s new affiliates in China vs. for the worldas a whole, in percent
0.2
.4.6
.8
China World
Primary ManufacturingService
% s
ecto
ral d
istri
butio
n
Graphs by dvdp
Source: Export-Import Bank of Korea
Figure 6: The share of affiliates in machinery, transportation and electronics in man-ufacturing
.1.2
.3.4
.5P
erce
ntag
e of
Kor
ean
affil
iate
s
1990 1995 2000 2005year
Source: Export-Import Bank of Korea.
29
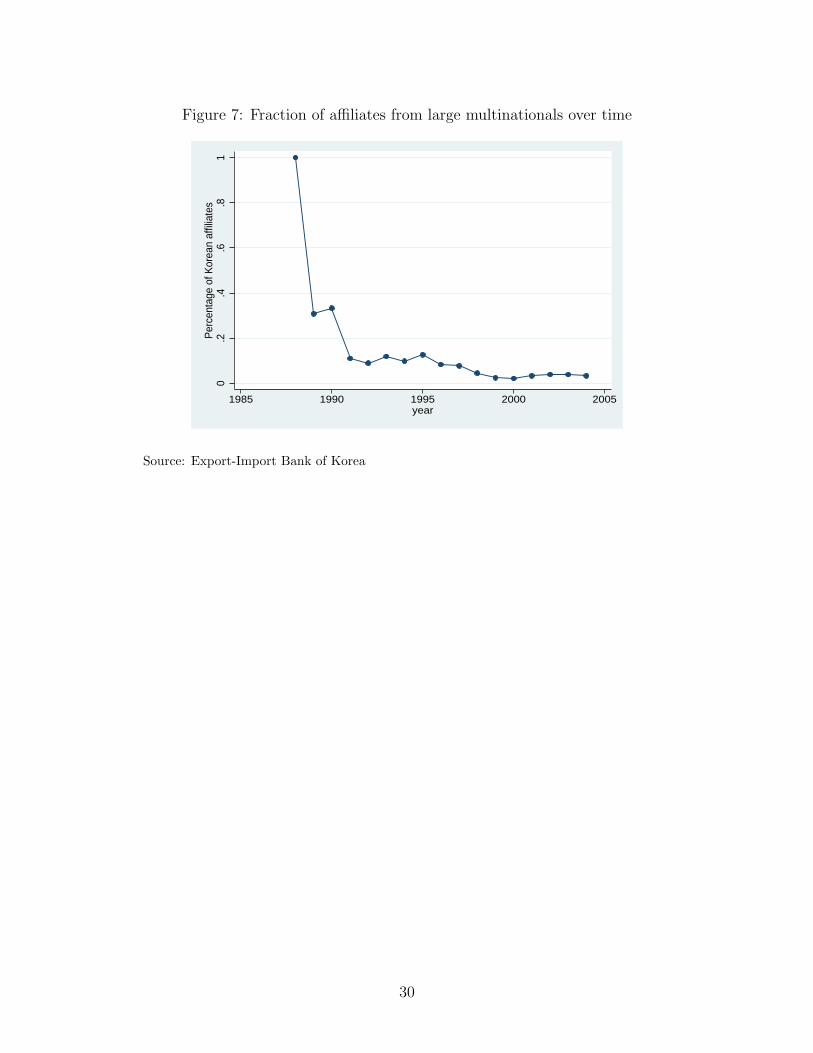
Figure 7: Fraction of affiliates from large multinationals over time
0.2
.4.6
.81
Per
cent
age
of K
orea
n af
filia
tes
1985 1990 1995 2000 2005year
Source: Export-Import Bank of Korea
30
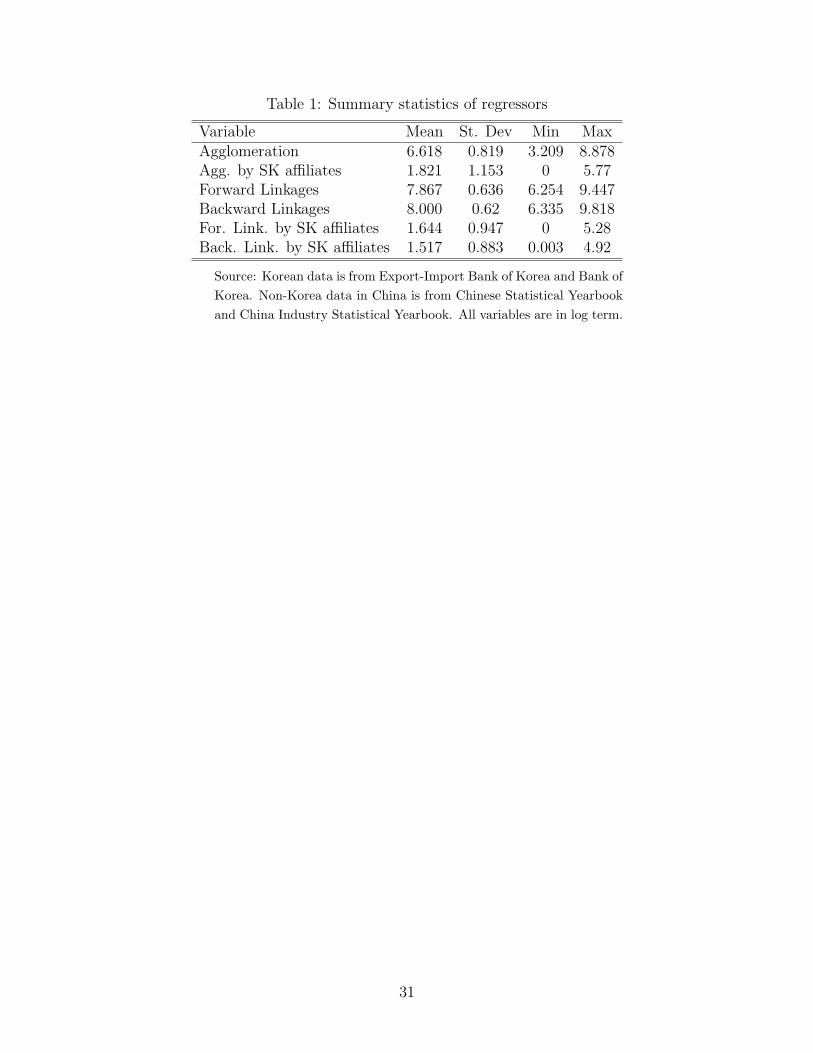
Table 1: Summary statistics of regressors
Variable Mean St. Dev Min MaxAgglomeration 6.618 0.819 3.209 8.878Agg. by SK affiliates 1.821 1.153 0 5.77Forward Linkages 7.867 0.636 6.254 9.447Backward Linkages 8.000 0.62 6.335 9.818For. Link. by SK affiliates 1.644 0.947 0 5.28Back. Link. by SK affiliates 1.517 0.883 0.003 4.92
Source: Korean data is from Export-Import Bank of Korea and Bank ofKorea. Non-Korea data in China is from Chinese Statistical Yearbookand China Industry Statistical Yearbook. All variables are in log term.
31
Tab
le2:
Est
imat
ion
afte
r19
99
(1)
(2)
(3)
(4)
(5)
(6)
Agg
rega
tion
Non
-Chaeb
ol
Agg
lom
erat
ion
1.06
10.
712
0.46
0.53
0.44
50.
486
[0.0
70]*
**[0
.073
]***
[0.1
72]*
**[0
.167
]***
[0.1
77]*
*[0
.183
]***
Agg
.by
SKaffi
liate
s0.
766
0.34
80.
315
0.57
10.
345
[0.0
49]*
**[0
.087
]***
[0.0
86]*
**[0
.147
]***
[0.0
91]*
**Fo
rwar
dLin
kage
s0.
162
0.21
40.
283
0.12
1[0
.366
][0
.362
][0
.305
][0
.383
]B
ackw
ard
Lin
kage
s0.
066
-0.2
61-0
.271
0.05
[0.4
24]
[0.3
91]
[0.3
54]
[0.4
43]
For.
Lin
k.by
SKaffi
liate
s0.
469
0.56
30.
501
0.49
2[0
.140
]***
[0.1
35]*
**[0
.243
]**
[0.1
45]*
**B
ack.
Lin
k.by
SKaffi
liate
s0.
542
0.55
0.20
60.
506
[0.1
34]*
**[0
.130
]***
[0.2
44]
[0.1
39]*
**M
arke
tPot
enti
al3.
491
[3.7
38]
Hig
hSc
hool
Gra
duat
es0.
099
[0.6
10]
Wag
era
te6.
946
[1.2
40]*
**E
cono
mic
Zon
es1.
649
[0.6
38]*
**
Pro
vinc
edu
mm
yno
nono
yes
nono
Pro
vinc
e&
Yea
rdu
mm
yye
sye
sye
sno
yes
yes
No.
ofch
oice
s25
2525
2525
25N
o.of
inve
stor
s42
6442
6442
6442
6442
6440
28P
seud
o-R
20.
370.
380.
380.
370.
370.
39Log
-lik
elih
ood
-868
6.2
-856
1.67
-854
3.01
-865
1.49
-859
9.23
-796
4.03
Sour
ce:
Kor
ean
data
isfr
omE
xpor
t-Im
port
Ban
kof
Kor
eaan
dB
ank
ofK
orea
.N
on-K
orea
nda
tais
from
Chi
nese
Stat
isti
calY
earb
ook
and
Chi
naIn
dust
rySt
atis
tica
lY
earb
ook.
Dis
tanc
eis
from
Yah
oo.c
om.
All
vari
able
sex
cept
for
dum
mie
sar
ein
log
term
.St
anda
rder
ror
isin
pare
nthe
ses.
*si
gnifi
cant
at10
%,**
sign
ifica
ntat
5%,**
*si
gnifi
cant
at1%
.
32

Tab
le3:
Est
imat
ion
afte
r19
92
(7)
(8)
(9)
(10)
(11)
(12)
Agg
rega
tion
Non
-Chaeb
ol
Agg
lom
erat
ion
0.87
90.
655
0.48
10.
219
0.44
0.58
7[0
.097
]***
[0.0
97]*
**[0
.160
]***
[0.1
32]*
[0.1
60]*
**[0
.172
]***
Agg
.*D
(yea
r>=
1998
)0.
180.
066
0.04
60.
405
0.09
10.
017
[0.1
19]
[0.1
19]
[0.1
19]
[0.0
85]*
**[0
.118
][0
.128
]A
gg.
bySK
affilia
tes
0.74
30.
418
0.50
70.
458
0.40
3[0
.038
]***
[0.0
67]*
**[0
.064
]***
[0.1
06]*
**[0
.070
]***
Forw
ard
Lin
kage
s0.
101
0.05
0.08
5-0
.162
[0.3
04]
[0.2
97]
[0.2
64]
[0.3
22]
Bac
kwar
dLin
kage
s0.
082
0.30
5-0
.011
0.25
8[0
.353
][0
.269
][0
.293
][0
.373
]Fo
r.Lin
k.by
SKaffi
liate
s0.
338
0.20
50.
326
0.35
7[0
.105
]***
[0.0
97]*
*[0
.178
]*[0
.111
]***
Bac
k.Lin
k.by
SKaffi
liate
s0.
457
0.3
0.31
60.
447
[0.1
01]*
**[0
.093
]***
[0.1
89]*
[0.1
06]*
**M
arke
tPot
enti
al1.
247
[0.6
26]*
*H
igh
Scho
olG
radu
ates
-0.1
05[0
.226
]W
age
rate
0.07
4[0
.330
]E
cono
mic
Zon
es0.
395
[0.1
48]*
**
Pro
vinc
edu
mm
yno
nono
yes
nono
Pro
vinc
e&
Yea
rdu
mm
yye
sye
sye
sno
yes
yes
No.
ofch
oice
s25
2525
2525
25N
o.of
inve
stor
s68
6368
6368
6368
6368
6363
07P
seud
o-R
20.
350.
360.
360.
350.
360.
37Log
-lik
elih
ood
-142
60.2
-140
61.8
6-1
4042
.03
-143
19.2
7-1
4145
.29
-127
15.1
1
Sour
ce:
Kor
ean
data
isfr
omE
xpor
t-Im
port
Ban
kof
Kor
eaan
dB
ank
ofK
orea
.N
on-K
orea
nda
tais
from
Chi
nese
Stat
isti
calY
earb
ook
and
Chi
naIn
dust
rySt
atis
tica
lY
earb
ook.
Dis
tanc
eis
from
Yah
oo.c
om.
All
vari
able
sex
cept
for
dum
mie
sar
ein
log
term
.St
anda
rder
ror
isin
pare
nthe
ses.
*si
gnifi
cant
at10
%,**
sign
ifica
ntat
5%,**
*si
gnifi
cant
at1%
.
33
Tab
le4:
Rob
ust
nes
s
1999
-200
419
92-2
004
(4)
(13)
(14)
(15)
(10)
(16)
(17)
(18)
Exc
ludi
ngSh
ando
ngN
orth
east
Mun
icip
alit
ies
Shan
dong
Nor
thea
stM
unic
ipal
itie
s
Agg
lom
erat
ion
0.53
0.57
50.
758
0.44
30.
219
0.26
60.
331
0.27
6[0
.167
]***
[0.1
98]*
**[0
.188
]***
[0.1
99]*
*[0
.132
]*[0
.152
]*[0
.165
]**
[0.1
53]*
Agg
.by
SKaffi
liate
s0.
315
0.40
40.
272
0.24
90.
507
0.49
40.
506
0.49
9[0
.086
]***
[0.1
05]*
**[0
.100
]***
[0.0
97]*
*[0
.064
]***
[0.0
79]*
**[0
.076
]***
[0.0
72]*
**Fo
rwar
dLin
kage
s0.
214
0.1
0.19
40.
312
0.05
0.20
40.
177
-0.0
22[0
.362
][0
.452
][0
.392
][0
.432
][0
.297
][0
.369
][0
.343
][0
.349
]B
ackw
ard
Lin
kage
s-0
.261
-0.1
27-0
.643
-0.2
460.
305
0.11
8-0
.522
0.52
[0.3
91]
[0.4
58]
[0.4
20]
[0.4
68]
[0.2
69]
[0.3
20]
[0.3
38]
[0.3
17]
For.
Lin
k.by
SKaffi
liate
s0.
563
0.38
20.
623
0.71
70.
205
0.19
70.
318
0.21
6[0
.135
]***
[0.1
63]*
*[0
.155
]***
[0.1
58]*
**[0
.097
]**
[0.1
19]*
[0.1
17]*
**[0
.110
]*B
ack.
Lin
k.by
SKaffi
liate
s0.
550.
636
0.41
30.
457
0.3
0.33
30.
113
0.28
9[0
.130
]***
[0.1
68]*
**[0
.155
]***
[0.1
46]*
**[0
.093
]***
[0.1
18]*
**[0
.114
][0
.103
]***
Pro
vinc
edu
mm
yye
sye
sye
sye
sye
sye
sye
sye
sN
o.of
choi
ces
2524
2222
2524
2222
No.
ofin
vest
ors
4264
2571
3583
3464
6863
4400
5312
5570
Pse
udo-
R2
0.37
0.28
0.43
0.45
0.35
0.28
0.42
0.43
Sour
ce:
Kor
ean
data
isfr
omE
xpor
t-Im
port
Ban
kof
Kor
eaan
dB
ank
ofK
orea
.N
on-K
orea
nda
tais
from
Chi
nese
Stat
isti
calY
earb
ook
and
Chi
naIn
dust
rySt
atis
tica
lY
earb
ook.
Dis
tanc
eis
from
Yah
oo.c
om.
All
vari
able
sex
cept
for
dum
mie
sar
ein
log
term
.St
anda
rder
ror
isin
pare
nthe
ses.
All
spec
ifica
tion
sin
clud
em
arke
tpo
tent
ial,
wag
era
te,th
era
tio
ofhi
ghsc
hool
grad
uate
s,an
dth
enu
mbe
rof
econ
omic
szo
nes.
*si
gnifi
cant
at10
%,**
sign
ifica
ntat
5%,**
*si
gnifi
cant
at1%
.
34