afm investigations of cellular response to environmental ...peter/theses/suarez.pdf · 2.2 afm...
TRANSCRIPT
1
AFM investigations of cellular response to
environmental and local chemo-mechanical
stimulus.
By
Fernando Suárez Sánchez
Centre for the Physics of Materials
Department of Physics
McGill University, Montréal
June, 2011.
A thesis submitted to McGill University in partial fulfillment of
the requirements for the degree of Doctor of Philosophy
© Fernando Suarez Sanchez, 2011

2
A
Abstract
Several cell types are found in organisms. Each type displays specific
characteristics such as morphology, proliferation rate, genetic expression,
mechanical properties, etc. Many investigations have been performed to study
the effect of chemical cues on these cell properties. This is in contrast to the
present work, which investigates the effect of mechanical properties of the global
or local surroundings. Here, we have studied the effect of the matrix stiffness on
the mechanical properties of airway smooth muscle cells using Atomic Force
Microscopy (AFM). Our results show that the elastic modulus (G‟) of these cells
increases to 820 ± 360 Pa when cultured on stiff gels when compared to the
elastic modulus of 340 ± 160 Pa for cells cultured on soft polyacrylamide gels.
We notice no significant difference in elastic modulus for cells plated on a glass
substrate when compared to the stiffer gels. There is no evident effect of
substrate stiffness on the loss modulus. The variability of the measured elastic
modulus is attributed to cellular variability. This variability is smaller for cells
cultured on the soft gel. When the cell cultures were labeled with Red-phalloidin,
we observed an increase in the organization of the actin fibers at the cell cortex
for stiffer substrates. We thus hypothesize that the increase in cellular stiffness is
the consequence of the actin organization beneath the cell membrane.
Proliferation rate was significantly diminished when the cells were cultured
on the softer polyacrylamide gels. Matrix stiffness also had an effect on genetic
expression as demonstrated by gene arrays. We observed a significant
difference of genetic expression when cells were cultured on a glass substrate.
All these results indicate that smooth muscle cells respond structurally and
genetrically to the mechanical properties of the environment.
Neurons are mechanically much more fragile and responsive than smooth
muscle cells. We locally changed the mechano-chemical environment of axons
and observed that this was sufficient to induce major structural changes such as
synapse formation and even the extraction of proteins containing membrane
strings. We developed a new approach to induce and study the creation of
presynaptic site formation in axons through a combination of local modification to

B
the mechano-chemical environment using a combination of AFM and
fluorescence microscopy. First, we use a poly-D-lysine coated bead attached to
an AFM tip to induce a synapse. We used transfection techniques and
fluorescence microscopy to study the recruitment of two synaptic proteins,
bassoon and synaptophysin, and measure their absolute arrival times to the
presynaptic site. We find that bassoon arrives after 23 ± 10 minutes and that
synaptophysin arrives after 43 ± 9 minutes. Finally, we observed the formation of
long (several 10s of μm) membrane strings as the AFM tip was withdrawn from
the axon. These membrane strings seemed functionally intact. It is conceivable
that these strings might be a mechanism by which new neurites and branch
points along existing neurites can be generated in situ.
C
Résumé
Plusieurs types de cellules se retrouvent dans les organismes. Chaque
type présente des caractéristiques spécifiques telles que la morphologie, le taux
de prolifération, l‟expression génétique, les propriétés mécaniques, etc. De
nombreuses enquêtes ont été réalisées afin d‟étudier l‟effet des signaux
chimiques dans la cellule. Ceci contraste avec les travaux actuels qui étudie
l‟effet des propriétés mécaniques sur l‟environnement global et local. Ici, nous
avons étudié l‟influence de la rigidité du substrat sur les propriétés mécaniques
et l‟expression génétique des cellules musculaires lisses des voies aériennes.
Nos résultats démontrent que le module d‟élasticité (G‟) des cellules augmente à
820 ± 360 Pa lorsqu‟elles sont cultivées sur les gels rigides par rapport à 340 ±
160 Pa aux cellules cultivées sur les gels polyacrylamides doux. Nous n‟avons
pas remarqué de différence significative dans le module d‟élasticité pour les
cellules étalées sur un substrat de verre en comparaison aux gels rigides. L‟effet
de rigidité sur le module de perte n‟est donc pas observé. La variabilité du
module d‟élasticité mesuré est attribuée à la variabilité cellulaire. Cette variabilité
cellulaire est moins effective pour les cellules cultivées sur les gels doux.
Lorsque les cultures de cellules ont été marquées avec Red-phalloïdine, nous
observons une augmentation dans l‟organisation des fibres d‟actine au niveau du
cortex cellulaire. Ainsi, nous émettons l‟hypothèse que l‟augmentation de la
rigidité cellulaire est une conséquence de l‟organisation d‟actine sous la
membrane cellulaire.
Le taux de prolifération a significativement diminué lorsque les cellules ont
été cultivées dans les gels de polyacrylamide plus doux. La rigidité du substrat a
également une influence sur l‟expression génétique comme démontrée dans les
réseaux de gènes. D‟un autre côté, une variation significative sur l‟expression
génétique a été observée dans les cellules cultivées sur du verre. Tous ces
résultats suggèrent que les cellules musculaires lisses répondent aux propriétés
fournis par l‟environment.
Les neurones sont mécaniquement beaucoup plus fragiles et sensibles
que les cellules musculaires lisses. Nous avons localement changé l‟environment
D
mécanochimique des axones et avons observé que cela suffisait pour induire
des changements structurels significatifs tels que la formation des synapses et
même l‟extraction de protéines contenant des chaînes membranaires. Nous
avons développé une nouvelle approche pour inciter et étudier la formation des
sites présynaptiques dans les axones par une combinaison de modifications
locales de l‟environnement mécano-chimique en utilisant une combinaison de
l'AFM et de la microscopie à fluorescence. Tout d‟abord, nous utilisons une bille
enrobée de poly-D-lysine pour attacher sur une pointe d‟AFM dans le but
d‟induire une synapse. Nous avons utilisé des techniques de transfection et la
microscopie à fluorescence pour étudier le recrutement de deux protéines
synaptiques, basson et synaptophysine, et de mesurer leur temps
d'arrivée absolue aux sites présynaptiques. Nous constatons que le
basson arrive après 23 ± 10 minutes et que la synaptophysine arrive après 43
± 9 minutes. Finalement, nous avons observé la formation de longues chaînes
membranaires contenant des protéines de l‟ordre de 10µm quand la pointe
d‟AFM a été retirée de l‟axone. Ces chaînes membranaires semblent être
fonctionnellement intactes. Il est concevable que ces chaînes pourraient être un
mécanisme rénovateur par lequel les nouvelles neurites et les nouveaux points
de branchement au long des neurites existants peuvent être générés in situ.
.

E
Acknowledgments
I want to thanks the institutions and people that make possible the
development of the present study. First, I thank the the Natural Science and
Engineering Research Council of Canada and the Canadian Institute for Health
Research and the Consejo Nacional de Ciencia y Tecnologia for their financial
assistance, both through scholarship awards and the research funding provided.
I am deeply grateful to my supervisor, Dr. Peter Grütter, who has been
very supportive through the development of this study. His insight and advices
have contributed importantly to improve my research skills.
I thank Dr. Barbara Tolloczko and Dr. James Martin. Both have helped me
to increase my biological knowledge and have guided me through many of the
the biological methods employed in this thesis.
Dr. David Colman has been a supportive figure in the neuro-physics study
described in this thesis. He facilitated the access to neuronal cultures by
providing us access to the installations in his laboratory.
My colleges Peter Thostrup and Jeff LeDue at the physics department,
Paul Andre, Taisuke Jo and technician Jamilah Saeed at the Meakins-Christie
Laboratories as well as Anna Lisa Lucido at the Montreal Neurological Institute
deserve my appreciation and credit. Talks with them were very helpful to
organize the ideas and discuss the results.
Especial thanks to Helene Bourque at the physics department for her
friendship and encourage during the first days of my time Canada. She taught
me much of the AFM methodologies employed in this thesis.
I thank my lab-mates for their partnership and to all my friends that helped
me in different manners and circumstances.
I want to thank my parents for their love and support during all this years
and thanks to Lizbel, who has been supportive and has been with me since the
first days of my doctoral studies.

F
Table of Content
Abstract A
Résumé C
Acknowledgments E
Table of Contents F
Statement of Originality K
1 Introduction 1
1.1 Why study mechanics in biological systems? 7
1.2 Synaptic formation in Neurons. 9
2 Material and Methods (Atomic Force
Microscope) 11
2.1 AFM and inverted optical microscope setup 11
2.2 AFM basics and optimization 12
2.3 Operation modes 18
2.3.1 Contact mode 18
2.3.2 Tapping mode 21
2.3.3 Metrology and time resolution in contact and dynamic modes 23
2.4 The force sensor 24
2.4.1 Spring constant 24
2.4.2 Attachment of polystyrene beads to cantilever tips 26
2.5 Force spectroscopy 28
2.5.1 Force Volume Imaging 31
2.5.2 Hertz model 34
G
2.5.3 Indentation Modulation 40
3 Cellular mechanics 49
3.1 Methods to measure mechanical properties of cells 53
3.2 Mechanical properties of cells 55
4 Material and Methods (Airway Smooth
Muscle Cells) 58
4.1 Experimental Setup (Temperature and pH control). 58
4.2 Cell isolation and cultures for the AFM experiments. 60
4.3 Cell localization and methodology to identify the area to indent. 61
4.4 Polyacrylamide gel preparation. 62
4.5 Gel functionalization. 63
4.6 Gel characterization. 64
4.7 Proliferation assay. 65
4.8 RNA extraction protocol. 67
4.9 Immunofluorescence. 68
4.10 Analysis of the data 68
5 Application of force spectroscopy to
Airway Smooth Muscle Cells (Results) 70
5.1 Gel functionalization and its mechanical properties 70
5.2 Sources of uncertainty and applicability of the Hertz model to
determine the Young’s modulus of substrates. 75
5.3 Cell morphology on gels and actin network. 77
H
5.4 Dependence of the elastic properties of ASMC on the substrate
stiffness. 82
5.5 Cell Proliferation. 90
5.6 Genetic expression. 91
5.7 Summary, Conclusions and Discussion 94
5.7.1 Mechanical properties of the polyacrylamide gel and fibronectin
functionalization. 94
5.7.2 The use of the AFM to investigate the mechanics of the cells. 97
5.7.3 Correlation between the substrate stiffness, the viscoelasticity of
ASMC and the actin content. 99
5.7.4 Cell proliferation rate and genetic expression is influenced by the
substrate stiffness. 104
5.7.5 Outlook 107
6 Protein recruitment at presynaptic sites 109
7 Material and methods (Neurons) 113
7.1 Primary Cultures of Rat Hippocampal Neurons 113
7.2 Time-lapse Protein Recruitment and Adhesion Experiments 113
7.3 Image analysis and vesicle speed calculation 114
8 Applications of the AFM to the study of
presynaptic formation (Results) 115
8.1 Procedure for successful axon/bead contacts 115
8.2 Synaptic constituents are transported in vesicles 116
8.3 Bassoon is recruited before synaptophysin 118

I
8.4 Adhesion occurs before protein recruitment 119
8.5 Membrane-bound strings can be pulled out of an axon 119
8.6 Properties of axon strings 121
8.7 Discussion 122
8.8 Conclusion 124
9 General Conclusion 126
10 Appendix 1 129
11 Appendix 2 143
12 Bibliography 146

J
K
Statement of Originality
The author claims the following aspects of this thesis as original
contributions to the field of biophysics.
1. Cellular response to matrix stiffness study.
• The first study where the viscoelastic properties of airway smooth muscle
cells cultured on different matrix stiffnesses were measured.
• The study sheds light on the influence of the substrate mechanics in the
proliferative and genetic expression of airway smooth muscle cells.
• Description of a methodology to determine the the Hertzian best fit on
force distance curves adquired with the AFM
• The first study where the mechanical properties, the proliferation,
morphology and the genetic expression of ASMC are determined as a function of
the matrix stiffness.
2. Time-lapse presynaptic formation study.
• The first study where the formation of presynaptic buttons is induced in a
controlled fashion. The process is initiated by the contact of a poly-lysin coated
bead and the axon membrane.
• The formation of long strings (potentially functional neurites) was formed
after bead pulling. Movement of vesicles in the strings was observed.
• Determination of the presence of important structural molecules for
protein and vesicle transport (tubulin) as well as actin in the strings.
Synaptophysin and bassoon proteins normally found moving along the axon
shaft or stationed on the presynaptic sites were also observed.
Essential procedures in this thesis not performed by the author are the
following.

L
• Gene arrays were performed by Genome Quebec Innovation Center,
McGill University with total RNA provided by our laboratory.
• Neuron culture preparation. Procedure explained in brief in material and
methods. Prepared by Dr. Peter Thostrup, Physics department, McGill University.
1
1 Introduction
In his book “Imagined Worlds” Freeman Dayson, a notable US theoretical
physicist and mathematician wrote:
“The effect of concept-driven revolution is to explain old things in new
ways. The effect of tool-driven revolution is to discover new things that have yet
to be explained.”
Freeman Dyson, Imagined Worlds
This is to say that the use of tools, especially when new ones are used in
science, have the potential to generate numerous new findings that can lead to a
search of its basics principles, understanding of previous unsolved questions or
originate new ones that have to be explored.
In this logic, the aim of the use of the Atomic Force Microscope (AFM) tool
in this thesis is to explore two biological questions and make new discoveries
that then stimulate a more systematic examination in more detail by biologists.
This will lead to a deeper understanding of cell behavior. Here, we are motivated
in how mechanical cues affect cell response and properties. We will explore the
effect of the global substrate stiffness on cell mechanical properties. We will also
use a local mechano-chemical cue to investigate the formation of synapses in
neurites. We will demonstrate that this technique can be used to understand the
dynamics of proteins known to be involved in the formation of synapses. In
particular, we determined the arrival time of two different proteins to the AFM
induced newly formed presynaptic sites.
However, before going deeper in the uses of the AFM in biology, it is
worth to give some examples of its use to explore questions in physics and the
type of information that can be obtained. Above all, after its introduction by Binnig
et al., (1986), the AFM was first employed by physicists. For instance, the AFM
has been used to detect atomic interactions, something that requires very
sensitive techniques due to the small forces involved. To achieve that, two
approaches that have been used include the utilization of a cantilever oscillating
at its resonance frequency above the sample while keeping track of small shifts
2
in the resonance frequency. Any change in the resonance frequency is
associated to the interactions that occur between the cantilever tip and the
closest atom on the sample. In the other case, atomic force spectroscopy at low
temperature was exploited (Lantz et al., 2001) for a similar purpose. In this case,
the AFM was used to detect and directly measure the formation of a chemical
bond. A silicon tip was approached to a silicon (111) 7×7 surface and quantitative
and atomic-scale information about the interaction forces was acquired by the
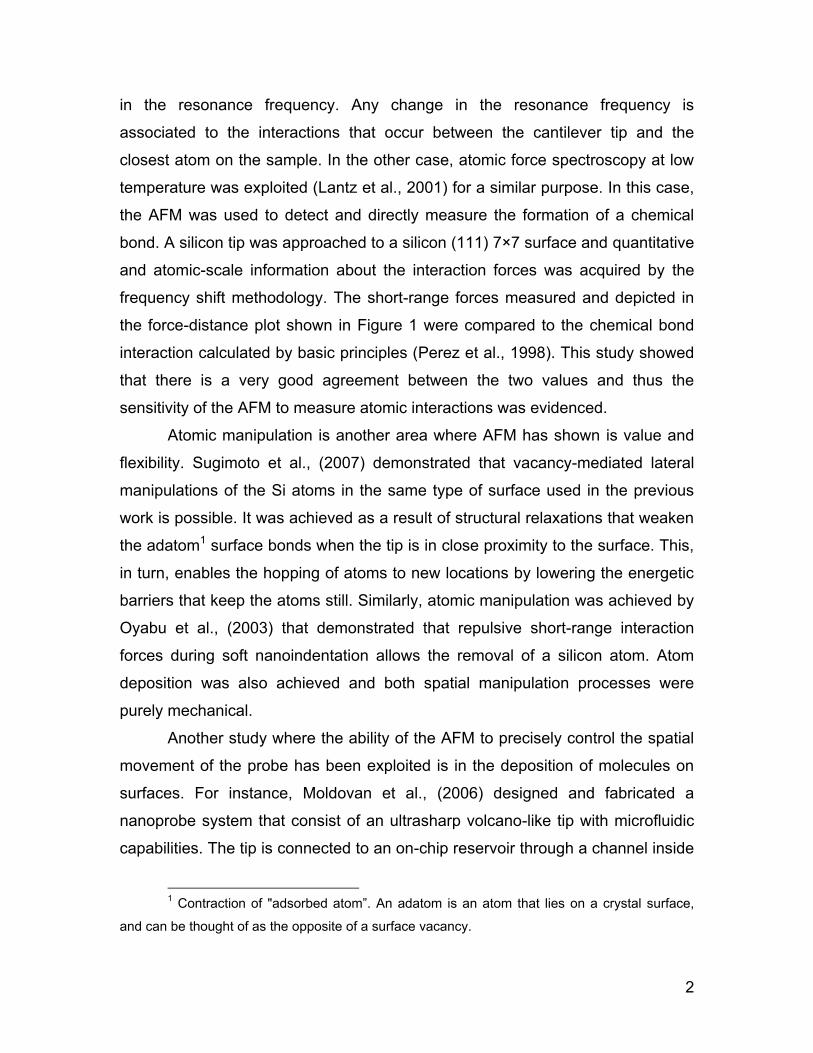
frequency shift methodology. The short-range forces measured and depicted in
the force-distance plot shown in Figure 1 were compared to the chemical bond
interaction calculated by basic principles (Perez et al., 1998). This study showed
that there is a very good agreement between the two values and thus the
sensitivity of the AFM to measure atomic interactions was evidenced.
Atomic manipulation is another area where AFM has shown is value and
flexibility. Sugimoto et al., (2007) demonstrated that vacancy-mediated lateral
manipulations of the Si atoms in the same type of surface used in the previous
work is possible. It was achieved as a result of structural relaxations that weaken
the adatom1 surface bonds when the tip is in close proximity to the surface. This,
in turn, enables the hopping of atoms to new locations by lowering the energetic
barriers that keep the atoms still. Similarly, atomic manipulation was achieved by
Oyabu et al., (2003) that demonstrated that repulsive short-range interaction
forces during soft nanoindentation allows the removal of a silicon atom. Atom
deposition was also achieved and both spatial manipulation processes were
purely mechanical.
Another study where the ability of the AFM to precisely control the spatial
movement of the probe has been exploited is in the deposition of molecules on
surfaces. For instance, Moldovan et al., (2006) designed and fabricated a
nanoprobe system that consist of an ultrasharp volcano-like tip with microfluidic
capabilities. The tip is connected to an on-chip reservoir through a channel inside
1 Contraction of "adsorbed atom”. An adatom is an atom that lies on a crystal surface,
and can be thought of as the opposite of a surface vacancy.
3
the cantilever. This system is an upgrade of the dip-pen nanolithography where
the “ink” is only deposited on the surface of the cantilever tip (Piner et al., 1999)
and used for writing. The potential uses of the volcano-like tip system in biology
include localized drug delivery at specific sites of the cells or close to membrane
receptors and biofluid sampling applications. This potentially allows the detection
of cells that are different of the rest by sampling the secreted molecules for
individual cells at specific locations.
Figure 1: Force-distance curve above the Si surface and a fit to the data using a
sphere-plane model for the Van der Waals interaction force (upper left image). Total force
(red line) and short-range force (yellow line) determined above an atom (lower left image,
Lantz et al., 2001) In the inset, a comparison between the measured short range force and
the calculated bonding interaction by first-principles is shown. Calculated diffusion barriers
for adatoms on a lattice when the tip is at different height above the surface (upper right
image). Topographic images from a series of vacancy-mediated manipulations mediated by
the AFM tip (lower right images, Sugimoto et al., 2007)
4
Combination of AFM with volcano-like tips and fluorescence microscopy
could be very valuable. Detection of spatial distribution of single molecules can
be performed with fluorescence imaging (Eckel et al., 2006). Force spectroscopy
by atomic force microscopy allows addressing, manipulation and quantitative
probing of the nanomechanical properties of individual macromolecules thus
allow the investigation of optical and mechanical properties at the single
molecule level. In Eckel et al., (2006) study, they report the distance-controlled
quenching of semiconductor quantum dot clusters with an AFM tip.
In biology, the AFM as been used more often in recent years. A traditional
applications is the collection of topographic data to reveal cellular structures.
Prior to the AFM introduction, such information was to the best scarce or difficult
to obtain. However, nowadays, contact and dynamic modes have been employed
with success. It is evidenced by AFM images of cells (Le Grimellec et al., 1998,
Espenel et al., 2008) but also other biological molecules such as RNA and DNA
(Hamon et al., 2007), DNA-protein complexes (Muller et al., 1997; Kopp-
Marsaudon et al., 2000), sole proteins (Möller et al., 1999; San Paulo and
García, 2000), polymers (Reiter et al., 2000) are other biological structures. Tip
radius is still a limiting factor to obtain good lateral resolution (Sun et al., 2002;
Kienberger et al., 2004).
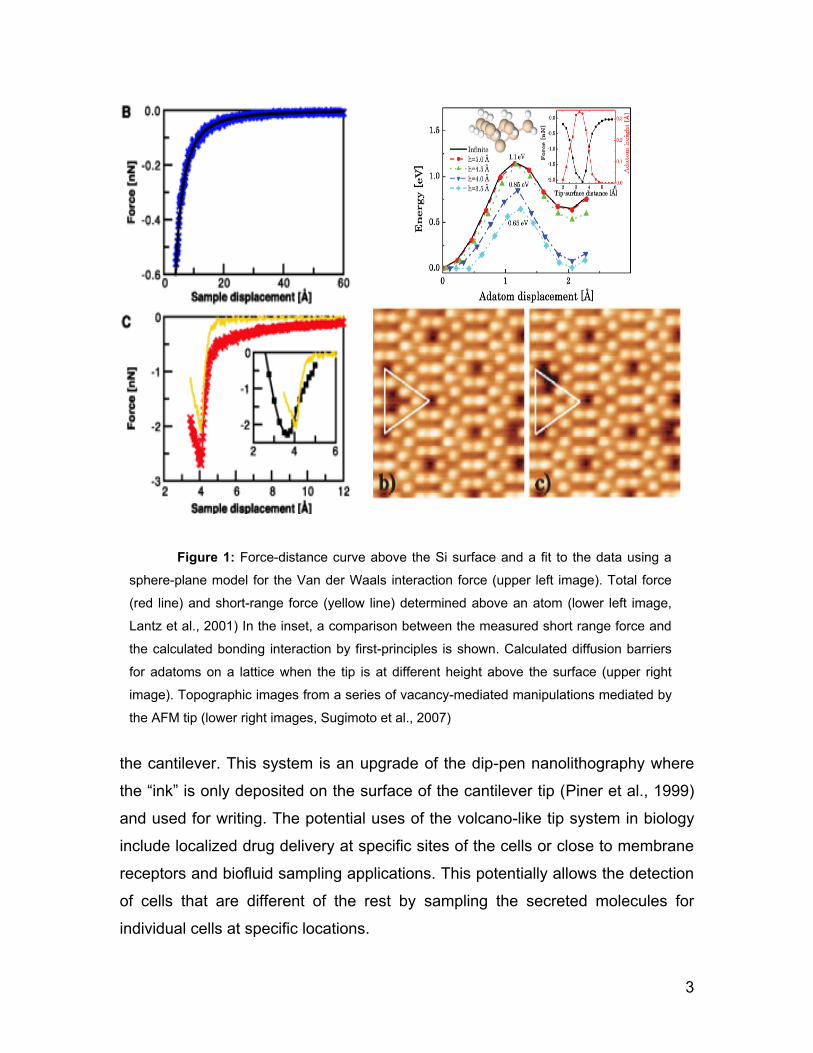
Conformational changes in the DNA-protein complexes are central for
many cellular processes and high resolution visualization of such interactions
might provide some clues about their biology (see Figure 2). The association of
proteins to the cytoskeleton has been explored by Afrin and Ikai, (2006) by force
spectroscopy where differences in the force-distances profiles got after pulling
proteins were used to determine whether or not they were connected to the
cytoskeleton.
Recent investigations (Lopez M., personal communication) have used the
AFM as a tool to study Ca2+ signalization cascades that are triggered by
mechanical stimulus in osteoblasts. In those studies, the cantilever tip is
positioned on a defined region on a cell and after the mechanical stimulus was
5
delivered, the force needed to trigger the signalization as well as the extent and
propagation of the stimulus to nearby cells were measured.
Force spectroscopy has been used to study the intermolecular interactions
of proteins as well. Here, a layer of the protein of interest is deposited on a solid
surface and a linker is used to connect the tip to the protein. Pulling results in the
break of intermolecular interactions and a portrait of the unfolding event is visible
at the force-distance curves as successive peaks in the retraction curve (see
Figure 2; Meadows et al., 2003).
The mechanical response of endothelial cells to a shear flow was
investigated by AFM by Sato et al., 2000. In this study, the cells were exposed
for several hours to a shear flow at the end of which the AFM was used to asses
changes in cell rigidity. Large Young‟s modulus was found at the upstream side
of the cells after 6 h exposure although this stiffness polarity was not permanent
and disappeared after long exposure times. Changes in stiffness during the cell
cycle have been found with marked but transient decrease in stiffness in the
mitotic spindle region during anaphase. (Dvorak and Nagao, 1998).
Figure 2: AFM topographic image of DNA on mica (left image, Hamon et
al., 2007). Force plot obtained when extending single molecules of fibronectin
away from a mica surface in water (right image). The successive picks in the
retraction curve evidence unfolding events. Meadows et al., 2003.
6
Measurements of the stiffness of cells in response to contractile agonist
were published by our lab (Smith et al., 2005). In those experiments, it was
shown that inhibition of myosin with 1-(5-iodonaphthalene-1-sulfonyl)-1H-
hexahydro-1,4-diazepine hydrochloride (ML-7) as well as treatment of cell
cultures with cytochalasin-D (which induces actin depolymerization) cause a
decrease in cell stiffness. A major contribution of this study is the evidence that
presented implicating cortical actin polymerization as the dominant mechanism
actuating the stiffening response of smooth muscle cells.
In sections 5.1 and 5.4, we exploit the ability of the AFM to measure
mechanical properties and we combine this capacity with other well established
biological techniques to generate data that put together can provide a more
comprehensive idea of the processes that the cells undergo when cultured on
non-rigid substrates. In this thesis, the mechanical properties of the cells are
determined and correlated with other cellular characteristics such as substrate
mechanics, actin fibers, cell proliferation rate, and genetic expression.
It was mentioned at the beginning of the introduction that AFM was used
to manipulate atoms on a Si surface (Sugimoto et al., 2007). This AFM
manipulation capability has been exploited in biology as well. For example, Han
et al., (2005) developed an AFM based methodology for gene or molecule
transfer. A nanoneedle covered with the molecule of interest was attached to the
AFM cantilever and inserted into the cell body. Some of the material was
transferred to the cell cytoplasm. Similar experiments have demonstrated that it
is possible to manipulate needles and insert them in the cell body to extract
mRNA from the cell (Kim et al., 2008). In these experiments, the needle with the
mRNA attached was used later to do Polymerase Chain Reaction (PCR) and
determine the gene expression on individual cells. This demonstrates that
combination of AFM and other established biological techniques can produce
valuable information. Other studies led by Afrin et al., 2009, used a beaded
cantilever coated with phospholipase A (this enzyme hydrolyzes phospholipids
on the cell membrane into fatty acids and other lipophilic substances) to produce
holes at specific locations in the membrane and study the viability of such cells.
7
Transfer of DNA through the holes was achieved as well and the success
evaluated by observing fluorescence. Manipulation of proteins in the membrane
as also been achieved with the AFM (Afrin et al., 2003). On these studies, it was
possible to bind surface proteins and even pull them from their initial
transmembranal location.
From the atomic to nanometric and micrometric levels, the AFM has
demonstrated to be a valuable tool to manipulate objects in both physics and
biology. Its unique capability to allow the manipulation of mechano-chemical cues
in space with nm precision and in time with ms resolution was utilized in this
thesis. Here, the AFM probe was used to explore its usefulness to investigate the
presynaptic formation and in particular the recruitment times of presynaptic
proteins (refer to section 8). It was done by controlled manipulating in space and
time a polystyrene bead attached to the AFM tip contacting a neuronal cell
1.1 Why study mechanics in biological systems?
Traditionally, cells cultured in plastic or glass Petri dishes have been
widely used in biological studies. There are practical advantages in using this
type of culture; the conditions in which the cells grow can be well controlled (i.e.
temperature and pH), the density of plated cells per unit area can be easily
manipulated, the physical access to the cells in order to challenge them with
drugs is easy and optical observation of the cell cultures facilitated. However,
probably the most important factors that determined this tendency are the
unawareness (until recent years) or shortage of studies that strongly establish
the importance of the elastic properties of the matrix on the cell behavior. The
effect of the substrate stiffness on cell behavior was usually ignored and only
lately efforts are been made to determine the extent of the influence of the
substrate stiffness on cell behavior (Engler et al., 2006a; Saha et al., 2008a;
Discher et al., 2009).
Early studies aimed to investigate cell differentiation have focused on
chemical signals as the main cause of cell differentiation. However, new and
recent studies have shown that chemical cues are not the only cause of
8
differentiation but the structure and mechanical properties of the
microenvironment also influences cell differentiation. Lineage specification, a
determinant process in embryology as well as in adult organisms is in part
modulated by substrate stiffness as shown by Engler et al., (2006a); Saha et al.,
(2008a); Discher et al., (2009). In these experiments, naive mesenchymal stem
cells were plated on polyacrylamide matrices and cell differentiation was
evaluated by morphological changes, immunostaining (it uses antibodies to
detect specific proteins in a sample), and western blot (a method to detect
proteins in a sample through electrophoresis and subsequent antibody
detection).
The molecular mechanism involved in the mechanically mediated
regulation is still unknown but new and increasing numbers of investigations are
under way to answer these questions (Paszek et al., 2005; Discher et al., 2009;
Tamara and et al., 2005; Lo et al., 2000; Cheng et al., 2009a). Recently, Cheng
et al., (2009b) have shown that mechanical stress, in addition to molecular cues
(i.e. growth factors) and other environmental cues (Ashkenazi and Dixit, 1998),
suppress proliferation and trigger apoptosis via the mitochondrial pathway. Cell
migration is also influenced by the stiffness of the substrate as Lo et al., (2000);
Cheng et al., (2009a) demonstrated. In these experiments, polyacrylamide
sheets were prepared such that the opposite extremes had different stiffness.
When cells were seeded, those that initially adhered onto the soft region of the
substrate migrated towards the stiffer region. This migration was solely a
response to the substrate stiffness (“durotaxis”).
In response to the matrix stiffness, mesenchymal stem cells plated on soft
matrices (mimicking the mechanical properties of the brain) turned neurogenic,
on stiffer matrices (that mimic muscle) they turned myogenic, and on
comparatively rigid matrices (that mimic collagenous bone) they evolved to an
osteogenic phenotype. Saha et al., (2008a) showed that neural stem cells
differentiate into neurons when the matrix stiffness was in a range between 100-
500 Pa which resembles the stiffness of the brain tissue. Analysis of protein
markers in those cells also showed a peak level of the neuronal marker, β-tubulin
9
III. Harder matrixes (> 500 Pa) promoted glial cultures but when the stiffness of
the matrix was lower than 100 Pa, differentiation was inhibited. This data
demonstrates the strong interconnection between cell differentiation and the
mechanics of the microenvironment in which the cells grow.
1.2 Synaptic formation in Neurons.
In addition to cell mechanics, the AFM was also used to study presynaptic
formation in this thesis by applying localized mechano-chemical cues. Synapse
formation, maturation and functioning is determinant not only in memory and
learning as broadly recognized but it is also important in several other automatic
and unconscious processes that take place in the mammalian organism such as
breathing, heart contraction, muscle movement and homeostasis. Usually,
synapses are formed between an axon and a dendrite (synapsis between axons
and non-neuronal cells occur too) but an important difference in the number of
connections that they can maintain exists. While the axons only form a single
synapse with a dendrite, the dendrites can form several synapses with many
axons.
Synapse formation is a complex process that involves, at the beginning,
the apparently random movement of highly dynamic filopodia. These “fingers”
move constantly searching for locations along the nearby axons to form
synapses. The resultant dendritic spines are more mechanically stable than their
precursors. In fact, spines associated with axons appear stiffer than non-
associated spines (Smith et al., 2007a). Many important issues are not
understood, such as how does this stabilization happen what are the signaling
pathways, what proteins are involved and how fast does it happen?
Although neuroscientist have studied synapses for several years many of
these questions remain or the answer is known to be incomplete. Such a
question is in what order do the different known components of the presynaptic
site arrive? In the second part of this thesis we will develop a new methodology
to answer this question. A good description of the arrival sequence of proteins
10
would provide new clues to understand the signaling cascades and steps that
occur starting from the first contact to the establishment of a mature synapse.
Although there are reports that have quantified the arrival times of
presynaptic proteins (Friedman et al., 2000), the procedure that was followed
relies on the random formation of a synapse between the neurons in the culture
dish. The observation of one of such events can take a considerable amount of
time. Here, we explore a more direct approach in which the formation of a
presynaptic site is induced by the contact between the axon and a poly-D-lysin
coated bead on an AFM tip.
In this proof-of-principle study we limit ourselves to determining the
recruitment times for synaptophysin and piccolo-bassoon proteins. This new and
original approach has the potential to be used to measure recruitment times of
many other protein that are located at the mature presynaptic site.
Fundamentally, the only change that has to be made to the technique is in the
neuronal culture transfection step. A vector carrying the right sequence for the
protein of interest has to be employed. All the other steps remain the same.
,An interesting observation, not persued further in this thesis, is the use of
the AFM to pull threads from the axon shaft. These threads have the potential to
be used to artificially make connections between neurites. If its functionality is
proved, this would become a remarkable way to induce the creation of synapses
at will. Initial examination of the proteins present in the threads suggest that they
contain and transport some of the important and characteristic proteins found in
axons.

11
2 Material and Methods (Atomic Force Microscope)
2.1 AFM and inverted optical microscope setup
An inverted optical microscope (Axiovert S100 TV, Carl Zeiss Canada
Ltd., Toronto, Ontario) was used for optical observation of the samples and
identification of the region of interest (live cells for the purpose of this thesis). The
microscope is equipped with 10X, 40X no-oil objectives as well as 40X, 60X and
100X oil immersion objectives. An short arc mercury lamp (HBO 50 W, Osram,
Munich, Germany) and an argon laser (Model, 35 LAP 431-220, Melles Griot,
Albuquerque, New Mexico) allows the detection of a wide range of fluorescent
proteins and dyes. The argon laser also serves as an illumination source for a
home built Total Internal Reflection Fluorescence (TIRF) (Durisic et al., 2009).
Figure 3: The equipment used in this work consists of an inverted optical
microscope and an AFM mounted on a damping table. A heavy metal stage placed on the
inverted microscope support the heated stage that keeps the cell cultures at 37 C during
the course of the experiments (circular element observed under the AFM head, inset). A
plexiglass box is then positioned above the heater and the AFM head placed into position
(see inset). The space between the box and the cylinder that encloses the piezo tube in
the AFM is sealed with a rubber sheet. The complete setup can keep cultures at a
controlled temperature and gas environment. We inject 5 % CO2 into the plastic box to
keep the pH of the medium at 7.2. Note that water condensation on the piezo has to be
avoided and dried carefully to avoid electrical shorts or shocks.
12
For fluorescence microscopy as well as bright field, a CCD camera (Cascade:1k
camera, Photometrics; Tucson, AZ) is employed to collect images of the samples
(see Figure 3).
The design of the Bioscope permits the acquisition of optical images
simultaneously with AFM images. The position of the optical microscope (below
the sample) allows the access of the AFM to the sample from the upper part. The
AFM used in this thesis is a commercial instrument made by Digital Instruments.
The instrument was equipped with a Nanoscope IIIa control electronics using the
software version 5.12r2 (Veeco Metrology Group, Santa Barbara, CA).
2.2 AFM basics and optimization
The Atomic Force Microscope (AFM) is capable of resolving features of
the order of nm or even smaller sizes, features that no optic technique is able to
resolve due to the diffraction limit constraint (roughly λ/2). From its invention by
Binnig et al., 1986, the AFM has evolved and new modes of operation such as
dynamic mode, frequency shift and force spectroscopy have been developed and
used for different purposes. In general, all these techniques rely on the detection
of the cantilever bending by mean of one of the methods available for that
purpose (interferometry, laser beam deflection, capacitative sensing and in early
designs tunneling microscopy; Rugar et al., 1989).
The AFM employed in this thesis uses the laser beam deflection method
for the cantilever bending detection. In this case, a laser beam is aligned in such
a way that it is reflected off the backside of the cantilever. The beam is reflected
towards a position sensitive photodiode detector, allowing cantilever deflections
of less than a nanometer to be reliably detected. (see Figure 4). However, the
cantilever noise is often more larger than this sensitivity.
In the Bioscope the AFM is positioned on top of the inverted microscope
and the sample lies on a rigid stage. This has the advantage that large, heavy
petri dishes with cell cultures can be imaged both by AFM and optical microscopy
techniques. Note that most commercial as well as home-made AFMs scan the
sample. Imaging of the samples by AFM thus requires the movement of the
13
cantilever in the x-y plane as the sample remains stationary. To achieve this
cantilever movement, the tip is mounted to a piezoelectric tube scanner.
Technically the challenge in implementing this design is to detect the cantilever
deflection as it is scanned in x, y and z relative to the sample without artifacts.
The AFM is a very sensitive device with great potential to study small
scale features (nm or even lower) with low interaction forces (pN). There are a
Piezoelectric
material
Servo, feedback
control
Sample
Laser Photodiode
Differential
amplifier
Error signal
Piezotube
voltage
Set point
-2 0 2 4 6 8 10 12 14-500
-400
-300
-200
-100
0
100
-2 0 2 4 6 8 10 12 14-500
-400
-300
-200
-100
0
100
C1 C2 C3 C4
Pie
zo
movem
ent
time-2 0 2 4 6 8 10 12 14
-500
-400
-300
-200
-100
0
100
-2 0 2 4 6 8 10 12 14-500
-400
-300
-200
-100
0
100
C1 C2 C3 C4
Pie
zo
movem
ent
time
Piezoelectric
material
Servo, feedback
control
Servo, feedback
control
Sample
Laser Photodiode
Differential
amplifier
Error signal
Piezotube
voltage
Set point
-2 0 2 4 6 8 10 12 14-500
-400
-300
-200
-100
0
100
-2 0 2 4 6 8 10 12 14-500
-400
-300
-200
-100
0
100
C1 C2 C3 C4
Pie
zo
movem
ent
time-2 0 2 4 6 8 10 12 14
-500
-400
-300
-200
-100
0
100
-2 0 2 4 6 8 10 12 14-500
-400
-300
-200
-100
0
100
C1 C2 C3 C4
Pie
zo
movem
ent
time
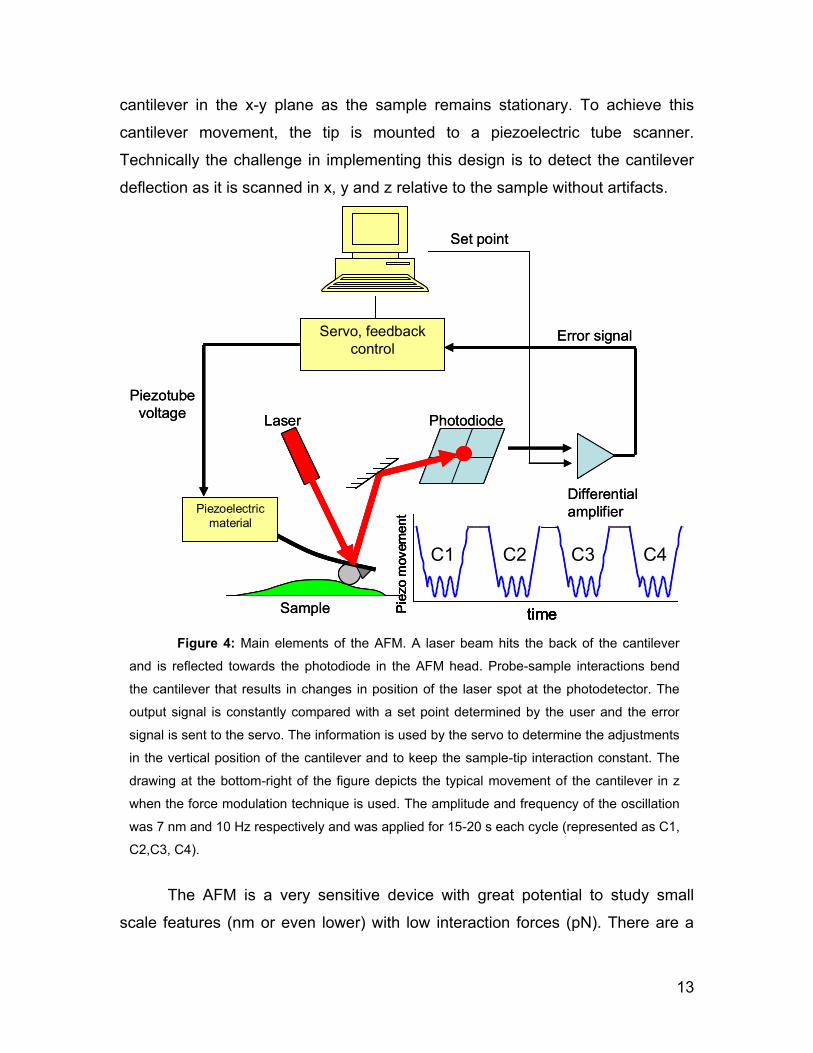
Figure 4: Main elements of the AFM. A laser beam hits the back of the cantilever
and is reflected towards the photodiode in the AFM head. Probe-sample interactions bend
the cantilever that results in changes in position of the laser spot at the photodetector. The
output signal is constantly compared with a set point determined by the user and the error
signal is sent to the servo. The information is used by the servo to determine the adjustments
in the vertical position of the cantilever and to keep the sample-tip interaction constant. The
drawing at the bottom-right of the figure depicts the typical movement of the cantilever in z
when the force modulation technique is used. The amplitude and frequency of the oscillation
was 7 nm and 10 Hz respectively and was applied for 15-20 s each cycle (represented as C1,
C2,C3, C4).
14
number of factors that need to be optimized carefully to achieve optimal imaging
conditions, in particular for biological systems:
1. Optimization of feedback performance and image acquisition time. An
artifact often observed during imaging with the AFM are feedback overshoots
that appear most often in regions with abrupt changes in height, commonly found
in biological systems which tend not to be very flat. Optimization of the feedback
parameters (integral and the proportional gains) significantly reduce the
overshooting although complete elimination is not always possible unless very
low scan rates are employed. However, low scanning rates also can lead to drift
artifacts (this occurs because of piezo creep and/or thermal drift) and a
significant increase in image acquisition time, something that most of the time is
not desirable when dealing with biological material. A good equilibrium between
feedback and scan rate must be found in order to produce the more accurate
images of the scanned samples.
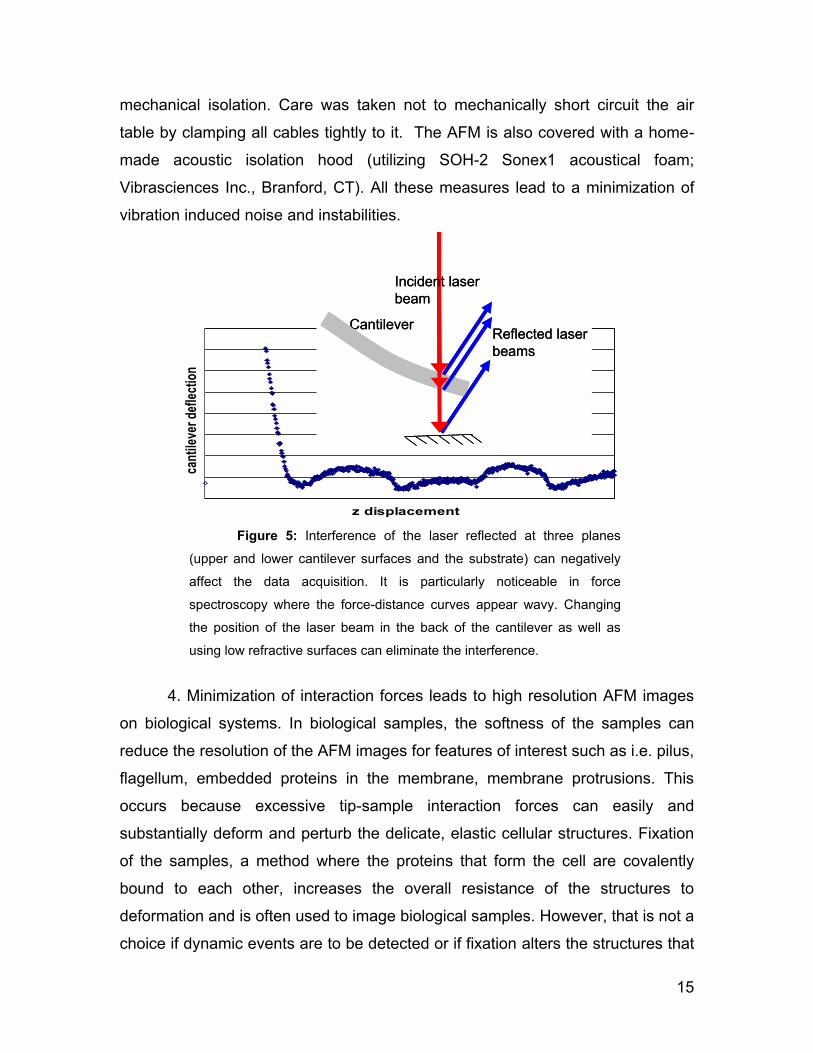
2. Avoidance or minimization of optical interference patterns, which can
originate from the reflection of the laser at the top and bottom side of the
cantilever as well as the top of the sample (such as optically flat regions of the
petri dish). This will result in noisy measurements (see Figure 5). This is
particularly noticeable when force-distance curves are acquired. In these cases,
a periodic wavy pattern is observed in the curve. Changing the position of the
laser spot on the back of the cantilever or changing to a less reflective sample
usually eliminates the interference.
3. Minimization of acoustic and floor vibrations which produce noise that
affect the resolution of the AFM. The cantilever probe is prone to pick up such
vibrations especially when the cantilever is in air. The minimization and damping
of any vibrations thus is critical to obtaining high-quality data with any AFM. Our
group has addressed this issue by locating the AFM in the basement of the M. H.
Wong Building at McGill University on a floor vibrationally decoupled from the
rest of the building. The basement was built on a separate foundation from the
surrounding structure to remove vibrations from the building structure. An air-
damped table on which the Bioscope AFM system rests gives additional
15
mechanical isolation. Care was taken not to mechanically short circuit the air
table by clamping all cables tightly to it. The AFM is also covered with a home-
made acoustic isolation hood (utilizing SOH-2 Sonex1 acoustical foam;
Vibrasciences Inc., Branford, CT). All these measures lead to a minimization of
vibration induced noise and instabilities.
4. Minimization of interaction forces leads to high resolution AFM images
on biological systems. In biological samples, the softness of the samples can
reduce the resolution of the AFM images for features of interest such as i.e. pilus,
flagellum, embedded proteins in the membrane, membrane protrusions. This
occurs because excessive tip-sample interaction forces can easily and
substantially deform and perturb the delicate, elastic cellular structures. Fixation
of the samples, a method where the proteins that form the cell are covalently
bound to each other, increases the overall resistance of the structures to
deformation and is often used to image biological samples. However, that is not a
choice if dynamic events are to be detected or if fixation alters the structures that
z displacement
cant
ileve
r de
flect
ion
z displacement
cantilever deflection
z displacement
cant
ileve
r de
flect
ion
Cantilever
Incident laser
beam
Reflected laser
beams
Cantilever
Incident laser
beam
Reflected laser
beams
Figure 5: Interference of the laser reflected at three planes
(upper and lower cantilever surfaces and the substrate) can negatively
affect the data acquisition. It is particularly noticeable in force
spectroscopy where the force-distance curves appear wavy. Changing
the position of the laser beam in the back of the cantilever as well as
using low refractive surfaces can eliminate the interference.
16
have to be observed. Reduction of the interaction forces is limited by external
vibrations, electrical as well as optical interference noise.
5. The thermal bimetallic effect can result in variations of the tip-sample
interaction force over time. This effect is especially relevant when scanning
biological samples which are very delicate and are damaged easily when large
forces are applied. The triangular cantilevers that have been widely used in this
thesis are coated with gold on the backside to increase the reflection of the laser
used to measure cantilever deflection. The bulk of the cantilever is made of
Silicon Nitride (a temperature change of 1 mK leads to a deflection of typically 1
nm). Shining light on the cantilever is one source of heating and absorption
induced thermal bimetallic bending that occurs slowly and only reaches an
equilibrium after several minutes (~30 min). Thus, for all the measurements
performed in this thesis, the cantilever was allowed to equilibrate before we
proceeded to the collection of data.
6. To achieve good accuracy and precision, regular calibration of the AFM
must be performed. This eliminates any artifact that could ultimately distort the
images or produce false measurements of both, horizontal/vertical displacements
or the strength of the probe-sample interaction forces. To assure quality data and
optimal performance of the AFM, a calibration procedure was completed
approximately every three months. A silicon calibration sample whose features
are known and well characterized is used to calibrate the x-y axes as well as the
z axes. Briefly, a topographic image of the calibration sample is taken and the
motion of the scanner in the x-y axes is linearized (for details about the
calibration procedures refer to the Bioscope manual). The size of the features is
compared to the known characteristic sizes and recalibrated if necessary. A
similar procedure applies to the calibration of the z displacement. In this case,
the vertical movement of the z-piezo must be calibrated by using the known
characteristic depth of the sample features. Finally, orthogonality in the x-y plane
must be calibrated as well by measuring and adjusting the angles at which the
features appear in the topographic image of the reference sample. The reason
for potential changes in calibration constants is due to the fact that
17
piezoelements age (and change sensitivity) and that the elaborate cantilever
piezoscanner with the integrated deflection measurement system can become
misaligned due to uncorrected x-y and z piezo cross talk.
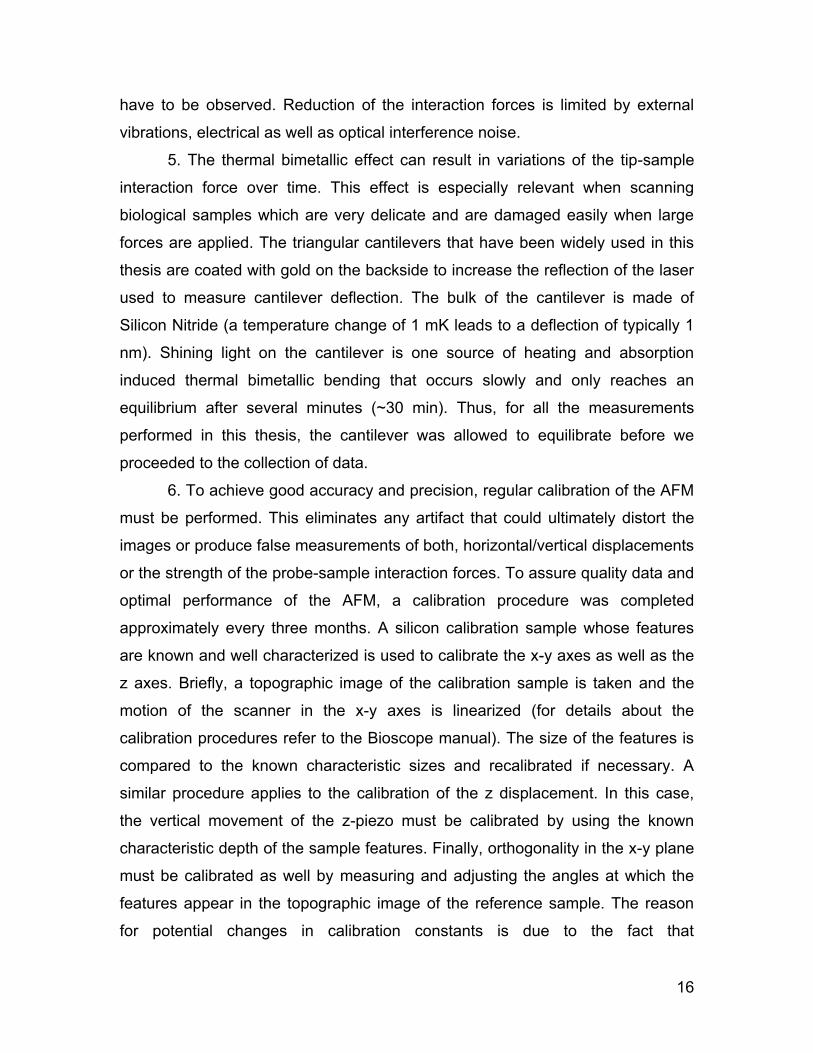
If all precautions described above are taken care of and the system is
calibrated a benchmark measurement of the system and deflection is performed.
Cantilever deflection data is collected with a 380 Hz bandwidth, while the z-
position is maintained constant. For a cantilever with a spring constant of 0.01
N/m submerged in liquid stabilized at 37 C (i.e. same conditions as those
employed when measuring cells) the measured standard deviation of the noise
was found to be 0.25 nm. This is larger than what is achievable on many
optimized high resolutions AFMs (where values as low as 10 pm are achievable),
but one needs to consider that the Bioscope AFM is mounted on an inverted
optical microscope. This (large) mechanical structure acts like a drumhead with
substantial vibrational amplitudes. From Figure 6, we see that it is thus possible
to observe cantilever deflections smaller than 1 nm under physiological
conditions. Note that under realistic operational conditions detection of such
0.2 0.3 0.4 0.5 0.6
-0.4
-0.2
0
0.2
0.4
0.6
time / s
deflection / n
m
6
4
2
0
-2
-4
Figure 6: Estimation of the noise in the cantilever was performed by submerging it
in liquid and taking the trace of spontaneous vibrations. It was found that the noise root
mean square is equal to 0.25 nm for the cantilever used in this thesis (0.01 N/m spring
constant). The data was acquired at 380 Hz. The use of stiffer cantilevers reduce the noise
but they were not used in this thesis to avoid damage of the membrane due to large loads.
18
small values of the cantilever deflection is challenging. A possible explanations is
that the noise of the electrical signal necessary to induce piezo motion to scan
the cantilever in x and y or during acquisition of force distance curves (movement
in z) induces piezo vibrations which couple to the cantilever An indication of this
is that a lower deflection noise can be achieved by using higher frequency (i.e.
stiffer) cantilevers. We however avoid the use of stiff cantilevers in this thesis as
the larger spring constant leads to a higher force loading which can induce
serious damages to the cell membrane.
2.3 Operation modes
2.3.1 Contact mode
In the contact mode of operation, the AFM cantilever is moved towards the
sample until the cantilever-sample interaction leads to a bending of the cantilever
due to Pauli repulsion. This event is detected optically by the laser beam
deflection method. In our system the laser beam wavelength is 670 nm and it is
focused on the back of the cantilever, close to the cantilever tip. The reflected
laser beam is then detected in a split photodiode. When the cantilever bends as
a consequence of tip-sample interaction, the laser spot on the split photodetector
changes location. The difference between the photodiode output signal is
proportional to the cantilever deflection. To maintain a constant, predetermined
force, the AFM feedback system constantly compares the output signal with a
reference (set point chosen by the user) and controls the cantilever movement to
achieve a zero difference between the measured and the set point value (see
Figure 4).
During imaging, the sample is scanned and the feedback controller keeps
the cantilever bending (and hence the applied force) constant by dynamically
moving the base of the cantilever and tip up or down (± z) with the help of a
piezoelectric crystal. The voltage applied to the piezo necessary to adjust the z
position of the cantilever is recorded and used to generate the topographic image
of the sample. These images thus represent contours of constant force.
19
The lateral resolution of the AFM is a critical issue if small sample features
are to be detected. Unlike optics, there is no resolution criteria related to some
characteristic length scale in AFM. However, three parameters are relevant and
determine the AFM resolution: sample-tip interaction force (in particular its decay
length), tip radius and signal to noise ratio.
In biological systems, the sample stiffness is an important factor to
consider if good resolution is needed. Care should be taken to choose the proper
sample-tip interaction force. Due to the viscoelastic nature of the cells, relatively
high interaction forces can mask soft surface features by smoothing them or
simply breaking them. Internal structures can also be damaged by large forces
and lead to cell death. However, the use of very low interaction forces is
challenging and accomplished only under very well controlled situations and
specific conditions. Le Grimellec et al., (1998) showed the viability to use the
AFM to discern small granular features on the cell membrane without significant
disruption (tip-sample interaction forces of the order of 20-50 pN were
employed). Lateral resolution of 20 nm and sometimes 10 nm was achieved with
indentations as low as 10 nm.
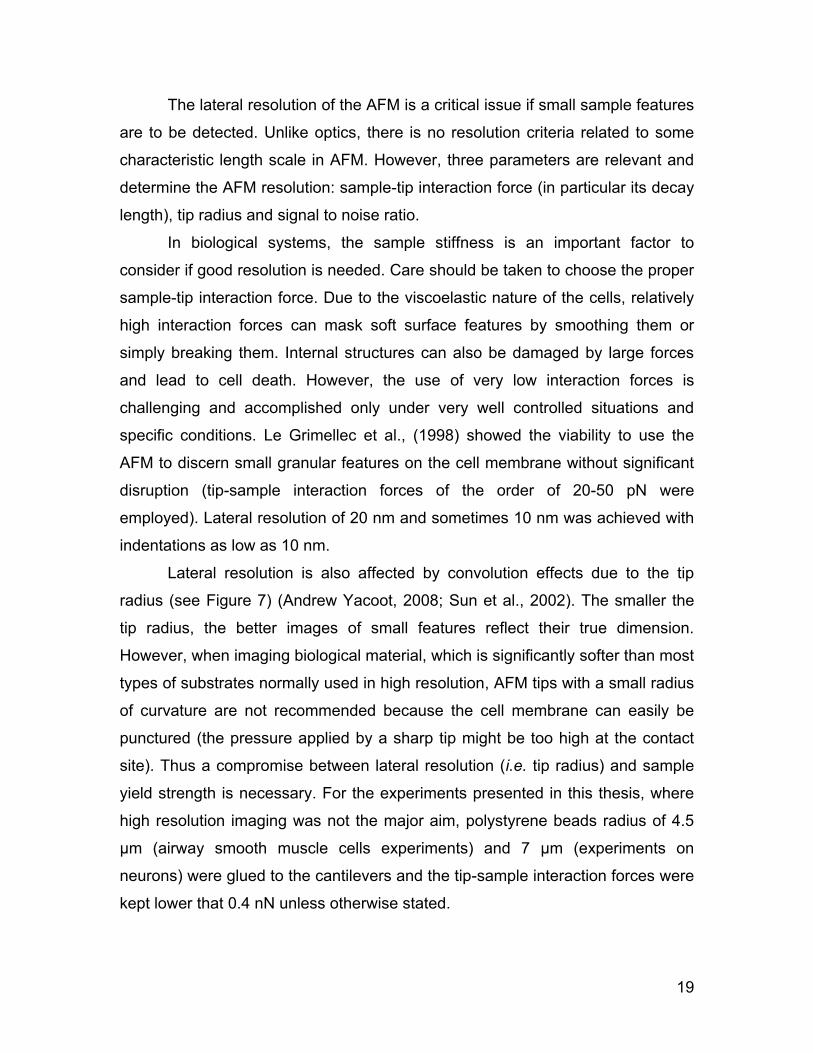
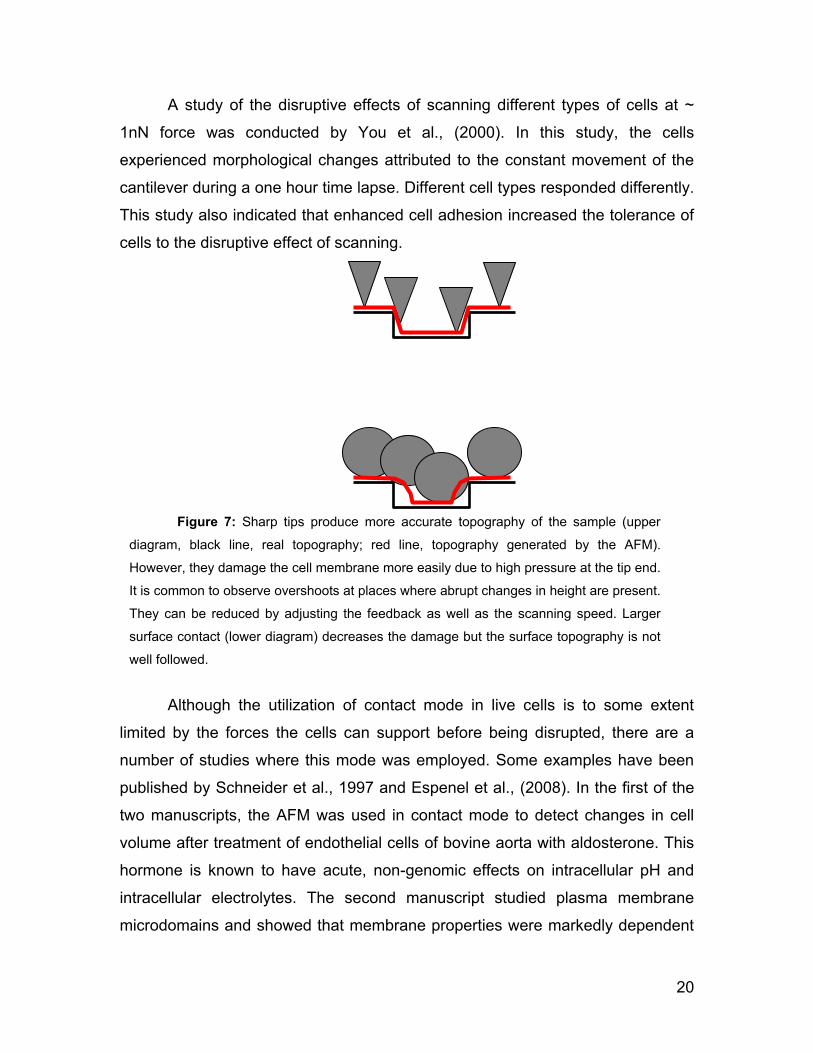
Lateral resolution is also affected by convolution effects due to the tip
radius (see Figure 7) (Andrew Yacoot, 2008; Sun et al., 2002). The smaller the
tip radius, the better images of small features reflect their true dimension.
However, when imaging biological material, which is significantly softer than most
types of substrates normally used in high resolution, AFM tips with a small radius
of curvature are not recommended because the cell membrane can easily be
punctured (the pressure applied by a sharp tip might be too high at the contact
site). Thus a compromise between lateral resolution (i.e. tip radius) and sample
yield strength is necessary. For the experiments presented in this thesis, where
high resolution imaging was not the major aim, polystyrene beads radius of 4.5
μm (airway smooth muscle cells experiments) and 7 μm (experiments on
neurons) were glued to the cantilevers and the tip-sample interaction forces were
kept lower that 0.4 nN unless otherwise stated.
20
A study of the disruptive effects of scanning different types of cells at ~
1nN force was conducted by You et al., (2000). In this study, the cells
experienced morphological changes attributed to the constant movement of the
cantilever during a one hour time lapse. Different cell types responded differently.
This study also indicated that enhanced cell adhesion increased the tolerance of
cells to the disruptive effect of scanning.
Although the utilization of contact mode in live cells is to some extent
limited by the forces the cells can support before being disrupted, there are a
number of studies where this mode was employed. Some examples have been
published by Schneider et al., 1997 and Espenel et al., (2008). In the first of the
two manuscripts, the AFM was used in contact mode to detect changes in cell
volume after treatment of endothelial cells of bovine aorta with aldosterone. This
hormone is known to have acute, non-genomic effects on intracellular pH and
intracellular electrolytes. The second manuscript studied plasma membrane
microdomains and showed that membrane properties were markedly dependent
Figure 7: Sharp tips produce more accurate topography of the sample (upper
diagram, black line, real topography; red line, topography generated by the AFM).
However, they damage the cell membrane more easily due to high pressure at the tip end.
It is common to observe overshoots at places where abrupt changes in height are present.
They can be reduced by adjusting the feedback as well as the scanning speed. Larger
surface contact (lower diagram) decreases the damage but the surface topography is not
well followed.

21
on temperature. These first temperature-dependent data show that large cell
structures appeared essentially stable at a microscopic scale. On the other hand,
as shown by contact mode AFM, the surface was highly dynamic at a
mesoscopic scale, with marked changes in apparent topography, friction, and
deflection signals. Sun et al., (2002) have used AFM to image cells but also to
image biological molecules such as RNA and DNA although tip radius is still a
limiting factor to obtaining good lateral resolution. Contact mode has been used
to examine fixed cell cultures as well. Fixation cross-links the proteins that form
the cell and make them stiffer relative to their live counterparts. The increased
stiffness facilitates the scanning process since the cell structures are more
resistant to deterioration and can even be used for more than one imaging
session.
2.3.2 Tapping mode
Contrary to contact mode, where the cantilever is always in contact with
the sample, in tapping mode, the cantilever interacts intermittently with the
sample. In this mode, the cantilever is oscillated at its resonant frequency by a
piezoelectric actuator. Upon approaching the sample and at the bottom of each
oscillation cycle, the tip briefly interacts („taps‟) the sample surface. This tip-
sample interaction produce a decreases of the oscillation amplitude. The AFM
feedback circuit is used to maintain a constant, reduced cantilever oscillation
amplitude (e.g. to 80% of the interaction free amplitude) by adjusting the tip-
sample separation. The feedback thus compensates for changes in the
amplitude set value by changing the tip-sample separation z. Simultaneous
topography and phase images can be obtained with this mode.
The use of tapping mode has some advantages relevant for biological
samples. In particular, this mode significantly reduced probe-sample shear
interactions, thus diminishing the damage that soft samples might suffer when
scanned in contact mode. Oscillating the tip at high frequencies can take
advantage of the viscoelastic nature of most biological materials, which tend to
be stiffer (have a higher elastic modulus) at higher frequencies. Thus tapping
22
mode imaging on biological systems tends to give higher resolution images while
minimizing damages from shear forces.
In addition to the topographic image, which provide information about the
physical shape of the sample contour, phase images contain information of the
mechanical properties of the sample. The phase lag of the tip movement relative
to the excitation signal is monitored and recorded while the feedback keeps the
oscillation amplitude at a fixed value. Phase image contains qualitative data of
the mechanics of the sample but other techniques such as Force spectroscopy
and Force modulation have to be used if quantitative data is required. Performing
tapping mode in liquids brings additional advantages that include the elimination
of capillary forces and the reduction of the van der Waals‟ forces. This, generally
speaking, makes the imaging of biologically relevant samples, that are delicate
and soft in nature, a bit less daunting (Hansma et al., 1994).
However, although tapping mode has advantages over contact mode,
some issues can arise, especially when measurements are carried out under
liquid which is a common procedure when investigating biological samples. The
resonance frequency of cantilevers immersed in liquid is shifted towards lower
frequencies compared to those observed when the cantilever is oscillated in air.
Resonance peaks can disappear due to strong damping and new peaks (due to
mechanical excitation of the liquid cell) might appear (Putman et al., 1994). This
phenomena is known as the „forest of peaks‟ problem and can make the
identification of the cantilever resonance peak challenging (Schaffer et al., 1996).
The quality factor of the cantilevers also decrease by 1 to 3 orders of magnitude
in liquids as compared to air due to viscous damping, thus reducing AFM
sensitivity (García and Pérez, 2002).
Despite that, tapping mode is widely used when low interaction forces are
required and the mechanical damage of the sample is a concern. This mode has
been used in experiments involving single and double stranded DNA, DNA-
protein complexes (Muller et al., 1997; Kopp-Marsaudon et al., 2000; Sun et al.,
2002), RNA (Kienberger et al., 2004), proteins (Möller et al., 1999; San Paulo
23
and García, 2000), polymers (Reiter et al., 2000) and living and fixed cells
(Espenel et al., 2008).
2.3.3 Metrology and time resolution in contact and dynamic modes
Although AFM topographic measurements are very useful, it should be
kept in mind that the height determined from images (both contact and tapping
mode) is usually smaller than the nominal expected value for soft, easily
deformable samples such as cells. Deformations occurs due to tip-sample
interactions as well as dehydration (when scanning in air) .Convolution effects
due to large tip radius of curvature also affect the measured lateral dimension of
objects (García and Pérez, 2002). Under some conditions2 an impressive lateral
resolution of 1.1 nm (on proteins located in the purple membrane) has been
achieved in tapping mode. The sample used were crystalline patches of the
protein bacteriorhodopsin mounted on a solid, flat substrate with careful
optimization of electrostatic screening (Möller et al., 1999).
Imaging of dynamic events such as cell division, filopodia extension,
synapse formation and developing requires the acquisition of several frames in
short periods of time. Current acquisition times are of the order of minutes which
make the use of the traditional AFM a tool not suited for imaging highly dynamic
events. Recently developed high speed AFM (HS-AFM) overcomes this problem
(Casuso et al., 2009). HS-AFM has been mainly developed by three groups
(Ando et al., 2001; Humphris et al., 2005; Hansma et al., 2006). For instance,
Ando et al., (2001) were able to get 100x100 pixels images within 80 ms and
therefore can generate a movie consisting of many successive images (80-ms
intervals) of a sample in aqueous solution. The optimization of the AFM involved
the use of small cantilevers with high resonance frequencies (450–650 kHz),
small spring constants (150–280 pN/nm), a scan system free of resonant
vibrations up to 60 kHz and several electronic components with a wide
2 Minimization of the tip-sample interactions and the increased rigidity of the sample at
higher frequencies due to viscoelasticity

24
bandwidth. This type of highly specialized equipment is not yet commercially
available. Most recently, HS AFM has directly visualized the details of the motion
of a single myosin motor protein on an actin filaments (Kodera et al., 2010).
2.4 The force sensor
2.4.1 Spring constant
In the AFM, the cantilever is the element that transduces the forces acting
between tip and sample to optically detected mechanical deflections. For small
forces (linear approximation) the deflection of the cantilever for a given force
acting on it is given by the Hooks‟ law,
F = k * z (Eq. 1)
where k is the cantilever spring constant and z represent the vertical
displacement (bending) measured at the cantilever tip. A good estimation of the
cantilever spring constant is thus necessary to determine the force from the
measured deflection z.
Several methods have been described in the literature to calibrate the
spring constant of a cantilever.
Sader‟s method of calculating the spring constant for triangular cantilevers
often used in biological experiments makes use of the parallel beam
approximation (Sader, 1995) in which the two arms of the triangular cantilever
are considered equivalent to a single rectangular cantilever plate of length L and
width 2d. For the triangular cantilevers, L is the length of one arm and d is its
width. The parallel beam approximation method predicts that k can be calculated
by the equation,
1
3
3
3
3
)2cos3(4
1cos2
b
d
L
dEtk (Eq. 2)
where E is the Young modulus of the material, t represents the thickness,
theta is half the opening angle between the arms and b is the distance between
the arms at the chip base. Calculation of the spring constant for the triangular
cantilevers using the nominal cantilever dimensions provided by the

25
manufacturer (L = 310 μm, b = 225 μm, d = 20 μm, t = 0.55 μm and theta = 19.4;
Veeco, model: MSCT-AUHW) and a silicon nitride‟s Young‟s modulus of 222
GPa (Nix, 1992) produces a k = 10.7 mN/m. The nominal value provided by the
manufacturer is 10 mN/m, well within the 10% - 20% error generally accepted for
the calculation of the spring constant using Sader‟s method (Sader, 2002).
A further method developed by Sader et al., (1995) to calculate the spring
constant of triangular cantilevers was published in 1995 (such cantilevers were
used in all the experiments described in this thesis unless otherwise stated). The
method incorporates the viscosity and density of the medium in which the
cantilever is immersed along with experimentally determined values of the
resonant frequency and quality factor. The cantilever dimensions are also
needed to calculate the stiffness of the cantilever. We found that results do not
differ significantly from the values stated by the manufacturer.
Cleveland et al., 1993 developed a method that is based on
measurements of the cantilever width and length as well as the cantilever‟s
resonant frequency. The method relies on literature values for elastic modulus
and density of the cantilever material.
The methods previously described make use of the cantilever dimensions
to get the spring constant and are generally called “geometric methods”.
“Thermal methods” measure the cantilever‟s thermal noise spectrum in
order to calculate the cantilever spring constant (Hutter and Bechhoefer, 1993).
In their approach, the cantilever is modeled as a harmonic oscillator in contact
with a heat bath. In this case, the Hamiltonian describing the cantilever motion is
given by,
22
0
2
2
1
2qm
m
pH (Eq. 3)
Using the equipartition theorem, equation 4 can be obtained,
2q
Tkk B (Eq. 4)
Where <q2> is mean square amplitude of the cantilever oscillation due to
thermal excitations. In order to measure the mean square amplitude of the
26
thermal fluctuations, the data is examined in the frequency domain. The power
spectral density of the cantilever displacement fluctuations has a Lorentzian
shape. Integrating this power spectrum over frequency gives the mean square of
the fluctuations in the time-series data needed as input to equation 4.
There are other calibration techniques such as finite element analyses
(Stark et al., 2001), methods that make use of nanoindentors (Holbery et al.,
2000) and approaches involving manipulation of small particles (Cleveland et al.,
1993). However, such techniques have some drawbacks such as complexity for
quick use and the necessity of special equipment (Burnham et al., 2003).
A comparison of different calibration techniques found variations of 20%
for the same cantilever (http://www.asylumresearch.com/
Applications/CantileverCal/CantileverCal.shtml). In the present study, we found
that the spring constant measured by the thermal method was within the value
calculated by the Sader method and in good agreement with the nominal value
given by the cantilever manufacturer. Thus, the nominal spring constant was
used to calculate interaction forces in this thesis.
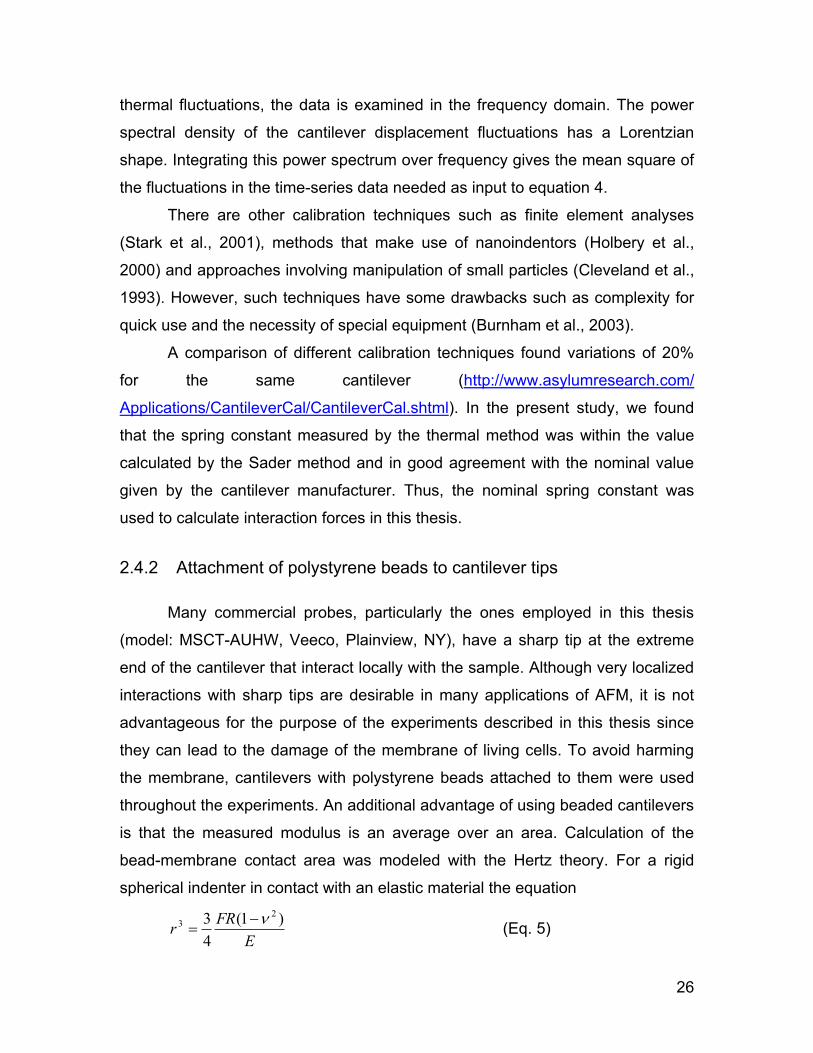
2.4.2 Attachment of polystyrene beads to cantilever tips
Many commercial probes, particularly the ones employed in this thesis
(model: MSCT-AUHW, Veeco, Plainview, NY), have a sharp tip at the extreme
end of the cantilever that interact locally with the sample. Although very localized
interactions with sharp tips are desirable in many applications of AFM, it is not
advantageous for the purpose of the experiments described in this thesis since
they can lead to the damage of the membrane of living cells. To avoid harming
the membrane, cantilevers with polystyrene beads attached to them were used
throughout the experiments. An additional advantage of using beaded cantilevers
is that the measured modulus is an average over an area. Calculation of the
bead-membrane contact area was modeled with the Hertz theory. For a rigid
spherical indenter in contact with an elastic material the equation
E
FRr
)1(
4
3 23 (Eq. 5)
27
predicted the contact radius (Fischer-Cripps, 1999). Given a 0.3 nN force
(typical for the measurements performed in this thesis) and a 4.5 μm diameter
polystyrene sphere, the contact radius vary between 0.8 μm and 1 μm (the
former for „stiff‟ cells, the latter for softer cells). The attachment of the bead to the
cantilever is described below.
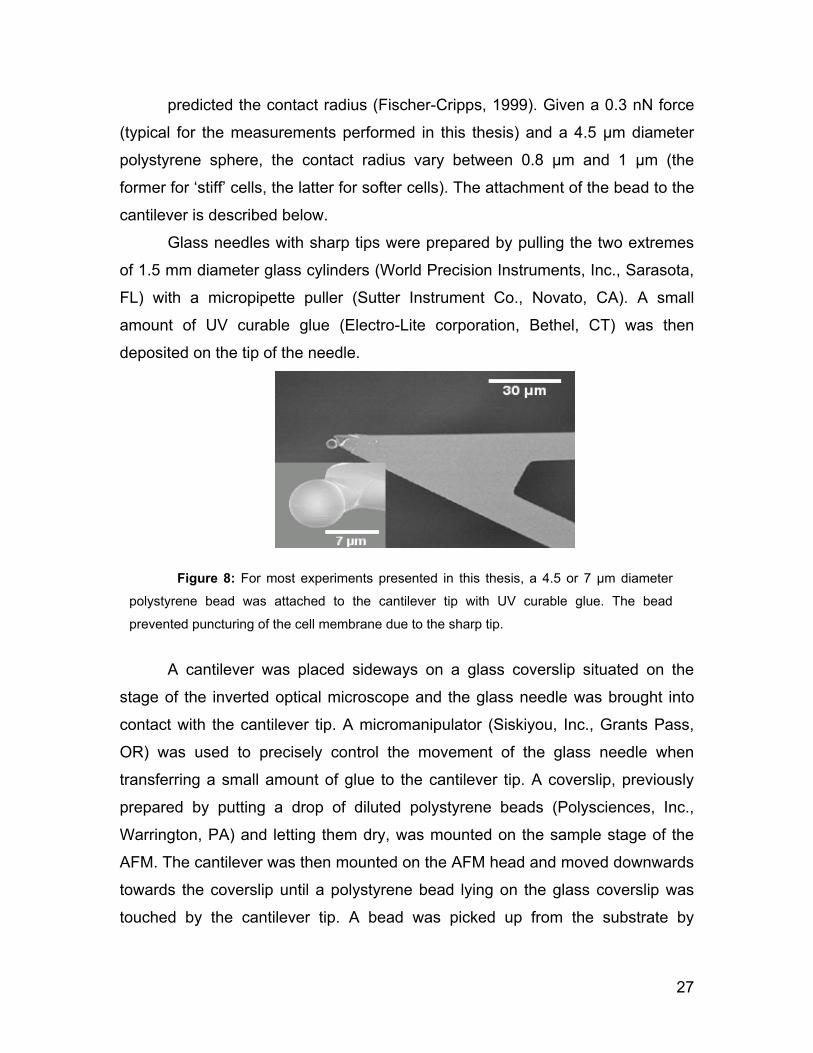
Glass needles with sharp tips were prepared by pulling the two extremes
of 1.5 mm diameter glass cylinders (World Precision Instruments, Inc., Sarasota,
FL) with a micropipette puller (Sutter Instrument Co., Novato, CA). A small
amount of UV curable glue (Electro-Lite corporation, Bethel, CT) was then
deposited on the tip of the needle.
A cantilever was placed sideways on a glass coverslip situated on the
stage of the inverted optical microscope and the glass needle was brought into
contact with the cantilever tip. A micromanipulator (Siskiyou, Inc., Grants Pass,
OR) was used to precisely control the movement of the glass needle when
transferring a small amount of glue to the cantilever tip. A coverslip, previously
prepared by putting a drop of diluted polystyrene beads (Polysciences, Inc.,
Warrington, PA) and letting them dry, was mounted on the sample stage of the
AFM. The cantilever was then mounted on the AFM head and moved downwards
towards the coverslip until a polystyrene bead lying on the glass coverslip was
touched by the cantilever tip. A bead was picked up from the substrate by
Figure 8: For most experiments presented in this thesis, a 4.5 or 7 μm diameter
polystyrene bead was attached to the cantilever tip with UV curable glue. The bead
prevented puncturing of the cell membrane due to the sharp tip.
28
retracting the tip. The cantilever with bead was then placed for 30 s under a UV
light to harden the glue (see Figure 8).
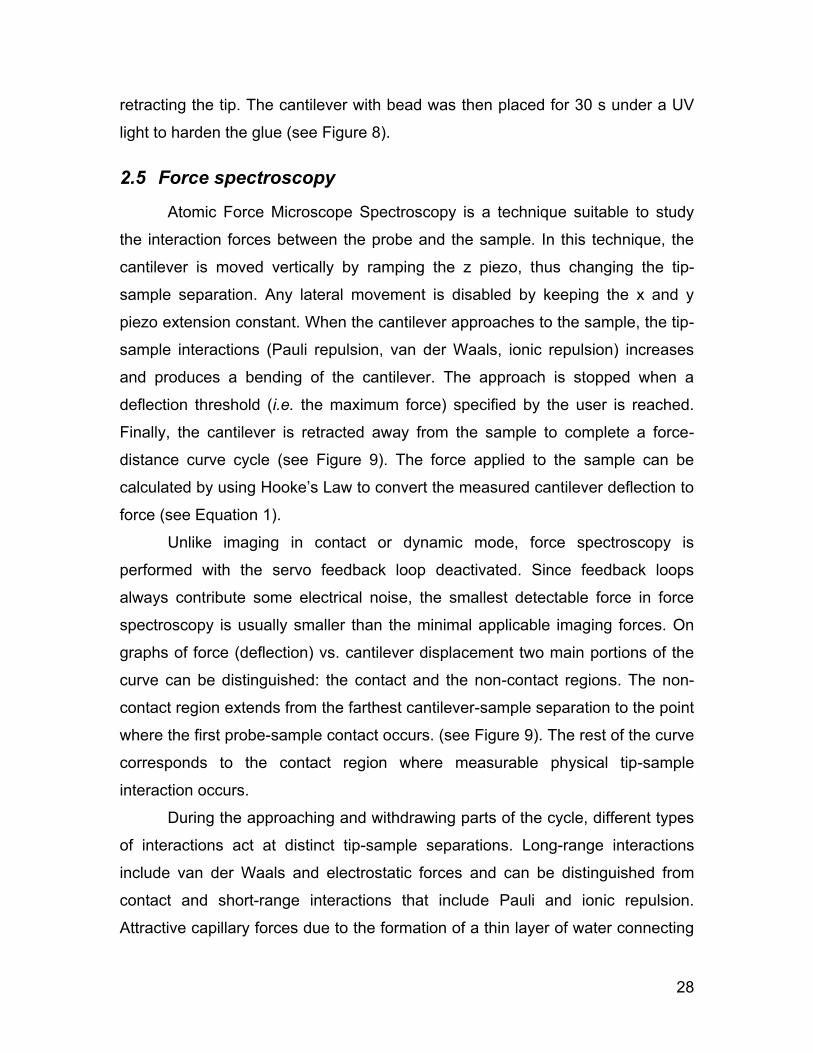
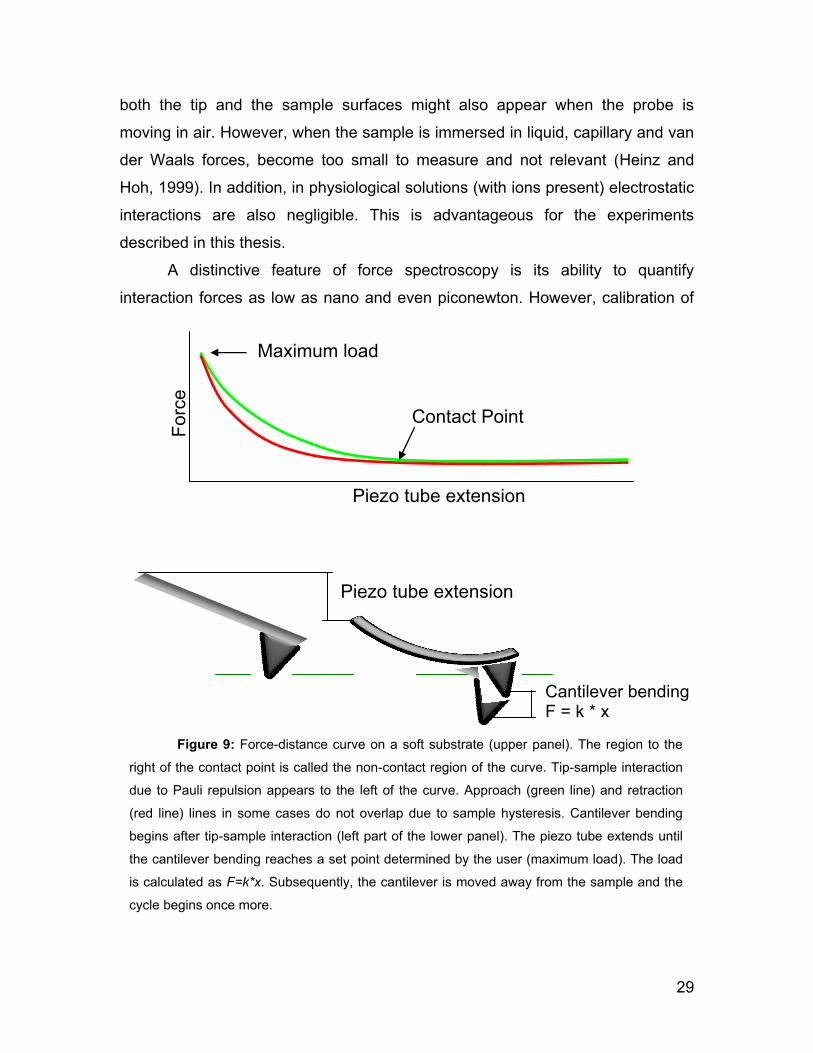
2.5 Force spectroscopy
Atomic Force Microscope Spectroscopy is a technique suitable to study
the interaction forces between the probe and the sample. In this technique, the
cantilever is moved vertically by ramping the z piezo, thus changing the tip-
sample separation. Any lateral movement is disabled by keeping the x and y
piezo extension constant. When the cantilever approaches to the sample, the tip-
sample interactions (Pauli repulsion, van der Waals, ionic repulsion) increases
and produces a bending of the cantilever. The approach is stopped when a
deflection threshold (i.e. the maximum force) specified by the user is reached.
Finally, the cantilever is retracted away from the sample to complete a force-
distance curve cycle (see Figure 9). The force applied to the sample can be
calculated by using Hooke‟s Law to convert the measured cantilever deflection to
force (see Equation 1).
Unlike imaging in contact or dynamic mode, force spectroscopy is
performed with the servo feedback loop deactivated. Since feedback loops
always contribute some electrical noise, the smallest detectable force in force
spectroscopy is usually smaller than the minimal applicable imaging forces. On
graphs of force (deflection) vs. cantilever displacement two main portions of the
curve can be distinguished: the contact and the non-contact regions. The non-
contact region extends from the farthest cantilever-sample separation to the point
where the first probe-sample contact occurs. (see Figure 9). The rest of the curve
corresponds to the contact region where measurable physical tip-sample
interaction occurs.
During the approaching and withdrawing parts of the cycle, different types
of interactions act at distinct tip-sample separations. Long-range interactions
include van der Waals and electrostatic forces and can be distinguished from
contact and short-range interactions that include Pauli and ionic repulsion.
Attractive capillary forces due to the formation of a thin layer of water connecting
29
both the tip and the sample surfaces might also appear when the probe is
moving in air. However, when the sample is immersed in liquid, capillary and van
der Waals forces, become too small to measure and not relevant (Heinz and
Hoh, 1999). In addition, in physiological solutions (with ions present) electrostatic
interactions are also negligible. This is advantageous for the experiments
described in this thesis.
A distinctive feature of force spectroscopy is its ability to quantify
interaction forces as low as nano and even piconewton. However, calibration of
Maximum load
Contact Point
Piezo tube extension
Forc
e
Piezo tube extension
Cantilever bending F = k * x
Figure 9: Force-distance curve on a soft substrate (upper panel). The region to the
right of the contact point is called the non-contact region of the curve. Tip-sample interaction
due to Pauli repulsion appears to the left of the curve. Approach (green line) and retraction
(red line) lines in some cases do not overlap due to sample hysteresis. Cantilever bending
begins after tip-sample interaction (left part of the lower panel). The piezo tube extends until
the cantilever bending reaches a set point determined by the user (maximum load). The load
is calculated as F=k*x. Subsequently, the cantilever is moved away from the sample and the
cycle begins once more.
30
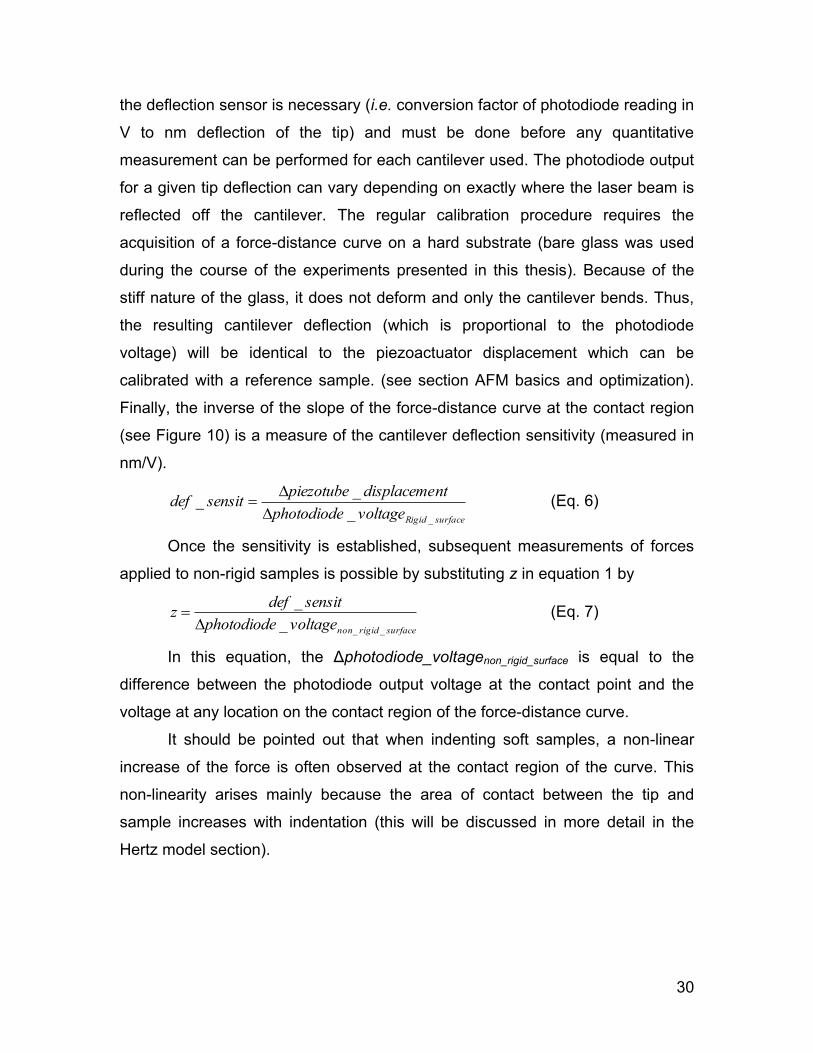
the deflection sensor is necessary (i.e. conversion factor of photodiode reading in
V to nm deflection of the tip) and must be done before any quantitative
measurement can be performed for each cantilever used. The photodiode output
for a given tip deflection can vary depending on exactly where the laser beam is
reflected off the cantilever. The regular calibration procedure requires the
acquisition of a force-distance curve on a hard substrate (bare glass was used
during the course of the experiments presented in this thesis). Because of the
stiff nature of the glass, it does not deform and only the cantilever bends. Thus,
the resulting cantilever deflection (which is proportional to the photodiode
voltage) will be identical to the piezoactuator displacement which can be
calibrated with a reference sample. (see section AFM basics and optimization).
Finally, the inverse of the slope of the force-distance curve at the contact region
(see Figure 10) is a measure of the cantilever deflection sensitivity (measured in
nm/V).
surfaceRigidvoltagephotodiode
ntdisplacemepiezotubesensitdef
__
__
(Eq. 6)
Once the sensitivity is established, subsequent measurements of forces
applied to non-rigid samples is possible by substituting z in equation 1 by
surfacerigidnonvoltagephotodiode
sensitdefz
___
_
(Eq. 7)
In this equation, the Δphotodiode_voltagenon_rigid_surface is equal to the
difference between the photodiode output voltage at the contact point and the
voltage at any location on the contact region of the force-distance curve.
It should be pointed out that when indenting soft samples, a non-linear
increase of the force is often observed at the contact region of the curve. This
non-linearity arises mainly because the area of contact between the tip and
sample increases with indentation (this will be discussed in more detail in the
Hertz model section).
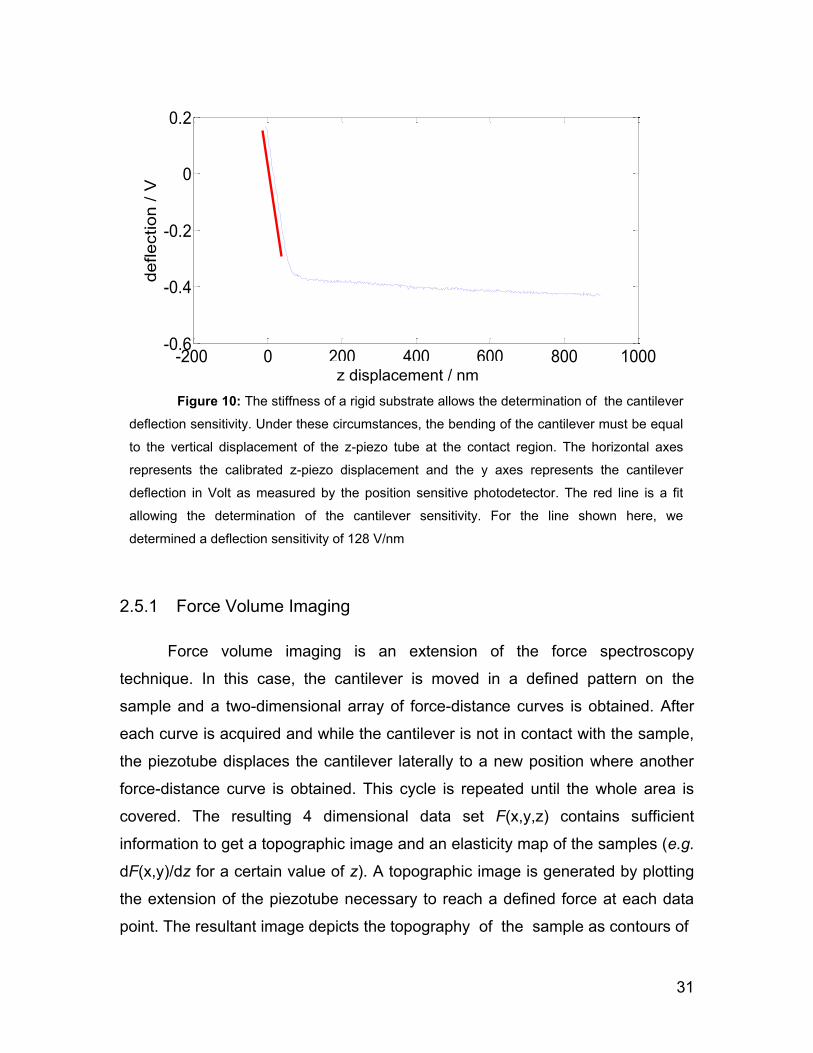
31
2.5.1 Force Volume Imaging
Force volume imaging is an extension of the force spectroscopy
technique. In this case, the cantilever is moved in a defined pattern on the
sample and a two-dimensional array of force-distance curves is obtained. After
each curve is acquired and while the cantilever is not in contact with the sample,
the piezotube displaces the cantilever laterally to a new position where another
force-distance curve is obtained. This cycle is repeated until the whole area is
covered. The resulting 4 dimensional data set F(x,y,z) contains sufficient
information to get a topographic image and an elasticity map of the samples (e.g.
dF(x,y)/dz for a certain value of z). A topographic image is generated by plotting
the extension of the piezotube necessary to reach a defined force at each data
point. The resultant image depicts the topography of the sample as contours of
-200 0 200 400 600 800 1000-0.6
-0.4
-0.2
0
0.2
z displecement / nm
de
fle
ctio
n /
V
Figure 10: The stiffness of a rigid substrate allows the determination of the cantilever
deflection sensitivity. Under these circumstances, the bending of the cantilever must be equal
to the vertical displacement of the z-piezo tube at the contact region. The horizontal axes
represents the calibrated z-piezo displacement and the y axes represents the cantilever
deflection in Volt as measured by the position sensitive photodetector. The red line is a fit
allowing the determination of the cantilever sensitivity. For the line shown here, we
determined a deflection sensitivity of 128 V/nm
z displacement / nm
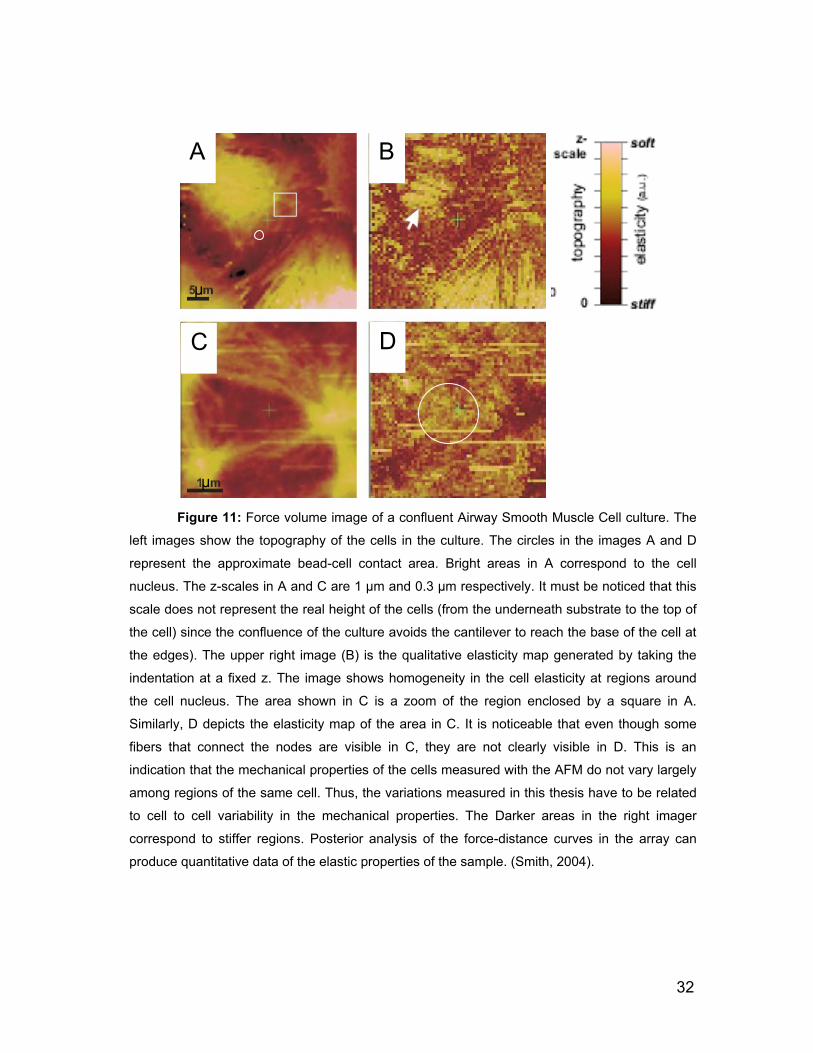
32
Figure 11: Force volume image of a confluent Airway Smooth Muscle Cell culture. The
left images show the topography of the cells in the culture. The circles in the images A and D
represent the approximate bead-cell contact area. Bright areas in A correspond to the cell
nucleus. The z-scales in A and C are 1 µm and 0.3 µm respectively. It must be noticed that this
scale does not represent the real height of the cells (from the underneath substrate to the top of
the cell) since the confluence of the culture avoids the cantilever to reach the base of the cell at
the edges). The upper right image (B) is the qualitative elasticity map generated by taking the
indentation at a fixed z. The image shows homogeneity in the cell elasticity at regions around
the cell nucleus. The area shown in C is a zoom of the region enclosed by a square in A.
Similarly, D depicts the elasticity map of the area in C. It is noticeable that even though some
fibers that connect the nodes are visible in C, they are not clearly visible in D. This is an
indication that the mechanical properties of the cells measured with the AFM do not vary largely
among regions of the same cell. Thus, the variations measured in this thesis have to be related
to cell to cell variability in the mechanical properties. The Darker areas in the right imager
correspond to stiffer regions. Posterior analysis of the force-distance curves in the array can
produce quantitative data of the elastic properties of the sample. (Smith, 2004).
B
D C
A
μ
μ
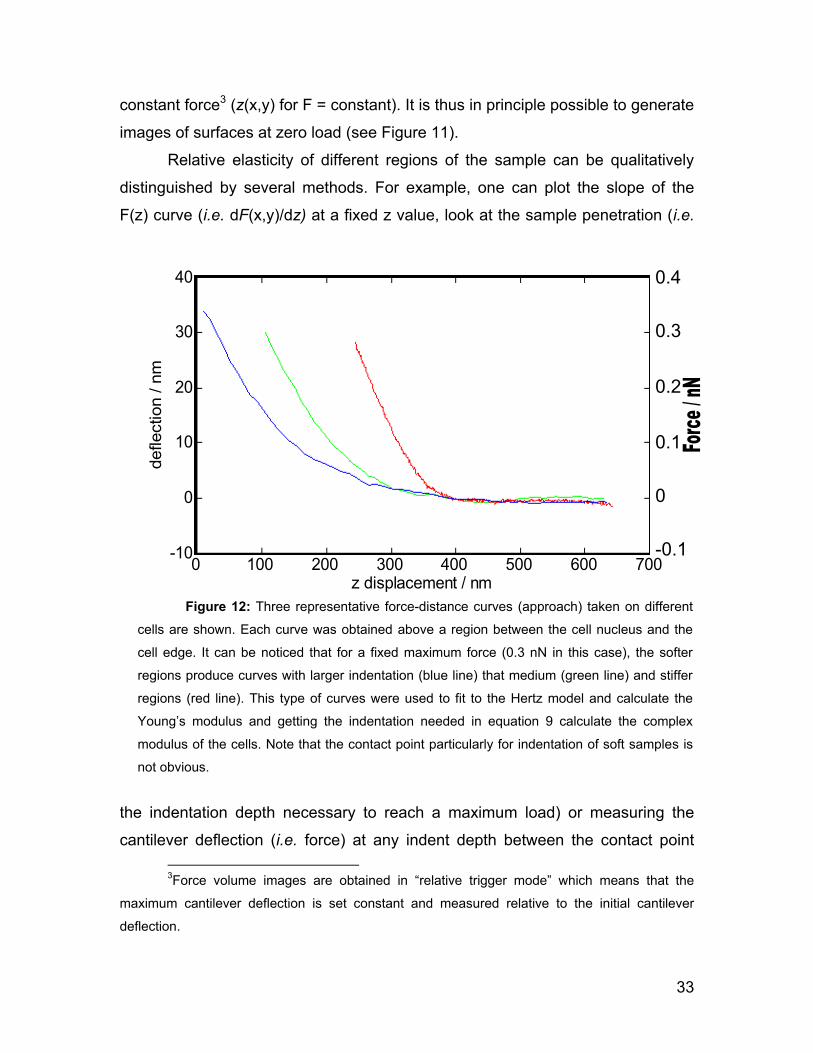
33
constant force3 (z(x,y) for F = constant). It is thus in principle possible to generate
images of surfaces at zero load (see Figure 11).
Relative elasticity of different regions of the sample can be qualitatively
distinguished by several methods. For example, one can plot the slope of the
F(z) curve (i.e. dF(x,y)/dz) at a fixed z value, look at the sample penetration (i.e.
the indentation depth necessary to reach a maximum load) or measuring the
cantilever deflection (i.e. force) at any indent depth between the contact point
3Force volume images are obtained in “relative trigger mode” which means that the
maximum cantilever deflection is set constant and measured relative to the initial cantilever
deflection.
0 100 200 300 400 500 600 700-10
0
10
20
30
40
z displacement / nm
deflection / n
m
0.4
0.3
0.2
0.1
0
-0.1
Figure 12: Three representative force-distance curves (approach) taken on different
cells are shown. Each curve was obtained above a region between the cell nucleus and the
cell edge. It can be noticed that for a fixed maximum force (0.3 nN in this case), the softer
regions produce curves with larger indentation (blue line) that medium (green line) and stiffer
regions (red line). This type of curves were used to fit to the Hertz model and calculate the
Young‟s modulus and getting the indentation needed in equation 9 calculate the complex
modulus of the cells. Note that the contact point particularly for indentation of soft samples is
not obvious.
34
and the maximum piezotube extension for each force-distance curve in the array
(see Figure 11). Curves obtained on soft regions show a larger indentation depth
than the indentations of relatively hard regions. Similarly, the cantilever deflection
at a fixed z tend to be larger for curves taken on stiffer regions of the sample (see
Figure 12).
Maps produced by force-volume imaging are useful to obtain a rapid and
qualitative map of the spatial 3D extent of regions of relative elasticity differences
of the sample. However, this method does not produce quantitative data
regarding the elastic and/or viscous properties of the sample. To achieve this,
other methods (Hassan et al., 1998) or further processing and analysis of the
collected data has to be done as described in the sections “Hertz model” and
“Force modulation”.
2.5.2 Hertz model
Elasticity and responsiveness of living cells to external forces are two
interesting subjects from the perspective of tissue engineering, cell biology and
cancer research. During tissue development, for instance, living cells respond to
mechanical stimulus in their native environments with changes in morphology,
membrane and nuclei structure (Lulevich et al., 2006), cell-spreading (Nathalie et
al., 2002), actin and microtubule reorganization (Laurent et al., 2005), or cell
motility (Petroll et al., 2004). So far, the investigation of single-cell mechanics had
been difficult to perform since most of the techniques are intended to measure
the mechanical properties of dissected tissue strips (strips are formed of
hundreds or thousands of cells; Yuan et al., 2000; Holzapfel et al., 2004;
Cavalcante et al., 2005) or averaging the mechanical properties of hundreds of
individual cells (magnetic twisting cytometry; Fabry et al., 2001) where no control
of the bead location on the cells surface is possible. The AFM, in contrast, can be
used to test the mechanical properties of individual cells. One can then
determine in principle how much of the distribution of various parameters
observed in the aforementioned experiments is due to single cell or population
heterogeneity. Furthermore, the AFM allows a fine control of the location of the
35
probe-cell contact and the duration of the interaction. Both, spatial and temporal
control make this technique highly valuable. However, the characterization of
cellular mechanics with the AFM is challenging mainly because the maximum cell
height in the nuclear region is usually only a few micrometers and the thickness
decreases considerably at regions close to the cell edge. This considerably limits
the possibility of obtaining reliable measurements in those regions, a substrate
effects or the mechanical properties of the nucleus can dominate. Although
several theories describing contact mechanics in the context of cellular systems
are available in the literature (Muller et al., 1983; Derjaguin et al., 1975; Johnson
et al., 1971), the Hertz theory is the most often used model and has been used in
several studies to characterize the cell mechanics of different types of cells
(Rotsch et al., 1999; Sato et al., 2000; Yamane et al., 2000).
The Hertz model makes several assumptions: the material to be tested
should be linear, elastic, isotropic and homogeneous with an infinite thickness
while the indenter should be rigid, non-adhering and of known symmetric
geometry (Hertz, 1882; Johnson, 1987). We will discuss these assumption in the
following paragraph.
The requirements of rigidity and well known symmetric geometry are met
by the spherical indenter used here. Small values of adhesion between the bead
and the cell cannot be ruled out completely. However, the force distance curves
used for the analysis did not show obvious signs of attachment (i.e. adhesion
force was less that the detectable force noise). Although the other assumptions
(linearity, elastic, isotropic and homogeneous) are generally not met by living
cells, this model has been used to extract mechanical properties of cells in the
past (Alcaraz et al., 2003; Smith et al., 2005; Rotsch et al., 1997). For instance,
cells are likely not isotropic due to the presence of stress fibers in the
cytoskeleton (actin filaments). However, at nm scales, the actin mesh might be
reasonably homogeneous and isotropic (see Figure 13, Svitkina and Borisy,
1999). The infinite thickness assumption made by the Hertz model has been
addressed by indenting the cells only a small fraction of the cell thickness (~ 10 –
20 %). Care was taken to indent only regions between the nucleus and the cell
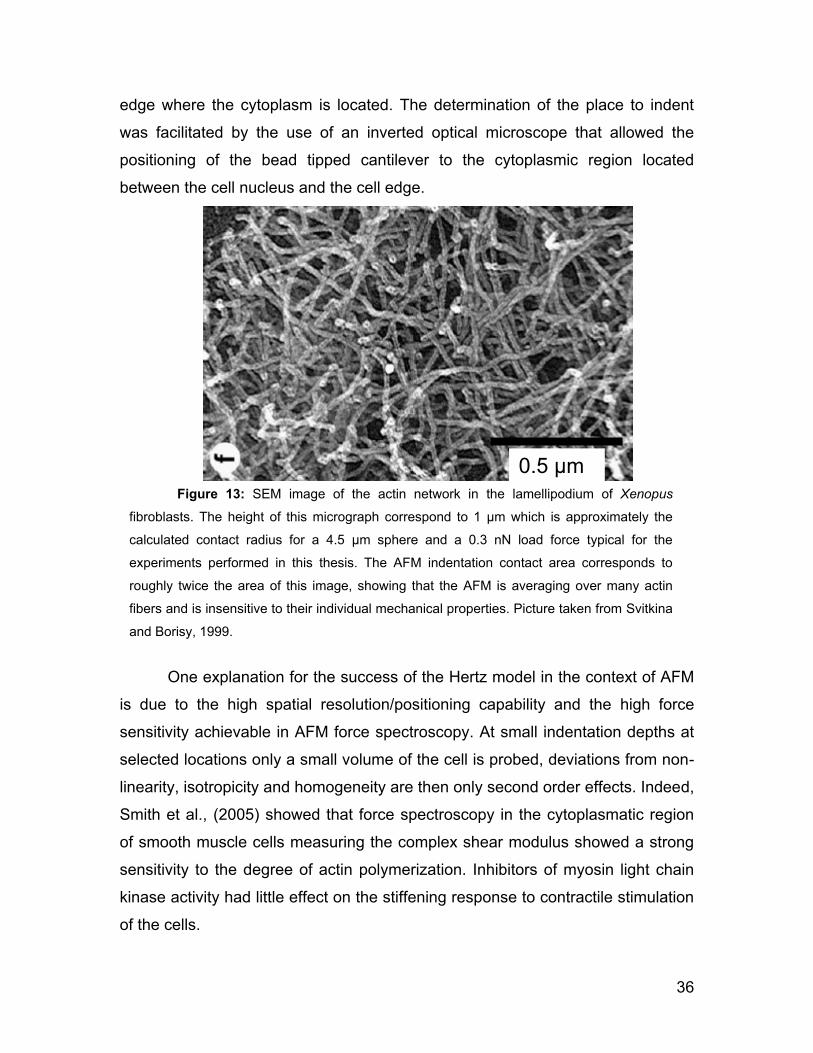
36
edge where the cytoplasm is located. The determination of the place to indent
was facilitated by the use of an inverted optical microscope that allowed the
positioning of the bead tipped cantilever to the cytoplasmic region located
between the cell nucleus and the cell edge.
One explanation for the success of the Hertz model in the context of AFM
is due to the high spatial resolution/positioning capability and the high force
sensitivity achievable in AFM force spectroscopy. At small indentation depths at
selected locations only a small volume of the cell is probed, deviations from non-
linearity, isotropicity and homogeneity are then only second order effects. Indeed,
Smith et al., (2005) showed that force spectroscopy in the cytoplasmatic region
of smooth muscle cells measuring the complex shear modulus showed a strong
sensitivity to the degree of actin polymerization. Inhibitors of myosin light chain
kinase activity had little effect on the stiffening response to contractile stimulation
of the cells.
Figure 13: SEM image of the actin network in the lamellipodium of Xenopus
fibroblasts. The height of this micrograph correspond to 1 μm which is approximately the
calculated contact radius for a 4.5 μm sphere and a 0.3 nN load force typical for the
experiments performed in this thesis. The AFM indentation contact area corresponds to
roughly twice the area of this image, showing that the AFM is averaging over many actin
fibers and is insensitive to their individual mechanical properties. Picture taken from Svitkina
and Borisy, 1999.
0.5 μm
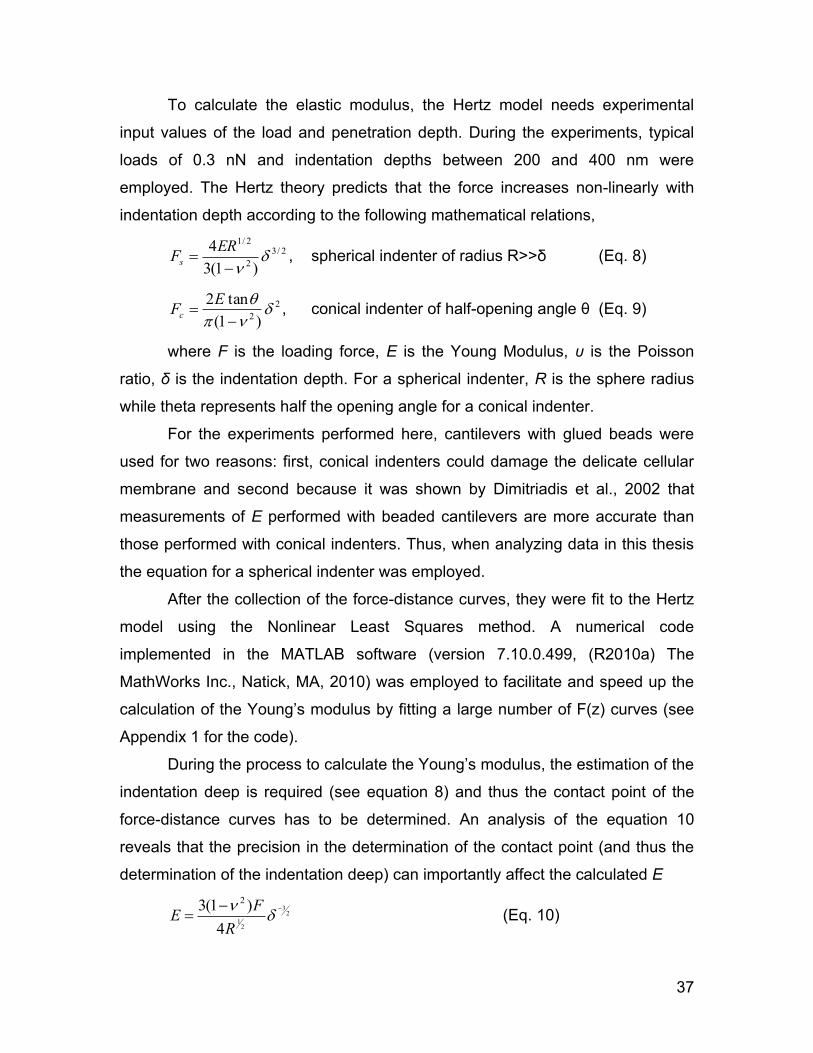
37
To calculate the elastic modulus, the Hertz model needs experimental
input values of the load and penetration depth. During the experiments, typical
loads of 0.3 nN and indentation depths between 200 and 400 nm were
employed. The Hertz theory predicts that the force increases non-linearly with
indentation depth according to the following mathematical relations,
2/3
2
2/1
)1(3
4
ERFs , spherical indenter of radius R>>δ (Eq. 8)
2
2 )1(
tan2
E
Fc , conical indenter of half-opening angle θ (Eq. 9)
where F is the loading force, E is the Young Modulus, υ is the Poisson
ratio, δ is the indentation depth. For a spherical indenter, R is the sphere radius
while theta represents half the opening angle for a conical indenter.
For the experiments performed here, cantilevers with glued beads were
used for two reasons: first, conical indenters could damage the delicate cellular
membrane and second because it was shown by Dimitriadis et al., 2002 that
measurements of E performed with beaded cantilevers are more accurate than
those performed with conical indenters. Thus, when analyzing data in this thesis
the equation for a spherical indenter was employed.
After the collection of the force-distance curves, they were fit to the Hertz
model using the Nonlinear Least Squares method. A numerical code
implemented in the MATLAB software (version 7.10.0.499, (R2010a) The
MathWorks Inc., Natick, MA, 2010) was employed to facilitate and speed up the
calculation of the Young‟s modulus by fitting a large number of F(z) curves (see
Appendix 1 for the code).
During the process to calculate the Young‟s modulus, the estimation of the
indentation deep is required (see equation 8) and thus the contact point of the
force-distance curves has to be determined. An analysis of the equation 10
reveals that the precision in the determination of the contact point (and thus the
determination of the indentation deep) can importantly affect the calculated E
23
21
4
)1(3 2
R
FE (Eq. 10)
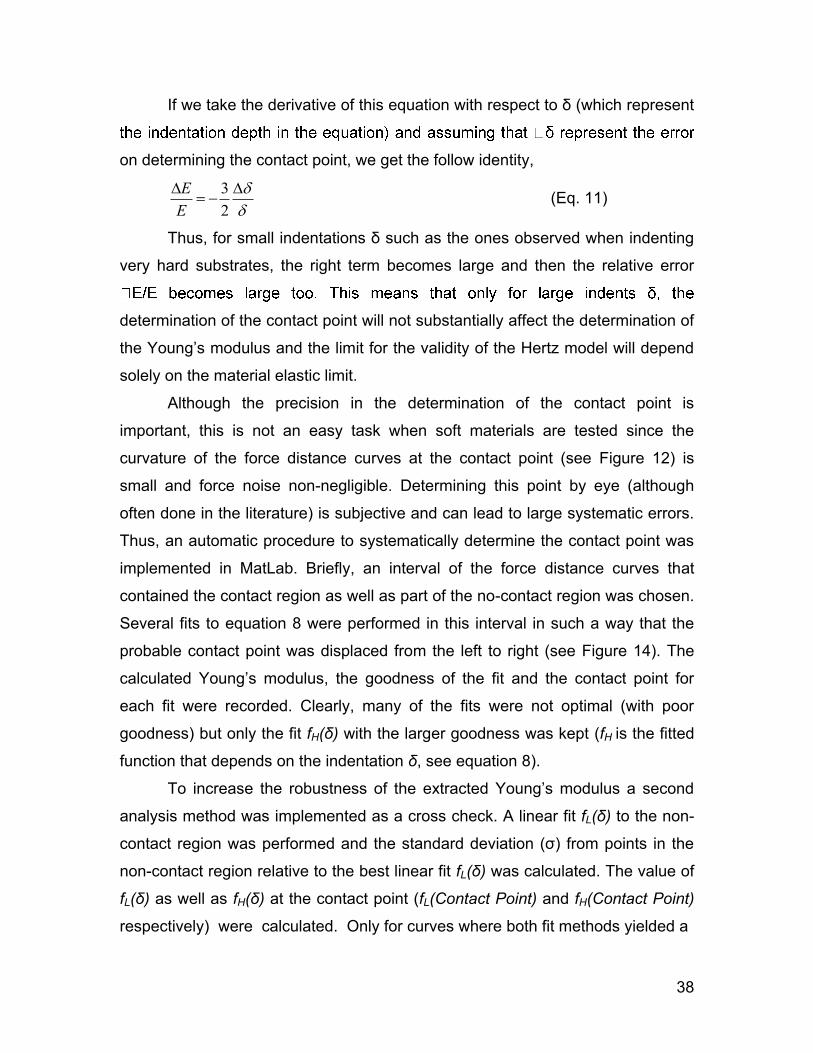
38
If we take the derivative of this equation with respect to δ (which represent
on determining the contact point, we get the follow identity,
2
3
E
E (Eq. 11)
Thus, for small indentations δ such as the ones observed when indenting
very hard substrates, the right term becomes large and then the relative error
determination of the contact point will not substantially affect the determination of
the Young‟s modulus and the limit for the validity of the Hertz model will depend
solely on the material elastic limit.
Although the precision in the determination of the contact point is
important, this is not an easy task when soft materials are tested since the
curvature of the force distance curves at the contact point (see Figure 12) is
small and force noise non-negligible. Determining this point by eye (although
often done in the literature) is subjective and can lead to large systematic errors.
Thus, an automatic procedure to systematically determine the contact point was
implemented in MatLab. Briefly, an interval of the force distance curves that
contained the contact region as well as part of the no-contact region was chosen.
Several fits to equation 8 were performed in this interval in such a way that the
probable contact point was displaced from the left to right (see Figure 14). The
calculated Young‟s modulus, the goodness of the fit and the contact point for
each fit were recorded. Clearly, many of the fits were not optimal (with poor
goodness) but only the fit fH(δ) with the larger goodness was kept (fH is the fitted
function that depends on the indentation δ, see equation 8).
To increase the robustness of the extracted Young‟s modulus a second
analysis method was implemented as a cross check. A linear fit fL(δ) to the non-
contact region was performed and the standard deviation (σ) from points in the
non-contact region relative to the best linear fit fL(δ) was calculated. The value of
fL(δ) as well as fH(δ) at the contact point (fL(Contact Point) and fH(Contact Point)
respectively) were calculated. Only for curves where both fit methods yielded a
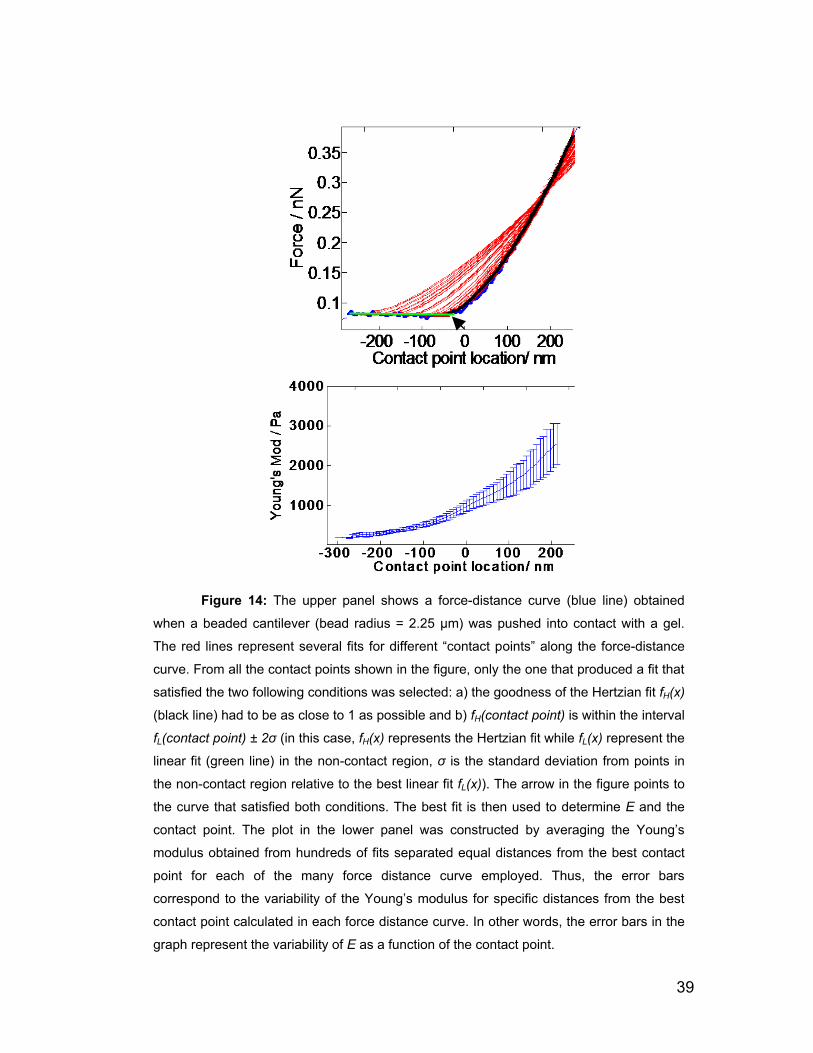
39
Figure 14: The upper panel shows a force-distance curve (blue line) obtained
when a beaded cantilever (bead radius = 2.25 μm) was pushed into contact with a gel.
The red lines represent several fits for different “contact points” along the force-distance
curve. From all the contact points shown in the figure, only the one that produced a fit that
satisfied the two following conditions was selected: a) the goodness of the Hertzian fit fH(x)
(black line) had to be as close to 1 as possible and b) fH(contact point) is within the interval
fL(contact point) ± 2σ (in this case, fH(x) represents the Hertzian fit while fL(x) represent the
linear fit (green line) in the non-contact region, σ is the standard deviation from points in
the non-contact region relative to the best linear fit fL(x)). The arrow in the figure points to
the curve that satisfied both conditions. The best fit is then used to determine E and the
contact point. The plot in the lower panel was constructed by averaging the Young‟s
modulus obtained from hundreds of fits separated equal distances from the best contact
point for each of the many force distance curve employed. Thus, the error bars
correspond to the variability of the Young‟s modulus for specific distances from the best
contact point calculated in each force distance curve. In other words, the error bars in the
graph represent the variability of E as a function of the contact point.
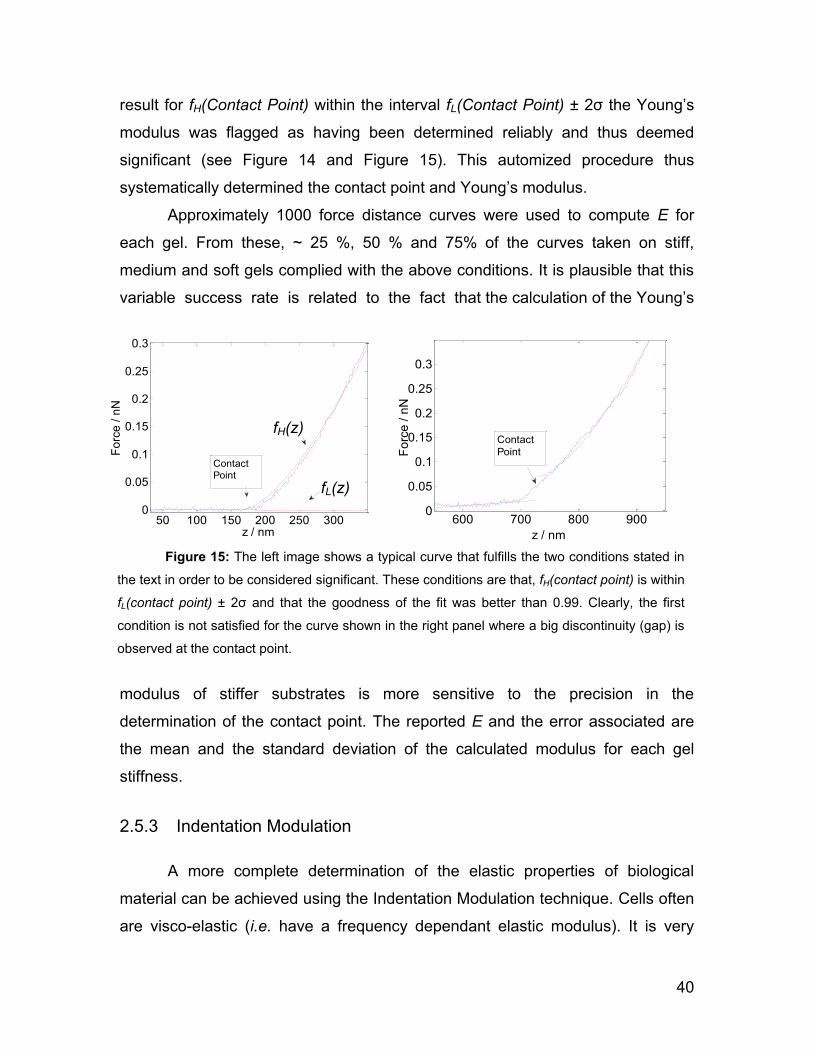
40
result for fH(Contact Point) within the interval fL(Contact Point) ± 2σ the Young‟s
modulus was flagged as having been determined reliably and thus deemed
significant (see Figure 14 and Figure 15). This automized procedure thus
systematically determined the contact point and Young‟s modulus.
Approximately 1000 force distance curves were used to compute E for
each gel. From these, ~ 25 %, 50 % and 75% of the curves taken on stiff,
medium and soft gels complied with the above conditions. It is plausible that this
variable success rate is related to the fact that the calculation of the Young‟s
modulus of stiffer substrates is more sensitive to the precision in the
determination of the contact point. The reported E and the error associated are
the mean and the standard deviation of the calculated modulus for each gel
stiffness.
2.5.3 Indentation Modulation
A more complete determination of the elastic properties of biological
material can be achieved using the Indentation Modulation technique. Cells often
are visco-elastic (i.e. have a frequency dependant elastic modulus). It is very
50 100 150 200 250 3000
0.05
0.1
0.15
0.2
0.25
0.3
z / nm
Fo
rce
/ n
N
Contact
Point
600 700 800 9000
0.05
0.1
0.15
0.2
0.25
0.3
z / nm
Fo
rce
/ n
N
Contact
Point
fH(z)
fL(z)
Figure 15: The left image shows a typical curve that fulfills the two conditions stated in
the text in order to be considered significant. These conditions are that, fH(contact point) is within
fL(contact point) ± 2σ and that the goodness of the fit was better than 0.99. Clearly, the first
condition is not satisfied for the curve shown in the right panel where a big discontinuity (gap) is
observed at the contact point.

41
challenging due to instrumentation limitations to extract visco-elastic properties
from force distance curves as described in the previous section. To implement
the indentation modulation method a sinusoidal signal generated by a lock-in
amplifier (Model SR810, Stanford Research Systems, Inc. Sunnyvale, CA) is fed
into the AFM system. It oscillates the piezo tube of the AFM at a controllable
amplitude and frequency. Consequently, a sinusoidal load is applied to the tested
material through the beaded cantilever. The material response is then detected in
the AFM photodiode output signal. This signal is analyzed with the lock-in
amplifier, which allows a sensitive and quantitative determination of the resultant
cantilever amplitude and phase. For a purely elastic material, the phase
difference will be zero; the demodulated amplitude will be a reflection of the
sample elastic modulus (more precisely the average of the bead-sample elastic
modulus): soft samples will lead to a small cantilever deflection as the bead
„sinks‟ into the sample, whereas stiff samples will lead to a large cantilever
oscillation amplitude. Calculation of the mechanical properties of the sample are
performed by comparing the input and the output signals, including the phase
shift (see inset in Figure 16). The resultant complex modulus (G*) is an imaginary
number, the elastic modulus correspond to the real part of G* and the viscous
modulus (also called loss modulus) correspond to the imaginary part of G*.
When performing the indentation modulation technique, the cantilever
movement before and after the application of the loading oscillation follows the
same pattern as that of the cantilever when regular force-distance curves are
taken (described in Hertz model section). However, in this technique, instead of a
single transient pause of the cantilever movement at the farthest non-contact part
of the cycle, a second pause is introduced at the maximum probe-sample
interaction. This dwelling time is then used to induce the additional oscillatory
load described above. The oscillation amplitude employed in the experimental
procedure was 7 nm in all cases and the dwelling time was 15 - 20s. (see Figure
4)
Since the accurate measurements of the amplitude and phase shift are
essential to calculate the complex modulus, a procedure to correct for phase

42
shifts and amplitude changes due to reasons other than the response of the
sample needs to be performed. Briefly, a hard silicon cantilever with spring
constant of the order of 40 N/m and resonance frequency ~ 300 kHz was driven
towards a rigid glass surface and oscillated at frequencies lower than 1 kHz. The
large difference between the cantilever resonance and the driving frequencies
assures that phase shifts or resonant amplitude enhancement due to the
cantilever resonance do not play any role in the induced cantilever oscillation.
The measured output is only a consequence of the drive input signal. In addition,
the rigidity of the cantilever and the high elastic constant (stiffness) of the glass
substrate allows one to make the assumption that any movement of the piezo
tube is instantaneously followed by the cantilever. Ideally, no difference in phase
and amplitude between the input and output signals are expected. However,
experimental results show a deviation from this expectation (Figure 16). Due to
non-linearities in the z-piezo, the cantilever, the photodetector and the lock-in
amplifier, the difference between the measured cantilever response and the
driving signal is not zero. Data acquired during the experiments on cells must be
corrected for this small deviation.
Strong attenuation of the amplitude and significant phase shifts are also
observed at frequencies lower than 5 Hz. Such changes in amplitude and phase
are attributed to ac coupling of the lock-in amplifier at low frequencies. The data
presented in this thesis was acquired at 10 Hz where no large amplitude and
phase changes were observed. Thus, attenuation at low frequencies was not a
limiting factors but correction of the data was performed as well. The selection of
10 Hz for the experimental procedure was mainly done because low rather than
the high frequencies are relevant for several physiological and cellular
processes. For instance, the beats produced by the muscle of the heart can go
from ~1 Hz at rest to ~3 Hz when exercising (Robert A. Robergs, 2002) and the
breathing frequencies are lower than 0.5 Hz in any exercising condition (Tortora,
1990). At the intracellular level, molecular motors that generate muscle
contraction such as myosin move along the actin filaments at a step rate of ~12
Hz (Pierobon et al., 2009).
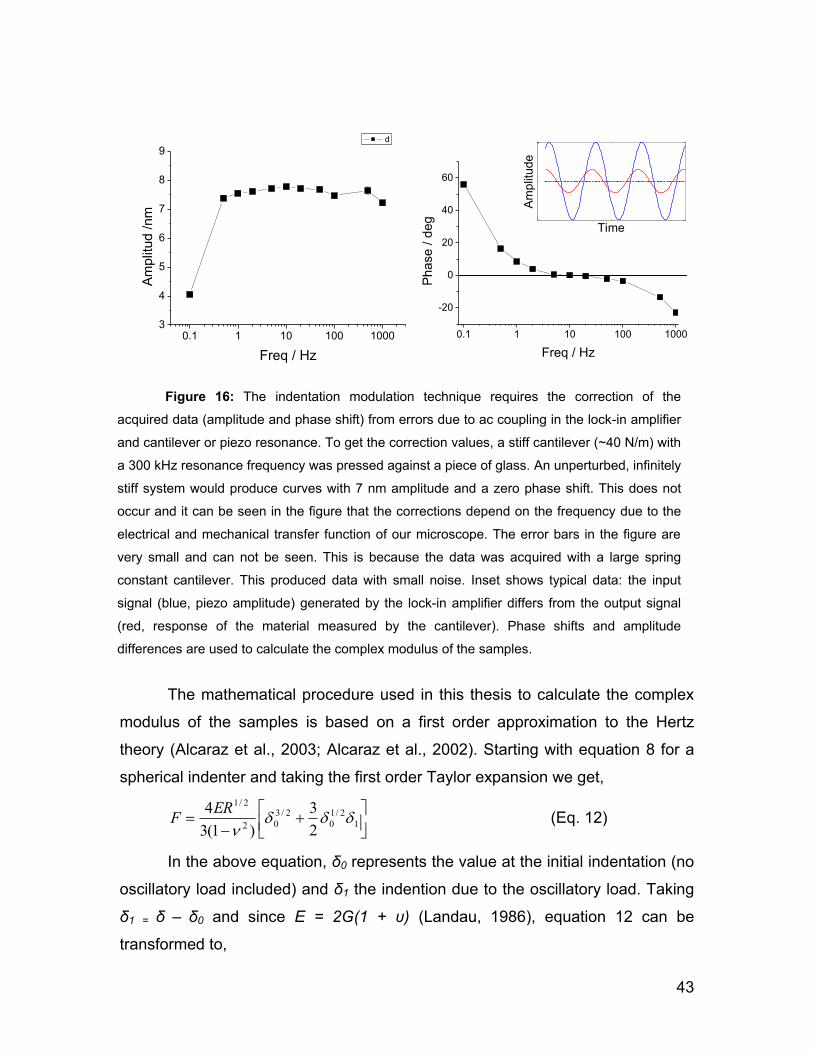
43
The mathematical procedure used in this thesis to calculate the complex
modulus of the samples is based on a first order approximation to the Hertz
theory (Alcaraz et al., 2003; Alcaraz et al., 2002). Starting with equation 8 for a
spherical indenter and taking the first order Taylor expansion we get,
1
2/1
0
2/3
02
2/1
2
3
)1(3
4
ERF (Eq. 12)
In the above equation, δ0 represents the value at the initial indentation (no
oscillatory load included) and δ1 the indention due to the oscillatory load. Taking
δ1 = δ – δ0 and since E = 2G(1 + υ) (Landau, 1986), equation 12 can be
transformed to,
0.1 1 10 100 10003
4
5
6
7
8
9A
mplit
ud /nm
Freq / Hz
d
0.1 1 10 100 1000
-20
0
20
40
60
Ph
ase
/ d
eg
Freq / Hz
PDeg
Time
Am
plit
ude
Figure 16: The indentation modulation technique requires the correction of the
acquired data (amplitude and phase shift) from errors due to ac coupling in the lock-in amplifier
and cantilever or piezo resonance. To get the correction values, a stiff cantilever (~40 N/m) with
a 300 kHz resonance frequency was pressed against a piece of glass. An unperturbed, infinitely
stiff system would produce curves with 7 nm amplitude and a zero phase shift. This does not
occur and it can be seen in the figure that the corrections depend on the frequency due to the
electrical and mechanical transfer function of our microscope. The error bars in the figure are
very small and can not be seen. This is because the data was acquired with a large spring
constant cantilever. This produced data with small noise. Inset shows typical data: the input
signal (blue, piezo amplitude) generated by the lock-in amplifier differs from the output signal
(red, response of the material measured by the cantilever). Phase shifts and amplitude
differences are used to calculate the complex modulus of the samples.
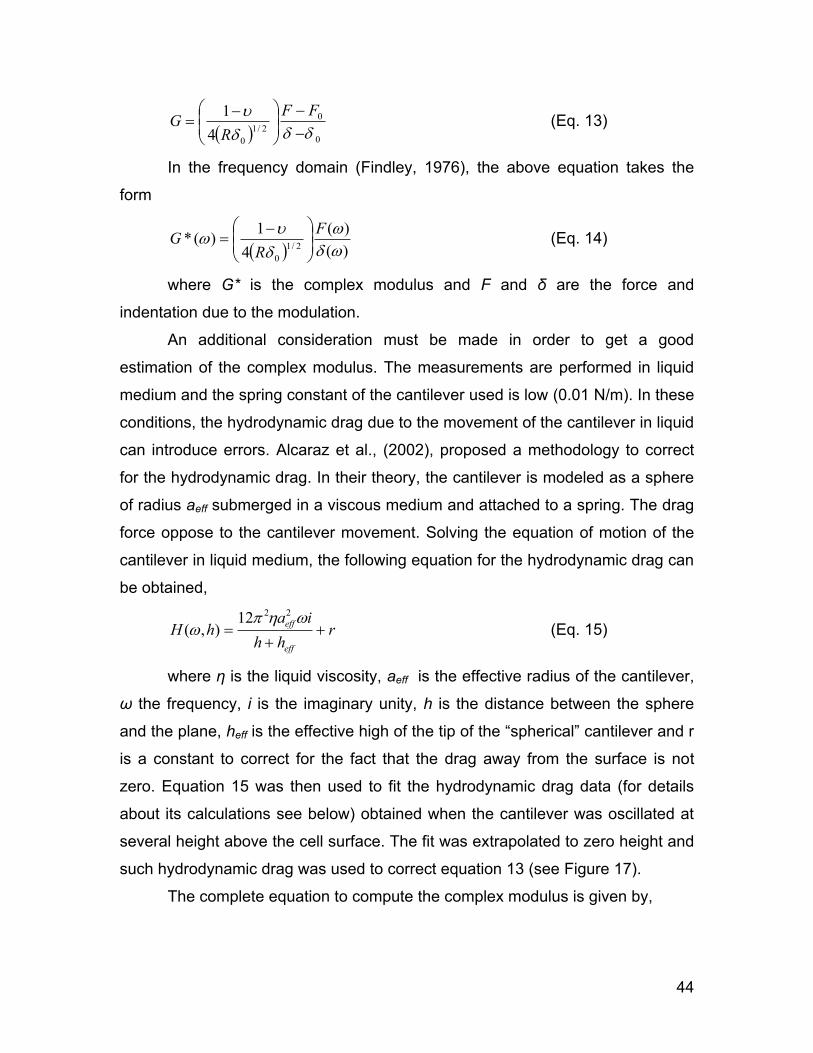
44
0
0
2/1
04
1
FF
RG (Eq. 13)
In the frequency domain (Findley, 1976), the above equation takes the
form
)(
)(
4
1)(*
2/1
0
F
RG
(Eq. 14)
where G* is the complex modulus and F and δ are the force and
indentation due to the modulation.
An additional consideration must be made in order to get a good
estimation of the complex modulus. The measurements are performed in liquid
medium and the spring constant of the cantilever used is low (0.01 N/m). In these
conditions, the hydrodynamic drag due to the movement of the cantilever in liquid
can introduce errors. Alcaraz et al., (2002), proposed a methodology to correct
for the hydrodynamic drag. In their theory, the cantilever is modeled as a sphere
of radius aeff submerged in a viscous medium and attached to a spring. The drag
force oppose to the cantilever movement. Solving the equation of motion of the
cantilever in liquid medium, the following equation for the hydrodynamic drag can
be obtained,
rhh
iahH
eff
eff
2212),( (Eq. 15)
where η is the liquid viscosity, aeff is the effective radius of the cantilever,
ω the frequency, i is the imaginary unity, h is the distance between the sphere
and the plane, heff is the effective high of the tip of the “spherical” cantilever and r
is a constant to correct for the fact that the drag away from the surface is not
zero. Equation 15 was then used to fit the hydrodynamic drag data (for details
about its calculations see below) obtained when the cantilever was oscillated at
several height above the cell surface. The fit was extrapolated to zero height and
such hydrodynamic drag was used to correct equation 13 (see Figure 17).
The complete equation to compute the complex modulus is given by,

45
)0,(
)(
)(
4
1)(*
2/1
0
H
F
RG (Eq. 16)
F(ω) and δ(ω) are measured experimentally. Since F is the Fourier
transform of the force experienced by the cantilever due to the oscillation, it can
be calculated using the equation F = k*z where z is calculated from the amplitude
and phase shift acquired with the lock-in amplifier (x = Aeiθ). The denominator δ
is calculated by subtracting x from the driving amplitude introduced by the
piezoelectric tube (in our experiments this was always 7 nm). δo represent the
initial indentation (before the oscillation is applied) and can be obtained from the
force-distance curves (see Figure 12). H is determined from data fitted to
equation 15 and extrapolated to zero height, i.e. contact (see Figure 17).
The noise in the amplitude and the phase measured by the lock-in
amplifier outputs lead to an associated uncertainty in the calculated G* value. As
a general rule, the amplitude and phase were calculated by averaging the last ~
5 s of the data collected from the lock-in amplifier outputs and thus only the
curves that showed a plateau at the end of the curve (see Figure 18) were
0.0 0.2 0.4 0.6 0.8 1.0 1.2 1.4 1.6 1.8 2.0
0.100
0.105
0.110
0.115
0.120
0.125
0.130
0.135 Data: Drag_G''
Model: Rational4
Chi^2 = 2.5758E-7
R^2 = 0.99749
a 1.50001 ±481433.48726
b 0.08947 ±43073.40999
c 0.07157 ±0.00129H/k
2
Hight / m
G''
Figure 17: A typical curve used to estimate the hydrodynamic drag at zero height
is shown in the figure. Equation 15 was used to fit the data and then extrapolated to zero.
This value was subtracted from the F(ω)/δ(ω) in equation 14
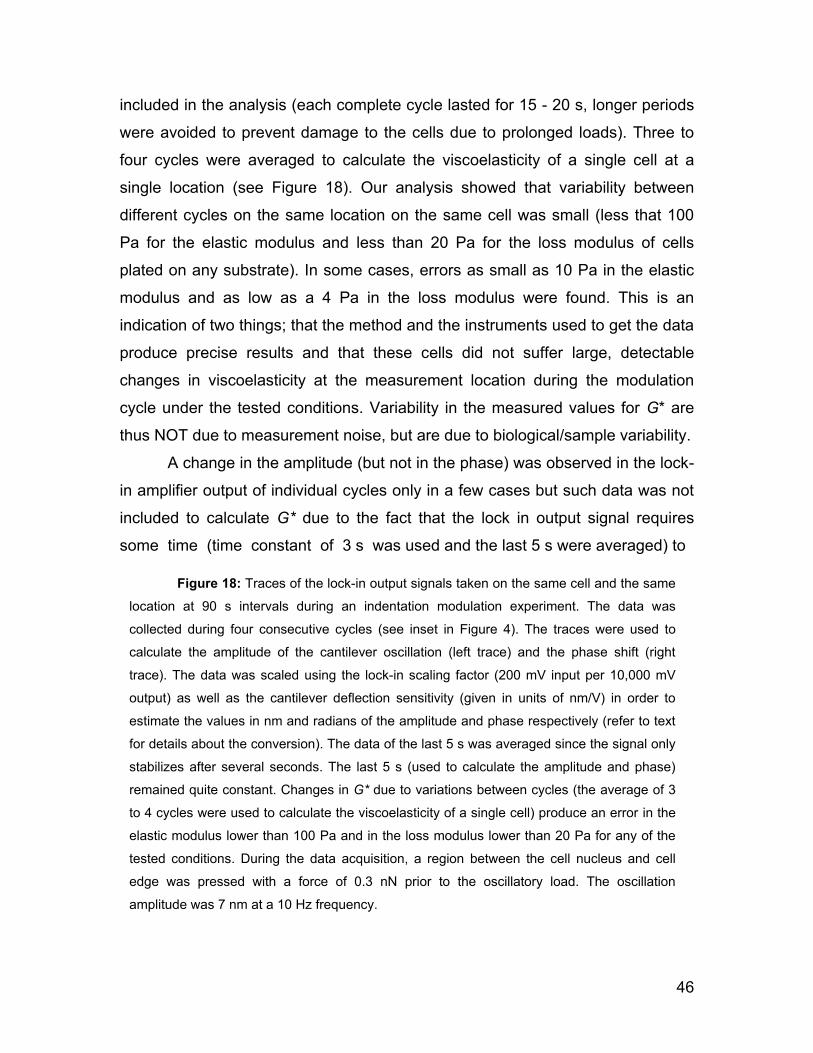
46
included in the analysis (each complete cycle lasted for 15 - 20 s, longer periods
were avoided to prevent damage to the cells due to prolonged loads). Three to
four cycles were averaged to calculate the viscoelasticity of a single cell at a
single location (see Figure 18). Our analysis showed that variability between
different cycles on the same location on the same cell was small (less that 100
Pa for the elastic modulus and less than 20 Pa for the loss modulus of cells
plated on any substrate). In some cases, errors as small as 10 Pa in the elastic
modulus and as low as a 4 Pa in the loss modulus were found. This is an
indication of two things; that the method and the instruments used to get the data
produce precise results and that these cells did not suffer large, detectable
changes in viscoelasticity at the measurement location during the modulation
cycle under the tested conditions. Variability in the measured values for G* are
thus NOT due to measurement noise, but are due to biological/sample variability.
A change in the amplitude (but not in the phase) was observed in the lock-
in amplifier output of individual cycles only in a few cases but such data was not
included to calculate G* due to the fact that the lock in output signal requires
some time (time constant of 3 s was used and the last 5 s were averaged) to
Figure 18: Traces of the lock-in output signals taken on the same cell and the same
location at 90 s intervals during an indentation modulation experiment. The data was
collected during four consecutive cycles (see inset in Figure 4). The traces were used to
calculate the amplitude of the cantilever oscillation (left trace) and the phase shift (right
trace). The data was scaled using the lock-in scaling factor (200 mV input per 10,000 mV
output) as well as the cantilever deflection sensitivity (given in units of nm/V) in order to
estimate the values in nm and radians of the amplitude and phase respectively (refer to text
for details about the conversion). The data of the last 5 s was averaged since the signal only
stabilizes after several seconds. The last 5 s (used to calculate the amplitude and phase)
remained quite constant. Changes in G* due to variations between cycles (the average of 3
to 4 cycles were used to calculate the viscoelasticity of a single cell) produce an error in the
elastic modulus lower than 100 Pa and in the loss modulus lower than 20 Pa for any of the
tested conditions. During the data acquisition, a region between the cell nucleus and cell
edge was pressed with a force of 0.3 nN prior to the oscillatory load. The oscillation
amplitude was 7 nm at a 10 Hz frequency.

47
0 5 10 15 20 25 30 35
-2000
-1000
0
1000
2000
3000
4000
5000
time / s
lock-in o
utp
ut
/ m
V
0 5 10 15 20 25 30 35
-2000
-1000
0
1000
2000
3000
4000
5000
time / s
lock-in o
utp
ut
/ m
V
0 5 10 15 20 25 30 35
-2000
-1000
0
1000
2000
3000
4000
5000
time / s
lock-in o
utp
ut
/ m
V
0 5 10 15 20 25 30 35
-2000
-1000
0
1000
2000
3000
4000
5000
time / s
lock-in o
utp
ut
/ m
V
0 5 10 15 0 5 10 15
time / s time / s
180 sec
270 sec
90 sec
0 sec

48
settle. Thus, if the input signal changes on time scales comparable to the lock-in
amplifier time constant, the lock-in amplifier output signal is not a reliable
measure of the input amplitude.
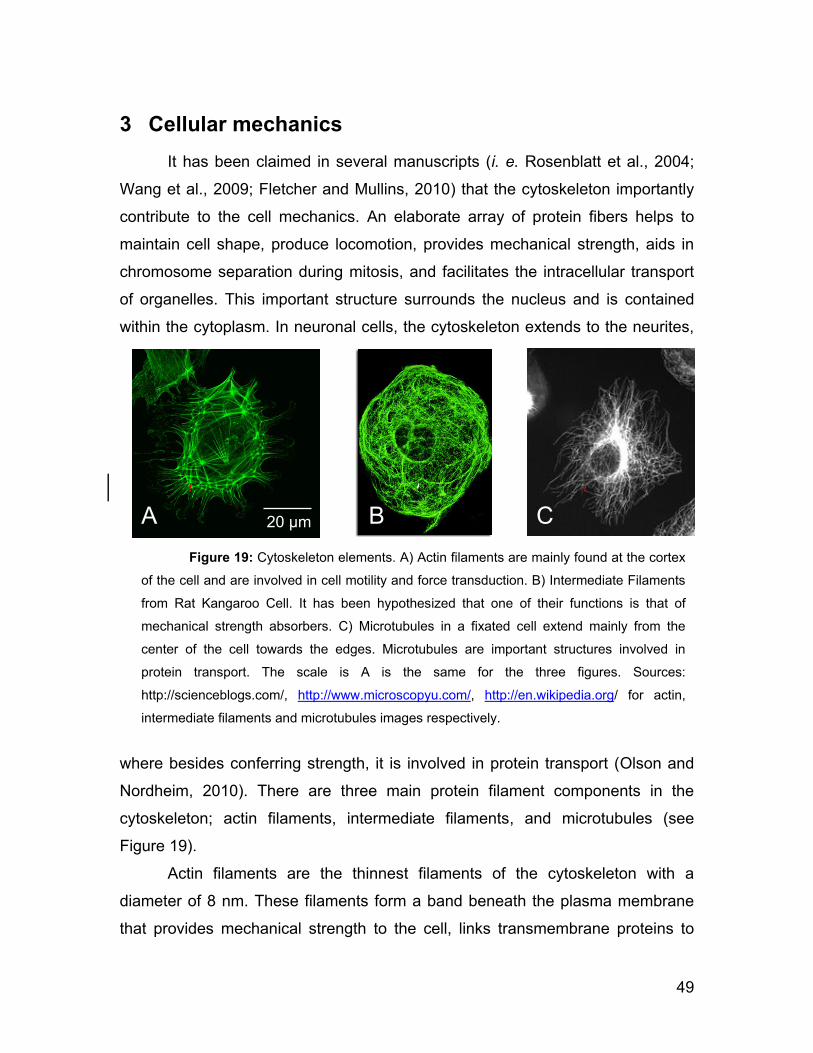
49
3 Cellular mechanics
It has been claimed in several manuscripts (i. e. Rosenblatt et al., 2004;
Wang et al., 2009; Fletcher and Mullins, 2010) that the cytoskeleton importantly
contribute to the cell mechanics. An elaborate array of protein fibers helps to
maintain cell shape, produce locomotion, provides mechanical strength, aids in
chromosome separation during mitosis, and facilitates the intracellular transport
of organelles. This important structure surrounds the nucleus and is contained
within the cytoplasm. In neuronal cells, the cytoskeleton extends to the neurites,
where besides conferring strength, it is involved in protein transport (Olson and
Nordheim, 2010). There are three main protein filament components in the
cytoskeleton; actin filaments, intermediate filaments, and microtubules (see
Figure 19).
Actin filaments are the thinnest filaments of the cytoskeleton with a
diameter of 8 nm. These filaments form a band beneath the plasma membrane
that provides mechanical strength to the cell, links transmembrane proteins to
A
A
A
B
A
C 20 μm
Figure 19: Cytoskeleton elements. A) Actin filaments are mainly found at the cortex
of the cell and are involved in cell motility and force transduction. B) Intermediate Filaments
from Rat Kangaroo Cell. It has been hypothesized that one of their functions is that of
mechanical strength absorbers. C) Microtubules in a fixated cell extend mainly from the
center of the cell towards the edges. Microtubules are important structures involved in
protein transport. The scale is A is the same for the three figures. Sources:
http://scienceblogs.com/, http://www.microscopyu.com/, http://en.wikipedia.org/ for actin,
intermediate filaments and microtubules images respectively.
50
cytoplasmic proteins, generates locomotion of cells and interacts with myosin
filaments to provide the force of muscular contraction. Actin filaments are flexible
and relatively strong (Carlier, 1990).
In cells, actin is mainly found in two forms: monomeric (or globular) and
filamentous actin (polymerized actin). The dynamic equilibrium between the two
forms is controlled by a variety of factors that are typically only found associated
with membranes and that ensure that the nucleation of new filaments occurs
mainly from preexisting filaments growing towards the membrane (Bailly et al.,
1999; Svitkina and Borisy, 1999; Pollard et al., 2000). Activation of cell surface
receptors generate signals that lead to the nucleation of actin on one side, while
at the opposite end, hydrolysis of ATP bound to polymerized actin followed by
phosphate dissociation marks older filaments for depolymerization.
Depolymerized actin is then recycled and returned to the pool of unpolymerized
monomers (Pollard et al., 2000).
Actin filaments are a central structural feature of all muscle tissue.
Controlled polymerization of branched networks of actin filaments produces force
for cell motility. The structural and dynamic properties of actin depend, at least in
part, on the form in which it is found in the cell (monomeric or filamentous)
(Pfaendtner et al., 2010). Even more, newly formed F-ADP-Pi-actin filaments are
more rigid than “old” F-ADP-actin filaments, a fact that could have implications in
actin-driven motility processes (Carlier, 1990; Isambert et al., 1995).
Intermediate filaments (IFs), another important component of the
cytoskeleton, constitute a major structural element of animal cells. Their major
function is assumed to be an integrating device for the entire cytoskeleton
(Kreplak et al., 2005).
There are several types of intermediate filament, each constructed from
one or more specific proteins. Keratins, for instance, are found in epithelial cells
and also form hair and nails; nuclear lamins form a meshwork that stabilizes the
inner membrane of the nuclear envelope; neurofilaments strengthen the long
axons of neurons and vimentins provide mechanical strength to muscle cells.
Despite their chemical diversity, intermediate filaments, in conjunction with
51
associated proteins, play similar roles in the cell providing a supporting
framework within the cell (Herrmann et al., 2007).
In vitro assembly of both recombinant and authentic IF proteins produced
smooth-looking, flexible filaments by electron microscopy (EM) and Atomic Force
Microscope (AFM). These fibers average 10 nm in diameter although estimation
of their thickness varied among fixed and unfixed samples (Mücke et al., 2004;
Mücke et al., 2005). Nanomechanical experiments with the AFM have
demonstrated that IFs are characterized by a high propensity to withstand both
tensile and bending stress (Kreplak et al., 2005; Kreplak and Fudge, 2007). In
the cytoskeleton, IFs seem to work synergistically with the actin filaments and MT
networks.
Finally, the microtubules are the third type of filaments that form the
cytoskeleton. Well known functions of the microtubules include, cell transport and
cell division in all eukaryotes (Nogales, 2003). During cell division, a large
dynamic array of MTs, called the mitotic spindle, functions to physically
segregate the chromosomes and to orient the plane of cleavage. In nondividing
cells, MTs organize the cytoplasm, position the nucleus and organelles, and
serve as the principal structural element of flagella and cilia (Desai and
Mitchison, 2003). MTs are composed of repeating tubulin heterodimers and are
present in all eukaryotes.
MTs are highly dynamic and can switch stochastically between growing
and shrinking phases, both in vivo and in vitro. This nonequilibrium behavior is
known as dynamic instability (Nogales, 2003). Possible functions of this instability
include; allowing newly formed regions of cytoplasm to rapidly fill with MTs which,
in turn, facilitate recruitment of membrane proteins through the MT transport
system (Tanaka and Kirschner, 1991). The rapid remodeling of the MT mesh
allows a more efficient three-dimensional exploration than equilibrium
polymerization would permit, thereby enabling MTs to find specific target sites
within the cell (Desai and Mitchison, 2003).
It has been shown that intracellular microtubules bear large-scale
compressive loads from a variety of physiological forces (i.e. active viscoelastic
52
flow of the cytoplasm generates a slowly evolving stress field) that can cause
both longitudinal compression and transverse shear stresses, depending on the
details of the local stress field. Besides its intrinsic mechanical properties, MT
resistance to compression is increased in vivo due to IFs reinforcement. In turn,
the IFs ability to bend is reduced by the MT (Brangwynne et al., 2006).
Although polymers of the cytoskeleton are made of distinct subunits and
differ in their properties, all those fibers are intricately linked together and interact
specifically or nonspecifically with each other and other cellular components
(Brangwynne et al., 2006). The resultant cytoskeletal organization ultimately
plays an important role in transmitting compressive and tensile stresses and in
sensing the mechanics of the microenvironment (Janmey and McCulloch, 2007).
Interconnectivity creates continuous mechanical coupling through the
cytoskeleton, which result in the distribution of internal and/or external forces
throughout the cell.
One of the subjects studied in this thesis is the impact of a non rigid elastic
substrate in cell mechanics. This is relevant because the live organisms, plants,
animals and even bacteria are subject to a wide range of mechanical stress.
Humans for example, due to their high mobility, have developed mechanisms to
exert contractile forces that facilitate their displacement and limb motion. Other
not controlled movements occur in the intestine and while breathing. At a
microscopic level, it has been described that during inflammation, many immune
system cells that normally move in the capillaries adhere to the walls and migrate
towards the source of the inflammation. When adhered and before migration,
shear stresses are applied on the cell surface due to the continuous movement
of the blood in the clear of the capillary. While migrating, compressive loads that
arise from their movement trough the small gaps that open between adjacent
epithelial cells are exerted on the immune cells. Similarly, breathing and bone
compression during movement are compressive and relaxation cycling
processes that occurs all the time. The rhythmic beat of the heart is another
example that shows the relevance of the mechanics of tissue. In muscle cells,
very specialized structures called sarcomeres allow the movement of limbs and
53
application of large forces. In disease, it is now known that the cancer cell
mechanics differ from normal in addition to other cell characteristics such as cell
growth, morphology, cell–cell interaction, organization of cytoskeleton, and
interactions with the extracellular matrix (Sokolov, 2007). Airway smooth muscle
cells (AMSC) of asthmatic patients are more susceptible to contract when a
stimulus appear (Jonas and Duschl, 2010; Shore, 2004).
In asthmatics, an increase in smooth-muscle mass is observed which in
turn increases the contractile capacities of the airways. New findings show that
the shortening velocities as well as the shortening capacities of ASMC of
asthmatics are larger than that of cell from healthy people. mRNA expression
and activity of myosin light-chain–kinase in the airway smooth muscle of patients
with asthma was also determined and appears higher in asthmatic cells which
could account for the increased velocity of shortening (Shore, 2004).
In dystrophin-deficient rat models, cultured myotubes were only one-fourth
as stiff as normal cells (Pasternak et al., 1995). In osteoarthritis, cartilage
chondrocytes display large viscoelastic moduli compared to cells from normal
tissue (Farshid, 2000) and erythrocytes from patients with sickle cell disease (a
type of anemia) are stiffer and more viscous than normal red blood cells (Nash et
al., 1984). Thus, development of new approaches to reliable and fast
measurement of the cell mechanics could potentially have an impact in
diagnostics and the determination of the efficacy of therapeutics.
3.1 Methods to measure mechanical properties of cells
Several methods are used to study the mechanics of the cells. Optical
tweezers have been used to test the mechanical properties of the filaments that
form part of the cytoskeleton (see Figure 20; Footer et al., 2007, Liu and et al.,
2005). However this method generally requires the isolation of individual
filaments that are not part of a complete cell anymore. The technique relies in the
optical trapping of a dielectric bead in a highly focused laser beam. The
narrowest point of the focused beam contains a very strong electric field gradient.
This tool can be used to measure small forces applied to the bead. For instance,
54
Simmons, (1993) have used an optical tweezers to measure or exert a force on
single actin filaments. Beads were attached to rhodamine phalloidin labelled actin
filaments and observed to move on a heavy meromyosin coated surface in the
presence of ATP. The force needed to stop the movement of a trapped bead was
assessed. Magnetic twisting cytometry (MTC) and glass needles can be used to
test the mechanics of living cells but the first relies in the interaction between
generally a type of integrin and its counterpart on the beads surface to promote
adhesion (see Figure 20; Fabry et al., 2001). Thus, measured elastic properties
are intrinsically related to the type of ligand or integrin at which the coated bead
attached. In this case, a magnetic bead is dropped into the cell culture and
twisting forces are applied by varying the direction of an external magnetic field.
Viscoelastic properties of human ASMC have been measured with this technique
by Fabry et al., 2001. In that study, they report that the stability of the
cytoskeleton in closely linked to the so called effective noise temperature, a
measured that arises from the fit of the measured viscoelastic properties at
several frequencies to a power law.
Similar analysis performed by Smith et al., 2005confirmed this finding.
However, a limitation of the MTC technique arises due to the fact that the
location of the beads-cell contact is random and the collection of beads are
distributed over the entire cell preventing measurements on specific sites on the
cell or avoiding locations that are close to the edges where the cell thickness is
small and contribution due to the substrate under the cell can lead to
uncertainties. In addition, the beads are usually attached to focal adhesion points
and thus directly interact with the cytoskeleton limiting measurements away from
focal adhesion points. Generally speaking, these methods neither have control
on the position of the bead-membrane contact resulting in beads that are
distributed over the entire cell.
The glass needle technique, although it can be used to test the mechanics
of the cells, does not allow to test the mechanics of the cells at very low force
interactions and is thus only suitable for stiff cells.
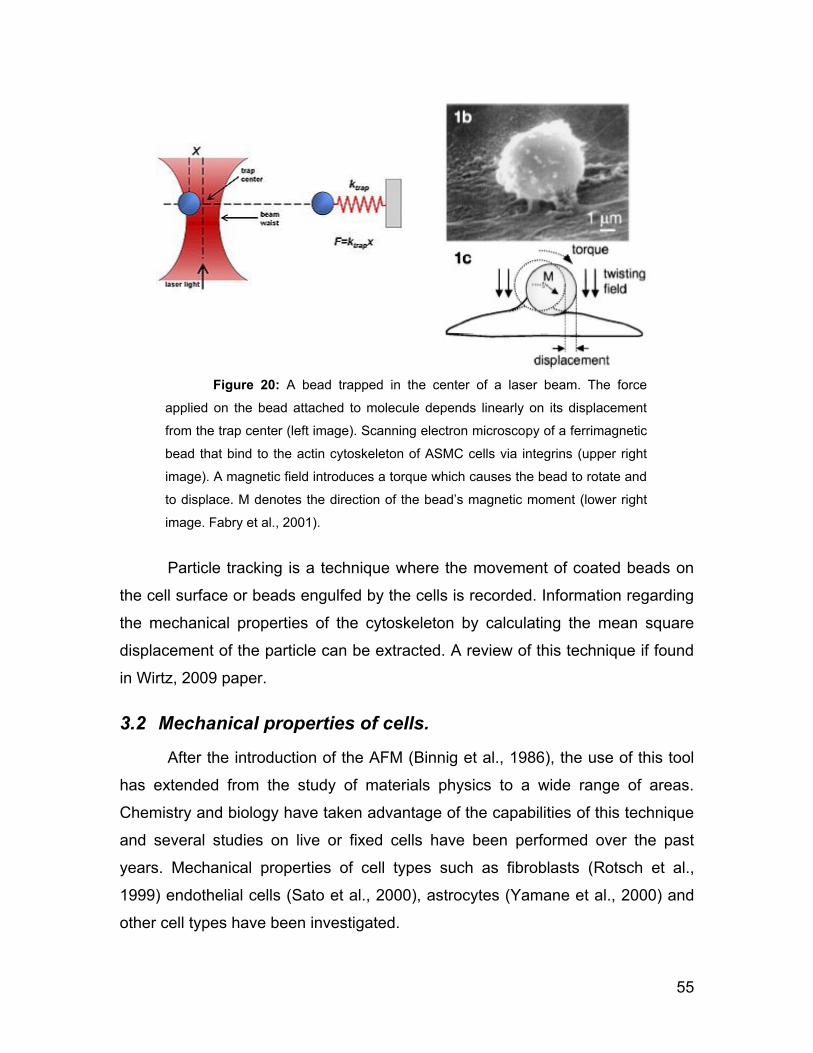
55
Particle tracking is a technique where the movement of coated beads on
the cell surface or beads engulfed by the cells is recorded. Information regarding
the mechanical properties of the cytoskeleton by calculating the mean square
displacement of the particle can be extracted. A review of this technique if found
in Wirtz, 2009 paper.
3.2 Mechanical properties of cells.
After the introduction of the AFM (Binnig et al., 1986), the use of this tool
has extended from the study of materials physics to a wide range of areas.
Chemistry and biology have taken advantage of the capabilities of this technique
and several studies on live or fixed cells have been performed over the past
years. Mechanical properties of cell types such as fibroblasts (Rotsch et al.,
1999) endothelial cells (Sato et al., 2000), astrocytes (Yamane et al., 2000) and
other cell types have been investigated.
Figure 20: A bead trapped in the center of a laser beam. The force
applied on the bead attached to molecule depends linearly on its displacement
from the trap center (left image). Scanning electron microscopy of a ferrimagnetic
bead that bind to the actin cytoskeleton of ASMC cells via integrins (upper right
image). A magnetic field introduces a torque which causes the bead to rotate and
to displace. M denotes the direction of the bead‟s magnetic moment (lower right
image. Fabry et al., 2001).
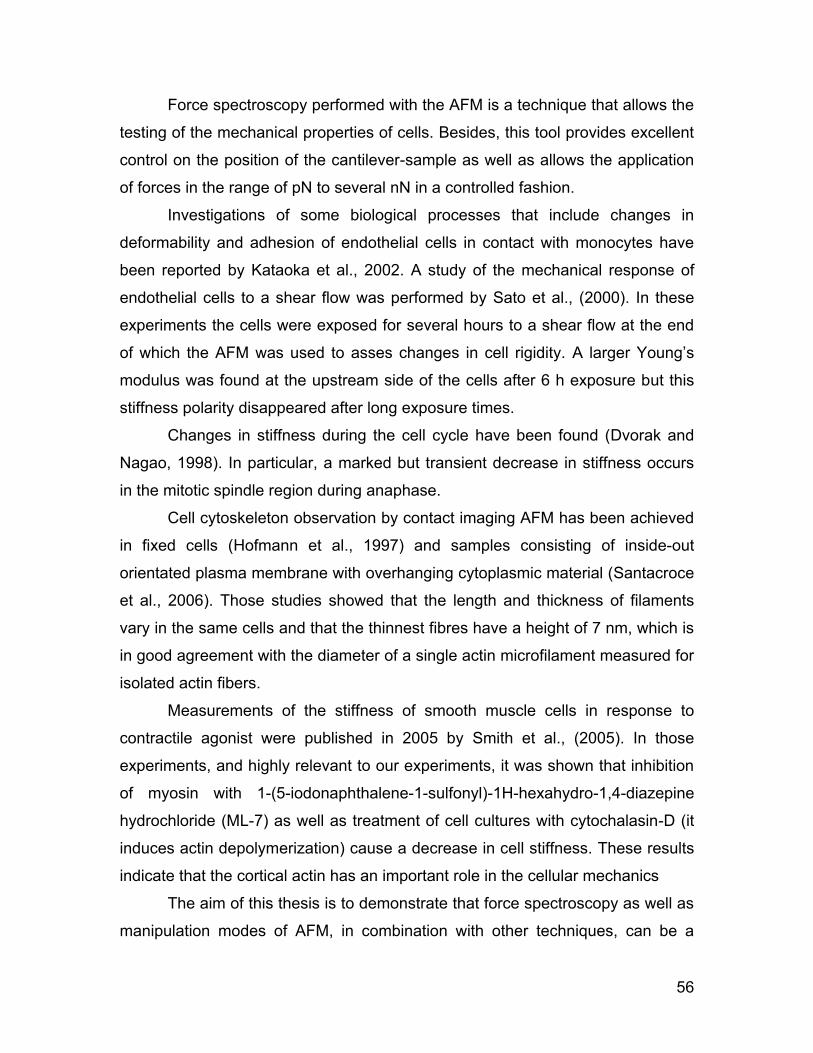
56
Force spectroscopy performed with the AFM is a technique that allows the
testing of the mechanical properties of cells. Besides, this tool provides excellent
control on the position of the cantilever-sample as well as allows the application
of forces in the range of pN to several nN in a controlled fashion.
Investigations of some biological processes that include changes in
deformability and adhesion of endothelial cells in contact with monocytes have
been reported by Kataoka et al., 2002. A study of the mechanical response of
endothelial cells to a shear flow was performed by Sato et al., (2000). In these
experiments the cells were exposed for several hours to a shear flow at the end
of which the AFM was used to asses changes in cell rigidity. A larger Young‟s
modulus was found at the upstream side of the cells after 6 h exposure but this
stiffness polarity disappeared after long exposure times.
Changes in stiffness during the cell cycle have been found (Dvorak and
Nagao, 1998). In particular, a marked but transient decrease in stiffness occurs
in the mitotic spindle region during anaphase.
Cell cytoskeleton observation by contact imaging AFM has been achieved
in fixed cells (Hofmann et al., 1997) and samples consisting of inside-out
orientated plasma membrane with overhanging cytoplasmic material (Santacroce
et al., 2006). Those studies showed that the length and thickness of filaments
vary in the same cells and that the thinnest fibres have a height of 7 nm, which is
in good agreement with the diameter of a single actin microfilament measured for
isolated actin fibers.
Measurements of the stiffness of smooth muscle cells in response to
contractile agonist were published in 2005 by Smith et al., (2005). In those
experiments, and highly relevant to our experiments, it was shown that inhibition
of myosin with 1-(5-iodonaphthalene-1-sulfonyl)-1H-hexahydro-1,4-diazepine
hydrochloride (ML-7) as well as treatment of cell cultures with cytochalasin-D (it
induces actin depolymerization) cause a decrease in cell stiffness. These results
indicate that the cortical actin has an important role in the cellular mechanics
The aim of this thesis is to demonstrate that force spectroscopy as well as
manipulation modes of AFM, in combination with other techniques, can be a

57
powerful new tool that can help to understand biological systems. We
demonstrate that AFM can be used to measure mechanical properties of cells
and substrates and can be used in novel ways using manipulation modes to
study biological interactions. Comprehensively answering biological questions is
beyond the scope of this thesis, but it will (and already has) stimulated the use of
these techniques to answer interesting, fundamental questions in biology
(Meakins Christie Chest Hospital, lab of James Martin; Montreal Neurological
Institute, labs of David Colman and Timothy Kennedy).
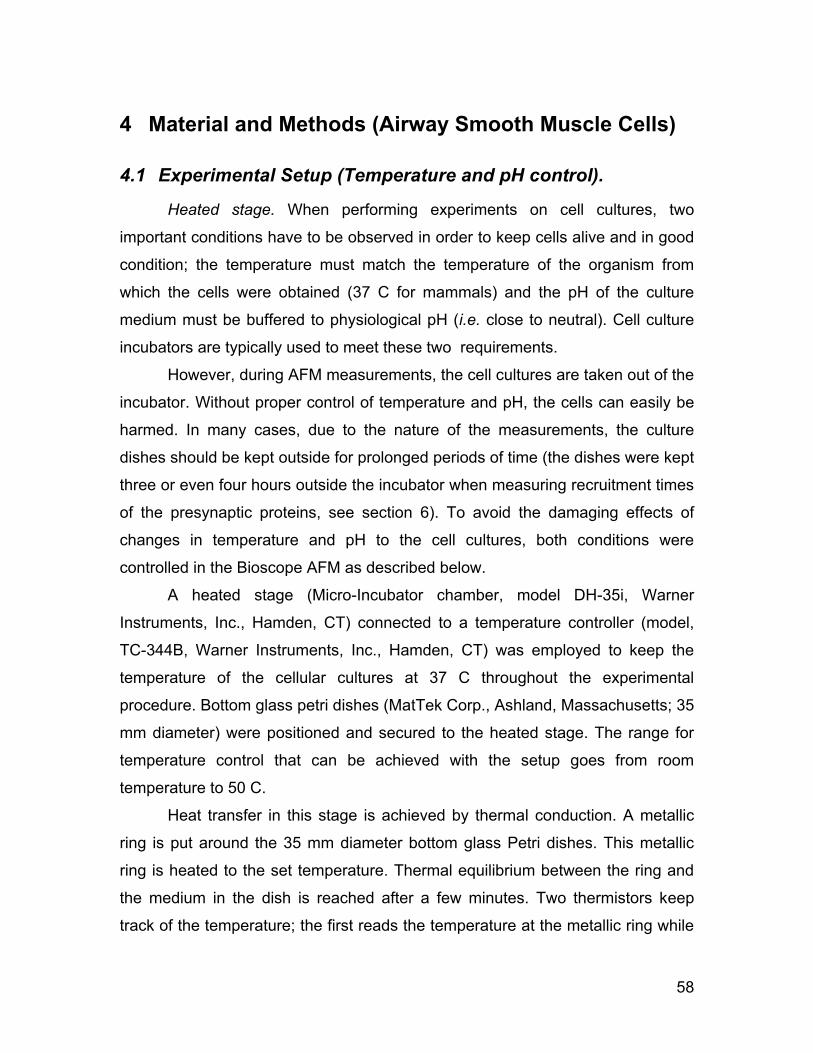
58
4 Material and Methods (Airway Smooth Muscle Cells)
4.1 Experimental Setup (Temperature and pH control).
Heated stage. When performing experiments on cell cultures, two
important conditions have to be observed in order to keep cells alive and in good
condition; the temperature must match the temperature of the organism from
which the cells were obtained (37 C for mammals) and the pH of the culture
medium must be buffered to physiological pH (i.e. close to neutral). Cell culture
incubators are typically used to meet these two requirements.
However, during AFM measurements, the cell cultures are taken out of the
incubator. Without proper control of temperature and pH, the cells can easily be
harmed. In many cases, due to the nature of the measurements, the culture
dishes should be kept outside for prolonged periods of time (the dishes were kept
three or even four hours outside the incubator when measuring recruitment times
of the presynaptic proteins, see section 6). To avoid the damaging effects of
changes in temperature and pH to the cell cultures, both conditions were
controlled in the Bioscope AFM as described below.
A heated stage (Micro-Incubator chamber, model DH-35i, Warner
Instruments, Inc., Hamden, CT) connected to a temperature controller (model,
TC-344B, Warner Instruments, Inc., Hamden, CT) was employed to keep the
temperature of the cellular cultures at 37 C throughout the experimental
procedure. Bottom glass petri dishes (MatTek Corp., Ashland, Massachusetts; 35
mm diameter) were positioned and secured to the heated stage. The range for
temperature control that can be achieved with the setup goes from room
temperature to 50 C.
Heat transfer in this stage is achieved by thermal conduction. A metallic
ring is put around the 35 mm diameter bottom glass Petri dishes. This metallic
ring is heated to the set temperature. Thermal equilibrium between the ring and
the medium in the dish is reached after a few minutes. Two thermistors keep
track of the temperature; the first reads the temperature at the metallic ring while
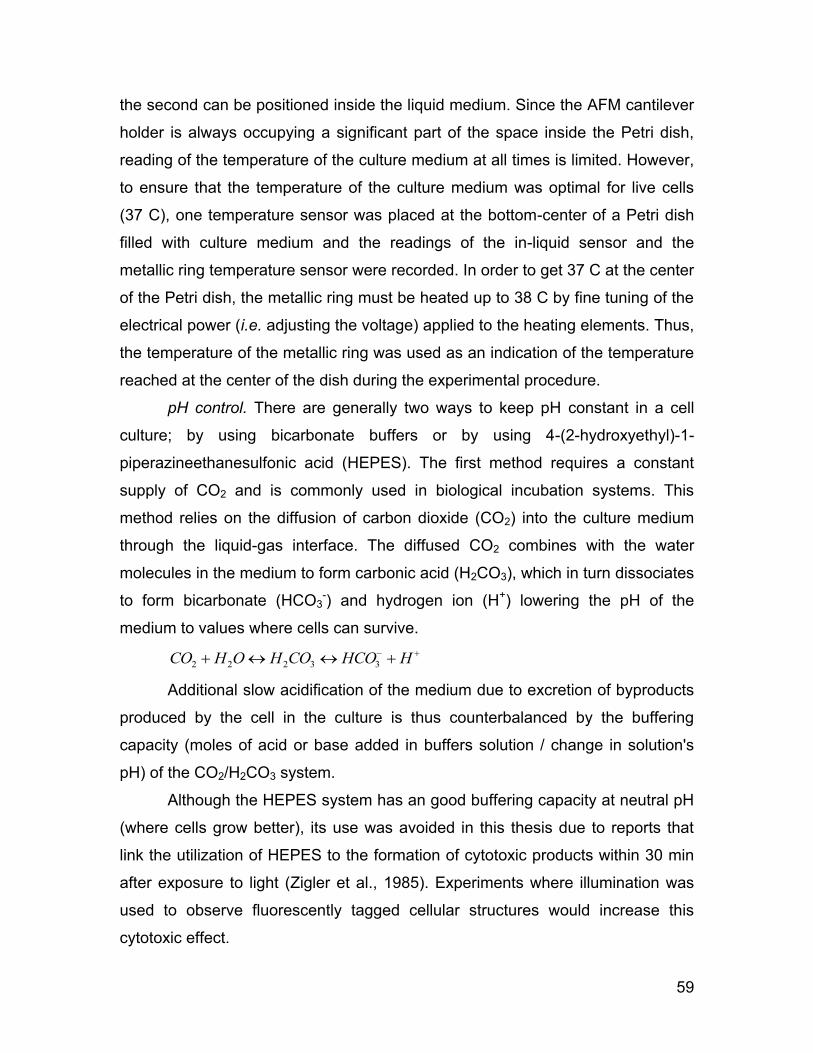
59
the second can be positioned inside the liquid medium. Since the AFM cantilever
holder is always occupying a significant part of the space inside the Petri dish,
reading of the temperature of the culture medium at all times is limited. However,
to ensure that the temperature of the culture medium was optimal for live cells
(37 C), one temperature sensor was placed at the bottom-center of a Petri dish
filled with culture medium and the readings of the in-liquid sensor and the
metallic ring temperature sensor were recorded. In order to get 37 C at the center
of the Petri dish, the metallic ring must be heated up to 38 C by fine tuning of the
electrical power (i.e. adjusting the voltage) applied to the heating elements. Thus,
the temperature of the metallic ring was used as an indication of the temperature
reached at the center of the dish during the experimental procedure.
pH control. There are generally two ways to keep pH constant in a cell
culture; by using bicarbonate buffers or by using 4-(2-hydroxyethyl)-1-
piperazineethanesulfonic acid (HEPES). The first method requires a constant
supply of CO2 and is commonly used in biological incubation systems. This
method relies on the diffusion of carbon dioxide (CO2) into the culture medium
through the liquid-gas interface. The diffused CO2 combines with the water
molecules in the medium to form carbonic acid (H2CO3), which in turn dissociates
to form bicarbonate (HCO3-) and hydrogen ion (H+) lowering the pH of the
medium to values where cells can survive.
HHCOCOHOHCO 33222
Additional slow acidification of the medium due to excretion of byproducts
produced by the cell in the culture is thus counterbalanced by the buffering
capacity (moles of acid or base added in buffers solution / change in solution's
pH) of the CO2/H2CO3 system.
Although the HEPES system has an good buffering capacity at neutral pH
(where cells grow better), its use was avoided in this thesis due to reports that
link the utilization of HEPES to the formation of cytotoxic products within 30 min
after exposure to light (Zigler et al., 1985). Experiments where illumination was
used to observe fluorescently tagged cellular structures would increase this
cytotoxic effect.
60
In order to keep cells alive outside the incubator during significant periods
of time (hours), a plastic box that covers the cell culture and isolates it from the
surroundings was designed and made-up in the machine shop facilities of the
Physics Department (see Figure 3). Basically, the box can be regarded as a
customized incubator. 5% CO2 gas is injected continuously by means of a needle
introduced through a rubber sheet that seals the upper part of the box. A hole
made in the rubber sheet that tightly fits to the skirt that protects the electronics in
the base of the AFM piezo tube allows the access of the cantilever to the cells
plated on the Petri dish. A piece of moist tissue is placed inside the box to reduce
the rate of evaporation of the culture medium.
4.2 Cell isolation and cultures for the AFM experiments.
Tracheal smooth muscle cells of Brown Norway rats (Harlan Sprague
Dawley, Wallkerville, MD, USA) were isolated and cultured as previously
described by Tolloczko et al., 1995. Briefly, the cells were enzymatically
dissociated with 0.05% elastase type IV and 0.2% collagenase type IV and
cultured in 1:1 Dulbecco's modified Eagle's medium -Ham's F12 medium
(DMEM-F12) supplemented with 10% fetal bovine serum (FBS), 0.224%
NaHCO3 and 100 U/ml penicillin, 100 µg/ml streptomycin and 25 µg/ml
amphotericin in a 5% CO2 incubator. Cell culture reagents were purchased from
Invitrogen (Canada Inc., Burlington, Ontario).
For AFM experiments, cell in the first or second passage were plated in
bottom glass culture dishes (MatTek Corp., Ashland, Massachusetts), let grow
until 60 – 70 % confluence was achieved and starved for 24 hours prior to
experiments in DMEM medium with 0.5% FBS. This assured that the cells were
always in the same phase of the cell cycle when the measurements were
performed. This level of confluence allowed a reliable discrimination of the
nucleus and cell borders. On the day of experiments, the culture dishes were
mounted on the microscope heated stage with ~1.5 ml of medium. The home
made CO2 box was placed around the culture dish and 5% CO2 was injected
continuously to keep the pH of the medium neutral. The temperature of the
61
culture was kept at 37 C by mean of the heated stage (DH-35iL, Warner
Instruments, 1125 Dixwell Avenue, Hamden, CT). A moist tissue placed inside
the box helped to maintain humidity and prevented evaporation of the medium.
Usually, the plates were prepared such that we had at least three cell
cultures, each one with a different substrate ready on the day of the AFM
measurement. Experiments were performed only ~30 min after the cell culture
was placed on the stage to give time for the cantilever stabilization (this was
necessary to avoid the bending of the cantilever due to the bimetallic effect; see
introduction). This allowed for a maximum of three cells (although usually two
cells) to be measured per dish due to the time it takes to perform these
experiments.
4.3 Cell localization and methodology to identify the area to
indent.
The combination of the AFM with the inverted optical microscope allows a
precise positioning (few micrometers using low magnification objectives and ~1
μm or less for high magnification objectives) of the cantilever relative to the cell.
We took advantage of this attribute of the set up to perform the measurements
that let us determine the mechanical properties of the cells. The steps described
below were followed:
1. Turn on the heated stage, mount the dish in the microscope stage and
position the AFM head above the culture dish, ready for the
experiments. Inject 5 % CO2 into the box that enclosed the cell culture.
2. Let the system stabilize for at least 30 min.
3. Localize a cell in the culture with the nucleus and the cell edge clearly
visible. This step was the most challenging of all since the nucleus is
not all the time clearly visible and the angle at which the dish is
illuminated from above has to be adjusted a few times before a clear
image is obtained. For future experiments, it is recommended to use a
phase contrast microscope which produce images more suited for
nuclear localization.
62
4. Localize a region between the cell nucleus and the cell edge.
5. Align the site to indent to the center of the bead. This was achieved by
first focusing on the cells and situate the mouse pointer on the
computer screen at the position to indent. Then, the bead was focused
and moved laterally until its center was positioned on the pointer tip.
6. Approach of the cantilever to the cell followed and the measurements
performed.
The completion of these steps allows us to systematically measure the
mechanical properties of the cells only on regions that lie between the nucleus
and the cell edge. The use of spherical beads for the experiments was chose
over conical tips even though the mechanical properties of the cells could in
principle be measured directly with such sharper tips. We thus, however, avoid
the potential of a sharp end of a conical tips to potentially disrupting the cell
membrane or cell interior structures.
4.4 Polyacrylamide gel preparation.
Polyacrylamide sheets can be directly prepared on glass surfaces.
However, those sheets detach easily from the glass. A procedure to adhere the
gels to the glass needed to be found. To achieve that, we implemented a method
previously described by Wang and Pelham, (1998) where polyacrylamide sheets
are covalently attached to an activated glass substrate.
Glass activation. Gels with three different mechanical properties were
prepared. Briefly, a small amount of 0.1 N NaOH was pipetted on the glass
surface of 35 mm diameter bottom glass Petri dishes (MatTek Corp., Ashland,
Massachusetts) and let dry. Covalent binding of the linker to the glass was
achieved by depositing 200 μl of 3-aminopropyltrimethoxysilane in the bottom of
glass dishes followed by a 5 min incubation time. Distilled water was added after
incubation and the dishes were agitated for 10 min. Finally, the dishes were
rinsed several times with distilled water and activation of the covalently bound
silane molecules was accomplished after 30 min incubation with 0.5%
glutaraldehyde in PBS solution.
63
Gel Preparation. Solutions of 10% Acrylamide-0.03% Bisacrylamide, 10%
Acrylamide-0.26% Bisacrylamide and 20% Acrylamide-0.5% Bisacrylamide were
prepared in distilled water. In all three cases, polymerization was initiated by
adding 1/200 volume of 10% ammonium persulfate (10% APS) and 1/2000
volume of N,N,N',N'-Tetramethylethylenediamine (TEMED). 15μl of the mixture
was pipetted into the activated glass and covered with a coverslip pretreated with
dichlorodimethylsilane (Acros Organics; Geel, Belgium) to facilitate its later
removal. Prior to gel functionalization, the substrates were rinsed several times
with 50 mM HEPES. The reagents used for the glass activation as well as gel
preparation (excluding dichlorodimethylsilane) were purchased from Sigma-
Aldrich Canada Ltd., Oakville, Ontario.
4.5 Gel functionalization.
It has been shown in this and other studies (Paszek et al., 2005; Discher
et al., 2009) that bare polyacrylamide gels have a reduced capacity to promote
cell adhesion. Functionalization of gels with molecules that promote adhesion is
thus necessary. Besides promoting adherence to the substrate, functionalization
also provides an environment that resembles to some extent the presence of
intercellular proteins (extracellular matrix proteins) in tissues. Particularly, smooth
muscle cells secrete extracellular matrix proteins into the intercellular spaces that
serve as support, provide an adhesive surface and could be involved in cell
signalization and transduction of mechanical forces among cells (Ingber, 2002;
Chiquet, 1999; Chiquet et al., 2003).
Polyacrylamide functionalization was performed according to the
procedure described in Wang and Pelham, 1998. 1 mM Sulfo-SANPAH (Thermo
Scientific, Nepean, Ontario) prepared in 50 mM HEPES (preparation performed
in darkness due to the photosensitivity of Sulfo-SANPAH) was pipetted onto the
polyacrylamide gel. The surface was exposed for 6 min to the 30W germicidal
lamp (UV light) of a culture hood. Care was taken to place a thin layer of the
solution on the gel surface and distribute it evenly. Large amounts of solution
resulted in poor functionalization. Elimination of the darkened solution, addition of
64
new 1mM sulfo-SANPAH solution and a new exposure to UV light followed.
Unbound sulfo-SANPAH was removed by adding 50 mM HEPES to the dish and
placing it in a shaker for 15 min. The step was repeated until the red residues of
unbound sulfo-SANPAH disappeared.
Fibronectin from human plasma (Sigma-Aldrich Canada Ltd., Oakville,
Ontario) was employed for gel as well as glass functionalization but
concentrations of the fibronectin solution used for functionalization varied among
the different substrates. For the 10% Acrylamide-0.03% Bisacrylamide gel, 70
μg/ml of fibronectin diluted in PBS was used; for the 10% Acrylamide-0.26%
Bisacrylamide gels, the concentration was 8 μg/ml, for 20% Acrylamide-0.5%
Bisacrylamide gels, the fibronectin concentration was 6 μg/ml and for glass
functionalization, the concentration used was 4μg/ml. The dishes were incubated
in a shaker overnight at room temperature.
Unbound fibronectin was removed by aspiration and washed with PBS.
UV irradiation for 20 min under the germicidal lamp of a sterile hood assured the
elimination of any bacteria or fungi in the substrate. Before sterilization, a thin
layer of sterile water was placed onto the substrate to prevent gel drying.
Dehydration of the polyacrylamide sheet can result in gel shrinking and
detachment.
1.5 ml of DMEM supplemented with 10% FBS was deposited in the Petri
dishes and incubated for at least 30 min before cell plating. This step permitted
the absorption of the medium into the gel.
4.6 Gel characterization.
Protein content. Content of fibronectin bound to the functionalized gels as
well as glass coverslips was quantified with a modified Enzyme-linked
immunosorbent assay (ELISA, Ma et al., 2010). First, the functionalized surfaces
as well as controls (no functionalized gels and glass plates) were covered with 1
ml of blocking buffer (3% bovine serum albumin in PBS) for 2 h at room
temperature. Albumin blocks the remaining sites where fibronectin is not bound.
The dishes were subsequently washed three times with PBS. Anti-Fibronectin
65
antibody produced in rabbit (Sigma-Aldrich Canada Ltd., Oakville, Ontario) was
diluted 1:5000 in blocking buffer, added to the dishes and incubated for 2 h at
room temperature. Unbound antibodies were removed rinsing three times the
dishes with PBS. The secondary antibody used was the goat anti-rabbit IgG–
FITC antibody (Sigma-Aldrich Canada Ltd., Oakville, Ontario) and was diluted
1:320 in blocking buffer. The antibody was added to each dish and then
incubated for 2 h at room temperature. The dishes were subsequently positioned
on the microscope stage and the FITC dye was excited (excitation wavelength,
495 nm) with an HBO 50 W mercury lamp and proper filters. The emission signal
(wavelength pick at 521 nm) was collected with a 60x oil immersion objective and
images of the sample acquired with a CCD camera (Cascade:1k camera,
Photometrics; Tucson, AZ) mounted in an inverse optical microscope (Axiovert
S100 TV, Carl Zeiss Canada Ltd., Toronto, Ontario). The images collected were
later subject to fluorescence intensity analysis using the public domain NIH
Image program (developed at the U.S. National Institutes of Health and available
on the Internet at http://rsb.info.nih.gov/nih-image/). Bare substrates (no
fibronectin) were used as controls for all experiments performed to determine
protein content.
Gel stiffness. Measurement of the gel elasticity was performed with the
AFM (for details refer to section Force volume) on at least four places on the
gels. Triangular cantilevers (C-triangular Microlever; Veeco) with spring constant
of 0.01 N/m and 4.5 μm diameter polystyrene beads (Polysciences Inc.,
Warrington, PA) glued to the cantilever tip were used. Maximum loads of 0.4 nN
were applied in order to get the force-distance curves employed to calculate the
Young‟s modulus of the gels.
4.7 Proliferation assay.
To examine the effect of the matrix stiffness on the proliferation rate,
airway smooth muscle cells from Brown Norway rat were seeded in both
polyacrylamide gels and glass functionalized with fibronectin. Cells plated did not
exceed the fifth passage on DB FalconTM cell culture flasks (BD Biosciences;
66
Mississauga, Ontario) in all the cases. Cells cultures were incubated at 37 C and
5% CO2 with complete DMEM medium until 60 – 70 % confluence was reached.
Subsequently, cell cultures were starved in 0.5% FBS medium for 24 hours to
assure that the cells were in the same phase of the cell cycle at the beginning of
the proliferation assay.
One day prior to the assay, the starvation medium was removed and
substituted with 10% or 0.5% FBS culture medium. Six hours after the medium
exchange, bromodeoxyuridine (BrdU; BD Pharmingen, 550891) diluted in DPBS
(Gibco) was added to the cultures at a final concentration of 10 μM. The cultures
were incubated another 18 h to permit the BrdU to incorporate into newly
synthesized DNA strands.
Prior to cell harvesting, the cells were washed three times with HBSS to
eliminate cellular debris or floating dead cells from the dish. The remaining cells
adhered to the polyacrylamide gel were then detached with 0.5 ml of 0.25%
trypsin. After inactivation of trypsin with 2 ml of 10% FBS medium, the cell
suspension was transferred to Falcon tubes (BD Biosciences) and spun at 1400
rpm in a refrigerated centrifuge (4 C). The supernatant was removed and 1 ml of
staining buffer (1X PBS, 3% FBS, 0.09% sodium azide) was added to the
remaining pellet followed by brief vortexing and spinning. Cells were
permeabilized with 100 μl of cytofix/cytoperm for 20 min on ice and washed with
Perm/wash buffer. Remaining traces of cytofix/cytoperm were eliminated with 1
ml of staining buffer. The cell pellet was then stored in freezing medium (10%
DMSO, 90% heat inactivated FBS) at -80 C.
To prepare the cells for the cytometer reading, the cells were once more
permeabilized with 100 ul of Cytofix/Cytoperm for 5 min at room temperature,
washed with Perm/Wash buffer and re-suspended in 100 μl of DNase. Cell
suspension was incubated for 1 h at 37 C followed by addition of 1 ml of
Perm/Wash buffer and spinning.
Anti-BrdU antibody diluted in Perm/Washer buffer was mixed with the cell
pellet and incubated for 30 min at room temperature. The Anti-BrdU antibody
solution was then eliminated by adding 1 ml of Perm/Wash buffer. For
67
fluorescence-activated cell sorting (FACS), the cell pellet was diluted in 0.5 ml of
staining buffer.
Cells were analyzed by FACScan (Beckman counter) with MultiCycle for
Windows software (Beckman counter) for detailed cell cycle status. The
percentage of proliferative cells in each condition was determined.
4.8 RNA extraction protocol.
Airway smooth muscle cells were cultured on polyacrylamide gels coated
with fibronectin. At 60 -70 % confluence, the cell cultures were starved in 0.5%
FBS medium for 24 hours to assure that the cells were in the same phase of the
cell cycle at the time of RNA extraction. On the day of the experiment, the culture
medium was removed from each dish. Cells were washed with PBS twice and
the RNeasy Mini kit® (QIAGEN) was used to extract RNA following the
manufactures protocols.
Briefly, cells were disrupted with 350 μl of RLT buffer plus 5% beta-
mercaptoethanol. Cell lysate was mixed by pipetting and transferred to
QIAshredder spin column placed in 2 ml collection tube and centrifuged in order
to homogenize. One volume of 70% ethanol was added to the homogenized
lysate and the mixture was transferred to RNeasy spin column placed in 2 ml
collection tube. The tubes were centrifuged for 15 s at 8000 x g. 700 μl of RW1
buffer was added to the RNeasy spin column and then centrifuged 15 s at 8000 x
g. The RNeasy spin column was then washed with 500 μl of RPE buffer twice,
centrifuged for 2 min at 8000 x g and transferred to another collection tube. The
RNA was eluted by adding 30 μl of RNase-free water directly to the spin column
membrane and centrifuged for 1 min at 8000 x g.
The total RNA was quantified with a NanoDrop (Thermo Fisher Scientific
Inc. 81 Wyman Street Waltham, MA) and integrity was verified in an Experion
machine (Bio-Rad, 1000 Alfred Nobel Drive Hercules, CA). The extracted total
RNA was sent to the Génome Québec Innovation Centre at McGill University for
gene expression assay exploiting Illumina array based technologies.
68
4.9 Immunofluorescence.
Cell cultures were cultured in DMEM supplemented with 10% FBS until ~
60 -70 % confluence was reached. Then, the cell cultures were starved in 0.5%
FBS medium for 24 hours to assure that the cells were in the same phase of the
cell cycle. Cell fixation was performed with 3.7% paraformaldehyde diluted in
PBS. Adherent cells were permeabilized with 0.1% saponin in PBS for 15 min
followed by the addition of blocking buffer (5% milk, 0.1% saponin in PBS). The
cultures were incubated 30 min and then the cells were labeled with FITC-
phallodin (33.3 μg/ml) diluted in PBS plus 0.1% saponin for 1 h. Prior to the
imaging procedure, the cultures were washed four times with PBS to remove the
excess of dye. An HBO 50 W mercury lamp and proper filters were used to excite
the FITC dye (excitation wavelength, 495 nm) and the emission signal
(wavelength pick at 521 nm) was collected with a CCD camera (Cascade:1k
camera, Photometrics; Tucson, AZ) mounted on an inverted optical microscope
(Axiovert S100 TV, Carl Zeiss Canada Ltd., Toronto, Ontario).
4.10 Analysis of the data
Young’s modulus and complex modulus
Due to the large number of data sets, in particular when analyzing force-
distance curves collected in the Force-Volume mode of operation (~ 750 force-
distance curves are taken at several positions above the polyacrylamide gels),
MatLab programming routines were implemented and employed to fit the curves
to the Hertz model and calculate the corresponding Young‟s Modulus (see code
in the Appendix). Details of the procedure to calculate the mechanical properties
can be found in the section Hertz model and Indentation modulation.
For the calculation of the complex modulus, the lock-in output data was
visualized using the WinWCP version 4.1.5 software
(http://spider.science.strath.ac.uk/sipbs/showPage.php?page=software_winWCP
). Averaging of the last 5 s of the curves (see Figure 18) was performed and the
data exported to Microcal OriginPro, version 6, where the calculation of the
Complex modulus was completed.
69
Images and Gene Array data
All images taken with the optical microscope, either bright field or
fluorescent images, were processed with the Image J software (NIH, http://
rsbweb.nih.gov/ij/index.html) when needed. FlexArray software (Genome
Quebec) was used to normalize the gene array row data and to perform further
the analysis such as one-way analysis of variance (ANOVA).
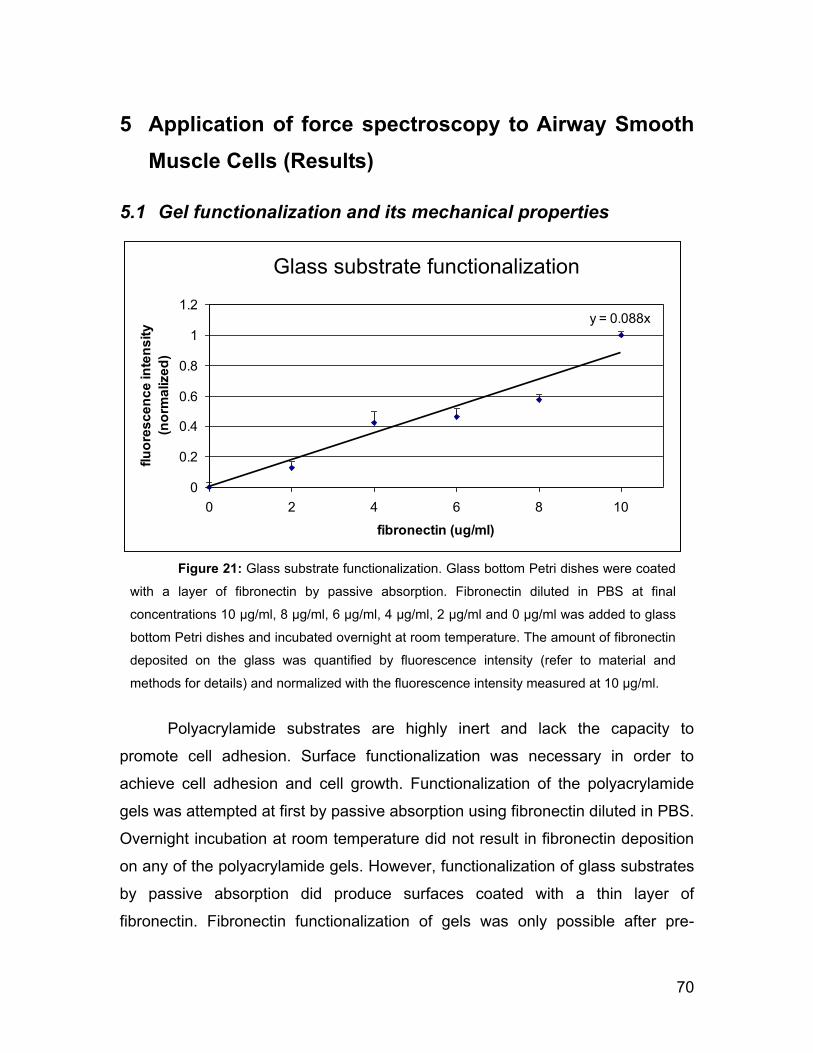
70
5 Application of force spectroscopy to Airway Smooth
Muscle Cells (Results)
5.1 Gel functionalization and its mechanical properties
Polyacrylamide substrates are highly inert and lack the capacity to
promote cell adhesion. Surface functionalization was necessary in order to
achieve cell adhesion and cell growth. Functionalization of the polyacrylamide
gels was attempted at first by passive absorption using fibronectin diluted in PBS.
Overnight incubation at room temperature did not result in fibronectin deposition
on any of the polyacrylamide gels. However, functionalization of glass substrates
by passive absorption did produce surfaces coated with a thin layer of
fibronectin. Fibronectin functionalization of gels was only possible after pre-
Glass substrate
y = 0.088x
0
0.2
0.4
0.6
0.8
1
1.2
0 2 4 6 8 10
fibronectin (ug/ml)
flu
ore
sc
en
ce
in
ten
sit
y
(no
rma
lize
d)
Figure 21: Glass substrate functionalization. Glass bottom Petri dishes were coated
with a layer of fibronectin by passive absorption. Fibronectin diluted in PBS at final
concentrations 10 μg/ml, 8 μg/ml, 6 μg/ml, 4 μg/ml, 2 μg/ml and 0 μg/ml was added to glass
bottom Petri dishes and incubated overnight at room temperature. The amount of fibronectin
deposited on the glass was quantified by fluorescence intensity (refer to material and
methods for details) and normalized with the fluorescence intensity measured at 10 μg/ml.
Glass substrate functionalization
71
treatment of polyacrylamide sheets with the crosslinker sulfo-SANPAH which
binds covalently to the gel by one extreme while the other extreme reacts with
the amino groups (i.e. lysine) present in the proteins.
Assessment of the relative content of fibronectin in all the substrates was
achieved by sandwich Enzyme-linked immunosorbent assay (ELISA).
Fluorescence intensity of Anti-Rabbit IgG-FITC antibody bound to anti-fibronectin
antibodies was measured and the fluorescent intensity of the glass functionalized
with a solution of fibronectin (see Figure 21) at an initial concentration of 10 μg/ml
was employed to normalize the data.
Comparison of the fluorescence intensity measurements of the
functionalized gels vs. functionalized glass showed that functionalization of glass
was more efficient than any of the polyacrylamide gels functionalized.
Adjustments in the concentration of fibronectin solution used for gels
functionalization were necessary. Measurements showed that for the 10%
acrylamide-0.03% bisacrylamide gel, the concentration of the fibronectin solution
was 70 μg/ml; for the 10% acrylamide-0.26% bisacrylamide gel, the
concentration was 8 μg/ml and for the 20% acrylamide-0.50% bisacrylamide gel
the concentration was 6 μg/ml. In all the cases, the fluorescence intensity
measured in the three gels was equivalent to that measured on glass
functionalized with a 5 μg/ml fibronectin solution.
Confocal microscopy performed on polyacrylamide gels showed that
fluorescent antibodies do not penetrate the matrix bulk and remain bound to
fibronectin molecules covalently linked to the gel surface (see Figure 22). This
assured that the determination of the fibronectin content on the gels by ELISA
only accounts for the protein located on the gel surface. Only the superficial
fibronectin layer promotes cellular adhesion. Seeding of smooth muscle cells on
the functionalized substrates confirmed that the amount of fibronectin covering
the surfaces was appropriate to support cell adhesion.
Following functionalization, the mechanical properties of the gels were
tested by performing AFM spectroscopy on three different 100 μm x 100 μm
square areas on the polyacrylamide gels. The Force-Volume imaging technique
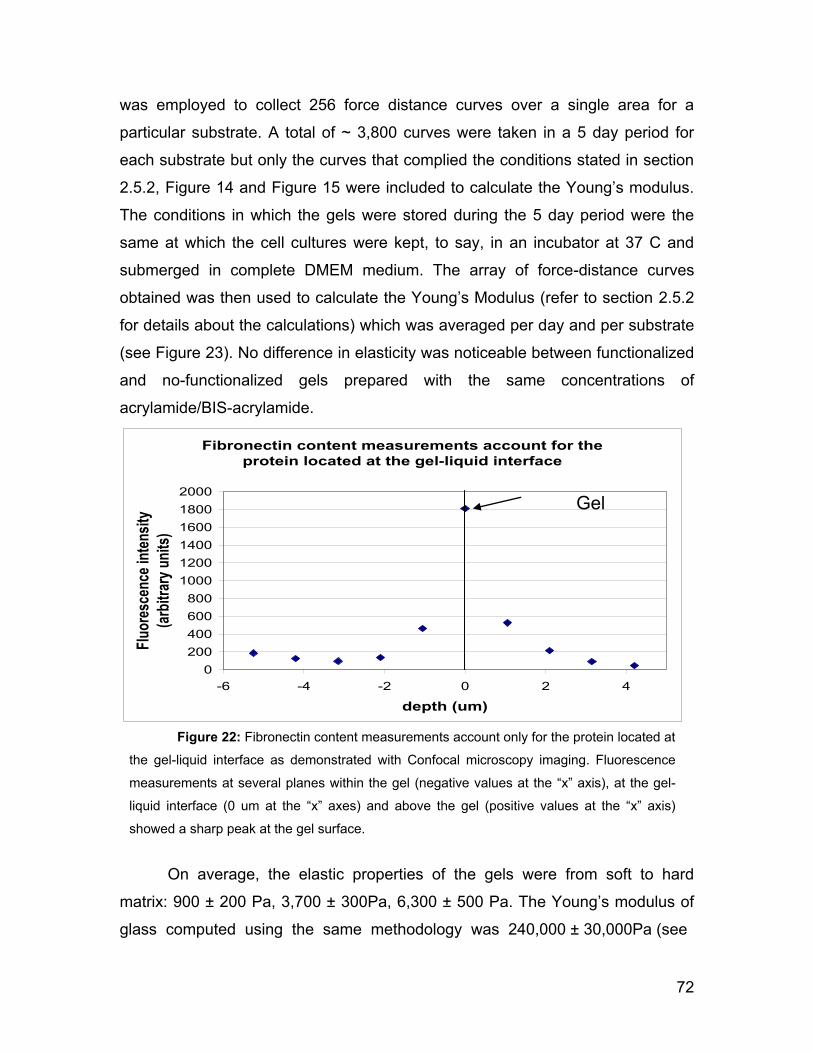
72
was employed to collect 256 force distance curves over a single area for a
particular substrate. A total of ~ 3,800 curves were taken in a 5 day period for
each substrate but only the curves that complied the conditions stated in section
2.5.2, Figure 14 and Figure 15 were included to calculate the Young‟s modulus.
The conditions in which the gels were stored during the 5 day period were the
same at which the cell cultures were kept, to say, in an incubator at 37 C and
submerged in complete DMEM medium. The array of force-distance curves
obtained was then used to calculate the Young‟s Modulus (refer to section 2.5.2
for details about the calculations) which was averaged per day and per substrate
(see Figure 23). No difference in elasticity was noticeable between functionalized
and no-functionalized gels prepared with the same concentrations of
acrylamide/BIS-acrylamide.
On average, the elastic properties of the gels were from soft to hard
matrix: 900 ± 200 Pa, 3,700 ± 300Pa, 6,300 ± 500 Pa. The Young‟s modulus of
glass computed using the same methodology was 240,000 ± 30,000Pa (see
Fibronectin content measurements account for the
protein located at the gel-liquid interface
0
200
400
600
800
1000
1200
1400
1600
1800
2000
-6 -4 -2 0 2 4
depth (um)
Flu
ores
cen
ce in
ten
sity
(arb
itra
ry u
nits
)
Gel
surface
Figure 22: Fibronectin content measurements account only for the protein located at
the gel-liquid interface as demonstrated with Confocal microscopy imaging. Fluorescence
measurements at several planes within the gel (negative values at the “x” axis), at the gel-
liquid interface (0 um at the “x” axes) and above the gel (positive values at the “x” axis)
showed a sharp peak at the gel surface.
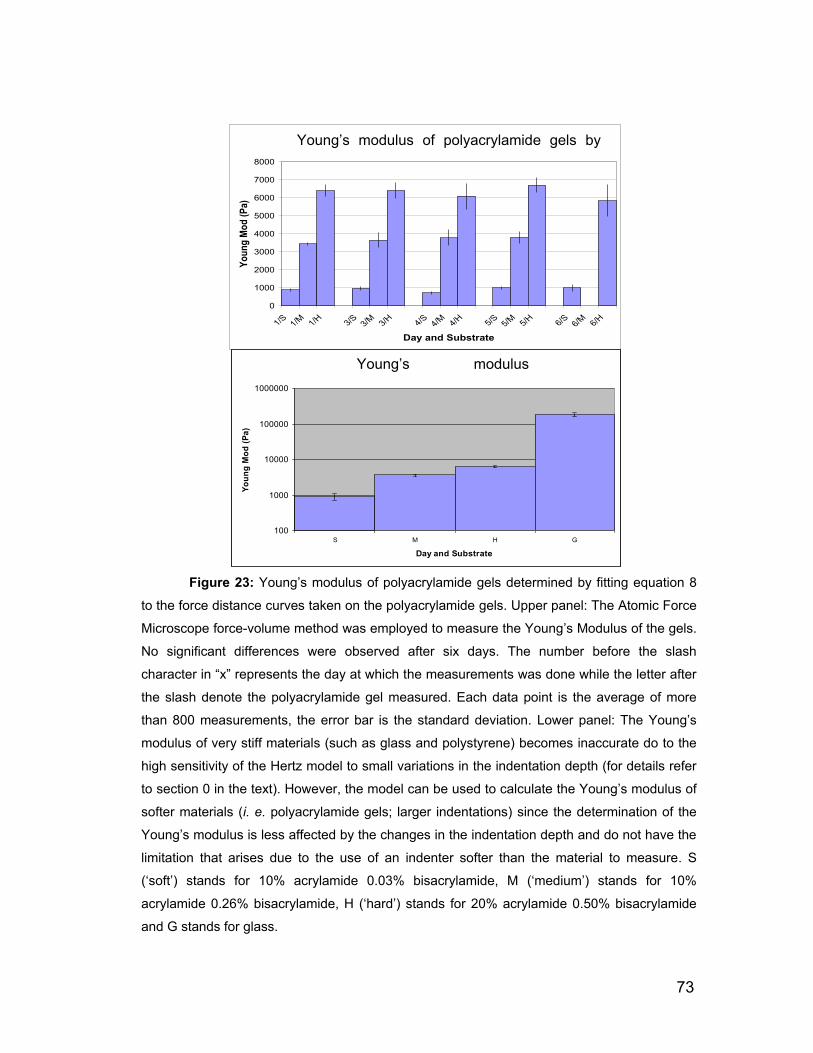
73
Young Modulus of polyacrylamide gels
0
1000
2000
3000
4000
5000
6000
7000
8000
1/S1/M 1/H 3/S
3/M 3/H 4/S4/M 4/H 5/S
5/M 5/H 6/S6/M 6/H
Day and Substrate
Yo
un
g M
od
(P
a)
Young Mod (Average)
100
1000
10000
100000
1000000
S M H G
Day and Substrate
Yo
un
g M
od
(P
a)
Young‟s modulus of polyacrylamide gels by
day
Young‟s modulus
averages
Figure 23: Young‟s modulus of polyacrylamide gels determined by fitting equation 8
to the force distance curves taken on the polyacrylamide gels. Upper panel: The Atomic Force
Microscope force-volume method was employed to measure the Young‟s Modulus of the gels.
No significant differences were observed after six days. The number before the slash
character in “x” represents the day at which the measurements was done while the letter after
the slash denote the polyacrylamide gel measured. Each data point is the average of more
than 800 measurements, the error bar is the standard deviation. Lower panel: The Young‟s
modulus of very stiff materials (such as glass and polystyrene) becomes inaccurate do to the
high sensitivity of the Hertz model to small variations in the indentation depth (for details refer
to section 0 in the text). However, the model can be used to calculate the Young‟s modulus of
softer materials (i. e. polyacrylamide gels; larger indentations) since the determination of the
Young‟s modulus is less affected by the changes in the indentation depth and do not have the
limitation that arises due to the use of an indenter softer than the material to measure. S
(„soft‟) stands for 10% acrylamide 0.03% bisacrylamide, M („medium‟) stands for 10%
acrylamide 0.26% bisacrylamide, H („hard‟) stands for 20% acrylamide 0.50% bisacrylamide
and G stands for glass.
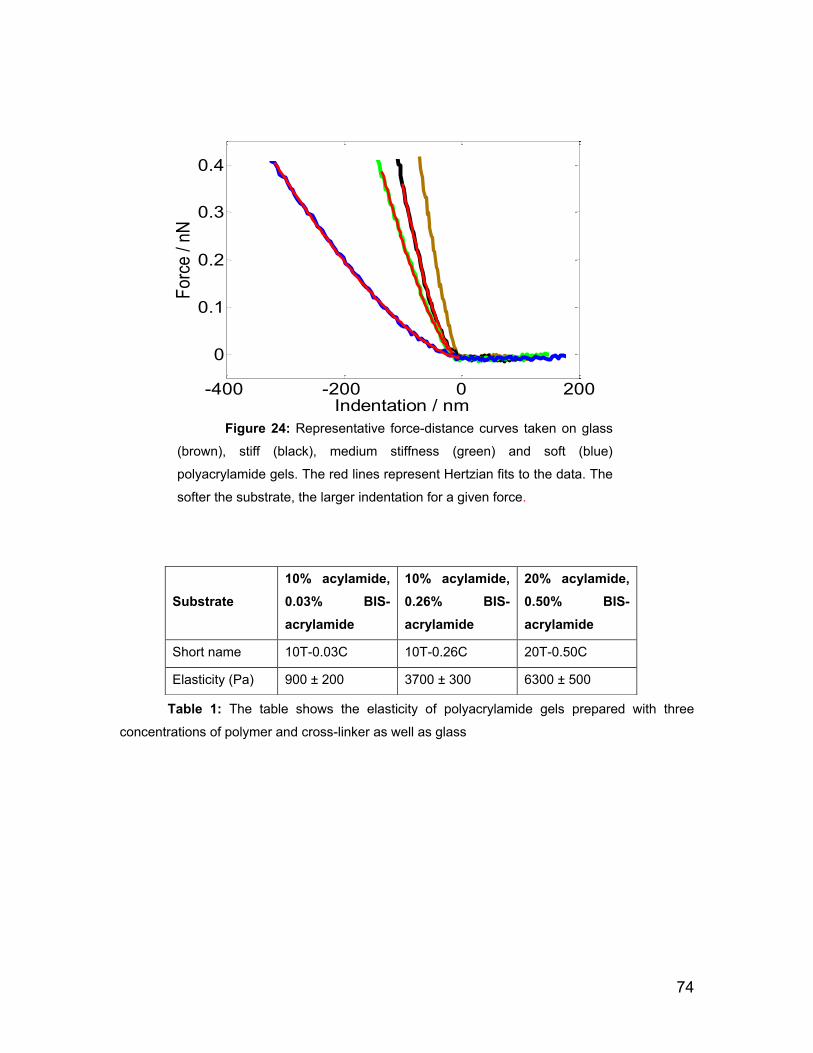
74
Table 1: The table shows the elasticity of polyacrylamide gels prepared with three
concentrations of polymer and cross-linker as well as glass
Substrate
10% acylamide,
0.03% BIS-
acrylamide
10% acylamide,
0.26% BIS-
acrylamide
20% acylamide,
0.50% BIS-
acrylamide
Short name 10T-0.03C 10T-0.26C 20T-0.50C
Elasticity (Pa) 900 ± 200 3700 ± 300 6300 ± 500
0 100 200 300 400 500-60
-50
-40
-30
-20
-10
0
10
20
30
40050060070080090010000.05
0.1
0.15
0.2
0.25
0.3
0.35
0.4
0.45
0.5
0.55
z / nm
Force / nN
E=1403.2364
r2=0.76618
E=1506.8366
r2=0.7865
E=1525.129
r2=0.77677
E=1668.4567
r2=0.80613
E=1764.5605
r2=0.81792
E=1830.5012
r2=0.8196
E=1965.2159
r2=0.83818
E=2094.8046
r2=0.85238
E=2218.9282
r2=0.8634
E=2282.3096
r2=0.859
E=2566.5393
r2=0.89734
E=2708.1866
r2=0.90475
E=2901.9367
r2=0.91805
E=3046.3596
r2=0.9218
E=3426.9934
r2=0.95198
E=3567.8616
r2=0.95205
E=3836.5124
r2=0.96257
E=4214.1004
r2=0.97786
E=4545.4109
r2=0.98562
E=4955.5623
r2=0.99329
E=5299.6353
r2=0.99619
E=5811.0228
r2=0.99886
E=6132.2889
r2=0.99891
E=6477.3445
r2=0.99834
E=6826.1301
r2=0.99778
E=7216.5759
r2=0.99642
E=7620.6899
r2=0.99516
E=8070.7406
r2=0.99289
E=8544.4583
r2=0.99075
E=9052.6001
r2=0.98811
E=9587.5043
r2=0.98633
E=10185.392
r2=0.98375
E=10877.5349
r2=0.98032
E=11545.9522
r2=0.98235
E=12549.2692
r2=0.97612
E=13567.2701
r2=0.97483
E=15149.6541
r2=0.95952
40050060070080090010000
0.1
0.2
0.3
0.4
0.5
z / nm
Force / nN
E=827.4277
r2=0.72442
E=879.4433
r2=0.7455
E=883.1642
r2=0.73545
E=985.5166
r2=0.78211
E=1007.3761
r2=0.78203
E=1035.2315
r2=0.78417
E=1091.2972
r2=0.79963
E=1131.1472
r2=0.80597
E=1173.7558
r2=0.81278
E=1217.3706
r2=0.81899
E=1319.3553
r2=0.84783
E=1347.0286
r2=0.84558
E=1416.5859
r2=0.85817
E=1473.6087
r2=0.86493
E=1561.8197
r2=0.88068
E=1660.0622
r2=0.89703
E=1721.4922
r2=0.90127
E=1828.6794
r2=0.91624
E=1898.5417
r2=0.92042
E=2043.303
r2=0.93945
E=2124.7085
r2=0.94356
E=2300.9905
r2=0.962
E=2337.6589
r2=0.95719
E=2518.1908
r2=0.97209
E=2667.7938
r2=0.97987
E=2808.3065
r2=0.98494
E=3015.7842
r2=0.99303
E=3146.3342
r2=0.99445
E=3412.979
r2=0.99887
E=3579.5571
r2=0.99867
E=3710.0075
r2=0.99781
E=3832.5617
r2=0.99706
E=3966.9174
r2=0.99572
E=4092.8267
r2=0.99498
E=4227.0328
r2=0.99393
E=4364.0709
r2=0.99309
E=4503.7931
r2=0.99257
E=4657.002
r2=0.9917
E=4824.0609
r2=0.99023
E=4997.9459
r2=0.98871
E=5176.2474
r2=0.98763
E=5366.4088
r2=0.98642
E=5564.2947
r2=0.98577
E=5789.9246
r2=0.98381
E=6011
r2=0.98399
E=6271.0831
r2=0.98258
E=6540.2774
r2=0.98309
E=6874.6582
r2=0.98099
E=7244.4137
r2=0.97979
E=7672.5035
r2=0.97646
E=8148.4133
r2=0.97229
E=8635.7843
r2=0.97297
E=9369.1071
r2=0.96299
E=10019.3561
r2=0.96579
E=11278.3042
r2=0.94057
1400150016001700180019002000-0.05
0
0.05
0.1
0.15
0.2
0.25
0.3
0.35
0.4
0.45
z / nm
Force / nN
E=356.3386
r2=0.83425
E=362.1872
r2=0.83186
E=377.7033
r2=0.84271
E=390.4735
r2=0.84881
E=406.7349
r2=0.85859
E=436.4835
r2=0.88289
E=451.5064
r2=0.8885
E=469.337
r2=0.89628
E=481.3052
r2=0.89737
E=516.4415
r2=0.91905
E=527.0129
r2=0.91773
E=562.5646
r2=0.93561
E=578.1113
r2=0.93704
E=596.6976
r2=0.93995
E=636.2812
r2=0.95545
E=662.9755
r2=0.96127
E=710.3344
r2=0.97532
E=728.9222
r2=0.97553
E=781.7524
r2=0.98691
E=816.2123
r2=0.99054
E=856.2507
r2=0.9943
E=901.7718
r2=0.99746
E=932.6357
r2=0.99804
E=990.0939
r2=0.99937
E=1019.7216
r2=0.99922
E=1051.2296
r2=0.99881
E=1082.4066
r2=0.9983
E=1115.2557
r2=0.99752
E=1147.1562
r2=0.99689
E=1181.3738
r2=0.99592
E=1215.6821
r2=0.99509
E=1252.1595
r2=0.99387
E=1288.1272
r2=0.99301
E=1325.6919
r2=0.99197
E=1365.1427
r2=0.99075
E=1403.7268
r2=0.99017
E=1446.5928
r2=0.98904
E=1490.7486
r2=0.9879
E=1537.2397
r2=0.98667
E=1582.8047
r2=0.98649
E=1635.6018
r2=0.98505
E=1687.0188
r2=0.98523
E=1745.1744
r2=0.9845
E=1806.9113
r2=0.98451
E=1879.1185
r2=0.98283
E=1953.0386
r2=0.9823
E=2029.7268
r2=0.98338
E=2131.4702
r2=0.98067
E=2228.3906
r2=0.9816
E=2350.7821
r2=0.98018
E=2475.6929 E=2657.5819 E=2853.3745 E=3189.6486 E=3500.2117
-400 -200 0 200
0
0.1
0.2
0.3
0.4
Indentation / nm
Fo
rce
/ n
N
E=356.3386
r2=0.83425
E=362.1872
r2=0.83186
E=377.7033
r2=0.84271
E=390.4735
r2=0.84881
E=406.7349
r2=0.85859
E=436.4835
r2=0.88289
E=451.5064
r2=0.8885
E=469.337
r2=0.89628
E=481.3052
r2=0.89737
E=516.4415
r2=0.91905
E=527.0129
r2=0.91773
E=562.5646
r2=0.93561
E=578.1113
r2=0.93704
E=596.6976
r2=0.93995
E=636.2812
r2=0.95545
E=662.9755
r2=0.96127
E=710.3344
r2=0.97532
E=728.9222
r2=0.97553
E=781.7524
r2=0.98691
E=816.2123
r2=0.99054
E=856.2507
r2=0.9943
E=901.7718
r2=0.99746
E=932.6357
r2=0.99804
E=990.0939
r2=0.99937
E=1019.7216
r2=0.99922
E=1051.2296
r2=0.99881
E=1082.4066
r2=0.9983
E=1115.2557
r2=0.99752
E=1147.1562
r2=0.99689
E=1181.3738
r2=0.99592
E=1215.6821
r2=0.99509
E=1252.1595
r2=0.99387
E=1288.1272
r2=0.99301
E=1325.6919
r2=0.99197
E=1365.1427
r2=0.99075
E=1403.7268
r2=0.99017
E=1446.5928
r2=0.98904
E=1490.7486
r2=0.9879
E=1537.2397
r2=0.98667
E=1582.8047
r2=0.98649
E=1635.6018
r2=0.98505
E=1687.0188
r2=0.98523
E=1745.1744
r2=0.9845
E=1806.9113
r2=0.98451
E=1879.1185
r2=0.98283
E=1953.0386
r2=0.9823
E=2029.7268
r2=0.98338
E=2131.4702
r2=0.98067
E=2228.3906E=2350.7821E=2475.6929E=2657.5819E=2853.3745E=3189.6486E=3500.2117
Figure 24: Representative force-distance curves taken on glass
(brown), stiff (black), medium stiffness (green) and soft (blue)
polyacrylamide gels. The red lines represent Hertzian fits to the data. The
softer the substrate, the larger indentation for a given force.
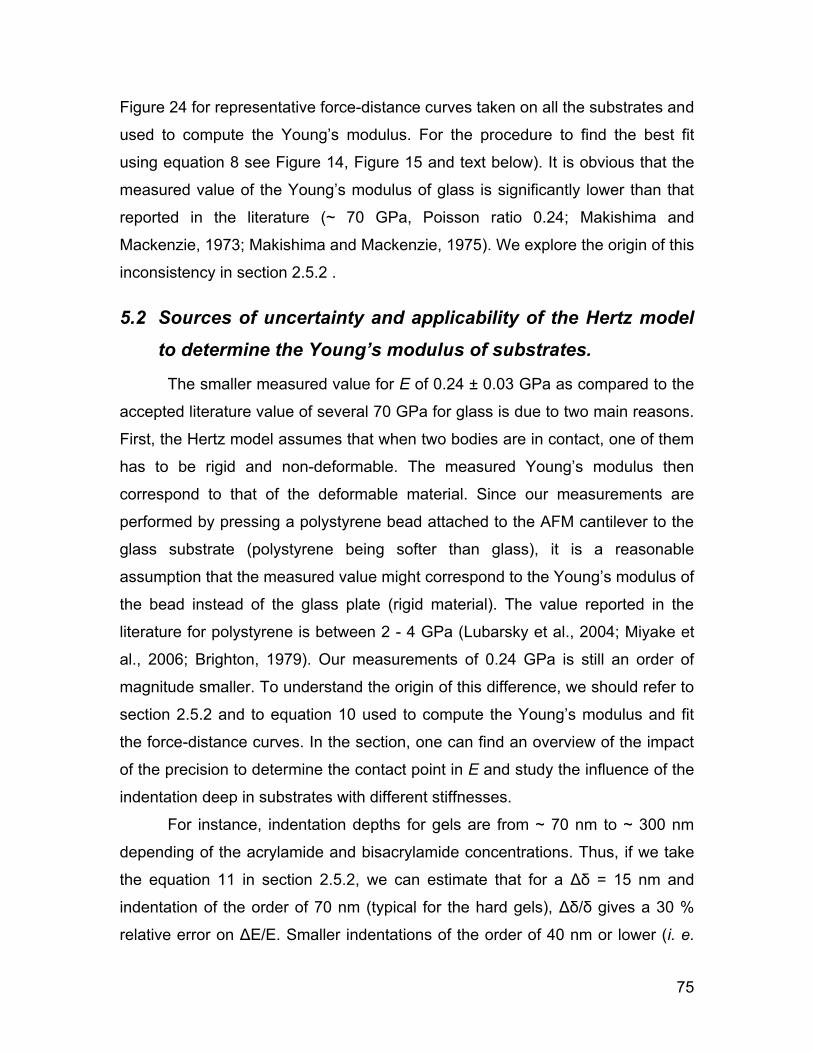
75
Figure 24 for representative force-distance curves taken on all the substrates and
used to compute the Young‟s modulus. For the procedure to find the best fit
using equation 8 see Figure 14, Figure 15 and text below). It is obvious that the
measured value of the Young‟s modulus of glass is significantly lower than that
reported in the literature (~ 70 GPa, Poisson ratio 0.24; Makishima and
Mackenzie, 1973; Makishima and Mackenzie, 1975). We explore the origin of this
inconsistency in section 2.5.2 .
5.2 Sources of uncertainty and applicability of the Hertz model
to determine the Young’s modulus of substrates.
The smaller measured value for E of 0.24 ± 0.03 GPa as compared to the
accepted literature value of several 70 GPa for glass is due to two main reasons.
First, the Hertz model assumes that when two bodies are in contact, one of them
has to be rigid and non-deformable. The measured Young‟s modulus then
correspond to that of the deformable material. Since our measurements are
performed by pressing a polystyrene bead attached to the AFM cantilever to the
glass substrate (polystyrene being softer than glass), it is a reasonable
assumption that the measured value might correspond to the Young‟s modulus of
the bead instead of the glass plate (rigid material). The value reported in the
literature for polystyrene is between 2 - 4 GPa (Lubarsky et al., 2004; Miyake et
al., 2006; Brighton, 1979). Our measurements of 0.24 GPa is still an order of
magnitude smaller. To understand the origin of this difference, we should refer to
section 2.5.2 and to equation 10 used to compute the Young‟s modulus and fit
the force-distance curves. In the section, one can find an overview of the impact
of the precision to determine the contact point in E and study the influence of the
indentation deep in substrates with different stiffnesses.
For instance, indentation depths for gels are from ~ 70 nm to ~ 300 nm
depending of the acrylamide and bisacrylamide concentrations. Thus, if we take
the equation 11 in section 2.5.2, we can estimate that for a Δδ = 15 nm and
indentation of the order of 70 nm (typical for the hard gels), Δδ/δ gives a 30 %
relative error on ΔE/E. Smaller indentations of the order of 40 nm or lower (i. e.
76
for glass substrates) and uncertainties in the determination of the contact point of
10 nm produce relative errors in ΔE/E of the order of 40 %. However, for the
large indentations observed on the softer gels (δ = 300 nm) and with Δδ = 20 nm,
Δδ/δ gives a 10 % relative error on ΔE/E. This analysis demonstrates that the
consequence of how precise the contact point can be determined is less
dramatic for soft materials where indentations are large. The above result also
imply that the Young‟s modulus of the soft and medium stiffness gels reported
above are the most reliable while the modulus calculated for the hard gel and
glass are less reliable due to systematic errors in contact point determination.
This is confirmed when the modulus E measured and calculated here is
compared to the values reported in the literature for glass or polystyrene.
Note that a further possible explanation for the discrepancy for the
polystyrene value is the fact that as we used very small indentation depths the
swelled surface layer of polystyrene might be softer than the bulk value reported
in the literature. Due to the systematic error in E as a result of the contact point
determination uncertainty in the present experiments this hypothesis cannot be
experimentally tested in the current set-up. Polysterene surfaces are however
known to change and age; polysterene spheres stored for extended periods of
time look very „fuzzy‟ in SEM images, in contrast to freshly acquired and imaged
samples.
Other sources of systematic error than would mainly affect the
determination of Young‟s modulus of hard substrates such as glass include the
cantilever bending due to its movement in liquid. The δ-3/2 part of equation 10
predicts that small measurement errors due to fluid-induced cantilever bending
(i.e. drag) in the determination of the indentations δ are not significant for large
indentations. For small indents in stiff substrates this can however become a
major source of systematic error. One would need to perform a careful
systematic study of cantilever drag not only in liquids, but also close to surfaces.
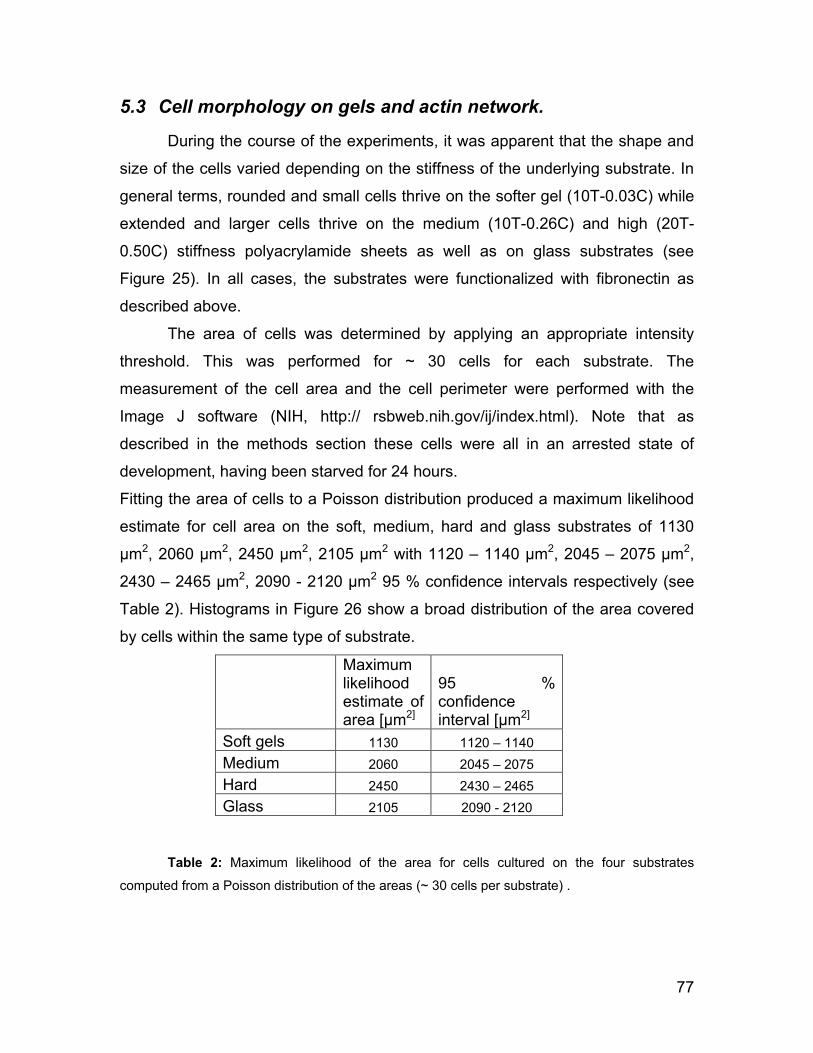
77
5.3 Cell morphology on gels and actin network.
During the course of the experiments, it was apparent that the shape and
size of the cells varied depending on the stiffness of the underlying substrate. In
general terms, rounded and small cells thrive on the softer gel (10T-0.03C) while
extended and larger cells thrive on the medium (10T-0.26C) and high (20T-
0.50C) stiffness polyacrylamide sheets as well as on glass substrates (see
Figure 25). In all cases, the substrates were functionalized with fibronectin as
described above.
The area of cells was determined by applying an appropriate intensity
threshold. This was performed for ~ 30 cells for each substrate. The
measurement of the cell area and the cell perimeter were performed with the
Image J software (NIH, http:// rsbweb.nih.gov/ij/index.html). Note that as
described in the methods section these cells were all in an arrested state of
development, having been starved for 24 hours.
Fitting the area of cells to a Poisson distribution produced a maximum likelihood
estimate for cell area on the soft, medium, hard and glass substrates of 1130
μm2, 2060 μm2, 2450 μm2, 2105 μm2 with 1120 – 1140 μm2, 2045 – 2075 μm2,
2430 – 2465 μm2, 2090 - 2120 μm2 95 % confidence intervals respectively (see
Table 2). Histograms in Figure 26 show a broad distribution of the area covered
by cells within the same type of substrate.
Maximum likelihood estimate of area [μm2]
95 % confidence interval [μm2]
Soft gels 1130 1120 – 1140
Medium 2060 2045 – 2075
Hard 2450 2430 – 2465
Glass 2105 2090 - 2120
Table 2: Maximum likelihood of the area for cells cultured on the four substrates
computed from a Poisson distribution of the areas (~ 30 cells per substrate) .
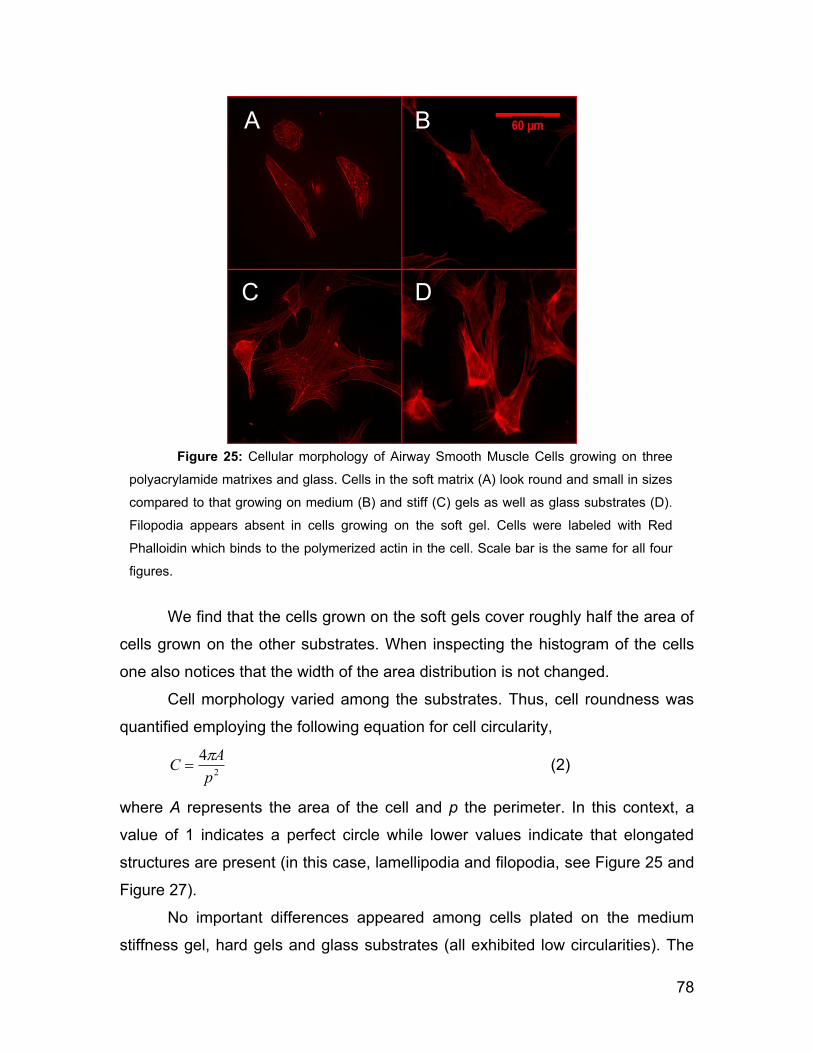
78
We find that the cells grown on the soft gels cover roughly half the area of
cells grown on the other substrates. When inspecting the histogram of the cells
one also notices that the width of the area distribution is not changed.
Cell morphology varied among the substrates. Thus, cell roundness was
quantified employing the following equation for cell circularity,
2
4
p
AC
(2)
where A represents the area of the cell and p the perimeter. In this context, a
value of 1 indicates a perfect circle while lower values indicate that elongated
structures are present (in this case, lamellipodia and filopodia, see Figure 25 and
Figure 27).
No important differences appeared among cells plated on the medium
stiffness gel, hard gels and glass substrates (all exhibited low circularities). The
A B
C D
A B
C D
Figure 25: Cellular morphology of Airway Smooth Muscle Cells growing on three
polyacrylamide matrixes and glass. Cells in the soft matrix (A) look round and small in sizes
compared to that growing on medium (B) and stiff (C) gels as well as glass substrates (D).
Filopodia appears absent in cells growing on the soft gel. Cells were labeled with Red
Phalloidin which binds to the polymerized actin in the cell. Scale bar is the same for all four
figures.
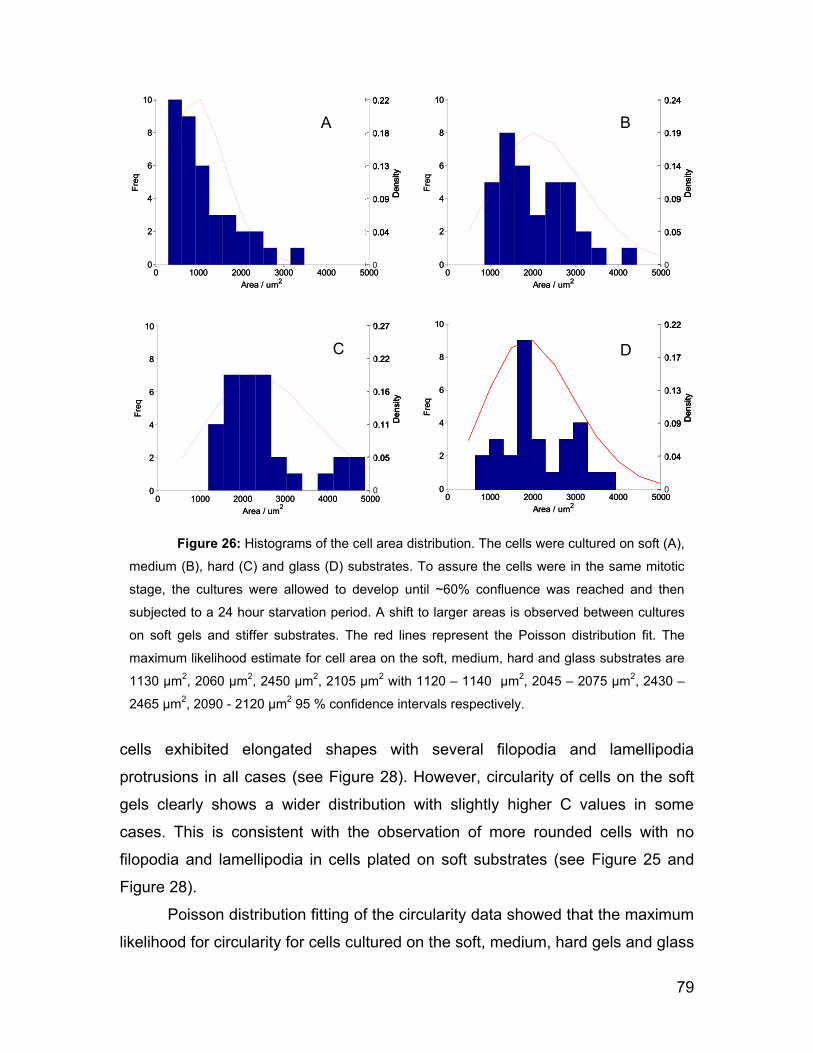
79
cells exhibited elongated shapes with several filopodia and lamellipodia
protrusions in all cases (see Figure 28). However, circularity of cells on the soft
gels clearly shows a wider distribution with slightly higher C values in some
cases. This is consistent with the observation of more rounded cells with no
filopodia and lamellipodia in cells plated on soft substrates (see Figure 25 and
Figure 28).
Poisson distribution fitting of the circularity data showed that the maximum
likelihood for circularity for cells cultured on the soft, medium, hard gels and glass
0 1000 2000 3000 4000 50000
2
4
6
8
10
Area / um2
Fre
q
0 1000 2000 3000 4000 50000
2
4
6
8
10
Area / um2
Fre
q
0.22
0.18
0.13
0.09
0
0.04
De
nsity
0 1000 2000 3000 4000 50000
2
4
6
8
10
Area / um2
Fre
q
0 1000 2000 3000 4000 50000
2
4
6
8
10
Area / um2
Fre
q
0.22
0.18
0.13
0.09
0
0.04
De
nsity
0 1000 2000 3000 4000 50000
2
4
6
8
10
Area / um2
Fre
q
0 1000 2000 3000 4000 50000
2
4
6
8
10
Area / um2
Fre
q
0.22
0.18
0.13
0.09
0
0.04
De
nsity
0 1000 2000 3000 4000 50000
2
4
6
8
10
Area / um2
Fre
q
0 1000 2000 3000 4000 50000
2
4
6
8
10
Area / um2
Fre
q
0.24
0.19
0.14
0.09
0
0.05
De
nsity
0 1000 2000 3000 4000 50000
2
4
6
8
10
Area / um2
Fre
q
0 1000 2000 3000 4000 50000
2
4
6
8
10
Area / um2
Fre
q
0.24
0.19
0.14
0.09
0
0.05
De
nsity
0 1000 2000 3000 4000 50000
2
4
6
8
10
Area / um2
Fre
q
0 1000 2000 3000 4000 50000
2
4
6
8
10
Area / um2
Fre
q
0.24
0.19
0.14
0.09
0
0.05
De
nsity
0 1000 2000 3000 4000 50000
2
4
6
8
10
Area / um2
Fre
q
0 1000 2000 3000 4000 50000
2
4
6
8
10
Area / um2
Fre
q
0.22
0.17
0.13
0.09
0
0.04
Den
sity
0 1000 2000 3000 4000 50000
2
4
6
8
10
Area / um2
Fre
q
0 1000 2000 3000 4000 50000
2
4
6
8
10
Area / um2
Fre
q
0.22
0.17
0.13
0.09
0
0.04
Den
sity
0 1000 2000 3000 4000 50000
2
4
6
8
10
Area / um2
Fre
q
0 1000 2000 3000 4000 50000
2
4
6
8
10
Area / um2
Fre
q
0.22
0.17
0.13
0.09
0
0.04
Den
sity
0 1000 2000 3000 4000 50000
2
4
6
8
10
Area / um2
Fre
q
0 1000 2000 3000 4000 50000
2
4
6
8
10
Area / um2
Fre
q
0.27
0.22
0.16
0.11
0
0.05
De
nsity
0 1000 2000 3000 4000 50000
2
4
6
8
10
Area / um2
Fre
q
0 1000 2000 3000 4000 50000
2
4
6
8
10
Area / um2
Fre
q
0.27
0.22
0.16
0.11
0
0.05
De
nsity
0 1000 2000 3000 4000 50000
2
4
6
8
10
Area / um2
Fre
q
0 1000 2000 3000 4000 50000
2
4
6
8
10
Area / um2
Fre
q
0.27
0.22
0.16
0.11
0
0.05
De
nsity
A B
C D
Figure 26: Histograms of the cell area distribution. The cells were cultured on soft (A),
medium (B), hard (C) and glass (D) substrates. To assure the cells were in the same mitotic
stage, the cultures were allowed to develop until ~60% confluence was reached and then
subjected to a 24 hour starvation period. A shift to larger areas is observed between cultures
on soft gels and stiffer substrates. The red lines represent the Poisson distribution fit. The
maximum likelihood estimate for cell area on the soft, medium, hard and glass substrates are
1130 μm2, 2060 μm
2, 2450 μm
2, 2105 μm
2 with 1120 – 1140 μm
2, 2045 – 2075 μm
2, 2430 –
2465 μm2, 2090 - 2120 μm
2 95 % confidence intervals respectively.
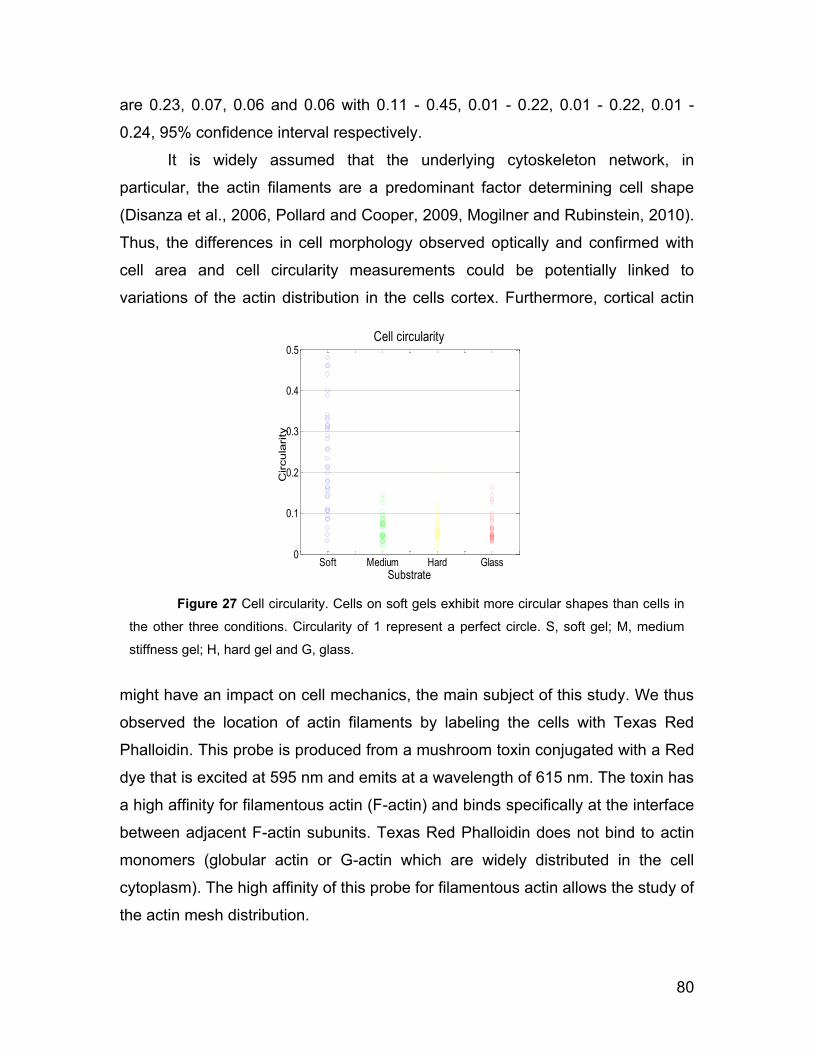
80
are 0.23, 0.07, 0.06 and 0.06 with 0.11 - 0.45, 0.01 - 0.22, 0.01 - 0.22, 0.01 -
0.24, 95% confidence interval respectively.
It is widely assumed that the underlying cytoskeleton network, in
particular, the actin filaments are a predominant factor determining cell shape
(Disanza et al., 2006, Pollard and Cooper, 2009, Mogilner and Rubinstein, 2010).
Thus, the differences in cell morphology observed optically and confirmed with
cell area and cell circularity measurements could be potentially linked to
variations of the actin distribution in the cells cortex. Furthermore, cortical actin
might have an impact on cell mechanics, the main subject of this study. We thus
observed the location of actin filaments by labeling the cells with Texas Red
Phalloidin. This probe is produced from a mushroom toxin conjugated with a Red
dye that is excited at 595 nm and emits at a wavelength of 615 nm. The toxin has
a high affinity for filamentous actin (F-actin) and binds specifically at the interface
between adjacent F-actin subunits. Texas Red Phalloidin does not bind to actin
monomers (globular actin or G-actin which are widely distributed in the cell
cytoplasm). The high affinity of this probe for filamentous actin allows the study of
the actin mesh distribution.
Soft Medium Hard Glass0
0.1
0.2
0.3
0.4
0.5
Substrate
Circula
rity
Cell circularity
Figure 27 Cell circularity. Cells on soft gels exhibit more circular shapes than cells in
the other three conditions. Circularity of 1 represent a perfect circle. S, soft gel; M, medium
stiffness gel; H, hard gel and G, glass.
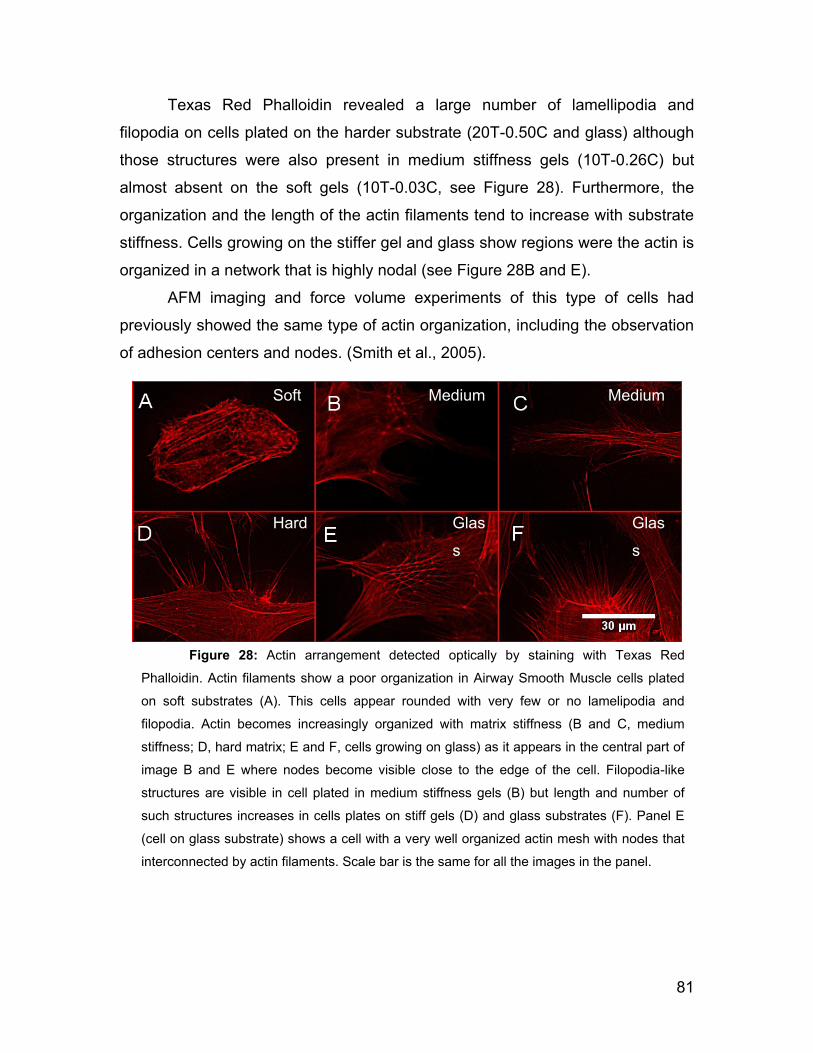
81
Texas Red Phalloidin revealed a large number of lamellipodia and
filopodia on cells plated on the harder substrate (20T-0.50C and glass) although
those structures were also present in medium stiffness gels (10T-0.26C) but
almost absent on the soft gels (10T-0.03C, see Figure 28). Furthermore, the
organization and the length of the actin filaments tend to increase with substrate
stiffness. Cells growing on the stiffer gel and glass show regions were the actin is
organized in a network that is highly nodal (see Figure 28B and E).
AFM imaging and force volume experiments of this type of cells had
previously showed the same type of actin organization, including the observation
of adhesion centers and nodes. (Smith et al., 2005).
Soft Medium Medium
Hard Glas
s
Glas
s
Figure 28: Actin arrangement detected optically by staining with Texas Red
Phalloidin. Actin filaments show a poor organization in Airway Smooth Muscle cells plated
on soft substrates (A). This cells appear rounded with very few or no lamelipodia and
filopodia. Actin becomes increasingly organized with matrix stiffness (B and C, medium
stiffness; D, hard matrix; E and F, cells growing on glass) as it appears in the central part of
image B and E where nodes become visible close to the edge of the cell. Filopodia-like
structures are visible in cell plated in medium stiffness gels (B) but length and number of
such structures increases in cells plates on stiff gels (D) and glass substrates (F). Panel E
(cell on glass substrate) shows a cell with a very well organized actin mesh with nodes that
interconnected by actin filaments. Scale bar is the same for all the images in the panel.
82
5.4 Dependence of the elastic properties of ASMC on the
substrate stiffness.
It has recently been reported that several cellular characteristics of in vitro
cultures are significantly linked to the mechanical properties of the matrix in
which they grow (Engler et al., 2006b; Saha et al., 2008b; Discher et al., 2009).
Thus, when investigating cellular behavior, matrix stiffness is an important
parameter to take into consideration if conclusions relevant to the in vivo
environment are to be drawn. In the present study, we were motivated to
determine whether the intrinsic viscoelastic properties of the cells are affected by
the mechanical properties of the matrix and give and initial exploratory view of
the effect of the matrix mechanics on other biologically relevant parameters such
as gene expression (genotype), cytoskeleton organization and proliferation (i.e.
cell viability). The present study should be seen as a starting point for future
more directed, biologically focused studies.
As described, polyacrylamide gels with three stiffnesses were prepared by
mixing 10 % w/v polyacrylamide with 0.03 % and 0.26 % w/v of the cross linker
BIS-acrylamide or 20 % w/v polyacrylamide with 0.50 % BIS-acrylamide and
used for cell growth. Cell cultures on glass were also included.
Prior to the measurement of the mechanical properties of the cells, they
were starved for 24 h in DMEM supplemented with 0.5 % FBS. This assured that
all the cells were in a non-proliferate stage of development and thus the cell cycle
phase does not play any role in the measured cell mechanics.
Force modulation measurement (refer to section 2.5.3 for details of the
procedure) were performed on the cytoplasm of cells (for a description of the
method used to determine the location to measure refer to material and methods
section). The experimental conditions employed were: a maximum prior-to-
modulation loading force of 0.3 nN and an additional oscillatory load of 7 nm
amplitude and 10 Hz frequency during ~ 15 sec followed by 20 sec unloaded
period to allow the cell relaxation and avoid damage. Due to the fact that the
preparation procedure as well as the cantilever drift stabilization, cantilever
sensitivity calibration, cell location, positioning and drag calibration were time

83
consuming, a maximum of three cells per dish were measured per day although
two cells was typical. For the duration of the measurements, the cells were
supplied with CO2 and kept at 37 C to prevent cellular deterioration. Each cell
was measured in a unique location between the nucleus and the cell edge.
Multiple measurements at different regions in a single cell were avoided to
prevent changes in cell mechanics due to prolonged loads. Even though the
measurements were performed on a sole location on the cell, previous results
from Smith et al., (2005) (see Figure 11) indicate that the data collected from
several cells in this thesis gives a representative view of the cells under the
specific tested conditions. In Figure 11B, it is possible to observe that the relative
elasticity of the region around the cell nucleus is homogeneous and differences
in elasticity are only evidenced at submicron areas (see Figure 11D). Since the
cell-bead contact area for the experimental conditions used in this thesis is ~ 3
μm2 (the contact radius is ~ 1 μm), it is reasonable to think that this methodology
is a very good approach to compute the overall mechanical properties of
individual cells. It is an indication that the AFM measurements are not sensitive
to the properties of individual fibers but it is an average of the elastic properties
over an area that contains several filaments.
On a typical day, cells on a maximum of three dishes were measured. The
total number of culture dishes employed and analyzed for the results presented
in this thesis were: 13, 10, 12 and 13 dishes for the cell cultured on glass, hard,
medium and soft substrates respectively. We thus report the results of 16-28
cells measured per substrate.
We found that the complex modulus of airway smooth muscle cells plated
on the substrates demonstrated that the elastic modulus of the cells tends to
increase until a maximum that is reached for hard matrices (see Figure 29). For
the conditions tested, the storage modulus was, 820 ± 360 Pa, 820 ± 280 Pa,
650 ± 300 Pa and 340 ± 160 Pa for the cells plated on glass, stiff gel, medium
stiffness gel and soft gel respectively. The fairly large standard deviations is due
to cell variability, as measurement errors are substantially smaller.
84
The experimental errors due to uncertainties in the estimation of the
contact point were estimated by substituting the typical values of the real part of
equation 14 (0.215 Pa m1/2 for the softest and 0.367 Pa m1/2 for the glass
substrates) and maximum estimated deviations of 20 nm from the typical
indentations δ0 (400 nm for cells on the softest and 200 nm for cells on glass)
into the equation 14. One thus obtains an estimate for the experimental error in
determining the elastic modulus from force modulation. We obtain of 2.5 % for
cells plated on softer matrix and 5 % for cells cultured on the glass substrate,
nearly an order of magnitude smaller than the observed standard deviation.
Additionally, it was shown in the material and methods section that the error due
to the lock-in amp output signals is in all the cases less than 100 Pa for cells
plated on stiff gels and ~ 20 Pa for cells cultured on the soft gels. Together, this
strongly indicates that the differences in the elastic modulus means as well as
the standard deviation are due to biological variability. A histogram of the elastic
modulus is shown in Figure 30.
Note that the absolute variability of the elastic modulus was narrower in
cells plated on the softer gel (160 Pa versus 280-360 Pa). As can be seen in
Figure 29, a trend that shows an increase of the mean elastic modulus of cells
plated on medium and hard gels is not statistically significant using the one-way
analysis of variance statistical analysis (one-way ANOVA) method. .The analysis
was performed in MatLab software, for an example of the methodology refer to
Appendix 2). ANOVA is used to discern whether or not the means of several
populations are statistically different or equal. It assumes that there is only one
factor that varies among the groups (in our case the substrate stiffness), that
there is independence of cases, equality of variances and the random variable
must be normally distributed. This assumption of only one variable is reasonable
since the culture dishes were all kept under the same incubation conditions and
the cells were in an arrested growth phase when the measurements were
performed. In other words, the results of these measurements, although an
average of cell plated on several dishes, are expected to be significant for each
group since all condition except the substrate were kept constant.
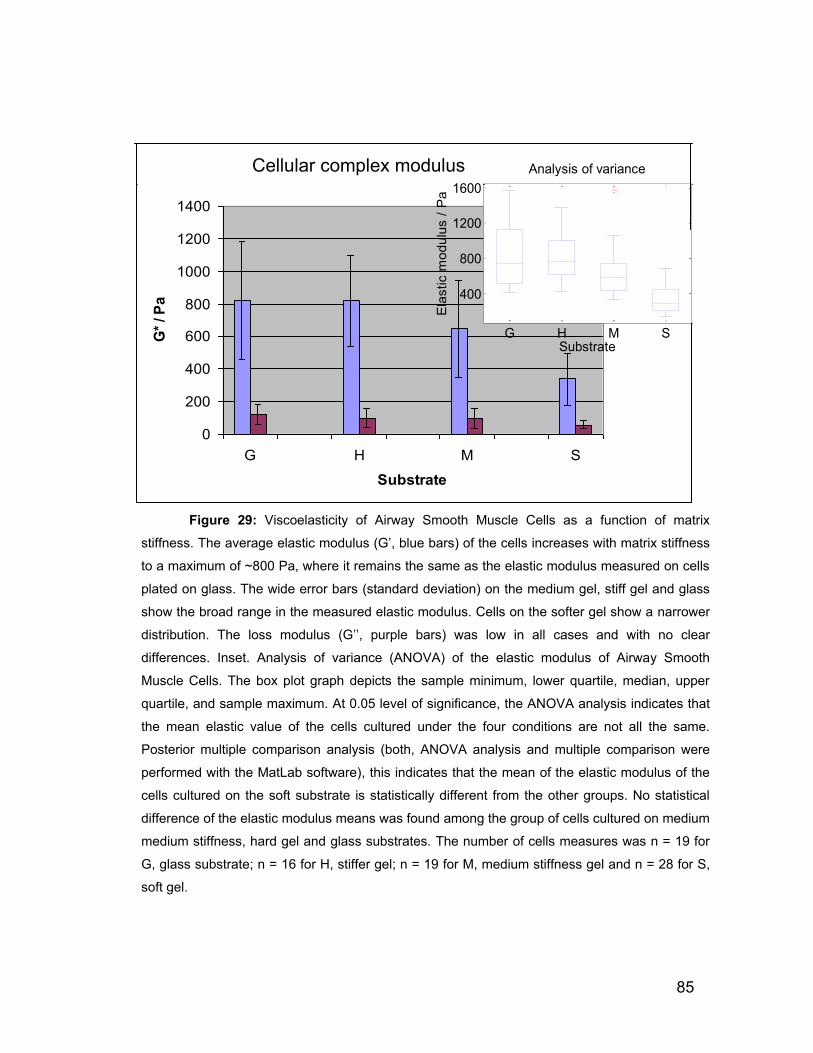
85
0
200
400
600
800
1000
1200
1400
G H M S
Substrate
G*
/ P
a
Series1
Series2
Cellular complex modulus
G H M S
400
800
1200
1600
Substrate
Ela
stic m
odulu
s /
Pa
Analysis of variance
Figure 29: Viscoelasticity of Airway Smooth Muscle Cells as a function of matrix
stiffness. The average elastic modulus (G‟, blue bars) of the cells increases with matrix stiffness
to a maximum of ~800 Pa, where it remains the same as the elastic modulus measured on cells
plated on glass. The wide error bars (standard deviation) on the medium gel, stiff gel and glass
show the broad range in the measured elastic modulus. Cells on the softer gel show a narrower
distribution. The loss modulus (G‟‟, purple bars) was low in all cases and with no clear
differences. Inset. Analysis of variance (ANOVA) of the elastic modulus of Airway Smooth
Muscle Cells. The box plot graph depicts the sample minimum, lower quartile, median, upper
quartile, and sample maximum. At 0.05 level of significance, the ANOVA analysis indicates that
the mean elastic value of the cells cultured under the four conditions are not all the same.
Posterior multiple comparison analysis (both, ANOVA analysis and multiple comparison were
performed with the MatLab software), this indicates that the mean of the elastic modulus of the
cells cultured on the soft substrate is statistically different from the other groups. No statistical
difference of the elastic modulus means was found among the group of cells cultured on medium
medium stiffness, hard gel and glass substrates. The number of cells measures was n = 19 for
G, glass substrate; n = 16 for H, stiffer gel; n = 19 for M, medium stiffness gel and n = 28 for S,
soft gel.
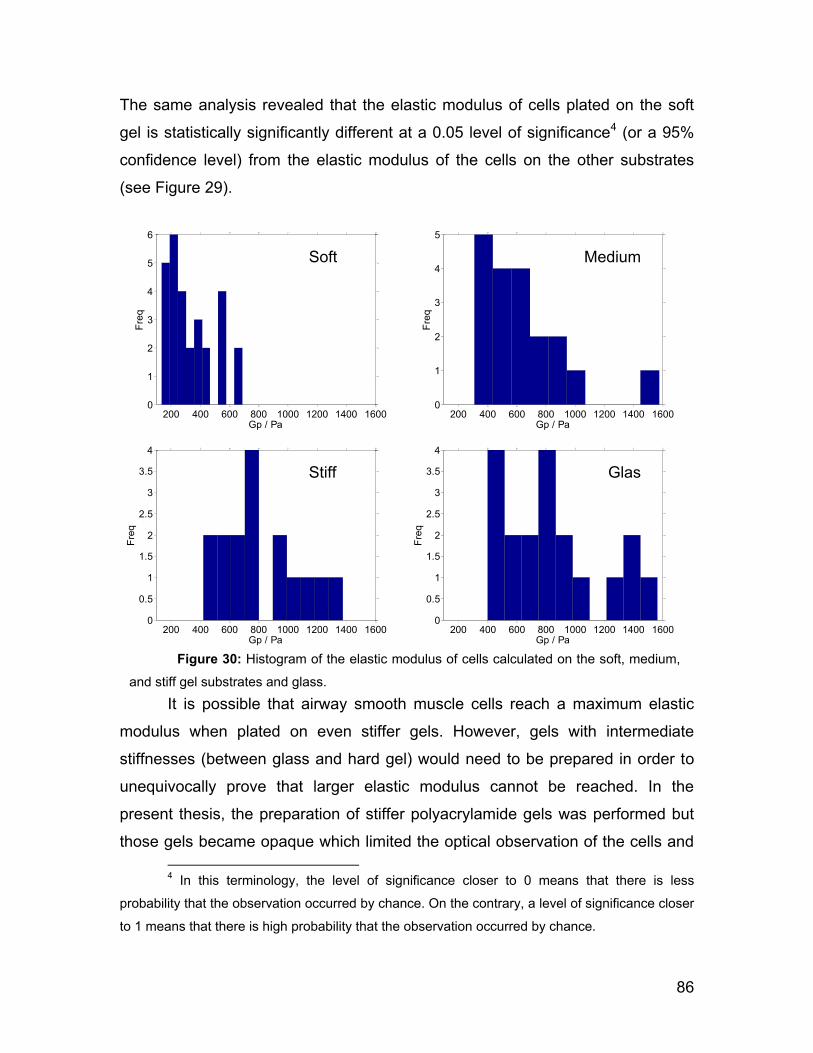
86
The same analysis revealed that the elastic modulus of cells plated on the soft
gel is statistically significantly different at a 0.05 level of significance4 (or a 95%
confidence level) from the elastic modulus of the cells on the other substrates
(see Figure 29).
It is possible that airway smooth muscle cells reach a maximum elastic
modulus when plated on even stiffer gels. However, gels with intermediate
stiffnesses (between glass and hard gel) would need to be prepared in order to
unequivocally prove that larger elastic modulus cannot be reached. In the
present thesis, the preparation of stiffer polyacrylamide gels was performed but
those gels became opaque which limited the optical observation of the cells and
4 In this terminology, the level of significance closer to 0 means that there is less
probability that the observation occurred by chance. On the contrary, a level of significance closer
to 1 means that there is high probability that the observation occurred by chance.
200 400 600 800 1000 1200 1400 16000
1
2
3
4
5
6
Gp / Pa
Fre
q
200 400 600 800 1000 1200 1400 16000
1
2
3
4
5
Gp / PaF
req
200 400 600 800 1000 1200 1400 16000
0.5
1
1.5
2
2.5
3
3.5
4
Gp / Pa
Fre
q
200 400 600 800 1000 1200 1400 16000
0.5
1
1.5
2
2.5
3
3.5
4
Gp / Pa
Fre
q
Glas
s
Medium
Stiff
Soft
Figure 30: Histogram of the elastic modulus of cells calculated on the soft, medium,
and stiff gel substrates and glass.

87
thus made it impossible to determine the contact location where the AFM probe
interacted with the cells. Cell culturing and complex modulus measuring on
substrates with stiffness between that of the soft and medium gel would be of
interest for futures studies that use the methodology presented here.
The loss modulus of the cells appeared more uniform and narrower than
the elastic modulus in all the samples. Their estimated averages were 120 ± 60
Pa, 100 ± 60 Pa, 90 ± 60 Pa and 60 ± 30 Pa for the cells growing on the glass,
stiff gel, medium stiffness gel and soft gel respectively. These values indicate
that the cells are prominently elastic with a low dissipative modulus that
essentially remains the same irrespectively of the matrix stiffness. One-way
ANOVA did not show any significant difference among the conditions.
An immediate questions is whether or not the variability observed in
Figure 29 reflect variations of the complex modulus of cells cultured on different
days or from different animals. To address this issue we looked at the elastic
modulus (determined by force modulation) of 12 cells. Nine of them (cells
cultured on the polyacrylamide substrates) were obtained from the same animal
and plated at the same time. The other three cells (cultured on glass substrate)
were cultured a different day but they were growing in the same dish which
eliminated the variable related to the origin and the incubation conditions of the
cells. For each cell measured, only one location on them (between the nucleus
and the cell edge) was tested. The data plotted in Figure 31 is the average of
three to four indentation modulation cycles (frequency 10 Hz and amplitude 7nm)
performed with 15 seconds intervals and in the same location on the cell. In the
graph, the error bars are too small to be visible (this error is associated to the
uncertainty of the lock-in output signals, refer to Figure 16 and section 2.5.3).
The magnitude of this error becomes clearer in Figure 32 where the elastic and
loss modulus vs. time is plotted. In the figure, each data point corresponds to the
modulus computed for a single indentation modulation cycle at a frequency of 10
Hz and the interval between each indentation cycle was from 15 – 20 s. Each
oscillatory cycle lasted for 15 s. Calculation of the error due to the averaging of
the loss modulus in time was found to be less than 100 Pa for the elastic
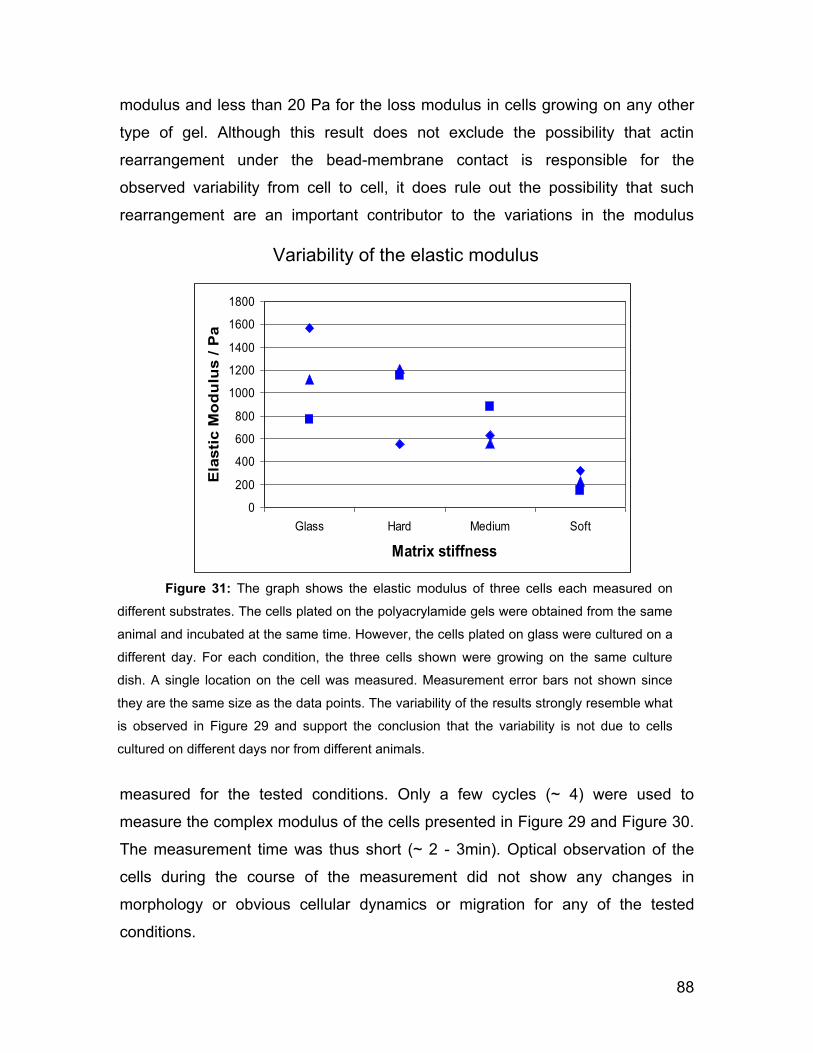
88
modulus and less than 20 Pa for the loss modulus in cells growing on any other
type of gel. Although this result does not exclude the possibility that actin
rearrangement under the bead-membrane contact is responsible for the
observed variability from cell to cell, it does rule out the possibility that such
rearrangement are an important contributor to the variations in the modulus
measured for the tested conditions. Only a few cycles (~ 4) were used to
measure the complex modulus of the cells presented in Figure 29 and Figure 30.
The measurement time was thus short (~ 2 - 3min). Optical observation of the
cells during the course of the measurement did not show any changes in
morphology or obvious cellular dynamics or migration for any of the tested
conditions.
0
200
400
600
800
1000
1200
1400
1600
1800
Glass Hard Medium Soft
Matrix stiffness
Ela
sti
c M
od
ulu
s /
Pa
Figure 31: The graph shows the elastic modulus of three cells each measured on
different substrates. The cells plated on the polyacrylamide gels were obtained from the same
animal and incubated at the same time. However, the cells plated on glass were cultured on a
different day. For each condition, the three cells shown were growing on the same culture
dish. A single location on the cell was measured. Measurement error bars not shown since
they are the same size as the data points. The variability of the results strongly resemble what
is observed in Figure 29 and support the conclusion that the variability is not due to cells
cultured on different days nor from different animals.
Variability of the elastic modulus

89
Together, these results strongly suggest that the variability observed in
Figure 29 is indeed only a consequence of cell-cell differences and not due to a
cell specific response to being probed.To summarize, our results thus suggest
that there is a large variability in the elastic modulus even for cells cultured in the
same dish. The origin of the variability in Figure 29 does not seem to be due to
the origin of the cells (i.e. different animal), day of measurement or the (arrested)
cell cycle phase. This result, in addition to previous published reports (Smith et
al., 2005) that shows that the elastic properties of the cytoplasm region of a
single ASMC is not highly variable suggest that the differences in the elastic
modulus observed among the substrates is linked to intrinsic differences between
the cells. The data above demonstrate that the cells growing on soft substrates
with more tissue like mechanical properties are statistically softer and have a
lower variability than cells grown on all other substrates. Cells grown on stiffer
substrates are similar both in terms of modulus and variability.
0 30 60 90 120 150
100
200
400
600
8001000
Time / s
G*
/ Pa
0 30 60 90 120 150
100
200
400
600
8001000
Time / s
G*
/ Pa
Figure 32: Evolution of the complex modulus for a single cell at a single location in
time. For the data showed, the averaged elastic modulus (blue points) was 850 ± 75 Pa while
the loss modulus was 140 ± 25 Pa.
Evolution of G* on one location on one cell
G‟
G‟‟
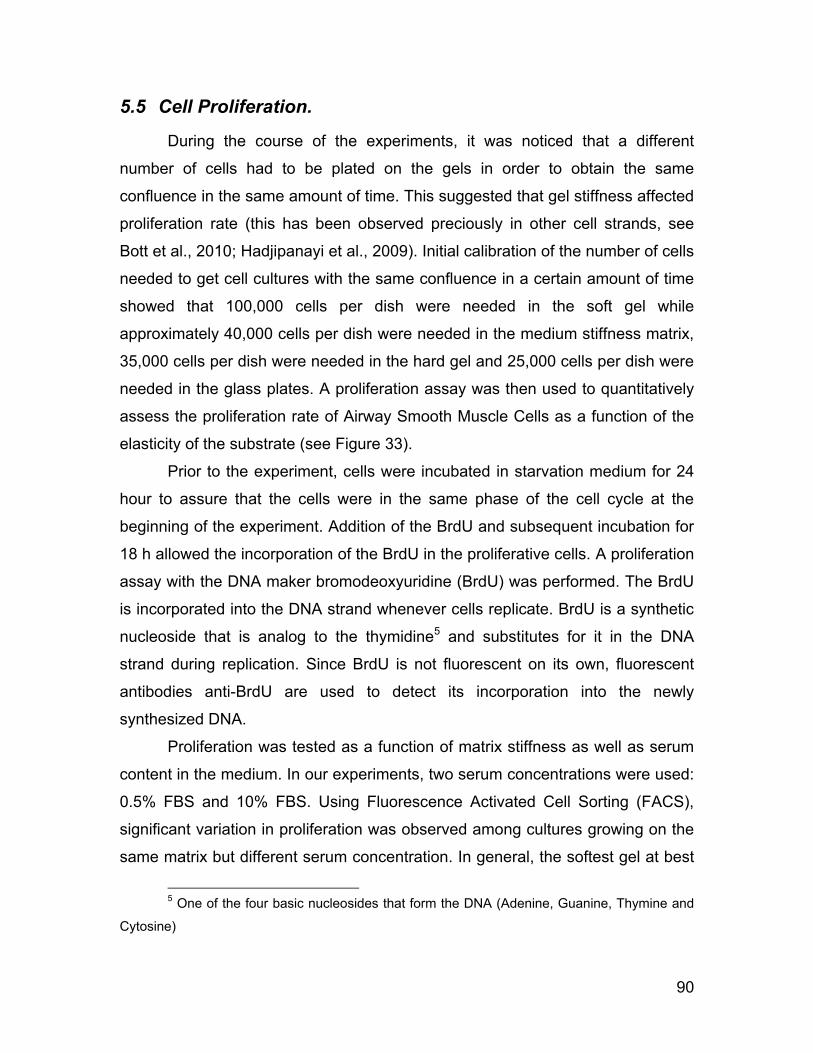
90
5.5 Cell Proliferation.
During the course of the experiments, it was noticed that a different
number of cells had to be plated on the gels in order to obtain the same
confluence in the same amount of time. This suggested that gel stiffness affected
proliferation rate (this has been observed preciously in other cell strands, see
Bott et al., 2010; Hadjipanayi et al., 2009). Initial calibration of the number of cells
needed to get cell cultures with the same confluence in a certain amount of time
showed that 100,000 cells per dish were needed in the soft gel while
approximately 40,000 cells per dish were needed in the medium stiffness matrix,
35,000 cells per dish were needed in the hard gel and 25,000 cells per dish were
needed in the glass plates. A proliferation assay was then used to quantitatively
assess the proliferation rate of Airway Smooth Muscle Cells as a function of the
elasticity of the substrate (see Figure 33).
Prior to the experiment, cells were incubated in starvation medium for 24
hour to assure that the cells were in the same phase of the cell cycle at the
beginning of the experiment. Addition of the BrdU and subsequent incubation for
18 h allowed the incorporation of the BrdU in the proliferative cells. A proliferation
assay with the DNA maker bromodeoxyuridine (BrdU) was performed. The BrdU
is incorporated into the DNA strand whenever cells replicate. BrdU is a synthetic
nucleoside that is analog to the thymidine5 and substitutes for it in the DNA
strand during replication. Since BrdU is not fluorescent on its own, fluorescent
antibodies anti-BrdU are used to detect its incorporation into the newly
synthesized DNA.
Proliferation was tested as a function of matrix stiffness as well as serum
content in the medium. In our experiments, two serum concentrations were used:
0.5% FBS and 10% FBS. Using Fluorescence Activated Cell Sorting (FACS),
significant variation in proliferation was observed among cultures growing on the
same matrix but different serum concentration. In general, the softest gel at best
5 One of the four basic nucleosides that form the DNA (Adenine, Guanine, Thymine and
Cytosine)
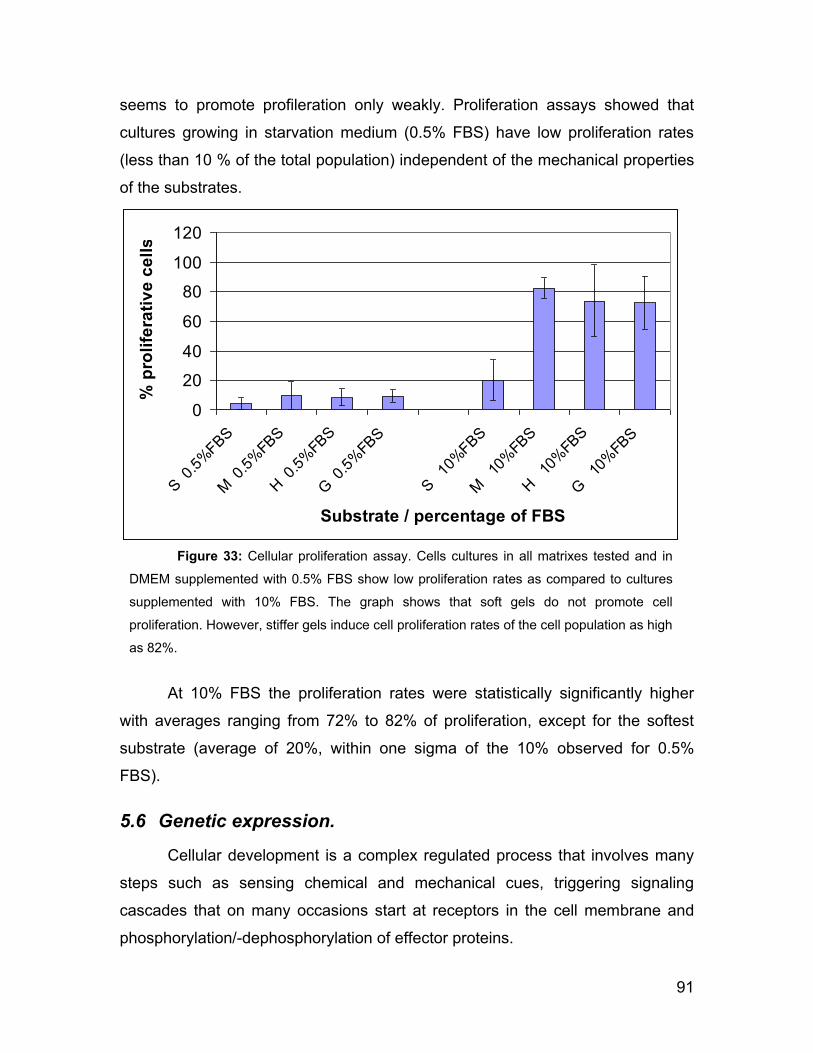
91
seems to promote profileration only weakly. Proliferation assays showed that
cultures growing in starvation medium (0.5% FBS) have low proliferation rates
(less than 10 % of the total population) independent of the mechanical properties
of the substrates.
At 10% FBS the proliferation rates were statistically significantly higher
with averages ranging from 72% to 82% of proliferation, except for the softest
substrate (average of 20%, within one sigma of the 10% observed for 0.5%
FBS).
5.6 Genetic expression.
Cellular development is a complex regulated process that involves many
steps such as sensing chemical and mechanical cues, triggering signaling
cascades that on many occasions start at receptors in the cell membrane and
phosphorylation/-dephosphorylation of effector proteins.
0
20
40
60
80
100
120
S 0
.5%
FBS
M 0
.5%
FBS
H 0
.5%
FBS
G 0
.5%
FBS
S
10%
FBS
M
10%
FBS
H
10%
FBS
G
10%
FBS
Substrate / percentage of FBS
% p
roli
fera
tiv
e c
ell
s
Figure 33: Cellular proliferation assay. Cells cultures in all matrixes tested and in
DMEM supplemented with 0.5% FBS show low proliferation rates as compared to cultures
supplemented with 10% FBS. The graph shows that soft gels do not promote cell
proliferation. However, stiffer gels induce cell proliferation rates of the cell population as high
as 82%.
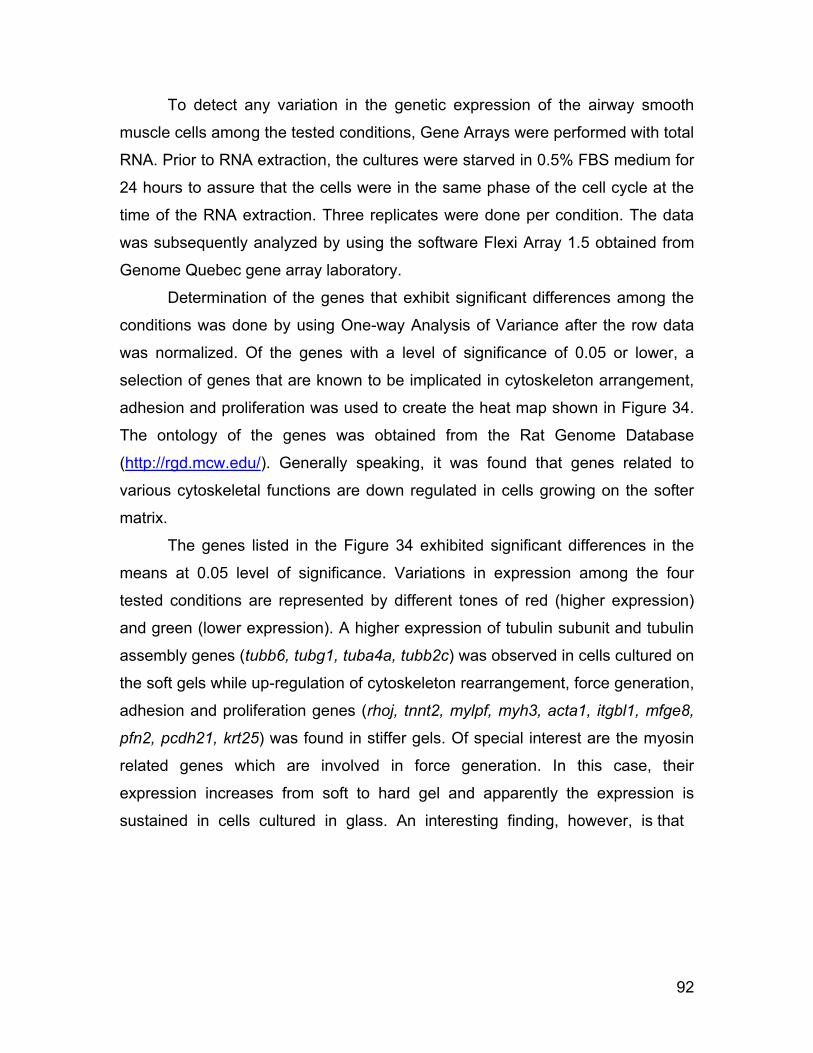
92
To detect any variation in the genetic expression of the airway smooth
muscle cells among the tested conditions, Gene Arrays were performed with total
RNA. Prior to RNA extraction, the cultures were starved in 0.5% FBS medium for
24 hours to assure that the cells were in the same phase of the cell cycle at the
time of the RNA extraction. Three replicates were done per condition. The data
was subsequently analyzed by using the software Flexi Array 1.5 obtained from
Genome Quebec gene array laboratory.
Determination of the genes that exhibit significant differences among the
conditions was done by using One-way Analysis of Variance after the row data
was normalized. Of the genes with a level of significance of 0.05 or lower, a
selection of genes that are known to be implicated in cytoskeleton arrangement,
adhesion and proliferation was used to create the heat map shown in Figure 34.
The ontology of the genes was obtained from the Rat Genome Database
(http://rgd.mcw.edu/). Generally speaking, it was found that genes related to
various cytoskeletal functions are down regulated in cells growing on the softer
matrix.
The genes listed in the Figure 34 exhibited significant differences in the
means at 0.05 level of significance. Variations in expression among the four
tested conditions are represented by different tones of red (higher expression)
and green (lower expression). A higher expression of tubulin subunit and tubulin
assembly genes (tubb6, tubg1, tuba4a, tubb2c) was observed in cells cultured on
the soft gels while up-regulation of cytoskeleton rearrangement, force generation,
adhesion and proliferation genes (rhoj, tnnt2, mylpf, myh3, acta1, itgbl1, mfge8,
pfn2, pcdh21, krt25) was found in stiffer gels. Of special interest are the myosin
related genes which are involved in force generation. In this case, their
expression increases from soft to hard gel and apparently the expression is
sustained in cells cultured in glass. An interesting finding, however, is that
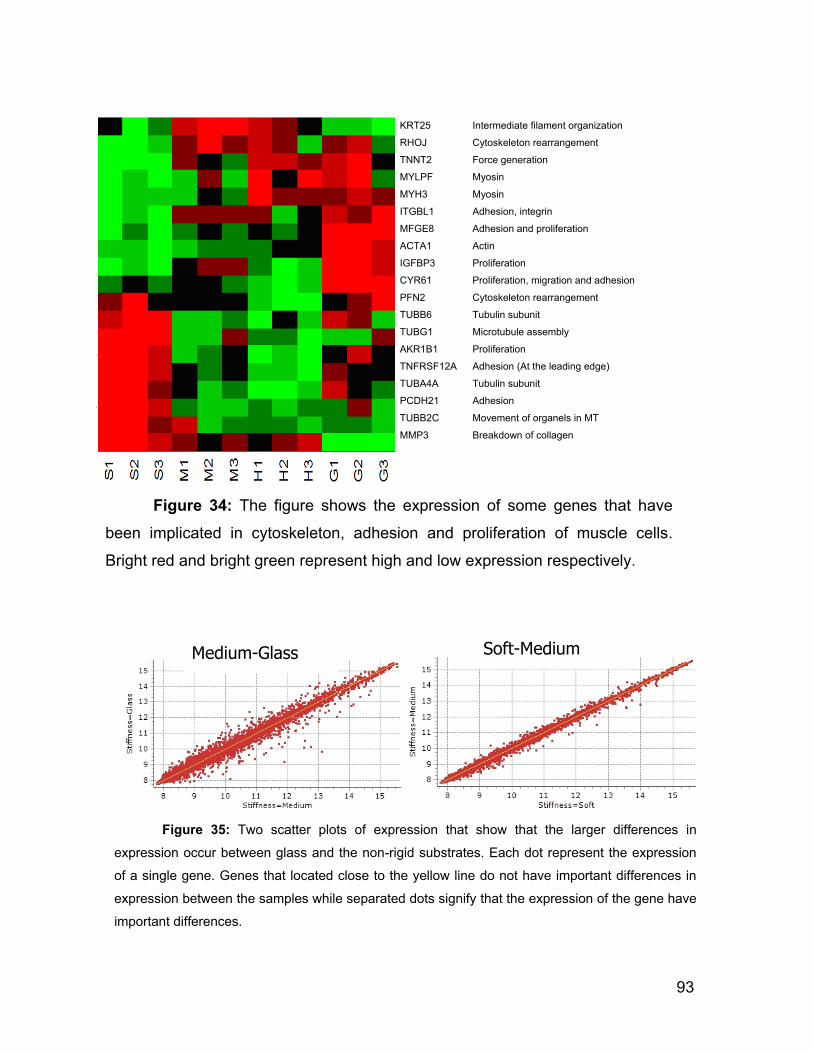
93
KRT25 Intermediate filament organization
RHOJ Cytoskeleton rearrangement
TNNT2 Force generation
MYLPF Myosin
MYH3 Myosin
ITGBL1 Adhesion, integrin
MFGE8 Adhesion and proliferation
ACTA1 Actin
IGFBP3 Proliferation
CYR61 Proliferation, migration and adhesion
PFN2 Cytoskeleton rearrangement
TUBB6 Tubulin subunit
TUBG1 Microtubule assembly
AKR1B1 Proliferation
TNFRSF12A Adhesion (At the leading edge)
TUBA4A Tubulin subunit
PCDH21 Adhesion
TUBB2C Movement of organels in MT
MMP3 Breakdown of collagen
Figure 34: The figure shows the expression of some genes that have
been implicated in cytoskeleton, adhesion and proliferation of muscle cells.
Bright red and bright green represent high and low expression respectively.
Soft-Medium Medium-Glass
Figure 35: Two scatter plots of expression that show that the larger differences in
expression occur between glass and the non-rigid substrates. Each dot represent the expression
of a single gene. Genes that located close to the yellow line do not have important differences in
expression between the samples while separated dots signify that the expression of the gene have
important differences.
94
generally speaking, the variability of the genetic expression is larger between
cells cultivated on glass as compared to any of the gels. (see Figure 35).
5.7 Summary, Conclusions and Discussion
5.7.1 Mechanical properties of the polyacrylamide gel and fibronectin
functionalization.
It is well known that chemical cues play an important role in the
determination of cell fate, genetic expression, protein content, morphology,
functionality, etc. but less is know about the role of mechanical cues on cell
behavior. Some of the available knowledge is attributable to Engler et al.,
(2006a); Saha et al., (2008a). They discovered that variations in matrix stiffness
are sufficient to trigger cell differentiation of stem cells. This finding demonstrates
that the mechanical properties of the cell surroundings are an important and
possibly a determinant factor to trigger several cellular processes. To further
study these effects, the AFM was used in the present study as a tool to explore
the role of physical cues on the cellular properties such as elasticity, proliferation
and gene expression.
In this study, polyacrylamide gels were chosen as substrates for cell
cultures because of the simplicity to accomplish the tuning of their stiffness. It
can be adjusted by varying the amount of polymer (acrylamide) and cross-linker
(BIS-acrylamide). Three polyacrylamide substrates prepared with 10%
acrylamide, 0.03% BIS-acrylamide for the softest gel; 10% acrylamide, 0.26%
BIS-acrylamide for the medium stiffness gel and 20% acrylamide, 0.50% BIS-
acrylamide for the stiff gel were prepared. Additionally, glass substrates were
employed to prepare cell cultures. Gels with higher concentrations of acrylamide
(30% and 40%) were prepared but they became opaque after polymerization.
Since the observation of the cells was performed from underneath by using an
inverted optical microscope, the opaqueness of the gels limited the optical
localization of the ASMC on the substrates and they were not employed in this
thesis (the optical observation of the bead-cell contact is essential to perform the
95
methodology described in section 2.5). Transparency was not an issue on cell
cultures prepared on glass.
One of the objectives of this study was to evaluate the effect of non rigid
substrates on cell behavior. Cultures prepared on glass substrates (rigid
substrate) were included because it is the most widely used substrate in cell
culture preparations. Thus, comparison of cellular behavior on polyacrylamide
gels vs. glass substrates is of interest to elucidate how cells react to matrix
stiffness. The rigidity of glass (~ 70 GPa, Van Vlack, 1982) is larger than bone
(15 – 20 GPa, Hoffmeister et al., 2000; Rho et al., 1993) although both are in the
GPa regime. It makes the glass the most rigid substrate employed in this study.
Cell cultures used in the experiments were typically incubated for five
days. Therefore, the use of substrates whose mechanical properties are stable
for that period of time was necessary. The Young‟s modulus of the
polyacrylamide gels was measured for six consecutive days to keep track of their
mechanical stability. The conditions at which the gels were stored during this
time were the same than that used when cell cultures were prepared. Force-
distance curves at ~ 750 locations on the gels were taken each day. No
difference in the Young‟s modulus was observed in the time indicating that the
stiffness of the polyacrylamide gels is not affected by the incubation (see Figure
23). On average, stiffness of the soft, medium and hard gels was 0.9 ± 0.2 kPa,
3.7 ± 0.3 kPa and 6.3 ± 0.5 kPa respectively.
Determination of the Young‟s modulus of glass with the AFM proved to be
unreliable mainly due to the large sensitivity of the Hertz model to small
indentations. The curves in Figure 24 shows that the accurate determination of
the stiffness of a rigid substrate requires a very precise (precision of nm or lower)
estimation of the contact point. Cantilever bending due to movement in liquid
might systematically affect the determination of the contact point. Equation 11
predicts that even small uncertainties in the determination of the contact point
can affect the calculation of E in stiff materials such as glass and polystyrene.
The use of a much harder indenter (harder than glass) that does not
deform is also necessary. This is clearly not the case for polystyrene bead tips
96
which have a Young‟s modulus of 2 – 4 GPa depending on the measurement
method (Lubarsky et al., 2004; Miyake et al., 2006; Brighton, 1979) and glass
(~70 GPa) as the substrate. Hence, it is mainly the indenter which is deformed.
Diamond coated tips would need to be used to measure very hard substrates
such as glass; their shape is however not well defined, making quantitative
analysis of nanoindents challenging.
Finally, the use of very small indentation depths can also contribute to the
unreliable determination of the Young‟s modulus of polystyrene. It is possible that
a swelling of the outer layer of the polystyrene leads to measured elastic moduli
values much lower than the bulk values reported in the literature. We base this
hypothesis on the observation that when old polystyrene beads are imaged in
AFM or SEM, they look “fuzzy” which might be an indication of the effect of liquid
on the bead surface.
The indentation caused by the beaded cantilever on gels was large (100-
350 nm, see Figure 24) and the sensitivity of the Hertz model to the precise
determination of the indentation onset thus smaller (see equation 11). The
stiffness of the polystyrene, which was three orders of magnitude larger than the
stiffness of gels, assured that the deformation occurred only on the substrate. In
these situations the Hertz model is thus expected to allow a reliable
determination of the mechanical properties of the polyacrylamide gels and cells.
In this study, all the surfaces (polyacrylamide and glass substrates) were
coated with fibronectin. There were two reasons to do that: the first is that
differences in substrate chemistry can alter cell behavior (Jie Song, 2004) and
the second is the simple fact that cells do not adhere to bare polyacrylamide
gels. Bare and functionalized glass demonstrated to be a well suited substrate for
in vitro cultures. In both cases, cells adhere and thrive. However and even
though bare and functionalized glass support cell growth, some studies indicate
that cells plated on both substrates do not behave equally. Jie Song, 2004 for
instance, cultured osteosarcoma TE85 cells on anionic functionalized surfaces as
well as bare glass and reported variations in protein content and cell adhesion.
This study points out to the necessity of keeping control of the surface chemistry
97
to avoid variations of cell behavior due to factors other than the variable of
interest.
Fibronectin functionalization of the polyacrylamide gels required the use of
the linker sulfo-SANPAH which covalently binds to both, the fibronectin protein in
one extreme and the polyacrylamide polymer on the other. Passive absorption of
the protein into the polyacrylamide gels proved to be ineffective for
functionalization.
5.7.2 The use of the AFM to investigate the mechanics of the cells.
There is increasing evidence (Wang and Ingber, 1994; Shyy and Chien,
1997; Jaasma et al., 2007; Gavara et al., 2008; Icard-Arcizet et al., 2008) that the
cellular behavior and function are importantly influenced not only by chemical
cues, which have been extensively studied for decades, but also respond to the
mechanical properties of the surroundings. Although intuitively we expect that the
mechanical properties of the substrates (for in vivo experiments) or the tissues
(living organisms) affect the cellular functions, no detailed studies were reported
until recently (i. e. Paszek et al., 2005; Discher et al., 2009). However, despite
these efforts, many questions still remain unanswered and further studies have to
be done to elucidate the fine relation between the mechanical properties of the
substrates on the cellular functions and behavior.
A variety of mechanical properties are distinguished in different parts of
the organisms, especially in those which have evolved to complex structures with
well defined body organization and differentiated tissues. Bone, for example, is a
very stiff structure that provides support and resistance to the body of many
animals. At the same time, it keeps the bone marrow tissue in its porous, inner
structure. Tendons and ligaments are made of connective tissue which contains
large numbers of fibroblast and is able to withstand substantial tension when
muscle cells shorten or joints are moved. One of the softer tissues in the
organism, the brain, is a compact mass of different soft cells. This tissue is very
delicate but at the same time highly specialized.
98
All mammalian cells contain an inner cytoskeleton which is a structure that
is composed of microtubules and intermediate filament enclosed by an actin
mesh. The cortical actin is located underneath the cell membrane which is the
most external part of the cells. It has a typical thickness of from 390 nm to 770
nm (Lang et al., 2000). The thickness of the cell membrane is only ~ 10 nm
(McMahon, H. T. and J. L. Gallop, 2005). Given these dimensions and
considering the ability of the AFM to produce small loads, indentations and
contact radius, this instrument is well suited to study the mechanics of individual
cells. Thus, AFM can provide some information to answer questions such as how
the elastic properties of tissue is linked to functions and what are these
connections? An example of its usefulness is found in a study recently published
by our group (Risse et al., 2011) where it was found by AFM force spectroscopy
that IL-13 treated cells have an increased response to the stimulation with the
contractile agonist histamine. Another example is the observation by AFM force
spectroscopy that the ASMC smooth muscle cells contract when exposed to
stimuli leading to asthma at the organ level. AFM force spectroscopy can answer
questions such as which components of the individual cell reacts and why does
this induce a contractile response, as addressed by our group using AFM force
spectroscopy of ASCM cells plated on glass cover slips (Smith, 2004). Given the
fact that cell phenotype and genotype can differ as a function of substrate
properties it is an important question to determine how cell mechanical properties
are affected by the substrate.
At the single cell level, recent experiments have indicated a change in
elastic properties as a function of the state of the cell. Cancer cells are softer
than healthy cells (Sarah and et al., 2008; Suresh, 2007). These empirical
observations are not well understood but clearly cell phenotype can in some
cases be determined by measurement of the viscoelastic properties of an
individual cell.
Small and localized probing forces do not dramatically disturb the cells as
a whole and can be applied by an AFM. This is due to the low spring constant of
the cantilevers employed in this thesis (0.01 N/m), which allows the application of

99
picoNewton forces. In this study, small probing forces of 0.3 nN were generally
used and produced indentation depths of approximately 200 nm in cells cultured
on glass substrates. Indentations produced in cells cultured on the soft
polyacrylamide gel were usually larger (~ 400 nm) as a result of their softer
nature (see Figure 12). The bead-cell membrane contact radius calculated for the
indentation and loading forces mentioned before vary between 0.8 μm and 1 μm
(the former for „stiff‟ cells, the latter for softer cells). Thus, the use of the beaded
cantilever also allowed us to compute the mechanical properties of the samples
over an area that averages many individual actin filaments (see Figure 13).
Force-volume imaging performed by Smith et al., (2005) on ASMC also
evidenced that the use of large contact areas is preferred to average over the
elastic properties of a region and be insensitive to punctual cell structures.
5.7.3 Correlation between the substrate stiffness, the viscoelasticity of
ASMC and the actin content.
By using the AFM, we found that smooth muscle cells are capable of
sensing and adapting to the mechanical properties of their proximate surrounding
by adjusting their own mechanical properties, proliferation rate, morphology and
genetic expression. The mechanism and feedback loops by which a cell performs
this is not understood. Any hypothesis to explain this phenomena can be tested
by the AFM method demonstrated in this thesis by knocking-out the relevant
genes coding for the structures/proteins suspected and measuring the
mechanical properties of cells grown on substrates of different mechanical
properties.
The data presented in section 5.4 exhibits a trend that shows an increase
in the cell elastic modulus with matrix stiffness. One-way analysis of variance
(ANOVA) only found significant difference (p<0.05) between cells cultured on the
softest substrate and any of the other conditions. The elastic component of the
complex modulus increased from 340 ± 160 Pa in cells cultured on the softer
substrate to 650 ± 300 Pa in medium stiffness and 820 ± 280 Pa in hard
polyacrylamide substrates. Interestingly, the average elastic modulus of cells
100
cultured on glass (820 ± 360 Pa) did not show a significant difference compared
to the storage modulus of cells cultured on the stiffer polyacrylamide gel (see
Figure 29). ANOVA performed on the loss modulus of data obtained on cells
from the four groups showed no significant differences (p<0.05).
A previous study by Smith et al., 2005 has qualitatively shield light on the
spatial variation of the elastic modulus of the same cells as used in this study
cultivated on glass. Force-volume imaging of confluent cells showed qualitatively
that the cell nucleus is softer than the rest of the cell. It was also found that all the
cytoplasmic region of the cell have a very similar stiffness when scanning over a
large area. Differences in stiffness in the cytoplasm were only evident when
probed on a submicron area. We thus conclude that if the nucleus is avoided,
relevant and significant measurements of the elastic properties of an individual
cell can be performed by a single measurement with a spatial averaging area of
at least 1 μm2. In the experiments presented in this thesis this averaging area
was determined to be at least 3 μm2 from an analysis of the Hertzian contact
area.
Exploration of the mechanical properties of cells cultured on stiffnesses
larger than 6300 ± 500 Pa and lower than that of glass was not done due to the
fact that stiffer polyacrylamide gels turned opaque, limiting the crucial step of cell
localization. Future studies, driven by cellular biology inspired hypothesis, might
be performed to investigate the transition between soft and medium substrate, as
cells grown on the soft substrate are the only ones to show a statistically
significant difference in elasticity, shape and profilation as compared to the other
cells.
The standard deviation of the measured elastic moduli is substantially
larger than experimental errors. Thus a significant variability of the elastic
modulus of cells cultured on the same substrate was observed. A larger
variability was observed on harder substrates. Currently we do not know where
this variability comes from. The cytoskeleton structures beneath the bead-cell
contact is relevant, as it might play a critical role in the determination of the
mechanical properties as well as in the variability observed within groups. One
101
could hypothesize that the lower variability observed on cells that belong to soft
substrate cultures is in part due to the absence of bundle fibers and more uniform
cytoskeleton with only thin interconnected fibers. The observations of the
cytoskeleton of identical cells cultured on glass by Smith et al., (2005) leads to
the exclusion of this hypothesis, as on an area of 1 μm2 these cells looked very
homogenous outside of the nuclear region. Understanding this variability is an
interesting future project that should be driven by a deeper biological
understanding.
All the measurement were performed on cell cultures that were starved in
DMEM plus 0.5% FBS for 24 h prior to the experiments. This assured that the
cells were in the same phase of the cell division cycle and thus the mitotic phase
is not responsible for the variability observed. Although not explored in detail, the
observed variability is not a consequence of measurements performed on cell
cultures prepared on different days since same day measurements already show
a large variability (see Figure 31).
The indentation depths used in the experiments are 10 – 20 % of the cell
thickness and thus will be insensitive to many cell internal structures. The 10-
20% indentation depth maxima was used as this is a criterion known in thin film
contact mechanics to lead to the mechanical properties of the thin film being
measured and not that of the underneath support), There are other strong
indications that the substrate does not directly contribute to the mechanical
properties of the measured cells. Bausch et al., 1998, for instance, demonstrated
that the penetration of the shear displacement field induced by the movement
(i.e. torque) of a magnetic bead attached to integrins on the cell membrane is
reduced and it does not reach the base of the cell. The result suggests that
localized structures are the main responders to localized loads, not the
cytoskeleton, and thus the measured mechanical properties. Integrins are
connected directly to the cytoskeleton on the inside of the cell membrane, and
thus beads used in such experiments are expected to measure a different elastic
modulus than beads attached to AFM tips. This difference between magnetic
bead, AFM and other measurements is one of the reasons for the on-going
102
debate regarding the mechanical properties of cells – this is due to the fact, often
not recognized, that different methods are sensitive to different structures of a
cell. Previous studies performed in our group (Smith et al., 2005) presented
evidence implicating actin as the dominant structure responsible for the cell
stiffening. Thus, actin dynamic has a prevalent role in near surface mechanics
and the AFM data presented in this thesis.
The largest indentations used in our study were lower or at the most equal
to the actin cortex thickness reported in the literature (390 nm to 770 nm, Lang et
al., 2000). Smith et al., (2005) demonstrated that the mechanical properties of a
cell measure by AFM changed dramatically if the cortical actin gel is disrupted
with cytochalasin-D. This is similar to the observation of cells treated with a
myosin light chain kinase inhibitors (1-(5-iodonaphthalene-1-sulfonyl)-1H-
hexahydro-1,4-diazepine hydrochloride, ML-7) Other studies lead by Charras et
al., 2005 and Mitchison et al., (2008) have also shown that local pressure
variations in the cytoplasm do not distribute instantaneously to the whole cell.
This indicates that although the cytoskeleton is a highly connected structure,
transduction of forces requires, in addition to the cytoskeletal filaments, cascades
of signalization triggered by local mechanical loads. A manuscript published by
Ananthakrishnan et al., (2006) reports that although the interior structural
elements contribute to the cell shape via their loose coupling to the cortex, it is
the outer actin cortical shell that mainly determines the cell's structural response.
Taken together, these results suggest that the mechanical properties measured
here have a significant contribution from the cortical actin.
In the literature, Podolski and Steck, 1990 have reported that the mesh
size of the cortical actin is ~ 0.2 μm. It is formed by thousands of interconnected
actin filaments with some thicker actin bundles that extend several micrometers
(see Figure 28). Labeling of the fibers with Red-palloidin showed that the
distribution of the actin structures differs among cells cultured on the four
substrates used. Cells on soft substrates are less extended and display low
content of actin bundles while cells cultured on stiffer matrices are generally
103
larger and display long and clear actin fibers. Node-like structures also appear
more frequently on cells from these cultures.
Filopodia-like structures are virtually absent in cell cultured on the softest
matrix. However, the length and number of such structures increases in cells
cultured on stiff gels and glass substrates. Overall, although slight differences in
the actin organization are observed between cells on the stiff matrix and glass,
both cell cultures already display a well organized actin structure with long actin
filaments and clear filopodia and lamelipodia. Besides actin, integrins are other
molecules that might be implicated in the response of the cells to the substrate
stiffness (Wilson et al., 1995; von Wichert et al., 2003). Integrins are trans-
membrane proteins whose extracellular regions bind to the extracellular matrix
while their intracellular part remains connected to the cytoskeleton. Integrins are
important elements of the focal adhesion sites where the cell-substrate
attachment takes place. In many type of cells, there is an important number of
focal adhesion sites (FAS) at the cell edges where lamellipodia extend and
locomotion occurs. Pelham and Wang, 1997 suggest that after the cells form an
initial adhesion trough the FAS located particularly in the lamellipodia and
filopodia, forces exerted on the matrix facilitates locomotion and keep cellular
shape at the same time.
Our results thus indicate that cells cultured on soft substrates lack the long
and well formed lamellipodia observed on stiffer matrices. On these substrates,
the reduced traction (substrates can withstand large deformations before
significant resistance arise) might prevent the creation of well formed stress
fibers, the maturation of the initial focal adhesion sites, the cell elongation and
the signaling cascades triggered by mechanical tensions.
A comprehensive study and description of the biochemical reactions
elicited by the cells in response to mechanical stimulation could be performed.
Application of local and small, controlled loads with an AFM (or a parallel array of
AFMs) on cells cultured on a soft medium and its combination with some of the
other techniques described in this thesis might be an effective methodology to
shed light into the cellular cascades that are triggered by mechanical stimulus.
104
The AFM could also be used to effectively simulate different substrate stiffnesses
locally on a few cells – allowing for comparison of cells grown under otherwise
identical conditions. A first step to understand the sequence of signaling events
leading to changes after mechanical contacts is demonstrated in this thesis by
observing the formation of a synaptic connection (see section 6).
5.7.4 Cell proliferation rate and genetic expression is influenced by the
substrate stiffness.
Initial airway smooth muscle cell cultures show that seeding the same
number of cells on the four examined matrices produced cultures which reached
confluence at different times. Adjustments in the number of cells plated was
necessary to get cell cultures with the same cell density the day on which the
experimental procedure was performed. Seeding of 25,000 cell/dish, 35,000
cell/dish, 40,000 cell/dish and 100,000 cell/dish in the glass substrate, the stiff,
medium and soft gels respectively produce cultures suitable for AFM
measurements after 5 days on incubation. This shows a large disparity of the
number of seeded cells (more than two fold) on the soft matrix relative to the
other substrates. A proliferation assay was performed to confirm that the
differences were indeed due to variations in cell proliferation and not due to
variations on the number of cells that initially adhere to the matrix.
The results show that the proliferation rate on soft substrates is ~ 3 fold
lower than the proliferation rate in the other conditions when the cultures were
incubated with complete medium (DMEM + 10 % FBS). Quiescent cell cultures
(0.5% FBS) showed basal proliferation rates lower than 10 % irrespectively of the
matrix stiffness (see Figure 33). This finding is an additional piece of information
that let us conclude that starvation keeps the cells in the same phase (no
proliferative phase) and that it is not a variable that influenced the viscoelastic
properties of the cells in the present study.
The molecular mechanism by which the cells sense the matrix stiffness
and adapt its behavior (in this case the proliferation rate) is not well understood.
However, some studies suggest that integrins and increase myosin light chain
105
phosphorylation might play a role in that process. For instance, Wilson et al.,
1995 reported that when vascular smooth muscle cells cultured in collagen
coated surfaces were treated with antibodies that bind the β3 and ανβ5 integrin
subunits, the mitogenic response induced by continue oscillatory loads on rat
vascular smooth muscle cells was abrogated. A study lead by Cai et al., (1998)
demonstrated in fibroblasts that myosin light chain phosphorylation alters
signaling pathways that regulate cell growth and division. In other reports (Wang
et al., 2006) force induced enhanced expression of alpha-actin (this is an actin
isoform that contributes to cell-generated mechanical tension and is normally
restricted to smooth muscle) and possible impact in the expression of other
genes has been associated to the ability of the actin fiber to serve as
mechanotransducer (Wang et al., 2006).
Gene array technology also provides clues regarding the link between cell
mechanics, proliferation and gene expression. The data obtained is valuable and
exhibits the regulation of genes among the groups cultured on different matrix
stiffness. However, as a general trend, the largest differences in genetic
expression occurred between the cultures on glass and any of the
polyacrylamide gel cultures. This finding does not immediately correlate to our
previous observations of cell viscoelasticity (cells plated on soft gels are
significantly different from any of the other groups) cytoskeleton organization and
proliferation rate (lower in gels cultured on soft gels). However, a plausible
explanation arise if we consider that the cells are able to sense the stiffness of
the substrate. Thus, the large difference between the stiffness of the glass and
the stiffness of the gels could account for some of the observed change in
genetic expression. In addition, there are some reports that have found that the
actual spatial distribution of the available attachment sites influences the cell
behavior (Teixeira et al., 2003; Uttayarat et al., 2005; Ismail et al., 2007;
Gadegaard et al., 2008; Yang et al., 2009). Thus, the flatness of the glass
substrate in contrast to the porous nature of the gels might impact the genetic
profile.
106
Characterization of the base membrane (Fitton et al., 1998; Abrams et al.,
2000; Abrams et al., 2003) has sheld light into the structures that the cell
encounters and attaches to in vivo. These studies have shown that the base
membrane have pore sizes of ~ 100 nm. This is aproximatelly the pore size
reported for the stiff polyacrylamide gel (Holmes DL, 1991). This coincidence is
an indication that cell cultures prepared on polyacrylamide gels are indeed
biologicaly relevant, perhaps even more so than those on glass.
The regulation of gene expression by matrix stiffness is evident when the
genes involved in proliferation, cytoskeleton dynamics are compared (see Figure
34). The larger differences encountered in the genetic expression occurred
between cultures prepared on gels and glass substrates. Since the cells were
kept in an arrested phase of growth before the RNA was collected and the
incubation conditions were the same for all the cultures, it is reasonable to
assume that any difference among the samples is only due to the substrate
stiffness.
Many of the regulated genes appear to be involved in tasks other than the
cytoskeleton rearrangement, focal adhesion sites or proliferation. A review of the
regulated genes produced a list of genes that have been implicated in cell
mechanics (tnnt2, tubg1, tuba4a, pfn2, krt25, tubb6, mylpf, myh3, rhoj, acta1; for
a brief description of their function refer to Figure 34). Interestingly, the only
cytoskeletal proteins that were up-regulated in the soft substrate cultures were
the tubulin subunit and tubulin assembly genes (tubg1, tuba4a, tubb6, tubb2c).
We did not detect changes in intermediate filament genes. An increase in the
expression levels of the acta1 gene in the stiffer substrates was observed (this
gene codes for α-actin 1 which is an actin isoform that is normally restricted to
cells of smooth muscle; Wang et al., 2006). Genes associated to the production
of myosin motors (mylpf, myh3) are also regulated. These proteins are regularly
associated to the actin bundles and are usually used by the cell to exert
mechanical forces and provide support to the cell. The genes akr1b1, igfbp3,
cyr61, tnfrsf12a gene that regulate cell proliferation also showed differential
expression (p<0.05, ANOVA analysis). Besides its relation to cell proliferation,
107
the Tnfrsf12a protein located in the plasma membrane decrease cellular
adhesion to the fibronectin and vitronectin extracellular matrix proteins. It reduces
cell growth and migration (Meighan-Mantha et al., 1999).
We note that confirmation of the gene expression by PCR was not
performed since detailed study of the genes involved in mechanical sensing is
beyond the scope of this thesis.
5.7.5 Outlook
The combination of AFM and other well established biological techniques
proved to be a useful approach to study mechanical properties of cells as a
function of matrix stiffness. The AFM measurements were essential to determine
both the mechanical properties of the polyacrylamide gel substrates and the cells
cultured on these substrates. The combination of the AFM and the inverted
optical microscope allowed us to determine the mechanical properties of single
cells at specific locations, something that is challenging to achieve with other
available techniques which average the elastic properties of a population of cells.
The measurements performed in this thesis were focused on the determination of
the complex modulus at regions of the cells between the nucleus and the cell
edge. The results show that a large variability mainly in the elastic modulus exists
among cells cultured on the same type of substrate and that this is even larger
when cells grow on stiffer substrates. Our observations as well as other
published results (Smith et al., 2005; Bausch et al., 1998; Charras et al., 2005;
Mitchison et al., 2008; Ananthakrishnan et al., 2006) suggest that this might be
importantly influenced by the actin distribution just beneath the cell membrane.
Paxillin-labeling of the actin fibers showed that the actin arrangement in cells
plated on the substrates was distinct, most of the differences were observed
between cells cultured on the soft matrix and any of the other substrates, to say,
cells on soft substrates lacked the long actin filaments, long lammelipodia and
filopodia observed in the other cells. In addition, the spread area was larger on
cells cultured on stiffer substrates which suggest a good cell adherence to the
substrate and tension of the actin filaments.

108
Cell proliferation rate was importantly affected by the mechanical
properties of the substrate. Cells on the softer matrix exhibited low proliferation
rates when cultured in either, complete medium plus 10 % FBS or starvation
medium which is another indication of the affectations that the matrix stiffness
produce in cell behavior. Gene expression was also importantly affected.
Although the overall larger differences in expression were observed between
rigid and non-rigid substrates, there are genes importantly related to cell
mechanics that exhibit differences among non-rigid substrates.
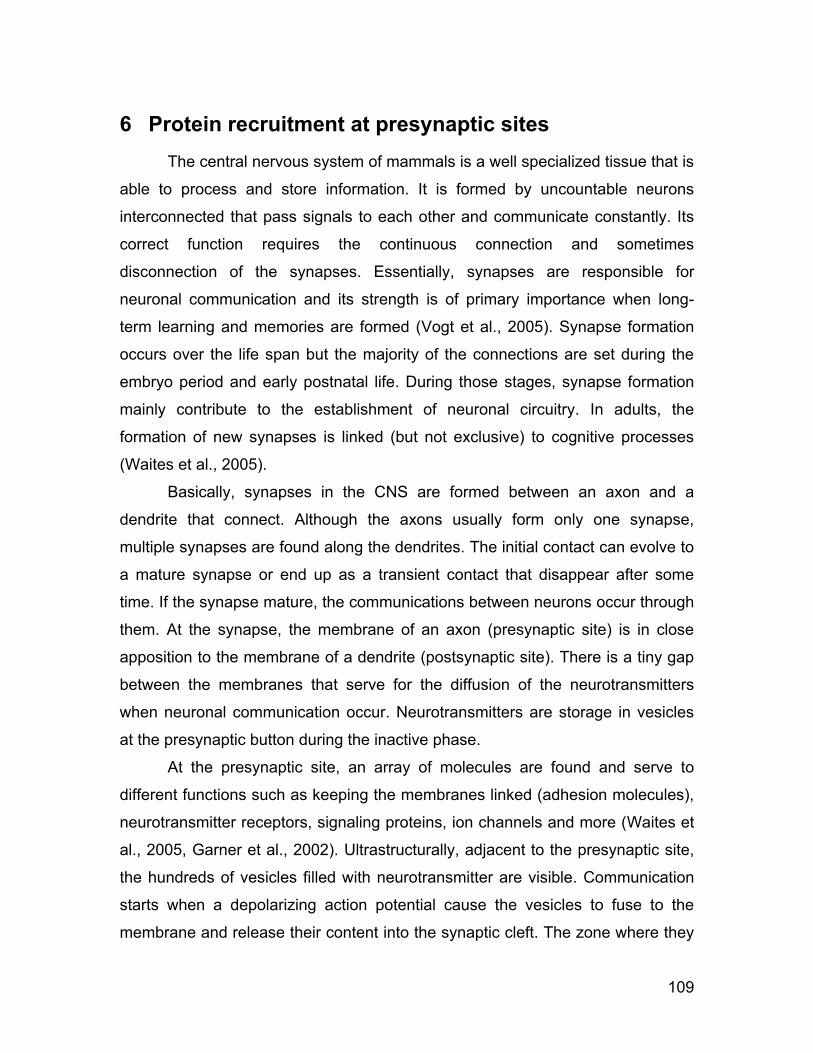
109
6 Protein recruitment at presynaptic sites
The central nervous system of mammals is a well specialized tissue that is
able to process and store information. It is formed by uncountable neurons
interconnected that pass signals to each other and communicate constantly. Its
correct function requires the continuous connection and sometimes
disconnection of the synapses. Essentially, synapses are responsible for
neuronal communication and its strength is of primary importance when long-
term learning and memories are formed (Vogt et al., 2005). Synapse formation
occurs over the life span but the majority of the connections are set during the
embryo period and early postnatal life. During those stages, synapse formation
mainly contribute to the establishment of neuronal circuitry. In adults, the
formation of new synapses is linked (but not exclusive) to cognitive processes
(Waites et al., 2005).
Basically, synapses in the CNS are formed between an axon and a
dendrite that connect. Although the axons usually form only one synapse,
multiple synapses are found along the dendrites. The initial contact can evolve to
a mature synapse or end up as a transient contact that disappear after some
time. If the synapse mature, the communications between neurons occur through
them. At the synapse, the membrane of an axon (presynaptic site) is in close
apposition to the membrane of a dendrite (postsynaptic site). There is a tiny gap
between the membranes that serve for the diffusion of the neurotransmitters
when neuronal communication occur. Neurotransmitters are storage in vesicles
at the presynaptic button during the inactive phase.
At the presynaptic site, an array of molecules are found and serve to
different functions such as keeping the membranes linked (adhesion molecules),
neurotransmitter receptors, signaling proteins, ion channels and more (Waites et
al., 2005, Garner et al., 2002). Ultrastructurally, adjacent to the presynaptic site,
the hundreds of vesicles filled with neurotransmitter are visible. Communication
starts when a depolarizing action potential cause the vesicles to fuse to the
membrane and release their content into the synaptic cleft. The zone where they
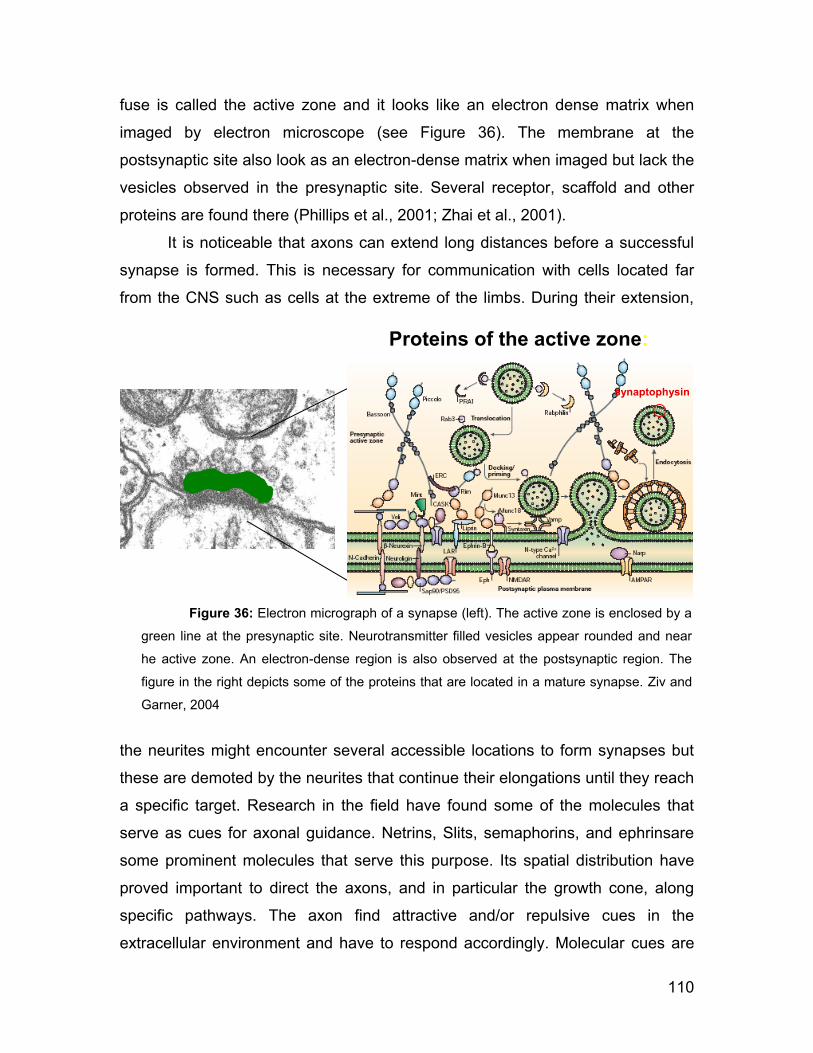
110
fuse is called the active zone and it looks like an electron dense matrix when
imaged by electron microscope (see Figure 36). The membrane at the
postsynaptic site also look as an electron-dense matrix when imaged but lack the
vesicles observed in the presynaptic site. Several receptor, scaffold and other
proteins are found there (Phillips et al., 2001; Zhai et al., 2001).
It is noticeable that axons can extend long distances before a successful
synapse is formed. This is necessary for communication with cells located far
from the CNS such as cells at the extreme of the limbs. During their extension,
the neurites might encounter several accessible locations to form synapses but
these are demoted by the neurites that continue their elongations until they reach
a specific target. Research in the field have found some of the molecules that
serve as cues for axonal guidance. Netrins, Slits, semaphorins, and ephrinsare
some prominent molecules that serve this purpose. Its spatial distribution have
proved important to direct the axons, and in particular the growth cone, along
specific pathways. The axon find attractive and/or repulsive cues in the
extracellular environment and have to respond accordingly. Molecular cues are
Proteins of the active zone:
Figure 36: Electron micrograph of a synapse (left). The active zone is enclosed by a
green line at the presynaptic site. Neurotransmitter filled vesicles appear rounded and near
he active zone. An electron-dense region is also observed at the postsynaptic region. The
figure in the right depicts some of the proteins that are located in a mature synapse. Ziv and
Garner, 2004
synaptophysin
111
not particular for nervous system but also important in inflammatory response.
(Dickson, 2002).
Synapses are highly dynamic entities, from their initial creation and
pruning to a more consolidated state (Garner et al., 2006). Studies of the initial
stages of synaptogenesis are still sparse, in part due to the rarity of synapse
creation in culture where single synapses are most conveniently identified and
studied in detail (Ziv and Garner, 2004). Even when such events are patiently
identified and scrutinized (e.g. Ahmari et al., 2000; Friedman et al., 2000;
Kaether et al., 2000), the total number of events remains quite low. A method
that could reliably induce synaptogenesis at will would therefore be highly
desirable.
Another largely unresolved aspect of synaptogenesis is the required
identity of synapse-inducing factors. As few specific ligand-receptor triggers have
been identified, such as neuroligin/neurexin, SynCAM and/or NGL-2 (Scheiffele
et al., 2000; Biederer et al., 2002; Graf et al., 2004; Kim et al., 2006). Studies
from the 80‟s (Burry, 1980, 1982) however indicate that no such specific ligand-
receptor interactions are required and that axons are in fact quite promiscuous in
their choice of postsynaptic partner. It was found that many (but not all) poly-
cationic substances have synaptogenic properties whereas neutral or anionic
substances do not.
Our lab has recently shown that presynapses induced by adhesive contact
to poly-D-lysine (PDL, an artificial cationic protein) coated beads (as “stand-ins”
for dendrites) are functional and share several characteristics with “real”
presynapses, such as protein content and presynaptic vesicle recycling ability
(Lucido et al., 2009a). In turn, such hemi-synapses are useful in the study of
synaptic development. During these studies, we concluded that a method to
spatially precisely control the contact between axon and bead would be useful to
study the temporal evolution of synaptic development as well as the adhesion
between axon and bead. In particular, such a method would enable a systematic
study of the recruitment of specific synaptic proteins rather than merely relying on
chance encounters between axons and dendrites in culture.
112
We now introduce a novel method of combining an Atomic Force
Microscope and fluorescence microscopy to precisely control a single contact
between a hippocampal axon and a protein-coated bead in time and space. We
observed the recruitment of Piccolo-Bassoon Transport Vesicles (PTVs) and
Synaptic Transport Vesicles (STVs) to the contact site and compare the temporal
evolution to the real case (Friedman et al., 2000). In addition, we are in a unique
position to observe the initial adhesion between axon and bead. We find that
adhesion is immediate and point-like and that unusually long (>50μm)
membrane-bounded, protein-containing strings can be elicited from the axon.
Furthermore, the adhesion points co-localize with pre-existing or recruited protein
puncta, indicating the existence of special, preformed microdomains along an
axon.
113
7 Material and methods (Neurons)
7.1 Primary Cultures of Rat Hippocampal Neurons
Cultures of dissociated rat hippocampal neurons were prepared using a
modification of a protocol described in Kaech and Banker, 2006. Hippocampi
were dissected from E17/18 embryos, treated with 0.25% trypsin at 37°C
followed by Advanced DMEM-10% horse serum, washed 2x with HBSS and
mechanically dissociated with a plastic Pasteur pipette. The dissociated neurons
were plated at a density of 1.8-2.3 x 104 cm-2 in, poly-D-lysine (Sigma) coated
glass-bottom dishes (MatTek) in serum-free Neurobasal medium supplemented
with L-glutamine and B-27. One-third of the medium was replaced every 3-4
days. All culture media purchased from Gibco (Invitrogen). The chosen cell
density reflects a compromise between a lower limit that allows for long-term cell
survival and a higher limit dictated by the need to locate isolated axons even on
day in vitro 10 (DIV10).
Transfection was performed on DIV6 using a standard Lipofectamine 2000
(Invitrogen) protocol. Three different plasmids were used (actin-YFP,
synaptophysin-GFP and bassoon-GFP). 10-20 neurons were expressing the
corresponding fluorescent proteins after 24 hours. High expression levels
persisted for up to one week.
Labeling of tubulin in axons was performed with TubulinTrackerTM Green
(Invitrogen) as described in the product information sheet except that the cell
culture was kept in Neurobasal medium during the imaging procedure. The final
concentration of TubulinTrackerTM Green used was 100mM.
7.2 Time-lapse Protein Recruitment and Adhesion Experiments
Latex beads (7.5μm, Bangs Laboratories) were glued to Atomic Force
Microscope (AFM) cantilevers (Veeco, model: MSCT-AUHW) with UV-curable
adhesive (Smith et al., 2007b). The beaded cantilevers were incubated in
50μg/ml poly-D-lysine solution overnight at 4°C or used without coating for
114
control experiments. Gluing the bead onto the cantilever prior to coating rather
than vice versa prevents drying of the coated bead.
The prepared cantilevers were mounted on a Bioscope AFM (Digital
Instruments, Veeco Metrology Group, Santa Barbara, CA) mounted over an
inverted optical microscope (Axiovert S100TV, Zeiss) that facilitates bright-field
or fluorescence imaging. We used a white-light excitation source sent through a
filter cube suitable for GFP imaging. The white-light source was equipped with a
mechanical shutter triggered by the image-acquisition program. The shutter was
found to be absolutely necessary to avoid bleaching and enable long-term
(several hours) image acquisition.
Bead-axon contact was achieved by positioning the cantilever next to a
fluorescent axon and moving the cantilever laterally. Before initial contact, it was
found to be necessary to leave the cantilever in the sample medium for 30-45
minutes to allow the system to equilibrate thermally, thus minimizing unwanted
drift. When the contact occurred (observed with the inverted optical microscope),
a movie was acquired with a CCD camera (cascade:1k, photometrics) at a rate of
six frames per minute. The temperature of the sample was kept at 37°C by using
a heated stage (DH-35 Culture Dish Heater, Warner Instruments) and the pH
kept at 7.2 by keeping the sample in a 5% CO2/air mixture.
7.3 Image analysis and vesicle speed calculation
Movies taken with the CCD camera were processed with the NIH ImageJ
software. To calculate the speed of vesicles, a linear region of interest (ROI) was
defined along the length of an axon followed by a reslicing of the images along
the ROI as a function of time. Horizontal traces indicate localized, immobile
vesicles. Diagonal traces represent vesicle movement. Vesicle speed was
calculated as the rate of traveled distance (y-axes in Figure 38B and Figure 39B)
over the duration of the vesicle movement (x-axes). Calibration of the pixels per
unit length for the CCD camera used in the experiments was performed using a
silicon sample of known dimensions observed in bright field with the 63x and
100x oil immersion objectives.
115
8 Applications of the AFM to the study of presynaptic
formation (Results)
8.1 Procedure for successful axon/bead contacts
For the experiments described below, we used an instrument that is
designed for simultaneous Atomic Force Microscopy (AFM) topography imaging
and fluorescence microscopy. We did however not make use of the topography
feature but rather used the AFM to contact a cantilever-mounted bead to an axon
expressing a synaptic protein of interest with nanometer accuracy. The
contacting proceeds as follows:
1. Locate a hippocampal neuron expressing the synaptic protein of interest.
Observation of small features (such as “strings,” see below) requires a
relatively high expression level.
2. In bright field, find an isolated length of axon.
3. Approach cantilever-mounted bead to surface, making sure to touch down
close to, but not onto, the previously identified length of axon.
4. Using AFM controls, move the bead laterally to contact the axon.
We note that the cells expressing fluorescent protein constitute a rather
heterogeneous sample, both in terms of expression level and developmental
stage of a given cell. This is why before even approaching the bead to the
sample, we made sure that the chosen axon had a sufficiently high expression
level and that the fluorescent protein was being transported along the length of
the axon. As will be shown below, mobile proteins are necessary to induce
synapse formation.
Figure 37 shows an example of a contacting procedure (step 4 above)
where at the end the bead is seen to slightly perturb the axon; this slight bending

116
was taken as a sign of a successful bead-neuron contac. Care was taken to
avoid perturbing the axon more than necessary, thus limiting potential damage
and/or constriction to the axon.
8.2 Synaptic constituents are transported in vesicles
We observed the PDL-induced recruitment of synaptic constituents
bassoon and synaptophysin (see Figure 38 and Figure 39). Bassoon is a
scaffolding protein that is actively transported to the synaptic site in so-called
Piccolo/Bassoon Transport Vesicles (PTVs) (Zhai et al., 2001; Shapira et al.,
2003). Synaptophysin (p38) is a classical presynaptic marker, which is located in
the membrane of presynaptic neurotransmitter-containing vesicles and is
transported to and from the synapse in a different vesicular carrier named
Synaptic Transport Vesicles (STVs).
Consistent with earlier studies (e.g. Kaether et al., 2000) we observe
bidirectional transport of both bassoon and synaptophysin in PTVs and STVs,
respectively. Figure 39B shows the movement of vesicles along a linear ROI as a
function of time of a representative time series of synaptophysin transport along
an axon. Diagonal tracks are the signatures of moving protein - containing
Figure 37: Microbead-axon approach. Precise (nm) control of the bead-axon
approach and further contact is achieved by using an AFM. After the bead is brought into
contact with the substrate close to a chosen axon (A), it is moved laterally until it gently
touches the axon (B). The contact is observed trough an inverted optical microscope. The
circle is drawn to indicate the location of the bead attached to the AFM tip.
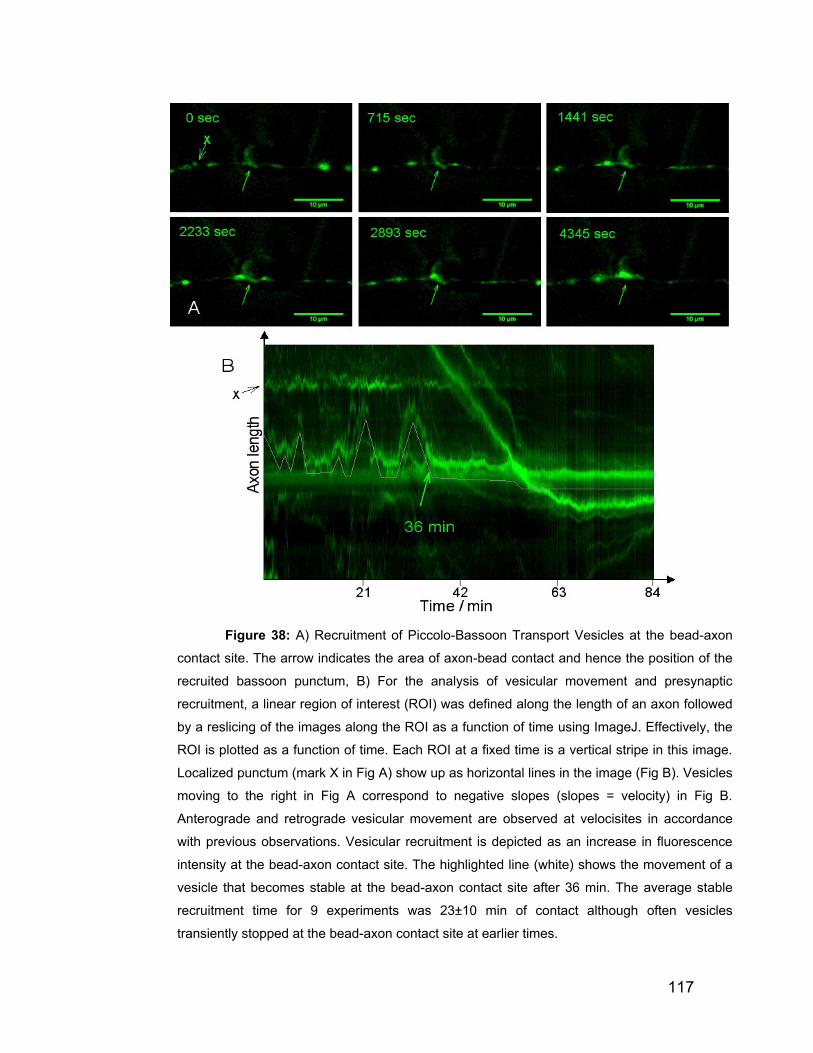
117
Figure 38: A) Recruitment of Piccolo-Bassoon Transport Vesicles at the bead-axon
contact site. The arrow indicates the area of axon-bead contact and hence the position of the
recruited bassoon punctum, B) For the analysis of vesicular movement and presynaptic
recruitment, a linear region of interest (ROI) was defined along the length of an axon followed
by a reslicing of the images along the ROI as a function of time using ImageJ. Effectively, the
ROI is plotted as a function of time. Each ROI at a fixed time is a vertical stripe in this image.
Localized punctum (mark X in Fig A) show up as horizontal lines in the image (Fig B). Vesicles
moving to the right in Fig A correspond to negative slopes (slopes = velocity) in Fig B.
Anterograde and retrograde vesicular movement are observed at velocisites in accordance
with previous observations. Vesicular recruitment is depicted as an increase in fluorescence
intensity at the bead-axon contact site. The highlighted line (white) shows the movement of a
vesicle that becomes stable at the bead-axon contact site after 36 min. The average stable
recruitment time for 9 experiments was 23±10 min of contact although often vesicles
transiently stopped at the bead-axon contact site at earlier times.
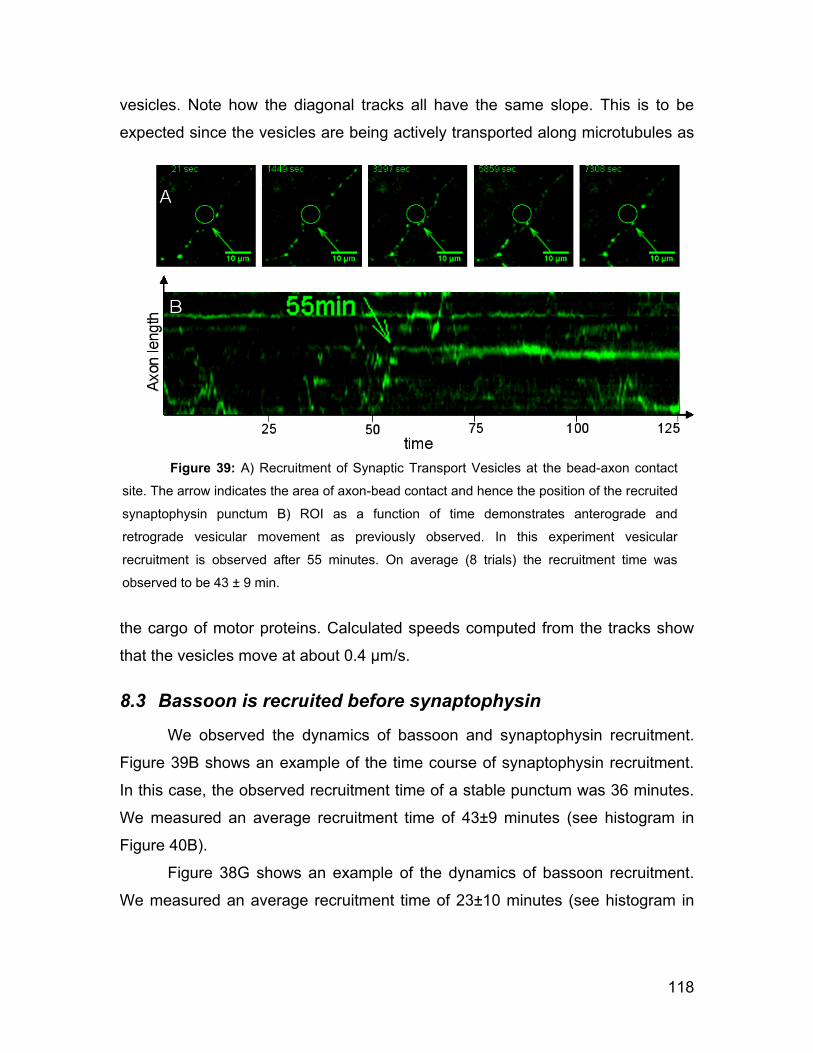
118
vesicles. Note how the diagonal tracks all have the same slope. This is to be
expected since the vesicles are being actively transported along microtubules as
the cargo of motor proteins. Calculated speeds computed from the tracks show
that the vesicles move at about 0.4 μm/s.
8.3 Bassoon is recruited before synaptophysin
We observed the dynamics of bassoon and synaptophysin recruitment.
Figure 39B shows an example of the time course of synaptophysin recruitment.
In this case, the observed recruitment time of a stable punctum was 36 minutes.
We measured an average recruitment time of 43±9 minutes (see histogram in
Figure 40B).
Figure 38G shows an example of the dynamics of bassoon recruitment.
We measured an average recruitment time of 23±10 minutes (see histogram in
Figure 39: A) Recruitment of Synaptic Transport Vesicles at the bead-axon contact
site. The arrow indicates the area of axon-bead contact and hence the position of the recruited
synaptophysin punctum B) ROI as a function of time demonstrates anterograde and
retrograde vesicular movement as previously observed. In this experiment vesicular
recruitment is observed after 55 minutes. On average (8 trials) the recruitment time was
observed to be 43 ± 9 min.
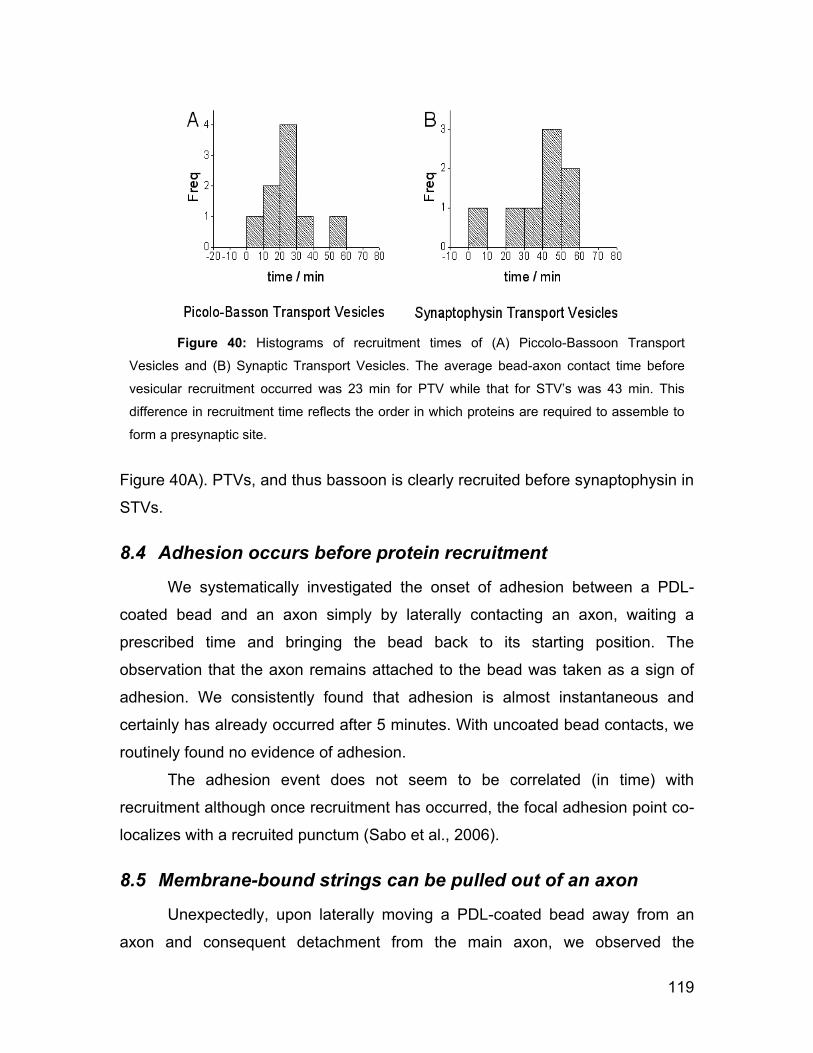
119
Figure 40A). PTVs, and thus bassoon is clearly recruited before synaptophysin in
STVs.
8.4 Adhesion occurs before protein recruitment
We systematically investigated the onset of adhesion between a PDL-
coated bead and an axon simply by laterally contacting an axon, waiting a
prescribed time and bringing the bead back to its starting position. The
observation that the axon remains attached to the bead was taken as a sign of
adhesion. We consistently found that adhesion is almost instantaneous and
certainly has already occurred after 5 minutes. With uncoated bead contacts, we
routinely found no evidence of adhesion.
The adhesion event does not seem to be correlated (in time) with
recruitment although once recruitment has occurred, the focal adhesion point co-
localizes with a recruited punctum (Sabo et al., 2006).
8.5 Membrane-bound strings can be pulled out of an axon
Unexpectedly, upon laterally moving a PDL-coated bead away from an
axon and consequent detachment from the main axon, we observed the
Figure 40: Histograms of recruitment times of (A) Piccolo-Bassoon Transport
Vesicles and (B) Synaptic Transport Vesicles. The average bead-axon contact time before
vesicular recruitment occurred was 23 min for PTV while that for STV‟s was 43 min. This
difference in recruitment time reflects the order in which proteins are required to assemble to
form a presynaptic site.
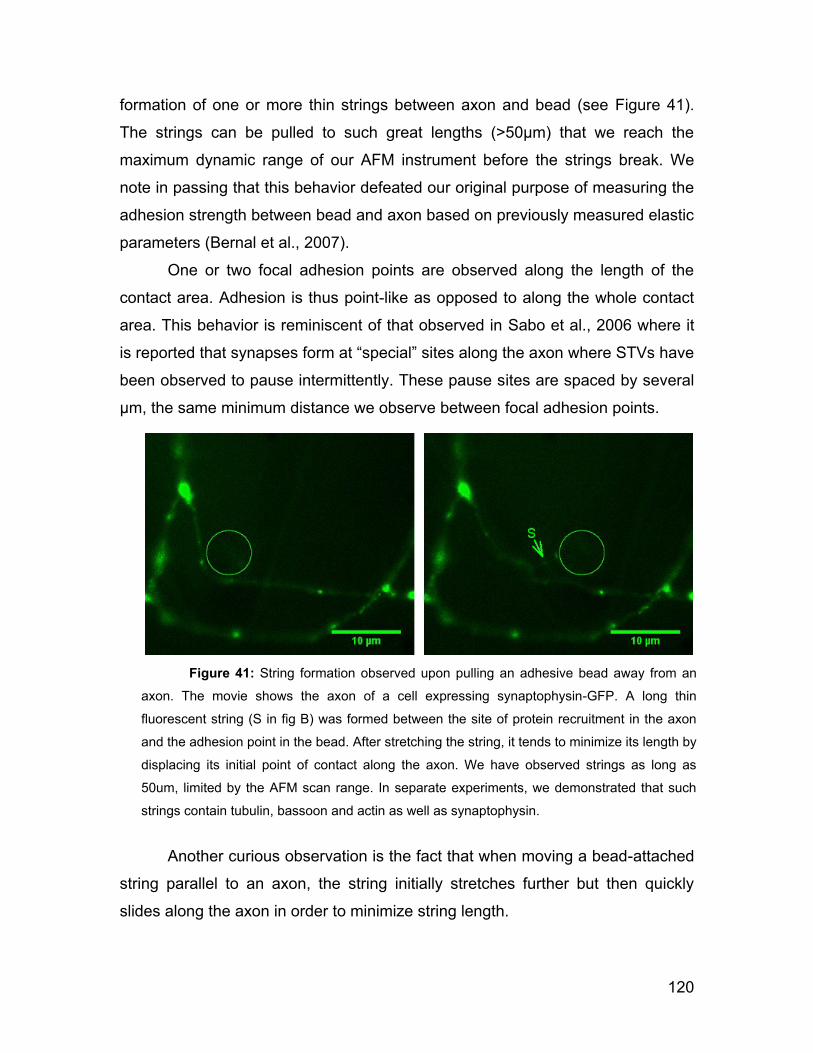
120
formation of one or more thin strings between axon and bead (see Figure 41).
The strings can be pulled to such great lengths (>50μm) that we reach the
maximum dynamic range of our AFM instrument before the strings break. We
note in passing that this behavior defeated our original purpose of measuring the
adhesion strength between bead and axon based on previously measured elastic
parameters (Bernal et al., 2007).
One or two focal adhesion points are observed along the length of the
contact area. Adhesion is thus point-like as opposed to along the whole contact
area. This behavior is reminiscent of that observed in Sabo et al., 2006 where it
is reported that synapses form at “special” sites along the axon where STVs have
been observed to pause intermittently. These pause sites are spaced by several
μm, the same minimum distance we observe between focal adhesion points.
Another curious observation is the fact that when moving a bead-attached
string parallel to an axon, the string initially stretches further but then quickly
slides along the axon in order to minimize string length.
Figure 41: String formation observed upon pulling an adhesive bead away from an
axon. The movie shows the axon of a cell expressing synaptophysin-GFP. A long thin
fluorescent string (S in fig B) was formed between the site of protein recruitment in the axon
and the adhesion point in the bead. After stretching the string, it tends to minimize its length by
displacing its initial point of contact along the axon. We have observed strings as long as
50um, limited by the AFM scan range. In separate experiments, we demonstrated that such
strings contain tubulin, bassoon and actin as well as synaptophysin.
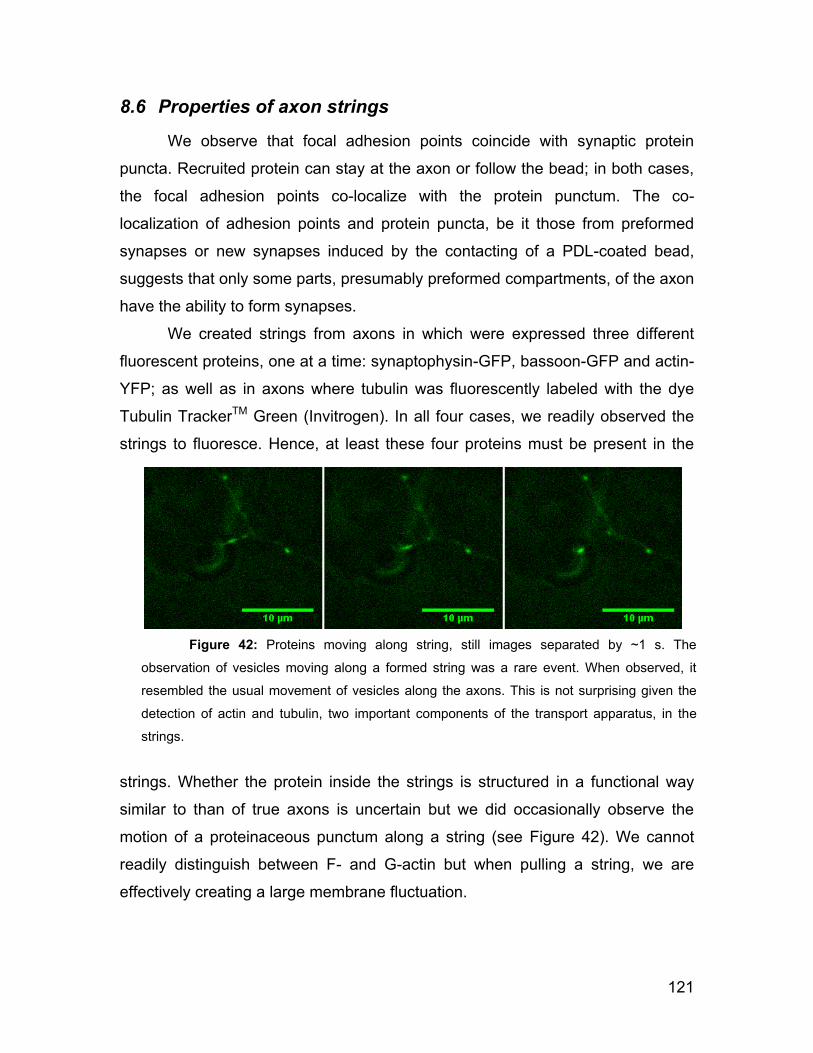
121
8.6 Properties of axon strings
We observe that focal adhesion points coincide with synaptic protein
puncta. Recruited protein can stay at the axon or follow the bead; in both cases,
the focal adhesion points co-localize with the protein punctum. The co-
localization of adhesion points and protein puncta, be it those from preformed
synapses or new synapses induced by the contacting of a PDL-coated bead,
suggests that only some parts, presumably preformed compartments, of the axon
have the ability to form synapses.
We created strings from axons in which were expressed three different
fluorescent proteins, one at a time: synaptophysin-GFP, bassoon-GFP and actin-
YFP; as well as in axons where tubulin was fluorescently labeled with the dye
Tubulin TrackerTM Green (Invitrogen). In all four cases, we readily observed the
strings to fluoresce. Hence, at least these four proteins must be present in the
strings. Whether the protein inside the strings is structured in a functional way
similar to than of true axons is uncertain but we did occasionally observe the
motion of a proteinaceous punctum along a string (see Figure 42). We cannot
readily distinguish between F- and G-actin but when pulling a string, we are
effectively creating a large membrane fluctuation.
Figure 42: Proteins moving along string, still images separated by ~1 s. The
observation of vesicles moving along a formed string was a rare event. When observed, it
resembled the usual movement of vesicles along the axons. This is not surprising given the
detection of actin and tubulin, two important components of the transport apparatus, in the
strings.
122
8.7 Discussion
The second system used to explore the potential of AFM to apply small
forces and controlled interactions were neuronal cultures. A number of
techniques to study the protein content at synaptic sites has been available to
researches in the past (Garner et al., 2000; Kennedy, 2000; Scannevin and
Huganir, 2000; Dresbach et al., 2001; Murthy and Camilli, 2003; Benson and
Tanaka, 1998; Ichtchenko et al., 1996; Dieck et al., 1998). Many of those
techniques are widely used in biological studies. However, time lapse studies of
protein recruitment at presynapses are scarce in part due to the lack of a
technique capable of inducing the presynaptic array at will. The few studies that
have addressed the issue relied upon random dendrite-axon encounters where
no control of either the contact site or contact time were possible (Ahmari et al.,
2000; Friedman et al., 2000; Kaether et al., 2000).
In this study, we successfully induced the formation of presynaptic sites
that have several characteristics of presynapses formed at axon-dendrite
contacts (Lucido et al., 2009b). We made use of the AFM to put a poly-D-lysine
coated bead in contact with an axon. The advantages of using the AFM include a
nanometric precision in the positioning of the bead relative to the axon as well as
a good control of the time and duration of the bead-axon contact. To increase the
likelihood of observing the recruitment of proteins, we chose axons with relatively
high fluorescent intensity and observable vesicle movement in the axon shaft
(Qiang et al., 2010). Measurements of the recruitment times for synaptophysin,
and bassoon at the contact site showed that synaptophysin is recruited after
bassoon. This marks a natural time course where bassoon, a known scaffolding
protein, is recruited first, presumably to stabilize the framework needed to tether
presynaptic vesicles (here marked by synaptophysin) at the synaptic site. We
observe the same recruitment timing of these two particular protein-containing
vesicles as happens upon natural axon/dendrite contact (Friedman et al., 2000).
This demonstrates that the inductive signals from the PDL-coated beads to the
axon have the same effects as the signals from a contacting dendrite.
123
Reslicing of a linear ROI (see Figure 38B and Figure 39B) defined along
the length of the axon allows the observation of vesicle movement in anterograde
and retrograde directions in accordance with previous reports (Kaether et al.,
2000). This allows transport speed to be measured.
Although two proteins were studied in this work, the technique presented
here would allow time lapse studies of the recruitment of any other protein in the
presynaptic site, the only requirement would be to get neurons expressing the
fluorescently tagged protein of interest. One could even study cooperative effects
by labeling with different colors.
Bead-axon adhesion of poly-D-lysine coated beads occurs shortly after
contact and definitively before recruitment. The type of interaction that occurs is
believed to happen between the positively charged surface of the bead and the
negatively charged motives of heparan sulfate proteoglycan (HSPG)
transmembrane proteins (Lucido et al., 2009b). Besides, it has been shown that
the cytoskeleton is rearranged at the presynaptic site in mature synapses
(Garner et al., 2002) thus the mere redistribution of the underlying cytoskeleton
(which has a net negative charge, Janmey et al., 1998) due to simple charge
interaction with the poly-D-lysine molecules on the bead could be a potential
contributor to the formation of presynapses (Liu et al., 2006).
Surprisingly, bead-axon adhesion of poly-D-lysine coated beads was
observed to be strong enough to pull membrane strings from the main axon. We
determined that those strings contained actin, synaptophysin, piccolo-bassoon
and tubulin. In few cases, we observed movement of protein punctum along the
formed strings which could signify that the strings are indeed functional axon
branches.
Recent results support this idea. Yang et al., (2009) and Lan and Papoian,
(2008) have shown that membrane fluctuation can facilitate the formation of
filopodia by creating “empty” space between the membrane and the tip of the
actin filaments where actin polymerization and elongation occur (Bray and
Chapman, 1985). The mechanical stress exerted on the cytoskeleton when the
bead is pulled could severe some microtubule fibers generating free microtubule
124
ends. Qiang et al., (2010) showed that the appearance of an increased number
of interstitial branches in axons is related to the generation of free microtubule
ends in the axon shaft. Subsequent organization and filling of the strings with
cytoskeleton, vesicles and other internal components of the axon directed by
either active transport (newly formed microtubule filaments) or Brownian motion
could end up in a functional axon branch (Goldberg and Burmeister, 1986).
8.8 Conclusion
The AFM is constantly increasing its presence in biological sciences. Their
uses enclose an increasingly extending set of methods to study some relevant
questions. In this part, we believed we have introduced a new use for the AFM in
biology. The remarkable spatial precision and time resolution that can be
achieved with the AFM has let us to study the recruitment time of the proteins
that are present at the presynapse site. The induction of the protein recruitment
with the poly-D-lysin coated bead cantilever allowed to determine that bassoon is
recruited first than synaptophysin to the presynaptic site. We demonstrated that
this developed technique gives information that is in good agreement with
previously established recruitment times for these proteins (Friedman et al.,
2000). Besides, this technique demonstrated to be suitable to study recruitment
times of almost any other protein that is located at the presynatic site. The only
change to the method would be to transfect the neurons with a vector carrying
the sequence to synthesize the protein of interest. It is even possible to do two
color microscopy to determine the recruitment times for more than one protein at
the same time.
In addition, the use of the AFM in this study allowed to pull long treads (>
50 μm) from the axon shaft that are apparently functional if we look at the movies
that show what appears like a vesicle moving along one of the treads. Further
assessing of the proteins contained in the treads demonstrated that actin,
synaptophisin, bassoon and tubulin are present which is other indication of the
functionality of the treads. Concluding experiments to demonstrate their
functionality and capacity to produce synapses have yet to be developed by

125
neuroscientists with the available techniques to observe vesicle fusion to the
membrane after an action potential arises. If this is demonstrated, the AFM would
become an important tool to study the synapses by “artificially” connecting axons
and dendrites.
126
9 General Conclusion
In science and other fields, new hypothesis are often proposed and new
questions arise. Most of the time, a proper description of the subject is possible
with the available techniques but there are some times where suitable techniques
to test a hypothesis or uncover an answer are limited or not available. This has
happened in several fields many times in history but can be exemplified by the
well-known Leonardo da Vinci‟s drawings of several apparatus and flying
machines that remained as an idea for many years and even centuries due to the
limitations in technology at that time. The most recent construction of gigantic
colliders obey the necessity of new apparatus capable of unveil and detect
particles that have been proposed by theoretical physicists. Something similar
might be happening to the study of the behavior of individual cells. Techniques to
study and collect information from hundreds or thousands of cells have been
available for many years but only recently, new tools to study single cell behavior
have been developed. One of such techniques is the AFM which is gaining
ground in biology research.
It has been shown in many studies that the AFM is a valuable tool in
biology. Particularly, in this thesis the AFM was employed to measure
mechanical properties of cells and to control the poly-D-lysin coated bead-axon
contact, which induces protein recruitment at the presynaptic site. These two
examples show the flexibility of the AFM and demonstrate its potential to
contribute to biology in areas other than its well known ability to produce
topographic images of samples. Furthermore, it has been demonstrated that the
use of the AFM and other biology techniques are highly valuable to study the
response of the biological material to some stimulus. Biology is complex, so
many methods need to be combined to achieve a detailed understanding. In our
case, the stimulus employed to study cell behavior comprise the use of non-rigid
materials and the contact of axons with poly-D-lysin coated beads. The
combination of the AFM and the inverted optical microscope was essential for
many purposes in this study since the optical view of the cells (either bright field
127
or fluorescence microscopy) allowed the location and latter precise positioning of
the cell beneath the AFM cantilever.
The calculation of the mechanical properties and analysis of the force-
distance curves revealed that although the theory behind the calculation of the
properties is valid for both soft or very hard substrates, the experimental data
(force spectroscopy curves) obtained with the AFM using soft cantilevers is more
suitable to measure the mechanical properties of less rigid substrates. This is
mainly because the Hertz model is extremely sensitive to the (small) contact
point error for very stiff materials.
We have demonstrated the biological potential of the inherent spatial and
temporal control of the AFM. Determination of the contact as a function of time
allowed measurement of protein recruitment in synapse formation.
This study also allowed to determine some AFM system related factors
whose improvement is desirable. Phase contrast microscopy allows the easy,
high contrast observation of cells. It was not available on the microscope system
used in the present study. However the new AFM (Asylum) acquired by our
group is equipped with this type of optical microscope. It simplifies the
observation of the cell regions (nucleus, cytoplasm, edges) without the necessity
of dyes. It is always preferred to perform experiments on cells with no dyes, as
these might interfere with cellular processes.
In the future, some experiments to complement the results presented here
should be performed. For instance, one should determine the mechanical
properties of transfected cell cultures to identify the dynamic response of
structures underneath the contact area, the effect of the inhibition of myosin
motors on the mechanical properties of the cells, and investigate the genetic
expression with a more sensitive technique (PCR) to quantify in detail the
expression level of genes. Characterization of the fibronectin mesh size and
arrangement on the different substrates should be performed. A method to
prepare polyacrylamide gels with gradient stiffness should be developed.
Regarding the neuron study in this thesis, one can measure the time
arrival of other proteins present at the synapse using the same methodology to

128
convert the presently known static information of which proteins are involved to a
complete dynamic picture of events. Furthermore, it would be interesting to study
the effect of other positively charger molecules in the formation of presynaptic
sites. Determination of the functionality of the pulled strings and the exploration
of the possibility to create artificial neuronal networks with these strings is an
exciting and open field that begs be investigated.
129
10 Appendix 1
The main piece of code used in the calculation of the Young‟s modulus
was the follow. However, some helper functions were required. They are found at
the end of the main code.
function FVAnalysis
%%Force volume file must be exported as row data instead of nm
%%The text file to be analyzed must not have any space between the
image data
%%and the f-v data. The first line also must be deleted. Only numerical
%%data must be included in the text file.
clc;
clear;
%Create and then hide the GUI.
f = figure('Visible','off','Position',[360,500,600,300]);
%GUI components.
htextspringcte = uicontrol('Style','text',...
'String','Spring Constant (N/m)',...
'Position',[10,180,120,15]); %[left bottom width height]
hspringcte = uicontrol('Style','edit',...
'String','0.01',...
'Position',[10,150,70,25],...
'Callback',{@springcte_Callback});
htextdefsensit = uicontrol('Style','text',...
'String','Deflection Sensitivity (nm/V)',...
'Position',[10,110,140,15]);
hdefsensit = uicontrol('Style','edit',...
'String','134.2383',...
'Position',[10,80,70,25]);
htextramp = uicontrol('Style','text',...
130
'String','Ramp size (nm)',...
'Position',[10,40,120,15]);
hramp = uicontrol('Style','edit',...
'String','1000',...
'Position',[10,10,70,25]);
htextbeadradius = uicontrol('Style','text',...
'String','Bead Radius (nm)',...
'Position',[160,180,120,15]); %[left bottom width height]
hbeadradius = uicontrol('Style','edit',...
'String','2250',...
'Position',[160,150,70,25]);
htextdate = uicontrol('Style','text',...
'String','Date exp done',...
'Position',[160,40,70,15]);
hdate = uicontrol('Style','edit',...
'String','000000',...
'Position',[160,10,70,25]);
htextpiezosensit = uicontrol('Style','text',...
'String','Piezo sensit (nm/V)',...
'Position',[160,110,110,15]); %[left bottom width height]
hpiezosensit = uicontrol('Style','edit',...
'String','9.825793',...
'Position',[160,80,70,25]);
htextImZScale = uicontrol('Style','text',...
'String',{'\*Ciao image list';'\@2:Z scale (V/LSB)'},...
'Position',[310,180,120,30]); %[left bottom width height]
hImZScale = uicontrol('Style','edit',...
'String','0.006713765',...
'Position',[310,150,90,25]);
htextFTTD = uicontrol('Style','text',...
'String',{'\*Ciao force list';'\@4:Trig threshold Deflection (V/LSB)'},...
131
'Position',[310,90,120,45]); %[left bottom width height]
hFTTD = uicontrol('Style','edit',...
'String','0.0000381470',...
'Position',[310,60,90,25]);
htextpixel = uicontrol('Style','text',...
'String','pixels per side',...
'Position',[460,180,120,15]); %[left bottom width height]
hpixel = uicontrol('Style','edit',...
'String','16',...
'Position',[460,150,70,25]);
htextScanSize = uicontrol('Style','text',...
'String','Scan Size (um)',...
'Position',[460,110,120,15]); %[left bottom width height]
hScanSize = uicontrol('Style','edit',...
'String','30',...
'Position',[460,70,70,25]);
htextcomment = uicontrol('Style','text',...
'String',{'This program uses a .txt';'file exported from Nanoscope in row
data units without header. All text must be deleted from the file as well as any
space between the Image data and the F-d curves data. Number of columns
must be 256 if 16x16 image or 512 if 32x32 image. For semi-automatic fitting,
chose an initial interval to fit in line 273 of the program and also let
semiautomatic fitting to run in the same line.'},...
'Position',[10,220,580,70]);
hopenfile = uicontrol('Style','pushbutton',...
'String','Open file and run',...
'Position',[310,20,100,25],...
'Callback',{@openfile_Callback},...
'UserData','FileName');
%Align GUI components
align([htextspringcte,hspringcte,htextdefsensit,hdefsensit,htextramp,...
132
hramp],'Center','None');
align([htextbeadradius,hbeadradius,htextdate,hdate,htextpiezosensit,...
hpiezosensit],'Center','None');
align([htextImZScale,hImZScale,htextFTTD,hFTTD,hopenfile],'Center','No
ne');
align([htextcomment],'Center','None');
%Initialize the GUI. Change units to normalized so components resize
%automatically.
set([f,htextspringcte,hspringcte,htextdefsensit,hdefsensit,htextramp,...
hramp,htextbeadradius,hbeadradius,htextdate,hdate,...
htextpiezosensit,hpiezosensit,htextcomment,...
htextImZScale,hImZScale,htextFTTD,hFTTD,hopenfile],'Units','normalized');
%Assign the GUI a name to appear in the window title.
set(f,'Name','Force Volume')
%Move the GUI to the center of the screen.
movegui(f,'center')
%Make the GUI visible.
set(f,'Visible','on');
%Callback for simple_gui. These callback automatically
%have access to component handles, initialized data
%and calculate Young's Modulus.
function [FVData] = openfile_Callback(source,eventdata)
%Displays the open file window
[FileName,PathName,FilterIndex] = uigetfile('*.txt','FilterSpec',...
'DialogTitle','Location',[1 2]);
%File location
Location = [PathName,FileName];
%Import the .txt files that contains both the Image and the F-d
%curves of the force volume file and storage the data in the
%variable called "FVData"
133
FVData = importdata(Location);
save('FVData','FVData') %For debug
%Pick data that corresponde to the thopographyc image and storage
%it in the matrix "DataIm". Still raw data
NumColFVData = size(FVData,2);
DataIm = FVData(1:NumColFVData,:);
save('DataIm','DataIm') %For debug
%Pick data that correspond to the F-d curves. Both fordware and
%backward curves. Still raw data
DataFd = FVData(NumColFVData+1:end,:);
save('DataFd','DataFd') %For debug
%Loop to generate a 16x16 or 32x32 cell with the values
%that will be used to plot the hight image
format long
NumPixelsPerSide = str2num(get(hpixel,'String'));
%NumPixelsPerSide take values 16 or 32
PointsPerPixel = NumColFVData/NumPixelsPerSide;
for y = 1:1:NumPixelsPerSide
for x = 1:1:NumPixelsPerSide
box = DataIm(1+(y-1)*PointsPerPixel:y*PointsPerPixel,1+(x-
1)*PointsPerPixel:x*PointsPerPixel);
pixelImAv(y,x) =
mean(mean(box))*str2num(get(hImZScale,'String'))*str2num(get(hpiezose
nsit,'String'));
%Since pixelImAv is in row data (bits), we must multiply it by the
volt/LSB
%to get the voltage applied to the piezo and then multiply it by z
sensit
%to get the number in nm
%\*Ciao image list
134
%\@2:Z scale: V [Sens. Zscan] (0.006713765 V/LSB) 200.9027
V
%http://www.physics.arizona.edu/~smanne/DI/software/v43header.html
end
end
save('pixelImAv','pixelImAv') %For debug
%Generates and saves the image(topographic) figure
XYStep = str2num(get(hScanSize,'String'))/NumPixelsPerSide;
DataImX = [0:XYStep:XYStep*(NumPixelsPerSide)];
temparr = zeros(1,NumPixelsPerSide);
pixelImAv = [pixelImAv;temparr]; clear temparr;
temparr = zeros(NumPixelsPerSide+1,1);
pixelImAv = [pixelImAv,temparr]; clear temparr;
DataImY = DataImX';
fig2 = figure('name', 'Hight Image');
figImAv = surf(DataImX,DataImX,pixelImAv);
title('Hight');
xlabel('um');
ylabel('um');
zlabel('nm');
colorbar
saveas(figImAv,'Hight_Image_Cte_Force.fig')
%Array with the number of f-d curves in the .txt file
for k = 1:NumPixelsPerSide*NumPixelsPerSide
pixel{k} = (k);
end
save('pixel','pixel') %For debug
%Array with the coordenate of the f-d curves. Read left to
%right and top to bottom
r = 0;
135
for k = 1:NumPixelsPerSide
for q = 1:NumPixelsPerSide
r = r+1;
coordenate{r} = [k,q];
end
end
save('coord','coordenate') %For debug
%Array with the hight of the surface at each f-d curve
r = 0;
for k = 1:NumPixelsPerSide
for q = 1:NumPixelsPerSide
r = r+1;
hight{r} = pixelImAv(k,q);
end
end
save('hight','hight') %For debug
%Pick the approach and withdraw curves and storage them in
%different arrays
defsens = str2num(get(hdefsensit,'String'));
k = size(DataFd);
NumPointsFd = k(1,1)*k(1,2)/((NumPixelsPerSide^2)*2);
DataFdCollumn = reshape(DataFd',[],1);
save('DataFdCollumn','DataFdCollumn') %For debug
for k = 1:NumPixelsPerSide^2
approach{k} = DataFdCollumn(1+(k-1)*2*NumPointsFd:(2*k-
1)*NumPointsFd,1)*str2num(get(hFTTD,'String'))*defsens;
%\*Ciao force list
%\@4:Trig threshold Deflection: V [Sens. Deflection]
%(0.0000381470 V/LSB) 0.4166667 V
%http://www.physics.arizona.edu/~smanne/DI/software/v43header.html
136
end
save('approach','approach') %For debug
%Create a structure array with the properties of the f-d curves
for k = 1:NumPixelsPerSide*NumPixelsPerSide;
Xaxes{k} =
[0:str2num(get(hramp,'String'))/NumPointsFd:str2num(get(hramp,'String'))-
str2num(get(hramp,'String'))/NumPointsFd]';
end
save('Xaxes','Xaxes') %For debug
s = struct('Pixel', pixel','Coordenate', coordenate','Hight', hight',...
'Xaxes', Xaxes','Approach', approach','Young_Mod', [1],'Rsquare',
[1]);
%Rearrange the fd so that the lowest data point is zero
q = size(s);
for k = 1:q(1,1)
minimA = find(s(k,1).Approach == min(s(k,1).Approach));
s(k,1).Approach = s(k,1).Approach - s(k,1).Approach(minimA(1,1));
end
%Flip Approach and reverse so that the bending apears at the
%right of the f-d
q = size(s);
for k = 1:q(1,1)
s(k,1).Approach = flipdim(s(k,1).Approach,1);
end
save('s','s') %For debug
%Fit to Hertz model
beadradius= str2num(get(hbeadradius,'String'));
date = get(hdate,'String');
for k = 1:q(1,1)
137
k
%110423NewStart
[xm, ym] = IndentCorrection(s(k,1).Xaxes, s(k,1).Approach);
for ww = 1:numel(xm)-1;
if xm(ww) < xm(ww + 1);
CanFit(ww) = 0;
else
CanFit(ww) = 1;
end
end
ToFit = sum(CanFit);
if ToFit == 0;
s(k,1).Xaxes = xm';
s(k,1).Approach = ym';
%else
%s(k,1).Xaxes = xm';
%s(k,1).Approach = ym';
end
save('s','s'); save('xm','xm') %For debug
%110423NewEnd
[M,F] = mode(s(k,1).Approach,1);
if F < 200
%Semi automatic
RT = s(k,1).Xaxes(309,1);
RC = s(k,1).Xaxes(510,1);
[E, inic, r2] =
dualfitting2(s(k,1).Xaxes,s(k,1).Approach*str2num(get(hspringcte,'String')),
...
138
beadradius,k,date,[RT 0 RC 0]);%[6.015625000000000e+02 0
9.941406250000000e+02 0]);
s(k,1).Young_Mod(1) = E;
s(k,1).Rsquare(1) = r2; %%
s(k,1).Hight(1) = s(k,1).Hight(1)+(str2num(get(hramp,'String'))-
inic); %%
save('s','s') %For debug
else
s(k,1).Young_Mod(1) = 1;
save('s','s') %For debug
end
end
%Plot Young_Mod
%Loop to generate a 16x16 or 32x32 cell 'pixel' with the values that
will be used to
%plot the Young_Mod image and the Real Hight Image
r = 1;
pixelFd = zeros(NumPixelsPerSide,NumPixelsPerSide);
pixelRealHight = zeros(NumPixelsPerSide,NumPixelsPerSide); %%
for y = 1:1:NumPixelsPerSide
for x = 1:1:NumPixelsPerSide
pixelFd(y,x) = s(r,1).Young_Mod;
pixelRealHight(y,x) = s(r,1).Hight; %%
r = r +1;
end
end
%pixelFd = flipdim(pixelFd,1);
save('pixelFd','pixelFd') %For Debug
save('pixelRealHight','pixelRealHight') %For Debug %%
%Creates the plot of the Young_Mod and the Real Hight image
139
DataImY = DataImX';
fig4 = figure('name', 'Young Mod');
temparr = zeros(1,NumPixelsPerSide);
pixelFd = [pixelFd;temparr]; clear temparr;
temparr = zeros(NumPixelsPerSide+1,1);
pixelFd = [pixelFd,temparr]; clear temparr;
figFd = surf(DataImX,DataImY,pixelFd);
title('Young Mod');
xlabel('um');
ylabel('um');
zlabel('Pa');
colorbar
saveas(figFd,'Young_Mod.fig')
fig5 = figure('name', 'Contact Hight'); %%
temparr = zeros(1,NumPixelsPerSide);
pixelRealHight = [pixelRealHight;temparr]; clear temparr;
temparr = zeros(NumPixelsPerSide+1,1);
pixelRealHight = [pixelRealHight,temparr]; clear temparr;
figRH = surf(DataImX,DataImY,pixelRealHight); %%
title('Topography Contact'); %%
xlabel('um'); %%
ylabel('um'); %%
zlabel('nm'); %%
colorbar %%
saveas(figRH,'Contact_Hight.fig') %%
end
end
Function 1: Dualfitting2,
function [ENm2, inic, r2] = dualfitting1(x,y,beadradius,m,date,val)

140
fullscreen = get(0,'ScreenSize');
fig3 = figure('name', 'Choose the interval to fit',...
'Position',[0 70 fullscreen(3) fullscreen(4)-150]); %Create the
figure where a point is going to be chosen
plot(x,y); %in order to start the fit
axis tight
hold on
%dualcursor
val; %val = [x1 y1 x2 y2]
valX1 = find(x == val(1,1));
valX2 = find(x == val(1,3));
datastep = 2;
rsquares = zeros(round((valX2-valX1)/datastep)-2,1);
for k = 1:round((valX2-valX1)/datastep)-2;
PXaxes = x(valX1+datastep*k:valX2)-x(valX1+datastep*k);
PApproach = y(valX1+datastep*k:valX2)-y(valX1+datastep*k);
[ci,gof,a,b] = Hertz(PXaxes,PApproach);
rsquares(k,1) = gof.rsquare;
end
s1=fitoptions('Method','NonlinearLeastSquares',...
'Lower', [-inf, -inf],...
'Upper', [inf, inf],...
'Startpoint', [1, 1]);
f1=fittype('a*x+b','options',s1);
%110423NewStart
firstpoint = 150;
%110423NewEnd
[ci1,gof1]=fit(x(firstpoint:valX1),y(firstpoint:valX1),f1);
yst = y(firstpoint:valX1)+ci1(x(firstpoint:valX1));
sd = 2*std(yst)
figure(fig3)
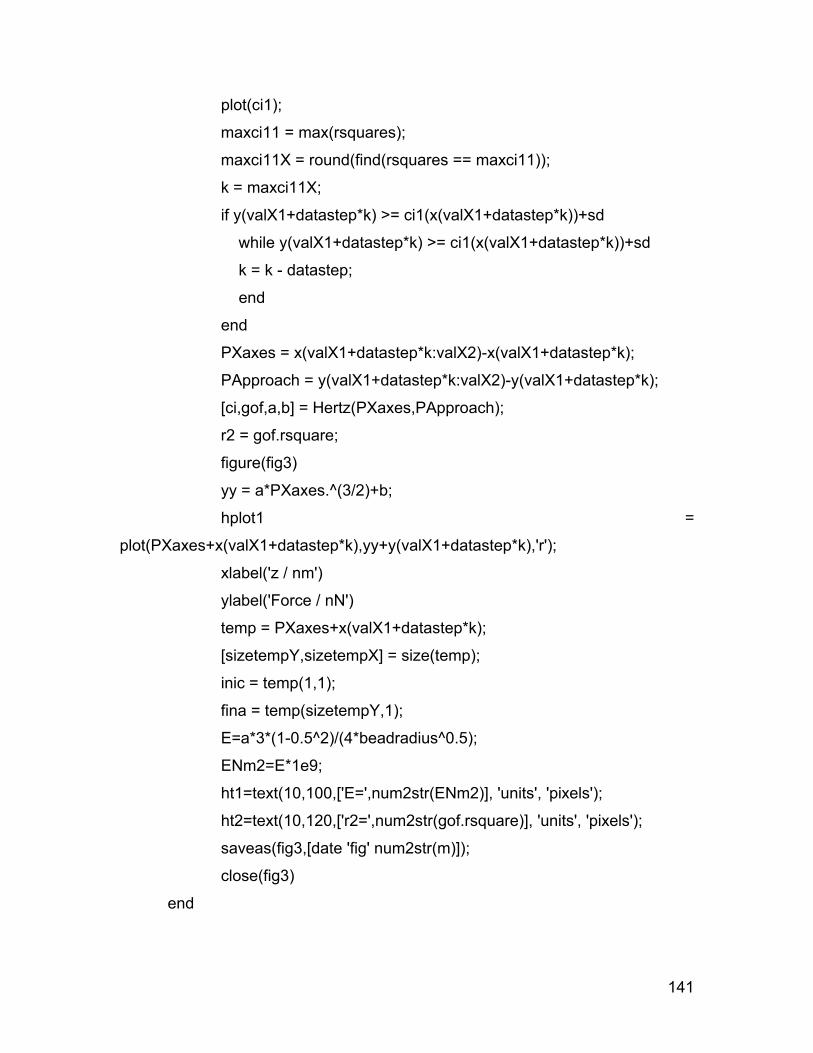
141
plot(ci1);
maxci11 = max(rsquares);
maxci11X = round(find(rsquares == maxci11));
k = maxci11X;
if y(valX1+datastep*k) >= ci1(x(valX1+datastep*k))+sd
while y(valX1+datastep*k) >= ci1(x(valX1+datastep*k))+sd
k = k - datastep;
end
end
PXaxes = x(valX1+datastep*k:valX2)-x(valX1+datastep*k);
PApproach = y(valX1+datastep*k:valX2)-y(valX1+datastep*k);
[ci,gof,a,b] = Hertz(PXaxes,PApproach);
r2 = gof.rsquare;
figure(fig3)
yy = a*PXaxes.^(3/2)+b;
hplot1 =
plot(PXaxes+x(valX1+datastep*k),yy+y(valX1+datastep*k),'r');
xlabel('z / nm')
ylabel('Force / nN')
temp = PXaxes+x(valX1+datastep*k);
[sizetempY,sizetempX] = size(temp);
inic = temp(1,1);
fina = temp(sizetempY,1);
E=a*3*(1-0.5^2)/(4*beadradius^0.5);
ENm2=E*1e9;
ht1=text(10,100,['E=',num2str(ENm2)], 'units', 'pixels');
ht2=text(10,120,['r2=',num2str(gof.rsquare)], 'units', 'pixels');
saveas(fig3,[date 'fig' num2str(m)]);
close(fig3)
end
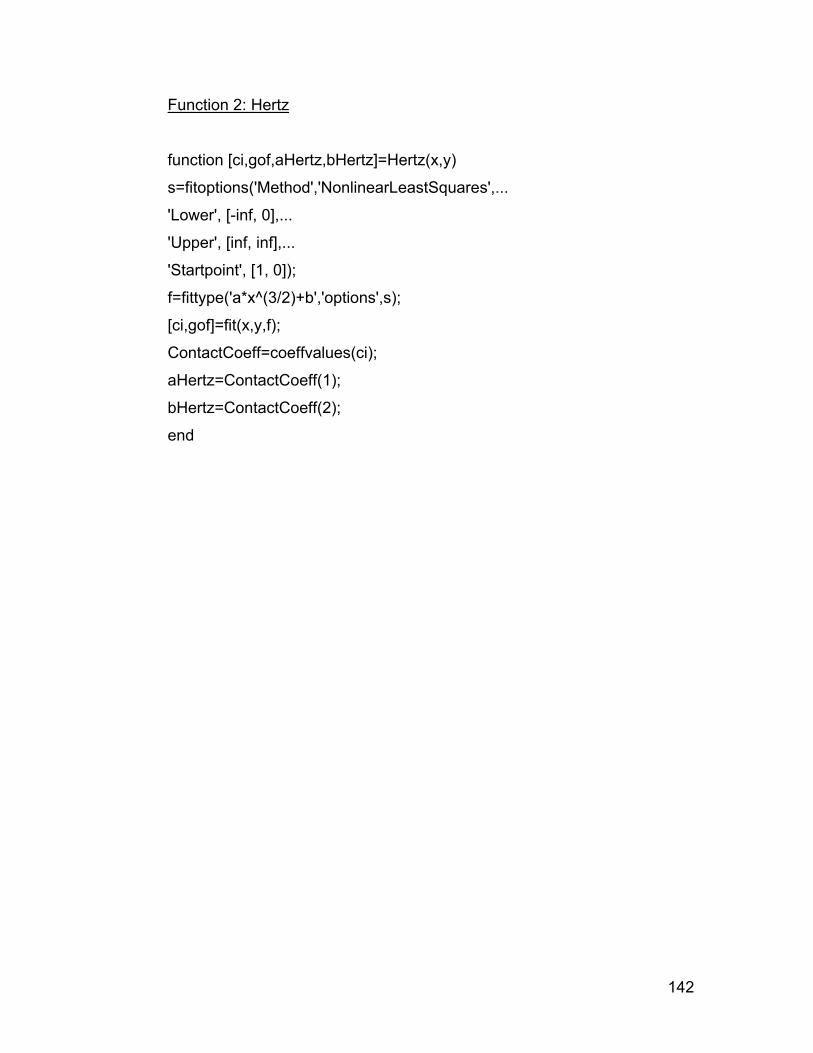
142
Function 2: Hertz
function [ci,gof,aHertz,bHertz]=Hertz(x,y)
s=fitoptions('Method','NonlinearLeastSquares',...
'Lower', [-inf, 0],...
'Upper', [inf, inf],...
'Startpoint', [1, 0]);
f=fittype('a*x^(3/2)+b','options',s);
[ci,gof]=fit(x,y,f);
ContactCoeff=coeffvalues(ci);
aHertz=ContactCoeff(1);
bHertz=ContactCoeff(2);
end

143
11 Appendix 2
In the one-way analysis of variance methodology, the numerator of the
variance (also called total sum of squares or Total SS) which is given by,
ij ij ijijij ij nyyyy /)()( 222
Is partitioned into two components (in the above equation, j is an
observation for the treatment i),
Total SS = SST + SSE
222 )()()( ij iiji iiij ij yyyynyy
where ni is the number of observations for treatment i. In the above
identity, the total variation in the data is split into a portions due to changes in the
values of the independent variable and a portion due to random error.
The mean squares due to the treatment and due to error are written as;
MST = SST / DFT
MET = SSE / DFE
Where DFT is the degree of freedom for treatment (= no. of treatments - 1)
and DFE the degrees of freedom for error (= total number of observations - no. of
treatments)
One-way ANOVA methodology predicts that;
F = MST/MSE
Thus, the F distribution is used to determine whether the means are
significantly different or not.
An example follows,
Data used for the calculations,
Glass /
Pa
Hard /
Pa
Medium
/ Pa
Soft /
Pa
512 779 746 227
401 672 483 283
774 556 311 379
409 1156 1053 528
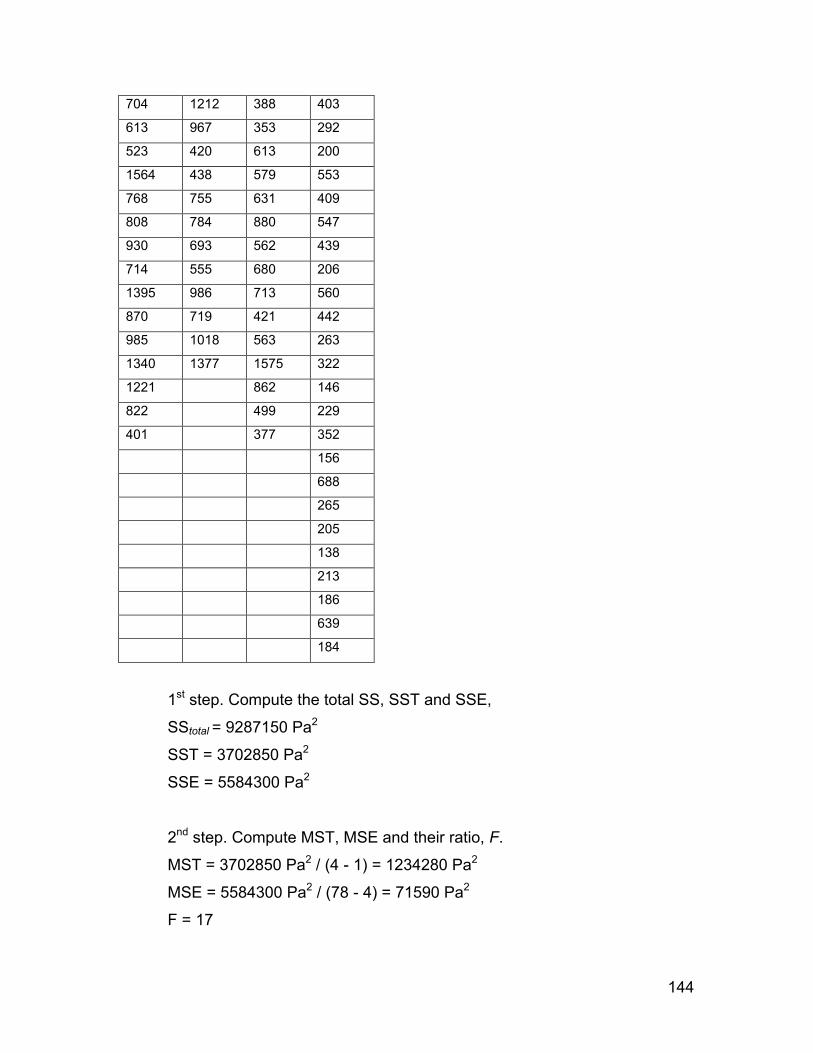
144
704 1212 388 403
613 967 353 292
523 420 613 200
1564 438 579 553
768 755 631 409
808 784 880 547
930 693 562 439
714 555 680 206
1395 986 713 560
870 719 421 442
985 1018 563 263
1340 1377 1575 322
1221 862 146
822 499 229
401 377 352
156
688
265
205
138
213
186
639
184
1st step. Compute the total SS, SST and SSE,
SStotal = 9287150 Pa2
SST = 3702850 Pa2
SSE = 5584300 Pa2
2nd step. Compute MST, MSE and their ratio, F.
MST = 3702850 Pa2 / (4 - 1) = 1234280 Pa2
MSE = 5584300 Pa2 / (78 - 4) = 71590 Pa2
F = 17
145
Now, looking at an F-distribution table (this table can be consulted in many
references)
F(DFT, DFE) = F(3,74) = 2.73.
One-way ANOVA predicts that if the calculated F is larger than F(DFT,
DFE), there is difference among the means.
Combination of this result with multiple compassion analysis performed in
MatLab programming software allowed to determine that the mean that is
different from the others is the one that correspond to cell cultured on soft gels.
146
12 Bibliography
Abrams G, Murphy C, Wang Z-Y, Nealey P, Bjorling D (2003) "Ultrastructural basement
membrane topography of the bladder epithelium" Urological Research 31:341-
346-346.
Abrams GA, Goodman SL, Nealey PF, Franco M, Murphy CJ (2000) "Nanoscale
topography of the basement membrane underlying the corneal epithelium of the
rhesus macaque" Cell and Tissue Research 299:39-46-46.
Afrin R, Arakawa H, Osada T, Ikai A (2003) "Extraction of membrane proteins from a
living cell surface using the atomic force microscope and covalent crosslinkers"
Cell Biochemistry and Biophysics 39:101-117.
Afrin R, Ikai A (2006) "Force profiles of protein pulling with or without cytoskeletal
links studied by AFM" Biochemical and Biophysical Research Communications
348:238-244.
Afrin R, Zohora US, Uehara H, Watanabe-Nakayama T, Ikai A (2009) "Atomic force
microscopy for cellular level manipulation: imaging intracellular structures and
DNA delivery through a membrane hole" Journal of Molecular Recognition
22:363-372.
Ahmari SE, Buchanan J, Smith SJ (2000) "Assembly of presynaptic active zones from
cytoplasmic transport packets" Nature Neuroscience 3:445-451.
Alcaraz J, Buscemi L, Grabulosa M, Trepat X, Fabry B, Farré R, Navajas D (2003)
"Microrheology of Human Lung Epithelial Cells Measured by Atomic Force
Microscopy" 84:2071-2079.
Alcaraz J, Buscemi L, Puig-de-Morales M, Colchero J, Baró A, Navajas D (2002)
"Correction of Microrheological Measurements of Soft Samples with Atomic
Force Microscopy for the Hydrodynamic Drag on the Cantilever" Langmuir
18:716-721.
Ananthakrishnan R, Guck J, Wottawah F, Schinkinger S, Lincoln B, Romeyke M, Moon
T, Käs J (2006) "Quantifying the contribution of actin networks to the elastic
strength of fibroblasts" Journal of Theoretical Biology 242:502-516.
Ando T, Kodera N, Takai E, Maruyama D, Saito K, Toda A (2001) "A high-speed atomic
force microscope for studying biological macromolecules" Proceedings of the
National Academy of Sciences of the United States of America 98:12468-12472.
Andrew Yacoot LK (2008) "Aspects of scanning force microscope probes and their
effects on dimensional measurement" Journal of Physics D: Applied Physics
10:103001.
Ashkenazi A, Dixit VM (1998) "Death Receptors: Signaling and Modulation" Science
281:1305-1308.
Bailly M, Macaluso F, Cammer M, Chan A, Segall JE, Condeelis JS (1999)
"Relationship between Arp2/3 Complex and the Barbed Ends of Actin Filaments
at the Leading Edge of Carcinoma Cells after Epidermal Growth Factor
Stimulation" The Journal of Cell Biology 145:331-345.
Bausch AR, Ziemann F, Boulbitch AA, Jacobson K, Sackmann E (1998) "Local
Measurements of Viscoelastic Parameters of Adherent Cell Surfaces by Magnetic
Bead Microrheometry" Biophysical Journal 75:2038-2049.
147
Benson DL, Tanaka H (1998) "N-Cadherin Redistribution during Synaptogenesis in
Hippocampal Neurons" J Neurosci 18:6892-6904.
Bernal R, Pullarkat PA, Melo F (2007) "Mechanical Properties of Axons" Physical
review letters 99:018301-018304.
Biederer T, Sara Y, Mozhayeva M, Atasoy D, Liu X, Kavalali ET, Sudhof TC (2002)
"SynCAM, a Synaptic Adhesion Molecule That Drives Synapse Assembly"
Science 297:1525-1531.
Binnig G, Quate CF, Gerber C (1986) "Atomic Force Microscope" Physical Review
Letters 56:930.
Bott K, Upton Z, Schrobback K, Ehrbar M, Hubbell JA, Lutolf MP, Rizzi SC (2010)
"The effect of matrix characteristics on fibroblast proliferation in 3D gels"
Biomaterials 31:8454-8464.
Brangwynne CP, MacKintosh FC, Kumar S, Geisse NA, Talbot J, Mahadevan L, Parker
KK, Ingber DE, Weitz DA (2006) "Microtubules can bear enhanced compressive
loads in living cells because of lateral reinforcement" The Journal of Cell Biology
173:733-741.
Bray D, Chapman K (1985) "Analysis of microspike movements on the neuronal growth
cone" Journal of Neuroscience 5:3204-3213.
Brighton CA, G. Pritchard and G. A. Skinner (ed.) (1979) Styrene polymers: Technology
and environmental aspects. London: Applied Science Publishers.
Burnham NA, Chen X, Hodges CS, Matei GA, Thoreson EJ, Roberts CJ, Davies MC,
Tendler SJB (2003) "Comparison of calibration methods for atomic-force
microscopy cantilevers" Nanotechnology 14:1-6.
Burry RW (1980) "Formation of apparent presynaptic elements in response to poly-basic
compounds" Brain Research 184:85-98.
Burry RW (1982) "Development of apparent presynaptic elements formed in response to
polylysine coated surfaces" Brain Research 247:1-16.
Cai S, Pestic-Dragovich L, O’Donnell ME, Wang N, Ingber D, Elson E, De Lanerolle P
(1998) "Regulation of cytoskeletal mechanics and cell growth by myosin light
chain phosphorylation" American Journal of Physiology - Cell Physiology
275:C1349-C1356.
Carlier M-F (1990) "Actin polymerization and ATP hydrolysis" Advances in Biophysics
26:51-73.
Casuso I, Kodera N, Le Grimellec C, Ando T, Scheuring S (2009) "Contact-Mode High-
Resolution High-Speed Atomic Force Microscopy Movies of the Purple
Membrane" Biophysical Journal 97:1354-1361.
Cavalcante FSA, Ito S, Brewer K, Sakai H, Alencar AM, Almeida MP, Andrade JS,
Majumdar A, Ingenito EP, Suki B (2005) "Mechanical interactions between
collagen and proteoglycans: implications for the stability of lung tissue" Journal
of Applied Physiology 98:672-679.
Charras GT, Yarrow JC, Horton MA, Mahadevan L, Mitchison TJ (2005) "Non-
equilibration of hydrostatic pressure in blebbing cells" Nature 435:365-369.
Cheng C-M, Steward Jr RL, LeDuc PR (2009a) "Probing cell structure by controlling the
mechanical environment with cell-substrate interactions" Journal of Biomechanics
42:187-192.
148
Cheng G, Tse J, Jain RK, Munn LL (2009b) "Micro-Environmental Mechanical Stress
Controls Tumor Spheroid Size and Morphology by Suppressing Proliferation and
Inducing Apoptosis in Cancer Cells" PLoS ONE 4:e4632.
Chiquet M (1999) "Regulation of extracellular matrix gene expression by mechanical
stress" Matrix Biology 18:417-426.
Chiquet M, Renedo AS, Huber F, Flück M (2003) "How do fibroblasts translate
mechanical signals into changes in extracellular matrix production?" Matrix
Biology 22:73-80.
Cleveland JP, Manne S, Bocek D, Hansma PK (1993) "A nondestructive method for
determining the spring constant of cantilevers for scanning force microscopy"
Review of Scientific Instruments 64:403-405.
Derjaguin BV, Muller VM, Toporov YP (1975) "Effect of contact deformations on the
adhesion of particles" Journal of Colloid and Interface Science 53:314-326.
Desai A, Mitchison TJ (2003) "Microtubule polymerization dynamics" Annual Review of
Cell and Developmental Biology 13:83-117.
Dickson BJ (2002) "Molecular Mechanisms of Axon Guidance" Science 298:1959-1964.
Dieck S, Sanmarti-Vila L, Langnaese K, Richter K, Kindler S, Soyke A, Wex H, Smalla
K-H, Kampf U, Franzer J-T, Stumm M, Garner CC, Gundelfinger ED (1998)
"Bassoon, a Novel Zinc-finger CAG/Glutamine-repeat Protein Selectively
Localized at the Active Zone of Presynaptic Nerve Terminals" J Cell Biol
142:499-509.
Dimitriadis EK, Horkay F, Maresca J, Kachar B, Chadwick RS (2002) "Determination of
Elastic Moduli of Thin Layers of Soft Material Using the Atomic Force
Microscope" 82:2798-2810.
Disanza A, Mantoani S, Hertzog M, Gerboth S, Frittoli E, Steffen A, Berhoerster K,
Kreienkamp H-J, Milanesi F, Fiore PPD, Ciliberto A, Stradal TEB, Scita G
(2006) "Regulation of cell shape by Cdc42 is mediated by the synergic actin-
bundling activity of the Eps8-IRSp53 complex" Nat Cell Biol 8:1337-1347.
Discher DE, Mooney DJ, Zandstra PW (2009) "Growth Factors, Matrices, and Forces
Combine and Control Stem Cells" Science 324:1673-1677.
Dresbach T, Qualmann B, Kessels MM, Garner CC, Gundelfinger * ED (2001) "The
presynaptic cytomatrix of brain synapses" Cellular and Molecular Life Sciences
58:94-116.
Durisic N, Wise an PW, r tter P, Heyes CD (2009) "A Common Mechanism
Underlies the Dark Fraction Formation and Fluorescence Blinking of Quantum
Dots" ACS Nano 3:1167-1175.
Dvorak JA, Nagao E (1998) "Kinetic Analysis of the Mitotic Cycle of Living Vertebrate
Cells by Atomic Force Microscopy" Experimental Cell Research 242:69-74.
Eckel R, Walhorn V, Pelargus C, Martini J, Nann T, Anselmetti D, Ros R (2006)
Combined TIRF-AFM setup: controlled quenching of individual quantum dots.
vol. 6092 (Enderlein, J. and Gryczynski, Z. K., eds), pp 609209-609208 San Jose,
CA, USA: SPIE.
Engler AJ, Sen S, Sweeney HL, Discher DE (2006a) "Matrix Elasticity Directs Stem Cell
Lineage Specification" Cell 126:677-689.
Engler AJ, Sen S, Sweeney HL, Discher DE (2006b) "Matrix Elasticity Directs Stem Cell
Lineage Specification" 126:677-689.
149
Espenel C, Giocondi M-C, Seantier B, Dosset P, Milhiet P-E, Le Grimellec C (2008)
"Temperature-dependent imaging of living cells by AFM" Ultramicroscopy
108:1174-1180.
Fabry B, Maksym GN, Butler JP, Glogauer M, Navajas D, Fredberg JJ (2001) "Scaling
the Microrheology of Living Cells" Physical Review Letters 87:148102.
Farshid G (2000) "The deformation behavior and viscoelastic properties of chondrocytes
in articular cartilage" Biorheology 37:27-44.
Findley W, J. Lai, and K. Onaran (1976) Creep and Relaxation of Nonlinear Viscoelastic
Materials. New York: Dover Publications, Inc.
Fischer-Cripps AC (1999) "The Hertzian contact surface" Journal of Materials Science
34:129-137.
Fitton JH, Dalton BA, Beumer G, Johnson G, Griesser HJ, Steele JG (1998) "Surface
topography can interfere with epithelial tissue migration" Journal of Biomedical
Materials Research 42:245-257.
Fletcher DA, Mullins RD (2010) "Cell mechanics and the cytoskeleton" Nature 463:485-
492.
Footer MJ, Kerssemakers JWJ, Theriot JA, Dogterom M (2007) "Direct measurement of
force generation by actin filament polymerization using an optical trap"
Proceedings of the National Academy of Sciences 104:2181-2186.
Friedman HV, Bresler T, Garner CC, Ziv NE (2000) "Assembly of new individual
excitatory synapses: Time course and temporal order of synaptic molecule
recruitment" Neuron 27:57-69.
García R, Pérez R (2002) "Dynamic atomic force microscopy methods" Surface Science
Reports 47:197-301.
Garner C, Waites C, Ziv N (2006) "Synapse development: still looking for the forest, still
lost in the trees" Cell and Tissue Research 326:249-262.
Garner CC, Nash J, Huganir RL (2000) "PDZ domains in synapse assembly and
signalling" Trends in Cell Biology 10:274-280.
Garner CC, Zhai RG, Gundelfinger ED, Ziv NE (2002) "Molecular mechanisms of CNS
synaptogenesis" Trends in Neurosciences 25:243-250.
Gavara N, Roca-Cusachs P, Sunyer R, Farré R, Navajas D (2008) "Mapping Cell-Matrix
Stresses during Stretch Reveals Inelastic Reorganization of the Cytoskeleton"
Biophysical Journal 95:464-471.
Goldberg DJ, Burmeister DW (1986) "Stages in axon formation: observations of growth
of Aplysia axons in culture using video-enhanced contrast-differential
interference contrast microscopy" J Cell Biol 103:1921-1931.
Graf ER, Zhang X, Jin S-X, Linhoff MW, Craig AM (2004) "Neurexins Induce
Differentiation of GABA and Glutamate Postsynaptic Specializations via
Neuroligins" Cell 119:1013-1026.
Hadjipanayi E, Mudera V, Brown RA (2009) "Close dependence of fibroblast
proliferation on collagen scaffold matrix stiffness" Journal of Tissue Engineering
and Regenerative Medicine 3:77-84.
Hamon L, Pastré D, Dupaigne P, Breton CL, Cam EL, Piétrement O (2007) "High-
resolution AFM imaging of single-stranded DNA-binding (SSB) protein—DNA
complexes" Nucleic Acids Research 35:e58.
150
Han SW, Nakamura C, Obataya I, Nakamura N, Miyake J (2005) "A molecular delivery
system by using AFM and nanoneedle" Biosensors and Bioelectronics 20:2120-
2125.
Hansma PK, Cleveland JP, Radmacher M, Walters DA, Hillner PE, Bezanilla M, Fritz M,
Vie D, Hansma HG, Prater CB, Massie J, Fukunaga L, Gurley J, Elings V (1994)
"Tapping mode atomic force microscopy in liquids" Applied Physics Letters
64:1738-1740.
Hansma PK, Schitter G, Fantner GE, Prater C (2006) "High-Speed Atomic Force
Microscopy" Science 314:601-602.
Hassan E, Heinz WF, Antonik MD, D'Costa NP, Nageswaran S, Schoenenberger CA,
Hoh JH (1998) "Relative microelastic mapping of living cells by atomic force
microscopy" Biophys J 74:1564-1578.
Heinz WF, Hoh JH (1999) "Spatially resolved force spectroscopy of biological surfaces
using the atomic force microscope" Trends in Biotechnology 17:143-150.
Herrmann H, Bar H, Kreplak L, Strelkov SV, Aebi U (2007) "Intermediate filaments:
from cell architecture to nanomechanics" Nat Rev Mol Cell Biol 8:562-573.
Hertz H (1882) "Über den Berührung fester elastischer Körper" J Reine Angew
Mathematik 92:156-171.
Hoffmeister B, Smith S, Handley S, Rho J (2000) "Anisotropy of Young's modulus of
human tibial cortical bone" Medical and Biological Engineering and Computing
38:333-338.
Hofmann UG, Rotsch C, Parak WJ, Radmacher M (1997) "Investigating the
Cytoskeleton of Chicken Cardiocytes with the Atomic Force Microscope" Journal
of Structural Biology 119:84-91.
Holbery JD, Eden VL, Sarikaya M, Fisher RM (2000) "Experimental determination of
scanning probe microscope cantilever spring constants utilizing a nanoindentation
apparatus" Review of Scientific Instruments 71:3769-3776.
Holmes DL SN (1991) "Estimation of polyacrylamide gel pore size from Ferguson plots
of linear DNA fragments. II. Comparison of gels with different crosslinker
concentrations, added agarose and added linear polyacrylamide." Electrophoresis
12:612-619.
Holzapfel GA, Sommer G, Regitnig P (2004) "Anisotropic Mechanical Properties of
Tissue Components in Human Atherosclerotic Plaques" Journal of Biomechanical
Engineering 126:657-665.
Humphris ADL, Miles MJ, Hobbs JK (2005) "A mechanical microscope: High-speed
atomic force microscopy" Applied Physics Letters 86:034106.
Hutter JL, Bechhoefer J (1993) "Calibration of atomic-force microscope tips" Review of
Scientific Instruments 64:1868-1873.
Icard-Arcizet D, Cardoso O, Richert A, Hénon S (2008) "Cell Stiffening in Response to
External Stress is Correlated to Actin Recruitment" Biophysical Journal 94:2906-
2913.
Ichtchenko K, Nguyen T, Südhof TC (1996) "Structures, Alternative Splicing, and
Neurexin Binding of Multiple Neuroligins" Journal of Biological Chemistry
271:2676-2682.
Ingber DE (2002) "Mechanical Signaling and the Cellular Response to Extracellular
Matrix in Angiogenesis and Cardiovascular Physiology" Circ Res 91:877-887.
151
Isambert H, Venier P, Maggs A, Fattoum A, Kassab R, Pantaloni D, Carlier M (1995)
"Flexibility of actin filaments derived from thermal fluctuations. Effect of bound
nucleotide, phalloidin, and muscle regulatory proteins" Journal of Biological
Chemistry 270:11437-11444.
Jaasma MJ, Jackson WM, Tang RY, Keaveny TM (2007) "Adaptation of cellular
mechanical behavior to mechanical loading for osteoblastic cells" Journal of
Biomechanics 40:1938-1945.
Janmey PA, Käs J, Shah JV, Allen PG, Tang JX (1998) "Cytoskeletal Networks and
Filament Bundles: Regulation by Proteins and Polycations" Biological Bulletin
194:334-336.
Janmey PA, McCulloch CA (2007) "Cell Mechanics: Integrating Cell Responses to
Mechanical Stimuli" Annual Review of Biomedical Engineering 9:1-34.
Jie Song JC, Catherine M. Klapperich, Vincent Eng and Carolyn R. Bertozzi (2004)
"Functional glass slides for in vitro evaluation of interactions between
osteosarcoma TE85 cells and mineral-binding ligands" J Mater Chem 14:2643-
2648.
Johnson KL (1987) Contact mechanics. Cambridge: Cambridge University Press.
Johnson KL, Kendall K, Roberts AD (1971) "Surface Energy and the Contact of Elastic
Solids" Proceedings of the Royal Society of London A Mathematical and Physical
Sciences 324:301-313.
Jonas O, Duschl C (2010) "Force propagation and force generation in cells" Cytoskeleton
67:555-563.
Kaech S, Banker G (2006) "Culturing hippocampal neurons" Nat Protoc 1:2406-2415.
Kaether C, Skehel P, Dotti CG (2000) "Axonal Membrane Proteins Are Transported in
Distinct Carriers: A Two-Color Video Microscopy Study in Cultured
Hippocampal Neurons" Mol Biol Cell 11:1213-1224.
Kataoka N, Iwaki K, Hashimoto K, Mochizuki S, Ogasawara Y, Sato M, Tsujioka K,
Kajiya F (2002) "Measurements of endothelial cell-to-cell and cell-to-substrate
gaps and micromechanical properties of endothelial cells during monocyte
adhesion" Proceedings of the National Academy of Sciences of the United States
of America 99:15638-15643.
Kennedy MB (2000) "Signal-Processing Machines at the Postsynaptic Density" Science
290:750-754.
Kienberger F, Zhu R, Moser R, Blaas D, Hinterdorfer P (2004) "Monitoring RNA
Release from Human Rhinovirus by Dynamic Force Microscopy" J Virol
78:3203-3209.
Kim H, Uehara H, Afrin R, Arakawa H, Sekiguchi H, Osada T, Ikai A (2008)
Application of Atomic Force Microscopy to the Study of Expressed Molecules in
or on a Single Living Cell. In: Applied Scanning Probe Methods IX(Tomitori, M.
et al., eds), pp 149-175: Springer Berlin Heidelberg.
Kim S, Burette A, Chung HS, Kwon SK, Woo J, Lee HW, Kim K, Kim H, Weinberg RJ,
Kim E (2006) "NGL family PSD-95-interacting adhesion molecules regulate
excitatory synapse formation" Nat Neurosci 9:1294-1301.
Kodera N, Yamamoto D, Ishikawa R, Ando T (2010) "Video imaging of walking myosin
V by high-speed atomic force microscopy" Nature 468:72-76.
152
Kopp-Marsaudon S, Leclère P, Dubourg F, Lazzaroni R, Aimé JP (2000) "Quantitative
Measurement of the Mechanical Contribution to Tapping-Mode Atomic Force
Microscopy Images of Soft Materials" Langmuir 16:8432-8437.
Kreplak L, Bär H, Leterrier JF, Herrmann H, Aebi U (2005) "Exploring the Mechanical
Behavior of Single Intermediate Filaments" Journal of Molecular Biology
354:569-577.
Kreplak L, Fudge D (2007) "Biomechanical properties of intermediate filaments: from
tissues to single filaments and back" BioEssays 29:26-35.
Lan Y, Papoian GA (2008) "The stochastic dynamics of filopodial growth" Biophys J
94:3839-3852.
Landau LD, and E. M. Lifshitz. (1986) Theory of Elasticity. Oxford: Pergamon Press.
Lang T, Wacker I, Wunderlich I, Rohrbach A, Giese G, Soldati T, Almers W (2000)
"Role of Actin Cortex in the Subplasmalemmal Transport of Secretory Granules
in PC-12 Cells" Biophysical Journal 78:2863-2877.
Lantz MA, Hug HJ, Hoffmann R, van Schendel PJA, Kappenberger P, Martin S, Baratoff
A, Güntherodt H-J (2001) "Quantitative Measurement of Short-Range Chemical
Bonding Forces" Science 291:2580-2583.
Laurent VM, Kasas S, Yersin A, Schäffer TE, Catsicas S, Dietler G, Verkhovsky AB,
Meister J-J (2005) "Gradient of Rigidity in the Lamellipodia of Migrating Cells
Revealed by Atomic Force Microscopy" 89:667-675.
Le Grimellec C, Lesniewska E, Giocondi M-C, Finot E, Vié V, Goudonnet J-P (1998)
"Imaging of the Surface of Living Cells by Low-Force Contact-Mode Atomic
Force Microscopy" Biophysical Journal 75:695-703.
Liu BF, Ma J, Xu QY, Cui FZ (2006) "Regulation of charged groups and laminin patterns
for selective neuronal adhesion" Colloids and Surfaces B: Biointerfaces 53:175-
178.
Liu C-X, et al. (2005) "Measurement of Breaking Force of Fluorescence Labelled
Microtubules with Optical Tweezers" Chinese Physics Letters 22:1278.
Lo C-M, Wang H-B, Dembo M, Wang Y-l (2000) "Cell Movement Is Guided by the
Rigidity of the Substrate" Biophysical Journal 79:144-152.
Lubarsky GV, Davidson MR, Bradley RH (2004) "Elastic modulus, oxidation depth and
adhesion force of surface modified polystyrene studied by AFM and XPS"
Surface Science 558:135-144.
Lucido AL, Sanchez FS, Thostrup P, Kwiatkowski AV, Ortiz SL, Gopalakrishnan G,
Liazoghli D, Belkaid W, Lennox RB, Grutter P, Garner CC, Colman DR (2009a)
"Rapid assembly of functional presynaptic boutons triggered by adhesive
contacts" Journal of Neuroscience submitted.
Lucido AL, Suarez Sanchez F, Thostrup P, Kwiatkowski AV, Leal-Ortiz S,
Gopalakrishnan G, Liazoghli D, Belkaid W, Lennox RB, Grutter P, Garner CC,
Colman DR (2009b) "Rapid Assembly of Functional Presynaptic Boutons
Triggered by Adhesive Contacts" J Neurosci 29:12449-12466.
Lulevich V, Zink T, Chen H-Y, Liu F-T, Liu G-y (2006) "Cell Mechanics Using Atomic
Force Microscopy-Based Single-Cell Compression" Langmuir 22:8151-8155.
Ma X, Sun P, He P, Han P, Wang J, Qiao S, Li D (2010) "Development of monoclonal
antibodies and a competitive ELISA detection method for glycinin, an allergen in
soybean" Food Chemistry 121:546-551.

153
Makishima A, Mackenzie JD (1973) "Direct calculation of Young's moidulus of glass"
Journal of Non-Crystalline Solids 12:35-45.
Makishima A, Mackenzie JD (1975) "Calculation of bulk modulus, shear modulus and
Poisson's ratio of glass" Journal of Non-Crystalline Solids 17:147-157.
Meadows PY, Bemis JE, Walker GC (2003) "Single-Molecule Force Spectroscopy of
Isolated and Aggregated Fibronectin Proteins on Negatively Charged Surfaces in
Aqueous Liquids" Langmuir 19:9566-9572.
Meighan-Mantha RL, Hsu DKW, Guo Y, Brown SAN, Feng S-LY, Peifley KA, Alberts
GF, Copeland NG, Gilbert DJ, Jenkins NA, Richards CM, Winkles JA (1999)
"The Mitogen-inducible Fn14 Gene Encodes a Type I Transmembrane Protein
that Modulates Fibroblast Adhesion and Migration" Journal of Biological
Chemistry 274:33166-33176.
Mitchison TJ, Charras GT, Mahadevan L (2008) "Implications of a poroelastic cytoplasm
for the dynamics of animal cell shape" Seminars in Cell & Developmental
Biology 19:215-223.
Miyake K, Satomi N, Sasaki S (2006) "Elastic modulus of polystyrene film from near
surface to bulk measured by nanoindentation using atomic force microscopy"
Applied Physics Letters 89:031925-031923.
Mogilner A, Rubinstein B (2010) "Actin disassembly 'clock' and membrane tension
determine cell shape and turning: a mathematical model" Journal of Physics:
Condensed Matter 22:194118.
Moldovan N, Keun-Ho K, Espinosa HD (2006) "Design and fabrication of a novel
microfluidic nanoprobe" Microelectromechanical Systems, Journal of 15:204-
213.
Möller C, Allen M, Elings V, Engel A, Müller DJ (1999) "Tapping-Mode Atomic Force
Microscopy Produces Faithful High-Resolution Images of Protein Surfaces"
77:1150-1158.
Mücke N, Kirmse R, Wedig T, Leterrier JF, Kreplak L (2005) "Investigation of the
morphology of intermediate filaments adsorbed to different solid supports"
Journal of Structural Biology 150:268-276.
Mücke N, Kreplak L, Kirmse R, Wedig T, Herrmann H, Aebi U, Langowski J (2004)
"Assessing the Flexibility of Intermediate Filaments by Atomic Force
Microscopy" Journal of Molecular Biology 335:1241-1250.
Muller DJ, Engel A, Carrascosa JL, Velez M (1997) "The bacteriophage [phgr]29 head-
tail connector imaged at high resolution with the atomic force microscope in
buffer solution" EMBO J 16:2547-2553.
Muller VM, Derjaguin BV, Toporov YP (1983) "On two methods of calculation of the
force of sticking of an elastic sphere to a rigid plane" Colloids and Surfaces
7:251-259.
Murthy VN, Camilli PD (2003) "CELL BIOLOGY OF THE PRESYNAPTIC
TERMINAL" Annual Review of Neuroscience 26:701-728.
Nash G, Johnson C, Meiselman H (1984) "Mechanical properties of oxygenated red
blood cells in sickle cell (HbSS) disease" Blood 63:73-82.
Nathalie C, Olivier T, Yanik T, Jean-Jacques M (2002) "Contribution of the nucleus to
the mechanical properties of endothelial cells" Journal of Biomechanics 35:177-
187.
154
Nix JJVaWD (1992) "A new bulge test technique for the determination of Young's
modulus and Poisson's ratio of thin films." Journal of Materials Research pp
3242-3249
Nogales E (2003) "Structural insights into microtubule function" Annual Review of
Biochemistry 69:277-302.
Olson EN, Nordheim A (2010) "Linking actin dynamics and gene transcription to drive
cellular motile functions" Nat Rev Mol Cell Biol 11:353-365.
Oyabu N, Custance, Oacute, scar, Yi I, Sugawara Y, Morita S (2003) "Mechanical
Vertical Manipulation of Selected Single Atoms by Soft Nanoindentation Using
Near Contact Atomic Force Microscopy" Physical Review Letters 90:176102.
Pasternak C, Wong S, Elson EL (1995) "Mechanical function of dystrophin in muscle
cells" The Journal of Cell Biology 128:355-361.
Paszek MJ, Zahir N, Johnson KR, Lakins JN, Rozenberg GI, Gefen A, Reinhart-King
CA, Margulies SS, Dembo M, Boettiger D, Hammer DA, Weaver VM (2005)
"Tensional homeostasis and the malignant phenotype" Cancer Cell 8:241-254.
Pelham RJ, Wang Y-l (1997) "Cell locomotion and focal adhesions are regulated by
substrate flexibility" Proceedings of the National Acade y of Sciences of the
United States of America 94:13661-13665.
Perez R, Scarontich I, Payne MC, Terakura K (1998) "Surface-tip interactions in
noncontact atomic-force microscopy on reactive surfaces: Si(111)" Physical
Review B 58:10835.
Petroll WM, Cavanagh HD, Jester JV (2004) "Dynamic three-dimensional visualization
of collagen matrix remodeling and cytoskeletal organization in living corneal
fibroblasts" Scanning 26:1-10.
Pfaendtner J, Lyman E, Pollard TD, Voth GA (2010) "Structure and Dynamics of the
Actin Filament" Journal of Molecular Biology 396:252-263.
Phillips GR, Huang JK, Wang Y, Tanaka H, Shapiro L, Zhang W, Shan W-S, Arndt K,
Frank M, Gordon RE (2001) "The Presynaptic Particle Web: Ultrastructure,
Composition, Dissolution, and Reconstitution" Neuron 32:63-77.
Pierobon P, Achouri S, Courty S, Dunn AR, Spudich JA, Dahan M, Cappello G (2009)
"Velocity, Processivity, and Individual Steps of Single Myosin V Molecules in
Live Cells" 96:4268-4275.
Piner RD, Zhu J, Xu F, Hong S, Mirkin CA (1999) ""Dip-Pen" Nanolithography" Science
283:661-663.
Podolski JL, Steck TL (1990) "Length distribution of F-actin in Dictyostelium
discoideum" Journal of Biological Chemistry 265:1312-1318.
Pollard TD, Blanchoin L, Mullins RD (2000) "Molecular mechanisms controlling actin
filament dynamics in nonmuscle cells" Annual Review of Biophysics and
Biomolecular Structure 29:545-576.
Pollard TD, Cooper JA (2009) "Actin, a Central Player in Cell Shape and Movement"
Science 326:1208-1212.
Putman CAJ, Werf KOVd, Grooth BGD, Hulst NFV, Greve J (1994) "Tapping mode
atomic force microscopy in liquid" Applied Physics Letters 64:2454-2456.
Qiang L, Yu W, Liu M, Solowska JM, Baas PW (2010) "Basic fibroblast growth factor
elicits formation of interstitial axonal branches via enhanced severing of
microtubules" Mol Biol Cell 21:334-344.
155
Reiter G, Castelein G, Hoerner P, Riess G, Sommer J-U, Floudas G (2000)
"Morphologies of diblock copolymer thin films before and after crystallization"
Eur Phys J E 2:319-334.
Rho JY, Ashman RB, Turner CH (1993) "Young's modulus of trabecular and cortical
bone material: Ultrasonic and microtensile measurements" Journal of
Biomechanics 26:111-119.
Risse P-A, Jo T, Suarez F, Hirota N, Tolloczko B, Ferraro P, Grütter P, Martin JG (2011)
"Interleukin-13 inhibits proliferation and enhances contractility of human airway
smooth muscle cells without change in contractile phenotype" American Journal
of Physiology - Lung Cellular and Molecular Physiology.
Robert A. Robergs RL (2002) "The surprising history of the ―HR ax=220-age‖
equation" Journal of Exercise Physiology 5.
Rosenblatt N, Hu S, Chen J, Wang N, Stamenovic D (2004) "Distending stress of the
cytoskeleton is a key determinant of cell rheological behavior" Biochemical and
Biophysical Research Communications 321:617-622.
Rotsch C, Braet F, Wisse E, Radmacher M (1997) "AFM IMAGING AND
ELASTICITY MEASUREMENTS ON LIVING RAT LIVER
MACROPHAGES" Cell Biology International 21:685-696.
Rotsch C, Jacobson K, Radmacher M (1999) "Dimensional and mechanical dynamics of
active and stable edges in motile fibroblasts investigated by using atomic force
microscopy" Proceedings of the National Academy of Sciences of the United
States of America 96:921-926.
Rugar D, Mamin HJ, Guethner P (1989) "Improved fiber-optic interferometer for atomic
force microscopy" Applied Physics Letters 55:2588-2590.
Sabo SL, Gomes RA, McAllister AK (2006) "Formation of Presynaptic Terminals at
Predefined Sites along Axons" J Neurosci 26:10813-10825.
Sader JE (1995) "Parallel beam approximation for V-shaped atomic force microscope
cantilevers" Review of Scientific Instruments 66:4583-4587.
Sader JE (ed.) (2002) Calibration of atomic force microscopy cantilevers: Marcel Dekker
Inc.
Sader JE, Larson I, Mulvaney P, White LR (1995) "Method for the calibration of atomic
force microscope cantilevers" Review of Scientific Instruments 66:3789-3798.
Saha K, Keung AJ, Irwin EF, Li Y, Little L, Schaffer DV, Healy KE (2008a) "Substrate
Modulus Directs Neural Stem Cell Behavior" Biophysical Journal 95:4426-4438.
Saha K, Keung AJ, Irwin EF, Li Y, Little L, Schaffer DV, Healy KE (2008b) "Substrate
Modulus Directs Neural Stem Cell Behavior" 95:4426-4438.
San Paulo A, García R (2000) "High-Resolution Imaging of Antibodies by Tapping-
Mode Atomic Force Microscopy: Attractive and Repulsive Tip-Sample
Interaction Regimes" Biophysical Journal 78:1599-1605.
Santacroce M, Orsini F, Perego C, Lenardi C, Castagna M, Mari SA, Sacchi VF, Poletti
G (2006) "Atomic force microscopy imaging of actin cortical cytoskeleton of
Xenopus laevis oocyte" Journal of Microscopy 223:57-65.
Sarah EC, et al. (2008) "AFM-based analysis of human metastatic cancer cells"
Nanotechnology 19:384003.
156
Sato M, Nagayama K, Kataoka N, Sasaki M, Hane K (2000) "Local mechanical
properties measured by atomic force microscopy for cultured bovine endothelial
cells exposed to shear stress" Journal of Biomechanics 33:127-135.
Scannevin RH, Huganir RL (2000) "Postsynaptic organisation and regulation of
excitatory synapses" Nat Rev Neurosci 1:133-141.
Schaffer TE, Cleveland JP, Ohnesorge F, Walters DA, Hansma PK (1996) "Studies of
vibrating atomic force microscope cantilevers in liquid" Journal of Applied
Physics 80:3622-3627.
Scheiffele P, Fan J, Choih J, Fetter R, Serafini T (2000) "Neuroligin Expressed in
Nonneuronal Cells Triggers Presynaptic Development in Contacting Axons" Cell
101:657-669.
Schneider SW, Yano Y, Sumpio BE, Jena BP, Geibel JP, Gekle M, Oberleithner H
(1997) "Rapid aldosterone-induced cell volume increase of endothelial cells
measured by the atomic force microscope" Cell Biology International 21:759-768.
Shapira M, Zhai RG, Dresbach T, Bresler T, Torres VI, Gundelfinger ED, Ziv NE,
Garner CC (2003) "Unitary Assembly of Presynaptic Active Zones from Piccolo-
Bassoon Transport Vesicles" Neuron 38:237-252.
Shore SA (2004) "Airway Smooth Muscle in Asthma — Not Just More of the Same"
New England Journal of Medicine 351:531-532.
Shyy JYJ, Chien S (1997) "Role of integrins in cellular responses to mechanical stress
and adhesion" Current Opinion in Cell Biology 9:707-713.
Simmons RM, Finer JT, Warrick HM, Kralik B, Chu S, Spudich JA. (1993) "Force on
single actin filaments in a motility assay measured with an optical trap" Adv Exp
Med Biol 331-337.
Smith B (2004) "Cellular Biomechanics Investigated by Atomic Force Microscopy
(Thesis)".
Smith BA, Roy H, De Koninck P, Grütter P, De Koninck Y (2007a) "Dendritic Spine
Viscoelasticity and Soft-Glassy Nature: Balancing Dynamic Remodeling with
Structural Stability" Biophysical Journal 92:1419-1430.
Smith BA, Roy H, De Koninck P, Grutter P, De Koninck Y (2007b) "Dendritic spine
viscoelasticity and soft-glassy nature: balancing dynamic remodeling with
structural stability" Biophys J 92:1419-1430.
Smith BA, Tolloczko B, Martin JG, Grütter P (2005) "Probing the Viscoelastic Behavior
of Cultured Airway Smooth Muscle Cells with Atomic Force Microscopy:
Stiffening Induced by Contractile Agonist" Biophysical Journal 88:2994-3007.
Sokolov I (2007) Atomic force microscopy in cancer cell research. Valencia, CA:
merican Scientific Publishers.
Stark RW, Drobek T, Heckl WM (2001) "Thermomechanical noise of a free v-shaped
cantilever for atomic-force microscopy" Ultramicroscopy 86:207-215.
Sugimoto Y, Jelinek P, Pou P, Abe M, Morita S, Perez R, Custance O (2007)
"Mechanism for Room-Temperature Single-Atom Lateral Manipulations on
Semiconductors using Dynamic Force Microscopy" Physical Review Letters
98:106104.
Sun Y, Arakawa H, Osada T, Ikai A (2002) "Tapping and contact mode imaging of
native chromosomes and extraction of genomic DNA using AFM tips" Applied
Surface Science 188:499-505.
157
Suresh S (2007) "Nanomedicine: Elastic clues in cancer detection" Nat Nano 2:748-749.
Svitkina TM, Borisy GG (1999) "Arp2/3 Complex and Actin Depolymerizing
Factor/Cofilin in Dendritic Organization and Treadmilling of Actin Filament
Array in Lamellipodia" The Journal of Cell Biology 145:1009-1026.
Tamara KB, et al. (2005) "Human epithelial cells increase their rigidity with ageing in
vitro : direct measurements" Physics in Medicine and Biology 50:81.
Tanaka EM, Kirschner MW (1991) "Microtubule behavior in the growth cones of living
neurons during axon elongation" The Journal of Cell Biology 115:345-363.
Tolloczko B, Jia YL, Martin JG (1995) "Serotonin-evoked calcium transients in airway
smooth muscle cells" Am J Physiol 269:L234-240.
Tortora JP, N. P. Anagnostakos (1990) Principles of Anatomy and Physiology. New
York: Harper-Collins.
Van Vlack LH (1982) Materials for Engineering. Reading, MA: Addison-Wesley
Publishing Company.
Vogt AK, Wrobel G, Meyer W, Knoll W, Offenhausser A (2005) "Synaptic plasticity in
micropatterned neuronal networks" Biomaterials 26:2549-2557.
von Wichert G, Jiang G, Kostic A, De Vos K, Sap J, Sheetz MP (2003) "RPTP-α acts as
a transducer of echanical force on αv/β3-integrin–cytoskeleton linkages" The
Journal of Cell Biology 161:143-153.
Waites CL, Craig AM, Garner CC (2005) "Mechanisms of vertebrate synaptogenesis"
Annu Rev Neurosci 28:251-274.
Wang J, Zohar R, McCulloch CA (2006) "Multiple roles of [alpha]-smooth muscle actin
in mechanotransduction" Experimental Cell Research 312:205-214.
Wang N, Ingber DE (1994) "Control of cytoskeletal mechanics by extracellular matrix,
cell shape, and mechanical tension" Biophysical Journal 66:2181-2189.
Wang N, Tytell JD, Ingber DE (2009) "Mechanotransduction at a distance: mechanically
coupling the extracellular matrix with the nucleus" Nat Rev Mol Cell Biol 10:75-
82.
Wang YL, Pelham RJ, Jr. (1998) "Preparation of a flexible, porous polyacrylamide
substrate for mechanical studies of cultured cells" Methods Enzymol 298:489-
496.
Wilson E, Sudhir K, Ives HE (1995) "Mechanical strain of rat vascular smooth muscle
cells is sensed by specific extracellular matrix/integrin interactions" The Journal
of Clinical Investigation 96:2364-2372.
Wirtz D (2009) "Particle-Tracking Microrheology of Living Cells: Principles and
Applications" Annual Review of Biophysics 38:301-326.
Yamane Y, Shiga H, Haga H, Kawabata K, Abe K, Ito E (2000) "Quantitative analyses of
topography and elasticity of living and fixed astrocytes" Journal of Electron
Microscopy 49:463-471.
Yang C, Hoelzle M, Disanza A, Scita G, Svitkina T (2009) "Coordination of membrane
and actin cytoskeleton dynamics during filopodia protrusion" PLoS One 4:e5678.
You HX, Lau JM, Zhang S, Yu L (2000) "Atomic force microscopy imaging of living
cells: a preliminary study of the disruptive effect of the cantilever tip on cell
morphology" Ultramicroscopy 82:297-305.
158
Yuan H, Kononov S, Cavalcante FSA, Lutchen KR, Ingenito EP, Suki B (2000) "Effects
of collagenase and elastase on the mechanical properties of lung tissue strips"
Journal of Applied Physiology 89:3-14.
Zhai RG, Vardinon-Friedman H, Cases-Langhoff C, Becker B, Gundelfinger ED, Ziv
NE, Garner CC (2001) "Assembling the presynaptic active zone: a
characterization of an active one precursor vesicle" Neuron 29:131-143.
Zigler J, Lepe-Zuniga J, Vistica B, Gery I (1985) "Analysis of the cytotoxic effects of
light-exposed hepes-containing culture medium" In Vitro Cellular &
Developmental Biology - Plant 21:282-287.
Ziv NE, Garner CC (2004) "Cellular and molecular mechanisms of presynaptic
assembly" Nature Reviews Neuroscience 5:385-399.