affinity capture and detection of immunoglobulin e in human serum using an aptamer-modified surface...
TRANSCRIPT
Affinity Capture and Detection of ImmunoglobulinE in Human Serum Using an Aptamer-ModifiedSurface in Matrix-Assisted Laser Desorption/Ionization Mass Spectrometry
Jacquelyn R. Cole, Lawrence W. Dick, Jr.,† Elizabeth J. Morgan, and Linda B. McGown*
Department of Chemistry and Chemical Biology, Cogswell Building, Rensselaer Polytechnic Institute, Troy, New York 12180
Capture and detection of immunoglobulin E (IgE) insimple solution and in human serum using an aptamer-modified probe surface for affinity matrix-assisted laserdesorption/ionization mass spectroscopy detection isreported. Detectable signals were obtained for 1 amol ofIgE applied either in a single, 1-µL application of 1 pMIgE or after 10 successive, 1-µL applications of 100 fMIgE. In both cases, the surface was rinsed after eachapplication of IgE to remove sample concomitants includ-ing salts and free or nonspecifically associated proteins.Detection of native IgE, which is the least abundant of theserum immunoglobulins and occurs at subnanomolarlevels, in human serum was demonstrated and interfer-ence from the high-abundance immunoglobulins andalbumin was investigated. The aptamer-modified surfaceshowed high selectivity toward immunoglobulins in se-rum, with no significant interference from serum albumin.Addition of IgE to the serum suppressed the signals fromthe other immunoglobulins, confirming the expectedselectivity of the aptamer surface toward IgE. Dilution ofthe serum increased the selectivity toward IgE; the proteinwas detected without interference in a 10 000-fold dilu-tion of the serum, which is consistent with detection ofIgE at amol (pM) levels in standard solutions.
The establishment of proteomic approaches to biomarkerdiscovery and disease profiling in recent years has tested the limitsof existing tools for capture and detection of low-abundanceproteins in biological samples. Affinity binding reagents haveplayed a crucial role in the translation of proteomic discoveriesto clinical diagnostics due to their ability to isolate target proteinsfrom complex protein mixtures. Antibodies have been unrivaledas affinity reagents for proteins due to their strong and selectivebinding; however, drawbacks associated with their production,stability, and manipulation have prompted researchers to seekalternatives. Foremost among alternatives are aptamers,1,2 whichoffer affinity on a par with that of monoclonal antibodies, but with
important advantages: first, once an aptamer to a target proteinhas been identified, it can be synthesized, chemically modified,and manipulated with ease; second, aptamers are chemically stableand can be reversibly folded and unfolded for capture and releaseof the target protein, allowing aptamer-modified surfaces to bereused indefinitely. Aptamers have been successfully employedover the past decade in chromatography, capillary electrophoresis,sensing, imaging, and protein isolation, and purification.3-7 Arecent addition to the field is the use of aptamer-modified surfacesfor affinity protein capture and detection in matrix-assisted laserdesorption/ionization mass spectroscopy (MALDI-MS).8 In previ-ous work, we demonstrated proof of principle of aptamer surfacesfor affinity MALDI-MS using the model system of thrombincapture by the G-quartet DNA thrombin-binding aptamer.8 Theapproach was subsequently applied in a nonaptameric system ofinsulin capture from nuclear extracts of cell lysates by a genomicDNA sequence that forms a G-quadruplex.9
The present work is distinguished from our previous studiesof aptamers in affinity MALDI-MS in its focus on the challengingtask of detecting a low-abundance protein in human serum.Specifically, we describe the capture and detection of immuno-globulin E (IgE) in human serum using the DNA aptamer to IgE(5′-GGGGC ACGTT TATCC GTCCC TCCTA GTGGC GTGCCCC-3′).10 IgE is the least abundant of the immunoglobulins inserum, normally occurring at level of ∼800 pM.11 This is 105 lowerthan the most abundant immunoglobulin, IgG, which is normallypresent at ∼100 µM in human serum.11 The IgE aptamer haspreviously been used for label-free12,13 and fluorescent-labeled14,15
detection of IgE in simple solution providing detectability downto 10-10 M IgE (corresponding to 5 fmol using a 50-µL aliquot inthe case of one immobilized aptamer sensor).13 The use of
* Corresponding author. E-mail: [email protected].† Current address: Department of Chemistry, Duke University, Box 90348,
Durham, NC 27708.(1) Tuerk, C.; Gold, L. Science 1990, 249, 505.(2) McGown, L. B.; Joseph, M. J.; Pittner, J. B.; Vonk, G. P.; Linn, C. P. Anal.
Chem. 1995, 67, 663A.
(3) Jayesena, S. D. Clin. Chem. 1999, 45, 1628.(4) Brody, E.; Gold, L. Rev. Mol. Biotechnol. 2000, 74, 5.(5) Tombelli, S.; Minunni, M.; Mascini, M. Biosens. Bioelectron. 2005, 20, 2424.(6) Schou, C.; Heegaard, N. H. H. Electrophoresis 2006, 27, 44.(7) Ravelet, C.; Grosset, C.; Peyrin, E. J. Chromatrogr., A 2006, 1117, 1.(8) Dick, L. W., Jr.; McGown, L. B. Anal. Chem. 2004, 76, 3037.(9) Connor, A. C.; Frederick, K. A.; Morgan, E. J.; McGown, L. B. J. Am. Chem.
Soc. 2006, 128, 4986.(10) Wiegand, T. W.; Williams, P. B.; Dreskin, S. C.; Jouvin, M.; Kinet, J.; Tasset,
D. J. Immunol. 1996, 157, 221.(11) Gould, H. J.; Sutton, B. J.; Beavil, A. J.; Beavil, R. L.; McCloskey, N.; Coker,
H. J.; Fear, D.; Smurthwaite, L. Ann. Rev. Immunol. 2003, 21, 579.(12) Liss, M.; Petersen, B.; Wolf, H.; Prohaska, E. Anal. Chem. 2002, 74, 4488.(13) Xu, D.; Xu, D.; Yu, X.; Liu, Z.; He, W.; Ma, Z. Anal. Chem. 2005, 77, 5107.
Anal. Chem. 2007, 79, 273-279
10.1021/ac061256b CCC: $37.00 © 2007 American Chemical Society Analytical Chemistry, Vol. 79, No. 1, January 1, 2007 273Published on Web 11/17/2006
fluorescent-labeled IgE aptamer in affinity capillary electrophoresisgave a detection limit of 46 pM IgE in simple solution, butapplication to human serum yielded detectable signals only forserum that was spiked with 5 nM IgE and not for native IgE inthe serum.16 In the present work, we achieved capture anddetection of native IgE in human serum and found that dilutionof the serum by at least 103-fold allowed detection of native IgEwith little interference from other serum proteins. Detectabilitycompares favorably with the commercial antibody-based ELISAkit (Human IgE ELISA Quantitation Kit, Bethyl Laboratories,Montgomery, TX) that offers 75 pM detection.14
EXPERIMENTAL SECTIONMaterials. IgE was obtained from Athens Research (Athens,
GA) as the lyophilized protein, reconstituted in deionized water,and stored at -4 °C. Human serum albumin was obtained fromSigma Aldrich (St. Louis, MO) as the lyophilized powder andstored at 2-8 °C. Human sera (normal and IgA/IgG/IgM free)were obtained from Sigma Aldrich. Standard protein solutions andserum samples were prepared by diluting the commercial proteinor serum to the desired concentration in incubation buffer. IgE“standard” solutions were prepared by diluting the appropriatevolume of the commercial sample in buffer (10 mM sodiumphosphate buffer, pH 8.0). For one set of experiments, the serumsample was treated to remove albumin and IgG using an immu-noaffinity kit (ProteoPrep Immunoaffinity Albumin and IgGDepletion Kit) from Sigma Aldrich.
The DNA oligonucleotides, including the IgE aptamer and ascrambled control sequence (5′-TTTTC CGACC TTCCG GGGGCCCCAG CGTCC TGCAG TG-3′)10 that does not exhibit affinitytoward IgE, were synthesized by Eurogentec (San Diego, CA)with a 5′-thiol modification allowing for attachment to the glasssurface. The oligonucleotides were reconstituted in Tris-HClbuffer, pH 7.2, and stored at -4 °C. Other chemicals included2-(4-hydroxyphenylazo)benzoic acid (HABA), tris(2-carboxyethyl)-phosphine (TCEP), 3-aminopropyltriethoxysilane (3-APTES), andsulfo-succinimidyl-4-(N-maleimidomethyl)cyclohexane-1-carboxy-late (sulfo-SMCC) from Sigma (St. Louis, MO) and DL-1,4-dithiothreitol 99% (DTT) from Acros (Morris Plains, NJ). Allbuffers and solutions were prepared using deionized water. Fused-silica plates (20 mm × 20 mm × 0.75 mm) were made by ValleyDesign (Westford, MA).
Preparation of DNA Oligonucleotide-Modified MALDISurfaces. DNA-coated spots were covalently attached to fused-silica slides as previously described.8,9 The surface of the glassplate was first cleaned and activated by rinsing with methanol,water, and sodium hydroxide. The activated plate was thenimmersed in a 10% solution of 3-APTES at 100 °C for 4 h, followedby addition of the heterobifunctional linker sulfo-SMCC to the3-APTES-coated fused-silica surface to create spots that were 1-2mm in diameter. The 5′-thiol-modified DNA (aptamer or scrambledcontrol) was treated with TCEP to give a free sulfhydryl groupand reacted with the linker at the surface. Finally, the DNA-modified plates were rinsed with buffer to remove excess reagents,
dried with ultrahigh-purity nitrogen, and stored at room temper-ature.
Affinity MALDI-MS Experiments. Protein capture and detec-tion at the DNA-coated spots on the fused-silica plate wereperformed as follows (unless otherwise specified in the text): A1-µL sample (either protein standard solution or human serumsample) was applied to each spot and incubated for 30 min. Thespots were then rinsed with distilled water for 30 s to removefree or loosely associated proteins, salts, and other concomitantsand dried with ultrahigh-purity nitrogen. One microliter of MALDImatrix (2.5 mg/mL R in 50:50 acetonitrile.water) was then appliedto each spot and the surface dried to crystallization. The fused-silica plate was then mounted in a specially designed holder in aBruker AutoFlex II MALDI-TOF MS system, and each spot wasanalyzed using a nitrogen laser power of ∼130 µJ. The spot surfacewas sampled at random at 16.7 Hz in linear mode, collecting 10-12 shots/position, for a total of 400 shots/spectrum.
Following analysis, the fused-silica plate was removed andrinsed multiple times, first with 50% acetonitrile in water and thenwith water, to remove solid matrix and proteins. The plate wasthen dried with nitrogen and left at room temperature betweenexperiments on the same day or stored under phosphate bufferin the refrigerator for longer periods. Occasionally, runs wereperformed between samples in which only matrix was applied tothe spots to check for protein carryover from run to run and tocheck for degradation of the DNA-modified surfaces. No evidenceof protein carryover or DNA degradation was observed.
RESULTS AND DISCUSSIONIgE Capture and Detection from Standard IgE Solutions.
Figure 1 shows results for MALDI-MS of 1 µL of 500 nM IgEsolution (500 fmol of IgE) on an unmodified aluminum probesurface (Figure 1A) and at fused-silica probe surfaces modifiedwith the IgE aptamer (Figure 1B) and the scrambled IgE control(Figure 1C). The mass spectrum at the aptamer surface exhibitsthe numerous, multiply charged ions of the 200 000-Da proteinthat are consistent with the spectrum of IgE at a aluminum MALDIprobe. There is a small amount of nonspecific capture at thescrambled control surface. Figure 1D shows the results for a10 000-fold dilution of the IgE solution (50 amol applied) at anaptamer spot. Interestingly, the spectrum at the lower concentra-tion is dominated by peaks at 66 600, 33 300, and 22 200 m/z,which correspond to the +3, +6, and +9 ions of IgE. This isattributed to dominance of these higher charged ions at the highmatrix/protein ratios for these samples, as well as the apparentfavorability of ions with multiples of +3 charge. Alternativeexplanations based on fragmentation of IgE were not borne outby experiments in which IgE was treated with DTT to break thedisulfide bonds between the various chains or subjected to highlaser powers to aid degradation (results not shown).
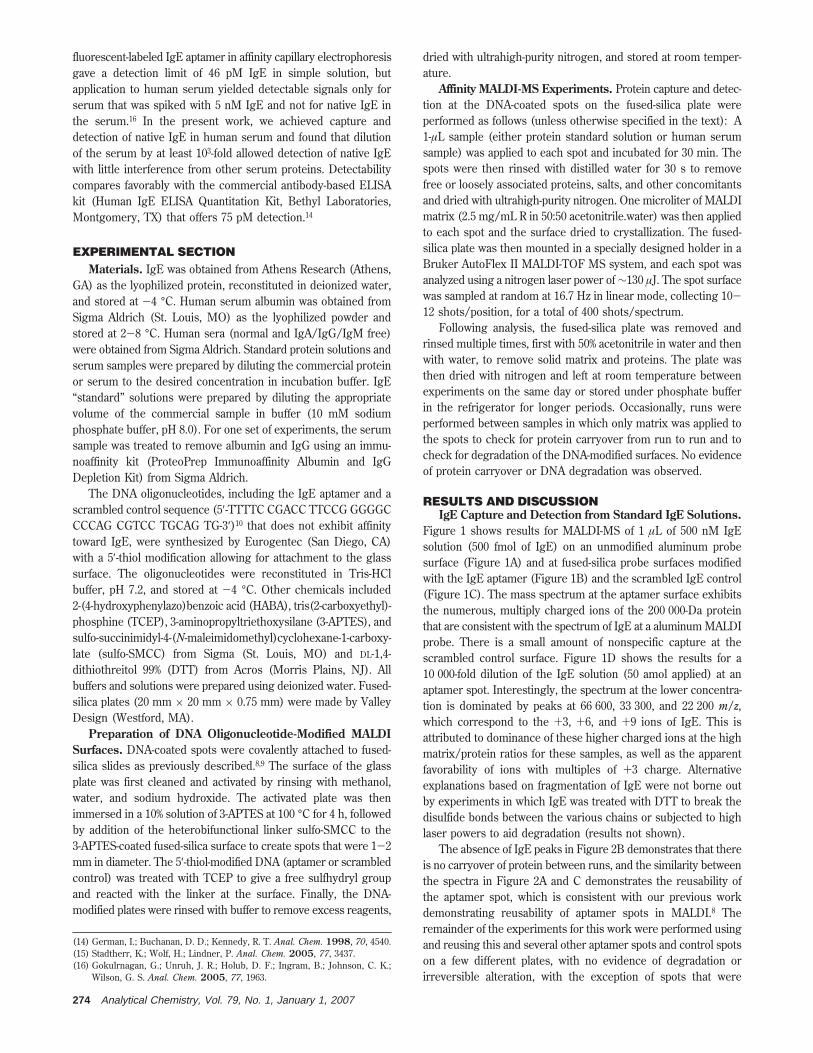
The absence of IgE peaks in Figure 2B demonstrates that thereis no carryover of protein between runs, and the similarity betweenthe spectra in Figure 2A and C demonstrates the reusability ofthe aptamer spot, which is consistent with our previous workdemonstrating reusability of aptamer spots in MALDI.8 Theremainder of the experiments for this work were performed usingand reusing this and several other aptamer spots and control spotson a few different plates, with no evidence of degradation orirreversible alteration, with the exception of spots that were
(14) German, I.; Buchanan, D. D.; Kennedy, R. T. Anal. Chem. 1998, 70, 4540.(15) Stadtherr, K.; Wolf, H.; Lindner, P. Anal. Chem. 2005, 77, 3437.(16) Gokulrnagan, G.; Unruh, J. R.; Holub, D. F.; Ingram, B.; Johnson, C. K.;
Wilson, G. S. Anal. Chem. 2005, 77, 1963.
274 Analytical Chemistry, Vol. 79, No. 1, January 1, 2007

overloaded with serum proteins when concentrated serum wasanalyzed. Those spots were immediately retired and the remainingspots used.
As in Figure 1D, in Figure 2, only the peaks corresponding toions with multiples of +3 charge are evident in the spectra at theselow levels of IgE. Spectra D and E in Figure 2 show the resultsfor 1 amol of IgE that was applied in 10 successive incubation/rinse cycles (1 µL of 100 fM IgE) prior to application of MALDImatrix and analysis, at an aptamer spot and a scrambled spot,respectively. The results illustrate the ability to preconcentrateIgE at an aptamer spot to achieve detectable levels. The absenceof signal for the scrambled spot (Figure 2E) shows that nonspecificbinding of IgE is insignificant at low concentrations of IgE evenafter multiple incubation/rinse cycles.
IgE Capture from Commercial Human Sera. Figure 3shows the results for protein capture from commercial human
serum. Undiluted serum on an aptamer spot (Figure 3A) showsseveral peaks including a series at 150 000, 75 000, 50 000, and37 500 m/z that is attributed to IgG (150 000 Da) and a series at67 000, 33 500, and 22 200 m/z that may be due to serum albumin(67 500 Da) or the +3, +6, and +9 ions of IgE (see below).Analysis of serum that was spiked with IgE by mixing equalvolumes of serum and 50 pM IgE solution prior to application tothe aptamer spot (Figure 3B) increases the latter peaks, suggest-ing that the peaks in the spectrum of the unspiked sample aredue to IgE. Upon 1000-fold dilution of the serum, the IgG peaksdominate the spectrum at both the aptamer and scrambled spots,showing only small contributions from the IgE peaks at theaptamer spot (Figure 3C) and none at the scrambled spot (Figure3D). Like the undiluted serum, spiking the diluted sample withIgE suppresses the IgG peaks and enhances the IgE peaks at theaptamer spot (Figure 3E), indicating effective competition by IgE
Figure 1. Mass spectra of IgE at various surfaces: (A) 500 fmol of IgE on unmodified aluminum probe surface; (B) 500 fmol of IgE onaptamer spot; (C) 500 fmol of IgE on scrambled spot; (D) 50 amol of IgE on aptamer spot; asterisks denote peaks at 22 200, 33 500, and67 000 m/z, corresponding to +9, +6, and +3 ions of IgE. Note that the intensity scale of (A-C) cannot be compared with that of (D).
Analytical Chemistry, Vol. 79, No. 1, January 1, 2007 275
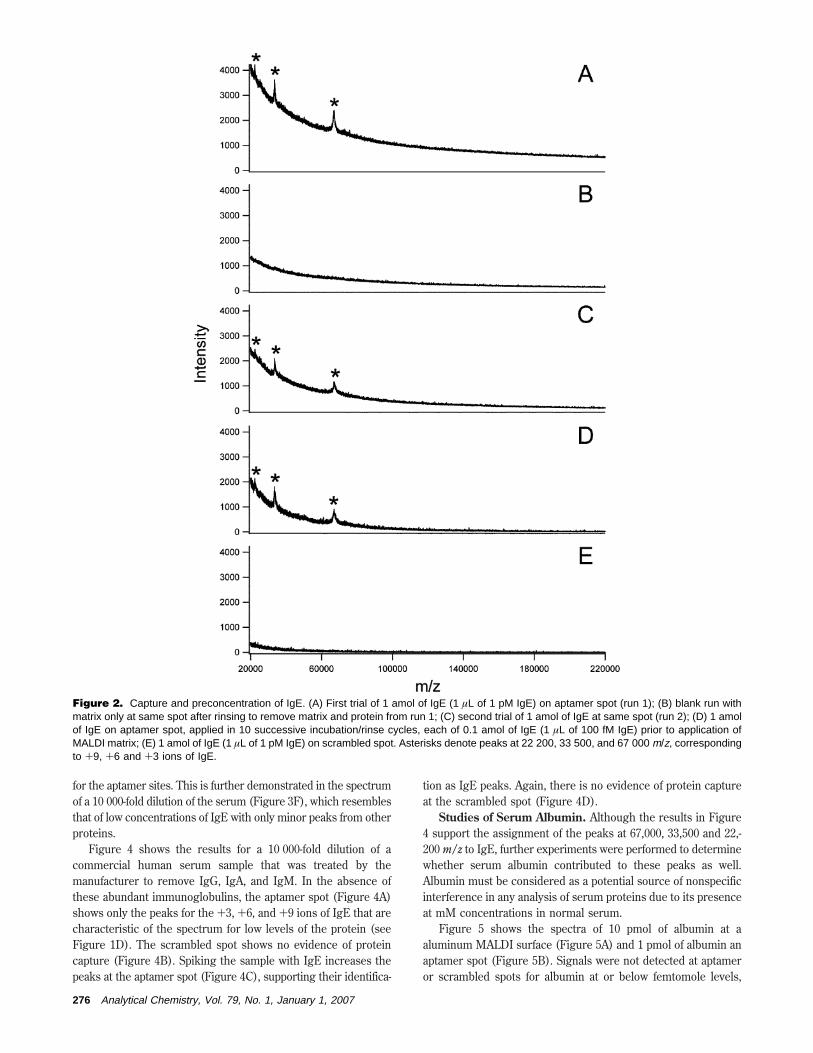
for the aptamer sites. This is further demonstrated in the spectrumof a 10 000-fold dilution of the serum (Figure 3F), which resemblesthat of low concentrations of IgE with only minor peaks from otherproteins.
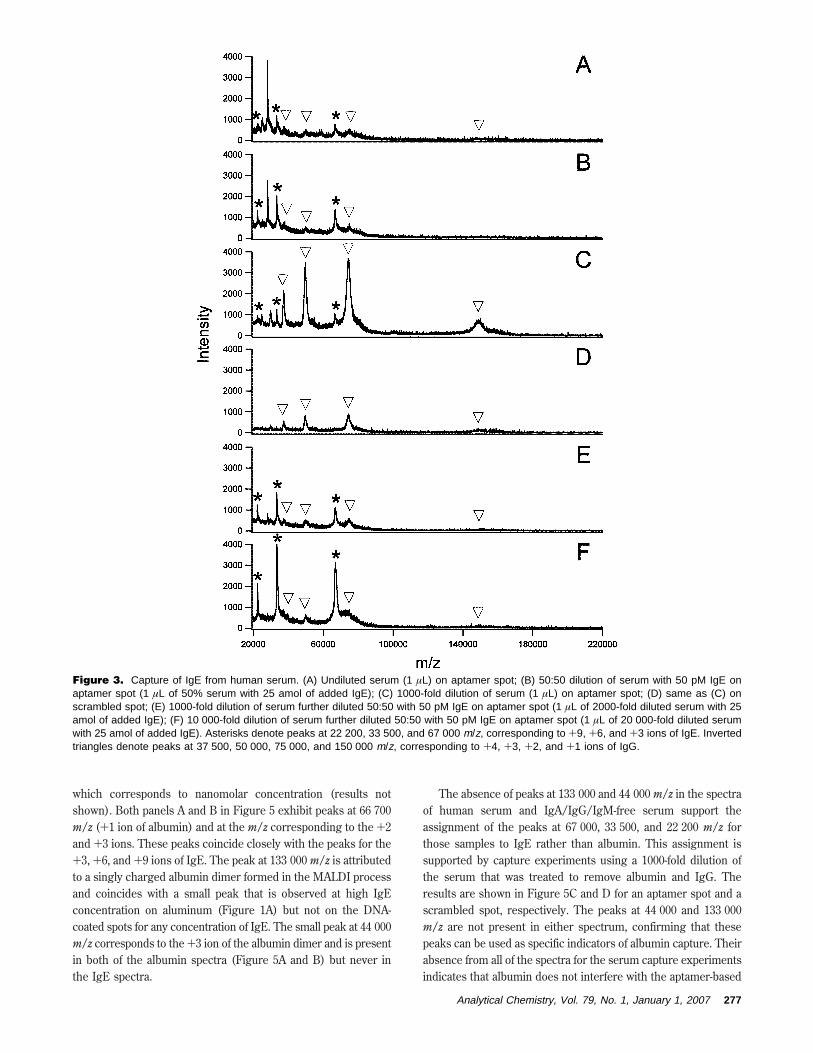
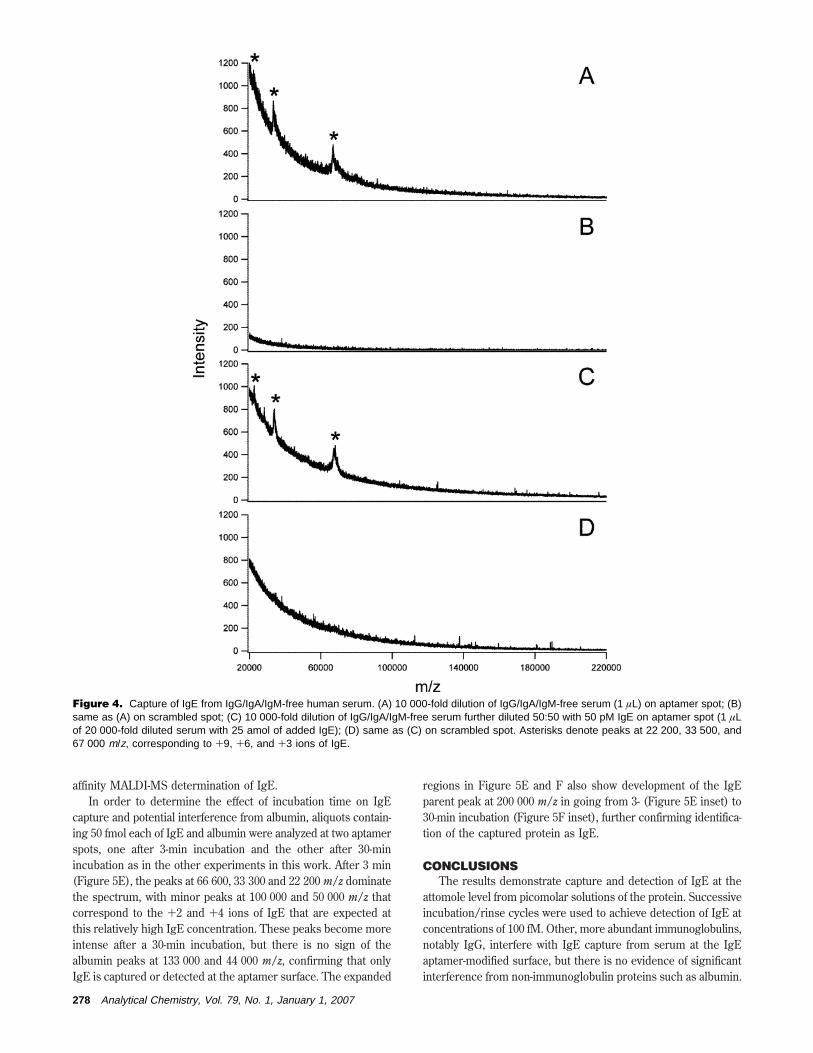
Figure 4 shows the results for a 10 000-fold dilution of acommercial human serum sample that was treated by themanufacturer to remove IgG, IgA, and IgM. In the absence ofthese abundant immunoglobulins, the aptamer spot (Figure 4A)shows only the peaks for the +3, +6, and +9 ions of IgE that arecharacteristic of the spectrum for low levels of the protein (seeFigure 1D). The scrambled spot shows no evidence of proteincapture (Figure 4B). Spiking the sample with IgE increases thepeaks at the aptamer spot (Figure 4C), supporting their identifica-
tion as IgE peaks. Again, there is no evidence of protein captureat the scrambled spot (Figure 4D).
Studies of Serum Albumin. Although the results in Figure4 support the assignment of the peaks at 67,000, 33,500 and 22,-200 m/z to IgE, further experiments were performed to determinewhether serum albumin contributed to these peaks as well.Albumin must be considered as a potential source of nonspecificinterference in any analysis of serum proteins due to its presenceat mM concentrations in normal serum.
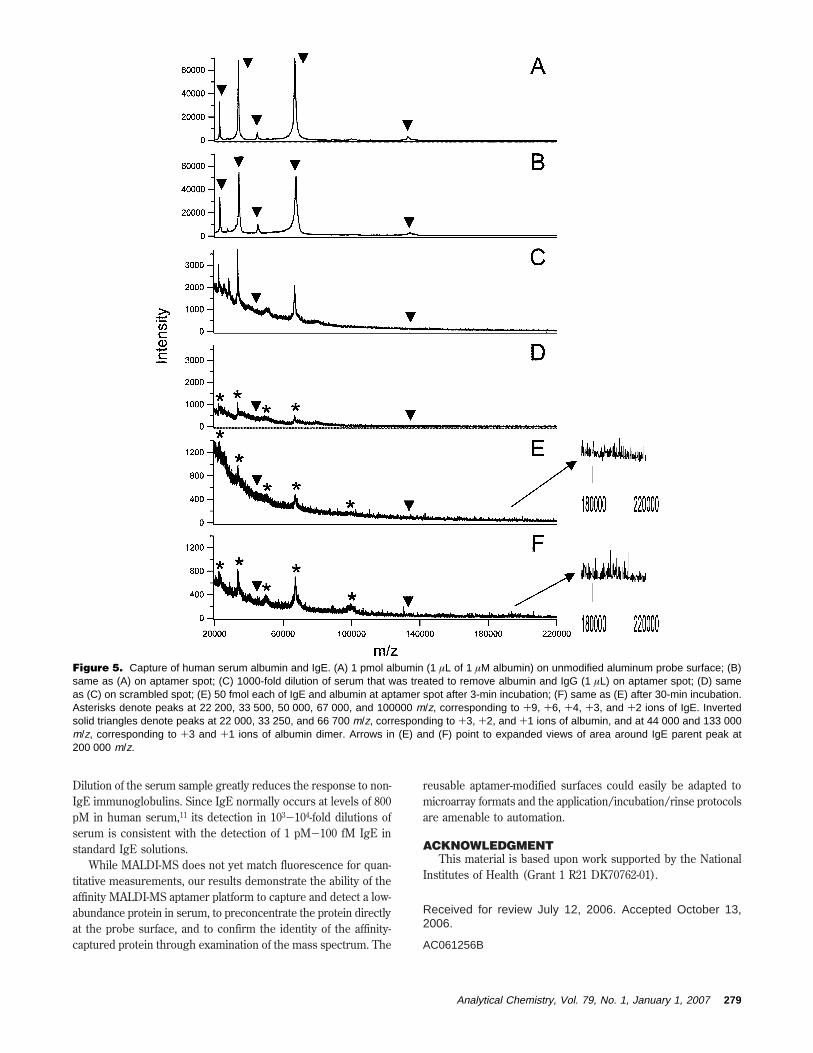
Figure 5 shows the spectra of 10 pmol of albumin at aaluminum MALDI surface (Figure 5A) and 1 pmol of albumin anaptamer spot (Figure 5B). Signals were not detected at aptameror scrambled spots for albumin at or below femtomole levels,
Figure 2. Capture and preconcentration of IgE. (A) First trial of 1 amol of IgE (1 µL of 1 pM IgE) on aptamer spot (run 1); (B) blank run withmatrix only at same spot after rinsing to remove matrix and protein from run 1; (C) second trial of 1 amol of IgE at same spot (run 2); (D) 1 amolof IgE on aptamer spot, applied in 10 successive incubation/rinse cycles, each of 0.1 amol of IgE (1 µL of 100 fM IgE) prior to application ofMALDI matrix; (E) 1 amol of IgE (1 µL of 1 pM IgE) on scrambled spot. Asterisks denote peaks at 22 200, 33 500, and 67 000 m/z, correspondingto +9, +6 and +3 ions of IgE.
276 Analytical Chemistry, Vol. 79, No. 1, January 1, 2007
which corresponds to nanomolar concentration (results notshown). Both panels A and B in Figure 5 exhibit peaks at 66 700m/z (+1 ion of albumin) and at the m/z corresponding to the +2and +3 ions. These peaks coincide closely with the peaks for the+3, +6, and +9 ions of IgE. The peak at 133 000 m/z is attributedto a singly charged albumin dimer formed in the MALDI processand coincides with a small peak that is observed at high IgEconcentration on aluminum (Figure 1A) but not on the DNA-coated spots for any concentration of IgE. The small peak at 44 000m/z corresponds to the +3 ion of the albumin dimer and is presentin both of the albumin spectra (Figure 5A and B) but never inthe IgE spectra.
The absence of peaks at 133 000 and 44 000 m/z in the spectraof human serum and IgA/IgG/IgM-free serum support theassignment of the peaks at 67 000, 33 500, and 22 200 m/z forthose samples to IgE rather than albumin. This assignment issupported by capture experiments using a 1000-fold dilution ofthe serum that was treated to remove albumin and IgG. Theresults are shown in Figure 5C and D for an aptamer spot and ascrambled spot, respectively. The peaks at 44 000 and 133 000m/z are not present in either spectrum, confirming that thesepeaks can be used as specific indicators of albumin capture. Theirabsence from all of the spectra for the serum capture experimentsindicates that albumin does not interfere with the aptamer-based
Figure 3. Capture of IgE from human serum. (A) Undiluted serum (1 µL) on aptamer spot; (B) 50:50 dilution of serum with 50 pM IgE onaptamer spot (1 µL of 50% serum with 25 amol of added IgE); (C) 1000-fold dilution of serum (1 µL) on aptamer spot; (D) same as (C) onscrambled spot; (E) 1000-fold dilution of serum further diluted 50:50 with 50 pM IgE on aptamer spot (1 µL of 2000-fold diluted serum with 25amol of added IgE); (F) 10 000-fold dilution of serum further diluted 50:50 with 50 pM IgE on aptamer spot (1 µL of 20 000-fold diluted serumwith 25 amol of added IgE). Asterisks denote peaks at 22 200, 33 500, and 67 000 m/z, corresponding to +9, +6, and +3 ions of IgE. Invertedtriangles denote peaks at 37 500, 50 000, 75 000, and 150 000 m/z, corresponding to +4, +3, +2, and +1 ions of IgG.
Analytical Chemistry, Vol. 79, No. 1, January 1, 2007 277
affinity MALDI-MS determination of IgE.In order to determine the effect of incubation time on IgE
capture and potential interference from albumin, aliquots contain-ing 50 fmol each of IgE and albumin were analyzed at two aptamerspots, one after 3-min incubation and the other after 30-minincubation as in the other experiments in this work. After 3 min(Figure 5E), the peaks at 66 600, 33 300 and 22 200 m/z dominatethe spectrum, with minor peaks at 100 000 and 50 000 m/z thatcorrespond to the +2 and +4 ions of IgE that are expected atthis relatively high IgE concentration. These peaks become moreintense after a 30-min incubation, but there is no sign of thealbumin peaks at 133 000 and 44 000 m/z, confirming that onlyIgE is captured or detected at the aptamer surface. The expanded
regions in Figure 5E and F also show development of the IgEparent peak at 200 000 m/z in going from 3- (Figure 5E inset) to30-min incubation (Figure 5F inset), further confirming identifica-tion of the captured protein as IgE.
CONCLUSIONSThe results demonstrate capture and detection of IgE at the
attomole level from picomolar solutions of the protein. Successiveincubation/rinse cycles were used to achieve detection of IgE atconcentrations of 100 fM. Other, more abundant immunoglobulins,notably IgG, interfere with IgE capture from serum at the IgEaptamer-modified surface, but there is no evidence of significantinterference from non-immunoglobulin proteins such as albumin.
Figure 4. Capture of IgE from IgG/IgA/IgM-free human serum. (A) 10 000-fold dilution of IgG/IgA/IgM-free serum (1 µL) on aptamer spot; (B)same as (A) on scrambled spot; (C) 10 000-fold dilution of IgG/IgA/IgM-free serum further diluted 50:50 with 50 pM IgE on aptamer spot (1 µLof 20 000-fold diluted serum with 25 amol of added IgE); (D) same as (C) on scrambled spot. Asterisks denote peaks at 22 200, 33 500, and67 000 m/z, corresponding to +9, +6, and +3 ions of IgE.
278 Analytical Chemistry, Vol. 79, No. 1, January 1, 2007
Dilution of the serum sample greatly reduces the response to non-IgE immunoglobulins. Since IgE normally occurs at levels of 800pM in human serum,11 its detection in 103-104-fold dilutions ofserum is consistent with the detection of 1 pM-100 fM IgE instandard IgE solutions.
While MALDI-MS does not yet match fluorescence for quan-titative measurements, our results demonstrate the ability of theaffinity MALDI-MS aptamer platform to capture and detect a low-abundance protein in serum, to preconcentrate the protein directlyat the probe surface, and to confirm the identity of the affinity-captured protein through examination of the mass spectrum. The
reusable aptamer-modified surfaces could easily be adapted tomicroarray formats and the application/incubation/rinse protocolsare amenable to automation.
ACKNOWLEDGMENTThis material is based upon work supported by the National
Institutes of Health (Grant 1 R21 DK70762-01).
Received for review July 12, 2006. Accepted October 13,2006.
AC061256B
Figure 5. Capture of human serum albumin and IgE. (A) 1 pmol albumin (1 µL of 1 µM albumin) on unmodified aluminum probe surface; (B)same as (A) on aptamer spot; (C) 1000-fold dilution of serum that was treated to remove albumin and IgG (1 µL) on aptamer spot; (D) sameas (C) on scrambled spot; (E) 50 fmol each of IgE and albumin at aptamer spot after 3-min incubation; (F) same as (E) after 30-min incubation.Asterisks denote peaks at 22 200, 33 500, 50 000, 67 000, and 100000 m/z, corresponding to +9, +6, +4, +3, and +2 ions of IgE. Invertedsolid triangles denote peaks at 22 000, 33 250, and 66 700 m/z, corresponding to +3, +2, and +1 ions of albumin, and at 44 000 and 133 000m/z, corresponding to +3 and +1 ions of albumin dimer. Arrows in (E) and (F) point to expanded views of area around IgE parent peak at200 000 m/z.
Analytical Chemistry, Vol. 79, No. 1, January 1, 2007 279