aerodynamics of gliding fligh otf a black …jeb.biologists.org/content/jexbio/53/2/363.full.pdf ·...
TRANSCRIPT
J. Exp. Biol. (1970), 53, 363-374With 6 text-figuresPrinted in Great Britain
AERODYNAMICS OF GLIDING FLIGHT OF A BLACKVULTURE CORAGYPS ATRATUS
BY G. CHRISTIAN PARROTT
Department of Zoology, Duke University, Durham, North Carolina
(Received 20 April 1970)
INTRODUCTION
Although aerodynamicists have used wind tunnels for over half a century, biologistshave only recently studied the aerodynamics and physiology of live birds flying intunnels (see Tucker & Parrott, 1970; Pennycuick, 1968; Greenewalt, 1960, for aero-dynamic work; and Tucker, 1968, 1966; Eliassen, 1963, for physiological studies).The wind tunnel provides a controlled aerial environment that allows one to obtainaerodynamic data of known accuracy. In addition, the aerodynamic and gravitationalforces of gliding can be simulated in a tunnel without the movement of a bird relativeto an observer. Under these conditions measurement of glide angle (angle betweenhorizontal and a bird's glide path relative to air) is facilitated and a gliding bird can bestudied over a selected range of air speeds and glide angles.
Prior to wind tunnel studies on live birds, aerodynamic data for gliding birds wereobtained either from wind tunnel tests on frozen, stuffed or model birds (see e.g.Nayler & Simmons, 1921; Feldmann, 1944), or from field studies on naturally glidingbirds (see e.g. Raspet, 1950; Pennycuick, i960). Models may not simulate the surfacefeatures of a live bird and cannot assume the various configurations of a flying bird.Measurement of a bird's glide angle under natural conditions is difficult because anobserver on the ground must know both the motion of the bird relative to the groundand the motion of the air relative to ground to determine glide angle.
I have circumvented these difficulties by training a black vulture to fly freely inthe working section of a wind tunnel. The black vulture is a common cathartid of thesouth-eastern United States, where it can often be seen soaring for many minuteson motionless wings.
METHODS AND MATERIALS
Calculations and definitions
This paper is concerned with the aerodynamics of equilibrium gliding, i.e. non-flapping flight without acceleration. In practice this meant that the vulture was movingless than o-oi m/s relative to the wind tunnel. In equilibrium gliding the lift (L)and drag (D) forces, which are respectively perpendicular and parallel to the glidepath, are balanced by components of the weight of the aircraft (see Jones, 1950, fora discussion of gliding flight). The following relations were used in this study
DT = Wsind, (1)
L = Wcosd, (2)
LID = cot 6, (3)
364 G. C. PARROTT
where W is the weight, DT is total drag and 6 is the glide angle. All units are in themks system. For angles less than 8°, cos 6 is within 1 % of unity so W approximatestoL.
For equilibrium gliding in still air LjD corresponds to the ratio of horizontal dis-tance travelled to altitude lost per unit time. Sinking speed is related to glide angleand air speed by the equation
sinking speed = V sin 6, (4)
where V is air speed. For angles less than io°, sin 6 is nearly equal to tan 6 so that
sinking speed = J-J^. (5)
Lift coefficients (CL) were calculated from the standard equation
where p is air density (1*17 kg/m3 in this study) and S is wing area, denned as theplane projected area of both wings, including the area intercepted by the body. Inter-cepted area is that part of the body bounded by lines joining the points where theleading and trailing edges of the wings contact the body. I determined wing areasfrom enlarged photographs with a planimeter. Right and left areas were measuredseparately and added to intercepted area to obtain total wing area. A scale factor wasdetermined by measuring the width of a wing's base on each picture. I estimate thatwing areas are accurate to 5%.
The total drag of an aircraft is composed of induced drag and parasite drag. Induceddrag (£)() was calculated from the equation
L2
D* = ^
where b is wing span (tip to tip distance) and M2 is the Munk span factor. For anelliptical distribution of lift across the span, the induced drag is a minimum and M2
is 1. For non-elliptical distributions the span factor is less than 1. Most wings have aM2 between 0-9 and 0-95 (von Mises, 1959) and I used a value of 0-9 in this study.
Parasite drag (Dp), which is caused by skin friction and pressure drag, is the partof total drag that is not associated with lift production. I obtained parasite drag bysubtracting the calculated induced drag from the measured total drag. Parasite dragcoefficients (Cnp) were calculated from the equation
C l (8)
where Sw is wetted area (total surface area of an aircraft).I calculated body area by assuming that the vulture consisted of a cylinder (head
and neck), a frustrum (thoracic region) and a cone (abdomen). Projected wing areawas multiplied by 2-05 (this factor accounted for upper and lower surfaces and curva-ture of the wings) to obtain wetted wing area. Total wetted area was then calculatedby adding wetted wing area to body and tail area and subtracting twice the interceptedarea. Body area is probably accurate to only 20%, but because body area is about 10%of the total wetted area the latter is accurate to better than 10%.
Aerodynamics of gliding flight of Coragyps atratus 365
Values of Reynolds number (Re) were calculated from the formula
where (i is the dynamic viscosity of air and c is the chord of the wings. For a non-rectangular wing the chord varies along the span and thus the average chord {Sjb)was used to calculate Re. The value of pjfi for this study was 6-38 x 104. Re variedfrom 1-5 x ioB to 2-6 x io5 over the range of air speeds encountered.
Wind tunnel and calibrationThe wind tunnel used for this study was of the open circuit, closed jet design and
could be tilted from o° to 7J0 down from horizontal about a central pivot. The workingsection was I-I m high by 1*4 m wide by 2-3 m long and had a wire screen (0-013 m
mesh) at the rear to prevent the bird from drifting close to the fan. The front of theworking section opened without screen or obstruction into the entrance cone. Avariable speed motor provided air speeds up to 16*8 m/s.
I calibrated the working section for air speed distribution, direction of air flow andturbulence (see Tucker & Parrott, 1970, for a description of the calibration techniques).
Air speed, determined in the region where the bird usually flew, varied ± 5 %from the mean.
Direction of air flow varied about i° across the working section. The direction ofair flow with respect to the working section was independent of tunnel tilt and airspeed. Mean angles, accurate to \°, were used for calculations. Variation in directionof air flow resulted in drag measurements accurate to 11 %.
Mean % turbulence was 0-4 %, which corresponds to a turbulence factor of approxi-mately i*3 (Pope & Harper, 1966).
Experimental animal and training procedure
The black vulture was purchased from an animal dealer and its weight during thestudy was 17-5 newtons±2% (mass = 179 kg, g = 9-8 m/s2). The wing span totunnel width ratio was 0-97 at maximum LjD.
A perch that could be raised and lowered (when lowered, the perch did not interferewith air flow) was mounted in the front of the working section. A capacitance-dischargeshocking device was employed to give the bird mild shocks. A wire (1-5 x io"3 m indiameter and 2-2 m long) was attached to each leg and a shock could be given when-ever necessary. These wires also prevented the bird from entering the entrance cone.
The training procedure consisted of reward and punishment. Initially, the birdwas placed on the perch and given a shock if it jumped from the perch to the tunnelfloor. After a few shocks the bird learned to stay on the perch and rarely jumped tothe floor. At this stage of the training I turned on the motor and lowered the perch.If the bird remained in the air for a few seconds no shock was given and the perch wasraised. The bird was then rewarded by being allowed to sit on the perch for 15-30 sbefore the next flight. If the bird landed, instead of remaining in the air, a shock wasgiven and the bird was placed back on the perch. By giving shocks whenever the birdlanded and by gradually lengthening the time that the perch was lowered, the vulture
366 G. C. PARROTT
was trained to glide for up to 30 min at a time. The entire training procedure tookabout 4 weeks with sessions at least every other day.
I was able to train the vulture to glide in the desired part of the working section bygiving mild correctional shocks whenever the bird drifted back into the screen orbumped into the ceiling or side walls. Characteristically, the bird would drift backwhen the perch was lowered and then glide to the front portion of the section. Afterremaining nearly motionless there for 10-30 s, the vulture would slowly drift backabout 1 m and then glide forward again.
At air speeds less than 13-9 m/s and glide angles greater than 6°, the vultureusually held its feet down perpendicular to the air flow. The feet were progressivelyretracted with increasing air speed and/or decreasing angle.
Experimental procedure
I photographed the vulture when it was in the region where the calibrations hadbeen made and when neither of its wing tips was touching the side walls. Photographswere taken from above the working section through the Plexiglass ceiling with amotor-driven 35 mm camera that tilted with the tunnel. An electronic flash illuminatedthe bird from above.
Glide angle and air speed were systematically varied, and about six pictures wereobtained for each combination of speed and angle. The normal procedure was asfollows. The bird was flown for a few minutes until its flight pattern was consistent(the vulture usually flapped vigorously and was erratic at the beginning of each session).Then the tunnel was tilted down to 7^° and the tunnel speed set. After pictures weretaken, the tunnel was tilted back £° and the bird was photographed at the new angle.This procedure was continued until an angle (minimum glide angle, 9M) was foundbelow which the bird would no longer maintain its position without flapping. I thentilted the tunnel to 7J0 again and selected a higher speed.
Photographs were obtained over a range of air speeds and glide angles from 9-9 to16-8 m/s and from 4-8° to 7-9°, respectively. Below 9*9 m/s the vulture would notremain airborne without flapping.
Corrections: drag due to wires
The drag of the training wires was measured and found to be about 10% of thetotal drag of the bird at maximum LjD (the wires were twisted together except forthe last 0-15 m.). Drag was measured by attaching a fine thread to the wires andrunning the thread over a pulley mounted in the region where the bird flew. Thethread passed through a hole in the floor of the working section and was tied to aweight (mass = m) on a top-loading Mettler balance. Tension (T) in the wires wasdetermined by the equation
T = g(m-R), (10)
where R is the balance reading (in kg) at various air speeds. At each air speed I useda protractor to measure the angle (<p) between the direction of air flow and the wires(tunnel tilt was 6°). Drag of the wires, equal to T cos <f>, was subtracted from the totaldrag of the vulture. Corrections ranged from 0-14 N at the lowest speed to 0-19 Nat the highest.
Aerodynamics of gliding flight o/Coragyps atratus 367
Corrections: tunnel interference effects
Wind tunnel boundaries cause the flow pattern around an object in a tunnel todiffer from the pattern in free air and measurements may have to be corrected for thisboundary interference (Pope & Harper, 1966).
The wake and solid blockage correction for lift and drag, horizontal buoyancycorrection for drag and streamline curvature correction for lift were each about 1 %or less and I did not correct data for these effects.
The downwash correction to drag was 29 % at the lowest speed and diminished to8% at the highest speed. Drag values were corrected according to the equation
where DM is the measured drag and C is the cross-sectional area of the working section(1-5 m*).
0-33
0 31
0-29
0-27
0-25
1
-
<-
-
-
••
y
<t y
i
1 1 '
/
/j # •V* .
i i
i
'it*fa:t
0
i
V-
-
-
-
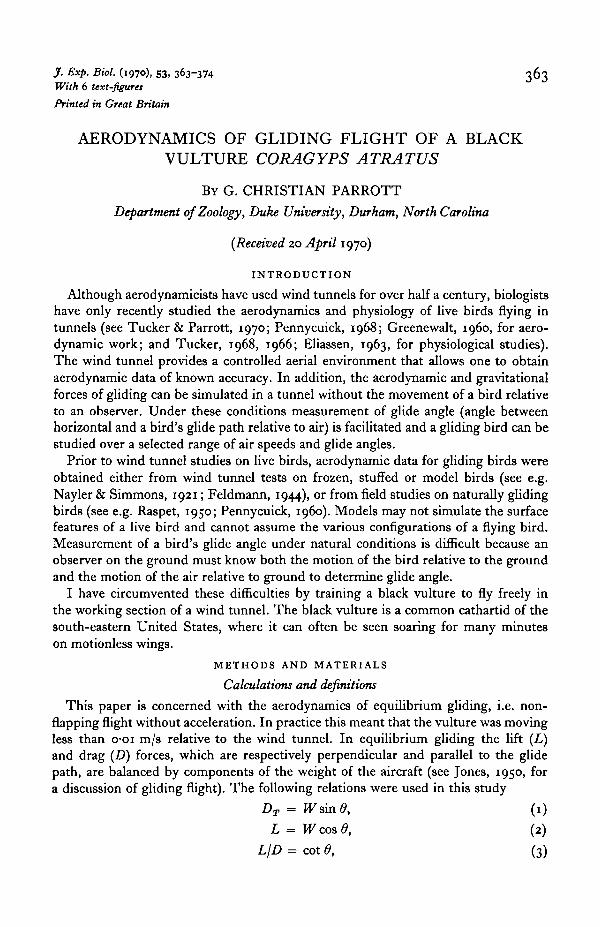
105 1-15 1-25Wing span (m)-
1 35
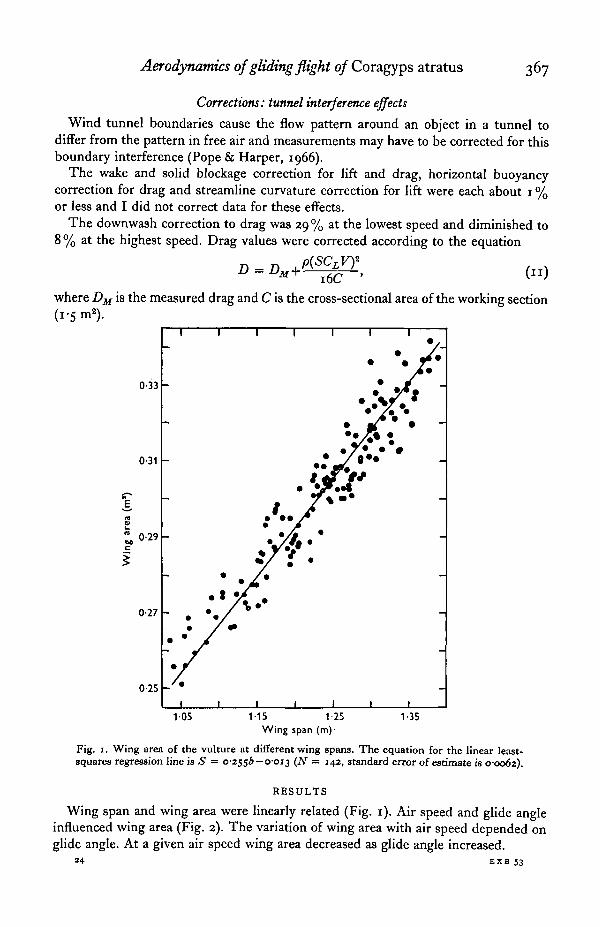
Fig. 1. Wing area of the vulture at different wing spans. The equation for the linear least-squares regression line is S = 0-2556 — 0-013 (N = 142, standard error of estimate is 0-0062).
RESULTS
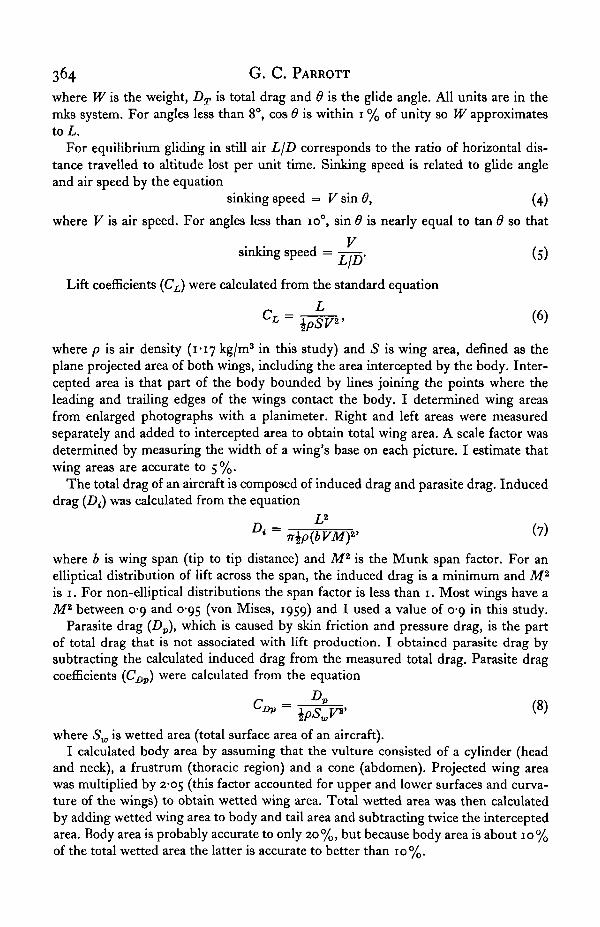
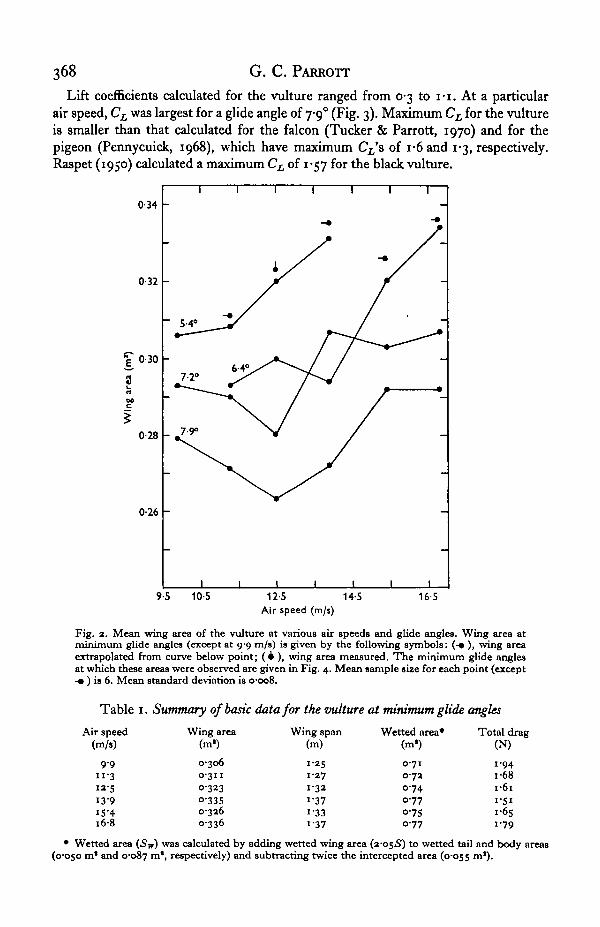
Wing span and wing area were linearly related (Fig. 1). Air speed and glide angleinfluenced wing area (Fig. 2). The variation of wing area with air speed depended onglide angle. At a given air speed wing area decreased as glide angle increased.
EXB 33
368 G. C. PARROTT
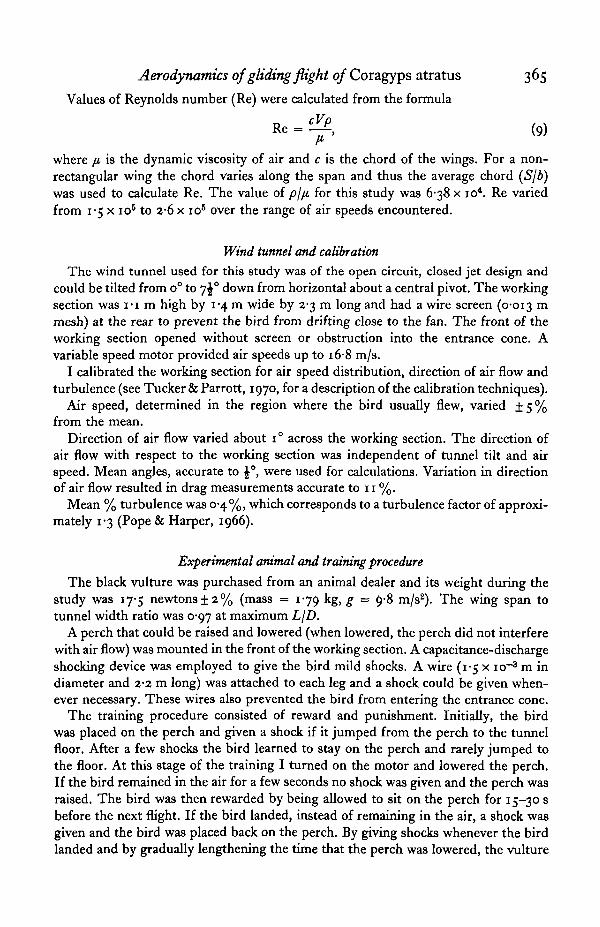
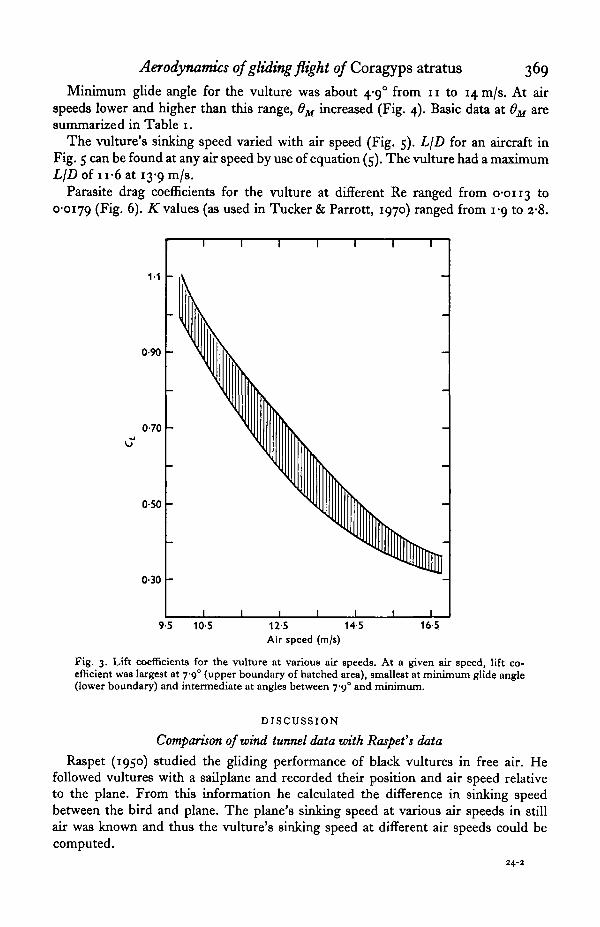
Lift coefficients calculated for the vulture ranged from 0-3 to I - I . At a particularair speed, CL was largest for a glide angle of 7-9° (Fig. 3). Maximum CL for the vultureis smaller than that calculated for the falcon (Tucker & Parrott, 1970) and for thepigeon (Pennycuick, 1968), which have maximum CL'& of i-6and 1-3, respectively.Raspet (1950) calculated a maximum CL of 1-57 for the black vulture.
0-34 -
0-32 -
0-30 -
0-28 -
0-26 -
95 10-5 12 5Air speed (m/s)
14-5 16-5
Fig. 2. Mean wing area of the vulture at various air speeds and glide angles. Wing area atminimum glide angles (except at 9-9 m/s) is given by the following symbols: (-• ), wing areaextrapolated from curve below point; (4 ), wing area measured. The minimum glide anglesat which these areas were observed are given in Fig. 4. Mean sample size for each point (except-• ) is 6. Mean standard deviation is 0-008.
Table i. Summary of basic data for the vulture at minimum glide angles
Air speed(m/s)
9 91 1 312-5
13-915-41 6 8
Wing area(m')
0-3060-3110-3230-3350-3260336
Wing span(m)
1 -251-271-321-37i-33i-37
Wetted area*(m«)
0-710-720-740-77o-7s0 7 7
Total drag(N)
1 9 4
i-68I-6I
i -5 i1-651 7 9
• Wetted area (5jr) was calculated by adding wetted wing area (a-os<S) to wetted tail and body areas(0-050 m1 and 0-087 m ' i respectively) and subtracting twice the intercepted area (0-055 m*)-
Aerodynamics of gliding flight of Coragyps atratus 369
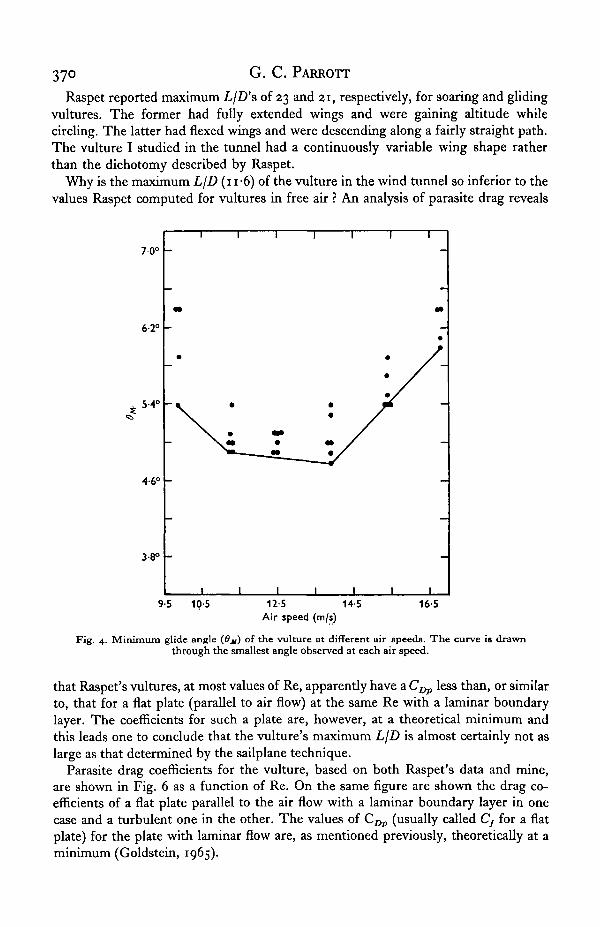
Minimum glide angle for the vulture was about 4-9° from 11 to 14.n1/8. At airspeeds lower and higher than this range, 0M increased (Fig. 4). Basic data at 6M aresummarized in Table 1.
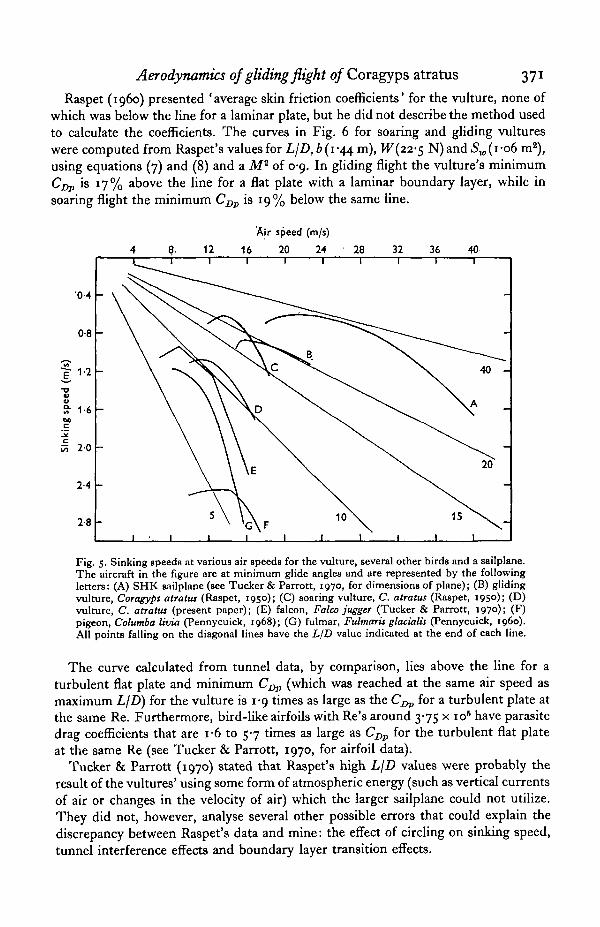
The vulture's sinking speed varied with air speed (Fig. 5). LjD for an aircraft inFig. 5 can be found at any air speed by use of equation (5). The vulture had a maximumL/Z) of u-6 at 13-9 m/s.
Parasite drag coefficients for the vulture at different Re ranged from 0-0113 t 0
0*0179 (Fig. 6). K values (as used in Tucker & Parrott, 1970) ranged from 1-9 to 2-8.
1-1
0-90
070
0-50
030
1 1 1
" \
V-
-
1 1 1
1 1 1 1
-
-
1 1 1 1
9-5 105 US 14-5Air speed (m/s)
16 5
Fig. 3. Lift coefficients for the vulture at various air speeds. At a given air speed, lift co-efficient was largest at 7-9° (upper boundary of hatched area), smallest at minimum glide angle(lower boundary) and intermediate at angles between 7-9° and minimum.
DISCUSSION
Comparison of wind tunnel data with Raspet's data
Raspet (1950) studied the gliding performance of black vultures in free air. Hefollowed vultures with a sailplane and recorded their position and air speed relativeto the plane. From this information he calculated the difference in sinking speedbetween the bird and plane. The plane's sinking speed at various air speeds in stillair was known and thus the vulture's sinking speed at different air speeds could becomputed.
24-2
370 G. C. PARROTT
Raspet reported maximum L/D's of 23 and 21, respectively, for soaring and glidingvultures. The former had fully extended wings and were gaining altitude whilecircling. The latter had flexed wings and were descending along a fairly straight path.The vulture I studied in the tunnel had a continuously variable wing shape ratherthan the dichotomy described by Raspet.
Why is the maximum L/D (11 -6) of the vulture in the wind tunnel so inferior to thevalues Raspet computed for vultures in free air ? An analysis of parasite drag reveals
70°
6-2°
5-4°
4-6°
3-8°
i I
m
-
-
i i
1 1 1
1 l 1
1 1
-
-
l i
9-5 10-5 125 14-5Air speed (m/s)
16-5
Fig. 4. Minimum glide angle (Ox) of the vulture at different air speeds. The curve is drawnthrough the smallest angle observed at each air speed.
that Raspet's vultures, at most values of Re, apparently have a C ^ less than, or similarto, that for a flat plate (parallel to air flow) at the same Re with a laminar boundarylayer. The coefficients for such a plate are, however, at a theoretical minimum andthis leads one to conclude that the vulture's maximum LjD is almost certainly not aslarge as that determined by the sailplane technique.
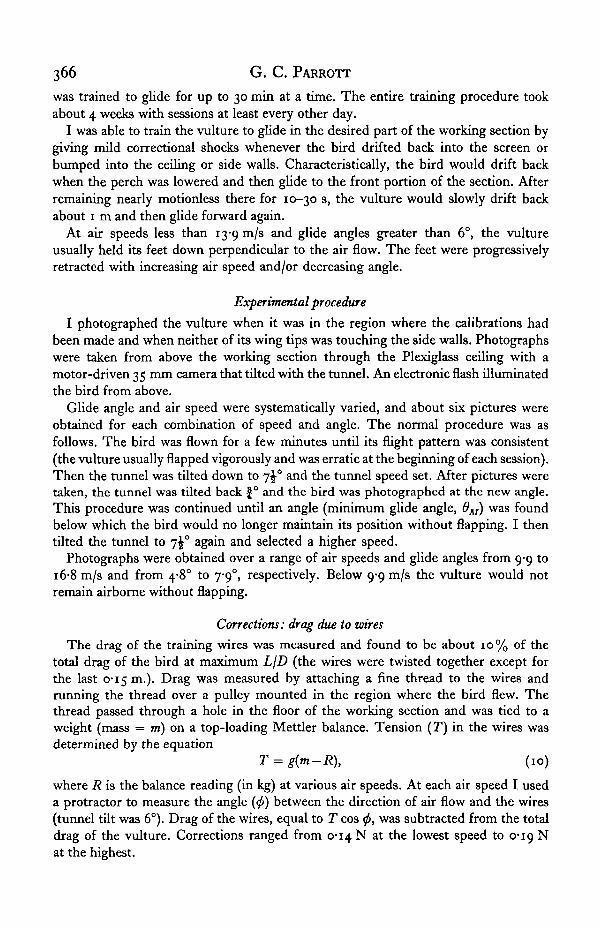
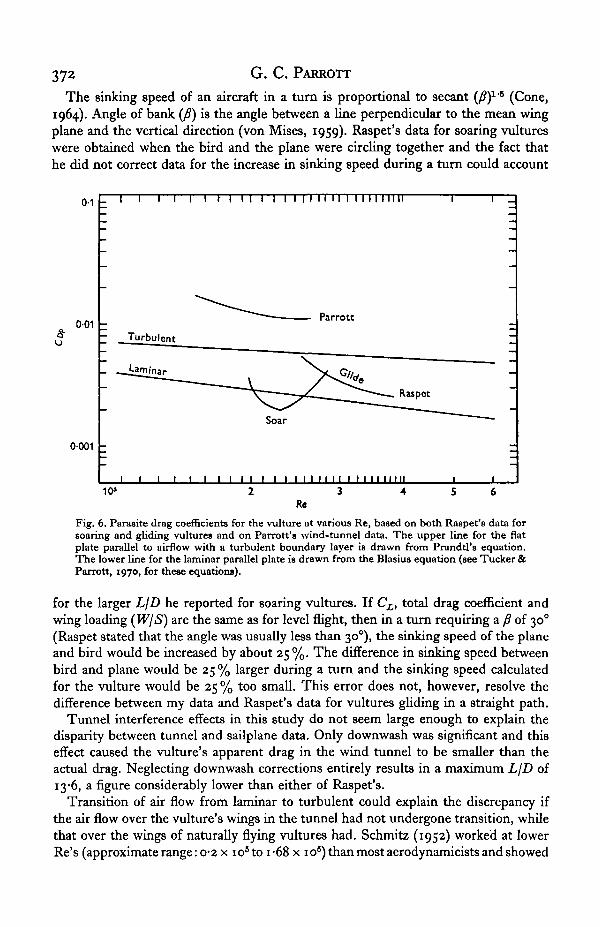
Parasite drag coefficients for the vulture, based on both Raspet's data and mine,are shown in Fig. 6 as a function of Re. On the same figure are shown the drag co-efficients of a flat plate parallel to the air flow with a laminar boundary layer in onecase and a turbulent one in the other. The values of C^ (usually called Cj for a flatplate) for the plate with laminar flow are, as mentioned previously, theoretically at aminimum (Goldstein, 1965).
Aerodynamics of gliding flight of Coragyps atratus 371
Raspet (i960) presented 'average skin friction coefficients' for the vulture, none ofwhich was below the line for a laminar plate, but he did not describe the method usedto calculate the coefficients. The curves in Fig. 6 for soaring and gliding vultureswere computed from Raspet's values for LjD, b(i -44 m), W(22-$ N)andS'1o(i-o6m2),using equations (7) and (8) and a M2 of 0-9. In gliding flight the vulture's minimumCjyp is 17% above the line for a flat plate with a laminar boundary layer, while insoaring flight the minimum C ^ is 19% below the same line.
8. 12
Air speed (m/s)
16 20 24 28 32 36 40.
2-8 -
Fig. 5. Sinking speeds at various air speeds for the vulture, several other birds and a sailplane.The aircraft in the figure are at minimum glide angles and are represented by the followingletters: (A) SHK sailplane (see Tucker & Parrott, 1970, for dimensions of plane); (B) glidingvulture, Coragyps atratus (Raspet, 1950); (C) soaring vulture, C. atratus (Raspet, 1950); (D)vulture, C. atratus (present paper); (E) falcon, Falco jugger (Tucker & Parrott, 1970); (F)pigeon, Columba livia (Pennycuick, 1968); (G) fulmar, Fulmaris glacialis (Pennycuick, i960).All points falling on the diagonal lines have the LID value indicated at the end of each line.
The curve calculated from tunnel data, by comparison, lies above the line for aturbulent fiat plate and minimum C^ (which was reached at the same air speed asmaximum LjD) for the vulture is 1-9 times as large as the C^j, for a turbulent plate atthe same Re. Furthermore, bird-like airfoils with Re's around 3-75 x 10s have parasitedrag coefficients that are i-6 to 5-7 times as large as Cj^ for the turbulent flat plateat the same Re (see Tucker & Parrott, 1970, for airfoil data).
Tucker & Parrott (1970) stated that Raspet's high LjD values were probably theresult of the vultures' using some form of atmospheric energy (such as vertical currentsof air or changes in the velocity of air) which the larger sailplane could not utilize.They did not, however, analyse several other possible errors that could explain thediscrepancy between Raspet's data and mine: the effect of circling on sinking speed,tunnel interference effects and boundary layer transition effects.
372 G. C. PARROTT
The sinking speed of an aircraft in a turn is proportional to secant (Z?)1'5 (Cone,1964). Angle of bank (y5) is the angle between a line perpendicular to the mean wingplane and the vertical direction (von Mises, 1959). Raspet's data for soaring vultureswere obtained when the bird and the plane were circling together and the fact thathe did not correct data for the increase in sinking speed during a turn could account
a001 -
0001 -
Fig. 6. Parasite drag coefficients for the vulture at various Re, based on both Raepet's data forsoaring and gliding vultures and on Parrott's wind-tunnel data. The upper line for the flatplate parallel to airflow with a turbulent boundary layer is drawn from Prandtl's equation.The lower line for the laminar parallel plate is drawn from the Blasius equation (see Tucker &Parrott, 1970, for these equations).
for the larger L/D he reported for soaring vultures. If CL, total drag coefficient andwing loading (W/S) are the same as for level flight, then in a turn requiring a /? of 300
(Raspet stated that the angle was usually less than 300), the sinking speed of the planeand bird would be increased by about 25%. The difference in sinking speed betweenbird and plane would be 25 % larger during a turn and the sinking speed calculatedfor the vulture would be 25 % too small. This error does not, however, resolve thedifference between my data and Raspet's data for vultures gliding in a straight path.
Tunnel interference effects in this study do not seem large enough to explain thedisparity between tunnel and sailplane data. Only downwash was significant and thiseffect caused the vulture's apparent drag in the wind tunnel to be smaller than theactual drag. Neglecting downwash corrections entirely results in a maximum LjD of13-6, a figure considerably lower than either of Raspet's.
Transition of air flow from laminar to turbulent could explain the discrepancy ifthe air flow over the vulture's wings in the tunnel had not undergone transition, whilethat over the wings of naturally flying vultures had. Schmitz (1952) worked at lowerRe's (approximate range: o-2 x io8to i-68 x io6) than most aerodynamicists and showed
Aerodynamics of gliding flight of Coragyps atratus 373
that transition can double the LfD of an airfoil. This effect probably does not account forthe disparity, however, since the vulture's Re, the tunnel turbulence factor and theRe (around 7x10*) at which Schmitz observed a doubling of LjD for conventionalairfoils all indicate that the wings of the vulture in the tunnel had a turbulent boundarylayer.
Raspet concluded on the basis of low drag coefficients for the vulture that someform of boundary layer control must operate to keep the air flow over the wingslaminar and the drag low. But Tucker & Parrott (1970) pointed out that, at a givenCL, the vulture would probably have a lower C ^ with a turbulent boundary layer thanwith a laminar one over the wings. Furthermore, Schmitz's data and the vulture's Reagain indicate that the wings of vultures in free air also have turbulent boundary layers.
The wind-tunnel data I have presented, coupled with values of C^ for conven-tional airfoils, strongly suggest that Raspet's low drag coefficients and high values ofHD are explained by the vultures' using atmospheric energy which the plane did not,rather than by control of the boundary layer.
Gliding performance
Maximum LID for the black vulture is the largest for birds thus far tested in windtunnels. The falcon has a slightly smaller maximum LID of 10, while that for thepigeon is only 6 (see Fig. 5). The L/Z) values for these birds are small compared to themaximum L/Z) of 38 for the sailplane in the same figure.
Although the falcon does not achieve an L/D as large as the vulture's, it neverthelesshas a lower minimum sinking speed. This is possible because sinking speed is a functionof V and LID (see equation 5) and the falcon's lower air speed more than compensatesfor its smaller £/£).
The vulture's air speed under natural conditions may be influenced by two possibleobjectives of an avian glider: covering distance over the ground toward a site andgaining altitude without flapping. In the wind tunnel the vulture achieves its minimumsinking speed at an air speed (11*3 m/s) less than that for maximum LID (i3'9 m/s).Tucker & Parrott (1970) analysed the significance of LID, V and time to maxi-mizing the distance travelled or altitude gained by a naturally gliding aircraft undervarious aerial conditions. According to their analysis the vulture should glide atmaximum LID in still air to cover the greatest distance over the ground (from a givenaltitude). However, with a tail wind, the distance travelled would be maximized bygliding at minimum sinking speed. Furthermore, in an updraft greater than thevulture's sinking speed, the greatest altitude would be gained by gliding at minimumsinking speed and remaining in the updraft as long as possible.
Wing geometry
Data for the pigeon, falcon and vulture (present paper) show that wing area andwing span are linearly related at all air speeds and glide angles investigated.
At a given air speed the wing area of the falcon and vulture decreases as 6 increases.At dM wing area of the pigeon and falcon decreases with increasing air speed. Wingarea for the vulture, however, increases slightly at dM as air speed increases.
374 G. C. PARROTT
SUMMARY
1. A black vulture (mass = 1-79 kg) gliding freely in a wind tunnel adjusted itswing span and wing area as its air speed and glide angle changed from 9-9 to 16*8 m/sand from 4-8° to 7-9°, respectively.
2. The minimum sinking speed was 1-09 m/s at an air speed of 11-3 m/s.3. The maximum ratio of lift to drag forces was 11-6 at an air speed of 13-9 m/s.4. Parasite drag coefficients for the vulture are similar to those for conventional
airfoils and do not support the contention that black vultures have unusually lowvalues of parasite drag.
This study was supported by a National Institutes of Health Training Grant (No.HE 05219) and a Duke University Biomedical Sciences Support Grant (No. 303-3215)administered by V. A. Tucker.
REFERENCES
CONE, C. D. (1964). The design of sailplanes for optimum thermal soaring performance. NASA TND-2052.
ELIASSEN, E. (1963). Preliminary results from new methods of investigating physiology of birds duringflight. Ibis 105, 234-7.
FELDMANN, I. F. (1944). Windkanaluntersuchung am Modell einer M6we. Aero revue, Zurich 19, 219-22.GOLDSTEIN, S. (1965). Modern Developments in Fluid Dynamics. New York: Dover Publ.GREENEWALT, C. H. (i960). Hummingbirds. New York: Doubleday.JONES, B. (1950). Elements of Practical Aerodynamics. New York: Wiley and Sons.MlSES, R. VON. (1959). Theory of Flight. New York: Dover Publ.NAYLER, J. L. & SIMMONS, L. F. G. (1921). A note relating to experiments in a wind channel with an
Alsatian swift. Aeron. Res. Comtn. Reports and Memoranda, No. 708.PENNYCUICK, C. J. (i960). Gliding flight of the fulmar petrel. J. exp. Biol. 37, 330-8.PENNYCUICK, C. J. (1968). A wind-tunnel study of gliding flight in the pigeon Columba livia. J. exp.
Biol. 49, 509-26.POPE, A. & HARPER, J. J. (1966). Low-speed Wind Tumtel Testing. New York: Wiley and Sons.RASPET, A. (1950). Performance measurements of a soaring bird. Aeron. Engin. Rev. 9, 14-17.RASPET, A. (i960). Biophysics of bird flight. Science 132, 191-200.SCHMITZ, F. W. (1952). Aerodynamik des Flugmodells. Duisburg: Carl Lange Verlag.TUCKER, V. A. (1966). Oxygen consumption of a flying bird. Science 154, 150-1.TUCKER, V. A. (1968). Respiratory exchange and evaporative water loss in the flying budgerigar.
J. exp. Biol. 48, 67-87.TUCKER, V. A. & PARROTT, G. C. (1970). Aerodynamics of gliding flight in a falcon and other birds.
J. exp. Biol. (In Press.)