aenv155 final report full
TRANSCRIPT
final report
Project code: A.ENV.0155
Prepared by: Paul Jensen
Advanced Water Management Centre The University of Queensland
October 2013 Date published:
PUBLISHED BY Meat & Livestock Australia Limited Locked Bag 991 NORTH SYDNEY NSW 2059
ished by
Meat & Livestock Australia acknowledges the matching funds provided by the Australian Government and contributions from the Australian Meat Processor Corporation to support the research and development detailed in this publication.
This publication is published by Meat & Livestock Australia Limited ABN 39 081 678 364 (MLA). Care is taken to ensure the accuracy of the information contained in this publication. However MLA cannot accept responsibility for the accuracy or completeness of the information or opinions contained in the publication. You should make your own enquiries before making decisions concerning your interests. Reproduction in whole or in part of this publication is prohibited without prior written consent of MLA.
Anaerobic Co-digestion of Paunch and DAF sludge
2
Executive Summary This is the final report for A.ENV.0155 Anaerobic Digestion of Paunch and DAF sludge. Management of paunch and DAF sludge have been identified as key issues in the Australian red meat processing industry. Both paunch waste and DAF sludge are large byproduct streams from the red meat industry, which also represent a substantial potential source of energy, and nutrients.
The UQ Biosolids project has operated a paunch digester at Teys Beenleigh since 2010. The results had previously shown a high degree of degradability in the paunch solids (>60%), such that on the order of 20% of plant heating requirements can be generated from the paunch. While the demonstration plant has previously field-proven the technology, A.ENV.0155 was developed to make the technology more attractive, and increase its utility to processors, by maximising space loading (decreasing capital costs), evaluating the impact of anaerobic digestion on dewaterability and other properties (e.g. viscosity), and exploring co-digestion as a strategy to boost biogas yield.
The maximum sustainable organic loading rate for the demonstration plant was estimated at 1-1.3 kgVS/m3/day using a feed solids concentration of approximately 3%. At this loading rate, organic solids destruction (60%) and methane production (220 L CH4 kg-1 VS) in the demonstration plant were similar to levels predicted from independent batch tests. Results from the demonstration plant indicate that an average sized processing facility (processing 600 beef cattle per day) could reduce paunch waste from 15 tonnes of wet solid per day to around 5 wet tonnes per day using anaerobic digestion. At feed concentrations above 3% solids, the demonstration plant had significant problems with materials handling resulting in solids accumulation, blockages and process failure. This was an engineering limitation of the process and not a biological limitation. Loading rates could likely be improved by re-engineering the mixing systems in the process vessels.
Anaerobic co-digestion (AcoD) is a process where two or more substrates with complementary characteristics are mixed for combined treatment. Investigations of anaerobic co-digestion of slaughterhouse wastes demonstrated that co-digestion is a promising strategy to improve process performance. In all cases, the B0 from AcoD mixtures was higher than the B0 of the paunch-only digestions. Co-digestion of paunch and DAF sludge was the most promising with results suggesting synergistic effects where the microorganisms present in the paunch may have contributed to improved hydrolysis of the partially biodegradable fat conglomerates present in the DAF sludge.
Investigations of AcoD in this project were based on batch tests. The next major investigation in this area should focus on examining the outcomes of the batch co-digestion trials in a continuous process; particularly co-digestion of paunch solids and DAF sludge. While AcoD was identified as a suitable strategy to boost methane production from the paunch digester, the impact of substrate composition and AcoD ratios on nutrient release and recovery potential was not investigated in this project. This is another area recommended for future investigation.
A.ENV.0155 - Anaerobic Co-digestion of Paunch and DAF sludge
3
Table of Contents Executive Summary ....................................................................................................................... 2
Abbreviations ................................................................................................................................ 4
1 Introduction .......................................................................................................................... 5
1.1 Background.............................................................................................................................. 5 1.2 Project Objectives ................................................................................................................... 6
2 Optimal Operation of Demonstration Scale Paunch Digester .............................................. 6
2.1 Summary of Plant Design ........................................................................................................ 6 2.2 Process Performance............................................................................................................... 7
2.2.1 Characterisation of Paunch ................................................................................... 7
2.2.2 Biogas Production ................................................................................................. 8
2.2.3 Organic Solids Removal ......................................................................................... 9
2.2.4 Dewaterability ..................................................................................................... 10
2.3 Summary ............................................................................................................................... 10 3 Anaerobic Co-digestion ....................................................................................................... 11
3.1 Materials and Methods ......................................................................................................... 11 3.1.1 Substrate ............................................................................................................. 11
3.1.2 Biochemical Methane Potential test (BMP) ........................................................ 12
3.1.3 Model Implementation and Data Analysis .......................................................... 15
3.2 Results and Discussion .......................................................................................................... 15 3.2.1 Methane Production from Synthetic Substrates ................................................ 15
3.2.2 Methane Production from Meat Processing Wastes .......................................... 17
3.2.3 Model-based Analysis ......................................................................................... 19
3.3 Summary ............................................................................................................................... 22 4 Conclusions and Recommendations ................................................................................... 22
5 References ........................................................................................................................... 23
A.ENV.0155 - Anaerobic Co-digestion of Paunch and DAF sludge
4
Abbreviations AcoD Anaerobic co-digestion AD Anaerobic Digestion
AL Anaerobic Lagoon BMP Biochemical Methane Potential B0 Ultimate Modelled Biochemical Methane Potential Ch Carbohydrate CAL Covered Anaerobic Lagoon COD Chemical Oxygen Demand DAF Dissolved Air Flotation (tank) EBCRC Environmental Biotechnology Cooperative Research Centre Fd Fraction of Organic Material that is Degradable under Anaerobic Conditions FOG Fats, Oils and Grease
HRT Hydraulic Residence Time IC50 Concentration where 50% inhibition occurs e.g. rate is reduced to 50% Khyd First Order Hydrolysis Rate Constant: Speed of Degradation
LCFA Long Chain Fatty Acids Li Lipid
NH4-N Ammonium nitrogen
PO4-P Phosphate Phosphorus Pr Protein
SRT Sludge Retention Time
TKN Total Kjehldahl Nitrogen TKP Total Kjehldahl Phosphorus TPAD Temperature Phased Anaerobic Digestion TS Total Solids TSS Total Suspended Solids UQ The University of Queensland VFA Volatile Fatty Acids VS Volatile Solids
A.ENV.0155 - Anaerobic Co-digestion of Paunch and DAF sludge
5
1 Introduction
1.1 Background There is strong ongoing interest in anaerobic digestion (AD) of waste solids, particularly paunch and DAF sludge. This is partly driven by an established need for an alternative to current waste sinks, which are largely composting, direct land application, and landfilling. Alternative waste sinks will address costs and risks associated with current disposal applications, which are increasing either due to implementation of policy (e.g., Qld Landfill Levy), regulations around pathogen control in land application and composting, and potential social impacts of direct disposal or land application. AMPC and MLA are actively exploring anaerobic digestion as a potential new sink, as well as other options such as thermal destruction or charring, which are likely to have specific strengths and weaknesses (e.g., complexity, capital cost); but are not addressed in this project.
The UQ Biosolids project has operated a paunch digester at Teys Beenleigh since 2010, with setup on paunch liquor in 2010/11, and operating on paunch solids in 2011/12. The results so far have shown a high degree of degradability in the paunch solids (>60%), such that on the order of 20% of plant heating requirements can be generated from the paunch. The demonstration has field proven the technology, and enough data and construction and operational experience now exists to build a full-scale digester. A.ENV.0155 was developed to make the technology more attractive, and increase its utility to processors, by maximising space loading (decreasing capital costs), evaluating the impact of anaerobic digestion on dewaterability and other properties (e.g., viscosity), and exploring co-digestion as a strategy to boost biogas yields.
Anaerobic co-digestion (AcoD) is a process where two or more substrates with complementary characteristics are mixed for combined treatment. AcoD often results in improved biogas production, however this improvement in methane production is generally a result of an increase in organic loading rate (Astals et al. 2012). When possible, co-substrates are selected and blended in ratios to: (i) favour positive interactions, i.e. synergisms, macro- and micro-nutrient equilibrium and moisture balance; (ii) dilute inhibitory or toxic compounds; (iii) optimise methane production and (iv) enhance stability of digested materials (Astals et al. 2011, Mata-Alvarez et al. 2011).
Cattle slaughterhouses generate multiple waste streams with highly variable compositions and methane yields ranging from 200 L CH4 kg-1VS to over 1000 L CH4 kg-1VS (findings taken from AMPC/MLA research projects A.ENV.0131, A.ENV.0151) (Hejnfelt and Angelidaki 2009, Zhang and Banks 2012). Anaerobic treatment of these wastes present risks associated with the high concentration of ammonium (NH4+) and/or long chain fatty acids (LCFA) in some streams and the potential for inhibition of anaerobic microorganisms (Cuetos et al. 2008). Since ammonia is a by-product of protein acidification and LCFAs are intermediate products from the degradation of fat, oil and grease, inhibition may be directly linked to the macro composition of the substrate (carbohydrates, protein and lipids). At the present time, there is limited knowledge about the influence of macro composition on AcoD performance as well as on interactions between substrates that may enhance or attenuate inhibition thresholds, degradation rates, or biogas yields. The degradation of carbohydrates, protein and lipids are characterised by different metabolic pathways, rates and methane yields (Angelidaki and Sanders 2004); therefore knowledge about the influence of the substrate macro-composition would enhance the understanding and utility of potential and/or novel AcoD applications.
A.ENV.0155 - Anaerobic Co-digestion of Paunch and DAF sludge
6
Reliable modelling of AcoD is required for clear and quantifiable predictions on the effect of mixing two or more wastes in a digester and remove potentially negative impacts from mixing based on random or heuristic decisions (Astals et al. 2011, Mata-Alvarez et al. 2011). In addition, a more detailed mechanistic understanding of how different substrates interact is expected to reduce the time and costs associated with laboratory experiments as well as improve co-substrate selection and dose rates (Galí et al. 2009). Models are also useful to estimate important biochemical parameters such as biodegradability, hydrolysis rate and inhibition characteristics, which are critical in AD process design, performance and troubleshooting (Batstone et al. 2009, Jensen et al. 2011).
1.2 Project Objectives Anaerobic digestion has been successfully demonstrated on paunch solids and results are scalable. This project was developed in order to reduce risk and process costs and enhance feasibility through analysis of mixed stream co-digestion as well as quantify impact on dewaterability. Specific objectives were to:
Identify the upper limit for paunch in terms of mass loading through increased feedconcentration, monitoring, and viscosity testing;
Test the feasibility of mixed paunch, DAF sludge, and red stream digestion throughlaboratory testing; and if possible extend to the consortium pilot plant;
Assess the impact of digestion on dewaterability for feed and digestate using the Koppdrying test;
Generate final solids reduction levels (volumetric destruction levels) for own or 3rdparty cost benefit analysis.
2 Optimal Operation of Demonstration Scale Paunch Digester
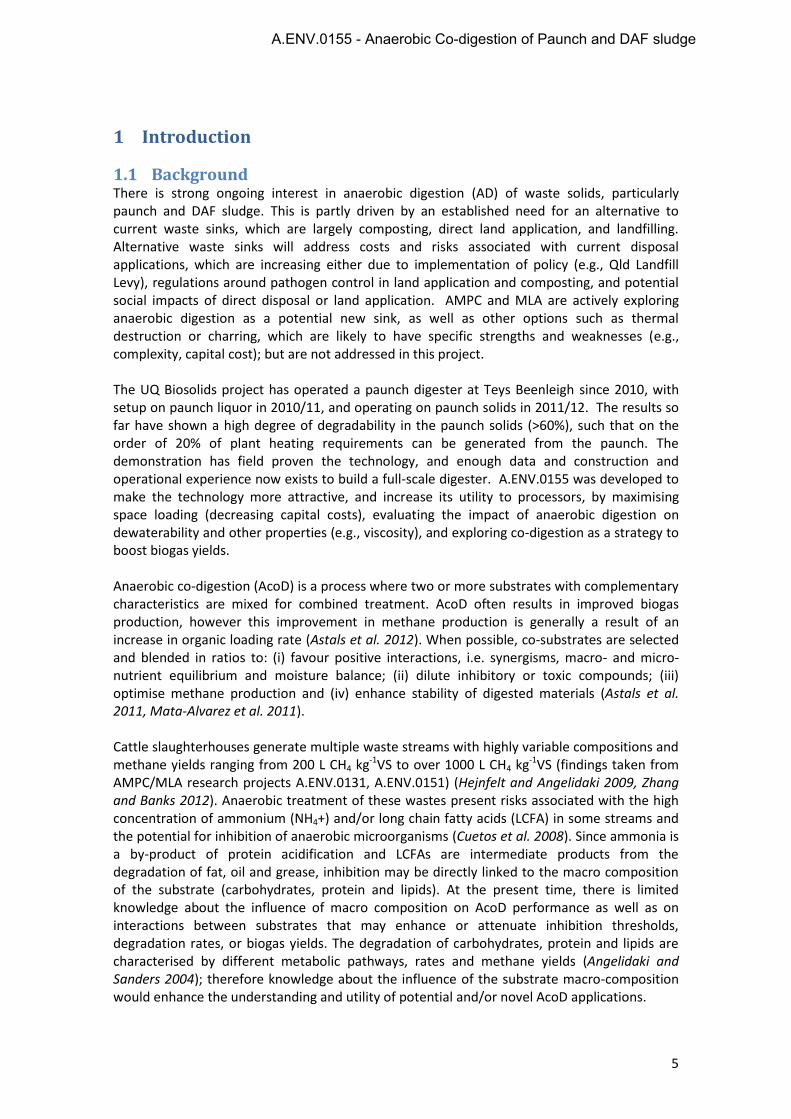
2.1 Summary of Plant Design The paunch digester used in this project was the EBCRC/UQ/MLA Biosolids Demonstration facility at Teys Aust, Beenleigh. The plant is based on a Temperature Phased Anaerobic Digestion (TPAD) process. TPAD is a two stage thermophilic-mesophilic treatment process. The first stage is operated at higher temperature (>50°C), with a 2-4 day retention time while the second stage is operated at moderate temperature (~35°C) with a 12-20 day retention time. The first stage is designed to destroy pathogens and enhance hydrolysis to condition the organic material and improve digestibility, while the second stage is designed to produce methane which can be used for renewable energy generation and stabilised organic residues (e.g. biosolids) which can be reused in agriculture. A process flow diagram for the demonstration plant is shown in Figure 1. The plant was commissioned as part of A.ENV.0099 and was operated previously at a solids feed concentration of 1-2% and organic loading rate of 0.5 kgCOD/m3/d. Detailed design reports and process performance data are available as outputs from A.ENV.0099.
A.ENV.0155 - Anaerobic Co-digestion of Paunch and DAF sludge
7
Effluent returned to existing waste processing line
R2Digester
R1Pre-treatment
Solids from Contra-shear
Feed Tank
Feed Pump
Mixing Pump
Effluent PumpTransfer Pump
Mixing Pump
Heating Bath
Process Wastewater
R1 gas meter R2 gas meter
Methane fired water heater
Gas HWS
Electric HWS fff
Grinding Pump
P
PP
P
P
PP PP
Relief ValveRelief Valve
pH
pH
P
P
PP
pH
Pressure Transmitter
pH probe/TransmitterRTDT
T
T
Figure 1: Process flow diagram of Biosolids Demonstration facility at Teys Aust.
2.2 Process Performance
2.2.1 Characterisation of Paunch Paunch solids were used as the substrate for the Biosolids Demonstration Plant. The paunch solids were collected after screening using a contrashear rotating drum screen. The collection point was selected based on access limitations and screening is not a requirement of the process. The screened paunch had a solids content of approximately 12% and required dilution to approximately 3% solids using process water. Feed concentrations above 3% resulted in transportation issues. In addition, solids would accumulate in the thermophilic pre-treatment stage causing blockages of process equipment and subsequent process failures. The average composition of diluted paunch feed (and 95% confidence margin) is shown in Table 1.
Table 1: Characterisation of paunch solids used as process feed
Characteristics Average
Total Solids (g/L) 29.6 ± 2.5
Volatile Solids (g/L) 26.2 ± 2.4
pH 6.8 ± 0.3
Chemical Oxygen Demand (g/L) 28.7 ± 2.5
Volatile Fatty Acid (g/L) 0.7 ± 0.3
NH4+-N (g/L N) 0.16 ± 0.02
A.ENV.0155 - Anaerobic Co-digestion of Paunch and DAF sludge
8
The demonstration plant was operated successfully at an organic loading rate of 1-1.3 kgCOD/m3/d. This is more than double the organic loading rate achieved in A.ENV.0099.
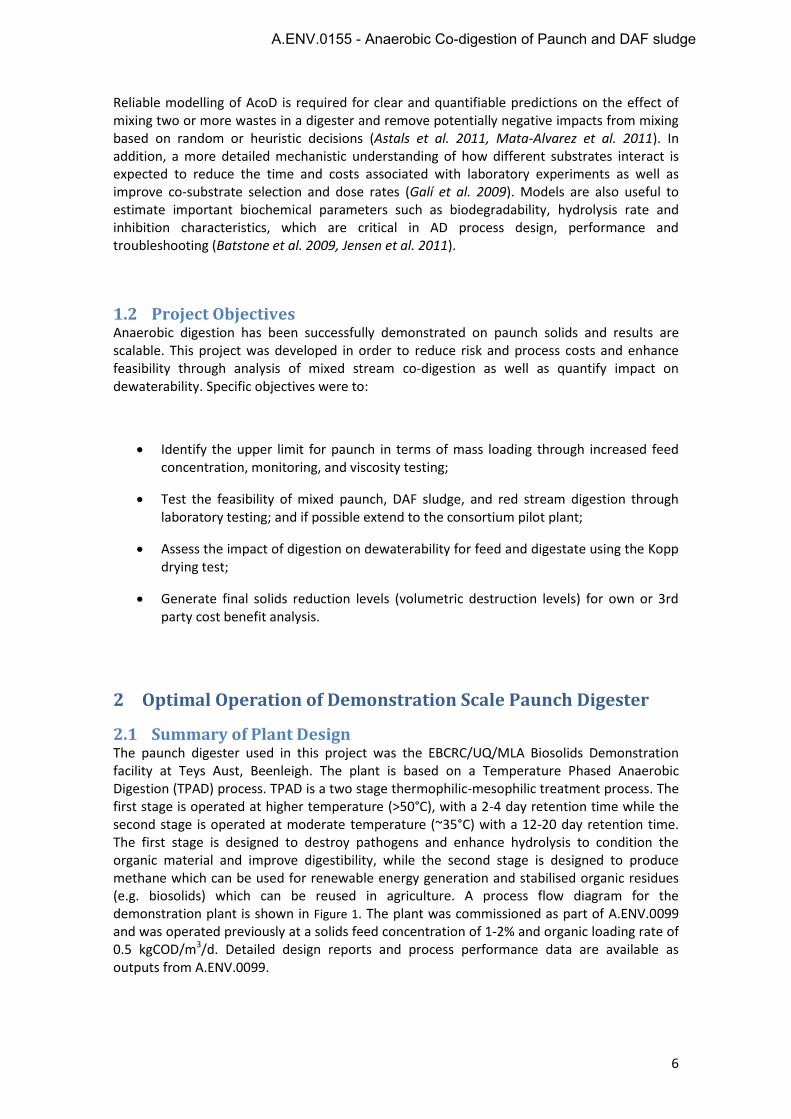
2.2.2 Biogas Production Production of methane rich biogas is a primary performance indicator of anaerobic processes and indicates the potential for renewable energy production during the stabilisation of organic matter. Biogas production from the demonstration plant is shown in Figure 2. The biogas composition was typically 63% methane (CH4) and 37% carbon dioxide (CO2), during full and steady operation this corresponds to 15 m3 of CH4 per day or approximately 220 L CH4 kg-1 VS.
Figure 2: Biogas production from the Biosolids Demonstration facility (R1: Thermophilic Pre-treatment reactor; R2: Mesophilic Digester).
The biochemical methane potential of paunch solids at Teys Aust. (Beenleigh) was measured at 237 L CH4 kg-1 VS using batch tests (Section 3.2.2). Comparisons of the demonstration plant performance and batch tests show that over 90% of the degradable material in paunch was converted to methane in the demonstration plant. The combination of biogas production and low VFA concentrations in the digester effluent were strong indications of a healthy and stable process.
Methane production from the demonstration plant appears low compared to methane production from anaerobic lagoons, however this is due to the structure of waste being treated. The biochemical methane potential of combined slaughterhouse wastewater is in the range of 600-800 L CH4 kg-1 VS (A.ENV.0131 and A.ENV.0151) due to the higher protein and lipid content in the combined effluent. However, a CAL will typically only convert 60-80% of the organic matter to methane. Therefore, while methane production is higher in CALs, the actual conversion and yield is lower than the demonstration plant.
A.ENV.0155 - Anaerobic Co-digestion of Paunch and DAF sludge
9
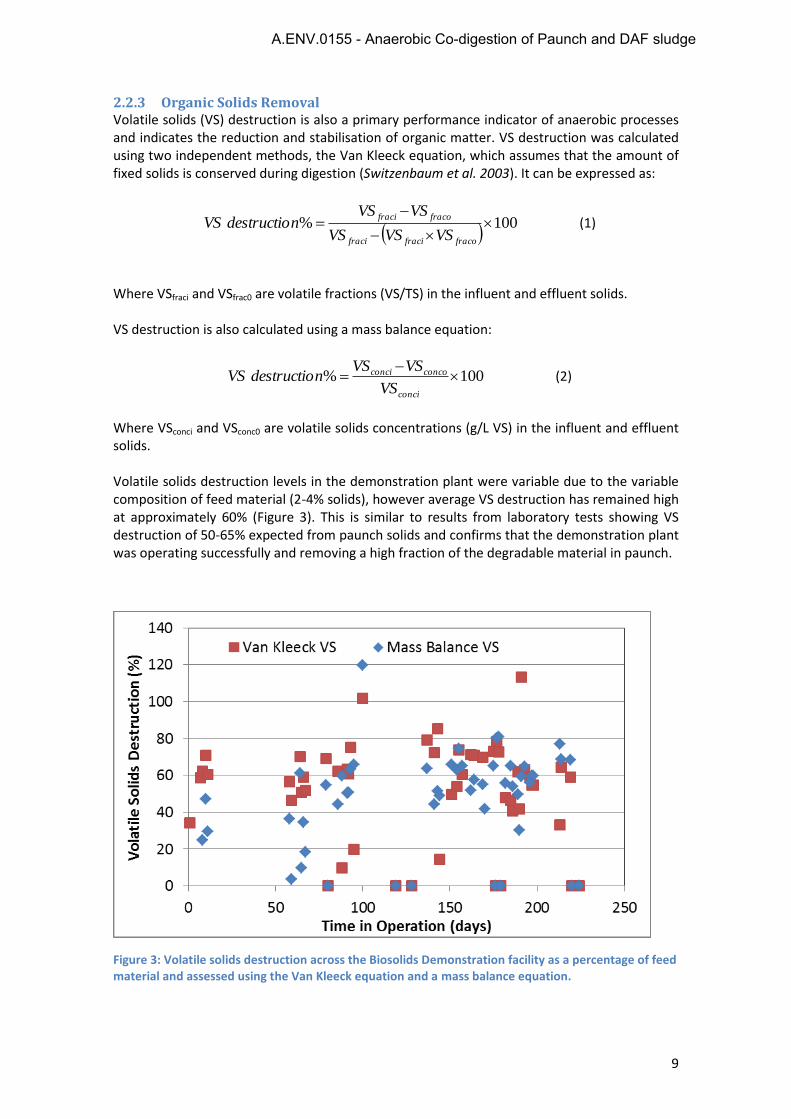
2.2.3 Organic Solids Removal Volatile solids (VS) destruction is also a primary performance indicator of anaerobic processes and indicates the reduction and stabilisation of organic matter. VS destruction was calculated using two independent methods, the Van Kleeck equation, which assumes that the amount of fixed solids is conserved during digestion (Switzenbaum et al. 2003). It can be expressed as:
100%
fracofracifraci
fracofraci
VSVSVS
VSVSndestructioVS (1)
Where VSfraci and VSfrac0 are volatile fractions (VS/TS) in the influent and effluent solids.
VS destruction is also calculated using a mass balance equation:
100%
conci
concoconci
VS
VSVSndestructioVS (2)
Where VSconci and VSconc0 are volatile solids concentrations (g/L VS) in the influent and effluent solids.
Volatile solids destruction levels in the demonstration plant were variable due to the variable composition of feed material (2-4% solids), however average VS destruction has remained high at approximately 60% (Figure 3). This is similar to results from laboratory tests showing VS destruction of 50-65% expected from paunch solids and confirms that the demonstration plant was operating successfully and removing a high fraction of the degradable material in paunch.
Figure 3: Volatile solids destruction across the Biosolids Demonstration facility as a percentage of feed material and assessed using the Van Kleeck equation and a mass balance equation.
A.ENV.0155 - Anaerobic Co-digestion of Paunch and DAF sludge
10
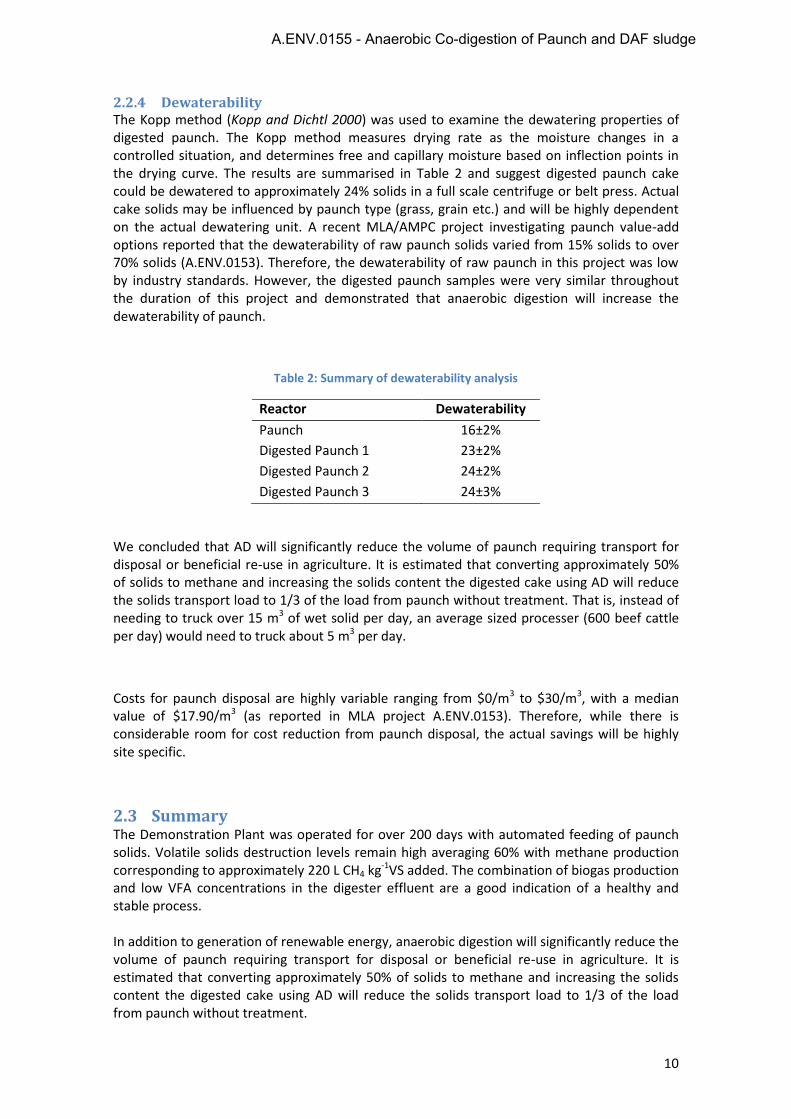
2.2.4 Dewaterability The Kopp method (Kopp and Dichtl 2000) was used to examine the dewatering properties of digested paunch. The Kopp method measures drying rate as the moisture changes in a controlled situation, and determines free and capillary moisture based on inflection points in the drying curve. The results are summarised in Table 2 and suggest digested paunch cake could be dewatered to approximately 24% solids in a full scale centrifuge or belt press. Actual cake solids may be influenced by paunch type (grass, grain etc.) and will be highly dependent on the actual dewatering unit. A recent MLA/AMPC project investigating paunch value-add options reported that the dewaterability of raw paunch solids varied from 15% solids to over 70% solids (A.ENV.0153). Therefore, the dewaterability of raw paunch in this project was low by industry standards. However, the digested paunch samples were very similar throughout the duration of this project and demonstrated that anaerobic digestion will increase the dewaterability of paunch.
Table 2: Summary of dewaterability analysis
Reactor Dewaterability
Paunch 16±2%
Digested Paunch 1 23±2%
Digested Paunch 2 24±2%
Digested Paunch 3 24±3%
We concluded that AD will significantly reduce the volume of paunch requiring transport for disposal or beneficial re-use in agriculture. It is estimated that converting approximately 50% of solids to methane and increasing the solids content the digested cake using AD will reduce the solids transport load to 1/3 of the load from paunch without treatment. That is, instead of needing to truck over 15 m3 of wet solid per day, an average sized processer (600 beef cattle per day) would need to truck about 5 m3 per day.
Costs for paunch disposal are highly variable ranging from $0/m3 to $30/m3, with a median value of $17.90/m3 (as reported in MLA project A.ENV.0153). Therefore, while there is considerable room for cost reduction from paunch disposal, the actual savings will be highly site specific.
2.3 Summary The Demonstration Plant was operated for over 200 days with automated feeding of paunch solids. Volatile solids destruction levels remain high averaging 60% with methane production corresponding to approximately 220 L CH4 kg-1VS added. The combination of biogas production and low VFA concentrations in the digester effluent are a good indication of a healthy and stable process.
In addition to generation of renewable energy, anaerobic digestion will significantly reduce the volume of paunch requiring transport for disposal or beneficial re-use in agriculture. It is estimated that converting approximately 50% of solids to methane and increasing the solids content the digested cake using AD will reduce the solids transport load to 1/3 of the load from paunch without treatment.
A.ENV.0155 - Anaerobic Co-digestion of Paunch and DAF sludge
11
The maximum sustainable organic loading rate for the demonstration plant has now been estimated at 1-1.3 kgVS/m3/d using a feed solids concentration of approximately 3%. At a feed concentration above 3%, solids accumulate in the thermophilic first stage causing materials handling issues, blockages of process equipment and subsequent process failures. Currently this is an engineering limitation of the system and could be addressed by re-designing the reactor mixing system. The biological limitation of the system has not been determined, but is estimated at 2.5-3 kgVS/m3/d based on laboratory batch tests.
Organic loading rates for mesophilic digesters treating sewage are typically in the range of 1-2 kgVS/m3/d. This is based on a feed concentration of 4-5% total solids and a solids retention time of 20-30 days (Batstone and Jensen 2011). While in the lower part of this range, the performance of the Biosolids Demonstration Plant was comparable to full scale digesters treating municipal wastewater sludge.
3 Anaerobic Co-digestion The batch co-digestion experiments were conducted as a collaboration between the Advanced Water Management Centre at The University of Queensland and the Department of Chemical Engineering at The University of Barcelona.
The primary objective of the anaerobic co-digestion batch tests was to identify the interactions (synergisms and antagonisms) between carbohydrates, protein and lipids that take place during anaerobic co-digestion, focusing on process kinetics and the anaerobic biodegradability of the substrates for a mechanistic model-based understanding of AcoD. To achieve this, the project first examined synthetic substrates containing only a carbohydrate (Ch), protein (Pr) or lipid (Li). The project then investigated more complex slaughterhouse substrates representing a concentrated source of a carbohydrate, protein or lipid. The co-digestion tests were designed to identify AcoD opportunities within the red meat processing industry and consequently improve the performance of paunch digestion and AD of other slaughterhouse wastes.
3.1 Materials and Methods
3.1.1 Substrate
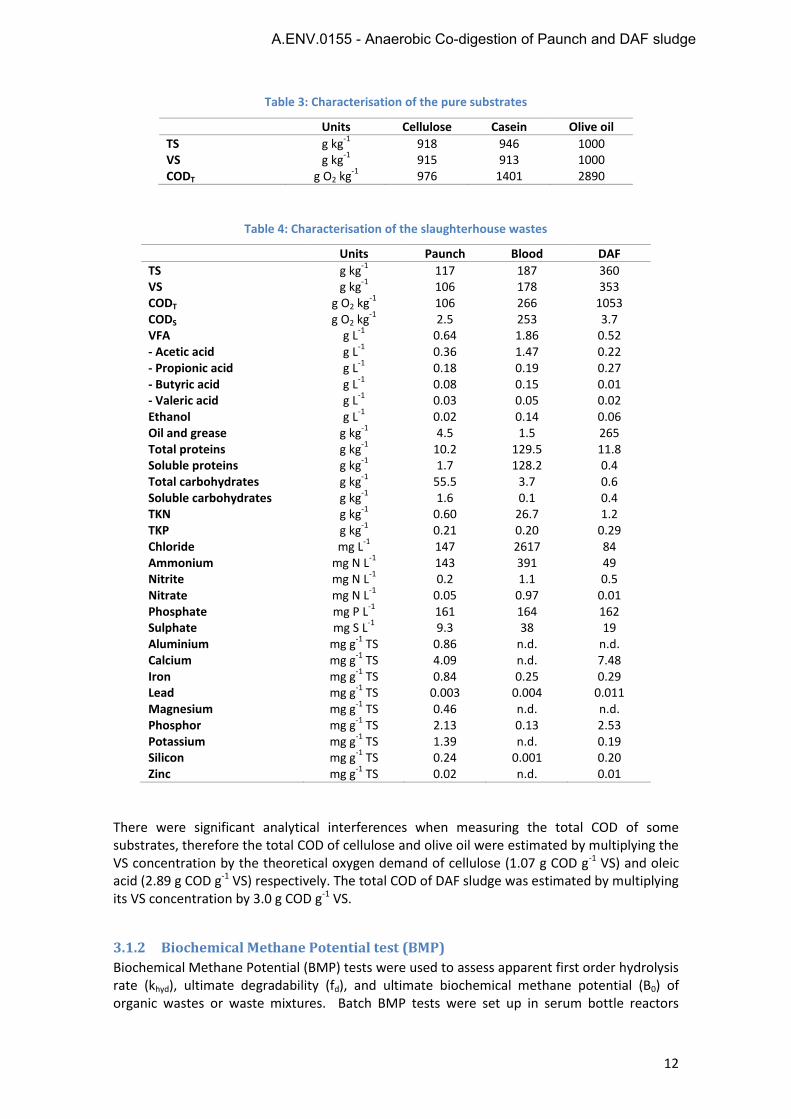
Pure substrates included analytical grade cellulose and casein purchased from Sigma-Aldrich® and white-label refined olive oil, which contained mainly palmitic, oleic and linoleic acid (AOCS 2013). Paunch solids, DAF sludge and blood wastewater were selected as slaughterhouse substrates to investigate co-digestion of carbohydrates (Ch), lipids (Li) and proteins (Pr) respectively. Table 3 shows a basic characterisation of the pure substrates, while Table 4 shows a complete physical-chemical characterisation of the slaughterhouse wastes used in this project. The slaughterhouse wastes were obtained from a Queensland slaughterhouse processing beef only (mixed grass and grain fed), wastes from mixed species plants, or beef only plants processing cattle with a different diet, may have different compositions.
A.ENV.0155 - Anaerobic Co-digestion of Paunch and DAF sludge
12
Table 3: Characterisation of the pure substrates
Units Cellulose Casein Olive oil
TS g kg-1
918 946 1000 VS g kg
-1 915 913 1000
CODT g O2 kg-1
976 1401 2890
Table 4: Characterisation of the slaughterhouse wastes
Units Paunch Blood DAF
TS g kg-1
117 187 360 VS g kg
-1 106 178 353
CODT g O2 kg-1
106 266 1053 CODS g O2 kg
-12.5 253 3.7
VFA g L-1
0.64 1.86 0.52 - Acetic acid g L
-1 0.36 1.47 0.22
- Propionic acid g L-1
0.18 0.19 0.27 - Butyric acid g L
-1 0.08 0.15 0.01
- Valeric acid g L-1
0.03 0.05 0.02 Ethanol g L
-1 0.02 0.14 0.06
Oil and grease g kg-1
4.5 1.5 265 Total proteins g kg
-1 10.2 129.5 11.8
Soluble proteins g kg-1
1.7 128.2 0.4 Total carbohydrates g kg
-1 55.5 3.7 0.6
Soluble carbohydrates g kg-1
1.6 0.1 0.4 TKN g kg
-1 0.60 26.7 1.2
TKP g kg-1
0.21 0.20 0.29 Chloride mg L
-1147 2617 84
Ammonium mg N L-1
143 391 49 Nitrite mg N L
-1 0.2 1.1 0.5
Nitrate mg N L-1
0.05 0.97 0.01 Phosphate mg P L
-1161 164 162
Sulphate mg S L-1
9.3 38 19 Aluminium mg g
-1 TS 0.86 n.d. n.d.
Calcium mg g-1
TS 4.09 n.d. 7.48 Iron mg g
-1 TS 0.84 0.25 0.29
Lead mg g-1
TS 0.003 0.004 0.011 Magnesium mg g
-1 TS 0.46 n.d. n.d.
Phosphor mg g-1
TS 2.13 0.13 2.53 Potassium mg g
-1 TS 1.39 n.d. 0.19
Silicon mg g-1
TS 0.24 0.001 0.20 Zinc mg g
-1 TS 0.02 n.d. 0.01
There were significant analytical interferences when measuring the total COD of some substrates, therefore the total COD of cellulose and olive oil were estimated by multiplying the VS concentration by the theoretical oxygen demand of cellulose (1.07 g COD g-1 VS) and oleic acid (2.89 g COD g-1 VS) respectively. The total COD of DAF sludge was estimated by multiplying its VS concentration by 3.0 g COD g-1 VS.
3.1.2 Biochemical Methane Potential test (BMP)
Biochemical Methane Potential (BMP) tests were used to assess apparent first order hydrolysis rate (khyd), ultimate degradability (fd), and ultimate biochemical methane potential (B0) of organic wastes or waste mixtures. Batch BMP tests were set up in serum bottle reactors
A.ENV.0155 - Anaerobic Co-digestion of Paunch and DAF sludge
13
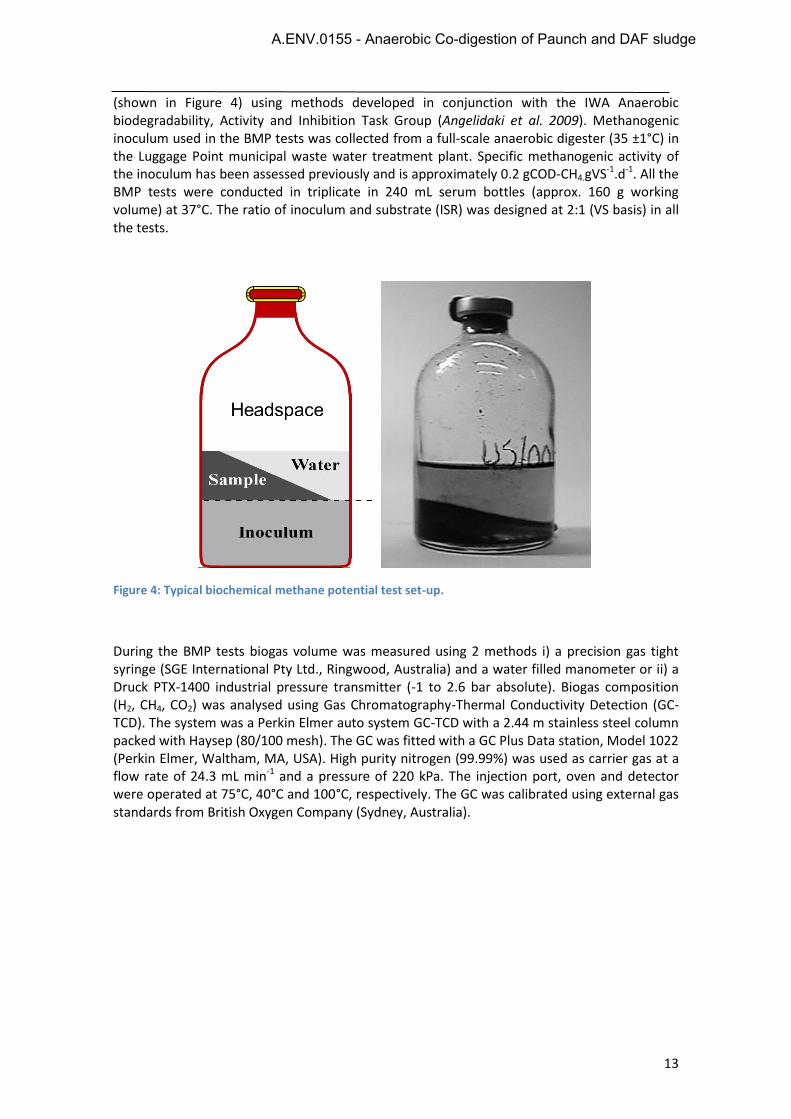
(shown in Figure 4) using methods developed in conjunction with the IWA Anaerobic biodegradability, Activity and Inhibition Task Group (Angelidaki et al. 2009). Methanogenic inoculum used in the BMP tests was collected from a full-scale anaerobic digester (35 ±1°C) in the Luggage Point municipal waste water treatment plant. Specific methanogenic activity of the inoculum has been assessed previously and is approximately 0.2 gCOD-CH4.gVS-1.d-1. All the BMP tests were conducted in triplicate in 240 mL serum bottles (approx. 160 g working volume) at 37°C. The ratio of inoculum and substrate (ISR) was designed at 2:1 (VS basis) in all the tests.
Figure 4: Typical biochemical methane potential test set-up.
During the BMP tests biogas volume was measured using 2 methods i) a precision gas tight syringe (SGE International Pty Ltd., Ringwood, Australia) and a water filled manometer or ii) a Druck PTX-1400 industrial pressure transmitter (-1 to 2.6 bar absolute). Biogas composition (H2, CH4, CO2) was analysed using Gas Chromatography-Thermal Conductivity Detection (GC-TCD). The system was a Perkin Elmer auto system GC-TCD with a 2.44 m stainless steel column packed with Haysep (80/100 mesh). The GC was fitted with a GC Plus Data station, Model 1022 (Perkin Elmer, Waltham, MA, USA). High purity nitrogen (99.99%) was used as carrier gas at a flow rate of 24.3 mL min-1 and a pressure of 220 kPa. The injection port, oven and detector were operated at 75°C, 40°C and 100°C, respectively. The GC was calibrated using external gas standards from British Oxygen Company (Sydney, Australia).
A.ENV.0155 - Anaerobic Co-digestion of Paunch and DAF sludge
14
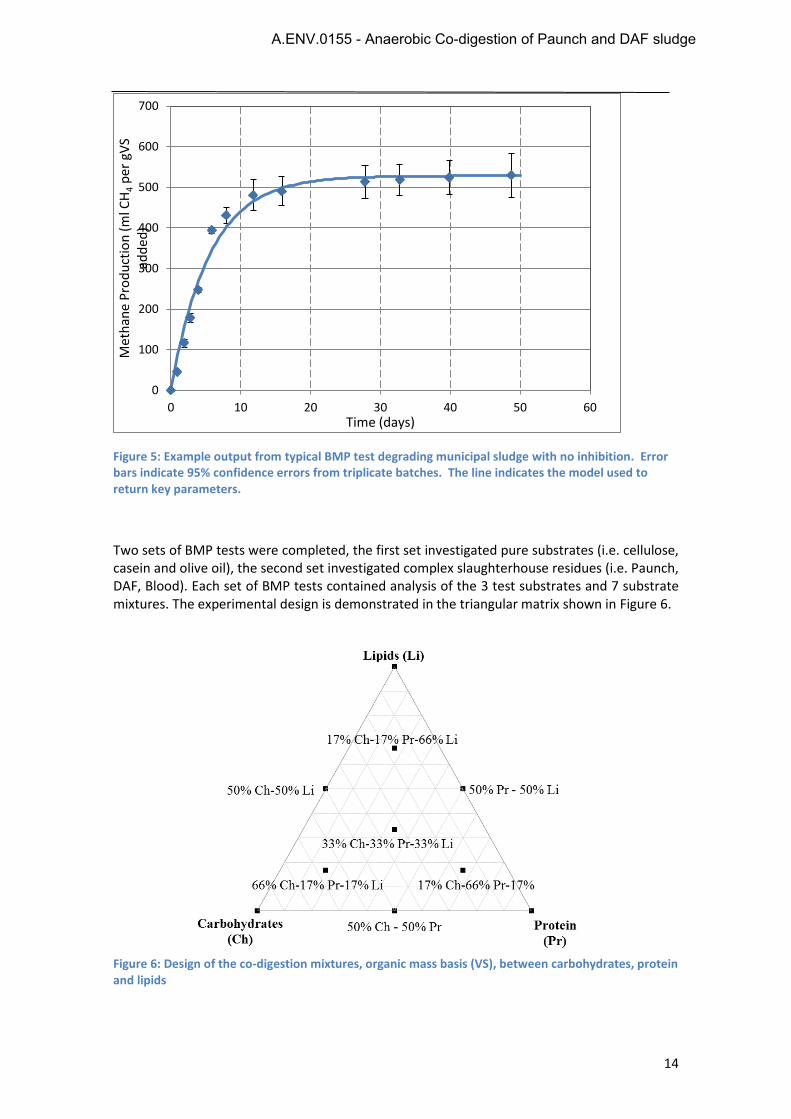
Figure 5: Example output from typical BMP test degrading municipal sludge with no inhibition. Error bars indicate 95% confidence errors from triplicate batches. The line indicates the model used to return key parameters.
Two sets of BMP tests were completed, the first set investigated pure substrates (i.e. cellulose, casein and olive oil), the second set investigated complex slaughterhouse residues (i.e. Paunch, DAF, Blood). Each set of BMP tests contained analysis of the 3 test substrates and 7 substrate mixtures. The experimental design is demonstrated in the triangular matrix shown in Figure 6.
Figure 6: Design of the co-digestion mixtures, organic mass basis (VS), between carbohydrates, protein and lipids
0
100
200
300
400
500
600
700
0 10 20 30 40 50 60
Met
han
e P
rod
uct
ion
(m
l CH
4 p
er g
VS
add
ed)
Time (days)
A.ENV.0155 - Anaerobic Co-digestion of Paunch and DAF sludge
15
3.1.3 Model Implementation and Data Analysis
Mathematical analysis of the BMPs was based on the IWA Anaerobic Digestion Model No. 1 (ADM1) (Batstone et al. 2002). Due to the high ISR, hydrolysis was considered the rate-limiting step during the batch tests (Jensen et al. 2011), therefore the BMPs were modelled using first order kinetics modified with an inhibition term (eq. 3) (Pratt et al. 2012).
(3)
Where:
r is the process rate (mL CH4 L-1 day-1),
fi is the substrate biodegradability (dimensionless), khyd,i is the first order hydrolysis rate constant of the substrate (day-1), Si is the substrate concentration (g VS L-1), Ci is the COD-to-VS ratio of the substrate, I is the inhibition factor and tdelay is the lag-phase, which is global across all substrates.
The inhibition factor was included to model LCFA inhibition during AD of lipids or AD of co-digestion mixtures containing lipids. Inhibition was modelled as per Pratt et al. (2012) (eq. 4).
(4)
Where:
I is the LCFA inhibition factor, which range from 0 (total inhibition) to 1 (no inhibition), Sli is the lipid concentration, KI,li is the inhibition constant (g VS L-1) and n is the inhibition exponent. The exponent allows for an increase in inhibition progression rate compared with the standard non-competitive function.
The model was implemented in Aquasim 2.1d. Parameter estimation and uncertainty analysis were simultaneously estimated, with a 95% confidence limit, as for Batstone et al. (2009).
3.2 Results and Discussion
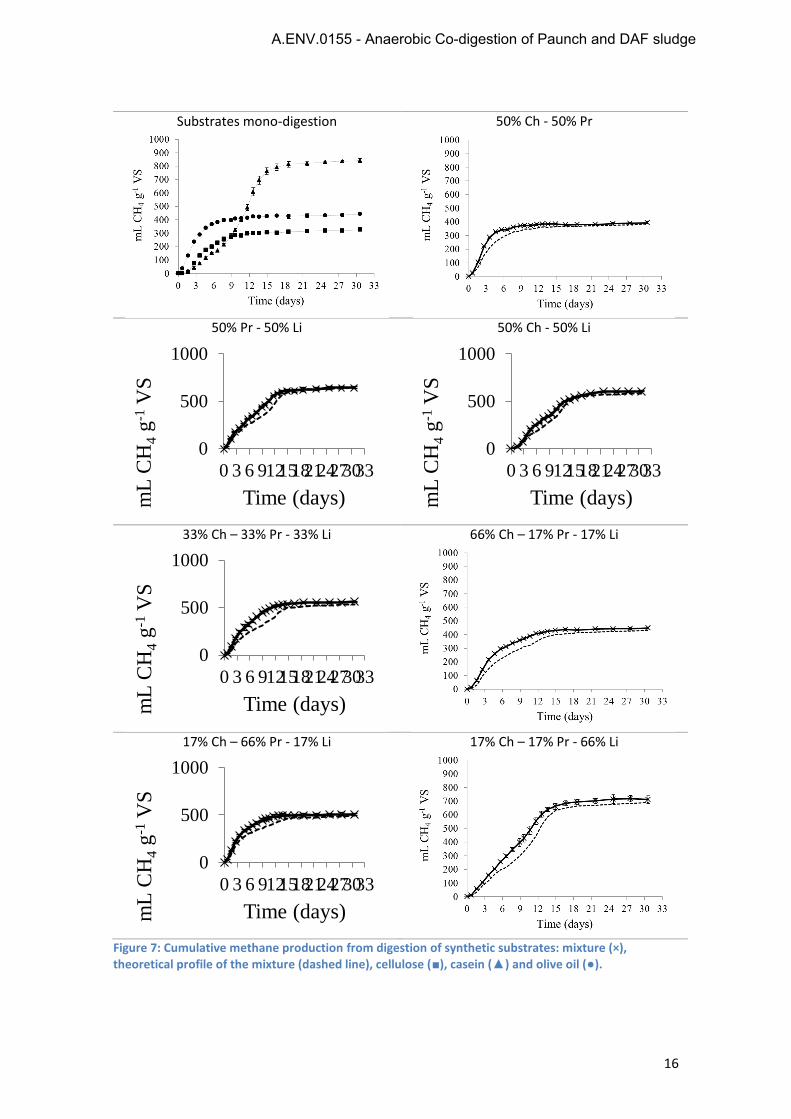
3.2.1 Methane Production from Synthetic Substrates Methane production from BMP tests investigating AD and AcoD of the synthetic substrates is shown in Figure 7.
delayi
iii,hydidelay tt
I·C·S·k·f,tt
0r
n
liI,li
liI,
KS
KI
A.ENV.0155 - Anaerobic Co-digestion of Paunch and DAF sludge
16
Substrates mono-digestion 50% Ch - 50% Pr
50% Pr - 50% Li 50% Ch - 50% Li
33% Ch – 33% Pr - 33% Li 66% Ch – 17% Pr - 17% Li
17% Ch – 66% Pr - 17% Li 17% Ch – 17% Pr - 66% Li
Figure 7: Cumulative methane production from digestion of synthetic substrates: mixture (×), theoretical profile of the mixture (dashed line), cellulose (■), casein (▲) and olive oil (●).
0
500
1000
0 3 6 91215182124273033
mL
CH
4 g
-1 V
S
Time (days)
0
500
1000
0 3 6 91215182124273033
mL
CH
4 g
-1 V
S
Time (days)
0
500
1000
0 3 6 91215182124273033
mL
CH
4 g
-1 V
S
Time (days)
0
500
1000
0 3 6 91215182124273033
mL
CH
4 g
-1 V
S
Time (days)
A.ENV.0155 - Anaerobic Co-digestion of Paunch and DAF sludge
17
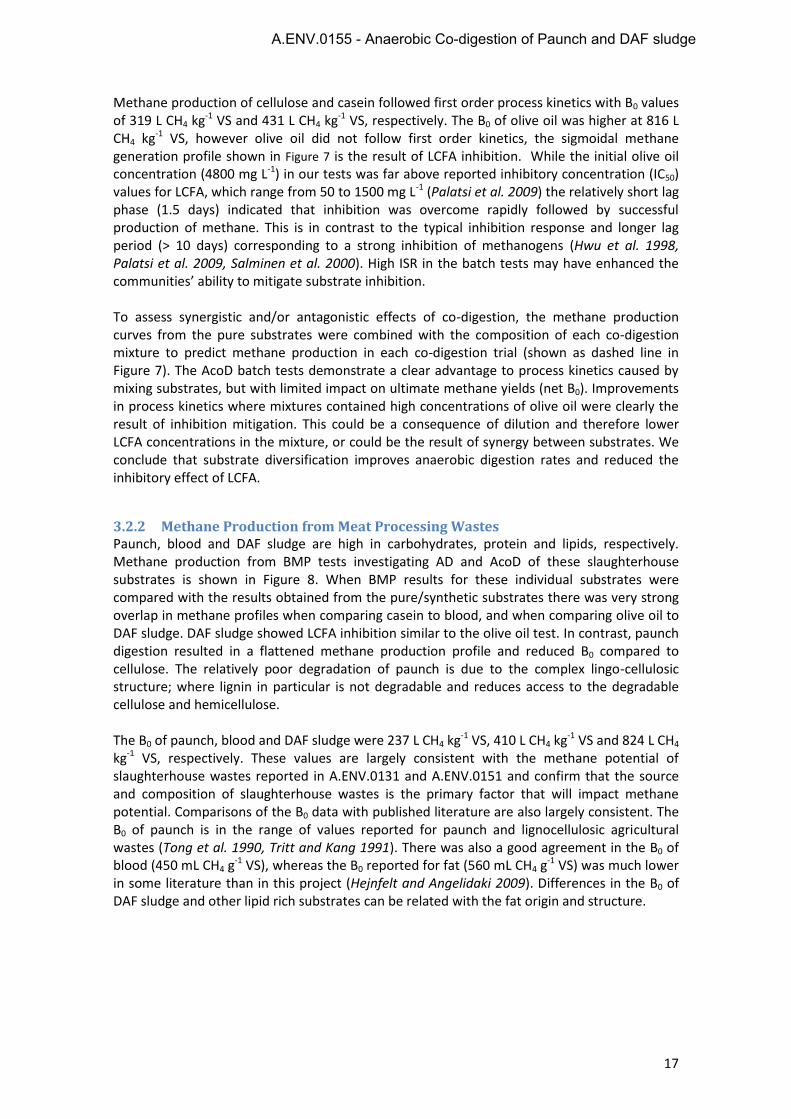
Methane production of cellulose and casein followed first order process kinetics with B0 values of 319 L CH4 kg-1 VS and 431 L CH4 kg-1 VS, respectively. The B0 of olive oil was higher at 816 L CH4 kg-1 VS, however olive oil did not follow first order kinetics, the sigmoidal methane generation profile shown in Figure 7 is the result of LCFA inhibition. While the initial olive oil concentration (4800 mg L-1) in our tests was far above reported inhibitory concentration (IC50) values for LCFA, which range from 50 to 1500 mg L-1 (Palatsi et al. 2009) the relatively short lag phase (1.5 days) indicated that inhibition was overcome rapidly followed by successful production of methane. This is in contrast to the typical inhibition response and longer lag period (> 10 days) corresponding to a strong inhibition of methanogens (Hwu et al. 1998, Palatsi et al. 2009, Salminen et al. 2000). High ISR in the batch tests may have enhanced the communities’ ability to mitigate substrate inhibition.
To assess synergistic and/or antagonistic effects of co-digestion, the methane production curves from the pure substrates were combined with the composition of each co-digestion mixture to predict methane production in each co-digestion trial (shown as dashed line in Figure 7). The AcoD batch tests demonstrate a clear advantage to process kinetics caused by mixing substrates, but with limited impact on ultimate methane yields (net B0). Improvements in process kinetics where mixtures contained high concentrations of olive oil were clearly the result of inhibition mitigation. This could be a consequence of dilution and therefore lower LCFA concentrations in the mixture, or could be the result of synergy between substrates. We conclude that substrate diversification improves anaerobic digestion rates and reduced the inhibitory effect of LCFA.
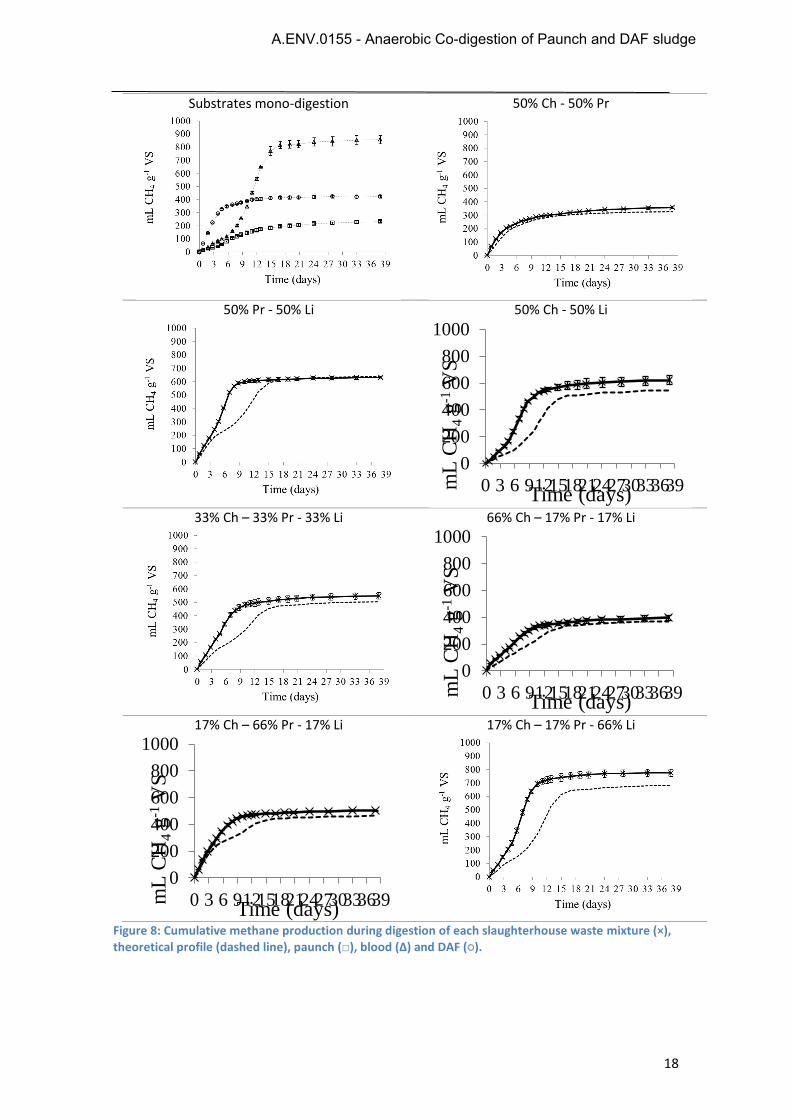
3.2.2 Methane Production from Meat Processing Wastes Paunch, blood and DAF sludge are high in carbohydrates, protein and lipids, respectively. Methane production from BMP tests investigating AD and AcoD of these slaughterhouse substrates is shown in Figure 8. When BMP results for these individual substrates were compared with the results obtained from the pure/synthetic substrates there was very strong overlap in methane profiles when comparing casein to blood, and when comparing olive oil to DAF sludge. DAF sludge showed LCFA inhibition similar to the olive oil test. In contrast, paunch digestion resulted in a flattened methane production profile and reduced B0 compared to cellulose. The relatively poor degradation of paunch is due to the complex lingo-cellulosic structure; where lignin in particular is not degradable and reduces access to the degradable cellulose and hemicellulose.
The B0 of paunch, blood and DAF sludge were 237 L CH4 kg-1 VS, 410 L CH4 kg-1 VS and 824 L CH4 kg-1 VS, respectively. These values are largely consistent with the methane potential of slaughterhouse wastes reported in A.ENV.0131 and A.ENV.0151 and confirm that the source and composition of slaughterhouse wastes is the primary factor that will impact methane potential. Comparisons of the B0 data with published literature are also largely consistent. The B0 of paunch is in the range of values reported for paunch and lignocellulosic agricultural wastes (Tong et al. 1990, Tritt and Kang 1991). There was also a good agreement in the B0 of blood (450 mL CH4 g
-1 VS), whereas the B0 reported for fat (560 mL CH4 g-1 VS) was much lower
in some literature than in this project (Hejnfelt and Angelidaki 2009). Differences in the B0 of DAF sludge and other lipid rich substrates can be related with the fat origin and structure.
A.ENV.0155 - Anaerobic Co-digestion of Paunch and DAF sludge
18
Substrates mono-digestion 50% Ch - 50% Pr
50% Pr - 50% Li 50% Ch - 50% Li
33% Ch – 33% Pr - 33% Li 66% Ch – 17% Pr - 17% Li
17% Ch – 66% Pr - 17% Li 17% Ch – 17% Pr - 66% Li
Figure 8: Cumulative methane production during digestion of each slaughterhouse waste mixture (×), theoretical profile (dashed line), paunch (□), blood (∆) and DAF (○).
0
200
400
600
800
1000
0 3 6 912151821242730333639mL
CH
4 g
-1 V
S
Time (days)
0
200
400
600
800
1000
0 3 6 912151821242730333639mL
CH
4 g
-1 V
S
Time (days)
0
200
400
600
800
1000
0 3 6 912151821242730333639mL
CH
4 g
-1 V
S
Time (days)
A.ENV.0155 - Anaerobic Co-digestion of Paunch and DAF sludge
19
When considering substrate selection for the Biosolids Demonstration Plant, paunch had the lowest B0 and therefore addition of either blood of DAF sludge would be expected to enhance methane yields (on a VS basis).
In all cases, the B0 from the AcoD mixtures was higher than the B0 of the paunch-only digestion. Two mixtures (50%Ch - 50%Li; 17%Ch - 17%Pr - 66%Li) resulted in a B0 significantly higher than the theoretical prediction (>15% improvement). Non-degraded COD in the paunch-only and blood-only tests was very low and not enough to explain the increased B0 in the AcoD trials. A COD balance showed that the increase in observed B0 from these tests must have been the result of improved conversion of the DAF sludge. Paunch contains ruminant microorganisms with a range of metabolic capabilities including lipid hydrolysis (Kim et al. 2009) and it is possible that the increase in observed B0 (compared to predicted) may be due to the hydrolytic capacity of these microorganisms to further degrade the DAF sludge (slurry with small fat conglomerates). Small improvements in B0 values were recorded in other AcoD mixtures; however the improvements were less than 7% and were not considered significant.
All AcoD mixtures resulted in an improvement in the digestion kinetics when compared with the theoretical predictions (Figure 8). The lipid-rich mixtures (50%Ch - 50%Li; 50%Pr - 50%Li; 33%Ch - 33%Pr - 33%Li and 17%Ch - 17%Pr - 66%Li) showed greater improvements in process kinetics compared to pure substrates. In the lipid-rich mixtures, the increase of the slope in the cumulative methane production, signalling recovery from LCFA inhibition, was observed at Days 4-5 instead of Day 7. Again, we conclude that AcoD mitigated LCFA inhibition during digestion of slaughterhouse wastes.
3.2.3 Model-based Analysis
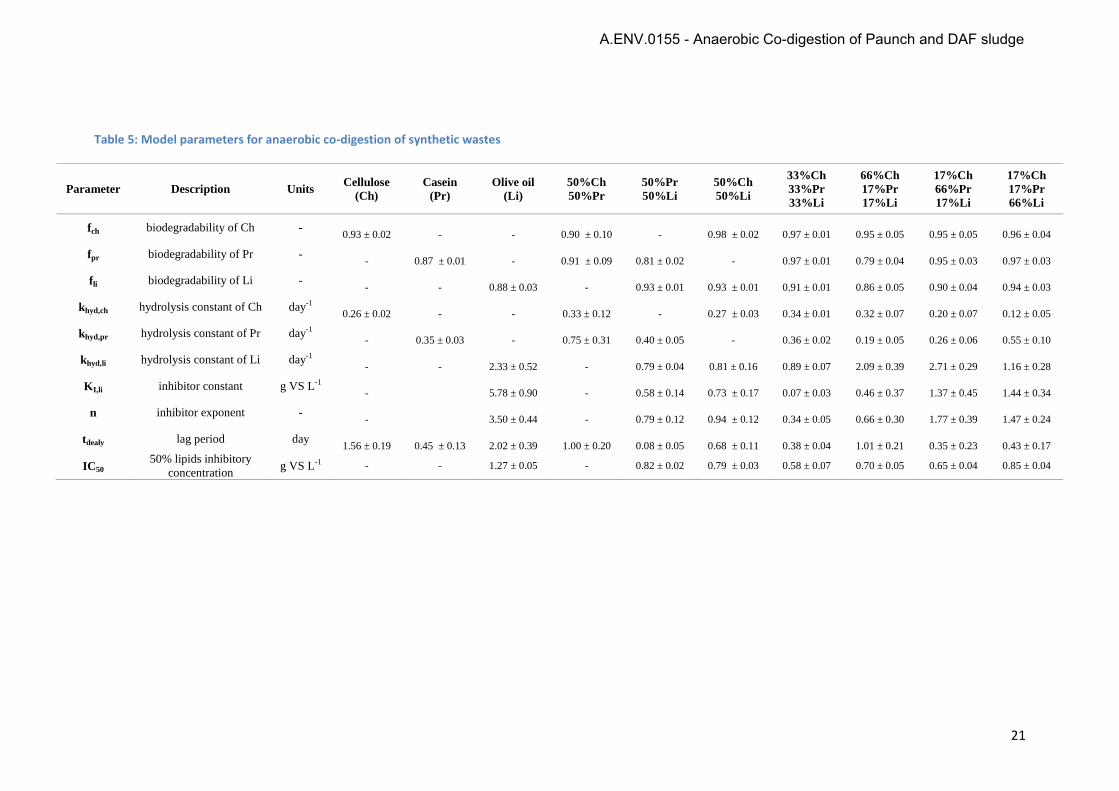
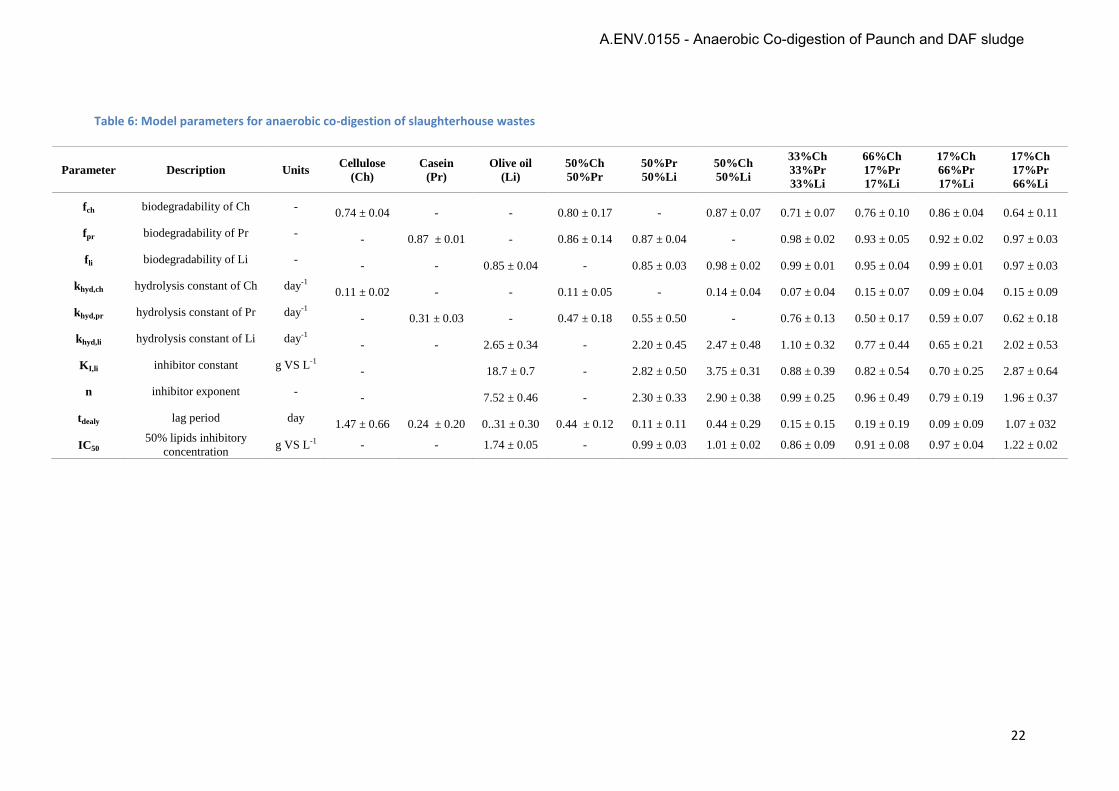
Kinetic parameters for the degradation of synthetic substrates and slaughterhouse wastes are presented in Table 5 and
A.ENV.0155 - Anaerobic Co-digestion of Paunch and DAF sludge
20
Table 6 respectively. These parameters demonstrate the fraction of material that can be converted to methane (f), the speed of conversion (khyd) and the degree of LCFA inhibition. The high degradability (85% to 97%) obtained in all scenarios for cellulose, casein and olive oil are in agreement with the B0 values obtained and confirm that there are no antagonistic effects associated with the intrinsic composition of organic matter. The degradability of blood and DAF sludge was also high (> 85 %), whereas the degradability of paunch was lower (~75 %) and was likely due to the complex lignocellulosic structure.
The improvement in process kinetics achieved using AcoD was reflected by the increase in hydrolysis rate of one or more compounds in the mixture (compared with the kinetics of single substrate digestion). However, the mitigation of LCFA inhibition is not well represented by the models. AcoD resulted in lower IC50 concentrations for the lipids mixtures and this would suggest that the lipids are inhibitory at lower levels; which is not consistent with the results of the BMP tests. Further investigations around inhibition modelling are recommended. These investigations could include analysis of the IC50 as a fraction of the initial lipid concentration, or modelling based on different modes of substrate inhibition (e.g. competitive vs non-competitive).
A.ENV.0155 - Anaerobic Co-digestion of Paunch and DAF sludge
21
Table 5: Model parameters for anaerobic co-digestion of synthetic wastes
Parameter Description Units Cellulose
(Ch)
Casein
(Pr)
Olive oil
(Li)
50%Ch
50%Pr
50%Pr
50%Li
50%Ch
50%Li
33%Ch
33%Pr
33%Li
66%Ch
17%Pr
17%Li
17%Ch
66%Pr
17%Li
17%Ch
17%Pr
66%Li
fch biodegradability of Ch - 0.93 ± 0.02 - - 0.90 ± 0.10 - 0.98 ± 0.02 0.97 ± 0.01 0.95 ± 0.05 0.95 ± 0.05 0.96 ± 0.04
fpr biodegradability of Pr - - 0.87 ± 0.01 - 0.91 ± 0.09 0.81 ± 0.02 - 0.97 ± 0.01 0.79 ± 0.04 0.95 ± 0.03 0.97 ± 0.03
fli biodegradability of Li - - - 0.88 ± 0.03 - 0.93 ± 0.01 0.93 ± 0.01 0.91 ± 0.01 0.86 ± 0.05 0.90 ± 0.04 0.94 ± 0.03
khyd,ch hydrolysis constant of Ch day-1 0.26 ± 0.02 - - 0.33 ± 0.12 - 0.27 ± 0.03 0.34 ± 0.01 0.32 ± 0.07 0.20 ± 0.07 0.12 ± 0.05
khyd,pr hydrolysis constant of Pr day-1 - 0.35 ± 0.03 - 0.75 ± 0.31 0.40 ± 0.05 - 0.36 ± 0.02 0.19 ± 0.05 0.26 ± 0.06 0.55 ± 0.10
khyd,li hydrolysis constant of Li day-1 - - 2.33 ± 0.52 - 0.79 ± 0.04 0.81 ± 0.16 0.89 ± 0.07 2.09 ± 0.39 2.71 ± 0.29 1.16 ± 0.28
KI,li inhibitor constant g VS L-1 - 5.78 ± 0.90 - 0.58 ± 0.14 0.73 ± 0.17 0.07 ± 0.03 0.46 ± 0.37 1.37 ± 0.45 1.44 ± 0.34
n inhibitor exponent - - 3.50 ± 0.44 - 0.79 ± 0.12 0.94 ± 0.12 0.34 ± 0.05 0.66 ± 0.30 1.77 ± 0.39 1.47 ± 0.24
tdealy lag period day 1.56 ± 0.19 0.45 ± 0.13 2.02 ± 0.39 1.00 ± 0.20 0.08 ± 0.05 0.68 ± 0.11 0.38 ± 0.04 1.01 ± 0.21 0.35 ± 0.23 0.43 ± 0.17
IC50 50% lipids inhibitory
concentration g VS L-1 - - 1.27 ± 0.05 - 0.82 ± 0.02 0.79 ± 0.03 0.58 ± 0.07 0.70 ± 0.05 0.65 ± 0.04 0.85 ± 0.04
A.ENV.0155 - Anaerobic Co-digestion of Paunch and DAF sludge
22
Table 6: Model parameters for anaerobic co-digestion of slaughterhouse wastes
Parameter Description Units Cellulose
(Ch)
Casein
(Pr)
Olive oil
(Li)
50%Ch
50%Pr
50%Pr
50%Li
50%Ch
50%Li
33%Ch
33%Pr
33%Li
66%Ch
17%Pr
17%Li
17%Ch
66%Pr
17%Li
17%Ch
17%Pr
66%Li
fch biodegradability of Ch - 0.74 ± 0.04 - - 0.80 ± 0.17 - 0.87 ± 0.07 0.71 ± 0.07 0.76 ± 0.10 0.86 ± 0.04 0.64 ± 0.11
fpr biodegradability of Pr - - 0.87 ± 0.01 - 0.86 ± 0.14 0.87 ± 0.04 - 0.98 ± 0.02 0.93 ± 0.05 0.92 ± 0.02 0.97 ± 0.03
fli biodegradability of Li - - - 0.85 ± 0.04 - 0.85 ± 0.03 0.98 ± 0.02 0.99 ± 0.01 0.95 ± 0.04 0.99 ± 0.01 0.97 ± 0.03
khyd,ch hydrolysis constant of Ch day-1 0.11 ± 0.02 - - 0.11 ± 0.05 - 0.14 ± 0.04 0.07 ± 0.04 0.15 ± 0.07 0.09 ± 0.04 0.15 ± 0.09
khyd,pr hydrolysis constant of Pr day-1 - 0.31 ± 0.03 - 0.47 ± 0.18 0.55 ± 0.50 - 0.76 ± 0.13 0.50 ± 0.17 0.59 ± 0.07 0.62 ± 0.18
khyd,li hydrolysis constant of Li day-1 - - 2.65 ± 0.34 - 2.20 ± 0.45 2.47 ± 0.48 1.10 ± 0.32 0.77 ± 0.44 0.65 ± 0.21 2.02 ± 0.53
KI,li inhibitor constant g VS L-1 - 18.7 ± 0.7 - 2.82 ± 0.50 3.75 ± 0.31 0.88 ± 0.39 0.82 ± 0.54 0.70 ± 0.25 2.87 ± 0.64
n inhibitor exponent - - 7.52 ± 0.46 - 2.30 ± 0.33 2.90 ± 0.38 0.99 ± 0.25 0.96 ± 0.49 0.79 ± 0.19 1.96 ± 0.37
tdealy lag period day 1.47 ± 0.66 0.24 ± 0.20 0..31 ± 0.30 0.44 ± 0.12 0.11 ± 0.11 0.44 ± 0.29 0.15 ± 0.15 0.19 ± 0.19 0.09 ± 0.09 1.07 ± 032
IC50 50% lipids inhibitory
concentration g VS L-1 - - 1.74 ± 0.05 - 0.99 ± 0.03 1.01 ± 0.02 0.86 ± 0.09 0.91 ± 0.08 0.97 ± 0.04 1.22 ± 0.02
A.ENV.0155 - Anaerobic Co-digestion of Paunch and DAF sludge
3.3 Summary The B0 of paunch, blood and DAF sludge were 237 L CH4 kg-1 VS, 410 L CH4 kg-1 VS and 824 L CH4 kg-1 VS, respectively. The high B0 of DAF sludge relative to paunch indicates that methane production from the Demonstration Plant could be improved by substituting a portion of the organic loading rate as DAF sludge. However, DAF sludge also resulted in process inhibition. Therefore determination of an optimal mixture is required.
Investigations of anaerobic co-digestion of slaughterhouse wastes demonstrated in a clear and quantifiable manner that co-digestion will improve process kinetics and in some cases may improve overall substrate degradation and methane production. Improvements in process kinetics are expected to be related to the mitigation of LCFA inhibition, however inhibition modelling is ongoing.
Other conclusions are summarised as follows:
In all cases, the B0 from the AcoD mixtures was higher than the B0 of the paunch-onlydigestion. Therefore AcoD would improve methane yields from the Biosolids DemonstrationPlant.
Substrate diversification improved process kinetics. The synergisms of mixing substrates ledto an improvement in AD kinetics for all mixtures. However, as a general trend, the ultimatemethane production was not affected.
Mixing waste is a feasible option to reduce the impact of inhibitory compounds. Theintroduction of a carbohydrates and/or protein source to lipids reduced the LCFA inhibitionpresent in lipid AD.
AcoD of paunch and DAF sludge resulted in a higher methane yield than predicted. Resultssuggest that the microorganisms present in the paunch may contribute to improvedhydrolysis of the partially biodegradable fat conglomerates present in the DAF sludge.
4 Conclusions and Recommendations The Biosolids Demonstration Plant was operated for over 200 days with paunch solids as the sole substrate. The maximum sustainable organic loading rate for the Demonstration Plant was estimated at 1-1.3 kgVS/m3/d using a feed solids concentration of approximately 3% and is comparable to full scale digesters treating municipal wastewater sludge. At solids concentrations above 3% the mixing system was not sufficient resulting in solids accumulation, blockages and subsequent process failures. Methane production (220 L CH4 kg-1 VS) and organic solids destruction (60%) in the demonstration plant were similar to levels predicted from independent batch tests.
In addition to generation of renewable energy, anaerobic digestion will significantly reduce the volume of paunch requiring transport for disposal/beneficial re-use in agriculture. It is estimated that converting approximately 50% of solids to methane and increasing the solids content the digested cake using AD will reduce the solids transport load to 1/3 of the load from paunch without treatment. In addition to reduced transport costs, digested paunch is stable and may be suitable for beneficial re-use via land application. However, this would be subject to local environmental regulations. Performance data from the Demonstration Plant, including energy recovery and mitigation of paunch disposal costs will now be used in cost-benefit analysis undertaken as the next phase of research projects on paunch digestion and value-add options.
23
A.ENV.0155 - Anaerobic Co-digestion of Paunch and DAF sludge
Investigations of anaerobic co-digestion of slaughterhouse wastes demonstrated that co-digestion is a promising strategy to improve process performance. In all cases, the B0 from AcoD mixtures was higher than the B0 of the paunch-only digestions. Generally, this was due to the higher B0 of the individual substrates. However, AcoD of paunch and DAF sludge resulted in a higher methane yield than predicted and results suggest that the biomass present in the paunch may have contributed to improved hydrolysis of the partially biodegradable fat conglomerates present in the DAF sludge.
When considering the process kinetics of paunch digestion, paunch was the slowest degrading substrate. The addition of rapidly degrading substrates such as blood or DAF sludge would not increase the required treatment times. When considering the process kinetics of co-digestion mixtures, all AcoD mixtures resulted in an improvement in the digestion kinetics when compared with the theoretical predictions. These improvements are expected to be related to the mitigation of LCFA inhibition associated with digestion of DAF sludge; however this needs to be investigated further using inhibition modelling.
Investigations of AcoD in this project were based on batch tests. We recommend the next major investigation in this area focus on examining the outcomes of the batch co-digestion trials in a continuous process; particularly co-digestion of paunch solids and DAF sludge. While AcoD was identified as a suitable strategy to boost methane production from the paunch digester, the impact of substrate composition and AcoD ratios on nutrient release and recovery potential was not investigated in this study. This is another area recommended for future investigation.
5 References 1. Angelidaki, I., Alves, M., Bolzonella, D., Borzacconi, L., Campos, J. L., Guwy, A. J., Kalyuzhnyi,
S., Jenicek, P., and Van Lier, J. B. 2009 Defining the biomethane potential (BMP) of solidorganic wastes and energy crops: A proposed protocol for batch assays, pp 927-934.
2. Angelidaki, I., and Sanders, W. 2004 Assessment of the anaerobic biodegradability ofmacropollutants, Reviews in Environmental Science and Biotechnology 3, 117-129.
3. AOCS. 2013 American Oil Chemists' Society.4. Astals, S., Ariso, M., Galí, A., and Mata-Alvarez, J. 2011 Co-digestion of pig manure and
glycerine: Experimental and modelling study, Journal of Environmental Management 92,1091-1096.
5. Astals, S., Nolla-Ardèvol, V., and Mata-Alvarez, J. 2012 Anaerobic co-digestion of pig manureand crude glycerol at mesophilic conditions: Biogas and digestate, Bioresource Technology110, 63-70.
6. Batstone, D. J., and Jensen, P. D. 2011 Anaerobic processes., In Treatise on Water Science(Wilderer, P., Rogers, P., Uhlenbrook, S., Frimmel, F., and Hanaki, K., Eds.), pp 615-640,Academic Press, Oxford, U.K.
7. Batstone, D. J., Keller, J., Angelidaki, I., Kalyuzhnyi, S. V., Pavlostathis, S. G., Rozzi, A.,Sanders, W. T., Siegrist, H., and Vavilin, V. A. 2002 The IWA Anaerobic Digestion Model No 1(ADM1), Water Science and Technology 45, 65-73.
8. Batstone, D. J., Tait, S., and Starrenburg, D. 2009 Estimation of hydrolysis parameters in full-scale anerobic digesters, Biotechnology and Bioengineering 102, 1513-1520.
9. Cuetos, M. J., Gómez, X., Otero, M., and Morán, A. 2008 Anaerobic digestion of solidslaughterhouse waste (SHW) at laboratory scale: Influence of co-digestion with the organicfraction of municipal solid waste (OFMSW), Biochemical Engineering Journal 40, 99-106.
10. Galí, A., Benabdallah, T., Astals, S., and Mata-Alvarez, J. 2009 Modified version of ADM1model for agro-waste application, Bioresource Technology 100, 2783-2790.
24
A.ENV.0155 - Anaerobic Co-digestion of Paunch and DAF sludge
11. Hejnfelt, A., and Angelidaki, I. 2009 Anaerobic digestion of slaughterhouse by-products, Biomass and Bioenergy 33, 1046-1054.
12. Hwu, C. S., Tseng, S. K., Yuan, C. Y., Kulik, Z., and Lettinga, G. 1998 Biosorption of long-chain fatty acids in UASB treatment process, Water Research 32, 1571-1579.
13. Jensen, P. D., Ge, H., and Batstone, D. J. 2011 Assessing the role of biochemical methane potential tests in determining anaerobic degradability rate and extent, Water Science and Technology 64, 880-886.
14. Kim, E. J., Huws, S. A., Lee, M. R. F., and Scollan, N. D. 2009 Dietary transformation of lipid in the rumen microbial ecosystem, Asian-Australasian Journal of Animal Sciences 22, 1341-1350.
15. Kopp, J., and Dichtl, N. 2000 Prediction of full-scale dewatering results by determining the water distribution of sewage sludges, pp 141-149.
16. Mata-Alvarez, J., Dosta, J., Macé, S., and Astals, S. 2011 Codigestion of solid wastes: A review of its uses and perspectives including modeling, Critical Reviews in Biotechnology 31, 99-111.
17. Palatsi, J., Laureni, M., Andrés, M. V., Flotats, X., Nielsen, H. B., and Angelidaki, I. 2009 Strategies for recovering inhibition caused by long chain fatty acids on anaerobic thermophilic biogas reactors, Bioresource Technology 100, 4588-4596.
18. Pratt, S., Liew, D., Batstone, D. J., Werker, A. G., Morgan-Sagastume, F., and Lant, P. A. 2012 Inhibition by fatty acids during fermentation of pre-treated waste activated sludge, Journal of Biotechnology 159, 38-43.
19. Salminen, E., Rintala, J., Lokshina, L. Y., and Vavilin, V. A. 2000 Anaerobic batch degradation of solid poultry slaughterhouse waste, pp 33-41.
20. Switzenbaum, M. S., Farrell, J. B., and Pincince, A. B. 2003 Relationship between the Van Kleeck and mass-balance calculation of volatile solids loss, Water Environment Research 75, 377-380.
21. Tong, X., Smith, L. H., and McCarty, P. L. 1990 Methane fermentation of selected lignocellulosic materials, Biomass 21, 239-255.
22. Tritt, W. P., and Kang, H. 1991 Ultimate biodegradibility and decay rates of cow paunch manure under anaerobic conditions, Bioresource Technology 36, 161-165.
23. Zhang, Y., and Banks, C. J. 2012 Co-digestion of the mechanically recovered organic fraction of municipal solid waste with slaughterhouse wastes, Biochemical Engineering Journal 68, 129-137.
25
A.ENV.0155 - Anaerobic Co-digestion of Paunch and DAF sludge