aem september 2012 corporate update
TRANSCRIPT

AGNICO EAGLE MINES LIMITEDAGNICO-EAGLE MINES LIMITED
Corporate Updatep pSeptember 2012
Forward Looking Statements
The information in this document has been prepared as at September 5, 2012. Certain statements contained in this document constitute“forward-looking statements” within the meaning of the United States Private Securities Litigation Reform Act of 1995 and forward lookinginformation under the provisions of Canadian provincial securities laws. When used in this document, the words “anticipate”, “expect”,“estimate” “forecast” “will” “planned” and similar expressions are intended to identify forward looking statements or informationestimate , forecast , will , planned , and similar expressions are intended to identify forward-looking statements or information.
Such statements include without limitation: statements regarding timing and amounts of capital expenditures and other assumptions;estimates of future reserves, resources, mineral production, optimization efforts and sales; estimates of mine life; estimates of futureinternal rates of return, mining costs, cash costs, minesite costs and other expenses; estimates of future capital expenditures and othercash needs, and expectations as to the funding thereof; statements and information as to the projected development of certain ore deposits,including estimates of exploration, development and production and other capital costs, and estimates of the timing of such exploration,development and production or decisions with respect to such exploration development and production; estimates of reserves anddevelopment and production or decisions with respect to such exploration, development and production; estimates of reserves andresources, and statements and information regarding anticipated future exploration; the anticipated timing of events with respect to theCompany's mine sites and statements and information regarding the sufficiency of the Company's cash resources. Such statements andinformation reflect the Company's views as at the date of this document and are subject to certain risks, uncertainties and assumptions, andundue reliance should not be placed on such statements and information. Many factors, known and unknown could cause the actual resultsto be materially different from those expressed or implied by such forward looking statements and information. Such risks include, but arenot limited to: the volatility of prices of gold and other metals; uncertainty of mineral reserves, mineral resources, mineral grades andy p g ; y , , gmineral recovery estimates; uncertainty of future production, capital expenditures, and other costs; currency fluctuations; financing ofadditional capital requirements; cost of exploration and development programs; mining risks; community protests; risks associated withforeign operations; governmental and environmental regulation; the volatility of the Company's stock price; and risks associated with theCompany's byproduct metal derivative strategies. For a more detailed discussion of such risks and other factors that may affect theCompany’s ability to achieve the expectations set forth in the forward-looking statements contained in this document, see the Company'sAnnual Report on Form 20-F for the year ended December 31, 2011, as well as the Company's other filings with the Canadian SecuritiesAd i i t t d th U S S iti d E h C i i Th C d t i t d d d t bli ti tAdministrators and the U.S. Securities and Exchange Commission. The Company does not intend, and does not assume any obligation, toupdate these forward-looking statements and information. Marc Legault, a Qualified Person and the Company’s Senior Vice-President,Project Evaluations, reviewed the technical information disclosed herein. For a detailed breakdown of the Company’s reserve and resourceposition see the February 15, 2012 press release on the Company’s website. That press release also lists the Qualified Persons for eachproject.
2

Notes To Investors
Note Regarding The Use Of Non-GAAP Financial Measures
This document presents estimates of future "total cash cost per ounce" and "minesite cost per tonne" that are not recognized measuresunder United States generally accepted accounting principles ("US GAAP") This data may not be comparable to data presented by otherunder United States generally accepted accounting principles ( US GAAP ). This data may not be comparable to data presented by othergold producers. These future estimates are based upon the total cash costs per ounce and minesite costs per tonne that the Companyexpects to incur to mine gold at the applicable projects and do not include production costs attributable to accretion expense and otherasset retirement costs, which will vary over time as each project is developed and mined. It is therefore not practicable to reconcile theseforward-looking non-GAAP financial measures to the most comparable GAAP measure. A reconciliation of the Company's total cash costper ounce and minesite cost per tonne to the most comparable financial measures calculated and presented in accordance with US GAAPfor the Company's historical results of operations is set forth in the notes to the financial statements included in the Company's Annualp y p p yInformation Form and Annual Report on Form 20-F, for the year ended December 31, 2011, as well as the Company's other filings with theCanadian Securities Administrators and the SEC.
Note Regarding Production Guidance
The gold production guidance is based on the Company’s mineral reserves but includes contingencies and assumes metal prices andf i h t th t diff t f th d i th ti t Th f t d th th t th ld d tiforeign exchange rates that are different from those used in the reserve estimates. These factors and others mean that the gold productionguidance presented in this disclosure does not reconcile exactly with the production models used to support these mineral reserves.
3
AEM Today
Million ounce gold producer with 55 years of operating historyhistory
Focused on delivering total shareholder return
Lower risk: Mature operations Low political risk jurisdictions Measured production growth Free cash flow generator
Committed to dividends - 30 consecutive years
4

AEM StrategyD li i f l h th i ti d fi i l t iDeliver meaningful per share growth in operating and financial metrics
Grow gold reserves and production in mining friendly regionsregions
Be a low-cost leader G l i t b k i t th i d t ’ l t t til Goal is to move back into the industry’s lowest cost quartile
Acquire small, think big Buy early, add value through exploration and mine building
Maintain a solid financial position $1.2 B of available bank lines Only 171 M shares outstanding after 55 years of operating history
5

Financial Results
Strong earnings and cash flow continue to strengthen balance sheet
Investment grade credit rating
New long-term bond adds to financial flexibility Average tenure: 11 years @ 4 94% Average tenure: 11 years @ 4.94%
YTD 2012 YTD 2012 Total Operating Margin - $498MGold(ounces in thousands)
520
Revenues frommining operations (millions)
$932
Laronde19%
Lapa11%
Kittila16%
Net income (millions)
$122
Net income per share (basic)
$0.71
Cash provided by operating
16%
MeadowbankCash provided by operating activities (millions)
$391Pinos Altos
30%
Meadowbank24%
6

Generating Net Free Cash FlowC h fl t f d di id d d th lCash flow to fund dividend and growth plans
Capital Expenditures (USD $000's)
$1,000,000
$1,200,000Approximate Average EBITDA*
$600,000
$800,000
Illustrative OngoingRe-Investment
$400,000
$0
$200,000
2007A 2008A 2009A 2010A 2011A 2012E 2013 2014
Actual Estimate
7* Approximate average EBITDA (Earnings Before Interest, Taxes, Depreciation and Amortization) estimate for illustrative purposes using $1700/oz gold, $32/oz silver, $2000/t zinc, C$/US$ 1.00, 1.35USD/€
Operations and Projects

LaRondeT iti t l i ti t b h ll iTransition to lower mine continues to be challenging YTD gold production of 83,487
oz at total cash costs of $489 P&P GOLD RESERVES (million oz) 4.7
per ounce
Q2 gold grade 2.4 g/t vs. 1.6 g/t in Q2’11
AVERAGE GOLD RESERVE GRADE (g/t) 4.4
Indicated resource (million oz) 0.4
Ramp up slower than expected due to heat, congestion and seismicity
V l f t
Inferred resource (million oz) 1.3
Estimated LOM (years) 15
2012 exploration budget $1M Value of ore per tonneapproximately 50% higher over life of mine versus 2011 at same metals prices
(LaRonde & regional) $1M
See AEM Feb 15, 2012 press release for detailed breakdown of reserves and resources.
9
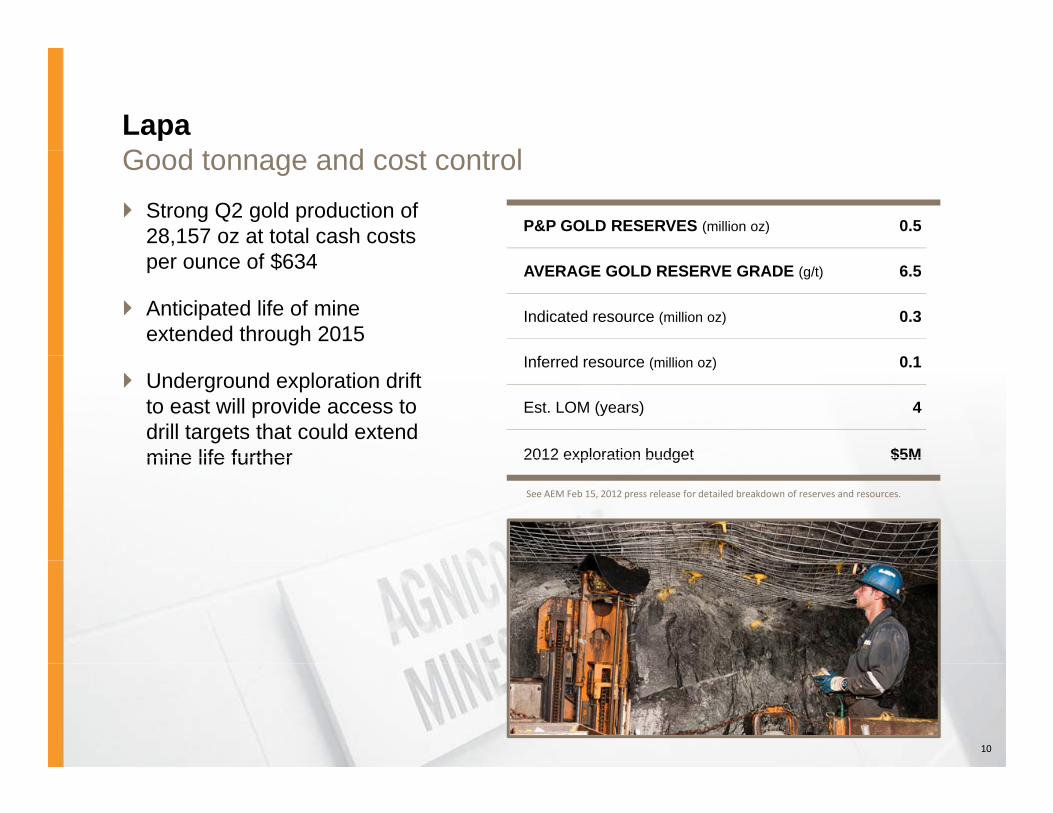
LapaG d t d t t lGood tonnage and cost control Strong Q2 gold production of
28,157 oz at total cash costs $
P&P GOLD RESERVES (million oz) 0.5
per ounce of $634
Anticipated life of mine extended through 2015
AVERAGE GOLD RESERVE GRADE (g/t) 6.5
Indicated resource (million oz) 0.3
Underground exploration drift to east will provide access to drill targets that could extend mine life further
Inferred resource (million oz) 0.1
Est. LOM (years) 4
2012 exploration budget $5Mmine life further 2012 exploration budget $5M
See AEM Feb 15, 2012 press release for detailed breakdown of reserves and resources.
10

KittilaL l lif ld d it ti tLarge long-life gold deposit continues to grow YTD gold production of 81,986oz
at total cash costs of $615 per P&P GOLD RESERVES (million oz) 5.2
ounce
Initial 25% expansion study expected near year end
AVERAGE GOLD RESERVE GRADE (g/t) 4.7
Indicated resource (million oz) 1.0
Good exploration results at Rimpi suggest potential for ongoing phased expansions
Inferred resource (million oz) 1.2
Estimated LOM (years) 32
2012 exploration budget $16M2012 exploration budget $16M
See AEM Feb 15, 2012 press release for detailed breakdown of reserves and resources.
2006
2012Focus Area
2007 – 2008
11
Focus Area
2009 – 2010 2011

Kittila – AEM’s Largest Gold Deposit
Still open for exploration at depth and to the North 2011 exploration expanded reserves and resources in Roura and Rimpi trends $16M in exploration up to 12 drills in 2012 $16M in exploration, up to 12 drills in 2012
2012 Focus Area
12

Mexico – (Pinos Altos & Creston Mascota)L t h fl t d i d ti bLargest cash flow generator and growing production base Record production in Q2 of
63,356 oz at total cash costs $
P&P GOLD RESERVES (million oz) 3.1
per ounce of $358
H1 mine operating margin -$149 M
AVERAGE GOLD RESERVE GRADE (g/t) 2.1
Indicated resource (million oz) 0.8
Drilling program focused on satellite deposits
Inferred resource (million oz) 0.8
Estimated LOM (years) 18
2012 exploration budget $6M2012 exploration budget $6M
See AEM Feb 15, 2012 press release for detailed breakdown of reserves and resources.
$100M Cash Operating Profit
$40M
$60M
$80M
13
$0M
$20M
Q2 11 Q3 11 Q4 11 Q1 12 Q2 12

La India C i l P d ti E t d i H2 2014Commercial Production Expected in H2 2014
P&P GOLD RESERVES (million oz)(45 M tonnes @ 0.7g/t)
0.9
AVERAGE GOLD RESERVE GRADE ( /t) 0 7AVERAGE GOLD RESERVE GRADE (g/t) 0.7
Indicated resource (million oz)(27 M tonnes @ 0.5g/t)
0.4
Inferred resource (million oz)(103 M tonnes @ 0.3g/t)
1.1
Est. LOM (years) 8Note: La India reserves and resource estimate is as of June 30, 2012, disclosed in AEM September 4, 2012 press release.
Annual gold production of approx. 90 koz @ average total cash costs ofkoz @ average total cash costs of approx. $500/oz
Open pit, heap leach mine, with stripping ratio of 1:1pp g
Total construction capital costs of $158M
After tax internal rate of return 31%*
14* Assumes $1379/oz gold, $26.49/oz silver, 13.00 MXP per USD
After-tax internal rate of return – 31%*

MeadowbankN l i k i l hitti t tNew lower risk mine plan hitting targets
Record gold production in Q2 of 98,403 oz at total cash costs per
P&P GOLD RESERVES (million oz) 2.2
G GO S G98,403 oz at total cash costs per ounce of $804;
H1 operating margin of $121M
AVERAGE GOLD RESERVE GRADE (g/t) 2.8
Indicated resource (million oz) 1.3
Inferred resource (million oz) 0.5
Focus has shifted to optimization and extending mine life
Est. LOM (years) 6
2012 exploration budget $7M
See AEM Feb 15, 2012 press release for detailed breakdown of reserves and resources.
$60M
$70M
$80M
9,000tpd
10,000tpd
Daily Throughput & Cash Operating Profit
$10M
$20M
$30M
$40M
$50M
$60M
5,000tpd
6,000tpd
7,000tpd
8,000tpd
15
$0M
$10M
4,000tpd
, p
Q2 11 Q3 11 Q4 11 Q1 12 Q2 12Daily Throughput (t/d) Cash Operating Profit

MeliadineP itti d d t ti dPermitting and road construction underway Updated feasibility study expected
in late 2013 P&P GOLD RESERVES (million oz) 2.9
Exploration success at Wesmeg, Normeg improving open pit and underground production scenarios
AVERAGE GOLD RESERVE GRADE (g/t) 7.2
Indicated resource (million oz) 1.7
Recent exploration results at Pump, F Zone and Wesmegexpected to add meaningful reserve and resource ounces
Inferred resource (million oz) 2.4
2012 exploration budget $30M
See AEM Feb 15, 2012 press release for detailed breakdown of reserves and resources.reserve and resource ounces at year-end
16
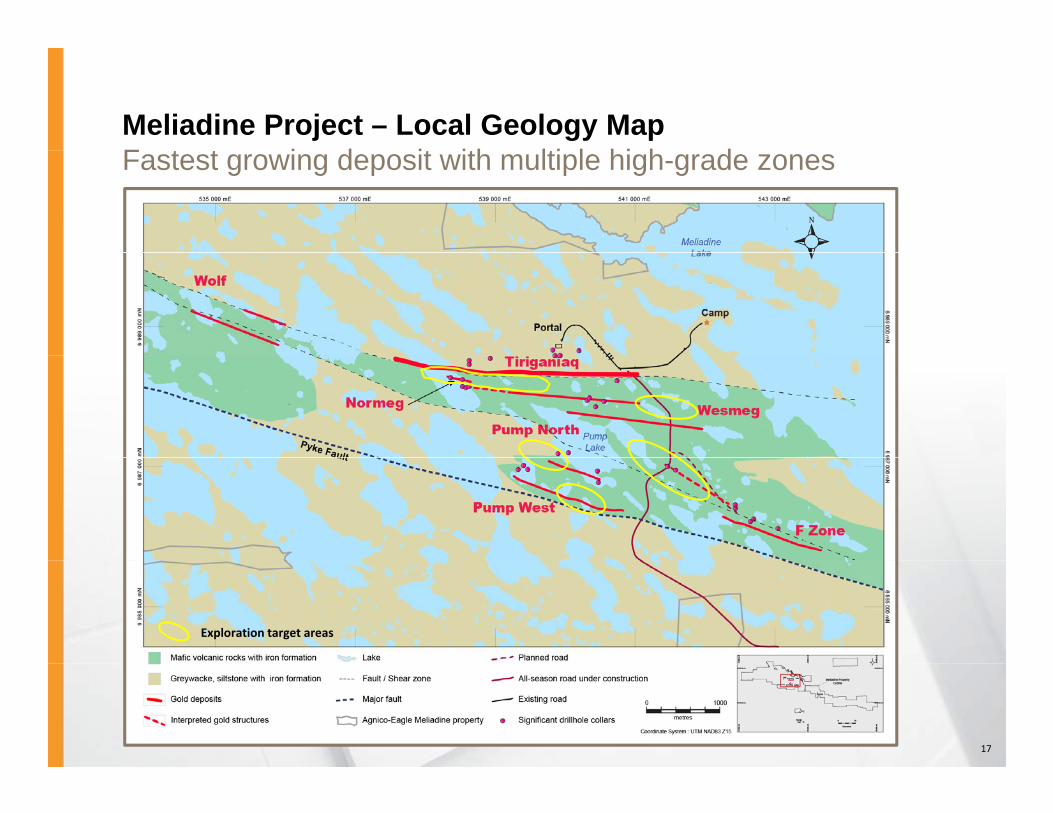
Meliadine Project – Local Geology MapF t t i d it ith lti l hi h dFastest growing deposit with multiple high-grade zones
Exploration target areas
17

Goldex – Commercial Production Expected in Q2 2014GEZ i d dGEZ remains suspended M & E satellite zones have been
approved for construction Measured & Indicated Gold Resource (million oz) 2.1
following extensive review
Preliminary Economic Assessment parameters for M & E ones
Average Measured & Indicated Gold Resource Grade (g/t)
1.8
Inferred resource (million oz) 1.6
Est. LOM (years) 4M & E zones: (y )
2012 exploration budget $18MSee AEM Feb 15, 2012 press release for detailed breakdown of reserves and resources.
Daily Throughput 5,100 tpd
Gold Grade 1.5 g/t
LOM Gold Prod’n to 2017 300,000 oz
Minesite Cost C$41 per tonne
Total Cash Costs $900 per ounce
Life of Mine 4 years
18
Net Free Cash Flow $70 million
Sound Business Continues To Deliver N h i t t fNo change in strategy or focus
AEM is among industry leaders in per share production, reserves, g y p p , ,cash flows and dividends
Meaningful near-term production growth driven by LaRonde, Meadowbank, La India and Goldex, with manageable, fully funded capex
Solid achievable production and cost guidance Solid, achievable production and cost guidance
Expecting growth in reserves through exploration of existing assets
Business generating strong cash flows in regions of low political risk Allocated to dividends, exploration and reinvesting in our core
assets
19

Appendix
20

Operating Metrics
$120/t
$140/t
7,000tpd
7,500tpd
LaRonde - Ore milled ('000 tonnes)LaRonde - Minesite costs per tonne (C$)LaRonde
$20/t
$40/t
$60/t
$80/t
$100/t
4,500tpd
5,000tpd
5,500tpd
6,000tpd
6,500tpd
$0/t4,000tpdQ3 10 Q4 10 Q1 11 Q2 11 Q3 11 Q4 11 Q1 12 Q2 12
$170/t2,000tpd
Lapa - Ore milled ('000 tonnes)
Lapa - Minesite costs per tonne (C$)Lapa
$110/t
$130/t
$150/t
1,000tpd
1,200tpd
1,400tpd
1,600tpd
1,800tpd
$50/t
$70/t
$90/t
0tpd
200tpd
400tpd
600tpd
800tpd
pQ3 10 Q4 10 Q1 11 Q2 11 Q3 11 Q4 11 Q1 12 Q2 12
21

Operating Metrics
€75/t€80/t€85/t
3,000tpd
3,500tpd
Kittila - Ore milled('000 tonnes)Kittila - Minesite costs per tonne (EUR)Kittila
€45/t€50/t€55/t€60/t€65/t€70/t
500tpd
1,000tpd
1,500tpd
2,000tpd
2,500tpd
€40/t0tpdQ3 10 Q4 10 Q1 11 Q2 11 Q3 11 Q4 11 Q1 12 Q2 12
$140/t12,000tpdPinos Altos Meadowbank
$60/t6,000tpd
$80/t
$100/t
$120/t
6,000tpd
8,000tpd
10,000tpd
$30/t
$40/t
$50/t
3,000tpd
4,000tpd
5,000tpd
$0/t
$20/t
$40/t
$60/t
0tpd
2,000tpd
4,000tpd
$0/t
$10/t
$20/t
0tpd
1,000tpd
2,000tpd
Q3
10
Q4
10
Q1
11
Q2
11
Q3
11
Q4
11
Q1
12
Q2
12
Meadowbank - Ore milled ('000 tonnes)Meadowbank - Minesite costs per tonne (C$)
Q3
10
Q4
10
Q1
11
Q2
11
Q3
11
Q4
11
Q1
12
Q2
12
Pinos Altos - Ore milled ('000 tonnes)Pinos Altos - Minesite costs per tonne (USD$)
22

Gold and Silver Reserves and ResourcesDecember 31, 2011December 31, 2011
GoldTonnes (000’s)
Gold (g/t)
Gold(ounces)
(000’s)Silver
Tonnes (000’s)
Silver (g/t)
Silver(ounces)
(000’s)(000 s)
Proven 11,029 2.80 994
(000 s)
Proven 7,318 45.35 10,670
Probable 146,057 3.78 17,757 Probable 72,693 45.06 105,319
Total Reserves 157,086 3.71 18,750
Measured & 168 336 1 78 9 633
Total Reserves 80,011 45.09 115,989
Measured & 27 801 27 24 24 344Indicated 168,336 1.78 9,633
Inferred 131,216 2.30 9,712
Indicated 27,801 27.24 24,344
Inferred 34,513 19.00 21,082
See AEM Feb 15, 2012 press release for detailed breakdown of reserves and resources. Reserves are not a subset of resources.23

Copper, Zinc and Lead Reserves and ResourcesDecember 31, 2011December 31, 2011
Copper Tonnes (000’s)
Copper(%)
Copper(tonnes) Zinc Tonnes
(000’s)Zinc
(%)Zinc
(tonnes) Lead Tonnes (000’s)
Lead(%)
Lead(tonnes)( ) (%) ( )
Proven 5,331 0.28 15,025
( ) (%) ( )
Proven 5,331 2.04 108,626
( ) (%) ( )
Proven 5,331 0.23 12,391
Probable 27,901 0.27 76,160 Probable 27,901 0.77 215,522 Probable 27,901 0.05 13,441
Total Reserves 33,232 0.27 91,184
I di t d 7 225 0 12 8 629
Total Reserves 33,232 0.98 324,149
I di t d 7 225 1 49 107 338
Total Reserves 33,232 0.08 25,832
I di t d 7 225 0 15 11 127Indicated 7,225 0.12 8,629
Inferred 11,400 0.26 29,664
Indicated 7,225 1.49 107,338
Inferred 11,400 0.44 49,745
Indicated 7,225 0.15 11,127
Inferred 11,400 0.05 5,138
See AEM Feb 15, 2012 press release for detailed breakdown of reserves and resources. Reserves are not a subset of resources 24

Notes to Investors Regarding the Use of Resources
Cautionary Note to Investors Concerning Estimates of Measured and Indicated Resources
This document uses the terms "measured resources" and "indicated resources". We advise investors that while those terms are recognized and requiredby Canadian regulations, the SEC does not recognize them. Investors are cautioned not to assume that any part or all of mineral deposits in thesey g , g y p pcategories will ever be converted into reserves.
Cautionary Note to Investors Concerning Estimates of Inferred Resources
This document also uses the term "inferred resources". We advise investors that while this term is recognized and required by Canadian regulations, theSEC does not recognize it. "Inferred resources" have a great amount of uncertainty as to their existence, and great uncertainty as to their economic andlegal feasibility. It cannot be assumed that all or any part of an inferred mineral resource will ever be upgraded to a higher category. Under Canadian rules,estimates of inferred mineral resources may not form the basis of feasibility or pre-feasibility studies, except in rare cases. Investors are cautioned not toassume that part or all of an inferred resource exists, or is economically or legally mineable.
Scientific and Technical Data
Agnico-Eagle Mines Limited is reporting mineral resource and reserve estimates in accordance with the CIM guidelines for the estimation, classification andreporting of resources and reserves.
Cautionary Note To U.S. Investors - The SEC permits U.S. mining companies, in their filings with the SEC, to disclose only those mineral deposits that acompany can economically and legally extract or produce. Agnico-Eagle uses certain terms in this press release, such as “measured”, “indicated”, and“inferred”, and “resources” that the SEC guidelines strictly prohibit U.S. registered companies from including in their filings with the SEC. U.S. investors areurged to consider closely the disclosure in our Form 20-F, which may be obtained from us, or from the SEC’s website at: http://sec.gov/edgar.shtml. A“final” or “bankable” feasibility study is required to meet the requirements to designate reserves under Industry Guide 7.
E ti t f ll ti l l t d i hi t i th t l i d f i h t i d ith th SECEstimates for all properties were calculated using historic three-year average metals prices and foreign exchange rates in accordance with the SECIndustry Guide 7. Industry Guide 7 requires the use of prices that reflect current economic conditions at the time of reserve determination, which the Staffof the SEC has interpreted to mean historic three-year average prices. The assumptions used for the mineral reserves and resources estimates reportedby the Company on February 15, 2012 were based on three-year average prices for the period ending December 31, 2011 of $1,255 per ounce gold,$23.00 per ounce silver, $0.91 per pound zinc, $3.25 per pound copper, $0.95 per pound lead and C$/US$, US$/Euro and MXP/US$ exchange rates of1.05, 1.37 and 12.86, respectively. The assumptions used for the La India reserves estimate reported in the Company’s September 4, 2012 press releasewere based on three-year average prices for the period ending June 30, 2012 of $1,379 per ounce gold, $26.49 per ounce silver, and MXP/US$ exchangerate of 13 00rate of 13.00.
The Canadian Securities Administrators’ National Instrument 43-101 (“NI 43-101”) requires mining companies to disclose reserves and resources using thesubcategories of “proven” reserves, “probable” reserves, “measured” resources, “indicated” resources and “inferred” resources. Mineral resources that arenot mineral reserves do not have demonstrated economic viability.
25

Notes to Investors Regarding the Use of Resources
A mineral reserve is the economically mineable part of a measured or indicated mineral resource demonstrated by at least a preliminary feasibility study.This study must include adequate information on mining, processing, metallurgical, economic and other relevant factors that demonstrate, at the time ofreporting, that economic extraction can be justified. A mineral reserve includes diluting materials and allows for losses that may occur when the material ismined. A proven mineral reserve is the economically mineable part of a measured mineral resource demonstrated by at least a preliminary feasibility study.A probable mineral reserve is the economically mineable part of an indicated, and in some circumstances, a measured mineral resource demonstrated byat least a preliminary feasibility studyat least a preliminary feasibility study.
A mineral resource is a concentration or occurrence of natural, solid, inorganic material, or natural solid fossilized organic material including base andprecious metals in or on the Earth’s crust in such form and quantity and of such a grade or quality that it has reasonable prospects for economic extraction.The location, quantity, grade, geological characteristics and continuity of a mineral resource are known, estimated or interpreted from specific geologicalevidence and knowledge. A measured mineral resource is that part of a mineral resource for which quantity, grade or quality, densities, shape and physicalcharacteristics are so well established that they can be estimated with confidence sufficient to allow the appropriate application of technical and economicparameters, to support production planning and evaluation of the economic viability of the deposit. The estimate is based on detailed and reliableexploration, sampling and testing information gathered through appropriate techniques from locations such as outcrops, trenches, pits, workings and drillholes that are spaced closely enough to confirm both geological and grade continuity. An indicated mineral resource is that part of a mineral resource forwhich quantity, grade or quality, densities, shape and physical characteristics can be estimated with a level of confidence sufficient to allow the appropriateapplication of technical and economic parameters, to support mine planning and evaluation of the economic viability of the deposit. The estimate is basedon detailed and reliable exploration and testing information gathered through appropriate techniques from locations such as outcrops, trenches, pits,workings and drill holes that are spaced closely enough for geological and grade continuity to be reasonably assumed. An inferred mineral resource is thatpart of a mineral resource for which quantity and grade or quality can be estimated on the basis of geological evidence and limited sampling andreasonably assumed, but not verified, geological and grade continuity. The estimate is based on limited information and sampling gathered throughy , , g g g y p g g gappropriate techniques from locations such as outcrops, trenches, pits, workings and drill holes. Mineral resources which are not mineral reserves do nothave demonstrated economic viability.
Investors are cautioned not to assume that part or all of an inferred resource exists, or is economically or legally mineable.
A Feasibility Study is a comprehensive technical and economic study of the selected development option for a mineral project that includes appropriatelydetailed assessments of realistically assumed mining, processing, metallurgical, economic, marketing, legal, environmental, social and governmentalconsiderations together with any other relevant operational factors and detailed financial analysis that are necessary to demonstrate at the time ofconsiderations together with any other relevant operational factors and detailed financial analysis, that are necessary to demonstrate at the time ofreporting that extraction is reasonably justified (economically mineable). The results of the study may reasonably serve as the basis for a final decision by aproponent or financial institution to proceed with, or finance, the development of the project. The confidence level of the study will be higher than that of aPre-Feasibility Study.
The effective date for all of the Company’s mineral resource and reserve estimates in this document is December 31, 2011. The effective date for the newLa India reserves and resources estimates in this document is June 30, 2012. Additional information about each of the mineral projects that is required byNI 43-101, sections 3.2 and 3.3 and paragraphs 3.4 (a), (c) and (d) can be found in Technical Reports, which may be found at www.sedar.com. Otheri t t ti i f ti b f d i th C ’ F 20 F d it l d t d F b 15 2012 d S t b 4 2012important operating information can be found in the Company’s Form 20-F and its news releases dated February 15, 2012 and September 4, 2012.
Marc Legault, a Qualified Person and the Company’s Senior Vice-President, Project Evaluations, reviewed the technical information disclosed herein.Alain Blackburn, a Qualified Person and the Company’s Senior Vice-President, Exploration, reviewed the technical information regarding the La India mineproject disclosed herein.
26
A solid financial position, low-cost structure, well-funded growth projects in regions of low political risk, and a focused, consistent strategy put Agnico-Eagle in a strong position to continue creating exceptional per share value.
Sean BoydPresident and Chief Executive Officer
Executive and Registered Office:145 King Street East, Suite 400Toronto, Ontario, Canada, M5C 2Y7Tel: 416‐947‐1212David Smith
SVP, Strategic Planning & Investor Relations
Trading Symbol: AEM on TSX & NYSE
I t R l ti
Tel: 416 947 1212Toll‐Free: 888‐822‐6714 Fax: 416‐367‐4681
Investor Relations:416‐947‐1212info@agnico‐eagle.com
agnico-eagle.com