aem april 2012 corporate update
TRANSCRIPT
AGNICO-EAGLE MINES LIMITED
Corporate Update
April 2012
Forward Looking Statements
2
The information in this document has been prepared as at April 17, 2012. Certain statements contained in this document constitute “forward-looking statements” within the meaning of the United States Private Securities Litigation Reform Act of 1995 and forward looking information under the provisions of Canadian provincial securities laws. When used in this document, the words “anticipate”, “expect”, “estimate”, “forecast”, “will”, “planned”, and similar expressions are intended to identify forward-looking statements or information.
Such statements include without limitation: statements regarding timing and amounts of capital expenditures and other assumptions; estimates of future reserves, resources, mineral production, optimization efforts and sales; estimates of mine life; estimates of future internal rates of return, mining costs, cash costs, minesite costs and other expenses; estimates of future capital expenditures and other cash needs, and expectations as to the funding thereof; statements and information as to the projected development of certain ore deposits, including estimates of exploration, development and production and other capital costs, and estimates of the timing of such exploration, development and production or decisions with respect to such exploration, development and production; estimates of reserves and resources, and statements and information regarding anticipated future exploration; the anticipated timing of events with respect to the Company's minesites and statements and information regarding the sufficiency of the Company's cash resources. Such statements and information reflect the Company's views as at the date of this document and are subject to certain risks, uncertainties and assumptions, and undue reliance should not be placed on such statements and information. Many factors, known and unknown could cause the actual results to be materially different from those expressed or implied by such forward looking statements and information. Such risks include, but are not limited to: the volatility of prices of gold and other metals; uncertainty of mineral reserves, mineral resources, mineral grades and mineral recovery estimates; uncertainty of future production, capital expenditures, and other costs; currency fluctuations; financing of additional capital requirements; cost of exploration and development programs; mining risks; community protests; risks associated with foreign operations; governmental and environmental regulation; the volatility of the Company's stock price; and risks associated with the Company's byproduct metal derivative strategies. For a more detailed discussion of such risks and other factors that may affect the Company’s ability to achieve the expectations set forth in the forward-looking statements contained in this document, see the Company's Annual Report on Form 20-F for the year ended December 31, 2011, as well as the Company's other filings with the Canadian Securities Administrators and the U.S. Securities and Exchange Commission. The Company does not intend, and does not assume any obligation, to update these forward-looking statements and information. Marc Legault, a Qualified Person and the Company’s Senior Vice-President, Project Development, reviewed the technical information disclosed herein. For a detailed breakdown of the Company’s reserve and resource position see the February 15, 2012 press release on the Company’s website. That press release also lists the Qualified Persons for each project.
Notes To Investors
Note Regarding The Use Of Non-GAAP Financial Measures This document presents estimates of future "total cash cost per ounce" and "minesite cost per tonne" that are not recognized measures under United States generally accepted accounting principles ("US GAAP"). This data may not be comparable to data presented by other gold producers. These future estimates are based upon the total cash costs per ounce and minesite costs per tonne that the Company expects to incur to mine gold at the applicable projects and do not include production costs attributable to accretion expense and other asset retirement costs, which will vary over time as each project is developed and mined. It is therefore not practicable to reconcile these forward-looking non-GAAP financial measures to the most comparable GAAP measure. A reconciliation of the Company's total cash cost per ounce and minesite cost per tonne to the most comparable financial measures calculated and presented in accordance with US GAAP for the Company's historical results of operations is set forth in the notes to the financial statements included in the Company's Annual Information Form and Annual Report on Form 20-F, for the year ended December 31, 2011, as well as the Company's other filings with the Canadian Securities Administrators and the SEC Note Regarding Production Guidance The gold production guidance is based on the Company’s mineral reserves but includes contingencies, assumes metal prices and foreign exchange rates that are different from those used in the reserve estimates. These factors and others mean that the gold production guidance presented in this disclosure does not reconcile exactly with the production models used to support these mineral reserves.
3
Focused Business With No Change In Strategy
Our business is positioned to deliver enhanced leverage to gold through: Reserve Growth – Exploration expected to continue to increase the size of our
large deposits
Production Growth – Gold production expected to increase by 24% from 2011 to 2014 from currently operating mines
Net Free Cash Flow – Construction capital requirements have declined while production and cash flows are expected to grow
Dividend Yield – AEM is one of the industry leaders in dividends per share and dividend yield
4
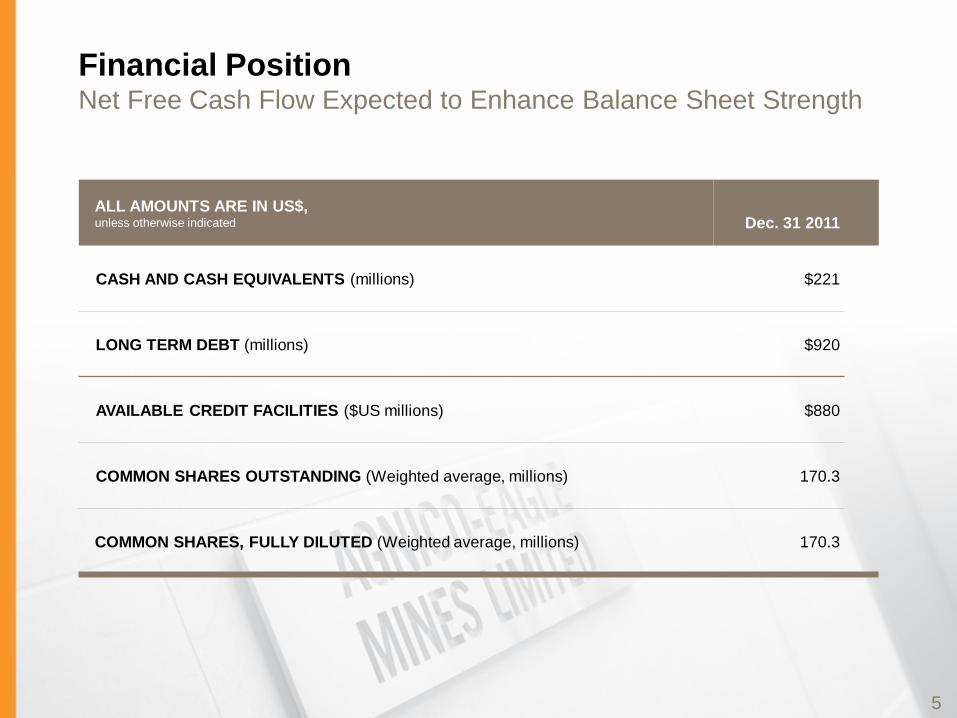
Financial Position Net Free Cash Flow Expected to Enhance Balance Sheet Strength
5
ALL AMOUNTS ARE IN US$, unless otherwise indicated
Dec. 31 2011
CASH AND CASH EQUIVALENTS (millions) $221
LONG TERM DEBT (millions) $920
AVAILABLE CREDIT FACILITIES ($US millions) $880
COMMON SHARES OUTSTANDING (Weighted average, millions) 170.3
COMMON SHARES, FULLY DILUTED (Weighted average, millions) 170.3
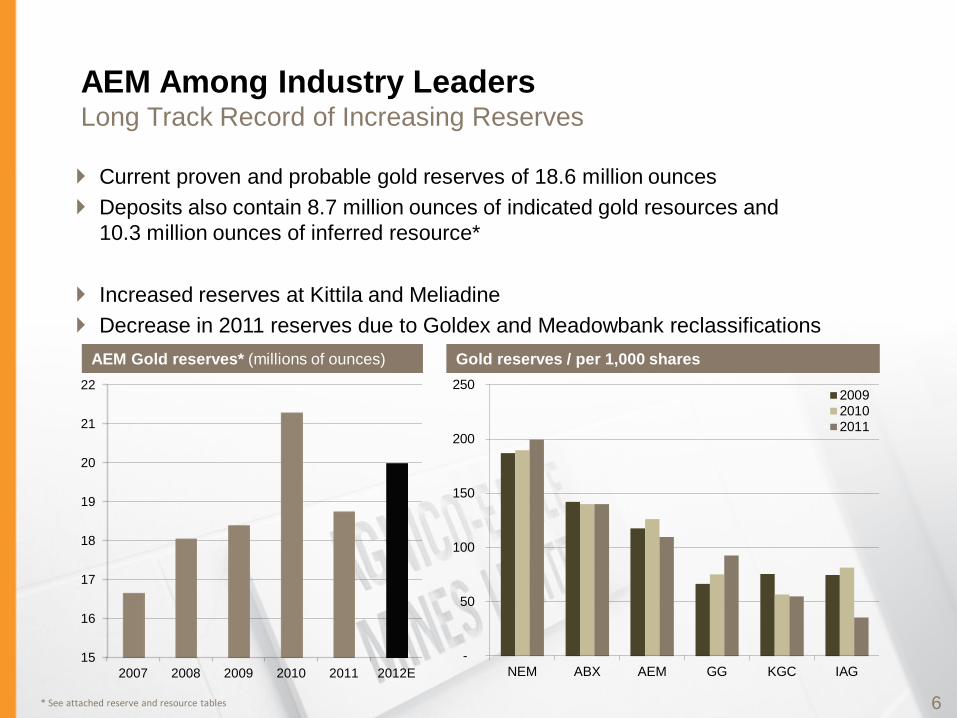
AEM Among Industry Leaders Long Track Record of Increasing Reserves Current proven and probable gold reserves of 18.6 million ounces Deposits also contain 8.7 million ounces of indicated gold resources and
10.3 million ounces of inferred resource*
Increased reserves at Kittila and Meliadine Decrease in 2011 reserves due to Goldex and Meadowbank reclassifications
15
16
17
18
19
20
21
22
2007 2008 2009 2010 2011 2012E
AEM Gold reserves* (millions of ounces)
* See attached reserve and resource tables 6
-
50
100
150
200
250
NEM ABX AEM GG KGC IAG
200920102011
Gold reserves / per 1,000 shares
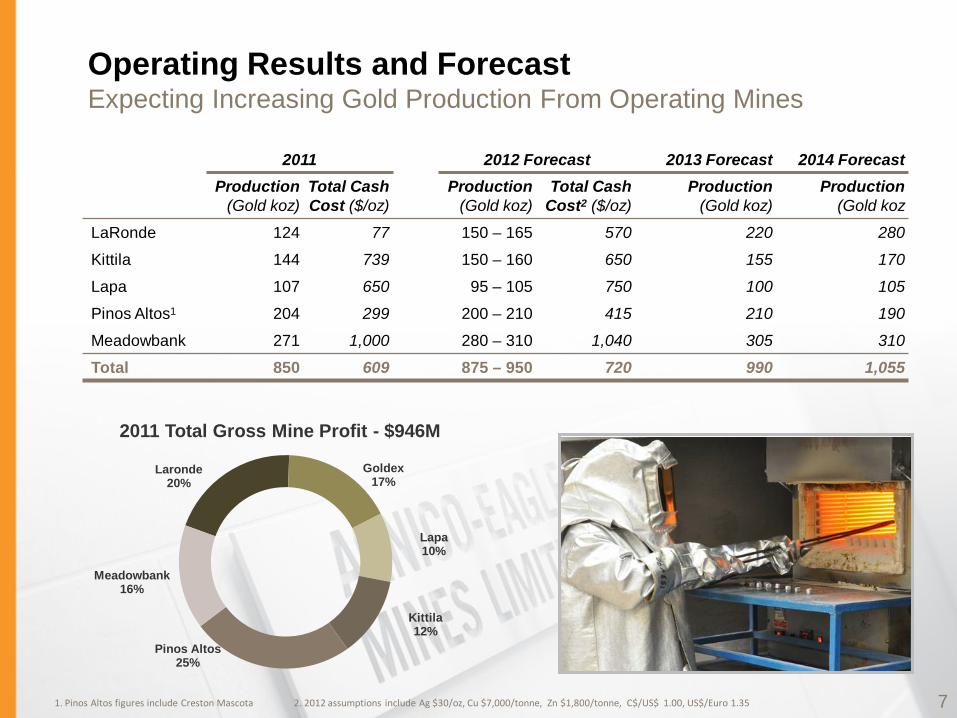
Operating Results and Forecast Expecting Increasing Gold Production From Operating Mines
2011 2012 Forecast 2013 Forecast 2014 Forecast Production
(Gold koz) Total Cash Cost ($/oz)
Production (Gold koz)
Total Cash Cost2 ($/oz)
Production (Gold koz)
Production (Gold koz
LaRonde 124 77 150 – 165 570 220 280
Kittila 144 739 150 – 160 650 155 170
Lapa 107 650 95 – 105 750 100 105
Pinos Altos1 204 299 200 – 210 415 210 190
Meadowbank 271 1,000 280 – 310 1,040 305 310
Total 850 609 875 – 950 720 990 1,055
1. Pinos Altos figures include Creston Mascota 2. 2012 assumptions include Ag $30/oz, Cu $7,000/tonne, Zn $1,800/tonne, C$/US$ 1.00, US$/Euro 1.35 7
Laronde 20%
Goldex 17%
Lapa 10%
Kittila 12%
Pinos Altos 25%
Meadowbank 16%
2011 Total Gross Mine Profit - $946M
8
800,000oz
850,000oz
900,000oz
950,000oz
1,000,000oz
1,050,000oz
1,100,000oz
2012E 2013E 2014E -
2.00
4.00
6.00
8.00
10.00
12.00
14.00
NEM ABX AEM GG IAG KGC
2009201020112012E2013E2014E
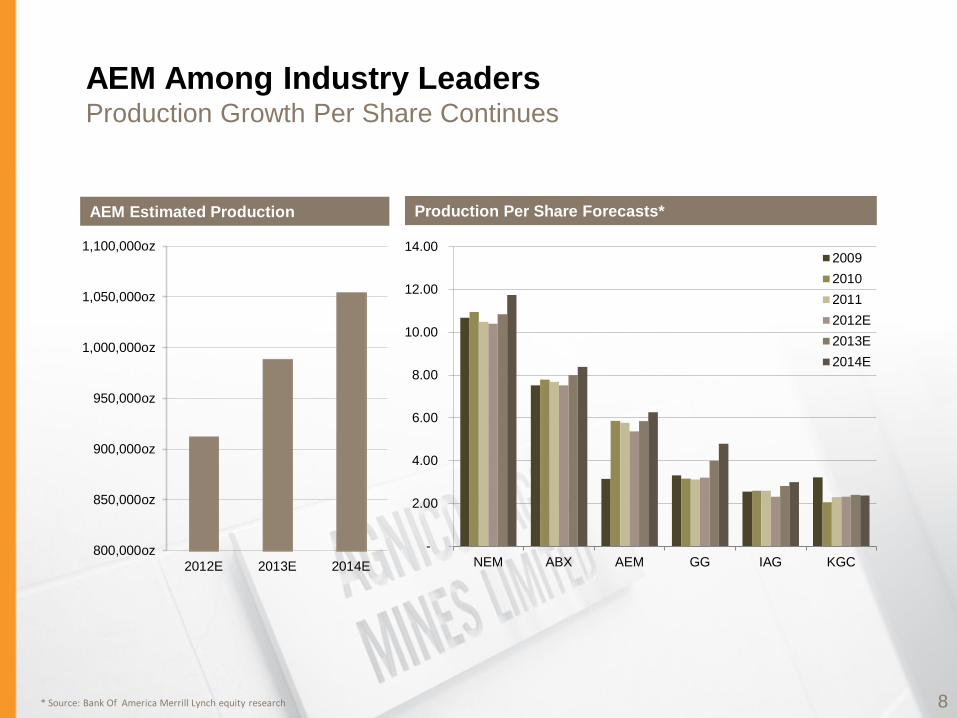
AEM Estimated Production Production Per Share Forecasts*
* Source: Bank Of America Merrill Lynch equity research
AEM Among Industry Leaders Production Growth Per Share Continues
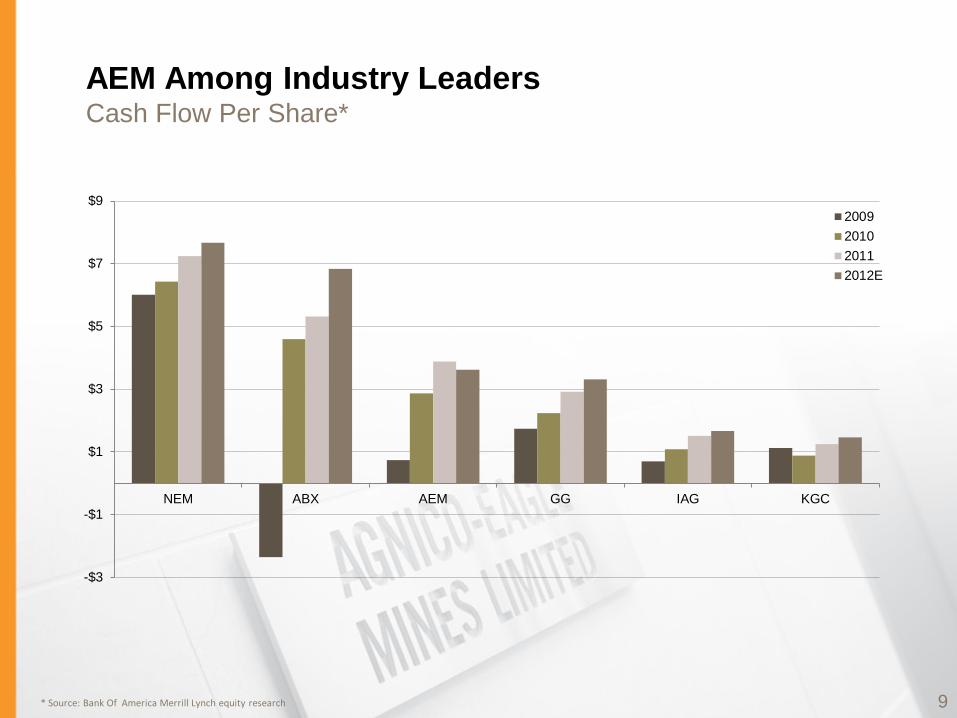
AEM Among Industry Leaders Cash Flow Per Share*
* Source: Bank Of America Merrill Lynch equity research 9
-$3
-$1
$1
$3
$5
$7
$9
NEM ABX AEM GG IAG KGC
2009201020112012E
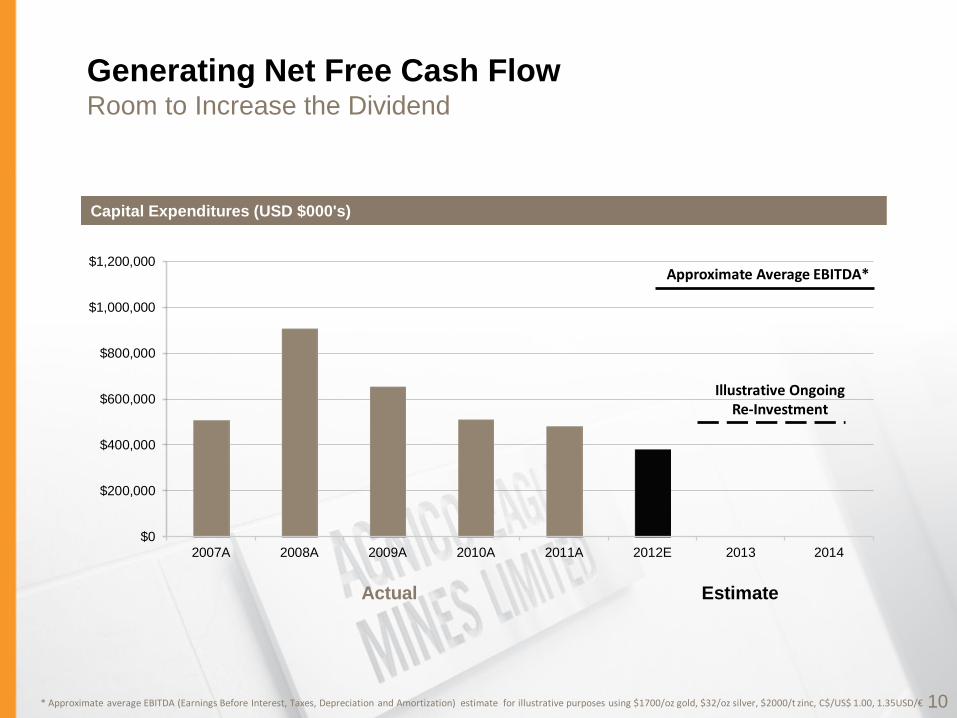
Generating Net Free Cash Flow Room to Increase the Dividend
$0
$200,000
$400,000
$600,000
$800,000
$1,000,000
$1,200,000
2007A 2008A 2009A 2010A 2011A 2012E 2013 2014
Actual Estimate
Approximate Average EBITDA*
* Approximate average EBITDA (Earnings Before Interest, Taxes, Depreciation and Amortization) estimate for illustrative purposes using $1700/oz gold, $32/oz silver, $2000/t zinc, C$/US$ 1.00, 1.35USD/€
Capital Expenditures (USD $000's)
Illustrative Ongoing Re-Investment
10
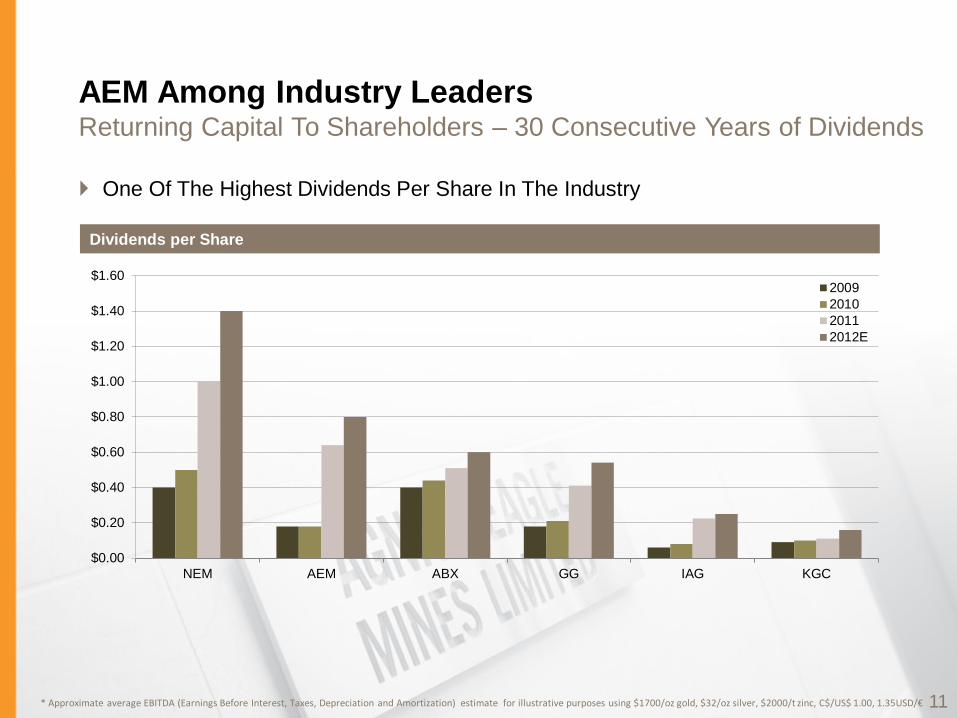
AEM Among Industry Leaders Returning Capital To Shareholders – 30 Consecutive Years of Dividends
* Approximate average EBITDA (Earnings Before Interest, Taxes, Depreciation and Amortization) estimate for illustrative purposes using $1700/oz gold, $32/oz silver, $2000/t zinc, C$/US$ 1.00, 1.35USD/€
Dividends per Share
11
$0.00
$0.20
$0.40
$0.60
$0.80
$1.00
$1.20
$1.40
$1.60
NEM AEM ABX GG IAG KGC
2009201020112012E
One Of The Highest Dividends Per Share In The Industry
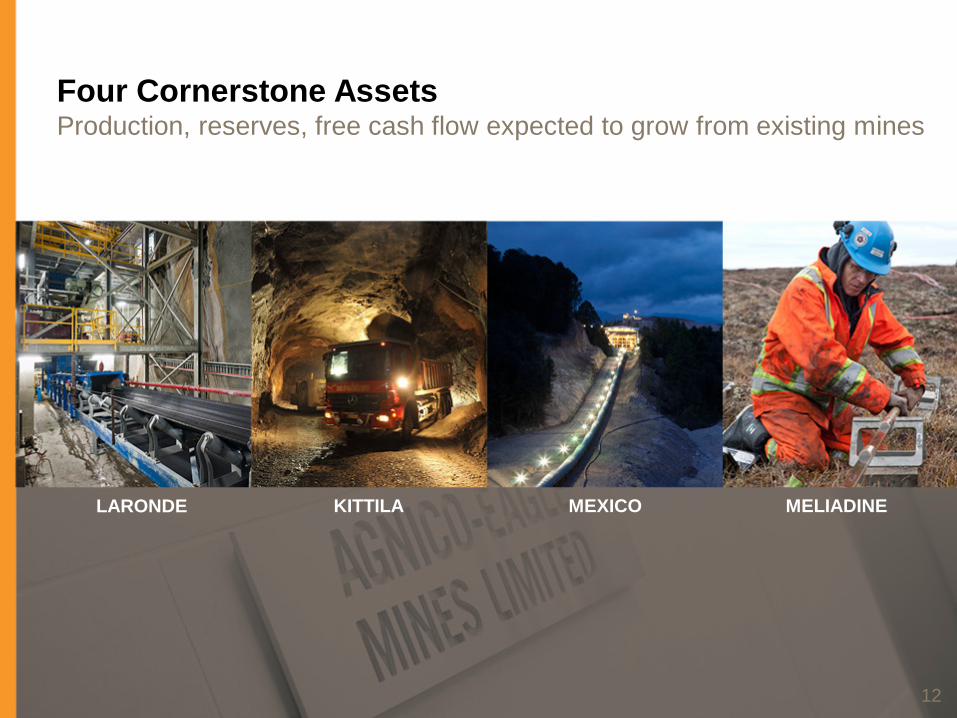
Four Cornerstone Assets Production, reserves, free cash flow expected to grow from existing mines
12
LARONDE KITTILA MEXICO MELIADINE
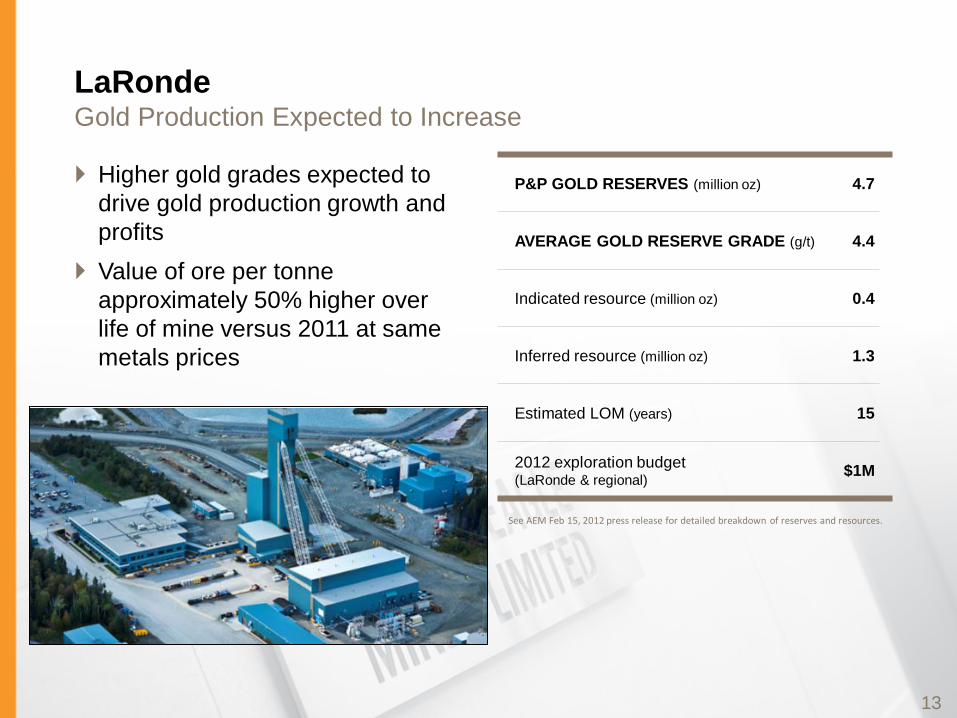
LaRonde Gold Production Expected to Increase
Higher gold grades expected to drive gold production growth and profits
Value of ore per tonne approximately 50% higher over life of mine versus 2011 at same metals prices
13
P&P GOLD RESERVES (million oz) 4.7
AVERAGE GOLD RESERVE GRADE (g/t) 4.4
Indicated resource (million oz) 0.4
Inferred resource (million oz) 1.3
Estimated LOM (years) 15
2012 exploration budget (LaRonde & regional) $1M
See AEM Feb 15, 2012 press release for detailed breakdown of reserves and resources.
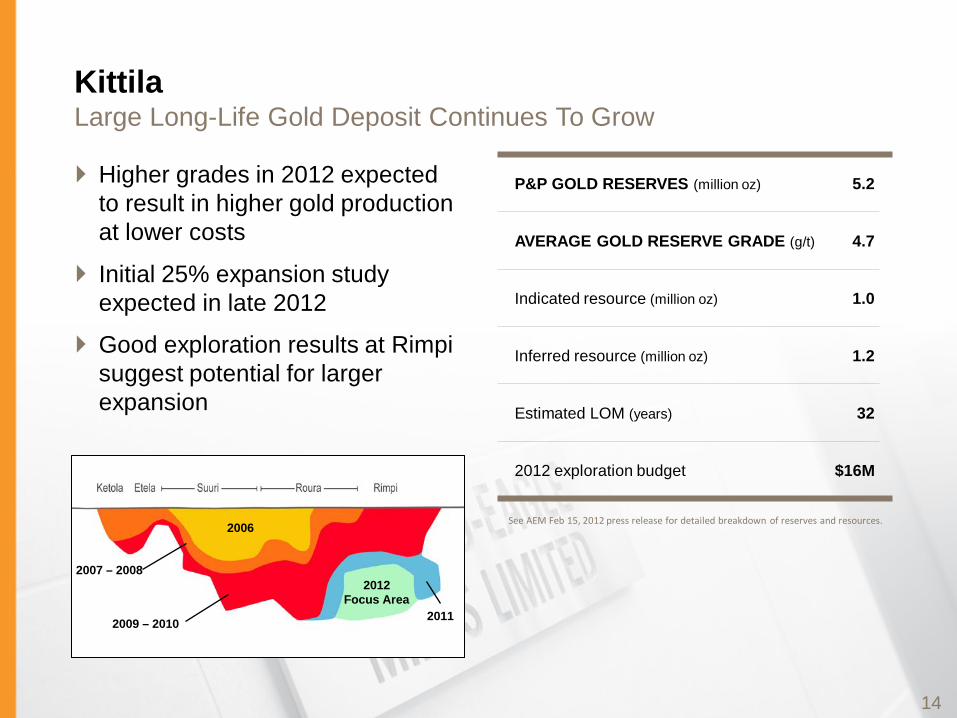
Kittila Large Long-Life Gold Deposit Continues To Grow
Higher grades in 2012 expected to result in higher gold production at lower costs
Initial 25% expansion study expected in late 2012
Good exploration results at Rimpi suggest potential for larger expansion
14
2007 – 2008
2006
2009 – 2010 2011
2012 Focus Area
P&P GOLD RESERVES (million oz) 5.2
AVERAGE GOLD RESERVE GRADE (g/t) 4.7
Indicated resource (million oz) 1.0
Inferred resource (million oz) 1.2
Estimated LOM (years) 32
2012 exploration budget $16M
See AEM Feb 15, 2012 press release for detailed breakdown of reserves and resources.
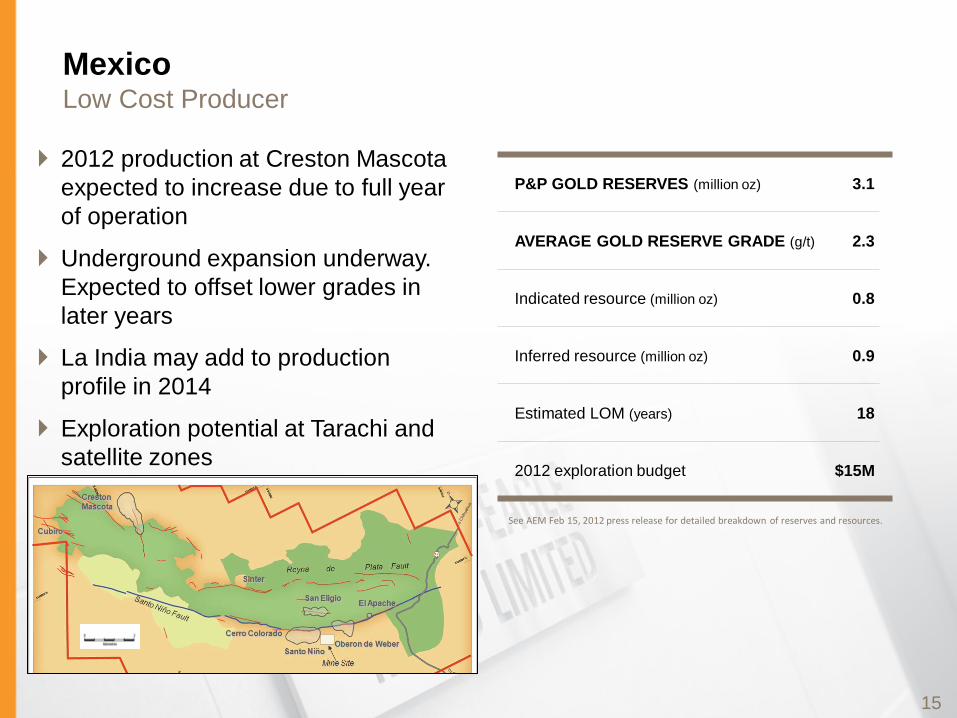
Mexico Low Cost Producer
2012 production at Creston Mascota expected to increase due to full year of operation
Underground expansion underway. Expected to offset lower grades in later years
La India may add to production profile in 2014
Exploration potential at Tarachi and satellite zones
15
P&P GOLD RESERVES (million oz) 3.1
AVERAGE GOLD RESERVE GRADE (g/t) 2.3
Indicated resource (million oz) 0.8
Inferred resource (million oz) 0.9
Estimated LOM (years) 18
2012 exploration budget $15M
See AEM Feb 15, 2012 press release for detailed breakdown of reserves and resources.
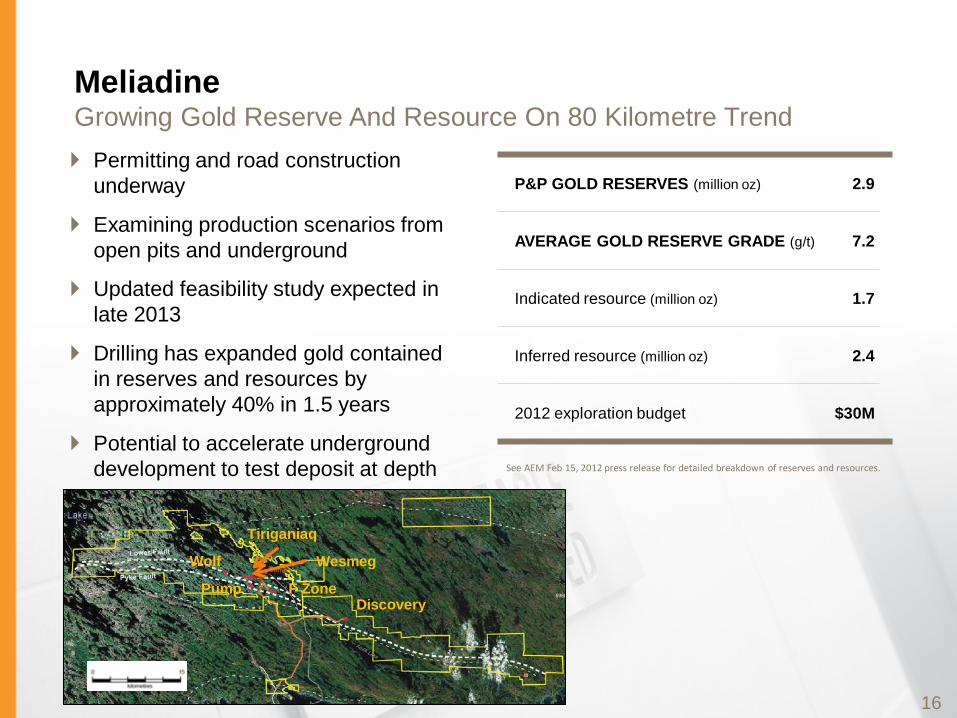
Meliadine Growing Gold Reserve And Resource On 80 Kilometre Trend Permitting and road construction
underway
Examining production scenarios from open pits and underground
Updated feasibility study expected in late 2013
Drilling has expanded gold contained in reserves and resources by approximately 40% in 1.5 years
Potential to accelerate underground development to test deposit at depth
16
Wolf
Pump F Zone
Tiriganiaq
Wesmeg
Discovery
P&P GOLD RESERVES (million oz) 2.9
AVERAGE GOLD RESERVE GRADE (g/t) 7.2
Indicated resource (million oz) 1.7
Inferred resource (million oz) 2.4
2012 exploration budget $30M
See AEM Feb 15, 2012 press release for detailed breakdown of reserves and resources.
17
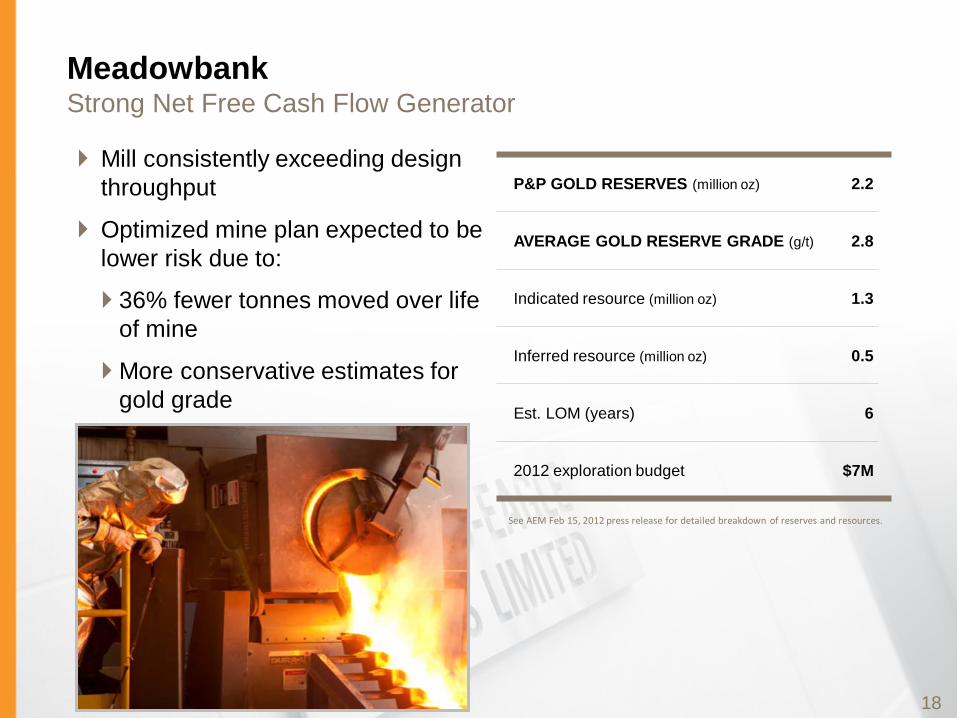
Meadowbank Strong Net Free Cash Flow Generator
Mill consistently exceeding design throughput
Optimized mine plan expected to be lower risk due to:
36% fewer tonnes moved over life of mine
More conservative estimates for gold grade
18
P&P GOLD RESERVES (million oz) 2.2
AVERAGE GOLD RESERVE GRADE (g/t) 2.8
Indicated resource (million oz) 1.3
Inferred resource (million oz) 0.5
Est. LOM (years) 6
2012 exploration budget $7M
See AEM Feb 15, 2012 press release for detailed breakdown of reserves and resources.
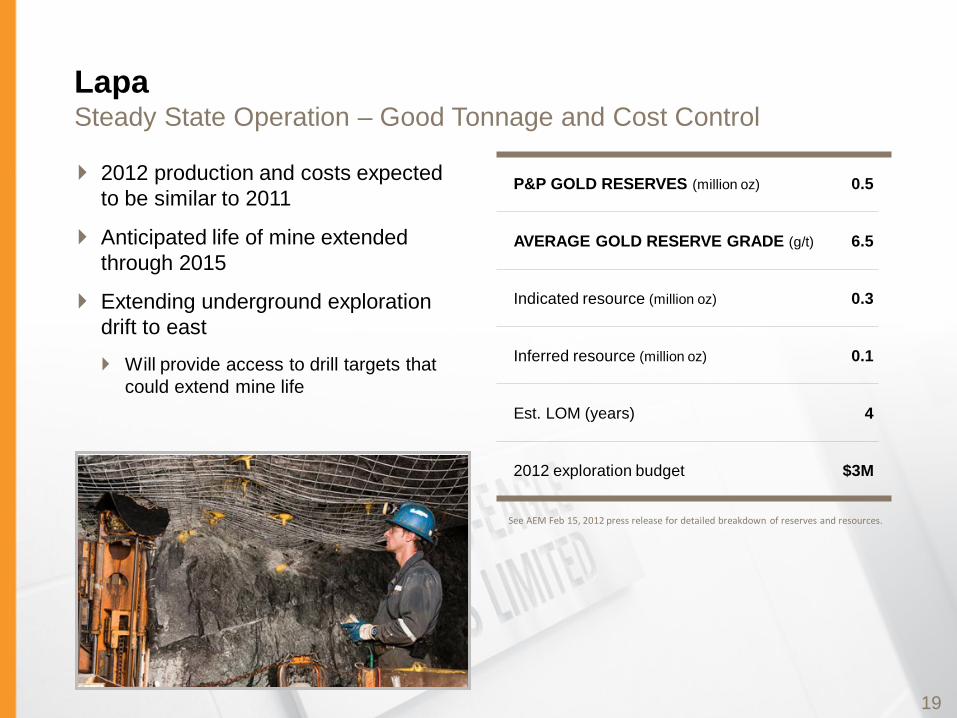
Lapa Steady State Operation – Good Tonnage and Cost Control
2012 production and costs expected to be similar to 2011
Anticipated life of mine extended through 2015
Extending underground exploration drift to east
Will provide access to drill targets that could extend mine life
19
P&P GOLD RESERVES (million oz) 0.5
AVERAGE GOLD RESERVE GRADE (g/t) 6.5
Indicated resource (million oz) 0.3
Inferred resource (million oz) 0.1
Est. LOM (years) 4
2012 exploration budget $3M
See AEM Feb 15, 2012 press release for detailed breakdown of reserves and resources.
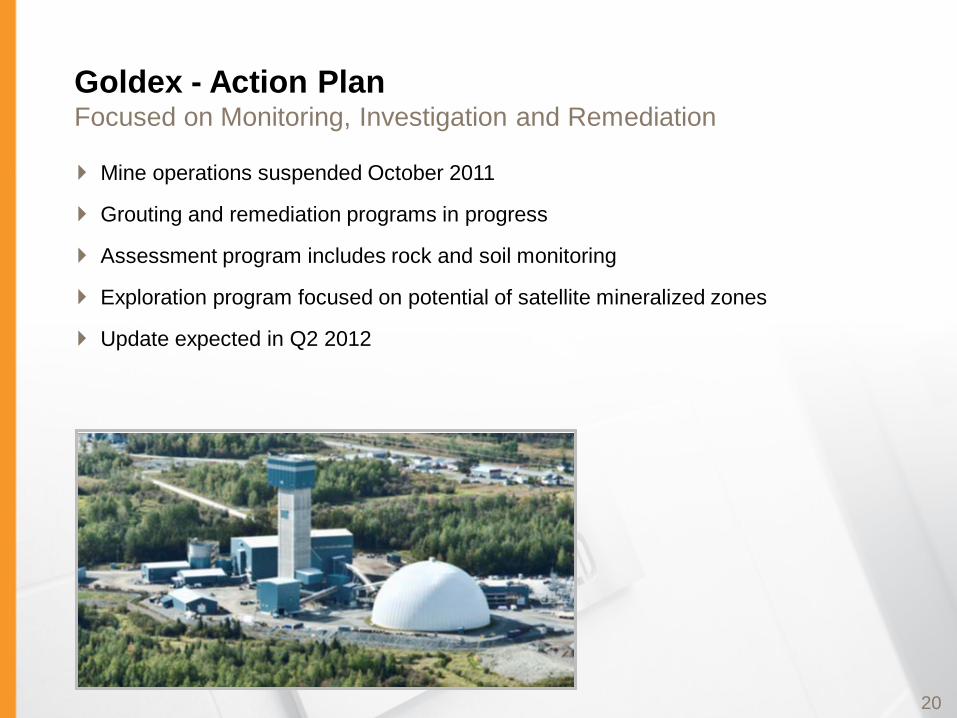
Goldex - Action Plan Focused on Monitoring, Investigation and Remediation
Mine operations suspended October 2011
Grouting and remediation programs in progress
Assessment program includes rock and soil monitoring
Exploration program focused on potential of satellite mineralized zones
Update expected in Q2 2012
20
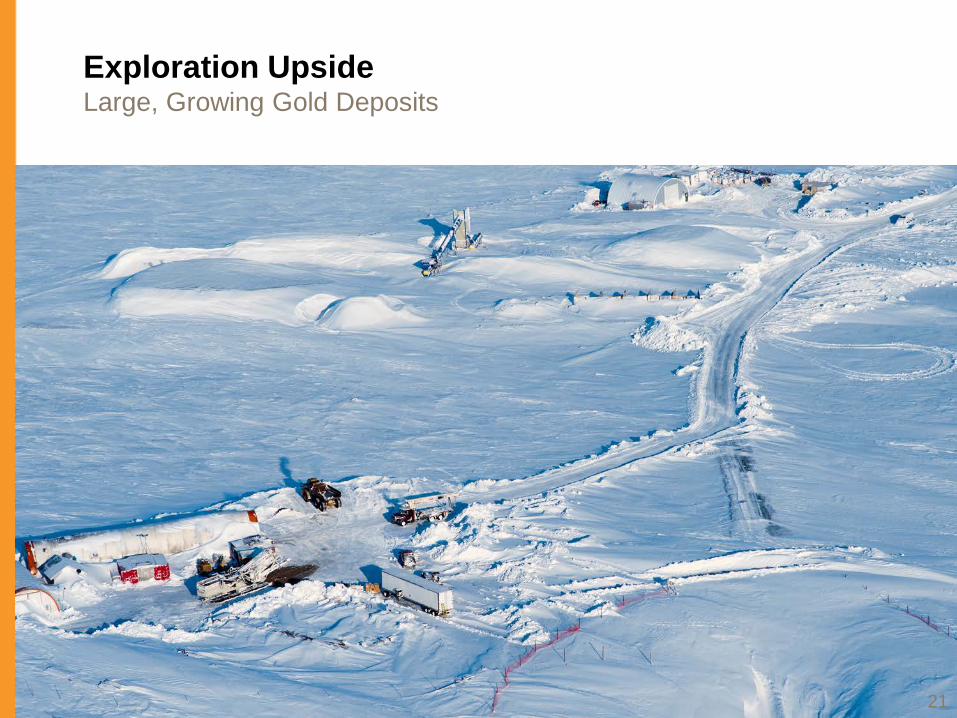
Exploration Upside Large, Growing Gold Deposits
21
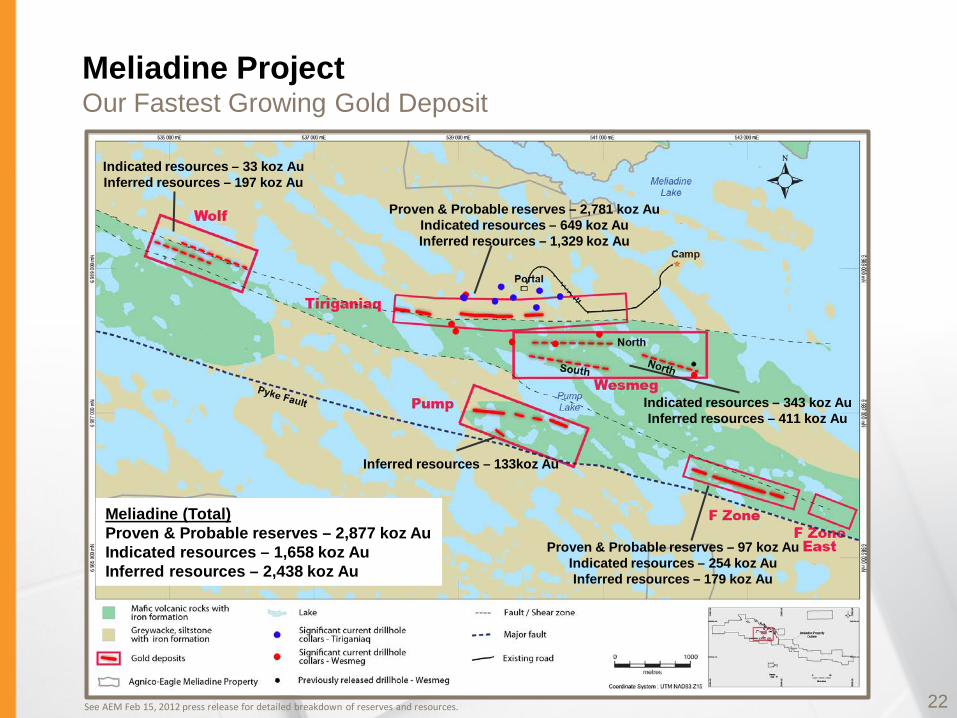
Meliadine Project Our Fastest Growing Gold Deposit
Indicated resources – 33 koz Au Inferred resources – 197 koz Au
Proven & Probable reserves – 2,781 koz Au Indicated resources – 649 koz Au Inferred resources – 1,329 koz Au
Indicated resources – 343 koz Au Inferred resources – 411 koz Au
Inferred resources – 133koz Au
Proven & Probable reserves – 97 koz Au Indicated resources – 254 koz Au Inferred resources – 179 koz Au
Meliadine (Total) Proven & Probable reserves – 2,877 koz Au Indicated resources – 1,658 koz Au Inferred resources – 2,438 koz Au
22 See AEM Feb 15, 2012 press release for detailed breakdown of reserves and resources.
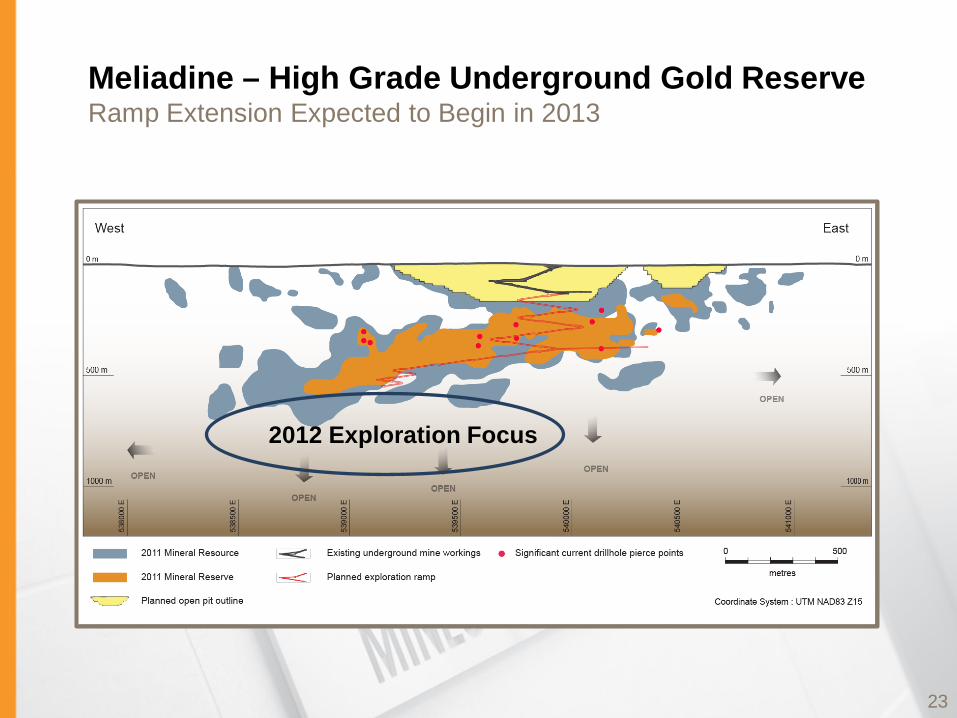
Meliadine – High Grade Underground Gold Reserve Ramp Extension Expected to Begin in 2013
23
2012 Exploration Focus
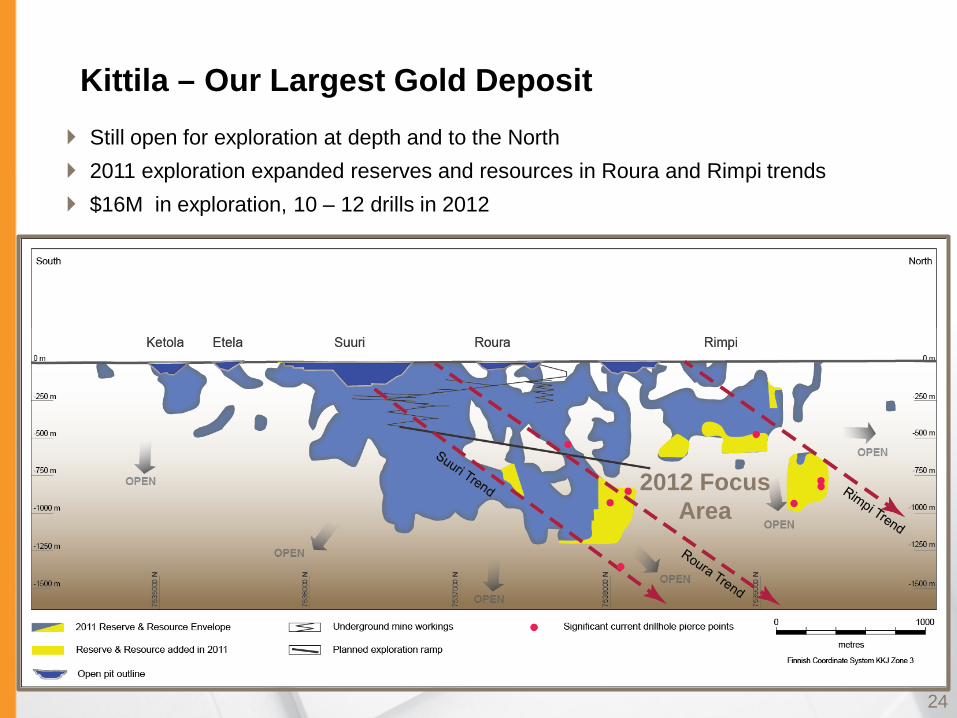
Kittila – Our Largest Gold Deposit
2012 Focus Area
Still open for exploration at depth and to the North 2011 exploration expanded reserves and resources in Roura and Rimpi trends $16M in exploration, 10 – 12 drills in 2012
24
Business Is Positioned To Deliver Moving Forward No Change in Strategy or Focus
AEM is among industry leaders in per share production, reserves, cash flows and dividends
24% production growth anticipated through 2014 from existing mines, with minimal capex required
Solid, achievable production and cost guidance
Expecting growth in reserves through exploration of existing assets
Business generating strong cash flows
Allocated to dividends, exploration and re-investing in our core assets
25
Appendix
26
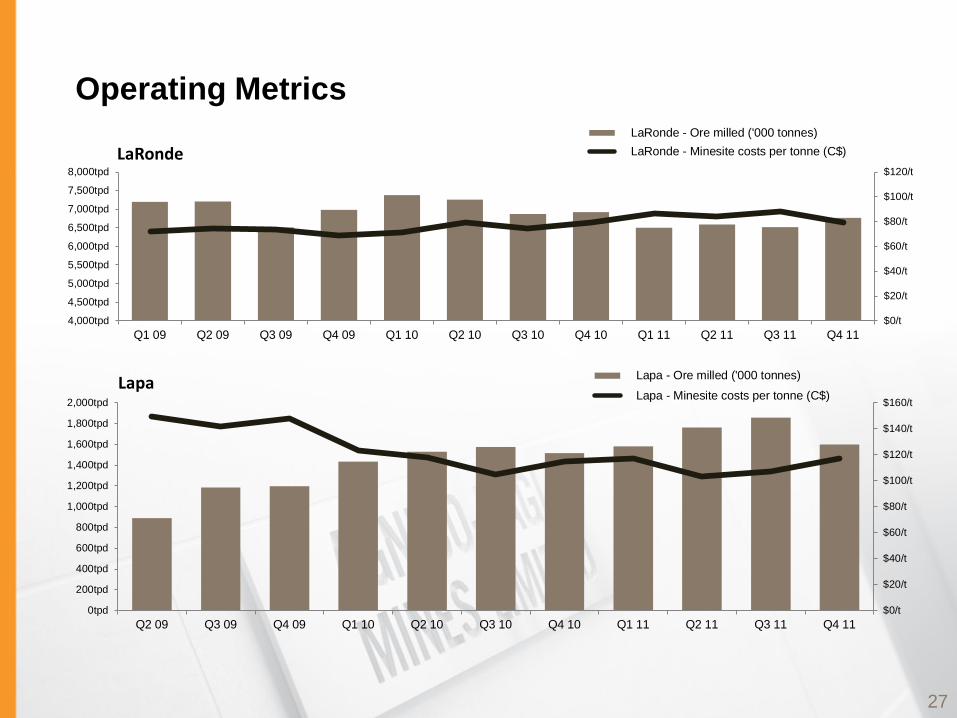
Operating Metrics
$0/t
$20/t
$40/t
$60/t
$80/t
$100/t
$120/t
4,000tpd
4,500tpd
5,000tpd
5,500tpd
6,000tpd
6,500tpd
7,000tpd
7,500tpd
8,000tpd
Q1 09 Q2 09 Q3 09 Q4 09 Q1 10 Q2 10 Q3 10 Q4 10 Q1 11 Q2 11 Q3 11 Q4 11
LaRonde - Ore milled ('000 tonnes) LaRonde - Minesite costs per tonne (C$)
$0/t
$20/t
$40/t
$60/t
$80/t
$100/t
$120/t
$140/t
$160/t
0tpd
200tpd
400tpd
600tpd
800tpd
1,000tpd
1,200tpd
1,400tpd
1,600tpd
1,800tpd
2,000tpd
Q2 09 Q3 09 Q4 09 Q1 10 Q2 10 Q3 10 Q4 10 Q1 11 Q2 11 Q3 11 Q4 11
Lapa - Ore milled ('000 tonnes)
Lapa - Minesite costs per tonne (C$)Lapa
LaRonde
27
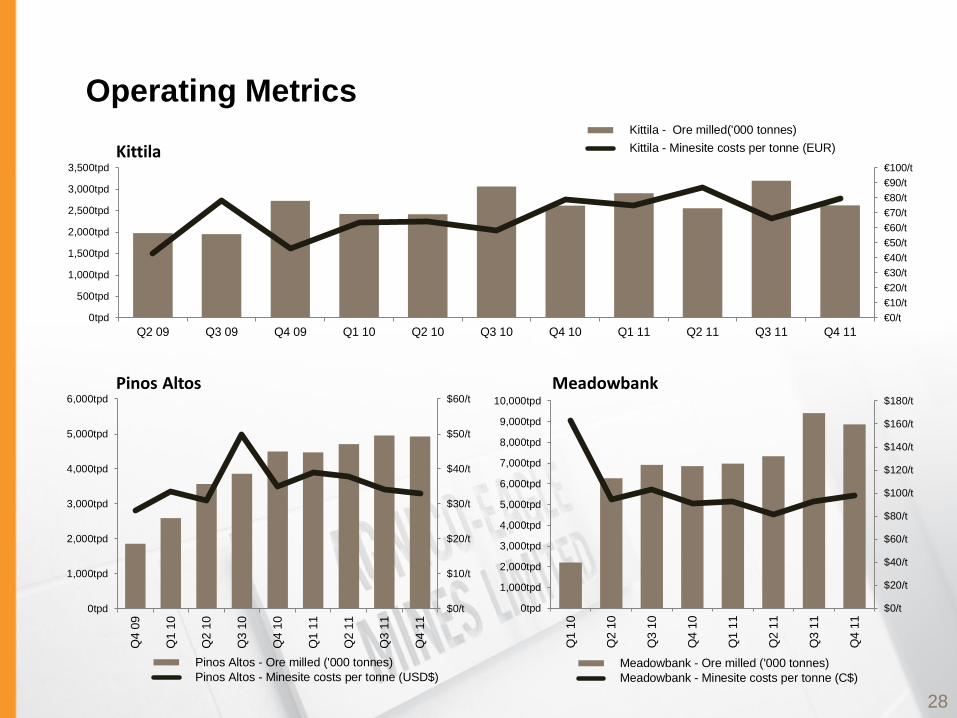
Operating Metrics
€0/t €10/t €20/t €30/t €40/t €50/t €60/t €70/t €80/t €90/t €100/t
0tpd
500tpd
1,000tpd
1,500tpd
2,000tpd
2,500tpd
3,000tpd
3,500tpd
Q2 09 Q3 09 Q4 09 Q1 10 Q2 10 Q3 10 Q4 10 Q1 11 Q2 11 Q3 11 Q4 11
Kittila - Ore milled('000 tonnes) Kittila - Minesite costs per tonne (EUR)
$0/t
$20/t
$40/t
$60/t
$80/t
$100/t
$120/t
$140/t
$160/t
$180/t
0tpd
1,000tpd
2,000tpd
3,000tpd
4,000tpd
5,000tpd
6,000tpd
7,000tpd
8,000tpd
9,000tpd
10,000tpd
Q1
10
Q2
10
Q3
10
Q4
10
Q1
11
Q2
11
Q3
11
Q4
11
Meadowbank - Ore milled ('000 tonnes) Meadowbank - Minesite costs per tonne (C$)
Pinos Altos Meadowbank
Kittila
28
$0/t
$10/t
$20/t
$30/t
$40/t
$50/t
$60/t
0tpd
1,000tpd
2,000tpd
3,000tpd
4,000tpd
5,000tpd
6,000tpd
Q4
09
Q1
10
Q2
10
Q3
10
Q4
10
Q1
11
Q2
11
Q3
11
Q4
11
Pinos Altos - Ore milled ('000 tonnes) Pinos Altos - Minesite costs per tonne (USD$)
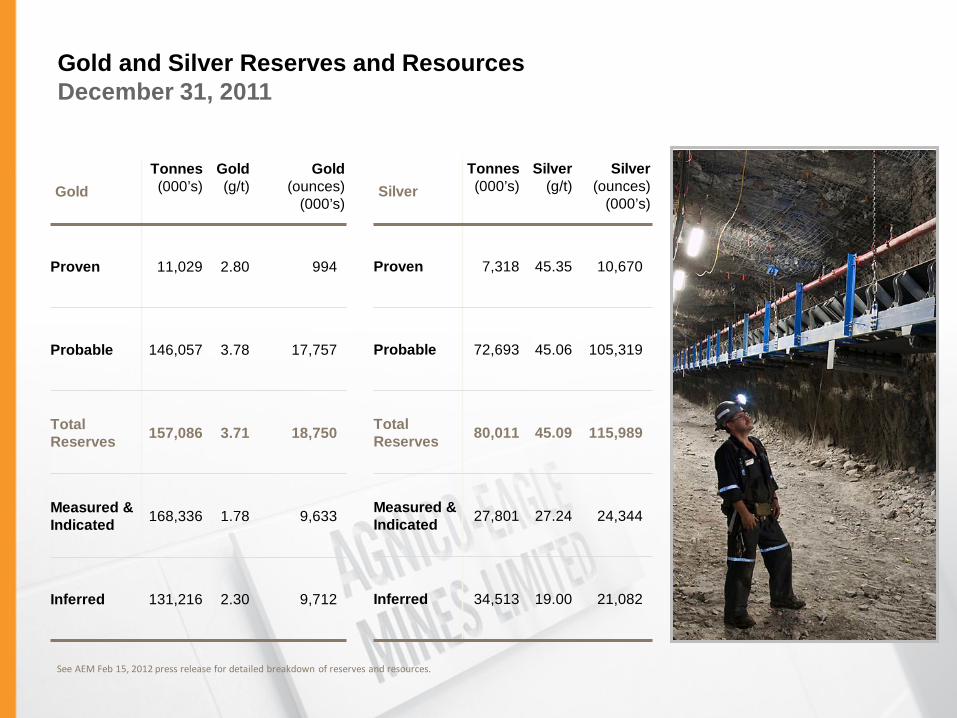
Gold and Silver Reserves and Resources December 31, 2011
Gold Tonnes (000’s)
Gold (g/t)
Gold (ounces)
(000’s)
Proven 11,029 2.80 994
Probable 146,057 3.78 17,757
Total Reserves 157,086 3.71 18,750
Measured & Indicated 168,336 1.78 9,633
Inferred 131,216 2.30 9,712
Silver Tonnes (000’s)
Silver (g/t)
Silver (ounces)
(000’s)
Proven 7,318 45.35 10,670
Probable 72,693 45.06 105,319
Total Reserves 80,011 45.09 115,989
Measured & Indicated 27,801 27.24 24,344
Inferred 34,513 19.00 21,082
See AEM Feb 15, 2012 press release for detailed breakdown of reserves and resources.
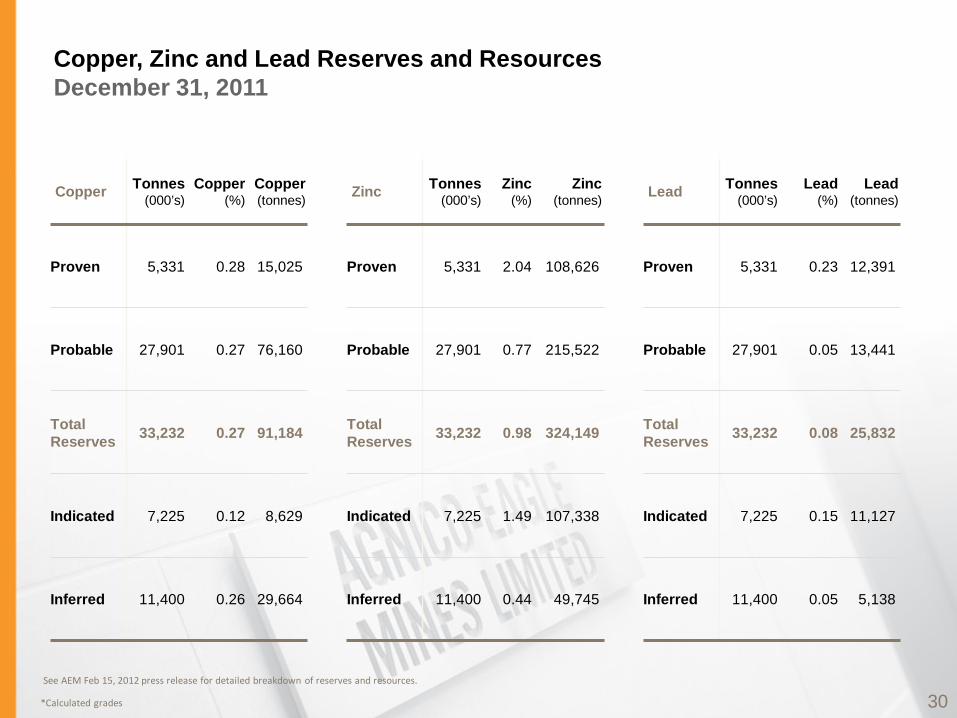
Copper, Zinc and Lead Reserves and Resources December 31, 2011
Copper Tonnes (000’s)
Copper (%)
Copper (tonnes)
Proven 5,331 0.28 15,025
Probable 27,901 0.27 76,160
Total Reserves 33,232 0.27 91,184
Indicated 7,225 0.12 8,629
Inferred 11,400 0.26 29,664
Zinc Tonnes (000’s)
Zinc (%)
Zinc (tonnes)
Proven 5,331 2.04 108,626
Probable 27,901 0.77 215,522
Total Reserves 33,232 0.98 324,149
Indicated 7,225 1.49 107,338
Inferred 11,400 0.44 49,745
Lead Tonnes (000’s)
Lead (%)
Lead (tonnes)
Proven 5,331 0.23 12,391
Probable 27,901 0.05 13,441
Total Reserves 33,232 0.08 25,832
Indicated 7,225 0.15 11,127
Inferred 11,400 0.05 5,138
*Calculated grades 30 See AEM Feb 15, 2012 press release for detailed breakdown of reserves and resources.
Notes to Investors Regarding the Use of Resources
Cautionary Note to Investors Concerning Estimates of Measured and Indicated Resources This document uses the terms "measured resources" and "indicated resources". We advise investors that while those terms are recognized and required by Canadian regulations, the SEC does not recognize them. Investors are cautioned not to assume that any part or all of mineral deposits in these categories will ever be converted into reserves. Cautionary Note to Investors Concerning Estimates of Inferred Resources This document also uses the term "inferred resources". We advise investors that while this term is recognized and required by Canadian regulations, the SEC does not recognize it. "Inferred resources" have a great amount of uncertainty as to their existence, and great uncertainty as to their economic and legal feasibility. It cannot be assumed that all or any part of an inferred mineral resource will ever be upgraded to a higher category. Under Canadian rules, estimates of inferred mineral resources may not form the basis of feasibility or pre-feasibility studies, except in rare cases. Investors are cautioned not to assume that part or all of an inferred resource exists, or is economically or legally mineable. Scientific and Technical Data Agnico-Eagle Mines Limited is reporting mineral resource and reserve estimates in accordance with the CIM guidelines for the estimation, classification and reporting of resources and reserves. Cautionary Note To U.S. Investors - The SEC permits U.S. mining companies, in their filings with the SEC, to disclose only those mineral deposits that a company can economically and legally extract or produce. Agnico-Eagle uses certain terms in this press release, such as “measured”, “indicated”, and “inferred”, and “resources” that the SEC guidelines strictly prohibit U.S. registered companies from including in their filings with the SEC. U.S. investors are urged to consider closely the disclosure in our Form 20-F, which may be obtained from us, or from the SEC’s website at: http://sec.gov/edgar.shtml. A “final” or “bankable” feasibility study is required to meet the requirements to designate reserves under Industry Guide 7. Estimates for all properties were calculated using historic three-year average metals prices and foreign exchange rates in accordance with the SEC Industry Guide 7. Industry Guide 7 requires the use of prices that reflect current economic conditions at the time of reserve determination, which the Staff of the SEC has interpreted to mean historic three-year average prices. The assumptions used for the mineral reserves and resources estimates reported by the Company on February 15, 2012 were based on three-year average prices for the period ending December 31, 2011 of $1,255 per ounce gold, $23.00 per ounce silver, $0.91 per pound zinc, $3.25 per pound copper, $0.95 per pound lead and C$/US$, US$/Euro and MXP/US$ exchange rates of 1.05, 1.37 and 12.86, respectively. The Canadian Securities Administrators’ National Instrument 43-101 (“NI 43-101”) requires mining companies to disclose reserves and resources using the subcategories of “proven” reserves, “probable” reserves, “measured” resources, “indicated” resources and “inferred” resources. Mineral resources that are not mineral reserves do not have demonstrated economic viability.
31
Notes to Investors Regarding the Use of Resources A mineral reserve is the economically mineable part of a measured or indicated mineral resource demonstrated by at least a preliminary feasibility study. This study must include adequate information on mining, processing, metallurgical, economic and other relevant factors that demonstrate, at the time of reporting, that economic extraction can be justified. A mineral reserve includes diluting materials and allows for losses that may occur when the material is mined. A proven mineral reserve is the economically mineable part of a measured mineral resource demonstrated by at least a preliminary feasibility study. A probable mineral reserve is the economically mineable part of an indicated, and in some circumstances, a measured mineral resource demonstrated by at least a preliminary feasibility study. A mineral resource is a concentration or occurrence of natural, solid, inorganic material, or natural solid fossilized organic material including base and precious metals in or on the Earth’s crust in such form and quantity and of such a grade or quality that it has reasonable prospects for economic extraction. The location, quantity, grade, geological characteristics and continuity of a mineral resource are known, estimated or interpreted from specific geological evidence and knowledge. A measured mineral resource is that part of a mineral resource for which quantity, grade or quality, densities, shape and physical characteristics are so well established that they can be estimated with confidence sufficient to allow the appropriate application of technical and economic parameters, to support production planning and evaluation of the economic viability of the deposit. The estimate is based on detailed and reliable exploration, sampling and testing information gathered through appropriate techniques from locations such as outcrops, trenches, pits, workings and drill holes that are spaced closely enough to confirm both geological and grade continuity. An indicated mineral resource is that part of a mineral resource for which quantity, grade or quality, densities, shape and physical characteristics can be estimated with a level of confidence sufficient to allow the appropriate application of technical and economic parameters, to support mine planning and evaluation of the economic viability of the deposit. The estimate is based on detailed and reliable exploration and testing information gathered through appropriate techniques from locations such as outcrops, trenches, pits, workings and drill holes that are spaced closely enough for geological and grade continuity to be reasonably assumed. An inferred mineral resource is that part of a mineral resource for which quantity and grade or quality can be estimated on the basis of geological evidence and limited sampling and reasonably assumed, but not verified, geological and grade continuity. The estimate is based on limited information and sampling gathered through appropriate techniques from locations such as outcrops, trenches, pits, workings and drill holes. Mineral resources which are not mineral reserves do not have demonstrated economic viability. Investors are cautioned not to assume that part or all of an inferred resource exists, or is economically or legally mineable. A Feasibility Study is a comprehensive technical and economic study of the selected development option for a mineral project that includes appropriately detailed assessments of realistically assumed mining, processing, metallurgical, economic, marketing, legal, environmental, social and governmental considerations together with any other relevant operational factors and detailed financial analysis, that are necessary to demonstrate at the time of reporting that extraction is reasonably justified (economically mineable). The results of the study may reasonably serve as the basis for a final decision by a proponent or financial institution to proceed with, or finance, the development of the project. The confidence level of the study will be higher than that of a Pre-Feasibility Study. The effective date for all of the Company’s mineral resource and reserve estimates in this document is December 31, 2011. Additional information about each of the mineral projects that is required by NI 43-101, sections 3.2 and 3.3 and paragraphs 3.4 (a), (c) and (d) can be found in the Technical Reports referred to above, which may be found at www.sedar.com. Other important operating information can be found in the Company’s Form 20-F and its news release dated February 15, 2012. The contents of this document have been prepared under the supervision of, and reviewed by, Marc Legault P.Eng., Senior Vice-President Project Development and a “Qualified Person” for the purposes of NI 43-101.
32
A solid financial position, low-cost structure, well-funded growth projects in regions of low political risk, and a focused, consistent strategy put Agnico-Eagle in a strong position to continue creating exceptional per share value.
Sean Boyd President and Chief Executive Officer
Ammar Al-Joundi SVP Finance and Chief Financial Officer
David Smith SVP, Strategic Planning & Investor Relations
Trading Symbol: AEM on TSX & NYSE
Investor Relations: 416-947-1212 [email protected]
Executive and Registered Office: 145 King Street East, Suite 400 Toronto, Ontario, Canada, M5C 2Y7 Tel: 416-947-1212 Toll-Free: 888-822-6714 Fax: 416-367-4681
agnico-eagle.com