advancing the standard - genisys-gmbh.com
TRANSCRIPT
1
Advancing the Standard
Which PEC ?
BEAMeeting March 2021

Advancing the Standard
2
• 2D PEC• PEC vs Shape-PEC
• PEC vs Corner-PEC
• 3D PEC• Single Layer Resist
• Surface PEC
• Topo PEC
• Multilayer Resist • Edge PEC vs
• T-gate PEC
Agenda
BEAMeeting March 2021

Advancing the Standard
3
• Correction is divided into Long-range, Mid-range and Short-range.
• Long-range correction is always a dose correction• Based on fast FFT-based convolution
• Short-range implemented as i) dose modulation or ii) shape modulation • Uses direct convolutions - fast when few features are involved
Proximity Effect Correction
BEAMeeting March 2021

Advancing the Standard
4
• 2D PEC• PEC vs Shape-PEC
• PEC vs Corner-PEC
• 3D PEC• Single Layer Resist
• Surface PEC
• Topo PEC
• Multilayer Resist • Edge PEC vs
• T-gate PEC
Agenda
BEAMeeting March 2021

Advancing the Standard
5
Dose PEC
• Optimal for most scenarios
• Fine dose control
• Higher Contrast and more stable forcomplex shapes
• Drawback for Line ends• In case, blur >> feature size
Resulting LES is hard to correct
Short- and Mid-Range Dose- vs Shape-PEC
Shape PEC
• Allows ODUS (Over Dose Under Size)
• Under size is limited by smallest
feature size.
• Limited by BSS• Shift Step Size = n x BSS
• Lower contrast (without ODUS), lessstable for complex curved shapes(without ODUS)
• Advantage: LES can be corrected
BEAMeeting March 2021

Advancing the Standard
6
• The enhancement of image contrast by ODUS
• The dependence of image contrast on pattern density
Methods Contrast Comparison
Simulation of 100 nm lines, 100keV exposure on 200nm PMMA 950K on GaAs
Dose PEC Shape PEC ODUS
ILS = 4.36 ILS = 4.14 ILS = 6.56
ILS = 2.13ILS = 1.43 ILS = 1.43
isoline
dense line
BEAMeeting March 2021

Advancing the Standard
7
Single layer resist lift-off process by achieving negative resist profile
Shape PEC-ODUS ApplicationsContrast enhancement for negative resist mr-EBL 6000 (microresist tech.)- 1:1 line spaces, 75nm
PEC
Shape-PEC
Dose PEC
ODUS(overdose = 2)
75 nm lines not printing well, remaining resist in gaps
Courtesy : Columbia UnivCourtesy : Weizmann Inst. Of Science
3.17
4.67
BEAMeeting March 2021

Advancing the Standard
8
• Dose PEC is limited by contrast
• Shape-PEC with ODUS improves the contrast and the process window
Interesting Border Case
PEC
OD=2
Courtesy : University of British Coulmbia
BEAMeeting March 2021
Advancing the Standard
9
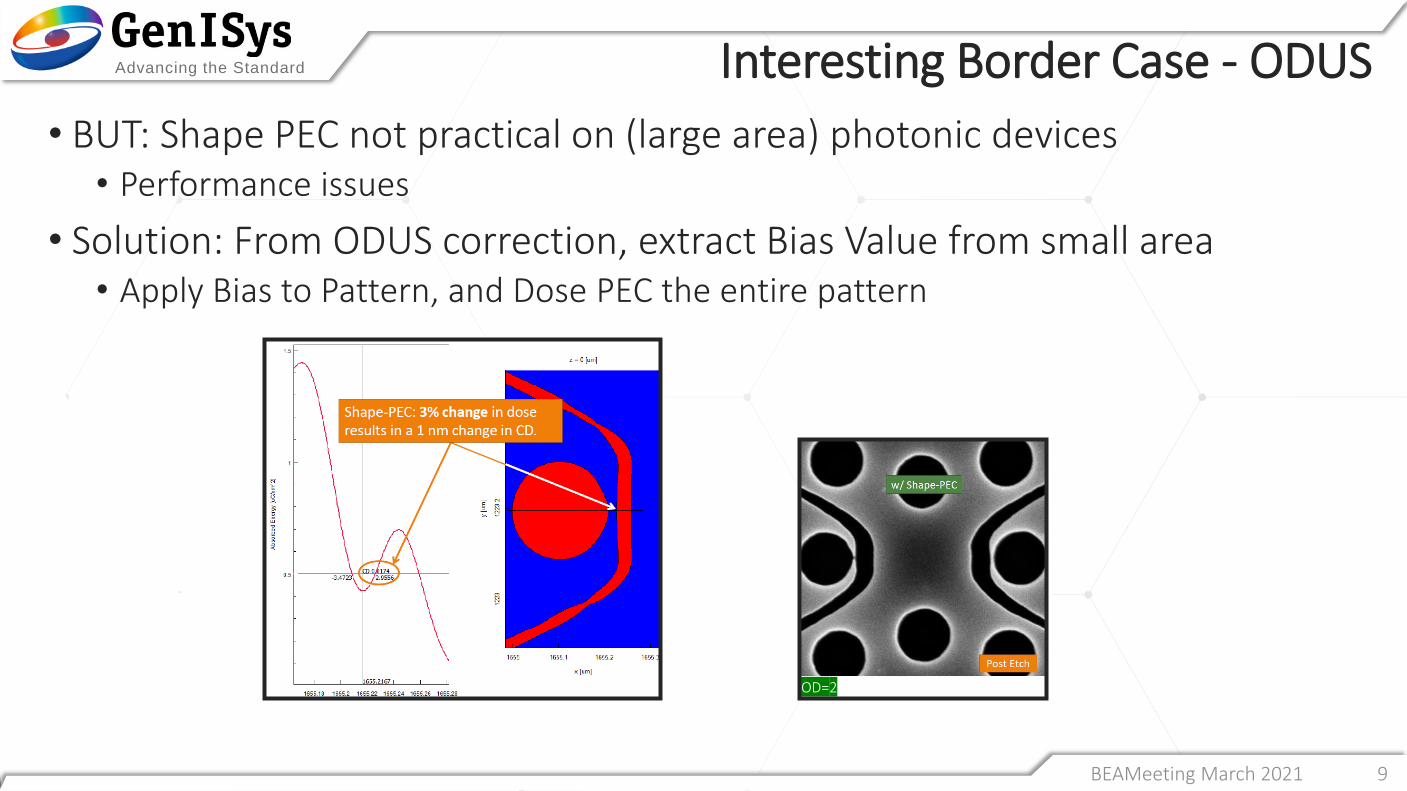
• BUT: Shape PEC not practical on (large area) photonic devices• Performance issues
• Solution: From ODUS correction, extract Bias Value from small area • Apply Bias to Pattern, and Dose PEC the entire pattern
Interesting Border Case - ODUS
OD=2
BEAMeeting March 2021

Advancing the Standard
10
• 2D PEC• PEC vs Shape-PEC
• PEC vs Corner-PEC
• 3D PEC• Single Layer Resist
• Surface PEC
• Topo PEC
• Multilayer Resist • Edge PEC vs
• T-gate PEC
Agenda
BEAMeeting March 2021

Advancing the Standard
11
PEC vs Corner-PEC
PEC
Corner-PEC
25 nm HSQPre-baked at 170oC for 2 min, I= 500 pA, Dose 19000 uC/cm2
Developed in Salty developer
Hexagons Triangles
Courtesy : Cornell University
BEAMeeting March 2021
Advancing the Standard
12
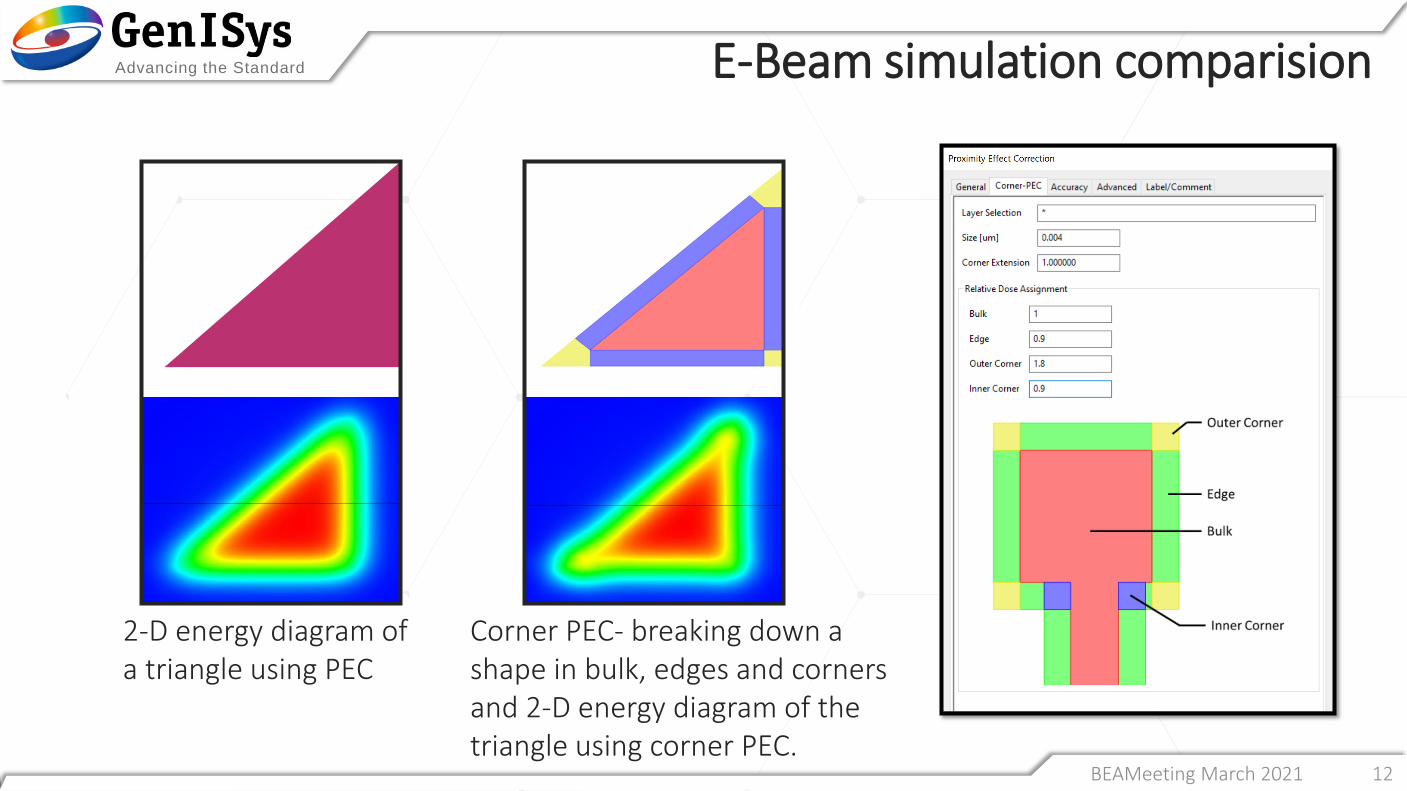
Corner PEC- breaking down a shape in bulk, edges and corners and 2-D energy diagram of the triangle using corner PEC.
2-D energy diagram of a triangle using PEC
E-Beam simulation comparision
BEAMeeting March 2021
Advancing the Standard
13
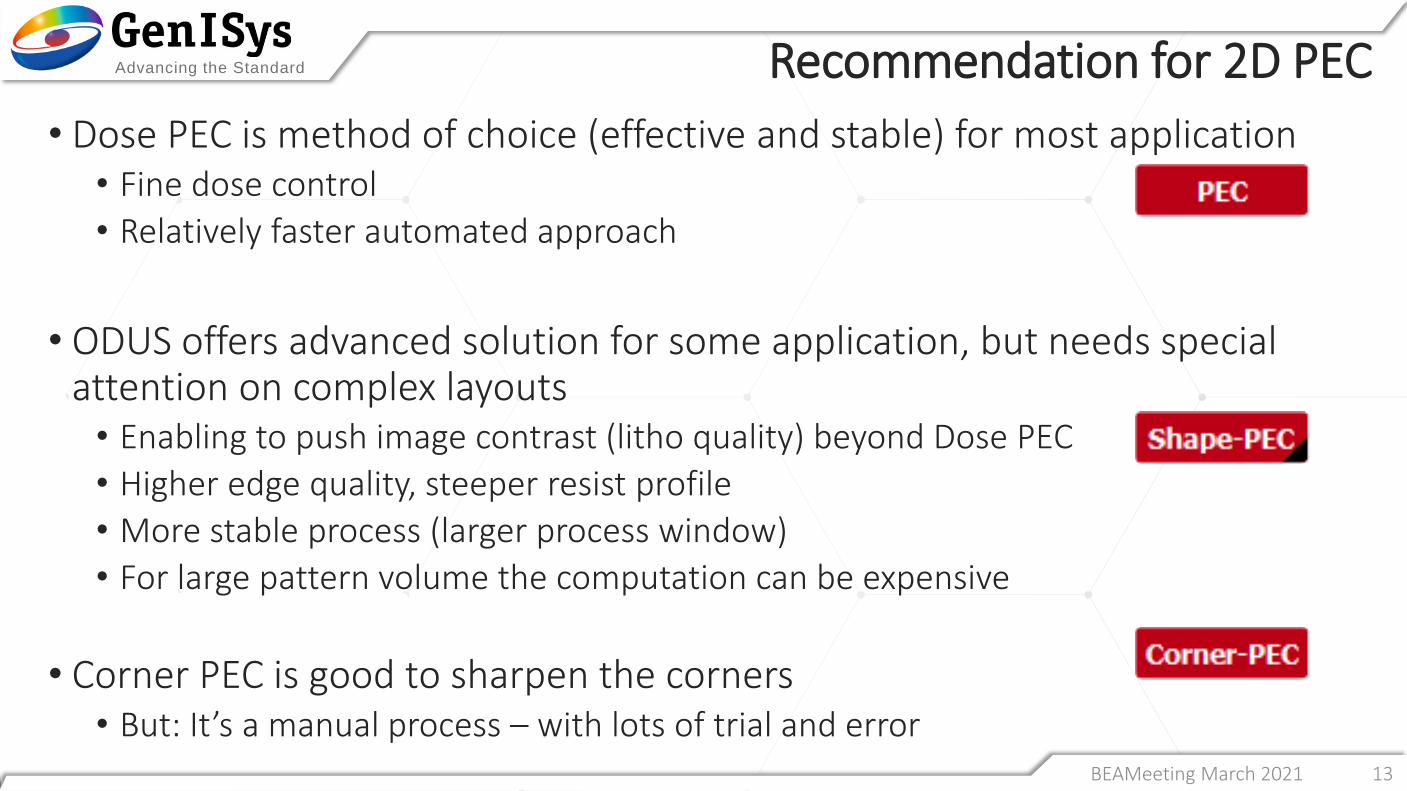
• Dose PEC is method of choice (effective and stable) for most application• Fine dose control
• Relatively faster automated approach
• ODUS offers advanced solution for some application, but needs special attention on complex layouts• Enabling to push image contrast (litho quality) beyond Dose PEC
• Higher edge quality, steeper resist profile
• More stable process (larger process window)
• For large pattern volume the computation can be expensive
• Corner PEC is good to sharpen the corners• But: It’s a manual process – with lots of trial and error
Recommendation for 2D PEC
BEAMeeting March 2021

Advancing the Standard
14
• 2D PEC• PEC vs Shape-PEC
• PEC vs Corner-PEC
• 3D PEC• Single Layer Resist
• Surface PEC
• Topo PEC
• Multilayer Resist • Edge PEC vs
• T-gate PEC
Agenda
BEAMeeting March 2021

Advancing the Standard
15
Some 3D samplesof E-BEAM
Courtesy: PSI, Switzerland
3D structures by hybrid nanomanufacturing processes
Symmetric/Asymmetric Circle
Multi-level,Sloped & BinaryMulti-level/Sloped
Convex/Concave Mixed/Hybrid
BEAMeeting March 2021

Advancing the Standard
16
3D Surface PEC
• Possibility to use 3D PSF
• To use Lateral development correction using the resist model derived from contrast curve
BEAMeeting March 2021

Advancing the Standard
17
3D-Topo PEC
• 3D Topo-PEC allows using region dependent PSF, for PEC corrections that consider underlying features
• The Topo-PEC module has been extended to allow careful control of the dose at topography edges
SiO₂Au
Si
PMMA
SiNx Membrane
Si Si
SiNxPMMA
No AuAuSi/SiNx
SiNx
BEAMeeting March 2021

Advancing the Standard
18
• 2D PEC• PEC vs Shape-PEC
• PEC vs Corner-PEC
• 3D PEC• Single Layer Resist
• Surface PEC
• Topo PEC
• Multilayer Resist • Edge PEC vs
• T-gate PEC
Agenda
BEAMeeting March 2021

Advancing the Standard
19
Multi Layer Resist Process
• Exposure may consist of multiple (e.g. two) „target“ layers• PEC needs to adjust to two targets• D2C of resist 1 at one exposure layer• D2C of resist 2 at other exposure layer
Resist 1-PMMA
Resist 2-MMA
Resist 2-MMA
Resist 1-PMMA
Wafer
Wafer
-4000
-3000
-2000
-1000
0
Res
ist
2
Exposure Dose (µC/cm2)
PMMA –MAA 8.5%+12%0 100 200 300
-4000
-3000
-2000
-1000
0
0 200 400 600
Res
ist
1
Exposure Dose(µC/cm2)
PMMA-950k 5% 300RPM
Resist 2
Wafer
Wafer
Resist 1
BEAMeeting March 2021

Advancing the Standard
20
• The top layer is defining the feature dimension
• The bottom layer is defining the undercut• Optimized lift-off process
• May also generate a „resist bridge“ (Dolan Bridge)
3D Edge PEC for Undercut-Control
Resist 1-PMMA
Resist 2-MMA
Wafer
WaferBEAMeeting March 2021

Advancing the Standard
21
• Common task in Quantum technology is generating Josephson Junction
• This is done using multi-layer process• generating a „resist bridge“ (Dolan Bridge)
• Forming the Josephson junction by shadow evaporation under an angle
Dolan Bridge
N Foroozani et al 2019 Quantum Sci. Technol. 4 025012In this work the Dolan bridge is generated using optical (stepper) lithography
After resist development
Yu-Lin Wu et al 2013 Chinese Phys. B 22 060309
BEAMeeting March 2021

Advancing the Standard
22
3D Edge PEC for Bridges
• The top is building a metal bridge after metalization
• The bottom layer creates the foots for interconnection
Courtesy : Weizmann Inst. Of Science
Resist 1-PMMAResist 2-MMA
Wafer
Wafer
BEAMeeting March 2021

Advancing the Standard
23
T-Gate is often oversized
Oversize > 30nm
• T-gate done using Edge PEC end up oversized
• Design 84 nm results in >> 100nm
• Lower base dose gives residues
• Gate already too large when cleared!
Courtesy : Weizmann Inst. Of Science
BEAMeeting March 2021

Advancing the Standard
24
Root Cause of Oversize
Oversize > 30nm due to lateral development
Courtesy : Weizmann Inst. Of Science
BEAMeeting March 2021

Advancing the Standard
25
• Development front moves not only down, but also to the side
• The development to the side is dependent on background energy and blur
• The lateral development bias needs to be considered
Dedicated T-Gate - PEC
Lateral Bias
BEAMeeting March 2021

Advancing the Standard
26
3D T-Gate PEC:
This mode is optimized for double-layer T-Gate process. It considers the full resist contrast curves of both resists, models and corrects lateral development bias, and enables contrast enhancement by ODUS of gate.
T-Gate PEC with gate & wing layer
Courtesy : Fudan University
BEAMeeting March 2021
Advancing the Standard
27
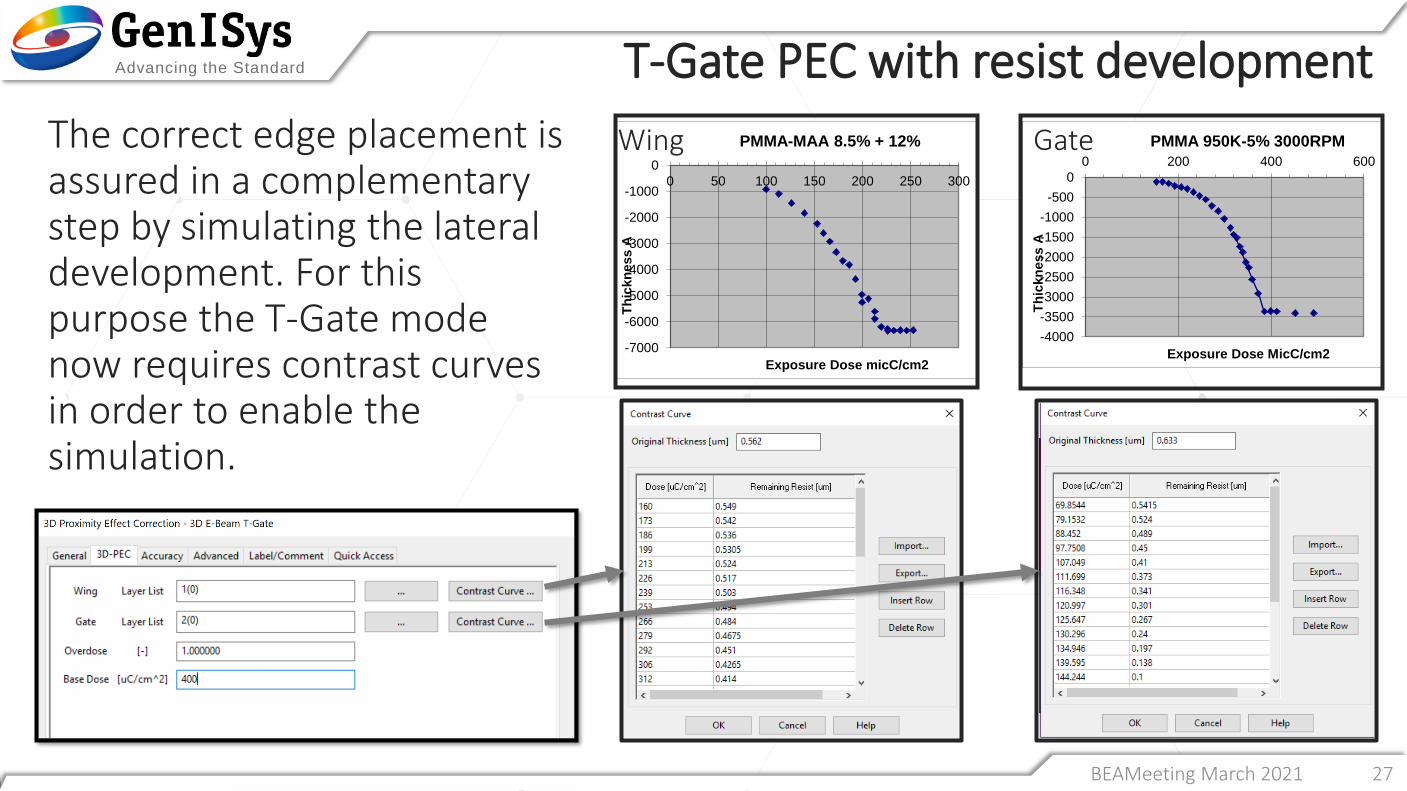
The correct edge placement is assured in a complementary step by simulating the lateral development. For this purpose the T-Gate mode now requires contrast curves in order to enable the simulation.
T-Gate PEC with resist development
-4000
-3500
-3000
-2500
-2000
-1500
-1000
-500
0
0 200 400 600
Th
ickn
ess A
Exposure Dose MicC/cm2
PMMA 950K-5% 3000RPM
-7000
-6000
-5000
-4000
-3000
-2000
-1000
0
0 50 100 150 200 250 300
Th
ickn
ess A
Exposure Dose micC/cm2
PMMA-MAA 8.5% + 12%Wing Gate
BEAMeeting March 2021

Advancing the Standard
28
• Edge PEC can take multiple resist layer whereas T-gate takes only two layers resist for correction
• T-gate PEC specially for T-gate correction• Inherent Lateral development correction– resist model from contrast curve
• Correction clubbed with ODUS
3D Edge PEC vs T-gate PEC
BEAMeeting March 2021

Advancing the Standard
29
• 2D PEC• Dose PEC is method of choice (effective and stable) for most
application
• ODUS offers advanced solution for some application, but needs special attention on complex layouts
• Corner PEC is good to sharpen the corners
• 3D PEC• Single Layer Resist
• Surface PEC – used for grey tone lithography
• Topo PEC – PEC corrections that consider underlying features, uses region dependent PSF
• Multilayer Resist • Edge PEC – low sensitive resist defines the critical feature dimensions
• T-gate PEC – Inherent lateral development correction and allows use of ODUS
Summary
BEAMeeting March 2021

Advancing the Standard
30
Thank You!
HeadquartersGenISys GmbH
Eschenstr. 66
D-82024 Taufkirchen (Munich)
GERMANY
+49-(0)89-3309197-60
+49-(0)89-3309197-61
USA OfficeGenISys Inc.
P.O. Box 410956
San Francisco, CA
94141-0956
USA
+1 (408) 353-3951
Japan / Asia Pacific OfficeGenISys K.K.
German Industry Park
1-18-2 Hakusan Midori-ku
Yokohama 226-0006
JAPAN
+81 (0)45-530-3306
+81 (0)45-532-6933
Advancing the Standard
30BEAMeeting March 2021