advancing renewable energy: displacing coal with … renewable energy: displacing coal with woody...
TRANSCRIPT
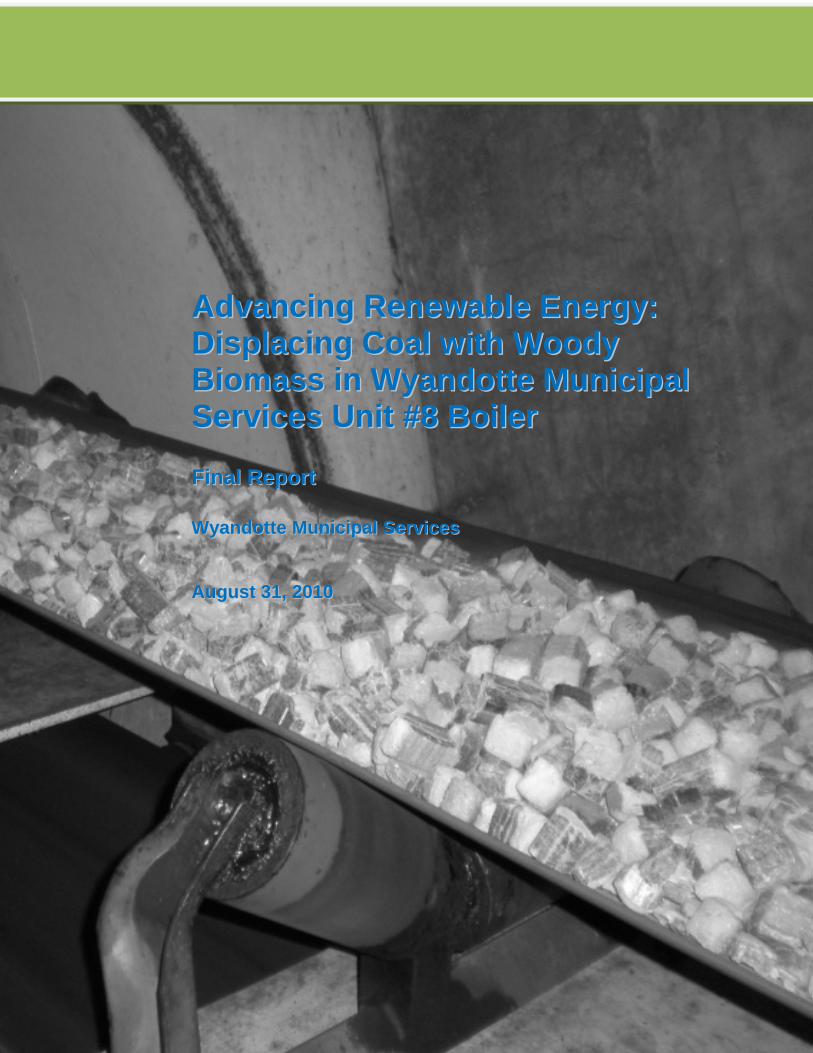
AAddvvaanncciinngg RReenneewwaabbllee EEnneerrggyy:: DDiissppllaacciinngg CCooaall wwiitthh WWooooddyy BBiioommaassss iinn WWyyaannddoottttee MMuunniicciippaall SSeerrvviicceess UUnniitt ##88 BBooiilleerr FFiinnaall RReeppoorrtt WWyyaannddoottttee MMuunniicciippaall SSeerrvviicceess AAuugguusstt 3311,, 22001100
Advancing Renewable Energy: Displacing Coal with Woody Biomass in Wyandotte Municipal Services Unit #8 Boiler Final Report Wyandotte Municipal Services August 31, 2010
450 South Wagner Road Ann Arbor, MI 48103 Phone: (734) 922-4400 Fax: (734) 922-4401
Unit #8 Woody Biomass Test Burn Final Report
Table of Contents
Executive Summary .....................................................................................................................................iv
1 Introduction................................................................................................................................................1
2 Biomass Fuel Suppliers..............................................................................................................................3
2.1 Existing Biomass Fuel Supply .................................................................................................... 3 2.2 Existing Biomass Fuel Supply .................................................................................................... 4 2.2 Selected Biomass Fuel Supplier.................................................................................................. 5
3 Biomass Fuel Test Burn.............................................................................................................................7
3.1 Biomass Test Burn Methodology ............................................................................................... 7 3.2 Facility and Boiler....................................................................................................................... 8 3.3 Fuel Handling Field Test ............................................................................................................ 9
3.3.2 Field Testing Matrix .................................................................................................... 11 3.4 Boiler Performance Test Procedures......................................................................................... 12
3.4.1 Boiler Efficiency.......................................................................................................... 13 3.4.2 Fuel Sampling and Analyses........................................................................................ 14 3.4.3 Boiler Emissions .......................................................................................................... 15 3.4.4 Fly Ash Characteristics ................................................................................................ 16
3.5 Sustainability............................................................................................................................. 16 4 Test Burn Results .....................................................................................................................................17
4.1 Boiler Efficiency....................................................................................................................... 18 4.1.1 Boiler Operation and Fuels .......................................................................................... 19
4.2 Boiler Emissions ....................................................................................................................... 20 4.3 Fly Ash Characteristics ............................................................................................................. 24 4.4 Sustainability Issues.................................................................................................................. 25
4.4.1 Fly Ash Composition ................................................................................................... 25 4.4.2 Woody Biomass Consumption..................................................................................... 26 4.4.3 Biogenic Carbon Lifecyle ............................................................................................ 26 4.4.4 GHG Emission Calculations ........................................................................................ 27
5 Project Evaluation....................................................................................................................................29
5.1 Biomass Combustion Options................................................................................................... 29 5.2 Storage and Feeding System Requirements.............................................................................. 29
6 Financials/Budget ....................................................................................................................................31
i
List of Tables
Table 1 Biomass Wood Fuel Suppliers .......................................................................................... 4 Table 2 Biomass Sizing Requirements........................................................................................... 5 Table 3 Unit #8 CEMS .................................................................................................................. 8 Table 4 Proximate and Ultimate Analysis.................................................................................... 11 Table 5 WMS Biomass Co-firing Program Test Matrix ............................................................... 12 Table 6 Summary of Boiler Efficiency Parameters ...................................................................... 13 Table 7 Fuel Characteristics As Received.................................................................................... 18 Table 8 Percent of Fuel by Weight .............................................................................................. 19 Table 9 Boiler Efficiency............................................................................................................. 19 Table 10 Michigan ‘12’ Metals Emissions (mg/kg) ....................................................................... 21 Table 10 CEMS Emissions ............................................................................................................ 22 Table 12 Ash Characteristics ......................................................................................................... 25 Table 13 Ash TCLP ‘12’ Metals (mg/l) ......................................................................................... 25 Table 14 Daily and Annual Woody Biomass Consumption Rates.................................................. 26 Table 15 Direct (Scope 1) CO2 Equivalent Emissions from Combustion....................................... 28
List of Figures
Figure 1 renewaFUEL Cube 100 percent Wood Product ................................................................. 6 Figure 2 renewaFUEL Cube 100 Percent Wood Product off Transfer House Belt ........................ 10 Figure 3 renewaFUEL Cube 100 Percent Wood Product from Limestone Feeder ......................... 10 Figure 4 WMS Unit #8 Steam Flow .............................................................................................. 20 Figure 5 WMS Unit #8 Carbon Monoxide .................................................................................... 23 Figure 6 WMS Unit #8 SO2 Emissions During Testing ................................................................ 23 Figure 7 WMS Unit #8 Limestone Consumed............................................................................... 24 Figure 8 Opinion of Probable Cost................................................................................................ 30
ii
List of Appendices
A. 2010 Wyandotte – List of Sample Analysis Costs R-1 B. 2010 Wyandotte – Wyandotte Fuel Specifications C. Biomass, Biofuels, and Bioenergy Feedstock Opportunities in Michigan D. Clean Energy from Wood Residues in Michigan E. Measures of Wood Resources in Lower Michigan Paper F. Measures of Wood Resources in Lower Michigan G. MI SO2 1866-2009 H. National Oceanic Atmospheric and Administration Weather Data I. Opportunities in Michigan Wood Energy J. Potential Availability of Urban Wood Biomass in Michigan K. Quantifying Urban Saw Timber Abundance and Quality in Southeastern Lower Michigan L. renewaFuel Wood Dust MSDS M. RF-Wyandotte Sustainability Details N. Robert Froese Traverse City Presentation O. Sawmill Operations Serving Southeastern Michigan P. Test Burn PI and CEMS Data Q. Test Burn Procedure R. Traverse City Report S. Urban Wood Waste in Michigan T. WMS Baghouse Screen Shot U. WMS MDNRE Air Quality Permit V. WMS Test Burn Boiler Efficiency 15 percent Biomass W. WMS Test Burn Boiler Efficiency 30 percent Biomass X. WMS Test Burn Boiler Efficiency Baseline Y. Wood Fuel Availability Study Z. Wood Waste Processing and Utilization in Southeastern Michigan AA. Woody Biomass Retrofit Opportunities in Michigan Boiler BB. Wyandotte Sample Test Plan CC. GHG Emissions Calculations
iii
Executive Summary
The Michigan Department of Energy, Labor & Economic Growth (DELEG) awarded Wyandotte
Municipal Services (WMS) a grant to demonstrate the feasibility of co-firing biomass fuel in its existing
Unit #8 – a 25Megawatt (MW) circulating fluidized-bed boiler. The WMS project investigated the
logistics of acquiring and handling various woody biomass fuels and conducted a test burn of the
proposed fuel to identify any technical challenges and develop recommendations for future use.
Several biomass suppliers were identified during the fuel supplier review, but renewaFUEL was selected
for the supply of biomass for the WMS test burn. RenewaFUEL was selected due to their densified wood
cube product, size of the cube, and their availability to supply large quantities of this product. Testing
concluded that the densified wood cubes traveled well through the existing conveying system. Dust was
an issue during the loading process, but for the purpose of the test burn, good general housekeeping was
maintained to mitigate this issue.
The testing consisted of three test burns – a baseline test, 15 percent by heat input biomass test, and a 30
percent by heat input biomass test. The first test which was a baseline test was completed on May 14,
2010. The baseline test was done operating the boiler as normally operated burning a coal/TDF mixture.
The data from this test was compared to the results from the biomass tests to try to determine operating
differences. The 30 percent biomass test was completed on June 9, 2010, and the 15% biomass test was
completed on June 10, 2010. The boiler was operated for eight hours at the respective biomass input
before testing proceeded. This was done to “season” the bed in the attempt to get more accurate testing
results. During testing, the boiler reacted well to the introduction of biomass and was capable of providing
a steady 160,000 lb/hr of steam flow while burning 15 percent and 30 percent biomass by heat input.
Conventional field testing protocols and reference methods were used to determine boiler efficiency,
emissions, and fly ash properties. The WMS facility PI Historian Systems, Continuous Emissions
Monitoring System and physical fuel and ash sample results were used to record the results of the biomass
test burns. No noticeable changes in boiler efficiency, emissions, or fly ash properties were detected
during the testing. It was concluded that the boiler operated successfully using the renewaFUEL biomass
and that biomass could be an option for future fuel at the WMS facility. Further testing is required to
fully determine the impacts on emissions and boiler efficiency when burning biomass.
iv
1 Introduction
The City of Wyandotte’s Department of Municipal Services is a community owned and operated entity
that provides electricity, water, telephone, internet, and cable television services to residents of
Wyandotte. The electricity is generated by Wyandotte Municipal Services (WMS). The power plant is
located on the western shore of the Detroit River, just north of the downtown area of Wyandotte.
WMS generates and delivers roughly 275,000 MWh of electricity annually to more than 10,000 homes
and 1,000 businesses within the City of Wyandotte. Today, WMS relies on two coal-fired boilers and
sources roughly 85 percent of its power from coal. WMS is striving to diversify its generation portfolio
and use of renewable energy and energy efficiency.
DELEG awarded WMS a grant for a biomass energy demonstration project, with an expected completion
date of July 31, 2010. This grant was provided by DELEG to demonstrate the feasibility of co-firing
biomass fuel in their existing generating facility. The goals of the WMS project were to investigate
the logistics of acquiring and handling various woody biomass fuels and to conduct a test burn of the
proposed fuel(s) to identify any technical challenges and develop recommendations for future use.
The evaluation and subsequent use of biomass-derived fuel as a partial replacement for coal could
help WMS reach its respective renewable portfolio standards in a timely manner. Under PA 295, all
the electric utilities in the state of Michigan are required to meet a renewable portfolio standard of 10
percent of renewable energy by the year 2015.
WMS has three boilers at this site, identified as Units #5, #7 and #8. Unit #5 is a 22.5 MW natural-gas-
fired boiler that is used as a back-up boiler to the other two boilers. Unit #7 is a 32.5 MW wall-fired
pulverized-coal-fired boiler that is capable of firing coal, natural gas, and propane. WMS selected Boiler
Unit #8; a 25 Megawatt (MW) circulating fluidized-bed boiler capable of firing coal, untreated virgin
wood chip waste, and tire-derived fuel (TDF) for the DELEG co-firing grant. The use of this grant to co-
fire biomass fuel in WMS’s Unit #8 boiler will lay out the pathway for replacing some of its current coal
intake with biomass fuel and TDF beginning in 2012.
The specific goals for this project were to:
1. Understand the market for biomass fuel suppliers (what and where) that will be available within a
feasible transportation range to WMS, so that WMS will be able to secure a consistent supply of
high quality, sustainably-sourced biofuel to fuel Unit #8 boiler for up to 7MW of electricity
production by 2025.
Barr Engineering Company Page 1
2. Identify the infrastructure upgrade requirements and costs for Boiler #8 that will be necessary to
store, handle, and feed biomass fuel into the boiler.
3. Verify that selected biomass fuel sources and handling equipment will effectively and consistently
work to generate high-quality, low-emission electricity for WMS’s customers.
This report presents results of the densified wood biomass testing conducted on Unit #8 at the WMS
power plant in Wyandotte, MI. This report includes the following sections:
• Discussion of the biomass fuel suppliers
• Description of the verification approach and parameters
• Description of sampling and analytical procedures
• Test results
• Evaluation
• Appendices
Barr Engineering Company Page 2
2 Biomass Fuel Suppliers
2.1 Existing Biomass Fuel Supply
Per the Wyandotte Municipal Services proposal response1 to the Michigan Bureau of Energy Systems
Biomass Energy Demonstration Grant RFP, the specific goals for the project regarding biomass fuel
supply are to:
• Develop a list of potential biomass suppliers that could feasibly, consistently, and cost effectively
provide biomass fuel for WMS
• Understand the supplier’s products, determine their capacities, evaluate their product in terms of
biomass and process type (chipped, grinder, pellet, cube), fuel characteristics, and fuel delivery
distance from WMS facility
1Wyandotte Municipal Services proposal, Advancing Renewable Energy: Displacing Coal with Woody Biomass in Wyandotte; Section E, pages 3-4.
Barr Engineering Company Page 3
2.2 Existing Biomass Fuel Supply
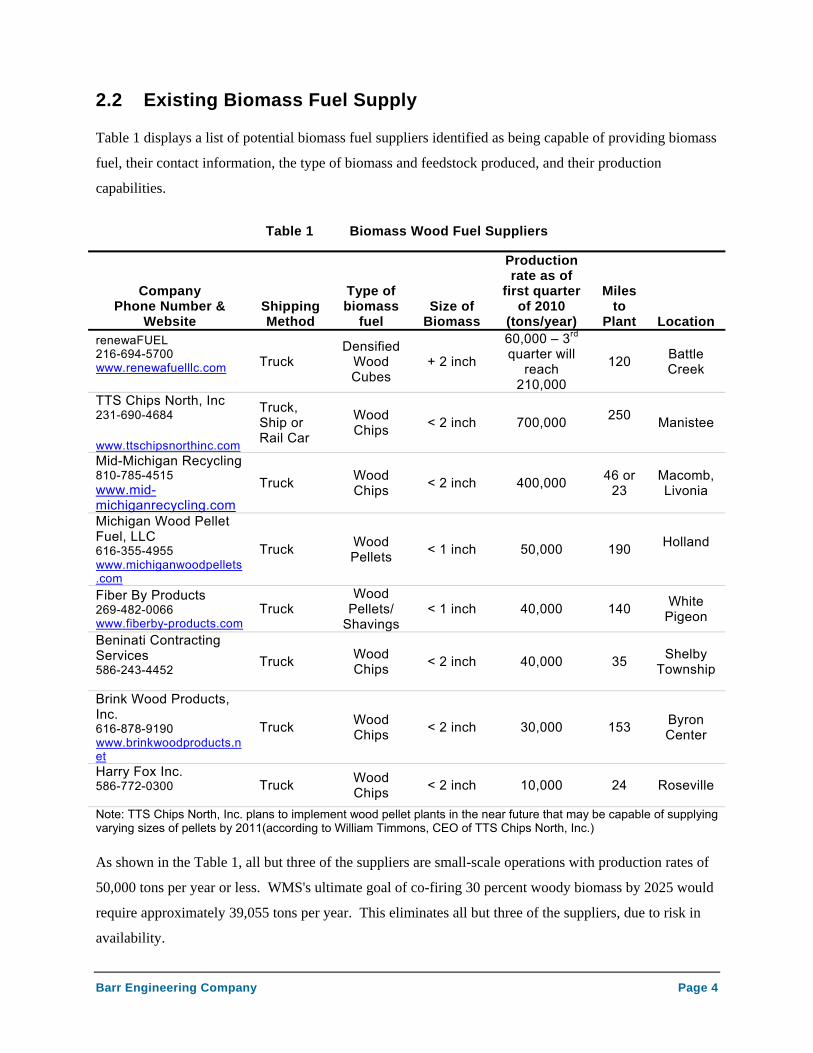
Table 1 displays a list of potential biomass fuel suppliers identified as being capable of providing biomass
fuel, their contact information, the type of biomass and feedstock produced, and their production
capabilities.
Table 1 Biomass Wood Fuel Suppliers
Company Phone Number &
Website Shipping Method
Type of biomass
fuel Size of
Biomass
Production rate as of
first quarter of 2010
(tons/year)
Miles to
Plant Location renewaFUEL 216-694-5700 www.renewafuelllc.com
Truck Densified
Wood Cubes
+ 2 inch
60,000 – 3rd quarter will
reach 210,000
120 Battle Creek
TTS Chips North, Inc 231-690-4684 www.ttschipsnorthinc.com
Truck, Ship or Rail Car
Wood Chips < 2 inch 700,000 250
Manistee
Mid-Michigan Recycling 810-785-4515 www.mid-michiganrecycling.com
Truck Wood Chips < 2 inch 400,000 46 or
23 Macomb, Livonia
Michigan Wood Pellet Fuel, LLC 616-355-4955 www.michiganwoodpellets.com
Truck Wood Pellets < 1 inch 50,000 190 Holland
Fiber By Products 269-482-0066 www.fiberby-products.com
Truck Wood
Pellets/ Shavings
< 1 inch 40,000 140 White Pigeon
Beninati Contracting Services 586-243-4452
Truck Wood Chips < 2 inch 40,000 35 Shelby
Township
Brink Wood Products, Inc. 616-878-9190 www.brinkwoodproducts.net
Truck Wood Chips < 2 inch 30,000 153 Byron
Center
Harry Fox Inc. 586-772-0300
Truck Wood Chips < 2 inch 10,000 24 Roseville
Note: TTS Chips North, Inc. plans to implement wood pellet plants in the near future that may be capable of supplying varying sizes of pellets by 2011(according to William Timmons, CEO of TTS Chips North, Inc.)
As shown in the Table 1, all but three of the suppliers are small-scale operations with production rates of
50,000 tons per year or less. WMS's ultimate goal of co-firing 30 percent woody biomass by 2025 would
require approximately 39,055 tons per year. This eliminates all but three of the suppliers, due to risk in
availability.
Barr Engineering Company Page 4
According to the U.S. Department of Energy, “One of the most important keys to a successful co-firing
operation is to appropriately and consistently size the biomass according to the requirements of the type of
boiler used. Biomass that does not meet these specifications is likely to cause flow problems in the fuel
handling equipment or incomplete burnout in the boiler.”2 General biomass sizing requirements for each
boiler type, as reported by the U.S. Department of Energy, are shown in Table 2.
Table 2 Biomass Sizing Requirements
Existing Type of Boiler Size Required (inches) Pulverized Coal ≤ 1/4
Stoker ≤ 3 Cyclone ≤ 1.2
Fluidized Bed ≤3
The biomass was added on top of the circulating fluidized bed for the test burn. Due to the operation of a
fluidized bed boiler a larger fuel size is required to keep the fuel within the bed as opposed to burning
above the bed or from being carried further down the flue gas stream and possibly burning in the
ductwork. During the biomass fuel supplier review it was determined that the renewaFUEL product
would be the best and possibly only product that would meet the size requirements for the WMS Unit #8
test burn. The renewaFUEL product size also removed the requirement for material handling
modifications to perform the test burn. All other fuel products would have required large monetary
investment in order to feed the product into the boiler. This was a limiting factor in the decision making
process for WMS and therefore left only the renewaFUEL product as a feasible biomass supplier for this
test.
2.2 Selected Biomass Fuel Supplier
Currently, renewaFUEL is the only wood biomass fuel supplier, discovered during this study, within 120
miles of the WMS facility capable of supplying the densified wood cube in the size (two inches and
larger) that meets the sizing requirements for co-firing biomass in a fluidized-bed boiler such as WMS’s
Unit#8. The other suppliers listed above are capable of providing either wood chips or wood pellets in
various quantities but at sizes smaller than two inches. A photograph of the renewaFUEL product is
shown in Figure 1.
2 US Department of Energy, “Federal Technology Alert - Biomass Co-firing in Coal-Fired Boilers,” Energy Efficiency and Renewable Energy, 26 April 2006, www.eere.energy.gov/femp/
Barr Engineering Company Page 5
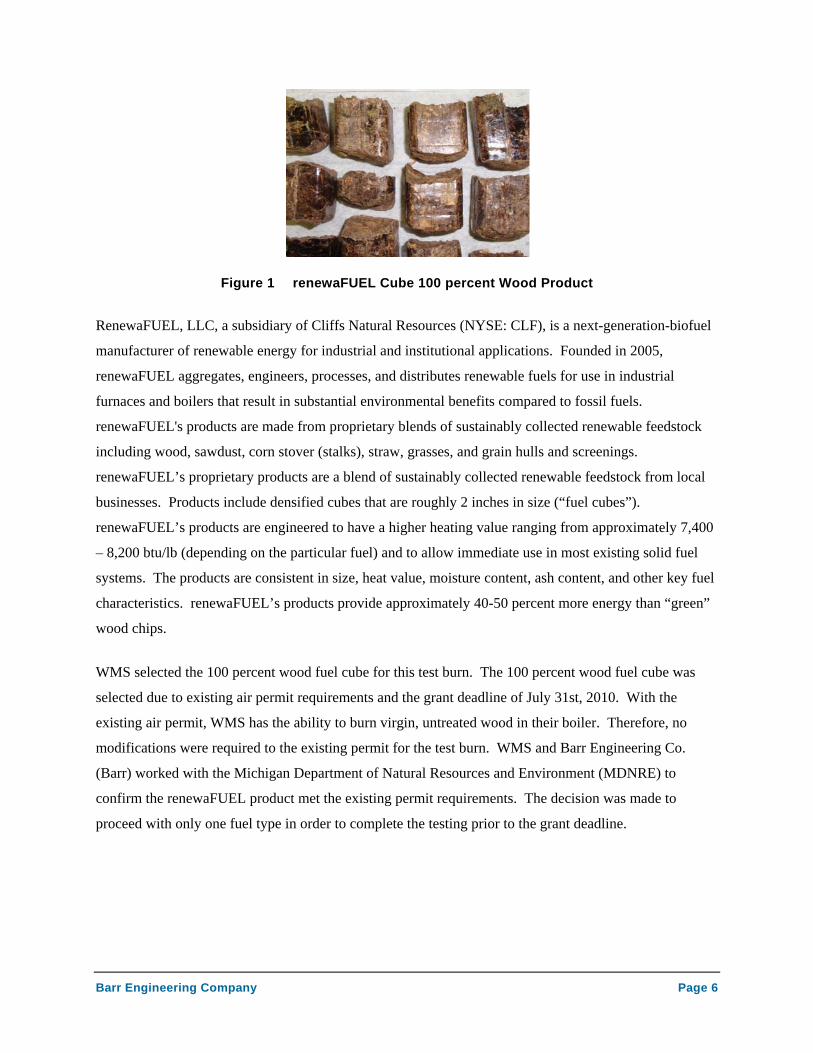
Figure 1 renewaFUEL Cube 100 percent Wood Product
RenewaFUEL, LLC, a subsidiary of Cliffs Natural Resources (NYSE: CLF), is a next-generation-biofuel
manufacturer of renewable energy for industrial and institutional applications. Founded in 2005,
renewaFUEL aggregates, engineers, processes, and distributes renewable fuels for use in industrial
furnaces and boilers that result in substantial environmental benefits compared to fossil fuels.
renewaFUEL's products are made from proprietary blends of sustainably collected renewable feedstock
including wood, sawdust, corn stover (stalks), straw, grasses, and grain hulls and screenings.
renewaFUEL’s proprietary products are a blend of sustainably collected renewable feedstock from local
businesses. Products include densified cubes that are roughly 2 inches in size (“fuel cubes”).
renewaFUEL’s products are engineered to have a higher heating value ranging from approximately 7,400
– 8,200 btu/lb (depending on the particular fuel) and to allow immediate use in most existing solid fuel
systems. The products are consistent in size, heat value, moisture content, ash content, and other key fuel
characteristics. renewaFUEL’s products provide approximately 40-50 percent more energy than “green”
wood chips.
WMS selected the 100 percent wood fuel cube for this test burn. The 100 percent wood fuel cube was
selected due to existing air permit requirements and the grant deadline of July 31st, 2010. With the
existing air permit, WMS has the ability to burn virgin, untreated wood in their boiler. Therefore, no
modifications were required to the existing permit for the test burn. WMS and Barr Engineering Co.
(Barr) worked with the Michigan Department of Natural Resources and Environment (MDNRE) to
confirm the renewaFUEL product met the existing permit requirements. The decision was made to
proceed with only one fuel type in order to complete the testing prior to the grant deadline.
Barr Engineering Company Page 6

3 Biomass Fuel Test Burn
3.1 Biomass Test Burn Methodology
One of the project’s objectives was to evaluate changes in boiler performance due to co-firing woody
biomass fuel with WMS’s current fuel blend of 60 percent Powder River Basin (PRB) Coal and 40
percent Tire Derived Fuel (TDF). Boiler operation performance with regard to efficiency, emissions, and
fly-ash characteristics were evaluated while combusting 100 percent PRB Coal/TDF fuel blend (Baseline
Test) and then reevaluated while co-firing a renewaFUEL woody biomass cubed product made of 100
percent wood at two different rates. The baseline test was performed on May 14th, 2010. The co-firing
verification evaluation was performed from June 9th through June 10th. For detailed information of the
baseline and verification evaluation, see the Test Burn Procedure in Appendix Q.
The testing of the renewaFUEL product was limited to the following operating points for WMS Unit #8
Boiler:
1) Baseline – Firing 100 percent PRB Coal/TDF fuel blend at a normal operating load of
180,000 lb/hr.
2) Test Burn #1 – Firing 70 percent PRB Coal/TDF fuel blend and 30 percent woody biomass
by heat input at an operating load of 160,000 lb/hr.
3) Test Burn #2 – Firing 85 percent PRB Coal/TDF fuel blend and 15 percent woody biomass
by heat input at an operating load of 160,000 lb/hr.
Two modifications were made to the original biomass test burn procedure. The original test plan
indicated that all tests would be conducted at a steam flow of 180,000 lb/hr. This steam flow rate
was selected by WMS because this is where the boiler typically operates on a day-to-day basis.
Unfortunately, after the baseline test had been completed and prior to the test burn being conducted,
WMS’s Turbine #5 tripped. Therefore, WMS was no longer able to run Unit #8 at 180,000 lb/hr.
The test burns were conducted at 160,000 lb/hr, the maximum steam flow that WMS could handle
with Turbine #5 down for maintenance. The second modification to the test plan was due to the
limitations of the limestone feeder used to supply the 60 percent biomass fuel by heat input at the
feed rate required; it was decided to perform the third test at 15 percent biomass fuel by heat input.
In addition to the limestone feeder limitations, increased temperature in the feed pipe was observed
by the WMS staff and safety became the sounding factor of the decision to limit the biomass feed
rate to 15 percent by heat input.
Barr Engineering Company Page 7
Emissions testing for this program was conducted using the continuing emissions monitoring system
(CEMS) for CO, CO2, NOx, SO2 and continuous opacity monitoring system for opacity, which are located
upstream of the stack.
3.2 Facility and Boiler
The testing was completed on the WMS Unit #8 boiler which is a 25 MW circulating fluidized-bed boiler
permitted to fire coal, untreated virgin wood, and TDF. This boiler is currently fired with a 60:40 blend
PRB Coal and TDF. The exhaust gas from Unit #8 is directed to a baghouse which collects flyash.
Bottom ash and fly ash generated by the boilers is removed and disposed of in a local landfill.
The CEMS monitors flue gas CO, CO2, NOx, SO2 and Opacity concentrations. Table 3 summarizes the
Unit #8 CEMS specifications.
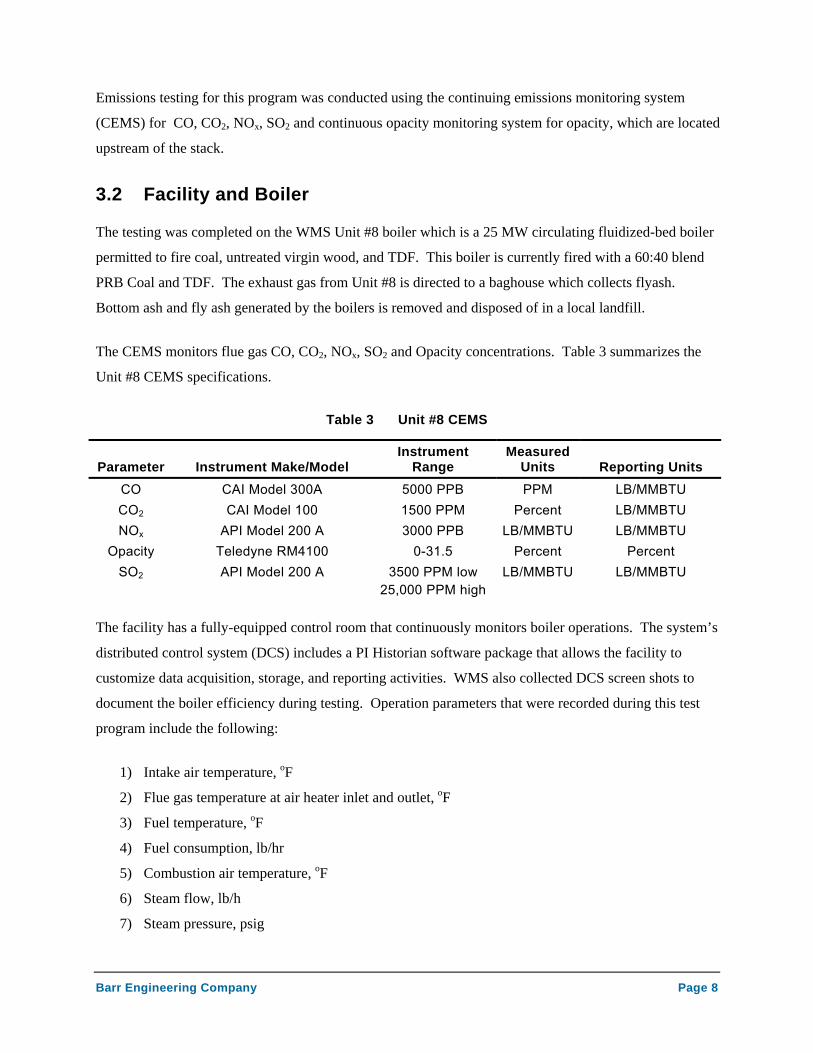
Table 3 Unit #8 CEMS
Parameter Instrument Make/Model Instrument
Range Measured
Units Reporting Units CO CAI Model 300A 5000 PPB PPM LB/MMBTU CO2 CAI Model 100 1500 PPM Percent LB/MMBTU NOx API Model 200 A 3000 PPB LB/MMBTU LB/MMBTU
Opacity Teledyne RM4100 0-31.5 Percent Percent SO2 API Model 200 A 3500 PPM low
25,000 PPM high LB/MMBTU LB/MMBTU
The facility has a fully-equipped control room that continuously monitors boiler operations. The system’s
distributed control system (DCS) includes a PI Historian software package that allows the facility to
customize data acquisition, storage, and reporting activities. WMS also collected DCS screen shots to
document the boiler efficiency during testing. Operation parameters that were recorded during this test
program include the following:
1) Intake air temperature, oF
2) Flue gas temperature at air heater inlet and outlet, oF
3) Fuel temperature, oF
4) Fuel consumption, lb/hr
5) Combustion air temperature, oF
6) Steam flow, lb/h
7) Steam pressure, psig
Barr Engineering Company Page 8
8) Steam temperature, oF
9) Supply water pressure, psig
10) Supply water temperature, oF
11) Power generation, kW
12) Excess O2
13) Moisture in ambient air, lb/lb dry air
These data were recorded using the PI Historian software package and the DCS system during each test
period. Readings were recorded every five minutes during each test period using an assigned start and
end tag, and then averaged over the test period to document boiler operations during co-firing rates, and
boiler efficiency. Key parameters such as heat input and steam flow are summarized in the results section
of this report.
3.3 Fuel Handling Field Test
The biomass fuel cubes were delivered via a walking-bed truck and dumped onto the Unit#8 reclaim. The
cubes were then conveyed via the existing conveying system to the Unit #8 limestone silo. The limestone
silo housed the biomass fuel for the duration of the test burns. This was done to alleviate costs associated
with adding new storage. Another option was to build a dividing wall in the existing Unit#8 coal bunker
separating the two pant legs which feed into coal feeders A and B. The addition of the dividing wall
would have created an additional cost of approximately $100,000. Therefore, it was decided to empty the
limestone silo, mix the limestone manually with the bed gravel, and utilize the limestone silo to house the
biomass. The biomass was fed into the boiler via the limestone feed pipe which is located at the
centerline of the boiler wall and approximately five feet above the boiler -bed elevation.
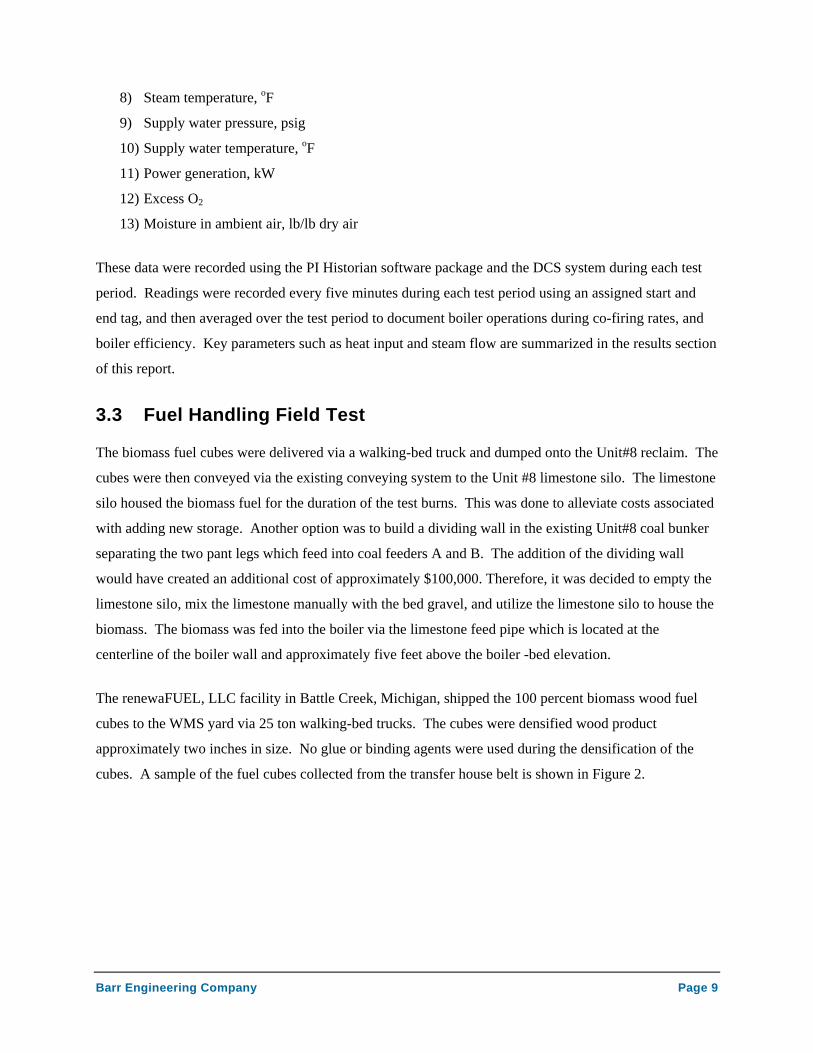
The renewaFUEL, LLC facility in Battle Creek, Michigan, shipped the 100 percent biomass wood fuel
cubes to the WMS yard via 25 ton walking-bed trucks. The cubes were densified wood product
approximately two inches in size. No glue or binding agents were used during the densification of the
cubes. A sample of the fuel cubes collected from the transfer house belt is shown in Figure 2.
Barr Engineering Company Page 9
.
Figure 2 renewaFUEL Cube 100 Percent Wood Product off Transfer House Belt
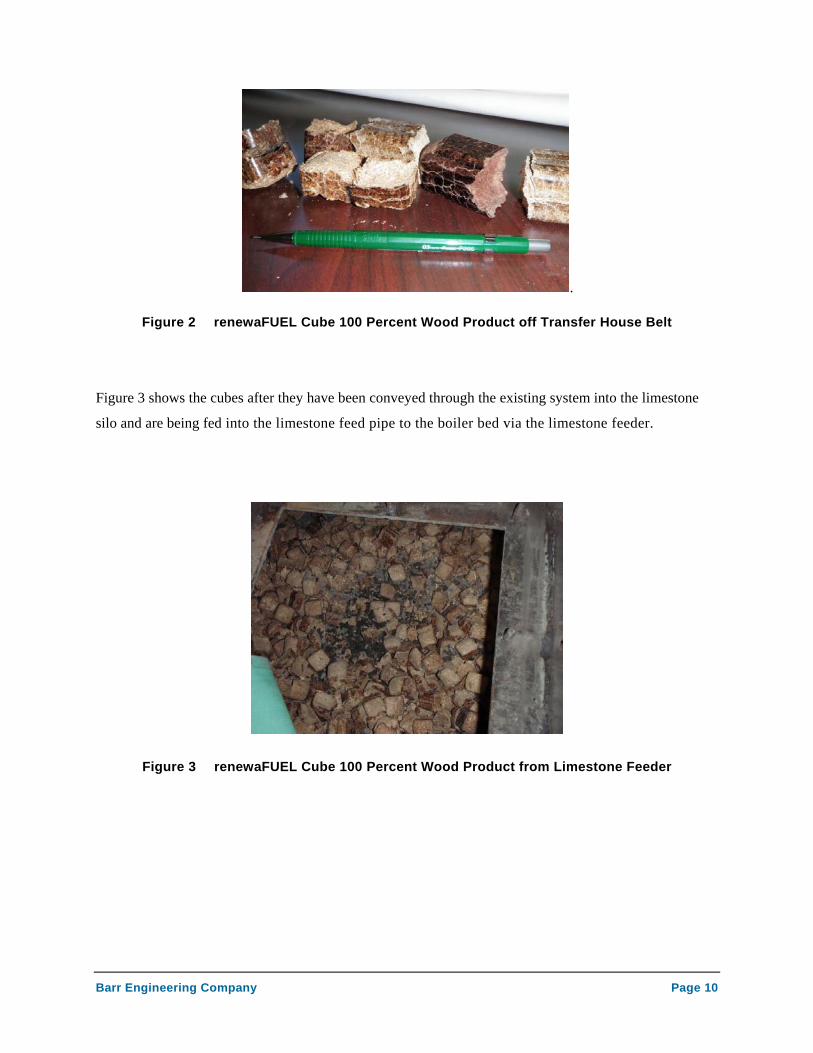
Figure 3 shows the cubes after they have been conveyed through the existing system into the limestone
silo and are being fed into the limestone feed pipe to the boiler bed via the limestone feeder.
Figure 3 renewaFUEL Cube 100 Percent Wood Product from Limestone Feeder
Barr Engineering Company Page 10

Proximate and ultimate analysis of the cubed wood product used for this testing is as follows in Table 4.
Table 4 Proximate and Ultimate Analysis
Analysis
Percent by Weight as
Received
30 Percent
Test
15 Percent
Test
Proximate
Moisture 7.89 8.30
Ash 0.70 1.04
Volatile Matter 76.77 73.33
Fixed Carbon 14.64 17.33
Ultimate
Carbon 43.98 45.57
Hydrogen 5.45 5.58
Nitrogen 0.11 0.29
Oxygen 41.83 39.18
Sulfur 0.04 0.04
The average heating value was 7,645 British thermal units per pound (Btu/lb) of the biomass cubed wood
product.
Two-hundred and fifty tons (T) of renewaFUEL 100 percent wood product was delivered to the WMS
site. The biomass fuel was fed into the limestone silo and the PRB Coal/TDF 60:40 fuel blend was fed
into the Coal Bunker #8. The fuels were not blended prior to entering the boiler. Therefore, the boiler
bed received coal as it typically does during operation with the biomass fuel inserted approximately five
feet above the bed through the limestone feed pipe.
3.3.2 Field Testing Matrix
A baseline test was performed on May 14th while firing a 60:40 fuel blend of PRB Coal and TDF at
180,000 lb/hr. On June 9th, a second set of tests began while co-firing wood renewaFUEL product at
160,000 lb/hr with WMS PRB Coal/TDF fuel blend in various mixture ratios. The duration of the tests
run are shown in Table 5 – WMS Biomass Co-firing Program Test Matrix. Other than changes in fuel
composition, all other boiler operations were replicated as closely as possible during test sets except for
Barr Engineering Company Page 11
the steam flow rate that was adjusted due to the Turbine #5 trip. Test and sampling procedures were also
consistent between sets of tests. For further information and details of the test burn see Appendix Q.
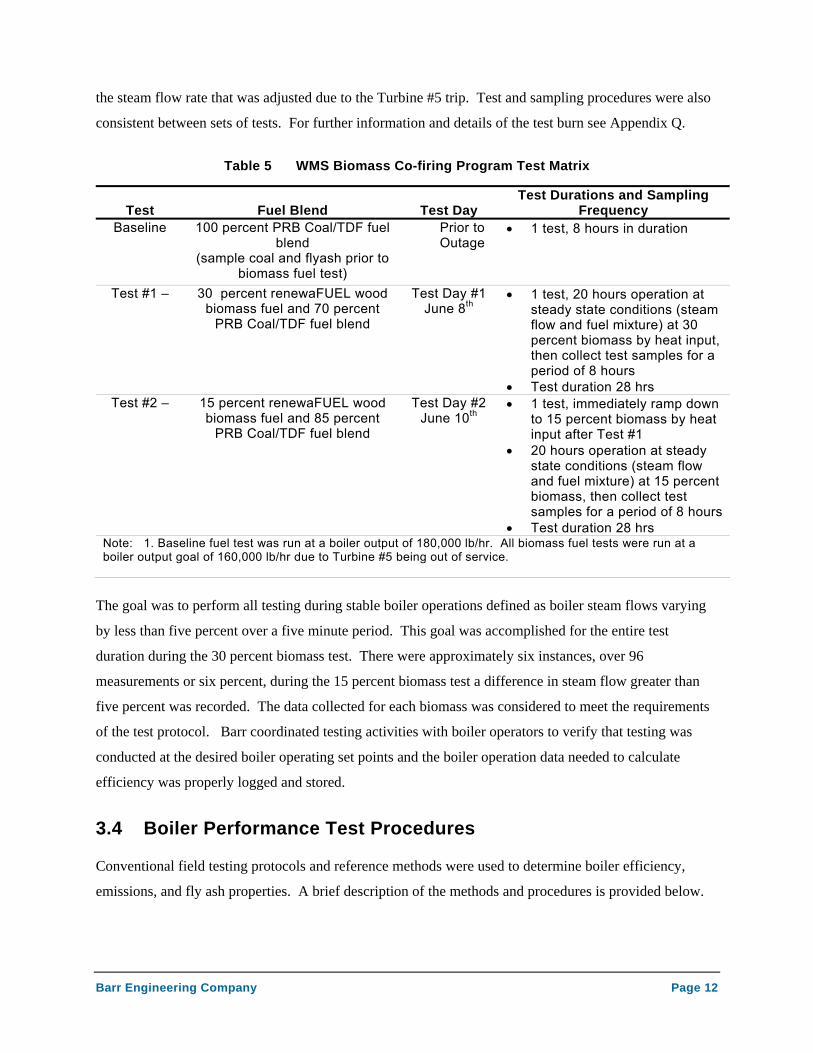
Table 5 WMS Biomass Co-firing Program Test Matrix
Test Fuel Blend Test Day Test Durations and Sampling
Frequency Baseline 100 percent PRB Coal/TDF fuel
blend (sample coal and flyash prior to
biomass fuel test)
Prior to Outage
• 1 test, 8 hours in duration
Test #1 – 30 percent renewaFUEL wood biomass fuel and 70 percent
PRB Coal/TDF fuel blend
Test Day #1 June 8th
• 1 test, 20 hours operation at steady state conditions (steam flow and fuel mixture) at 30 percent biomass by heat input, then collect test samples for a period of 8 hours
• Test duration 28 hrs Test #2 – 15 percent renewaFUEL wood
biomass fuel and 85 percent PRB Coal/TDF fuel blend
Test Day #2 June 10th
• 1 test, immediately ramp down to 15 percent biomass by heat input after Test #1
• 20 hours operation at steady state conditions (steam flow and fuel mixture) at 15 percent biomass, then collect test samples for a period of 8 hours
• Test duration 28 hrs Note: 1. Baseline fuel test was run at a boiler output of 180,000 lb/hr. All biomass fuel tests were run at a boiler output goal of 160,000 lb/hr due to Turbine #5 being out of service.
The goal was to perform all testing during stable boiler operations defined as boiler steam flows varying
by less than five percent over a five minute period. This goal was accomplished for the entire test
duration during the 30 percent biomass test. There were approximately six instances, over 96
measurements or six percent, during the 15 percent biomass test a difference in steam flow greater than
five percent was recorded. The data collected for each biomass was considered to meet the requirements
of the test protocol. Barr coordinated testing activities with boiler operators to verify that testing was
conducted at the desired boiler operating set points and the boiler operation data needed to calculate
efficiency was properly logged and stored.
3.4 Boiler Performance Test Procedures
Conventional field testing protocols and reference methods were used to determine boiler efficiency,
emissions, and fly ash properties. A brief description of the methods and procedures is provided below.
Barr Engineering Company Page 12
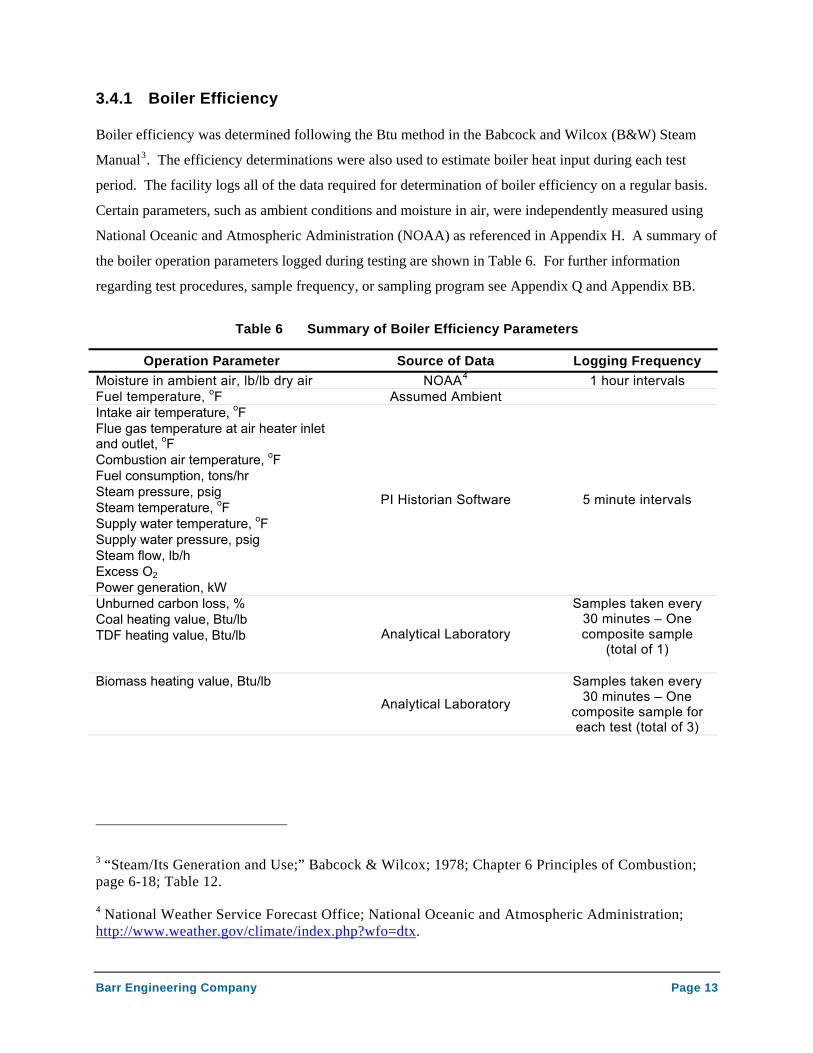
3.4.1 Boiler Efficiency
Boiler efficiency was determined following the Btu method in the Babcock and Wilcox (B&W) Steam
Manual3. The efficiency determinations were also used to estimate boiler heat input during each test
period. The facility logs all of the data required for determination of boiler efficiency on a regular basis.
Certain parameters, such as ambient conditions and moisture in air, were independently measured using
National Oceanic and Atmospheric Administration (NOAA) as referenced in Appendix H. A summary of
the boiler operation parameters logged during testing are shown in Table 6. For further information
regarding test procedures, sample frequency, or sampling program see Appendix Q and Appendix BB.
Table 6 Summary of Boiler Efficiency Parameters
Operation Parameter Source of Data Logging Frequency Moisture in ambient air, lb/lb dry air NOAA4 1 hour intervals Fuel temperature, oF Assumed Ambient Intake air temperature, oF Flue gas temperature at air heater inlet and outlet, oF Combustion air temperature, oF Fuel consumption, tons/hr Steam pressure, psig Steam temperature, oF Supply water temperature, oF Supply water pressure, psig Steam flow, lb/h Excess O2 Power generation, kW
PI Historian Software 5 minute intervals
Unburned carbon loss, % Coal heating value, Btu/lb TDF heating value, Btu/lb Analytical Laboratory
Samples taken every 30 minutes – One composite sample
(total of 1)
Biomass heating value, Btu/lb
Analytical Laboratory
Samples taken every 30 minutes – One
composite sample for each test (total of 3)
3 “Steam/Its Generation and Use;” Babcock & Wilcox; 1978; Chapter 6 Principles of Combustion; page 6-18; Table 12.
4 National Weather Service Forecast Office; National Oceanic and Atmospheric Administration; http://www.weather.gov/climate/index.php?wfo=dtx.
Barr Engineering Company Page 13
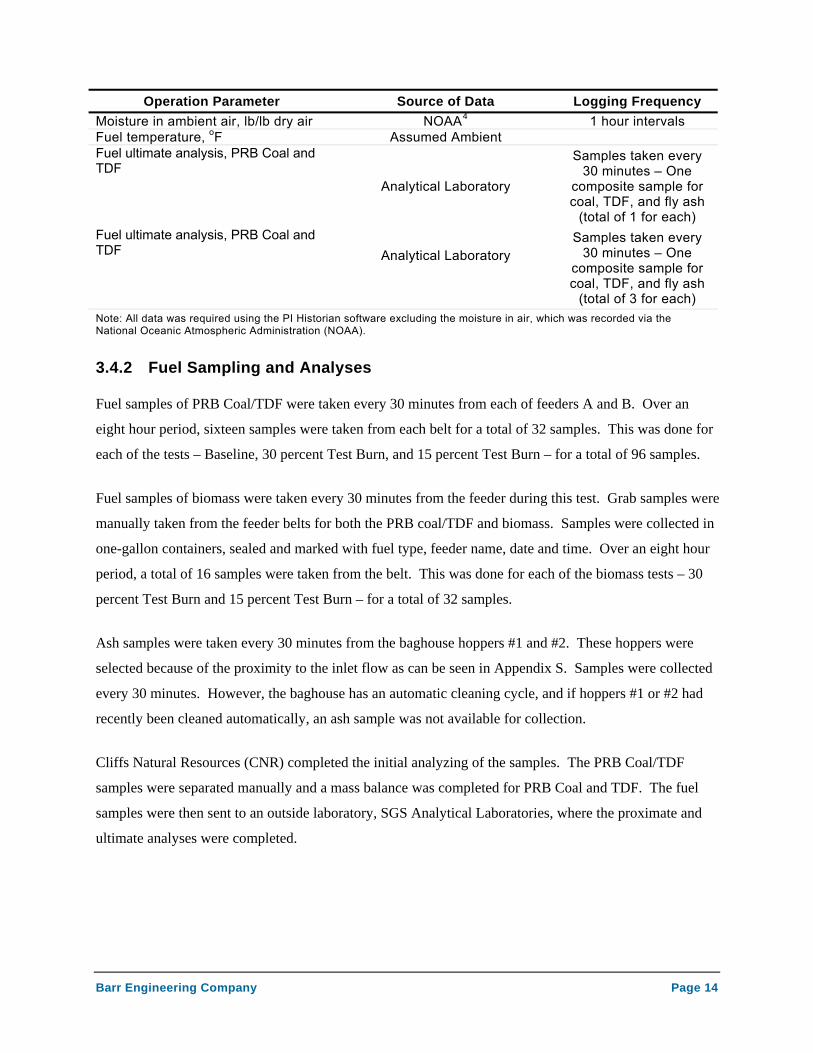
Operation Parameter Source of Data Logging Frequency Moisture in ambient air, lb/lb dry air NOAA4 1 hour intervals Fuel temperature, oF Assumed Ambient Fuel ultimate analysis, PRB Coal and TDF
Analytical Laboratory
Samples taken every 30 minutes – One
composite sample for coal, TDF, and fly ash
(total of 1 for each) Fuel ultimate analysis, PRB Coal and TDF
Analytical Laboratory
Samples taken every 30 minutes – One
composite sample for coal, TDF, and fly ash
(total of 3 for each) Note: All data was required using the PI Historian software excluding the moisture in air, which was recorded via the National Oceanic Atmospheric Administration (NOAA).
3.4.2 Fuel Sampling and Analyses
Fuel samples of PRB Coal/TDF were taken every 30 minutes from each of feeders A and B. Over an
eight hour period, sixteen samples were taken from each belt for a total of 32 samples. This was done for
each of the tests – Baseline, 30 percent Test Burn, and 15 percent Test Burn – for a total of 96 samples.
Fuel samples of biomass were taken every 30 minutes from the feeder during this test. Grab samples were
manually taken from the feeder belts for both the PRB coal/TDF and biomass. Samples were collected in
one-gallon containers, sealed and marked with fuel type, feeder name, date and time. Over an eight hour
period, a total of 16 samples were taken from the belt. This was done for each of the biomass tests – 30
percent Test Burn and 15 percent Test Burn – for a total of 32 samples.
Ash samples were taken every 30 minutes from the baghouse hoppers #1 and #2. These hoppers were
selected because of the proximity to the inlet flow as can be seen in Appendix S. Samples were collected
every 30 minutes. However, the baghouse has an automatic cleaning cycle, and if hoppers #1 or #2 had
recently been cleaned automatically, an ash sample was not available for collection.
Cliffs Natural Resources (CNR) completed the initial analyzing of the samples. The PRB Coal/TDF
samples were separated manually and a mass balance was completed for PRB Coal and TDF. The fuel
samples were then sent to an outside laboratory, SGS Analytical Laboratories, where the proximate and
ultimate analyses were completed.
Barr Engineering Company Page 14
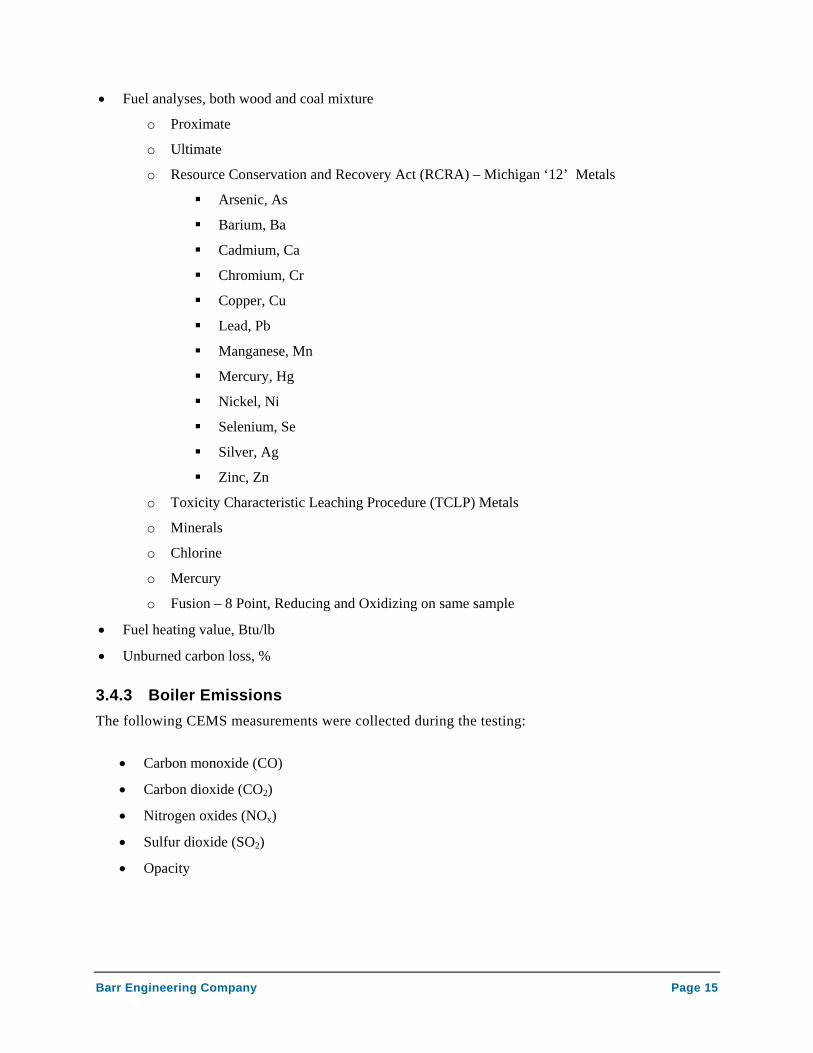
• Fuel analyses, both wood and coal mixture
o Proximate
o Ultimate
o Resource Conservation and Recovery Act (RCRA) – Michigan ‘12’ Metals
Arsenic, As
Barium, Ba
Cadmium, Ca
Chromium, Cr
Copper, Cu
Lead, Pb
Manganese, Mn
Mercury, Hg
Nickel, Ni
Selenium, Se
Silver, Ag
Zinc, Zn
o Toxicity Characteristic Leaching Procedure (TCLP) Metals
o Minerals
o Chlorine
o Mercury
o Fusion – 8 Point, Reducing and Oxidizing on same sample
• Fuel heating value, Btu/lb
• Unburned carbon loss, %
3.4.3 Boiler Emissions The following CEMS measurements were collected during the testing:
• Carbon monoxide (CO)
• Carbon dioxide (CO2)
• Nitrogen oxides (NOx)
• Sulfur dioxide (SO2)
• Opacity
Barr Engineering Company Page 15
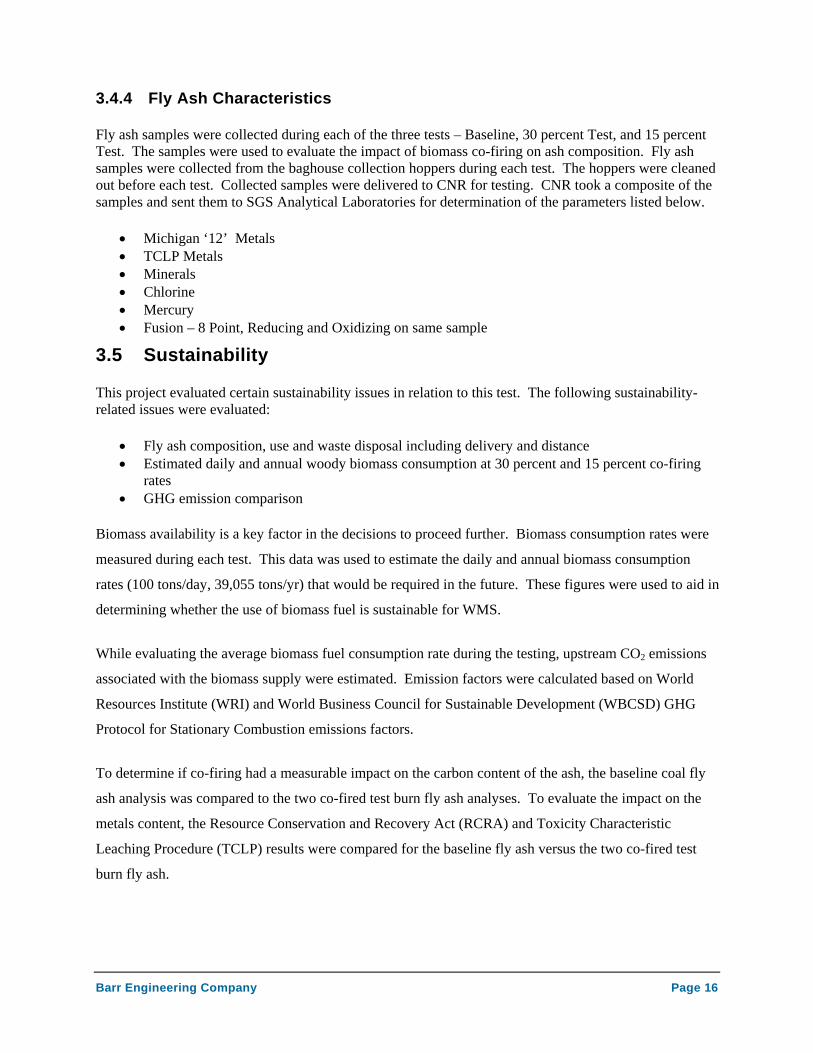
3.4.4 Fly Ash Characteristics
Fly ash samples were collected during each of the three tests – Baseline, 30 percent Test, and 15 percent Test. The samples were used to evaluate the impact of biomass co-firing on ash composition. Fly ash samples were collected from the baghouse collection hoppers during each test. The hoppers were cleaned out before each test. Collected samples were delivered to CNR for testing. CNR took a composite of the samples and sent them to SGS Analytical Laboratories for determination of the parameters listed below.
• Michigan ‘12’ Metals • TCLP Metals • Minerals • Chlorine • Mercury • Fusion – 8 Point, Reducing and Oxidizing on same sample
3.5 Sustainability
This project evaluated certain sustainability issues in relation to this test. The following sustainability- related issues were evaluated:
• Fly ash composition, use and waste disposal including delivery and distance • Estimated daily and annual woody biomass consumption at 30 percent and 15 percent co-firing
rates • GHG emission comparison
Biomass availability is a key factor in the decisions to proceed further. Biomass consumption rates were
measured during each test. This data was used to estimate the daily and annual biomass consumption
rates (100 tons/day, 39,055 tons/yr) that would be required in the future. These figures were used to aid in
determining whether the use of biomass fuel is sustainable for WMS.
While evaluating the average biomass fuel consumption rate during the testing, upstream CO2 emissions
associated with the biomass supply were estimated. Emission factors were calculated based on World
Resources Institute (WRI) and World Business Council for Sustainable Development (WBCSD) GHG
Protocol for Stationary Combustion emissions factors.
To determine if co-firing had a measurable impact on the carbon content of the ash, the baseline coal fly
ash analysis was compared to the two co-fired test burn fly ash analyses. To evaluate the impact on the
metals content, the Resource Conservation and Recovery Act (RCRA) and Toxicity Characteristic
Leaching Procedure (TCLP) results were compared for the baseline fly ash versus the two co-fired test
burn fly ash.
Barr Engineering Company Page 16

4 Test Burn Results
The results of the biomass fuel co-firing on WMS Unit #8 are summarized in the following
paragraphs.
Field and analytical data collected during the verification process are compiled in Appendix O.
Overall, the WMS Unit #8 boiler was able to handle and burn the biomass fuel with nominal changes
in operation. As stated in section 2, the only variation in fuel handling applied was storage of the
biomass fuel in the limestone silo in lieu of the Unit #8 coal bunker. This was done to prevent the
biomass fuel from absorbing moisture from the inherently moist PRB Coal and to reduce unnecessary
costs associated with testing. Other than this modification, the WMS facility was capable of
accommodating the biomass in their boiler.
The third test was originally set to run at a 60 percent biomass fuel by heat input to determine the
capability of the boiler. However, due to the limitations of the limestone feeder used to supply the
60 percent biomass fuel by heat input at the feed rate required, it was decided to perform the third
test at 15 percent biomass fuel by heat input. In addition to the limestone feeder limitations,
increased temperature in the feed pipe was observed by the WMS staff and safety became the
sounding factor of the decision to limit the biomass feed rate to 15 percent by heat input.
When evaluating whether biomass co-firing resulted in identifiable changes in boiler performance,
standard deviation in results were addressed using statistical analysis. This method aided in
determining the statistical significance of the observed changes in boiler efficiency or emissions.
Barr Engineering Company Page 17
4.1 Boiler Efficiency
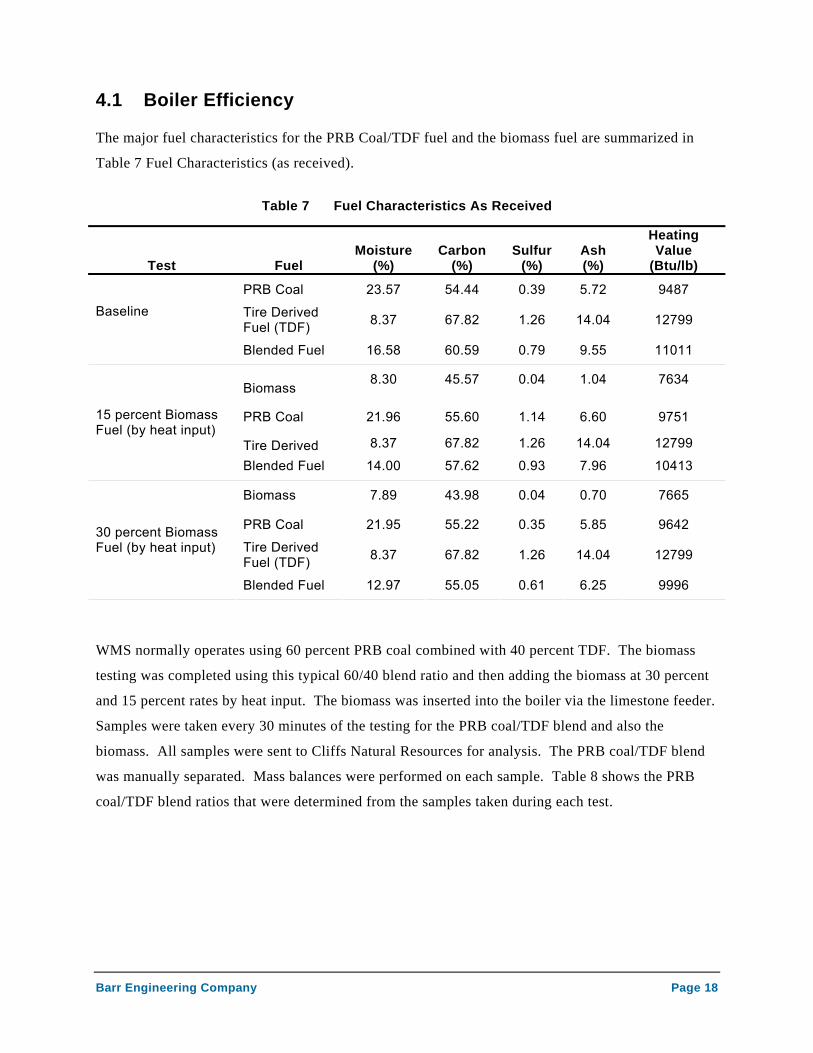
The major fuel characteristics for the PRB Coal/TDF fuel and the biomass fuel are summarized in
Table 7 Fuel Characteristics (as received).
Table 7 Fuel Characteristics As Received
Test Fuel Moisture
(%) Carbon
(%) Sulfur
(%) Ash (%)
Heating Value
(Btu/lb)
PRB Coal 23.57 54.44 0.39 5.72 9487
Tire Derived Fuel (TDF) 8.37 67.82 1.26 14.04 12799 Baseline
Blended Fuel 16.58 60.59 0.79 9.55 11011
Biomass
8.30 45.57 0.04 1.04 7634
PRB Coal
21.96
55.60
1.14
6.60
9751
Tire Derived 8.37 67.82 1.26 14.04 12799
15 percent Biomass Fuel (by heat input)
Blended Fuel 14.00 57.62 0.93 7.96 10413
Biomass 7.89 43.98 0.04 0.70 7665
PRB Coal 21.95 55.22 0.35 5.85 9642
Tire Derived Fuel (TDF) 8.37 67.82 1.26 14.04 12799
30 percent Biomass Fuel (by heat input)
Blended Fuel 12.97 55.05 0.61 6.25 9996
WMS normally operates using 60 percent PRB coal combined with 40 percent TDF. The biomass
testing was completed using this typical 60/40 blend ratio and then adding the biomass at 30 percent
and 15 percent rates by heat input. The biomass was inserted into the boiler via the limestone feeder.
Samples were taken every 30 minutes of the testing for the PRB coal/TDF blend and also the
biomass. All samples were sent to Cliffs Natural Resources for analysis. The PRB coal/TDF blend
was manually separated. Mass balances were performed on each sample. Table 8 shows the PRB
coal/TDF blend ratios that were determined from the samples taken during each test.
Barr Engineering Company Page 18
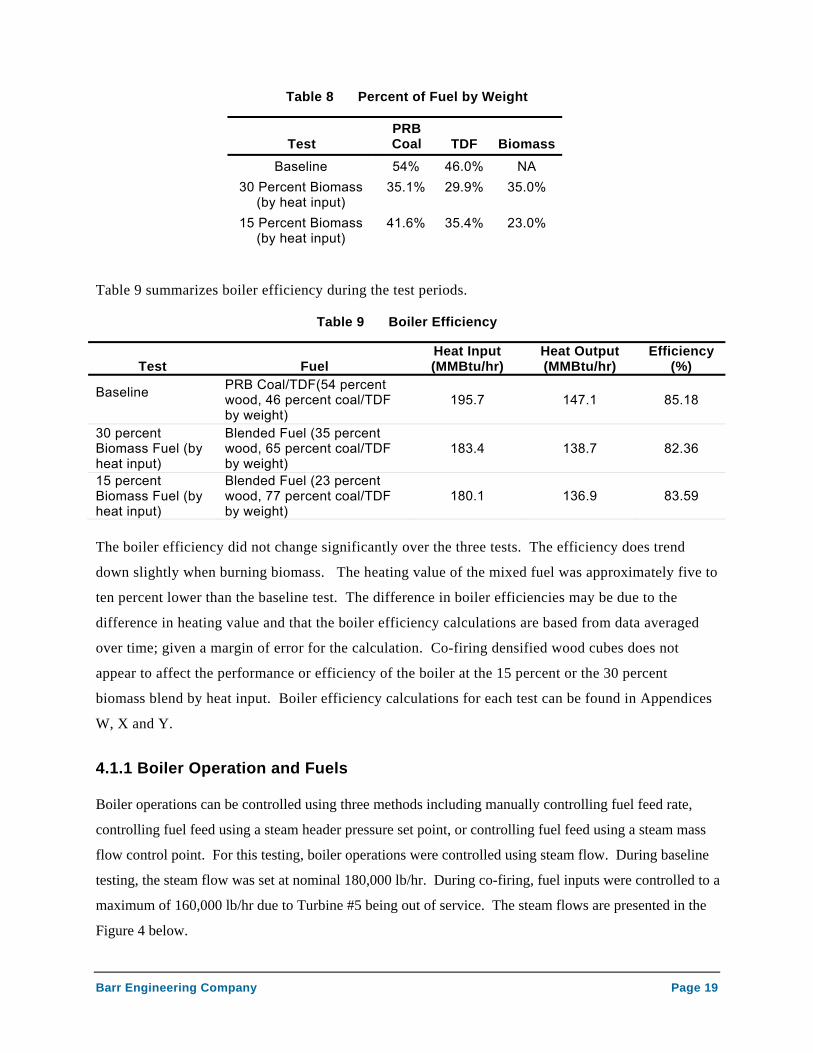
Table 8 Percent of Fuel by Weight
Test PRB Coal TDF Biomass
Baseline 54% 46.0% NA 30 Percent Biomass
(by heat input) 35.1% 29.9% 35.0%
15 Percent Biomass (by heat input)
41.6% 35.4% 23.0%
Table 9 summarizes boiler efficiency during the test periods.
Table 9 Boiler Efficiency
Test Fuel Heat Input (MMBtu/hr)
Heat Output (MMBtu/hr)
Efficiency (%)
Baseline
PRB Coal/TDF(54 percent wood, 46 percent coal/TDF by weight)
195.7 147.1 85.18
30 percent Biomass Fuel (by heat input)
Blended Fuel (35 percent wood, 65 percent coal/TDF by weight)
183.4 138.7 82.36
15 percent Biomass Fuel (by heat input)
Blended Fuel (23 percent wood, 77 percent coal/TDF by weight)
180.1 136.9 83.59
The boiler efficiency did not change significantly over the three tests. The efficiency does trend
down slightly when burning biomass. The heating value of the mixed fuel was approximately five to
ten percent lower than the baseline test. The difference in boiler efficiencies may be due to the
difference in heating value and that the boiler efficiency calculations are based from data averaged
over time; given a margin of error for the calculation. Co-firing densified wood cubes does not
appear to affect the performance or efficiency of the boiler at the 15 percent or the 30 percent
biomass blend by heat input. Boiler efficiency calculations for each test can be found in Appendices
W, X and Y.
4.1.1 Boiler Operation and Fuels
Boiler operations can be controlled using three methods including manually controlling fuel feed rate,
controlling fuel feed using a steam header pressure set point, or controlling fuel feed using a steam mass
flow control point. For this testing, boiler operations were controlled using steam flow. During baseline
testing, the steam flow was set at nominal 180,000 lb/hr. During co-firing, fuel inputs were controlled to a
maximum of 160,000 lb/hr due to Turbine #5 being out of service. The steam flows are presented in the
Figure 4 below.
Barr Engineering Company Page 19
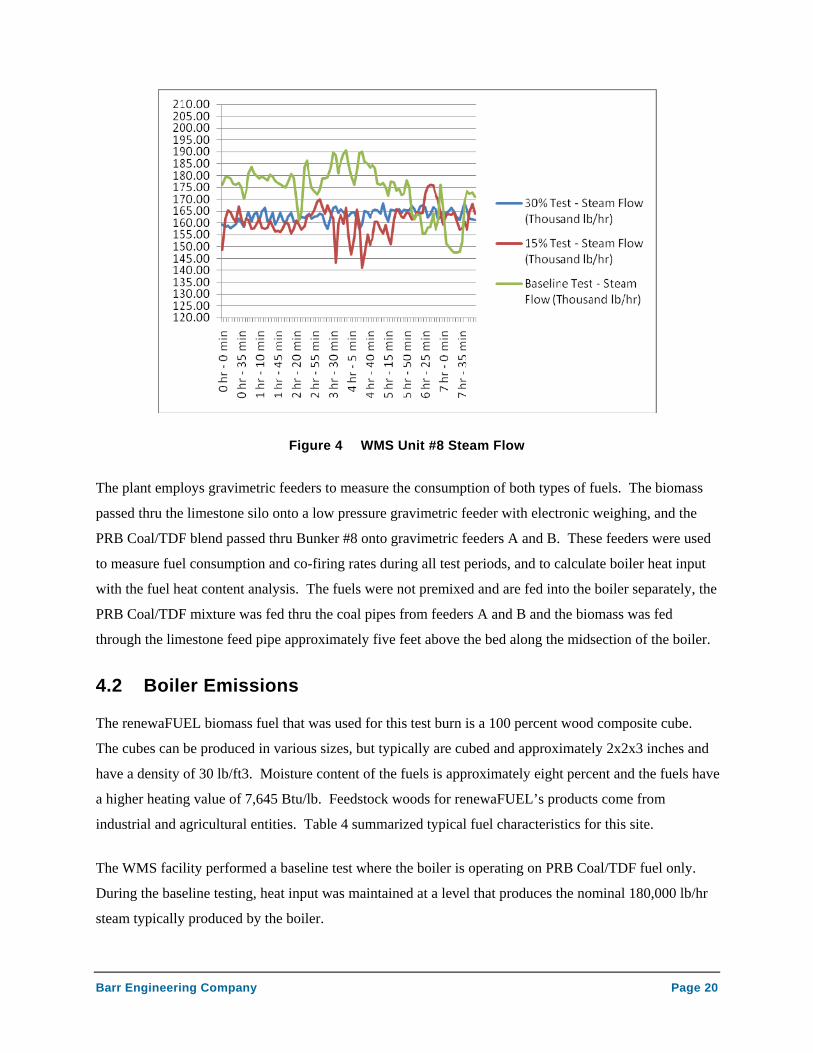
Figure 4 WMS Unit #8 Steam Flow
The plant employs gravimetric feeders to measure the consumption of both types of fuels. The biomass
passed thru the limestone silo onto a low pressure gravimetric feeder with electronic weighing, and the
PRB Coal/TDF blend passed thru Bunker #8 onto gravimetric feeders A and B. These feeders were used
to measure fuel consumption and co-firing rates during all test periods, and to calculate boiler heat input
with the fuel heat content analysis. The fuels were not premixed and are fed into the boiler separately, the
PRB Coal/TDF mixture was fed thru the coal pipes from feeders A and B and the biomass was fed
through the limestone feed pipe approximately five feet above the bed along the midsection of the boiler.
4.2 Boiler Emissions
The renewaFUEL biomass fuel that was used for this test burn is a 100 percent wood composite cube.
The cubes can be produced in various sizes, but typically are cubed and approximately 2x2x3 inches and
have a density of 30 lb/ft3. Moisture content of the fuels is approximately eight percent and the fuels have
a higher heating value of 7,645 Btu/lb. Feedstock woods for renewaFUEL’s products come from
industrial and agricultural entities. Table 4 summarized typical fuel characteristics for this site.
The WMS facility performed a baseline test where the boiler is operating on PRB Coal/TDF fuel only.
During the baseline testing, heat input was maintained at a level that produces the nominal 180,000 lb/hr
steam typically produced by the boiler.
Barr Engineering Company Page 20
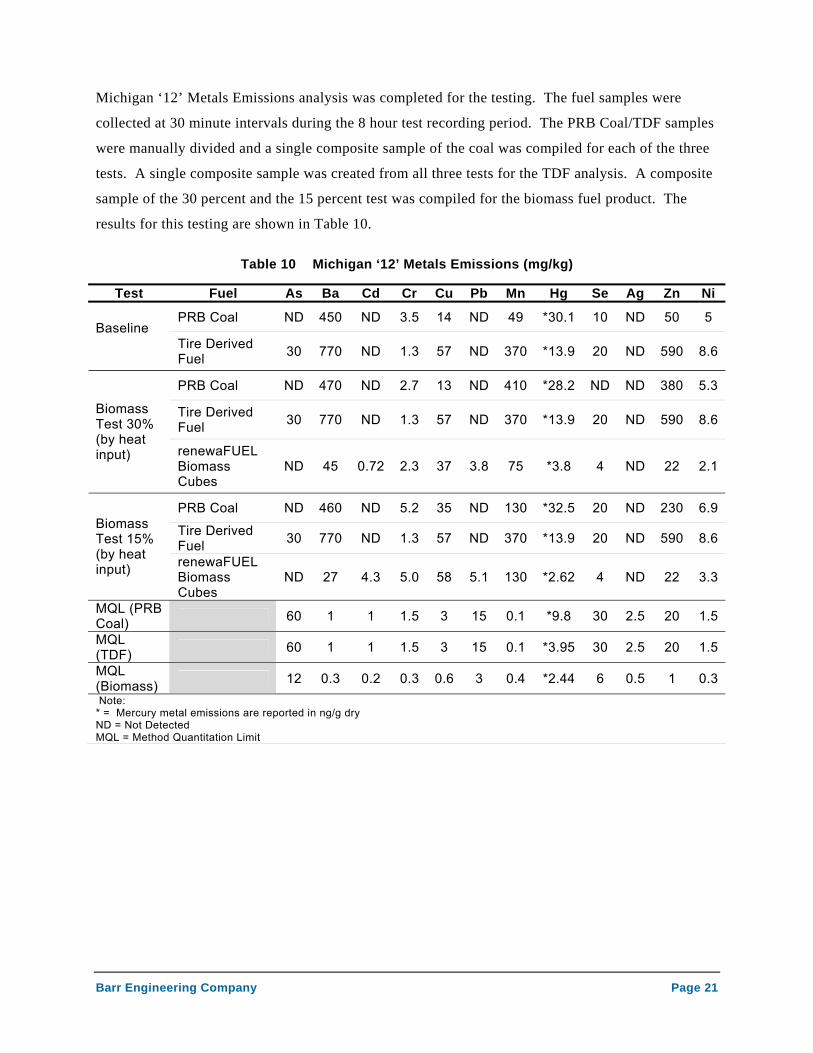
Michigan ‘12’ Metals Emissions analysis was completed for the testing. The fuel samples were
collected at 30 minute intervals during the 8 hour test recording period. The PRB Coal/TDF samples
were manually divided and a single composite sample of the coal was compiled for each of the three
tests. A single composite sample was created from all three tests for the TDF analysis. A composite
sample of the 30 percent and the 15 percent test was compiled for the biomass fuel product. The
results for this testing are shown in Table 10.
Table 10 Michigan ‘12’ Metals Emissions (mg/kg)
Test Fuel As Ba Cd Cr Cu Pb Mn Hg Se Ag Zn Ni
PRB Coal ND 450 ND 3.5 14 ND 49 *30.1 10 ND 50 5 Baseline Tire Derived
Fuel 30 770 ND 1.3 57 ND 370 *13.9 20 ND 590 8.6
PRB Coal ND 470 ND 2.7 13 ND 410 *28.2 ND ND 380 5.3
Tire Derived Fuel 30 770 ND 1.3 57 ND 370 *13.9 20 ND 590 8.6
Biomass Test 30% (by heat input) renewaFUEL
Biomass Cubes
ND 45 0.72 2.3 37 3.8 75 *3.8 4 ND 22 2.1
PRB Coal ND 460 ND 5.2 35 ND 130 *32.5 20 ND 230 6.9
Tire Derived Fuel 30 770 ND 1.3 57 ND 370 *13.9 20 ND 590 8.6
Biomass Test 15% (by heat input) renewaFUEL
Biomass Cubes
ND 27 4.3 5.0 58 5.1 130 *2.62 4 ND 22 3.3
MQL (PRB Coal) 60 1 1 1.5 3 15 0.1 *9.8 30 2.5 20 1.5
MQL (TDF) 60 1 1 1.5 3 15 0.1 *3.95 30 2.5 20 1.5
MQL (Biomass) 12 0.3 0.2 0.3 0.6 3 0.4 *2.44 6 0.5 1 0.3 Note: * = Mercury metal emissions are reported in ng/g dry ND = Not Detected MQL = Method Quantitation Limit
Barr Engineering Company Page 21
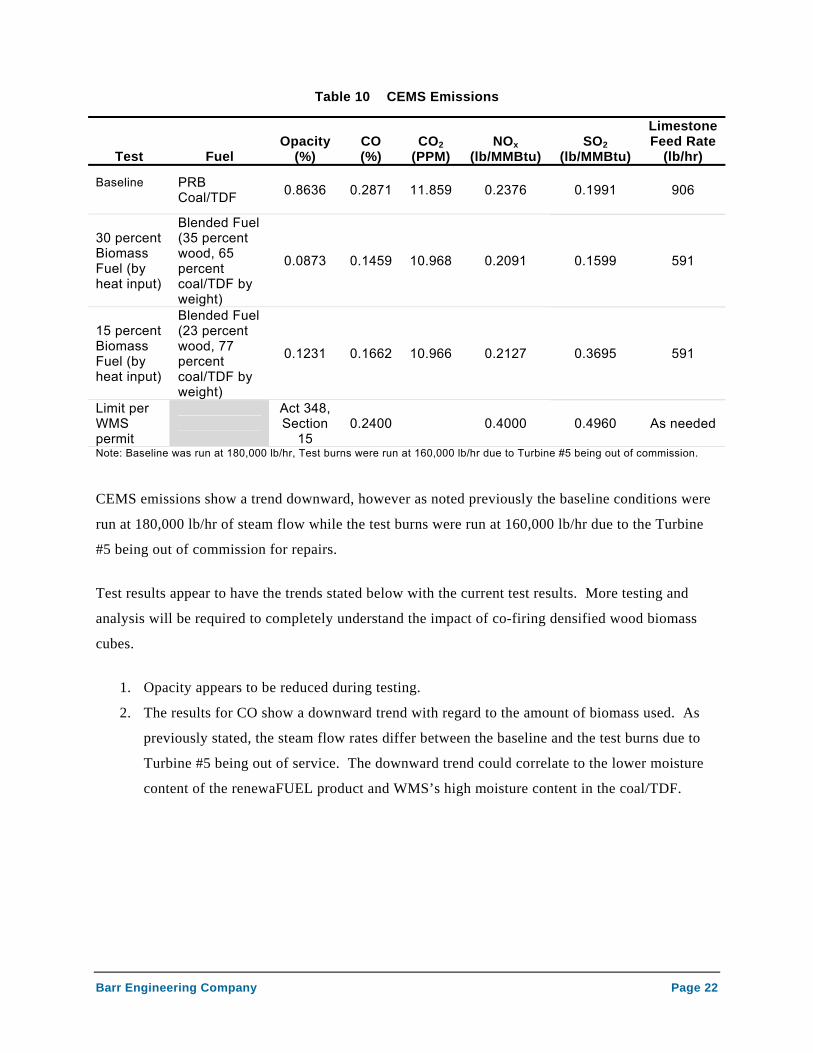
Table 10 CEMS Emissions
Test Fuel Opacity
(%) CO (%)
CO2 (PPM)
NOx (lb/MMBtu)
SO2 (lb/MMBtu)
Limestone Feed Rate
(lb/hr)
Baseline
PRB Coal/TDF 0.8636 0.2871 11.859 0.2376 0.1991 906
30 percent Biomass Fuel (by heat input)
Blended Fuel (35 percent wood, 65 percent coal/TDF by weight)
0.0873 0.1459 10.968 0.2091 0.1599 591
15 percent Biomass Fuel (by heat input)
Blended Fuel (23 percent wood, 77 percent coal/TDF by weight)
0.1231 0.1662 10.966 0.2127 0.3695 591
Limit per WMS permit
Act 348, Section
15 0.2400 0.4000 0.4960 As needed
Note: Baseline was run at 180,000 lb/hr, Test burns were run at 160,000 lb/hr due to Turbine #5 being out of commission.
CEMS emissions show a trend downward, however as noted previously the baseline conditions were
run at 180,000 lb/hr of steam flow while the test burns were run at 160,000 lb/hr due to the Turbine
#5 being out of commission for repairs.
Test results appear to have the trends stated below with the current test results. More testing and
analysis will be required to completely understand the impact of co-firing densified wood biomass
cubes.
1. Opacity appears to be reduced during testing.
2. The results for CO show a downward trend with regard to the amount of biomass used. As
previously stated, the steam flow rates differ between the baseline and the test burns due to
Turbine #5 being out of service. The downward trend could correlate to the lower moisture
content of the renewaFUEL product and WMS’s high moisture content in the coal/TDF.
Barr Engineering Company Page 22
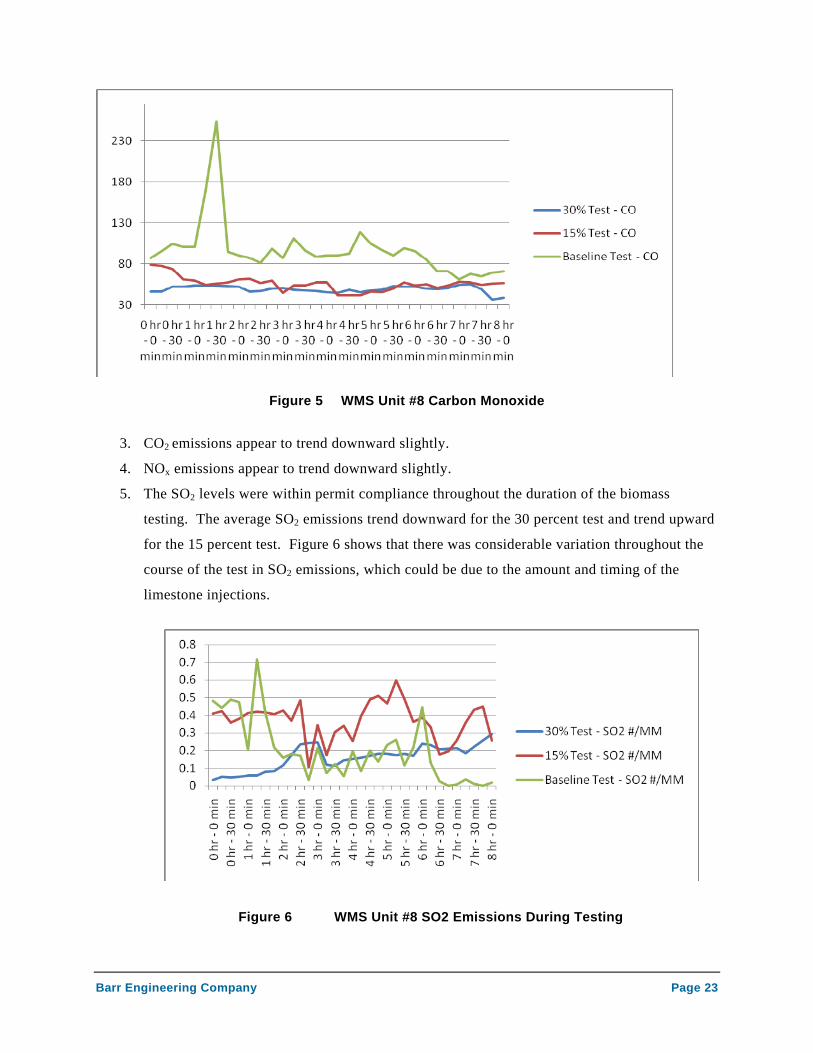
Figure 5 WMS Unit #8 Carbon Monoxide
3. CO2 emissions appear to trend downward slightly.
4. NOx emissions appear to trend downward slightly.
5. The SO2 levels were within permit compliance throughout the duration of the biomass
testing. The average SO2 emissions trend downward for the 30 percent test and trend upward
for the 15 percent test. Figure 6 shows that there was considerable variation throughout the
course of the test in SO2 emissions, which could be due to the amount and timing of the
limestone injections.
Figure 6 WMS Unit #8 SO2 Emissions During Testing
Barr Engineering Company Page 23
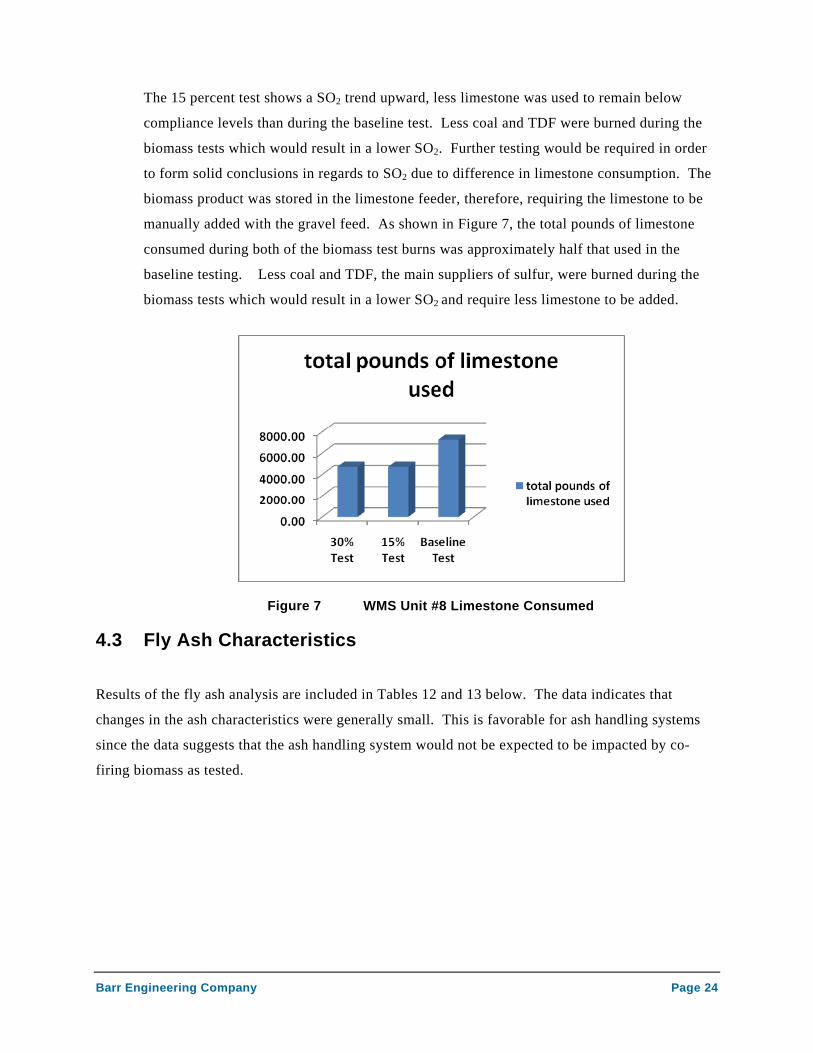
The 15 percent test shows a SO2 trend upward, less limestone was used to remain below
compliance levels than during the baseline test. Less coal and TDF were burned during the
biomass tests which would result in a lower SO2. Further testing would be required in order
to form solid conclusions in regards to SO2 due to difference in limestone consumption. The
biomass product was stored in the limestone feeder, therefore, requiring the limestone to be
manually added with the gravel feed. As shown in Figure 7, the total pounds of limestone
consumed during both of the biomass test burns was approximately half that used in the
baseline testing. Less coal and TDF, the main suppliers of sulfur, were burned during the
biomass tests which would result in a lower SO2 and require less limestone to be added.
Figure 7 WMS Unit #8 Limestone Consumed
4.3 Fly Ash Characteristics
Results of the fly ash analysis are included in Tables 12 and 13 below. The data indicates that
changes in the ash characteristics were generally small. This is favorable for ash handling systems
since the data suggests that the ash handling system would not be expected to be impacted by co-
firing biomass as tested.
Barr Engineering Company Page 24
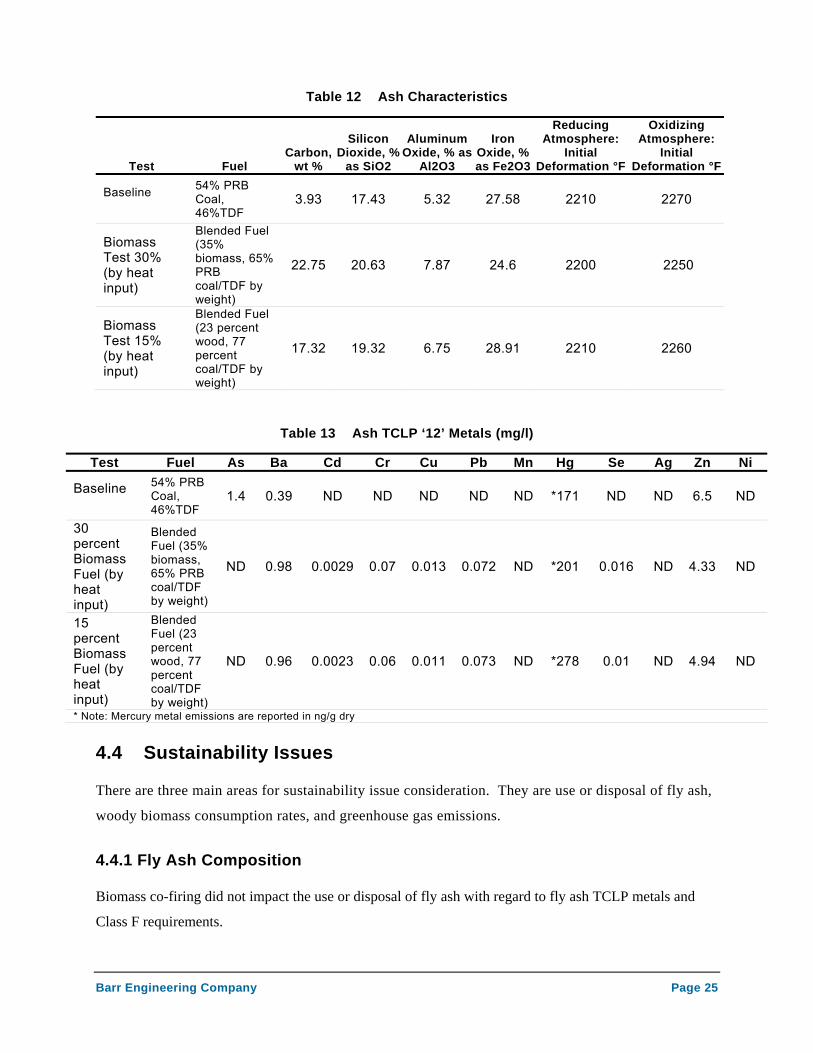
Table 12 Ash Characteristics
Test Fuel Carbon,
wt %
Silicon Dioxide, %
as SiO2
Aluminum Oxide, % as
Al2O3
Iron Oxide, % as Fe2O3
Reducing Atmosphere:
Initial Deformation °F
Oxidizing Atmosphere:
Initial Deformation °F
Baseline
54% PRB Coal, 46%TDF
3.93 17.43 5.32 27.58 2210 2270
Biomass Test 30% (by heat input)
Blended Fuel (35% biomass, 65% PRB coal/TDF by weight)
22.75 20.63 7.87 24.6 2200 2250
Biomass Test 15% (by heat input)
Blended Fuel (23 percent wood, 77 percent coal/TDF by weight)
17.32 19.32 6.75 28.91 2210 2260
Table 13 Ash TCLP ‘12’ Metals (mg/l)
Test Fuel As Ba Cd Cr Cu Pb Mn Hg Se Ag Zn Ni
Baseline
54% PRB Coal, 46%TDF
1.4 0.39 ND ND ND ND ND *171 ND ND 6.5 ND
30 percent Biomass Fuel (by heat input)
Blended Fuel (35% biomass, 65% PRB coal/TDF by weight)
ND 0.98 0.0029 0.07 0.013 0.072 ND *201 0.016 ND 4.33 ND
15 percent Biomass Fuel (by heat input)
Blended Fuel (23 percent wood, 77 percent coal/TDF by weight)
ND 0.96 0.0023 0.06 0.011 0.073 ND *278 0.01 ND 4.94 ND
* Note: Mercury metal emissions are reported in ng/g dry
4.4 Sustainability Issues
There are three main areas for sustainability issue consideration. They are use or disposal of fly ash,
woody biomass consumption rates, and greenhouse gas emissions.
4.4.1 Fly Ash Composition
Biomass co-firing did not impact the use or disposal of fly ash with regard to fly ash TCLP metals and
Class F requirements.
Barr Engineering Company Page 25
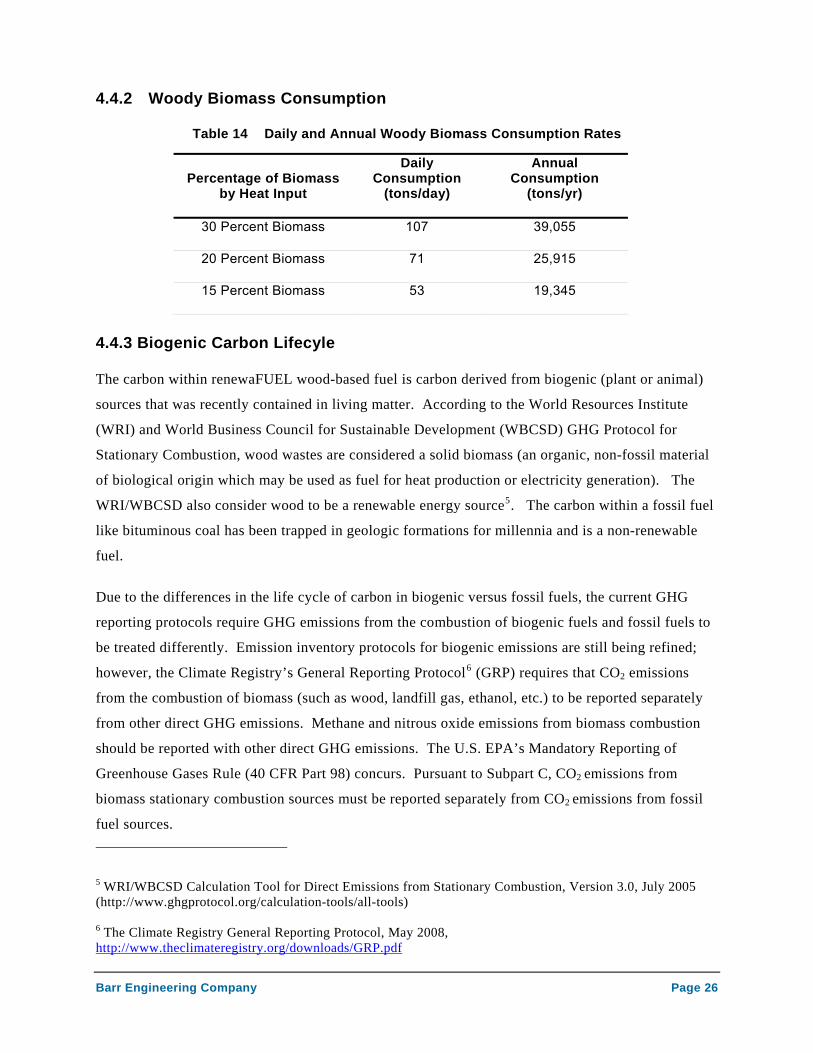
4.4.2 Woody Biomass Consumption
Table 14 Daily and Annual Woody Biomass Consumption Rates
Percentage of Biomass by Heat Input
Daily Consumption
(tons/day)
Annual Consumption
(tons/yr)
30 Percent Biomass 107 39,055
20 Percent Biomass 71 25,915
15 Percent Biomass 53 19,345
4.4.3 Biogenic Carbon Lifecyle
The carbon within renewaFUEL wood-based fuel is carbon derived from biogenic (plant or animal)
sources that was recently contained in living matter. According to the World Resources Institute
(WRI) and World Business Council for Sustainable Development (WBCSD) GHG Protocol for
Stationary Combustion, wood wastes are considered a solid biomass (an organic, non-fossil material
of biological origin which may be used as fuel for heat production or electricity generation). The
WRI/WBCSD also consider wood to be a renewable energy source5. The carbon within a fossil fuel
like bituminous coal has been trapped in geologic formations for millennia and is a non-renewable
fuel.
Due to the differences in the life cycle of carbon in biogenic versus fossil fuels, the current GHG
reporting protocols require GHG emissions from the combustion of biogenic fuels and fossil fuels to
be treated differently. Emission inventory protocols for biogenic emissions are still being refined;
however, the Climate Registry’s General Reporting Protocol6 (GRP) requires that CO2 emissions
from the combustion of biomass (such as wood, landfill gas, ethanol, etc.) to be reported separately
from other direct GHG emissions. Methane and nitrous oxide emissions from biomass combustion
should be reported with other direct GHG emissions. The U.S. EPA’s Mandatory Reporting of
Greenhouse Gases Rule (40 CFR Part 98) concurs. Pursuant to Subpart C, CO2 emissions from
biomass stationary combustion sources must be reported separately from CO2 emissions from fossil
fuel sources.
5 WRI/WBCSD Calculation Tool for Direct Emissions from Stationary Combustion, Version 3.0, July 2005 (http://www.ghgprotocol.org/calculation-tools/all-tools)
6 The Climate Registry General Reporting Protocol, May 2008, http://www.theclimateregistry.org/downloads/GRP.pdf
Barr Engineering Company Page 26
4.4.4 GHG Emission Calculations
Direct (Scope 1) carbon dioxide equivalent (CO2e) emissions have been calculated for the baseline
test (the combustion of a 100 percent fuel blend (60 percent bituminous coal and 40 percent tire-
derived fuel)). According to the GRP, if an emission unit’s CO2 emissions can be determined
through direct measurement or continuous emissions monitoring (CEMS), then this highest-quality
data tier (Tier A1) shall be used. Stack tests were not conducted during the baseline test, and
complete CEMS data is not available. As a result, GRP emission factors for the combustion of
bituminous coal and TDF have been used to calculate CO2 (GRP, Table 12.1, Tier C Method). GRP
emission factors for the stationary combustion of bituminous coal in a fluidized bed combustor were
used to calculate methane (CH4) and nitrous oxide (N2O) emissions from the baseline test (GRP,
Table 12.5, Tier B method). Methane (CH4) has a Global Warming Potential (GWP) of 21 and
nitrous oxide (N2O) has a GWP of 310; therefore, actual CH4 and N2O emissions were multiplied by
21 and 310 respectively, to calculate emissions in terms of CO2 equivalent. GHG emission
calculations and emission factor references for the baseline test are included in Appendix G and
summarized in Table 15.
Direct (Scope 1) carbon dioxide equivalent (CO2e) emissions have also been calculated for the 30%
biomass test burn and 15% biomass test burn. Stack tests were not conducted during the 30% and
15% biomass test burns, and complete CEMS data is not available. As a result, GRP emission
factors for the combustion of wood waste, bituminous coal and TDF have been used to calculate CO2
(GRP, Tables 12.1 and 12.2, Tier C Method). As noted previously, the CO2 emissions from the
biomass component of this fuel has been reported separately from the fossil fuel component.
Standard GRP emission factors for wood waste were used to calculate CH4 and N2O (GRP Table
12.5, Tier B method). Once again, the GWP of CH4 and N2O were factored in so that emissions are
reported in terms of CO2 equivalent. GHG emission calculations and emission factor references for
the 30% and 15% biomass test burns are included in Appendix G and summarized in Table 15 below.
Barr Engineering Company Page 27
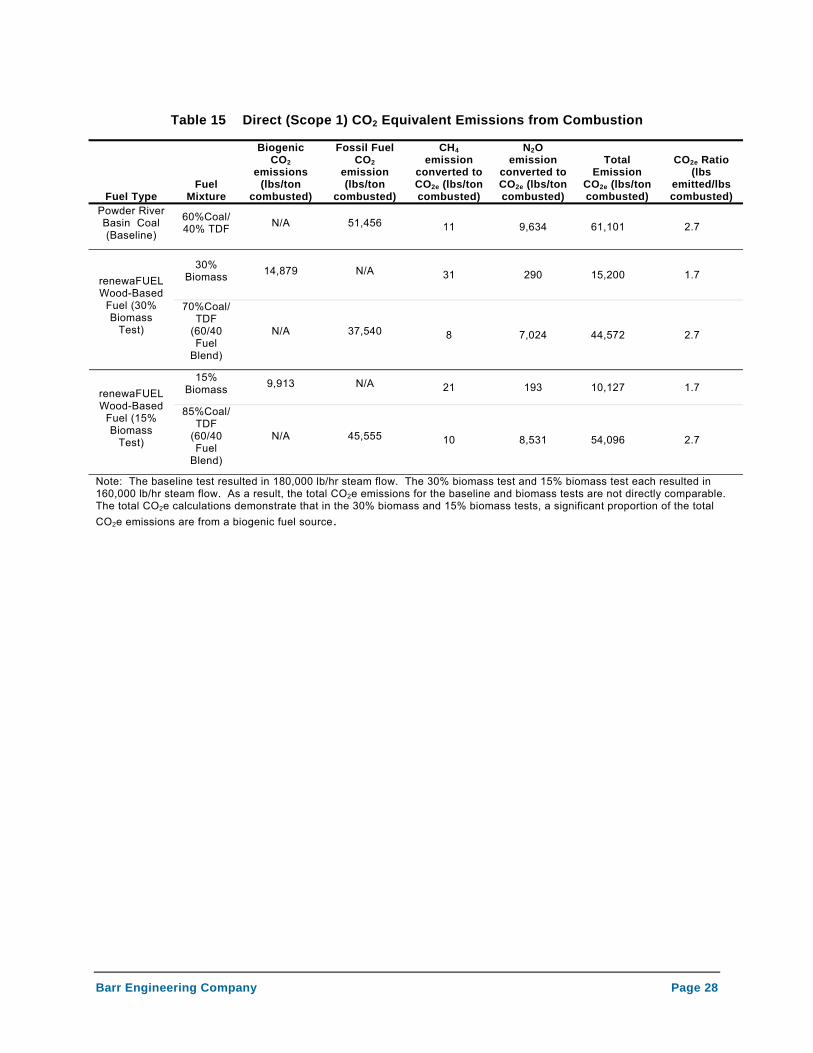
Table 15 Direct (Scope 1) CO2 Equivalent Emissions from Combustion
Fuel Type Fuel
Mixture
Biogenic CO2
emissions (lbs/ton
combusted)
Fossil Fuel CO2
emission (lbs/ton
combusted)
CH4 emission
converted to CO2e (lbs/ton combusted)
N2O emission
converted to CO2e (lbs/ton combusted)
Total Emission
CO2e (lbs/ton combusted)
CO2e Ratio (lbs
emitted/lbs combusted)
Powder River Basin Coal (Baseline)
60%Coal/ 40% TDF N/A 51,456 11 9,634 61,101 2.7
30% Biomass 14,879 N/A 31 290 15,200 1.7 renewaFUEL
Wood-Based Fuel (30% Biomass
Test)
70%Coal/TDF
(60/40 Fuel
Blend)
N/A 37,540 8 7,024 44,572 2.7
15% Biomass 9,913 N/A 21 193 10,127 1.7 renewaFUEL
Wood-Based Fuel (15% Biomass
Test)
85%Coal/TDF
(60/40 Fuel
Blend)
N/A 45,555 10 8,531 54,096 2.7
Note: The baseline test resulted in 180,000 lb/hr steam flow. The 30% biomass test and 15% biomass test each resulted in 160,000 lb/hr steam flow. As a result, the total CO2e emissions for the baseline and biomass tests are not directly comparable. The total CO2e calculations demonstrate that in the 30% biomass and 15% biomass tests, a significant proportion of the total CO2e emissions are from a biogenic fuel source.
Barr Engineering Company Page 28
5 Project Evaluation
5.1 Biomass Combustion Options
The initial test plan included evaluating different biomass feedstock to compare the differences in
energy output, stack emissions, and handling efficiency based on the type of feedstock, particle size
(chipped, shredded, tub ground), and moisture content. During the biomass fuel supplier study, it
was determined that renewaFUEL was the only supplier within 120 miles that could supply densified
wood cubes. Unit #8 is a circulating fluidized bed boiler which requires a fuel to be sized two inches
and larger for optimal operation. The renewaFUEL product is the only product that met this size
requirement.
Wood chips or shredded wood sized larger than two inches may have worked, but it was concluded
that the existing material handling system and storage bunkers would not feed this type of product
without installation of costly equipment. For this reason the renewaFUEL product was the only
biomass fuel tested.
5.2 Storage and Feeding System Requirements
WMS performed the biomass test burn using their existing storage and fuel handling system, no new
equipment was added for testing. Biomass was delivered by truck with walking floor trailers which
unloaded the biomass directly onto the Unit#8 reclaim. The existing conveying system was used to
feed the biomass from the reclaim in the Unit#8 limestone silo. From the silo, the biomass fed onto a
gravimetric feeder and ultimately went into the boiler through the limestone feeder pipe. No material
handling problems were identified during the test period. The biomass was dustier than coal and
increased housekeeping was required to keep dust from building and becoming an explosion hazard.
The renewaFUEL product is a manufactured biomass fuel that will break down when exposed to
water or wet conditions. Additional covered storage would be required to be installed to protect the
fuel from such conditions. Additional material conveying systems would also be required to get the
fuel from this covered storage into the boiler.
Barr Engineering Company Page 29
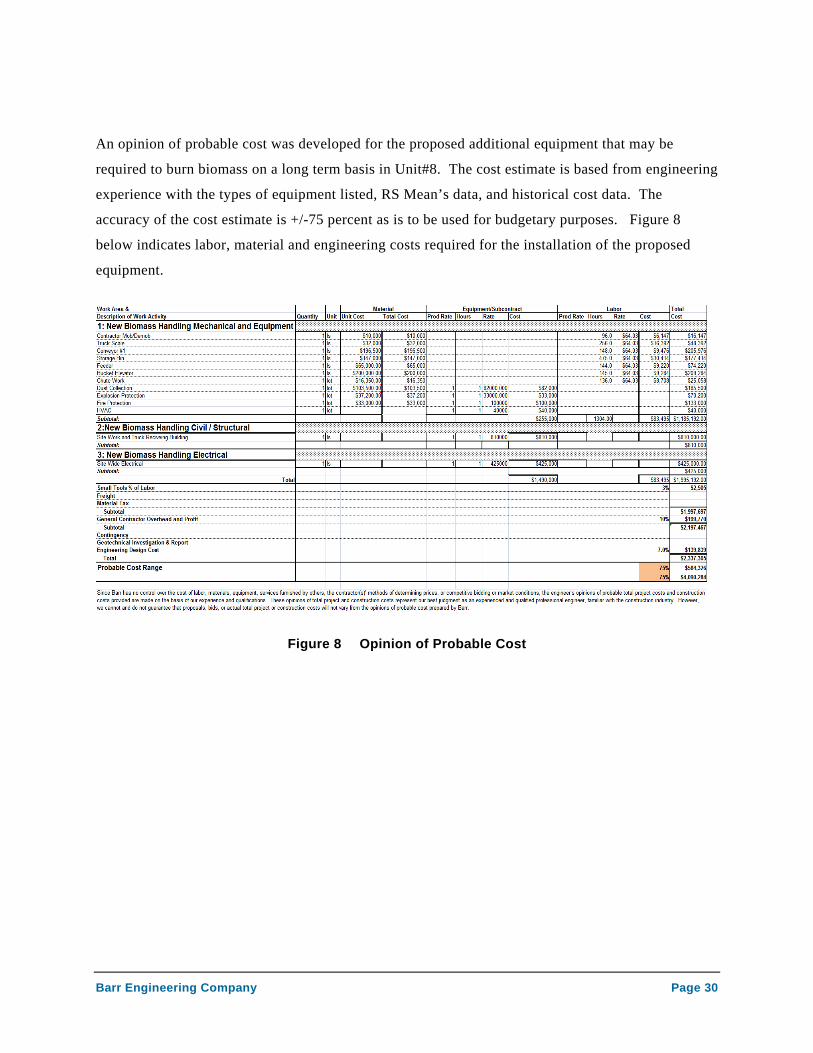
An opinion of probable cost was developed for the proposed additional equipment that may be
required to burn biomass on a long term basis in Unit#8. The cost estimate is based from engineering
experience with the types of equipment listed, RS Mean’s data, and historical cost data. The
accuracy of the cost estimate is +/-75 percent as is to be used for budgetary purposes. Figure 8
below indicates labor, material and engineering costs required for the installation of the proposed
equipment.
Figure 8 Opinion of Probable Cost
Barr Engineering Company Page 30

6 Financials/Budget
See attached DELEG form c-108 and supporting documents
Barr Engineering Company Page 31
Appendices
A. 2010 Wyandotte – List of Sample Analysis Costs R-1 B. 2010 Wyandotte – Wyandotte Fuel Specifications C. Biomass, Biofuels, and Bioenergy Feedstock Opportunities in Michigan D. Clean Energy from Wood Residues in Michigan E. Measures of Wood Resources in Lower Michigan Paper F. Measures of Wood Resources in Lower Michigan G. MI SO2 1866-2009 H. National Oceanic Atmospheric and Administration Weather Data I. Opportunities in Michigan Wood Energy J. Potential Availability of Urban Wood Biomass in Michigan K. Quantifying Urban Saw Timber Abundance and Quality in Southeastern Lower Michigan L. renewaFuel Wood Dust MSDS M. RF-Wyandotte Sustainability Details N. Robert Froese Traverse City Presentation O. Sawmill Operations Serving Southeastern Michigan P. Test Burn PI and CEMS Data Q. Test Burn Procedure R. Traverse City Report S. Urban Wood Waste in Michigan T. WMS Baghouse Screen Shot U. WMS MDNRE Air Quality Permit V. WMS Test Burn Boiler Efficiency 15 percent Biomass W. WMS Test Burn Boiler Efficiency 30 percent Biomass X. WMS Test Burn Boiler Efficiency Baseline Y. Wood Fuel Availability Study Z. Wood Waste Processing and Utilization in Southeastern Michigan AA. Woody Biomass Retrofit Opportunities in Michigan Boiler BB. Wyandotte Sample Test Plan CC. GHG Calculations