advanced license plate recognition - kimley-horn license plate recognition ... we are using facility...
TRANSCRIPT
W H I T E P A P E R S E R I E S
4vol.
May 2016
#
DATA ANALYSIS
Advanced License Plate Recognition
Unlimited Parking Solutions
Unlimited Parking Solutions
Unlimited Parking Solutions
ADVANCED LICENSE PLATE RECOGNITION DATA ANALYSIS
WHITE PAPER #41
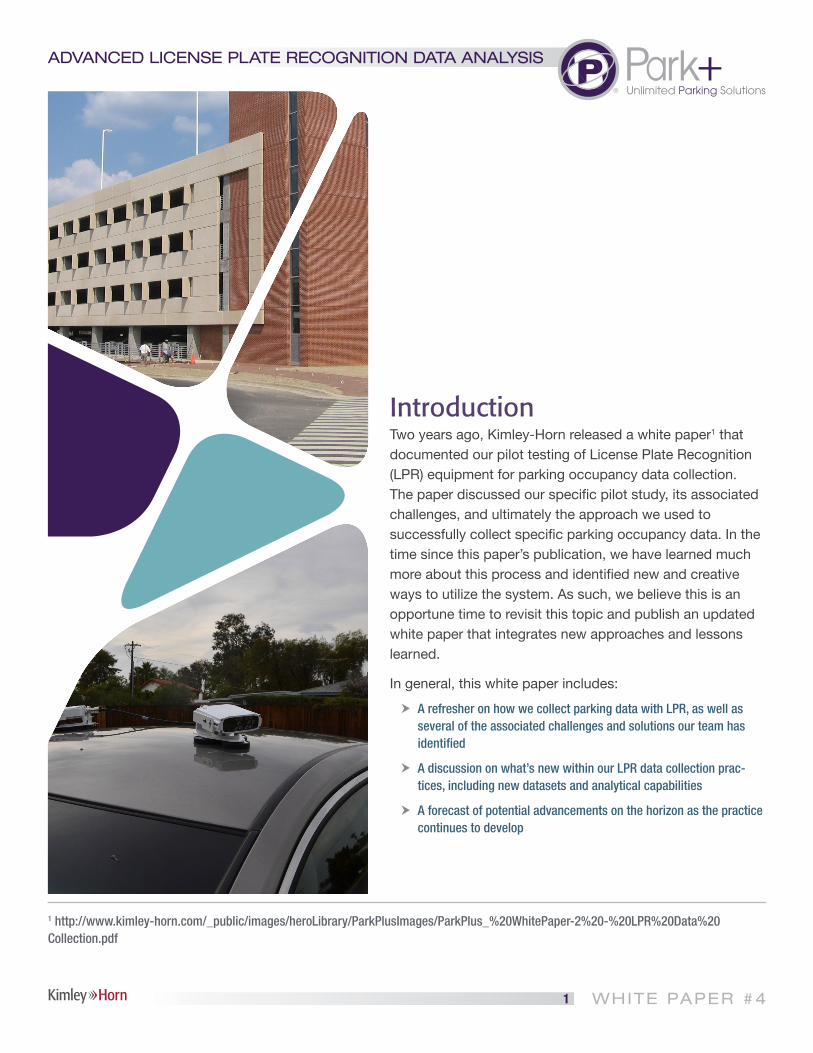
IntroductionTwo years ago, Kimley-Horn released a white paper1 that documented our pilot testing of License Plate Recognition (LPR) equipment for parking occupancy data collection. The paper discussed our specific pilot study, its associated challenges, and ultimately the approach we used to successfully collect specific parking occupancy data. In the time since this paper’s publication, we have learned much more about this process and identified new and creative ways to utilize the system. As such, we believe this is an opportune time to revisit this topic and publish an updated white paper that integrates new approaches and lessons learned.
In general, this white paper includes:
h A refresher on how we collect parking data with LPR, as well as several of the associated challenges and solutions our team has identified
h A discussion on what’s new within our LPR data collection prac-tices, including new datasets and analytical capabilities
h A forecast of potential advancements on the horizon as the practice continues to develop
1 http://www.kimley-horn.com/_public/images/heroLibrary/ParkPlusImages/ParkPlus_%20WhitePaper-2%20-%20LPR%20Data%20Collection.pdf
Unlimited Parking Solutions
ADVANCED LICENSE PLATE RECOGNITION DATA ANALYSIS
WHITE PAPER #42
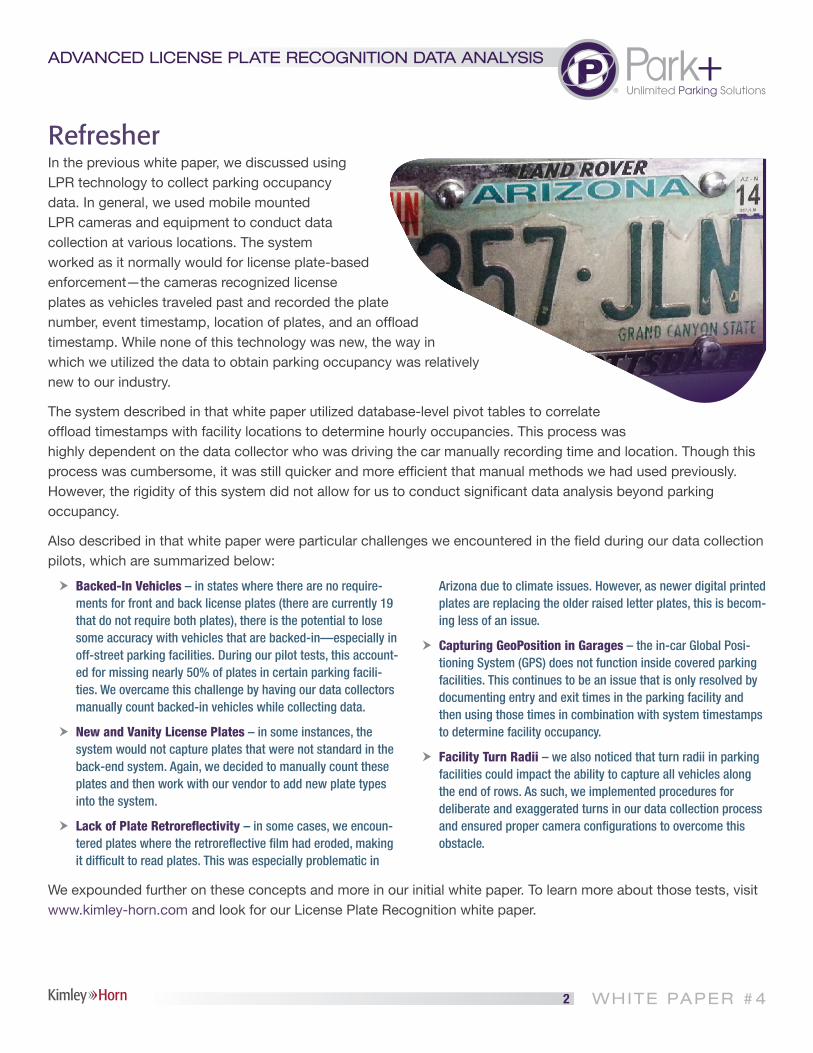
RefresherIn the previous white paper, we discussed using LPR technology to collect parking occupancy data. In general, we used mobile mounted LPR cameras and equipment to conduct data collection at various locations. The system worked as it normally would for license plate-based enforcement—the cameras recognized license plates as vehicles traveled past and recorded the plate number, event timestamp, location of plates, and an offload timestamp. While none of this technology was new, the way in which we utilized the data to obtain parking occupancy was relatively new to our industry.
The system described in that white paper utilized database-level pivot tables to correlate offload timestamps with facility locations to determine hourly occupancies. This process was highly dependent on the data collector who was driving the car manually recording time and location. Though this process was cumbersome, it was still quicker and more efficient that manual methods we had used previously. However, the rigidity of this system did not allow for us to conduct significant data analysis beyond parking occupancy.
Also described in that white paper were particular challenges we encountered in the field during our data collection pilots, which are summarized below:
h Backed-In Vehicles – in states where there are no require-ments for front and back license plates (there are currently 19 that do not require both plates), there is the potential to lose some accuracy with vehicles that are backed-in—especially in off-street parking facilities. During our pilot tests, this account-ed for missing nearly 50% of plates in certain parking facili-ties. We overcame this challenge by having our data collectors manually count backed-in vehicles while collecting data.
h New and Vanity License Plates – in some instances, the system would not capture plates that were not standard in the back-end system. Again, we decided to manually count these plates and then work with our vendor to add new plate types into the system.
h Lack of Plate Retroreflectivity – in some cases, we encoun-tered plates where the retroreflective film had eroded, making it difficult to read plates. This was especially problematic in
Arizona due to climate issues. However, as newer digital printed plates are replacing the older raised letter plates, this is becom-ing less of an issue.
h Capturing GeoPosition in Garages – the in-car Global Posi-tioning System (GPS) does not function inside covered parking facilities. This continues to be an issue that is only resolved by documenting entry and exit times in the parking facility and then using those times in combination with system timestamps to determine facility occupancy.
h Facility Turn Radii – we also noticed that turn radii in parking facilities could impact the ability to capture all vehicles along the end of rows. As such, we implemented procedures for deliberate and exaggerated turns in our data collection process and ensured proper camera configurations to overcome this obstacle.
We expounded further on these concepts and more in our initial white paper. To learn more about those tests, visit www.kimley-horn.com and look for our License Plate Recognition white paper.
Unlimited Parking Solutions
ADVANCED LICENSE PLATE RECOGNITION DATA ANALYSIS
WHITE PAPER #43
Advancements in LPR Data AnalysisThe remainder of this white paper will focus on several advancements we have made in the past year that have enabled us to move beyond occupancy-only data analysis. Each of these advancements are discussed in the below and followed by case studies for recent analyses we have conducted.
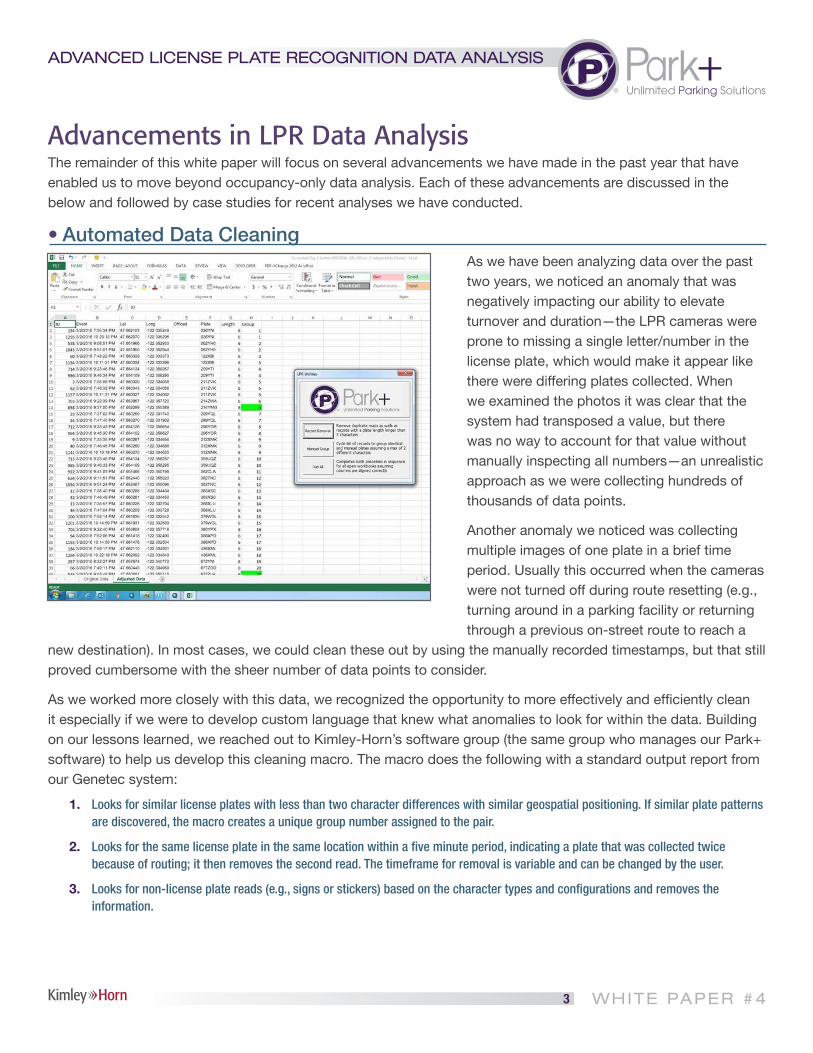
• Automated Data Cleaning As we have been analyzing data over the past two years, we noticed an anomaly that was negatively impacting our ability to elevate turnover and duration—the LPR cameras were prone to missing a single letter/number in the license plate, which would make it appear like there were differing plates collected. When we examined the photos it was clear that the system had transposed a value, but there was no way to account for that value without manually inspecting all numbers—an unrealistic approach as we were collecting hundreds of thousands of data points.
Another anomaly we noticed was collecting multiple images of one plate in a brief time period. Usually this occurred when the cameras were not turned off during route resetting (e.g., turning around in a parking facility or returning through a previous on-street route to reach a
new destination). In most cases, we could clean these out by using the manually recorded timestamps, but that still proved cumbersome with the sheer number of data points to consider.
As we worked more closely with this data, we recognized the opportunity to more effectively and efficiently clean it especially if we were to develop custom language that knew what anomalies to look for within the data. Building on our lessons learned, we reached out to Kimley-Horn’s software group (the same group who manages our Park+ software) to help us develop this cleaning macro. The macro does the following with a standard output report from our Genetec system:
1. Looks for similar license plates with less than two character differences with similar geospatial positioning. If similar plate patterns are discovered, the macro creates a unique group number assigned to the pair.
2. Looks for the same license plate in the same location within a five minute period, indicating a plate that was collected twice because of routing; it then removes the second read. The timeframe for removal is variable and can be changed by the user.
3. Looks for non-license plate reads (e.g., signs or stickers) based on the character types and configurations and removes the information.
Unlimited Parking Solutions
ADVANCED LICENSE PLATE RECOGNITION DATA ANALYSIS
WHITE PAPER #44
This macro has allowed us to clean data more efficiently and remove anomalies that might impact data analysis. Additionally, by having a more usable set of data that correlates plates (the group number created in the cleaning process), we are now able to conduct many of the advanced analyses discussed in the following sections.
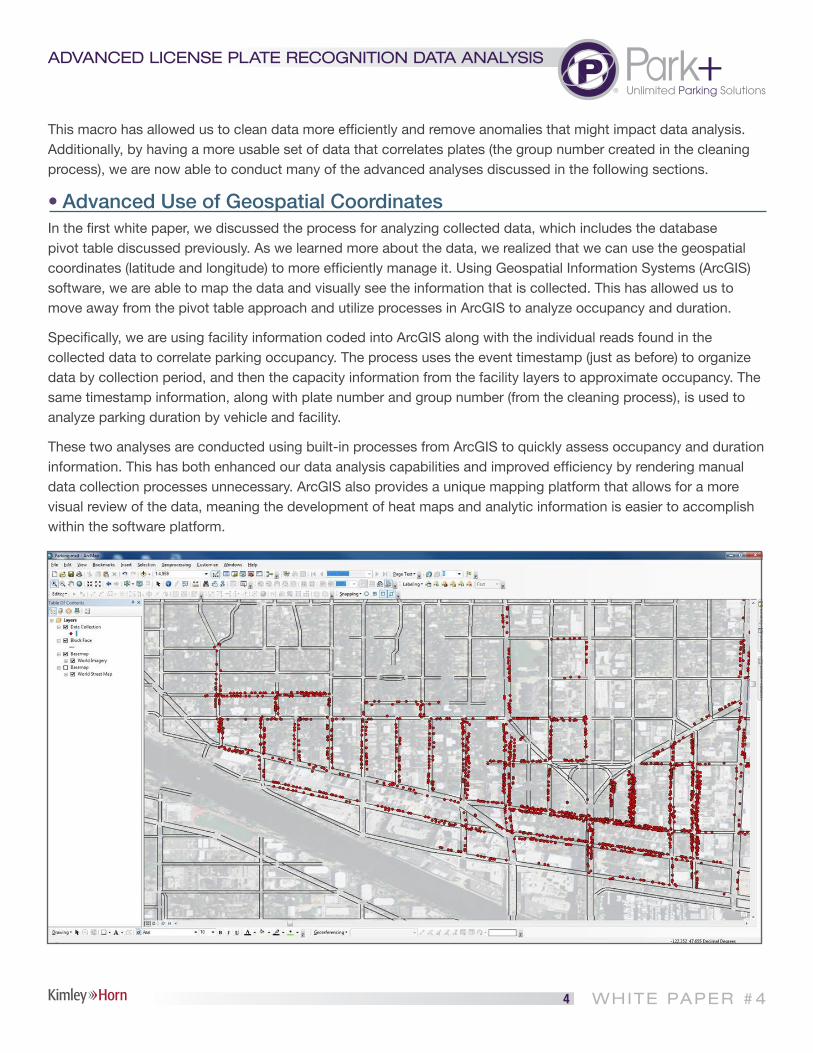
• Advanced Use of Geospatial Coordinates In the first white paper, we discussed the process for analyzing collected data, which includes the database pivot table discussed previously. As we learned more about the data, we realized that we can use the geospatial coordinates (latitude and longitude) to more efficiently manage it. Using Geospatial Information Systems (ArcGIS) software, we are able to map the data and visually see the information that is collected. This has allowed us to move away from the pivot table approach and utilize processes in ArcGIS to analyze occupancy and duration.
Specifically, we are using facility information coded into ArcGIS along with the individual reads found in the collected data to correlate parking occupancy. The process uses the event timestamp (just as before) to organize data by collection period, and then the capacity information from the facility layers to approximate occupancy. The same timestamp information, along with plate number and group number (from the cleaning process), is used to analyze parking duration by vehicle and facility.
These two analyses are conducted using built-in processes from ArcGIS to quickly assess occupancy and duration information. This has both enhanced our data analysis capabilities and improved efficiency by rendering manual data collection processes unnecessary. ArcGIS also provides a unique mapping platform that allows for a more visual review of the data, meaning the development of heat maps and analytic information is easier to accomplish within the software platform.
Unlimited Parking Solutions
ADVANCED LICENSE PLATE RECOGNITION DATA ANALYSIS
WHITE PAPER #45
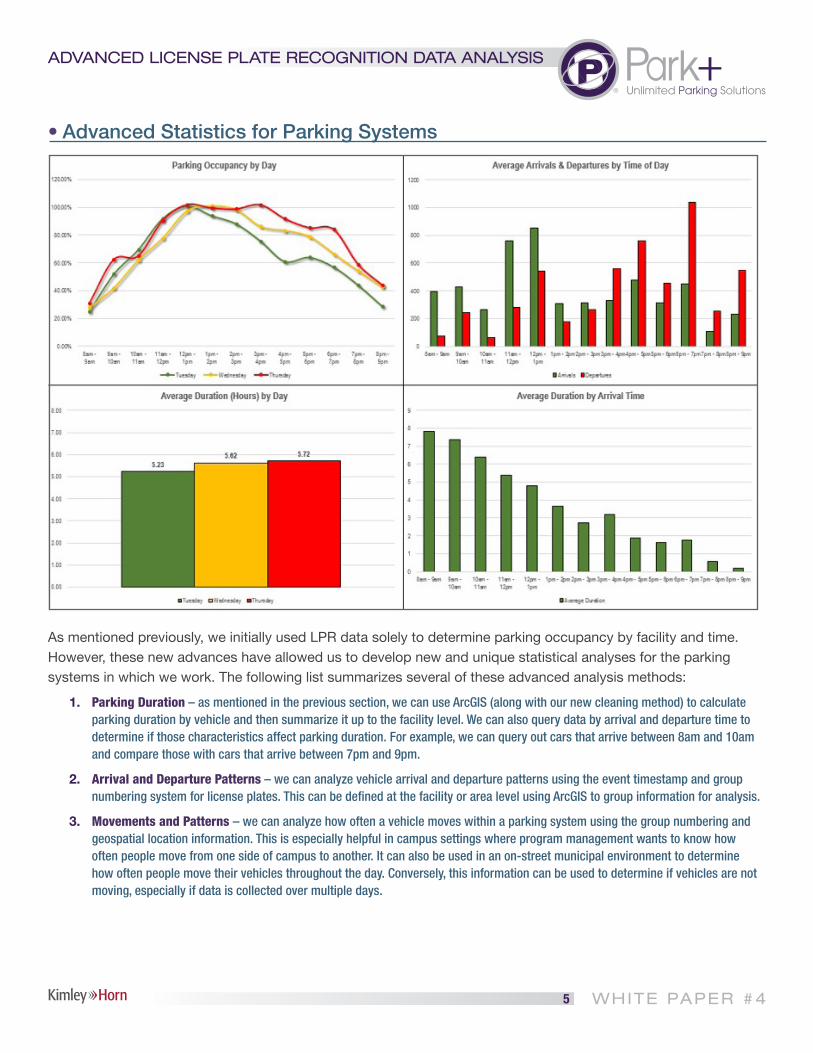
• Advanced Statistics for Parking Systems
As mentioned previously, we initially used LPR data solely to determine parking occupancy by facility and time. However, these new advances have allowed us to develop new and unique statistical analyses for the parking systems in which we work. The following list summarizes several of these advanced analysis methods:
1. Parking Duration – as mentioned in the previous section, we can use ArcGIS (along with our new cleaning method) to calculate parking duration by vehicle and then summarize it up to the facility level. We can also query data by arrival and departure time to determine if those characteristics affect parking duration. For example, we can query out cars that arrive between 8am and 10am and compare those with cars that arrive between 7pm and 9pm.
2. Arrival and Departure Patterns – we can analyze vehicle arrival and departure patterns using the event timestamp and group numbering system for license plates. This can be defined at the facility or area level using ArcGIS to group information for analysis.
3. Movements and Patterns – we can analyze how often a vehicle moves within a parking system using the group numbering and geospatial location information. This is especially helpful in campus settings where program management wants to know how often people move from one side of campus to another. It can also be used in an on-street municipal environment to determine how often people move their vehicles throughout the day. Conversely, this information can be used to determine if vehicles are not moving, especially if data is collected over multiple days.
Unlimited Parking Solutions
ADVANCED LICENSE PLATE RECOGNITION DATA ANALYSIS
WHITE PAPER #46
4. Specific Permitting Information – we can analyze how many of the vehicles in a collection area are utilizing a particular permit if permit databases with license plate information are provided (such as an academic or residential permitting system). This is helpful in quantifying how many permits are actually used in a capacity-constrained environment.
5. Origin/Destination – we can determine the origin address, zip code, or area of vehicles within a study area if license plate data from the Department of Motor Vehicles (DMV) is provided and correlated to our dataset. This could be useful in analyzing commute patterns or understanding the potential need for implementing park-and-ride facilities. However, it is important to note that using addresses to collect data begins to move toward accessing personal information and therefore should be done carefully and with the utmost discretion.
We have successfully conducted the analyses discussed above on recent projects. As we examine the ways in which we can further expand these analyses, we envision leveraging that knowledge to continue to grow our evaluation capabilities. This is especially true as we begin to work more and more with our partners in the industry to understand how to meet their specific data needs.
The following sections provide brief case studies for recent work we have completed.
• Seattle Restricted Parking Policy Assessment, Seattle, WA
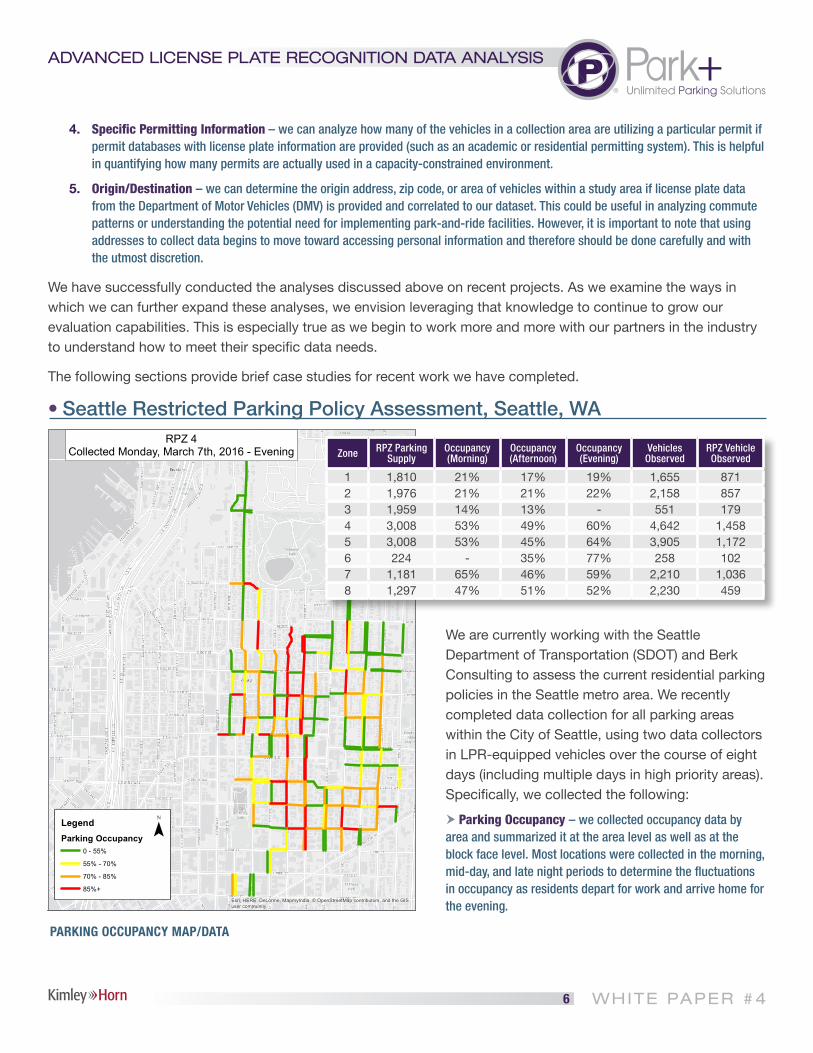
We are currently working with the Seattle Department of Transportation (SDOT) and Berk Consulting to assess the current residential parking policies in the Seattle metro area. We recently completed data collection for all parking areas within the City of Seattle, using two data collectors in LPR-equipped vehicles over the course of eight days (including multiple days in high priority areas). Specifically, we collected the following:
h Parking Occupancy – we collected occupancy data by area and summarized it at the area level as well as at the block face level. Most locations were collected in the morning, mid-day, and late night periods to determine the fluctuations in occupancy as residents depart for work and arrive home for the evening.
Esri, HERE, DeLorme, MapmyIndia, © OpenStreetMap contributors, and the GISuser community
RPZ 4Collected Monday, March 7th, 2016 - Evening
LegendParking Occupancy
0 - 55%
55% - 70%
70% - 85%
85%+
¯
Zone RPZ Parking Supply
Occupancy (Morning)
Occupancy (Afternoon)
Occupancy (Evening)
Vehicles Observed
RPZ Vehicle Observed
1 1,810 21% 17% 19% 1,655 8712 1,976 21% 21% 22% 2,158 8573 1,959 14% 13% - 551 1794 3,008 53% 49% 60% 4,642 1,4585 3,008 53% 45% 64% 3,905 1,1726 224 - 35% 77% 258 1027 1,181 65% 46% 59% 2,210 1,0368 1,297 47% 51% 52% 2,230 459
PARKING OCCUPANCY MAP/DATA

Unlimited Parking Solutions
ADVANCED LICENSE PLATE RECOGNITION DATA ANALYSIS
WHITE PAPER #47
h Presence of Residential Permits – using the RPZ license plate database, we were able to measure the actual occupancy of parked vehicles and whether they were residents or non-residents.
h Average Parking Duration – we used plate/group numbering and geospatial location to determine the average duration on an area-by-area basis.
h Presence of Vehicles Parked All Day – using the plate/group numbering and geospatial location, we determined which vehicles did not move during each day of collection.
h Presence of Vehicle Parking for 72 Hours – in the high prior-ity areas, we collected data on multiple days (with 72 hours in between collection days). Using geospatial location and plate numbers, we determined how many vehicles had not moved in a 72-hour period.
Ultimately, this data collection effort went above and beyond traditional data collection methods, which would have summarized solely occupancy and potentially duration. Using this more robust dataset allows the City of Seattle and our project team to make more customized decisions about how to best manage parking needs in RPZ areas with differing contexts.
• Corporate Campus Evaluation We recently conducted a parking analysis for a corporate campus, where the intent was to use parking behavioral data to better understand the potential impacts of new building development on campus. As part of the data collection, we collected the following information:
h Parking Occupancy – we collected occupancy data by facility and summarized it at the facility level as well as at specific campus zones. Data was collected from 8am to 9pm to under-stand the ebb and flow of demand throughout the day.
h Parking Duration – we collected parking duration information at the facility level and then aggregated to the campus zone area. This data was then evaluated based on arrival time to determine the average parking behavior for employees.
h Arrival and Departure Patterns – we used the timestamp data to determine the average arrival and departure information for facilities, campus areas, and the campus as a whole.
h Vehicular Movement Patterns – using the plate/group numbering and the geospatial location, we determined vehicle movement patterns by facility and campus area. We also cor-related which lots and facilities were most likely to see move-ment throughout the day and when the movement was most likely to occur.
h Presence of Vehicle Parking Overnight – using geospatial location and plate numbers, we determined if any vehicles were present in the same parking spot for the entire data collection period, indicating vehicle storage on campus.
This data helped campus planners better understand the potential impacts of implementing parking management improvements or losing parking spaces.
MOVEMENT MAP
Unlimited Parking Solutions
ADVANCED LICENSE PLATE RECOGNITION DATA ANALYSIS
WHITE PAPER #48
What’s on the HorizonAs we delve deeper into data analysis capabilities to better serve our projects and clients, here are several potential opportunities we see on the horizon:
1. Automating Data Collection – this seems to be the most intuitive, but using your LPR as a data stream can provide a resource for analyzing parking behavior without investing in new technologies or manual data collection efforts. Data collection must be well thought out and include specific routing and collection policies to be successful. If coordinated closely with typical enforcement, it can also provide a consistent stream of data without additional investment.
2. Data Analysis as a Service – as more of our clients begin using LPR as an enforcement and data collection tool, Kimley-Horn can help them extract valuable behavioral information from their systems. Cleaning and analyzing this data can be a very quick and efficient process for the Kimley-Horn team to conduct utilizing the client’s own data. In this setup, the client would simply send us their data and we would process it and send it back. This could occur on a weekly, monthly, or quarterly basis, with pricing based on volume of data and types of analyses conducted.
3. Using Data to Provide Performance Review – using this data (or the client’s own data should they elect to clean and process themselves) will yield a much deeper and more meaningful set of data that can be used to conduct performance metric reviews on parking system components. This could include changing behaviors related to parking management implementation or assessing changing demands as a community develops.
4. Park+ Calibration and Maintenance – for our Park+ users, this represents a more consistent stream of data for modeling processes. Where Park+ users are now collecting data quarterly or annually, Kimley-Horn could collect and manage their system data on an ongoing basis as they conduct parking enforcement with LPR.