advanced fpga design - asicentrum · 2008 as an application engineer supporting mentor’s range of...
TRANSCRIPT
Advanced FPGA Design
Seminar Hotel Akademie Nahac 23rd May 2012
2 © 2010 Mentor Graphics Corp. Company Confidential
www.mentor.com
Who we are
Mentor Graphics — A leader in Electronic Design Automation (EDA) — Second biggest EDA supplier worldwide in 2011 — Biggest EDA supplier in Europe in 2011 — PCB design solutions — Digital FPGA design solutions — Analog/Digital ASIC design solutions — Cabling design solutions — Manufacturing solutions
www.mentor.com
ASICentrum — ASICentrum is one of the leading European design houses, recently
becoming a partner of the EUROPRACTICE Partnership Program for ASIC Design
— ASICentrum is the distributor for Mentor Graphics software for the Czech and Slovak Republics
www.asicentrum.cz
3 © 2010 Mentor Graphics Corp. Company Confidential
www.mentor.com
Who we are (2)
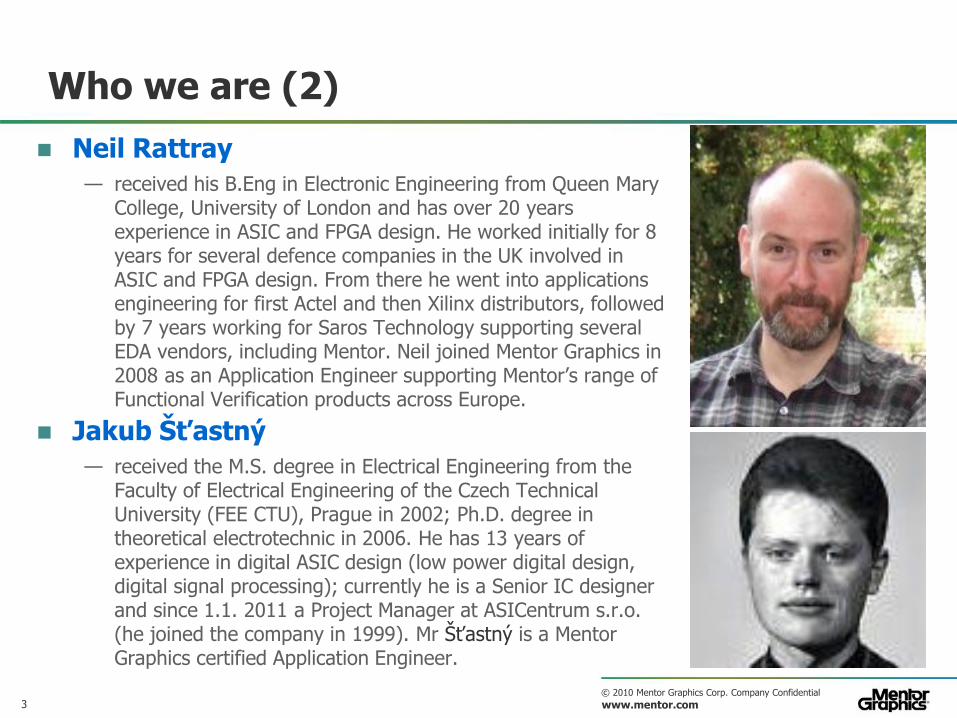
Neil Rattray
— received his B.Eng in Electronic Engineering from Queen Mary College, University of London and has over 20 years experience in ASIC and FPGA design. He worked initially for 8 years for several defence companies in the UK involved in ASIC and FPGA design. From there he went into applications engineering for first Actel and then Xilinx distributors, followed by 7 years working for Saros Technology supporting several EDA vendors, including Mentor. Neil joined Mentor Graphics in 2008 as an Application Engineer supporting Mentor’s range of Functional Verification products across Europe.
Jakub Šťastný
— received the M.S. degree in Electrical Engineering from the Faculty of Electrical Engineering of the Czech Technical University (FEE CTU), Prague in 2002; Ph.D. degree in theoretical electrotechnic in 2006. He has 13 years of experience in digital ASIC design (low power digital design, digital signal processing); currently he is a Senior IC designer and since 1.1. 2011 a Project Manager at ASICentrum s.r.o. (he joined the company in 1999). Mr Šťastný is a Mentor Graphics certified Application Engineer.
4 © 2010 Mentor Graphics Corp. Company Confidential
www.mentor.com
Agenda
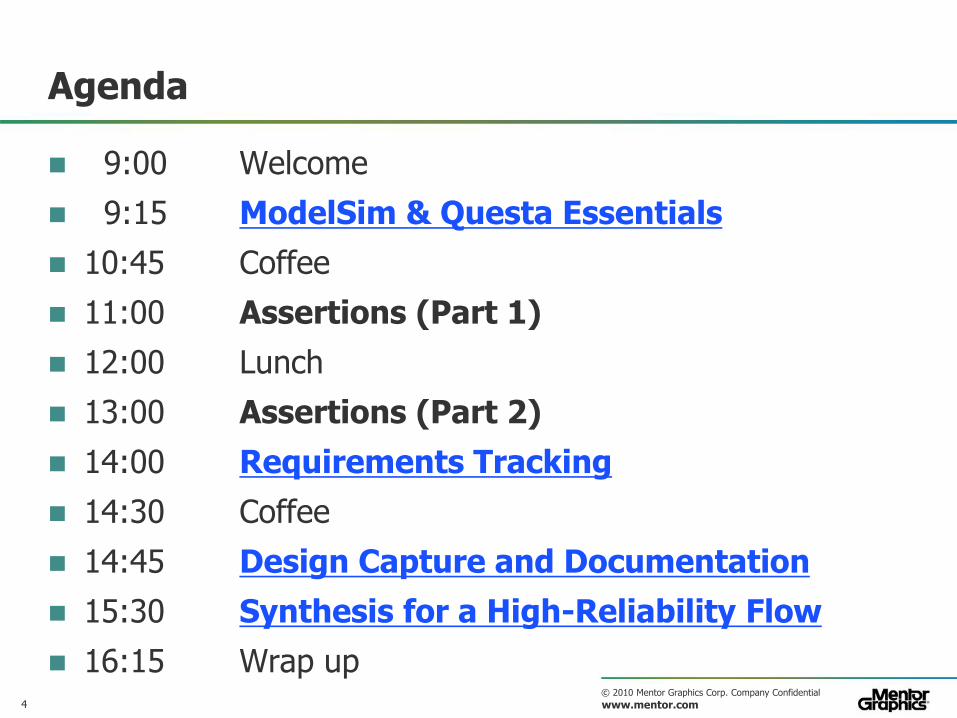
9:00 Welcome
9:15 ModelSim & Questa Essentials
10:45 Coffee
11:00 Assertions (Part 1)
12:00 Lunch
13:00 Assertions (Part 2)
14:00 Requirements Tracking
14:30 Coffee
14:45 Design Capture and Documentation
15:30 Synthesis for a High-Reliability Flow
16:15 Wrap up
5 © 2010 Mentor Graphics Corp. Company Confidential
www.mentor.com
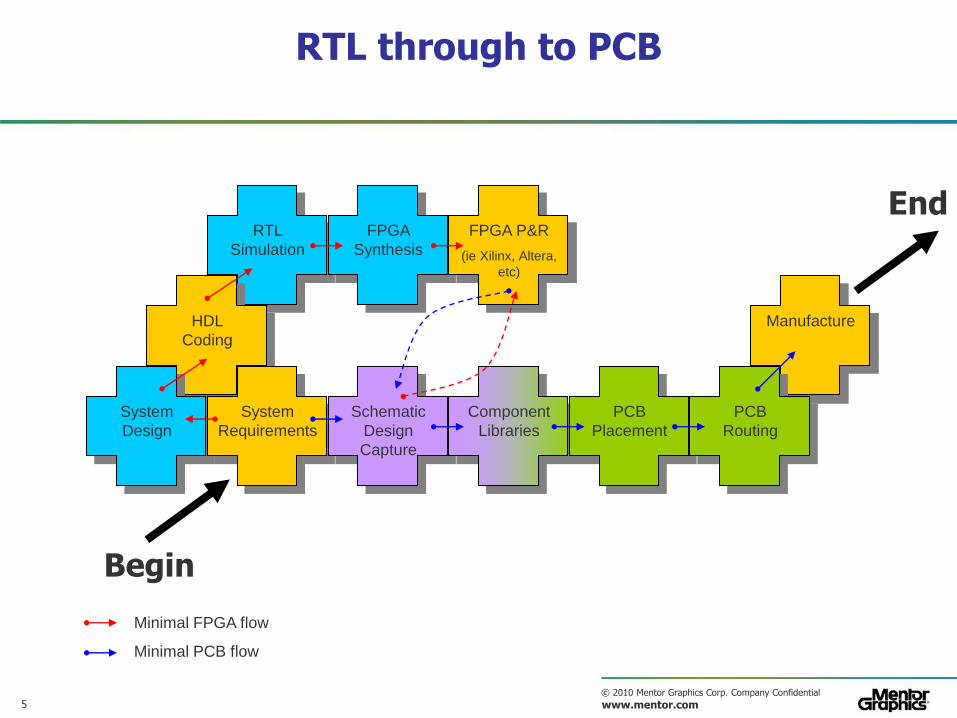
Manufacture
RTL
Simulation
HDL
Coding
FPGA
Synthesis
FPGA P&R
(ie Xilinx, Altera,
etc)
System
Design
Minimal FPGA flow
Minimal PCB flow
System
Requirements
Schematic
Design
Capture
Component
Libraries
PCB
Placement
PCB
Routing
RTL through to PCB
Begin
End
6 © 2010 Mentor Graphics Corp. Company Confidential
www.mentor.com
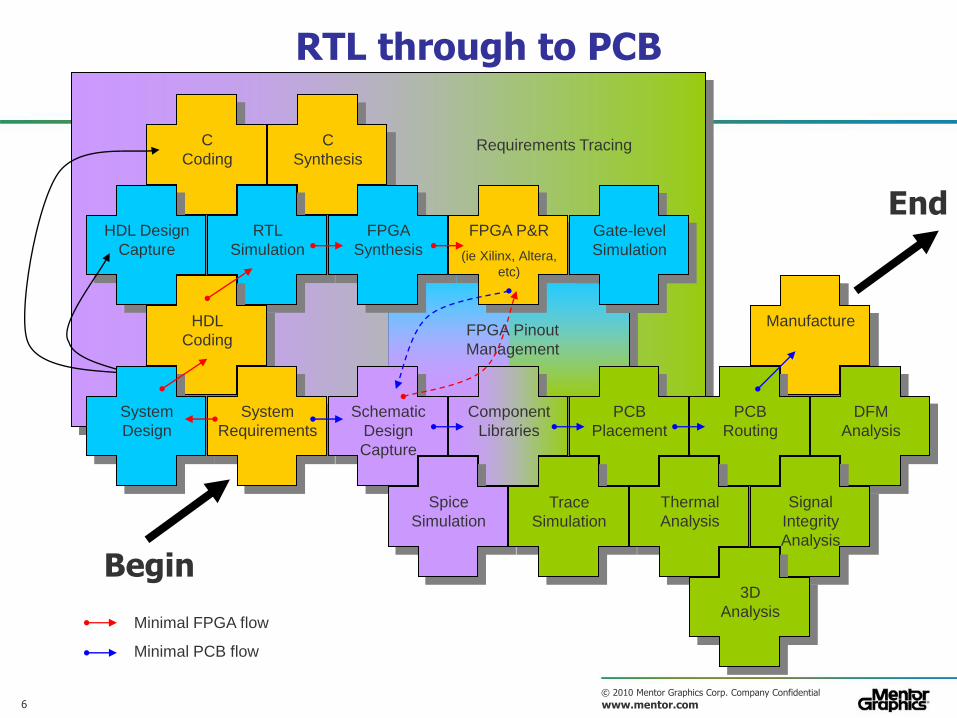
Requirements Tracing C
Coding
C
Synthesis
HDL Design
Capture
Manufacture FPGA Pinout
Management
RTL
Simulation
HDL
Coding
FPGA
Synthesis
FPGA P&R
(ie Xilinx, Altera,
etc)
Gate-level
Simulation
System
Design
Minimal FPGA flow
Minimal PCB flow
System
Requirements
Schematic
Design
Capture
Component
Libraries
PCB
Placement
PCB
Routing
Spice
Simulation
DFM
Analysis
RTL through to PCB
Trace
Simulation
Thermal
Analysis
Signal
Integrity
Analysis
3D
Analysis
Begin
End

7 © 2010 Mentor Graphics Corp. Company Confidential
www.mentor.com
Requirements Tracing C
Coding
C
Synthesis
HDL Design
Capture
Manufacture FPGA Pinout
Management
RTL
Simulation
HDL
Coding
FPGA
Synthesis
FPGA P&R
(ie Xilinx, Altera,
etc)
Gate-level
Simulation
System
Design
Minimal FPGA flow
Minimal PCB flow
System
Requirements
Schematic
Design
Capture
Component
Libraries
PCB
Placement
PCB
Routing
Spice
Simulation
DFM
Analysis
RTL through to PCB
Trace
Simulation
Thermal
Analysis
Signal
Integrity
Analysis
3D
Analysis
Begin
End
ReqTracer C
Coding
Catapult C
HDL Designer
Manufacture I/O Designer
ModelSim
& Questa
DesignChecker
Precision
RTL
FPGA P&R
(ie Xilinx, Altera,
etc)
ModelSim
& Questa
UVM/OVM
HDL Designer
(Visualisation)
DxDesigner
LP Wizard
PADS Layout
(Placement)
PADS Layout
(Routing)
HyperLynx
Analog
vSure
HyperLynx
LineSim
HyperLynx
PI
HyperLynx
BoardSim
HyperLynx
3D
8 © 2010 Mentor Graphics Corp. Company Confidential
www.mentor.com
Thank you
RTL through to PCB
Neil Rattray
Senior Application Engineer
Mentor Graphics (Netherlands) B.V.
Email: [email protected]
Mobile: +31 6316 20803

9 © 2010 Mentor Graphics Corp. Company Confidential
www.mentor.com Your Initials, Presentation Title, Month Year 9
132 © 2010 Mentor Graphics Corp. Company Confidential
www.mentor.com
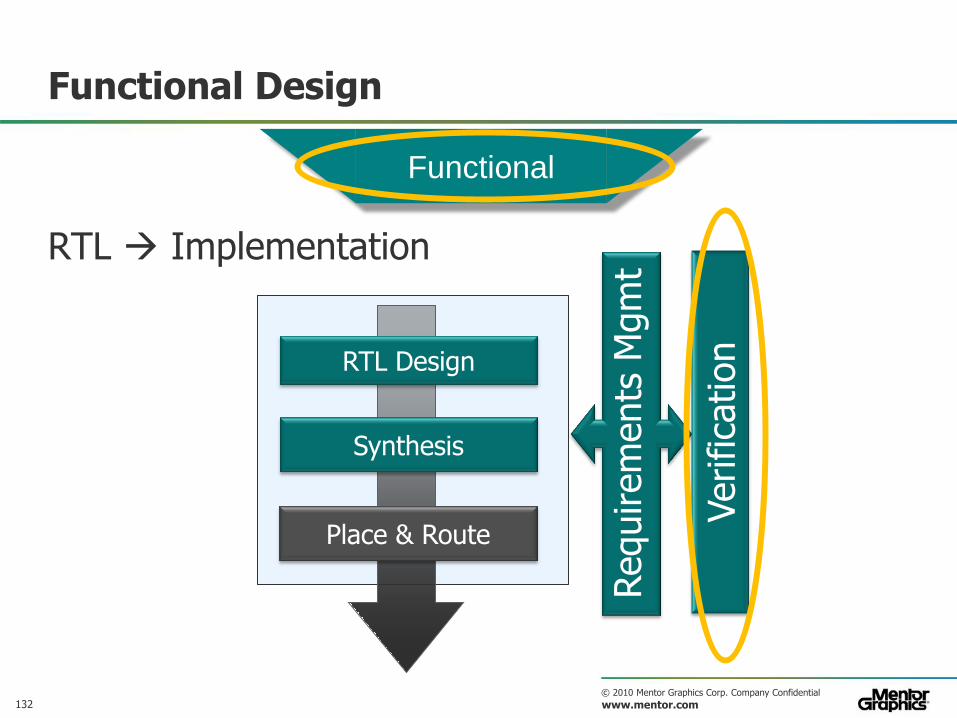
Functional Design
RTL Implementation
Functional
RTL Design
Synthesis
Place & Route
Requirem
ents
Mgm
t
Verifica
tion
133 © 2010 Mentor Graphics Corp. Company Confidential
www.mentor.com
ModelSim and Questa Essentials: Common FPGA Verification Myths
The sooner we get the design in FPGA, the sooner we find the bugs — Only true for easy trivial bugs. — One will waste a LOT of time finding and debugging the rest!
Early access to an FPGA prototype allow software teams to develop high quality S/W content — Only true if not bogged down by (hard to find) bugs
and spec changes
Small FPGA teams are more effective in the lab where test equipment will yield higher throughput — Very hard to control stimulus — Normally directed tests only — Hard to create corner cases – illegal inputs — Difficult to know when you are done
134 © 2010 Mentor Graphics Corp. Company Confidential
www.mentor.com
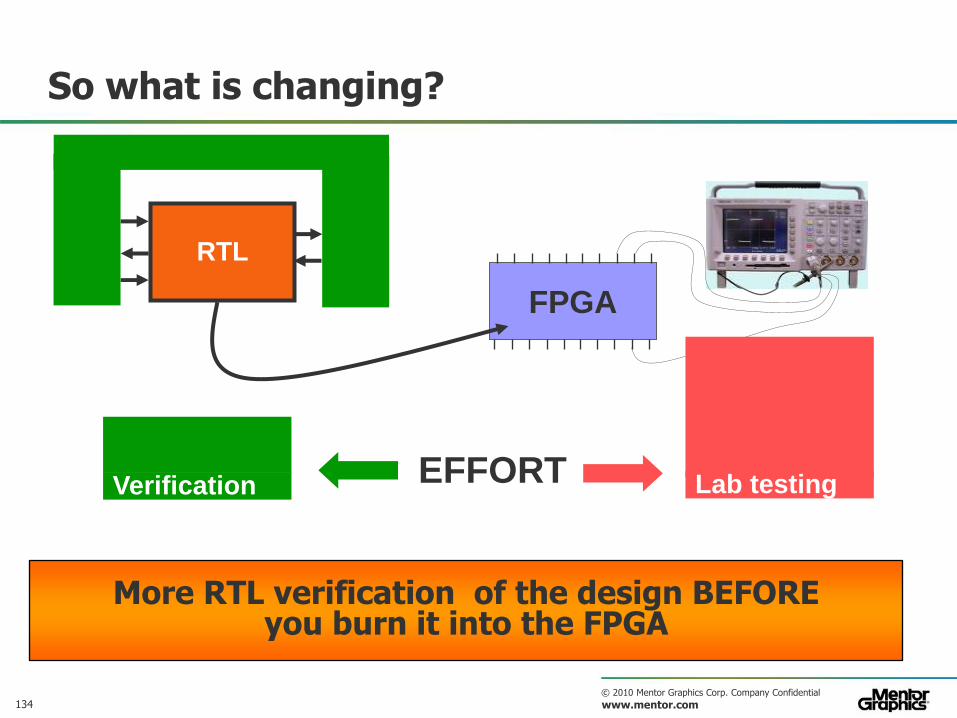
So what is changing?
FPGA
RTL
Verification Lab testing EFFORT
More RTL verification of the design BEFORE you burn it into the FPGA
135 © 2010 Mentor Graphics Corp. Company Confidential
www.mentor.com
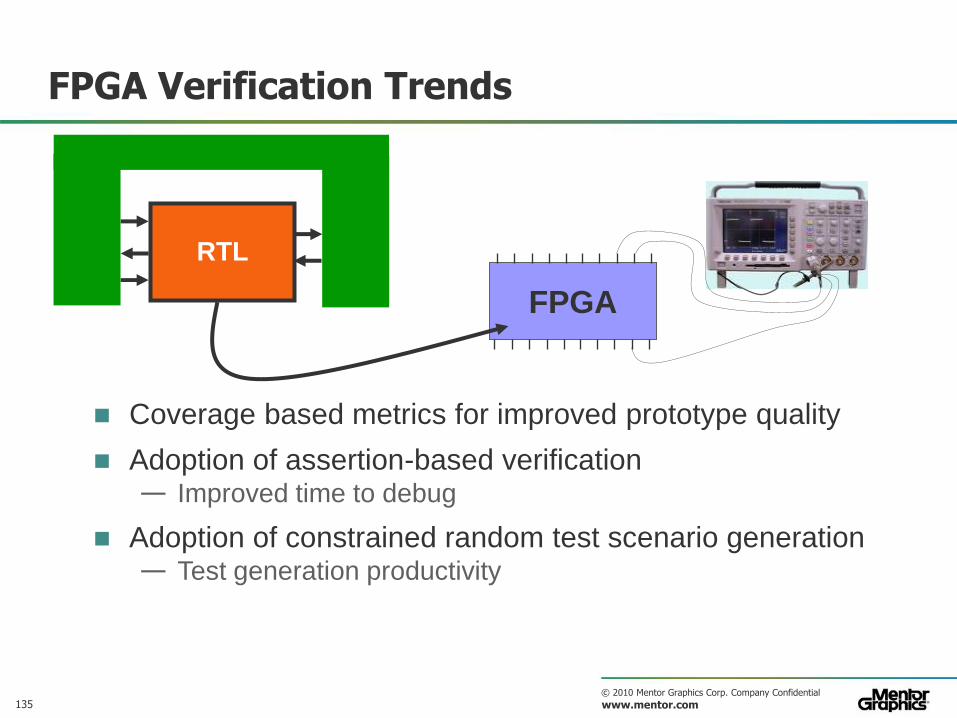
FPGA Verification Trends
FPGA
RTL
Coverage based metrics for improved prototype quality
Adoption of assertion-based verification — Improved time to debug
Adoption of constrained random test scenario generation — Test generation productivity
136 © 2010 Mentor Graphics Corp. Company Confidential
www.mentor.com
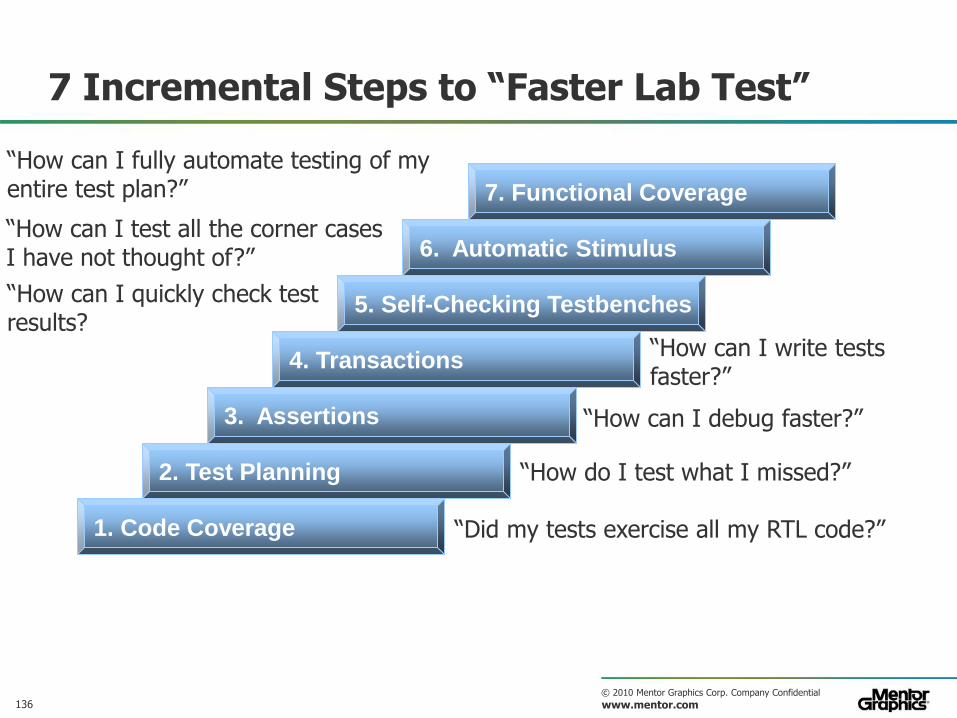
7 Incremental Steps to “Faster Lab Test”
1. Code Coverage “Did my tests exercise all my RTL code?”
2. Test Planning “How do I test what I missed?”
3. Assertions “How can I debug faster?”
4. Transactions “How can I write tests faster?”
6. Automatic Stimulus “How can I test all the corner cases I have not thought of?”
5. Self-Checking Testbenches “How can I quickly check test results?
7. Functional Coverage
“How can I fully automate testing of my entire test plan?”
137 © 2010 Mentor Graphics Corp. Company Confidential
www.mentor.com
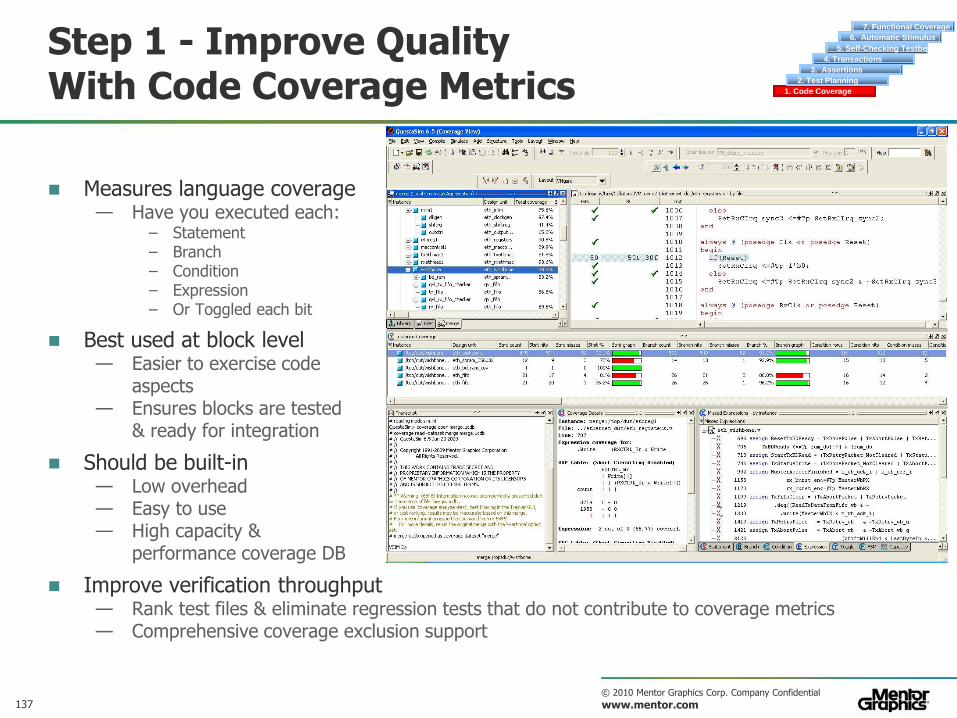
Step 1 - Improve Quality With Code Coverage Metrics
Measures language coverage — Have you executed each:
– Statement – Branch – Condition – Expression – Or Toggled each bit
Best used at block level — Easier to exercise code
aspects — Ensures blocks are tested
& ready for integration
Should be built-in — Low overhead — Easy to use — High capacity &
performance coverage DB
Improve verification throughput — Rank test files & eliminate regression tests that do not contribute to coverage metrics — Comprehensive coverage exclusion support
1. Code Coverage
2. Test Planning
3. Assertions
4. Transactions
6. Automatic Stimulus
5. Self-Checking Testbenches
7. Functional Coverage
138 © 2010 Mentor Graphics Corp. Company Confidential
www.mentor.com
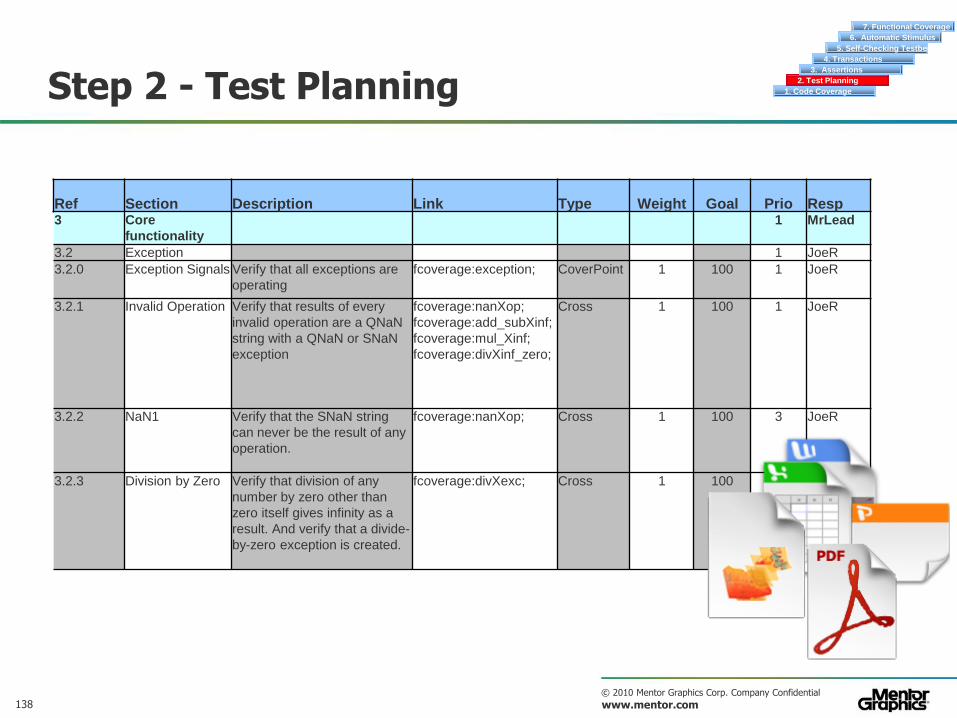
Step 2 - Test Planning
Ref Section Description Link Type Weight Goal Prio Resp 3 Core
functionality
1 MrLead
3.2 Exception 1 JoeR
3.2.0 Exception Signals Verify that all exceptions are
operating
fcoverage:exception; CoverPoint 1 100 1 JoeR
3.2.1 Invalid Operation
Verify that results of every
invalid operation are a QNaN
string with a QNaN or SNaN
exception
fcoverage:nanXop;
fcoverage:add_subXinf;
fcoverage:mul_Xinf;
fcoverage:divXinf_zero;
Cross 1 100 1 JoeR
3.2.2 NaN1
Verify that the SNaN string
can never be the result of any
operation.
fcoverage:nanXop; Cross 1 100 3 JoeR
3.2.3 Division by Zero
Verify that division of any
number by zero other than
zero itself gives infinity as a
result. And verify that a divide-
by-zero exception is created.
fcoverage:divXexc; Cross 1 100 1 JoeR
1. Code Coverage
2. Test Planning
3. Assertions
4. Transactions
6. Automatic Stimulus
5. Self-Checking Testbenches
7. Functional Coverage
139 © 2010 Mentor Graphics Corp. Company Confidential
www.mentor.com
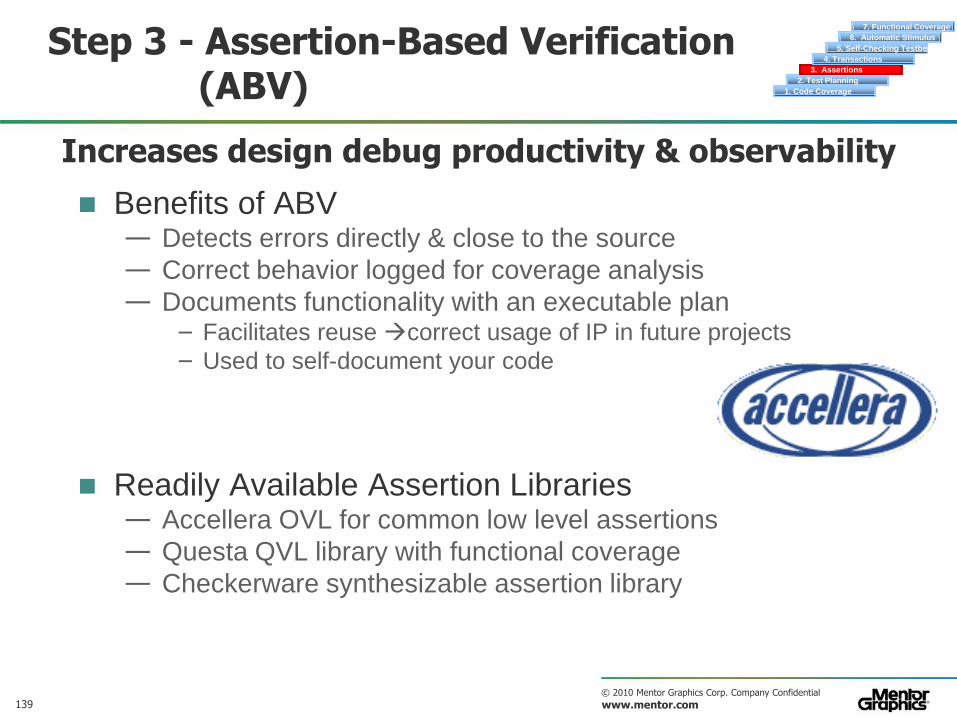
Step 3 - Assertion-Based Verification (ABV)
Benefits of ABV — Detects errors directly & close to the source
— Correct behavior logged for coverage analysis
— Documents functionality with an executable plan – Facilitates reuse correct usage of IP in future projects
– Used to self-document your code
Readily Available Assertion Libraries — Accellera OVL for common low level assertions
— Questa QVL library with functional coverage
— Checkerware synthesizable assertion library
Increases design debug productivity & observability
1. Code Coverage
2. Test Planning
3. Assertions
4. Transactions
6. Automatic Stimulus
5. Self-Checking Testbenches
7. Functional Coverage
140 © 2010 Mentor Graphics Corp. Company Confidential
www.mentor.com
Step 3 - Assertion-Based Verification (ABV)
Details in the next session after the break
1. Code Coverage
2. Test Planning
3. Assertions
4. Transactions
6. Automatic Stimulus
5. Self-Checking Testbenches
7. Functional Coverage
141 © 2010 Mentor Graphics Corp. Company Confidential
www.mentor.com
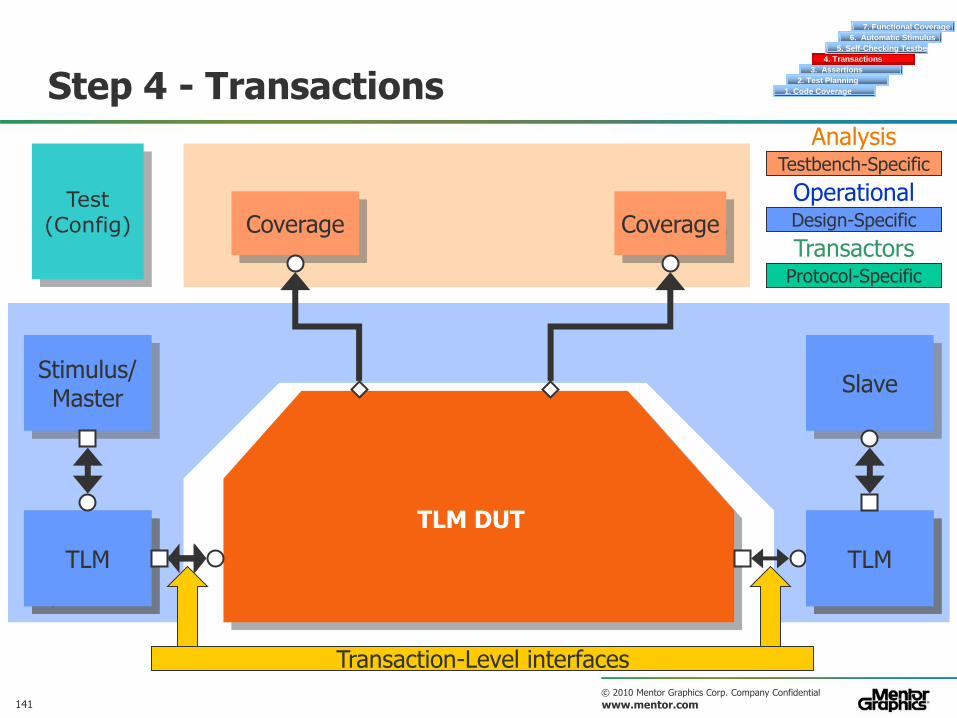
Step 4 - Transactions
Testbench-Specific
Analysis
Design-Specific
Operational
Protocol-Specific
Transactors
Stimulus Generator / Master
Slave TLM TLM
Stimulus/ Master
Slave
Coverage
Transaction-Level interfaces
Coverage
TLM DUT
Test (Config)
1. Code Coverage
2. Test Planning
3. Assertions
4. Transactions
6. Automatic Stimulus
5. Self-Checking Testbenches
7. Functional Coverage
142 © 2010 Mentor Graphics Corp. Company Confidential
www.mentor.com
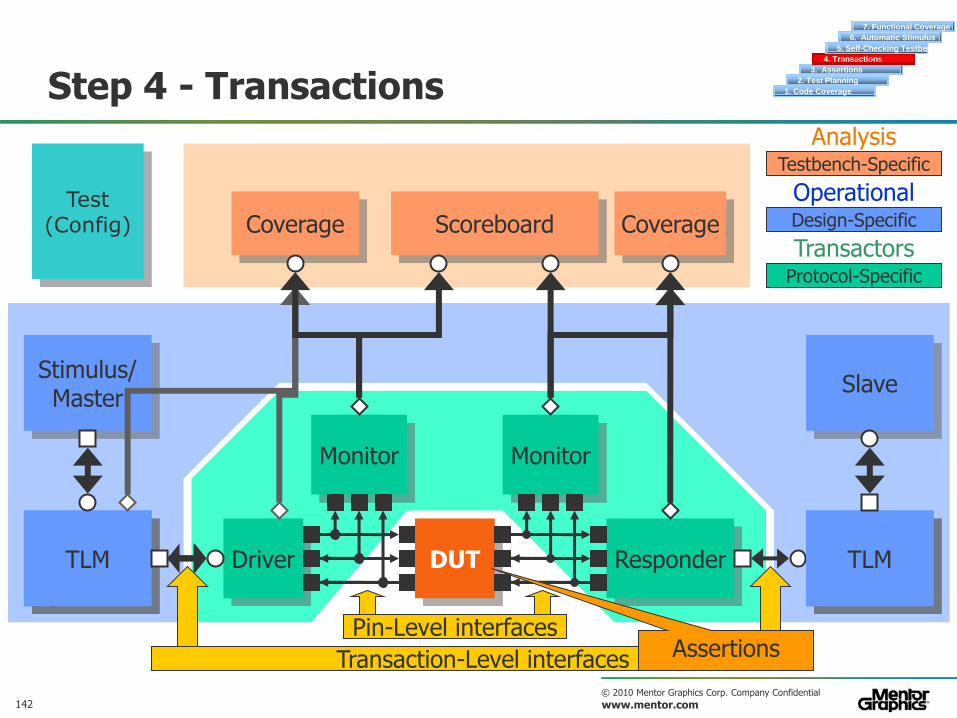
Step 4 - Transactions
Design-Specific
Operational
Protocol-Specific
Transactors
Testbench-Specific
Analysis
DUT Driver Responder
Monitor Monitor
Stimulus Generator / Master
Slave TLM TLM
Stimulus/ Master
Slave
Coverage Scoreboard Coverage
Pin-Level interfaces
Transaction-Level interfaces Assertions
Test (Config)
1. Code Coverage
2. Test Planning
3. Assertions
4. Transactions
6. Automatic Stimulus
5. Self-Checking Testbenches
7. Functional Coverage
143 © 2010 Mentor Graphics Corp. Company Confidential
www.mentor.com
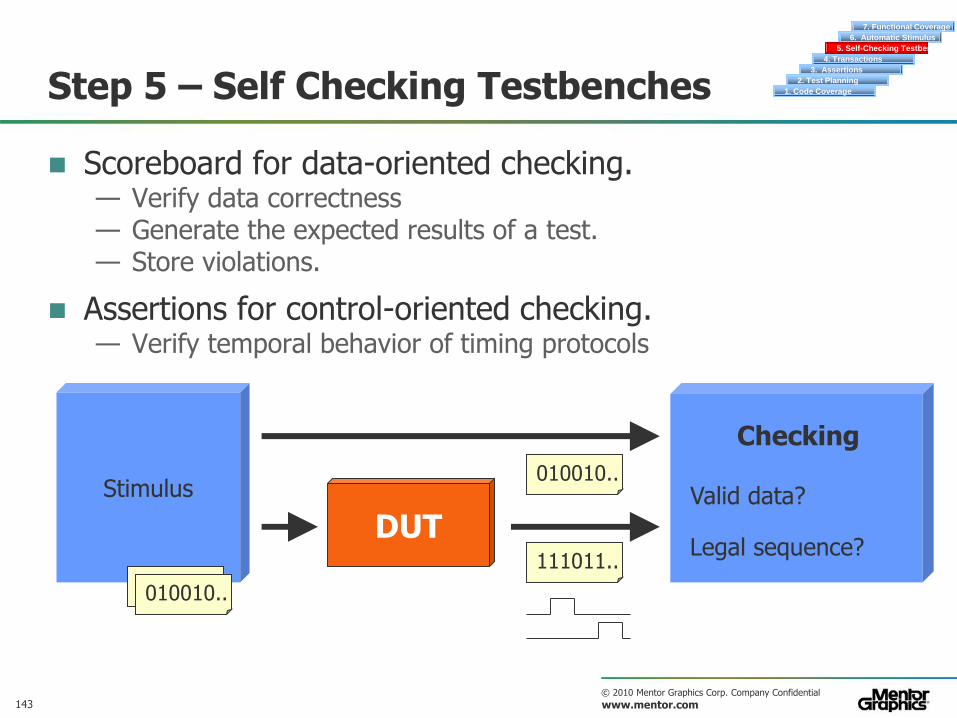
Step 5 – Self Checking Testbenches
Scoreboard for data-oriented checking. — Verify data correctness — Generate the expected results of a test. — Store violations.
Assertions for control-oriented checking. — Verify temporal behavior of timing protocols
1. Code Coverage
2. Test Planning
3. Assertions
4. Transactions
6. Automatic Stimulus
5. Self-Checking Testbenches
7. Functional Coverage
Stimulus
010010.. 010010..
DUT 111011..
010010.. Valid data?
Checking
Legal sequence?
144 © 2010 Mentor Graphics Corp. Company Confidential
www.mentor.com
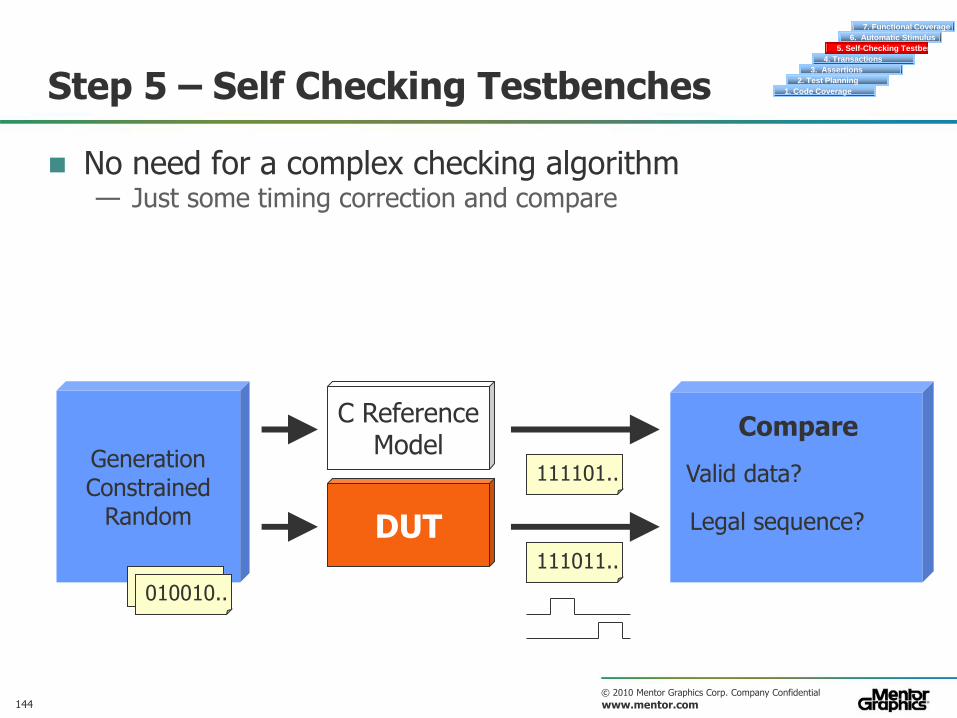
Step 5 – Self Checking Testbenches
No need for a complex checking algorithm — Just some timing correction and compare
1. Code Coverage
2. Test Planning
3. Assertions
4. Transactions
6. Automatic Stimulus
5. Self-Checking Testbenches
7. Functional Coverage
Generation Constrained
Random
010010.. 010010..
DUT 111011..
Valid data?
Compare
Legal sequence?
111101..
C Reference Model
145 © 2010 Mentor Graphics Corp. Company Confidential
www.mentor.com
Step 6 – Test automation Constrained Random Stimulus 1. Code Coverage
2. Test Planning
3. Assertions
4. Transactions
6. Automatic Stimulus
5. Self-Checking Testbenches
7. Functional Coverage
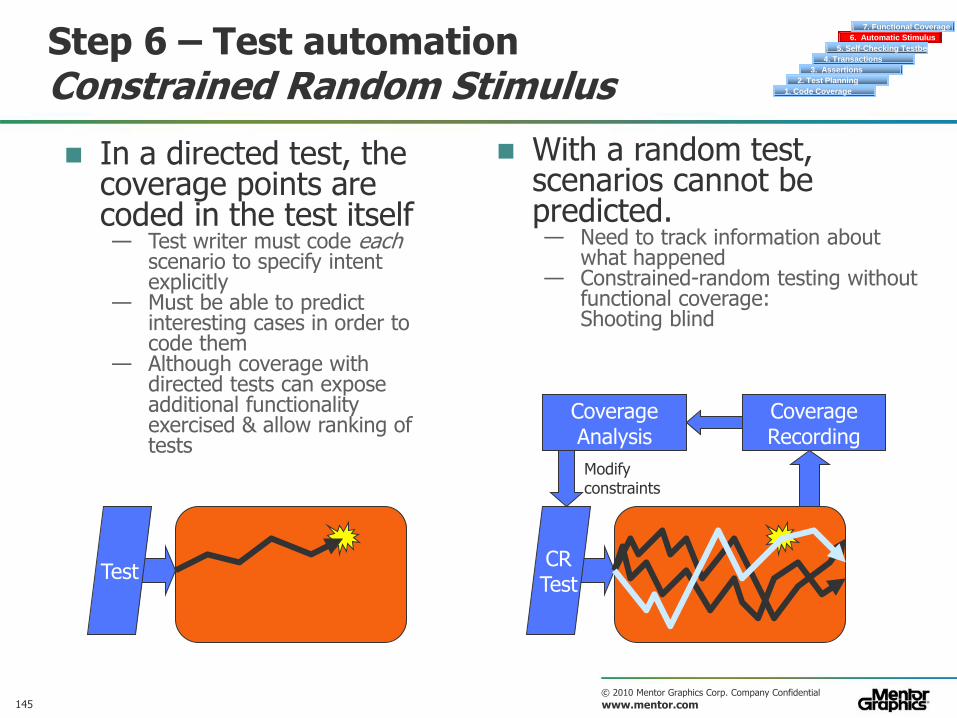
In a directed test, the coverage points are coded in the test itself — Test writer must code each
scenario to specify intent explicitly
— Must be able to predict interesting cases in order to code them
— Although coverage with directed tests can expose additional functionality exercised & allow ranking of tests
With a random test, scenarios cannot be predicted. — Need to track information about
what happened — Constrained-random testing without
functional coverage: Shooting blind
Test CR Test
Coverage Recording
Coverage Analysis
Modify constraints
146 © 2010 Mentor Graphics Corp. Company Confidential
www.mentor.com
Step 6 – Test automation UVM Integrated Verification Solution 1. Code Coverage
2. Test Planning
3. Assertions
4. Transactions
6. Automatic Stimulus
5. Self-Checking Testbenches
7. Functional Coverage
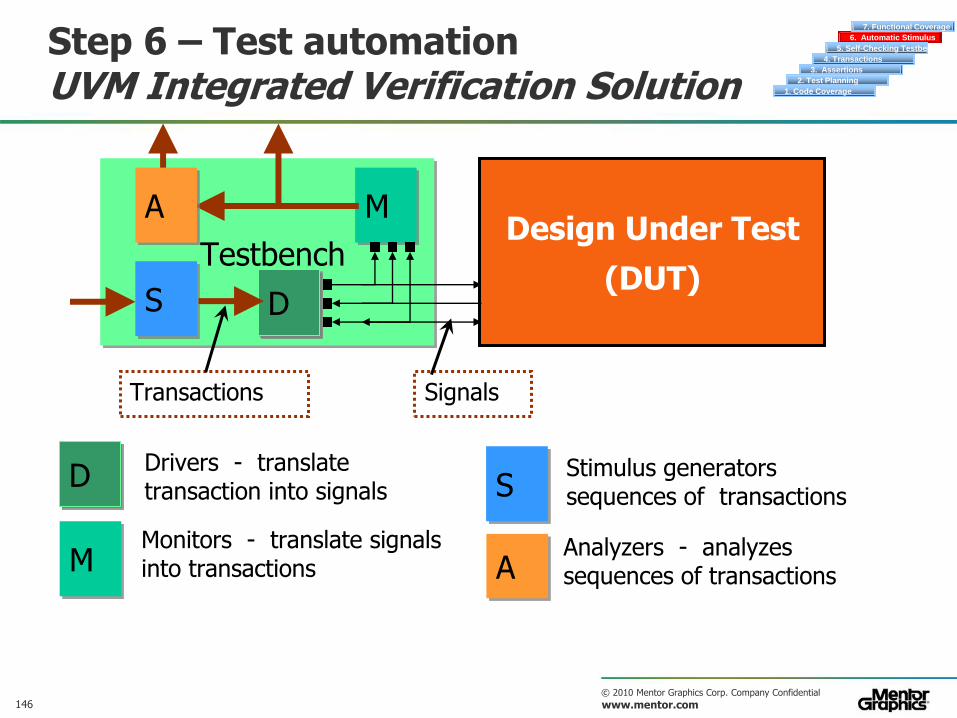
Design Under Test
(DUT) D D S
Transactions
M
Signals
D Drivers - translate transaction into signals
Monitors - translate signals into transactions M
Stimulus generators sequences of transactions S
Analyzers - analyzes sequences of transactions A
A
Testbench
147 © 2010 Mentor Graphics Corp. Company Confidential
www.mentor.com
Step 6 – Test automation inFact fits in UVM-based Testbenches 1. Code Coverage
2. Test Planning
3. Assertions
4. Transactions
6. Automatic Stimulus
5. Self-Checking Testbenches
7. Functional Coverage
Design Under Test
(DUT) D S
M A
D
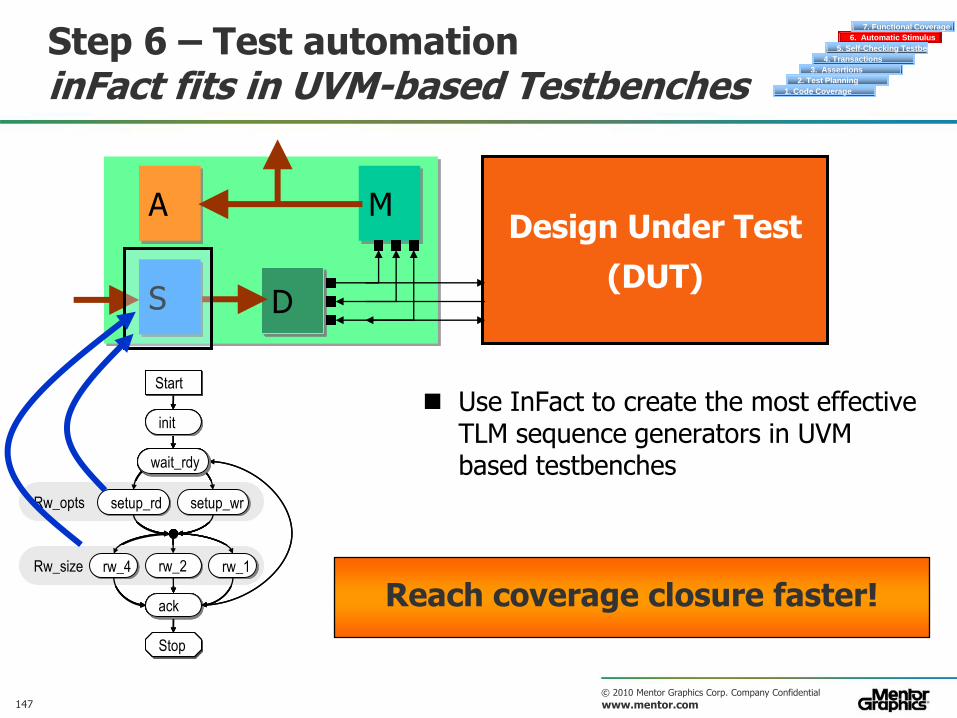
Use InFact to create the most effective TLM sequence generators in UVM based testbenches
Reach coverage closure faster!
Stop
init
Rw_opts
Rw_size
setup_rd setup_wr
rw_4 rw_2 rw_1
ack
Start
wait_rdy
init
setup_wr
rw_4
ack
Start
wait_rdy
setup_rd
rw_2
ack
wait_rdy
setup_wr
rw_1
ack
wait_rdy
setup_rd
rw_1
ack
wait_rdy
setup_wr
rw_2
ack
wait_rdy
setup_rd
rw_4
ack
wait_rdy
Stop Stop
init
Rw_opts
Rw_size
setup_rd setup_wr
rw_4 rw_2 rw_1
ack
Start
wait_rdy
148 © 2010 Mentor Graphics Corp. Company Confidential
www.mentor.com
Step 7 – Functional Coverage A traditional approach 1. Code Coverage
2. Test Planning
3. Assertions
4. Transactions
6. Automatic Stimulus
5. Self-Checking Testbenches
7. Functional Coverage
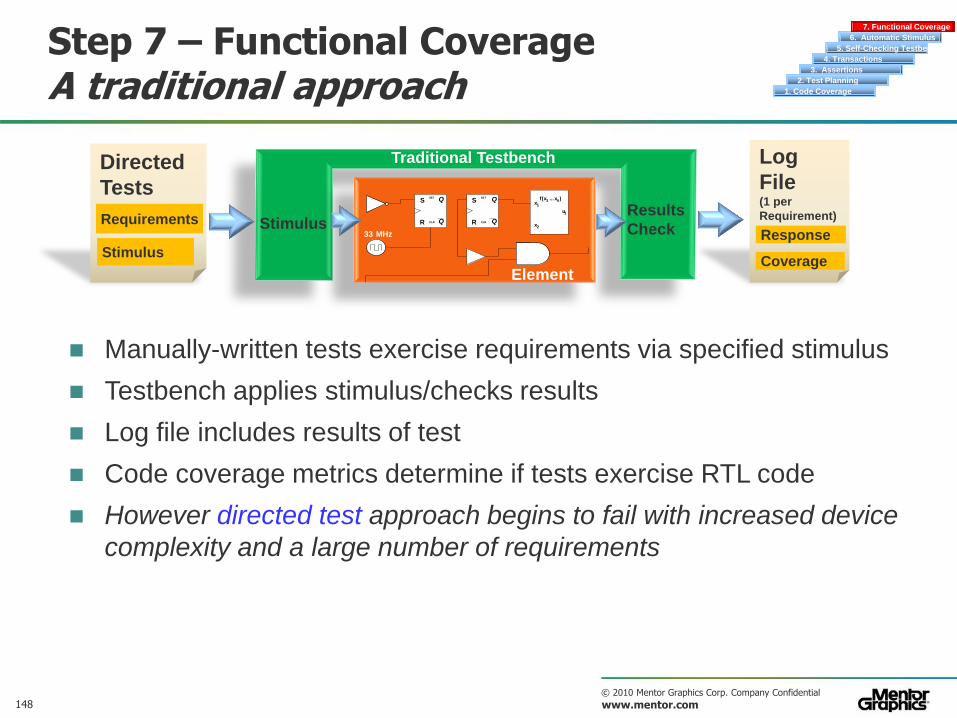
Manually-written tests exercise requirements via specified stimulus
Testbench applies stimulus/checks results
Log file includes results of test
Code coverage metrics determine if tests exercise RTL code
However directed test approach begins to fail with increased device
complexity and a large number of requirements
Directed
Tests
Traditional Testbench
Stimulus
Q
Q SET
CLR
S
R
33 MHz
Q
Q SET
CLR
S
R
u 1
x 2
x 1
f ( x 1 ... x n )
Element
Stimulus Results
Check
Log
File (1 per
Requirement)
Response
Coverage
Requirements
149 © 2010 Mentor Graphics Corp. Company Confidential
www.mentor.com
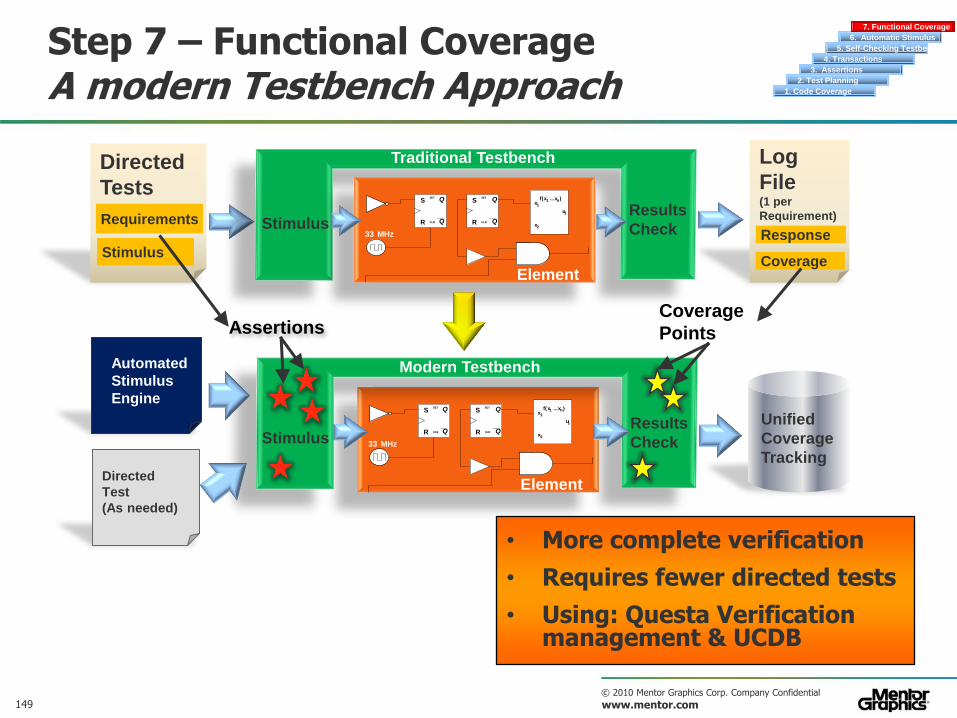
Step 7 – Functional Coverage A modern Testbench Approach 1. Code Coverage
2. Test Planning
3. Assertions
4. Transactions
6. Automatic Stimulus
5. Self-Checking Testbenches
7. Functional Coverage
Directed
Tests
Log
File (1 per
Requirement)
Traditional Testbench
Stimulus
• More complete verification
• Requires fewer directed tests
• Using: Questa Verification management & UCDB
Q
Q SET
CLR
S
R
33 MHz
Q
Q SET
CLR
S
R
u 1
x 2
x 1
f ( x 1 ... x n )
Element
Directed
Test
(As needed)
Automated
Stimulus
Engine
Stimulus Results
Check
Assertions Coverage
Points
Unified
Coverage
Tracking
Response
Coverage
Q
Q SET
CLR
S
R
33 MHz
Q
Q SET
CLR
S
R
u 1
x 2
x 1
f ( x 1 ... x n )
Element
Stimulus Results
Check
Requirements
Modern Testbench
150 © 2010 Mentor Graphics Corp. Company Confidential
www.mentor.com
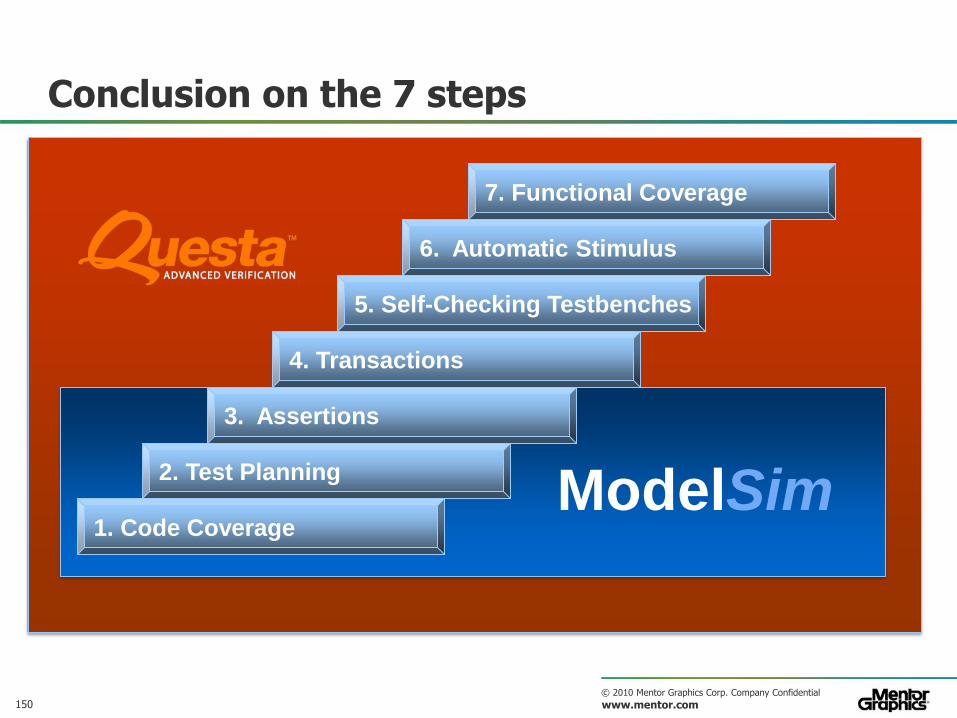
ModelSim
Conclusion on the 7 steps
1. Code Coverage
2. Test Planning
3. Assertions
4. Transactions
6. Automatic Stimulus
5. Self-Checking Testbenches
7. Functional Coverage
151 © 2010 Mentor Graphics Corp. Company Confidential
www.mentor.com
Learn More?
Register for the Verification Academy — www.verificationacademy.com
Learn more about Assertions in a one day training course
152 © 2010 Mentor Graphics Corp. Company Confidential
www.mentor.com
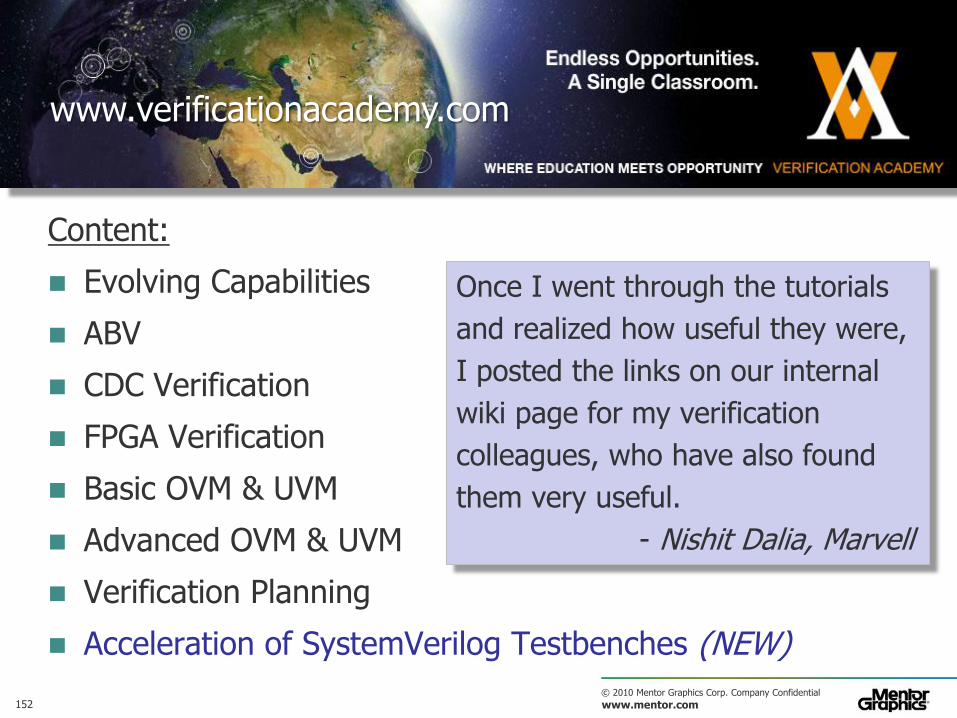
Content:
Evolving Capabilities
ABV
CDC Verification
FPGA Verification
Basic OVM & UVM
Advanced OVM & UVM
Verification Planning
Acceleration of SystemVerilog Testbenches (NEW)
Once I went through the tutorials
and realized how useful they were,
I posted the links on our internal
wiki page for my verification
colleagues, who have also found
them very useful.
- Nishit Dalia, Marvell
www.verificationacademy.com
153 © 2010 Mentor Graphics Corp. Company Confidential
www.mentor.com
ModelSim and Questa Leading Single & Mixed Language Simulation
Native single kernel verification environment — Verilog 1995, 2001, 2005
— VHDL 1987/1993/2002/2008
— SystemVerilog for design
— SystemVerilog and PSL assertions
— SystemC with SCV and TLM, C, C++ (option)
Broadest type support at language boundaries — Component/module instantiation
— SignalSpy™
— SC control, observe and connect methods
— Only simulator able to share type definitions written in one package in both VHDL and SystemVerilog
– Preserving full benefits of strong type checking
154 © 2010 Mentor Graphics Corp. Company Confidential
www.mentor.com
ModelSim PE Leading Single & Mixed Language Simulation
Integrated debug and analysis capabilities
— Comprehensive root cause analysis
— Coverage analysis and reporting
— Commands/GUI consistent across languages, HW platforms and abstraction levels
SecureIP support
— Higher performance Xilinx IP
— Native support for VHDL and Verilog
Windows support
155 © 2010 Mentor Graphics Corp. Company Confidential
www.mentor.com
ModelSim DE and Questa Leading Assertion and Coverage technology
SVA and PSL assertions — Improved verification effectiveness
— Improved time to debug – Identify failures as they occur
– ModelSim DE advanced assertion debugging
— Assertion browsing
OVL assertion library ready
Code Coverage — Efficient coverage collection
– Unified Coverage Database (UCDB)
— Improve verification test productivity – Ranking and Merging
Linux and Windows support
156 © 2010 Mentor Graphics Corp. Company Confidential
www.mentor.com
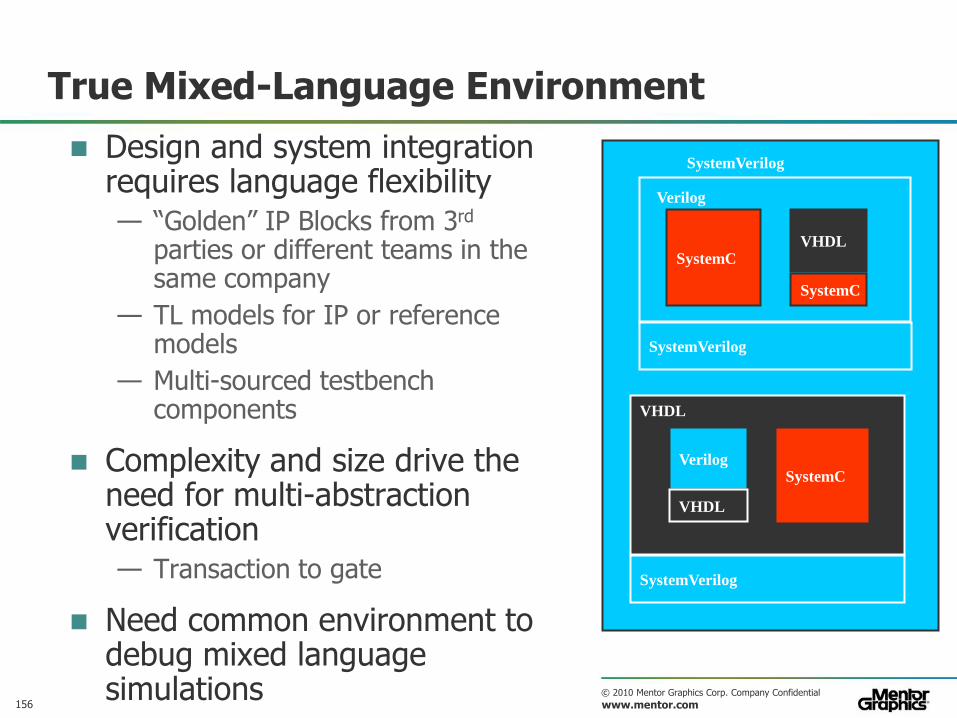
True Mixed-Language Environment
Design and system integration requires language flexibility — “Golden” IP Blocks from 3rd
parties or different teams in the same company
— TL models for IP or reference models
— Multi-sourced testbench components
Complexity and size drive the need for multi-abstraction verification — Transaction to gate
Need common environment to debug mixed language simulations
SystemVerilog
Verilog SystemC
VHDL
SystemVerilog
VHDL
VHDL
SystemC
SystemVerilog
SystemC
Verilog
157 © 2010 Mentor Graphics Corp. Company Confidential
www.mentor.com
Questa Ultra
Questa Prime
Questa Core
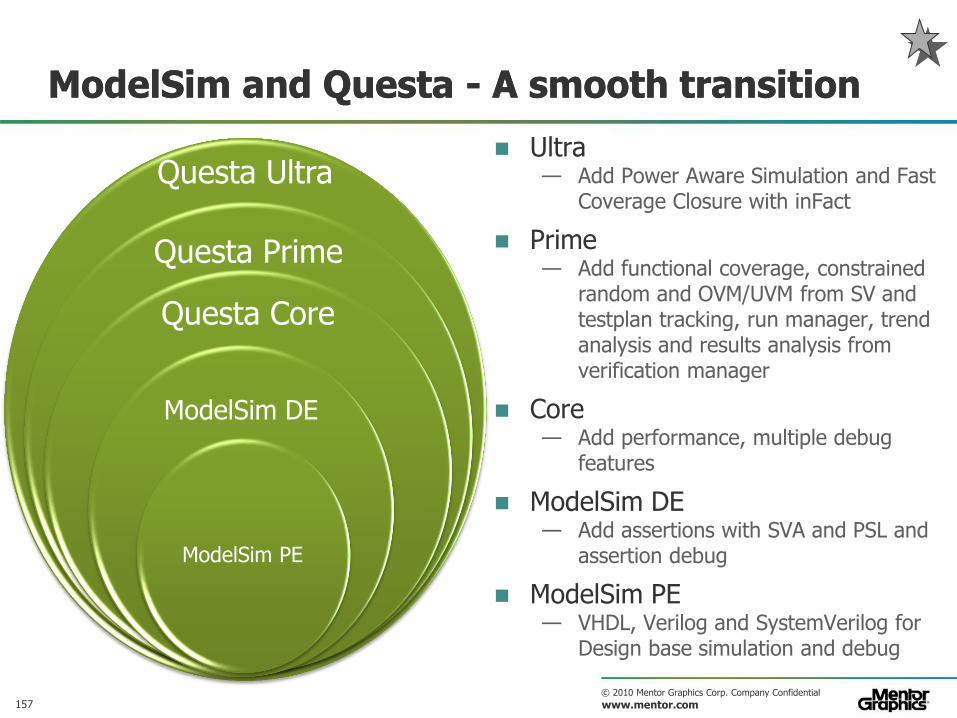
ModelSim and Questa - A smooth transition
ModelSim DE
ModelSim PE
Ultra — Add Power Aware Simulation and Fast
Coverage Closure with inFact
Prime — Add functional coverage, constrained
random and OVM/UVM from SV and testplan tracking, run manager, trend analysis and results analysis from verification manager
Core — Add performance, multiple debug
features
ModelSim DE — Add assertions with SVA and PSL and
assertion debug
ModelSim PE — VHDL, Verilog and SystemVerilog for
Design base simulation and debug
ModelSim and Questa - A smooth transition
158 © 2010 Mentor Graphics Corp. Company Confidential
www.mentor.com
Agenda: ModelSim & Questa GUI Essentials
Introduction
Getting Help with the Tool
General ModelSim Operations
Projects
Managing Simulation Messages
Source Level Debugging
Viewing and Working with Waveforms
Graphical Dataflow
Summary
159 © 2010 Mentor Graphics Corp. Company Confidential
www.mentor.com
Introduction
Many great debug tools in ModelSim
Most people don’t know what’s there
This workshop will show you ways to be more effective in our GUI
Use this workshop as a toolbox of techniques for common debugging & simulation tasks
This is just a sneak preview of the GUI workshop… the whole thing runs for half a day and includes hands-on lab work
160 © 2010 Mentor Graphics Corp. Company Confidential
www.mentor.com
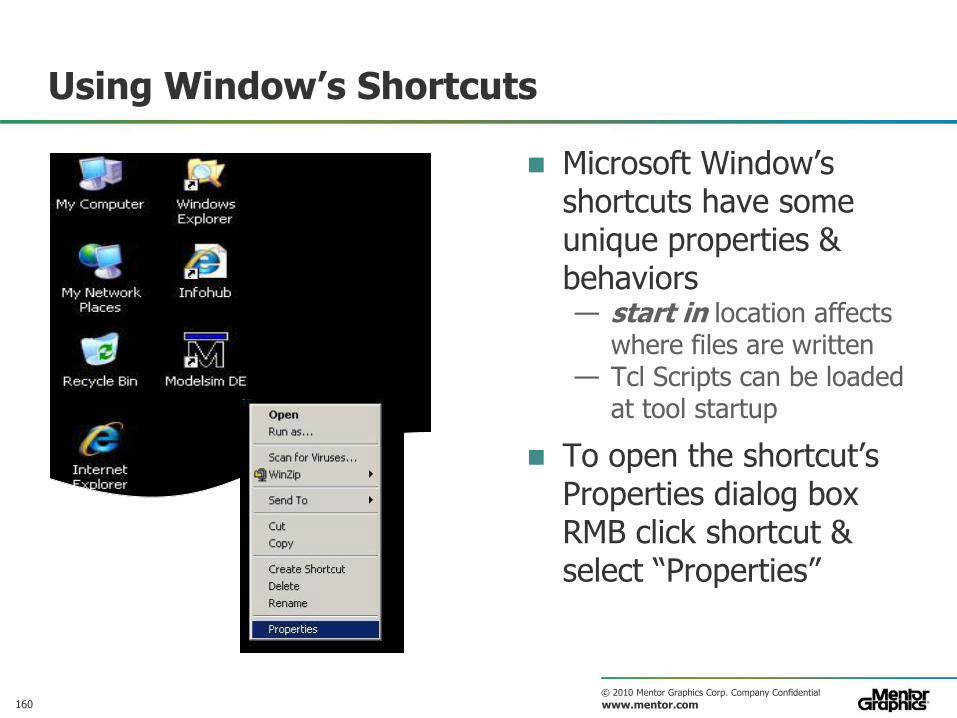
Using Window’s Shortcuts
Microsoft Window’s shortcuts have some unique properties & behaviors — start in location affects
where files are written — Tcl Scripts can be loaded
at tool startup
To open the shortcut’s Properties dialog box RMB click shortcut & select “Properties”
161 © 2010 Mentor Graphics Corp. Company Confidential
www.mentor.com
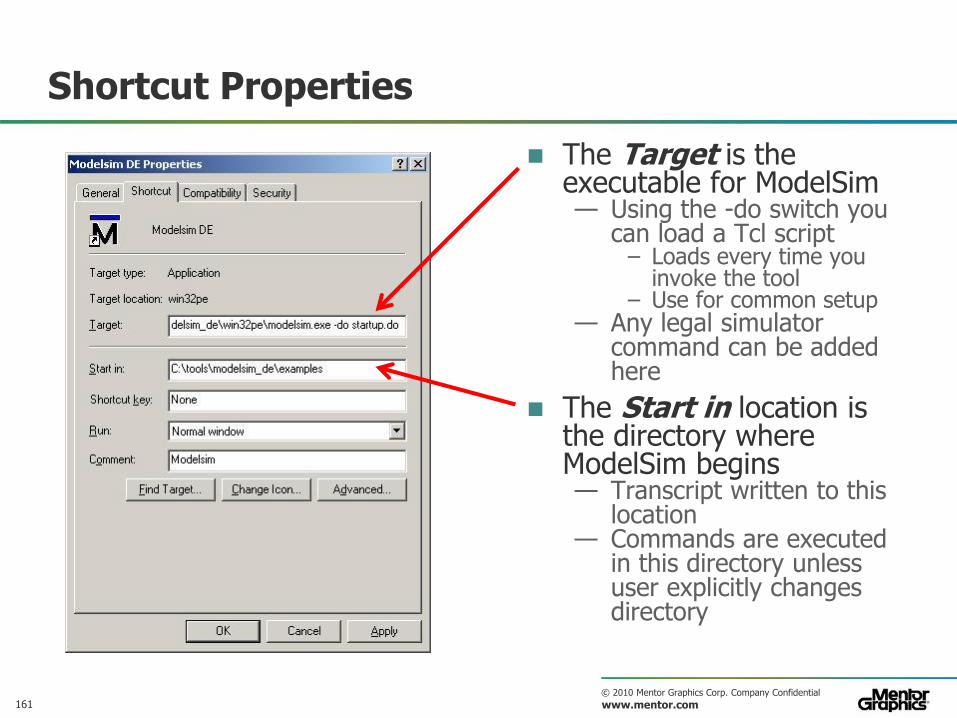
Shortcut Properties
The Target is the executable for ModelSim — Using the -do switch you
can load a Tcl script – Loads every time you
invoke the tool – Use for common setup
— Any legal simulator command can be added here
The Start in location is the directory where ModelSim begins — Transcript written to this
location — Commands are executed
in this directory unless user explicitly changes directory
162 © 2010 Mentor Graphics Corp. Company Confidential
www.mentor.com
Agenda: ModelSim & Questa GUI Essentials
Introduction
Getting Help with the Tool
General ModelSim Operations
Projects
Managing Simulation Messages
Source Level Debugging
Viewing and Working with Waveforms
Graphical Dataflow
Summary
163 © 2010 Mentor Graphics Corp. Company Confidential
www.mentor.com
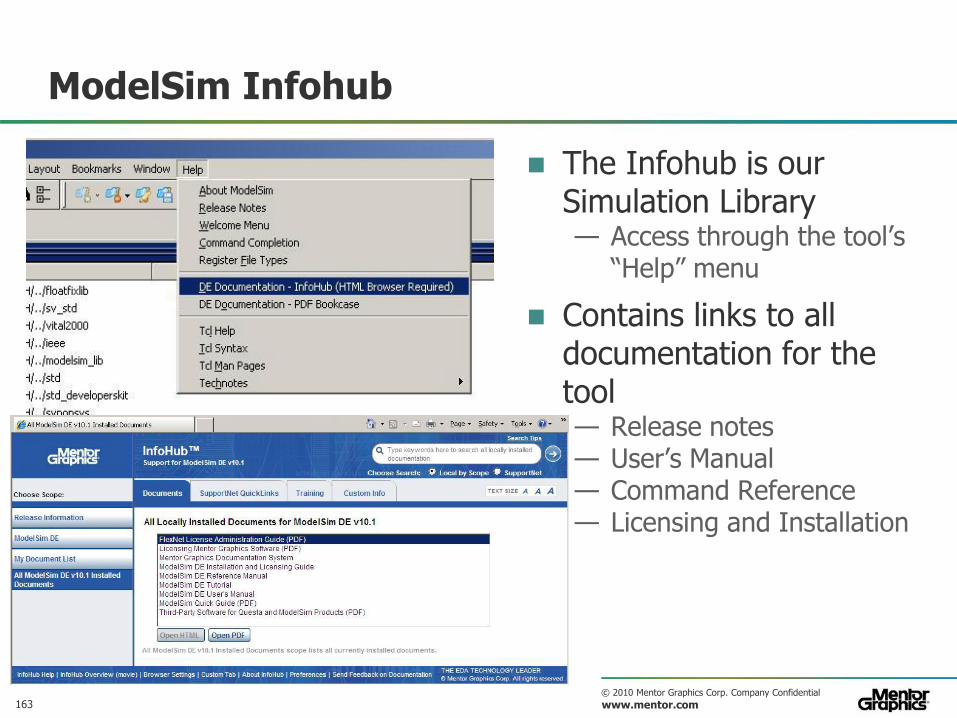
ModelSim Infohub
The Infohub is our Simulation Library — Access through the tool’s
“Help” menu
Contains links to all documentation for the tool — Release notes — User’s Manual — Command Reference — Licensing and Installation
164 © 2010 Mentor Graphics Corp. Company Confidential
www.mentor.com
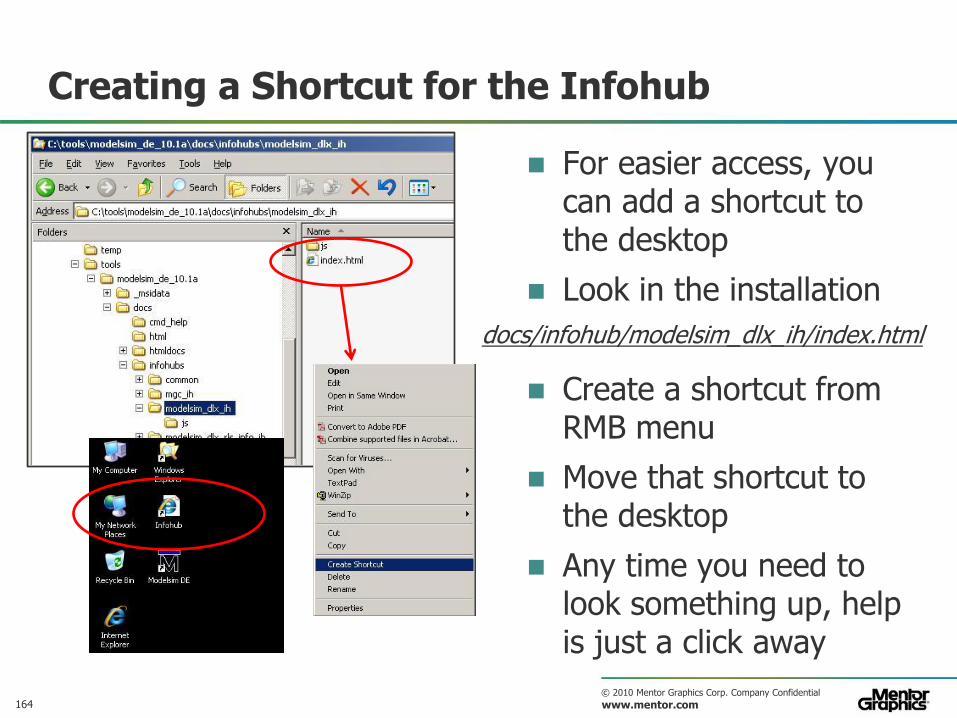
Creating a Shortcut for the Infohub
For easier access, you can add a shortcut to the desktop
Look in the installation
Create a shortcut from RMB menu
Move that shortcut to the desktop
Any time you need to look something up, help is just a click away
docs/infohub/modelsim_dlx_ih/index.html
165 © 2010 Mentor Graphics Corp. Company Confidential
www.mentor.com
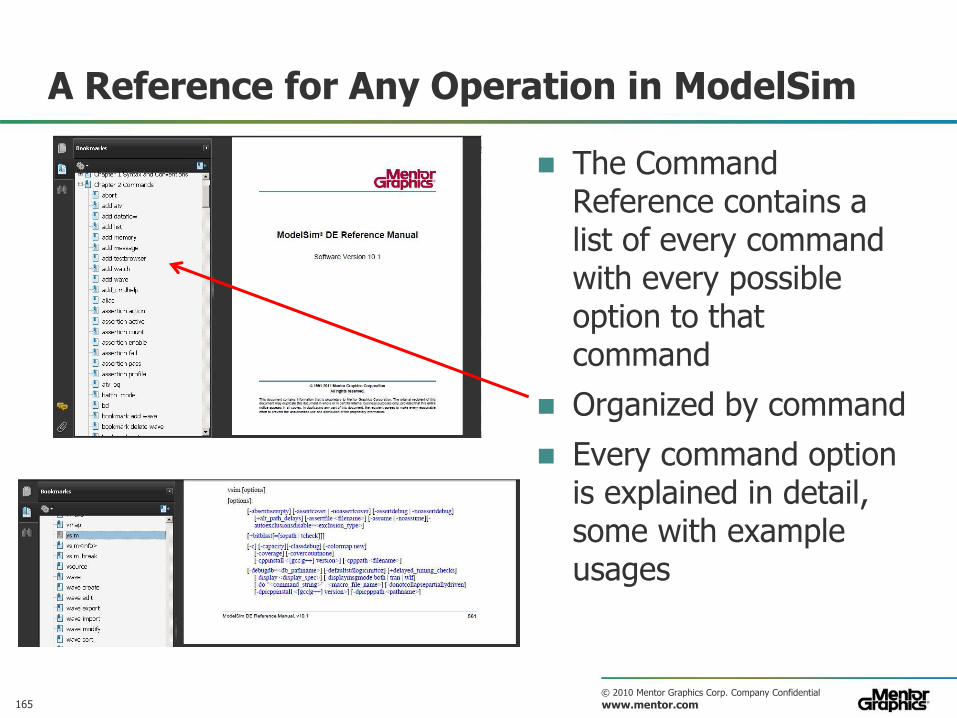
A Reference for Any Operation in ModelSim
The Command Reference contains a list of every command with every possible option to that command
Organized by command
Every command option is explained in detail, some with example usages
166 © 2010 Mentor Graphics Corp. Company Confidential
www.mentor.com
Agenda: ModelSim & Questa GUI Essentials
Introduction
Getting Help with the Tool
General ModelSim Operations
Projects
Managing Simulation Messages
Source Level Debugging
Viewing and Working with Waveforms
Graphical Dataflow
Summary
167 © 2010 Mentor Graphics Corp. Company Confidential
www.mentor.com
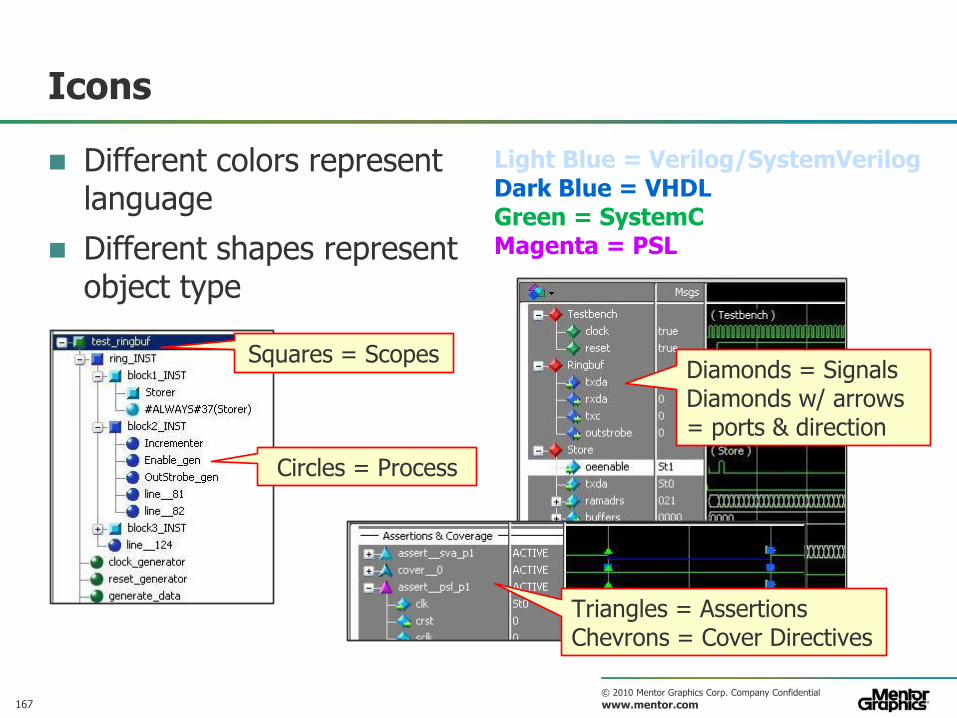
Icons
Different colors represent language
Different shapes represent object type
Light Blue = Verilog/SystemVerilog Dark Blue = VHDL Green = SystemC Magenta = PSL
Squares = Scopes
Circles = Process
Diamonds = Signals Diamonds w/ arrows = ports & direction
Triangles = Assertions Chevrons = Cover Directives
168 © 2010 Mentor Graphics Corp. Company Confidential
www.mentor.com
ModelSim’s GUI
ModelSim has many tools for different simulation tasks — Each tool has can operate in one or more windows
ModelSim’s GUI is very configurable allowing for best window placement during each task
There are several default views for common tasks — User can create as many custom views as they need
Any window can be positioned inside ModelSim’s main window frame or as separate window outside the main frame
Windows can be alone or grouped with other windows in “tab groups”
169 © 2010 Mentor Graphics Corp. Company Confidential
www.mentor.com
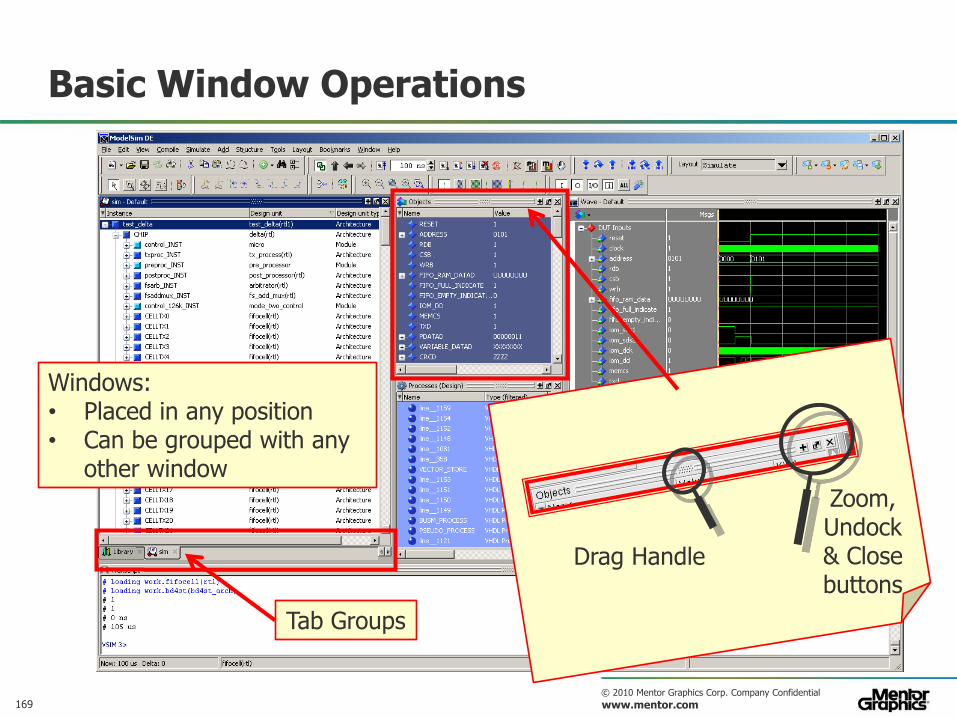
Basic Window Operations
Tab Groups
Drag Handle
Zoom, Undock & Close buttons
Windows: • Placed in any position • Can be grouped with any
other window
170 © 2010 Mentor Graphics Corp. Company Confidential
www.mentor.com
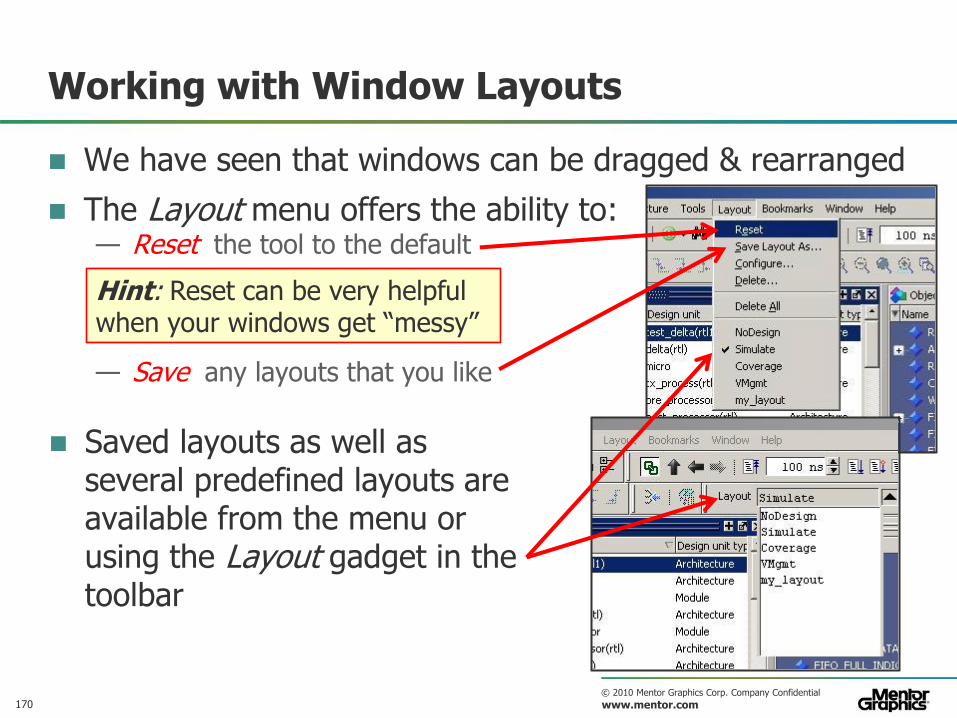
Working with Window Layouts
We have seen that windows can be dragged & rearranged
The Layout menu offers the ability to: — Reset the tool to the default
— Save any layouts that you like
Saved layouts as well as several predefined layouts are available from the menu or using the Layout gadget in the toolbar
Hint: Reset can be very helpful when your windows get “messy”
171 © 2010 Mentor Graphics Corp. Company Confidential
www.mentor.com
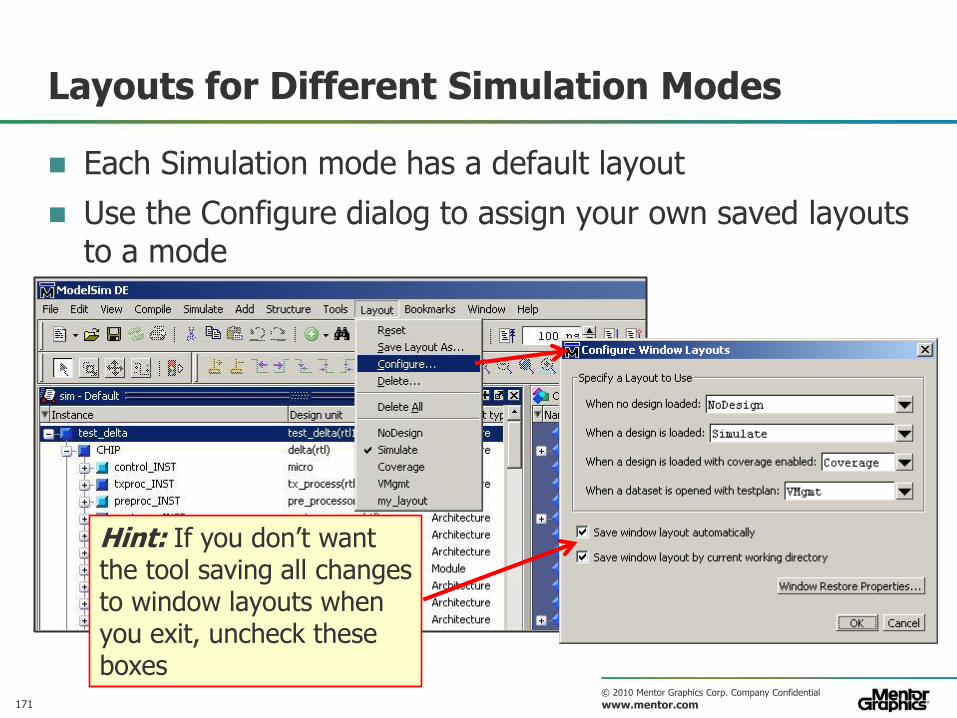
Layouts for Different Simulation Modes
Each Simulation mode has a default layout
Use the Configure dialog to assign your own saved layouts to a mode
Hint: If you don’t want the tool saving all changes to window layouts when you exit, uncheck these boxes
172 © 2010 Mentor Graphics Corp. Company Confidential
www.mentor.com
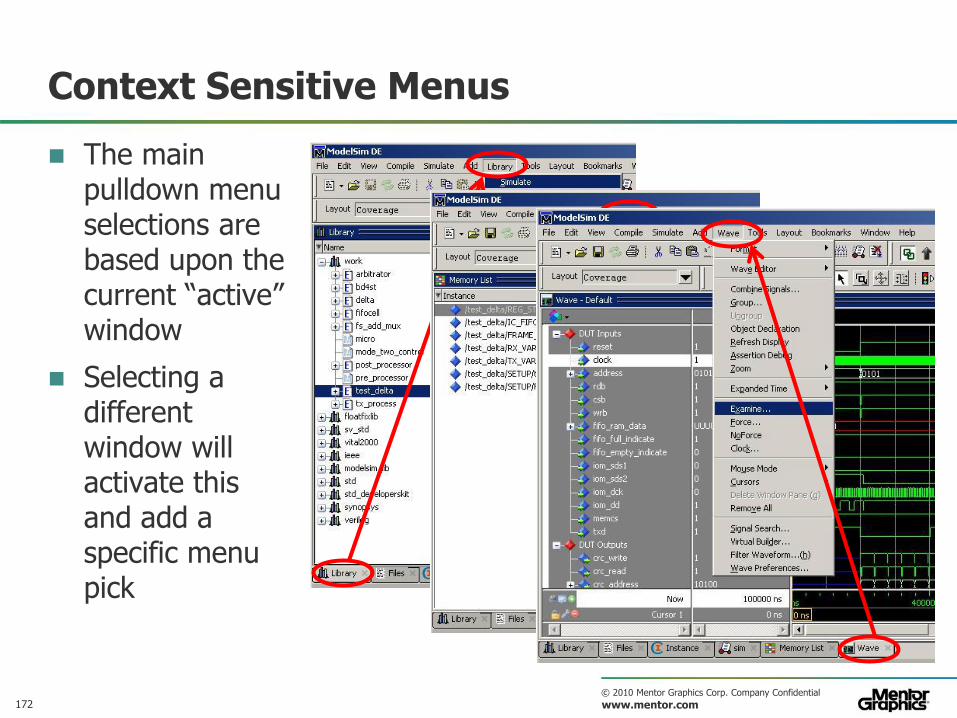
Context Sensitive Menus
The main pulldown menu selections are based upon the current “active” window
Selecting a different window will activate this and add a specific menu pick
173 © 2010 Mentor Graphics Corp. Company Confidential
www.mentor.com
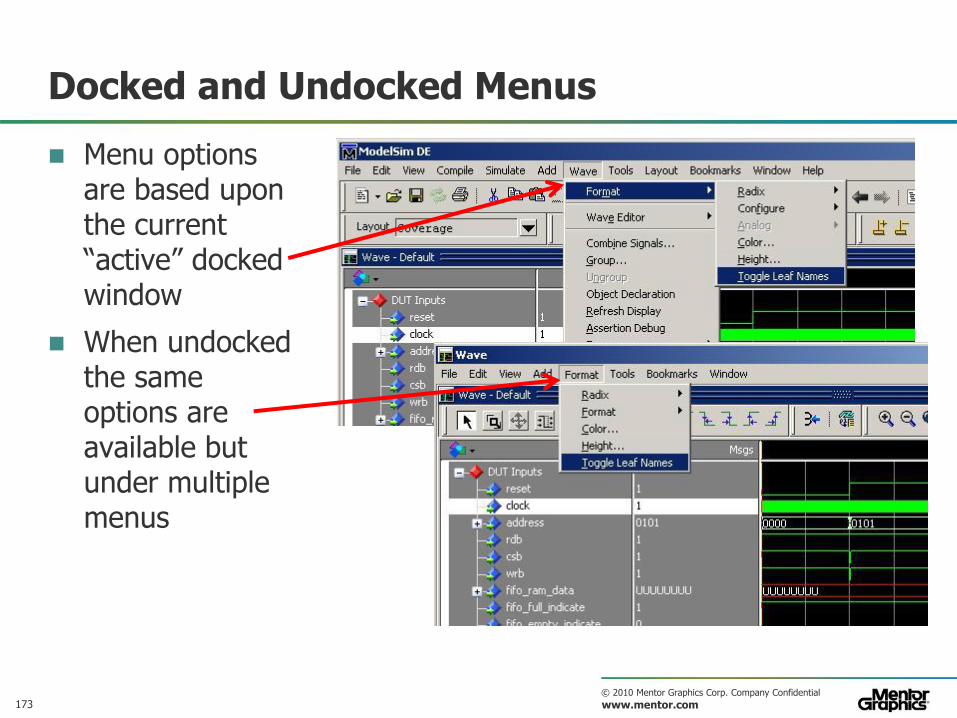
Docked and Undocked Menus
Menu options are based upon the current “active” docked window
When undocked the same options are available but under multiple menus
174 © 2010 Mentor Graphics Corp. Company Confidential
www.mentor.com
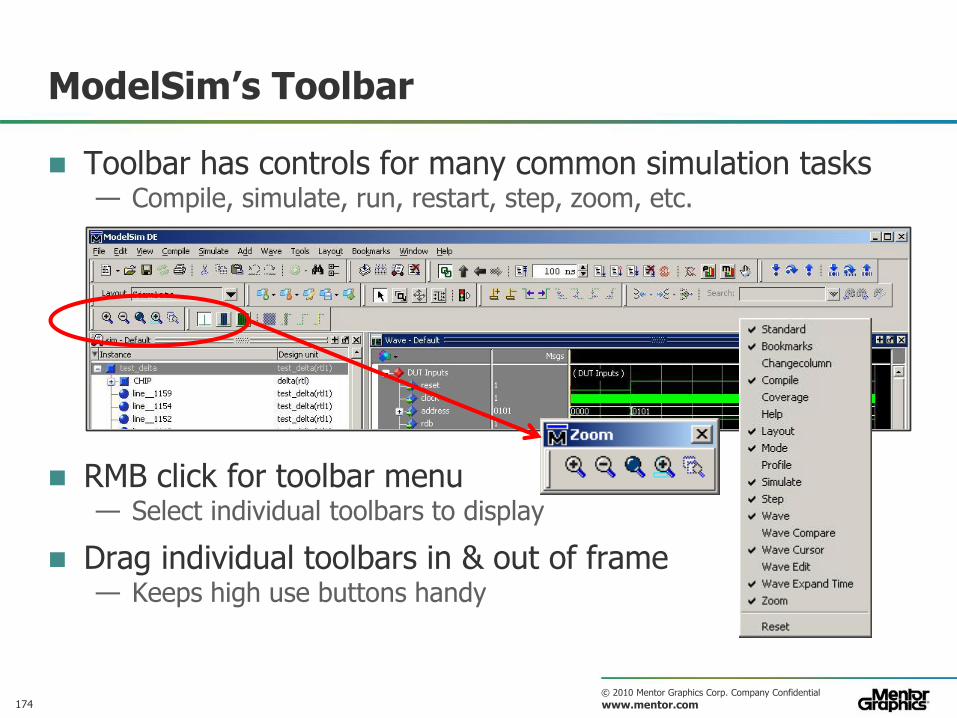
ModelSim’s Toolbar
Toolbar has controls for many common simulation tasks — Compile, simulate, run, restart, step, zoom, etc.
RMB click for toolbar menu — Select individual toolbars to display
Drag individual toolbars in & out of frame — Keeps high use buttons handy
175 © 2010 Mentor Graphics Corp. Company Confidential
www.mentor.com
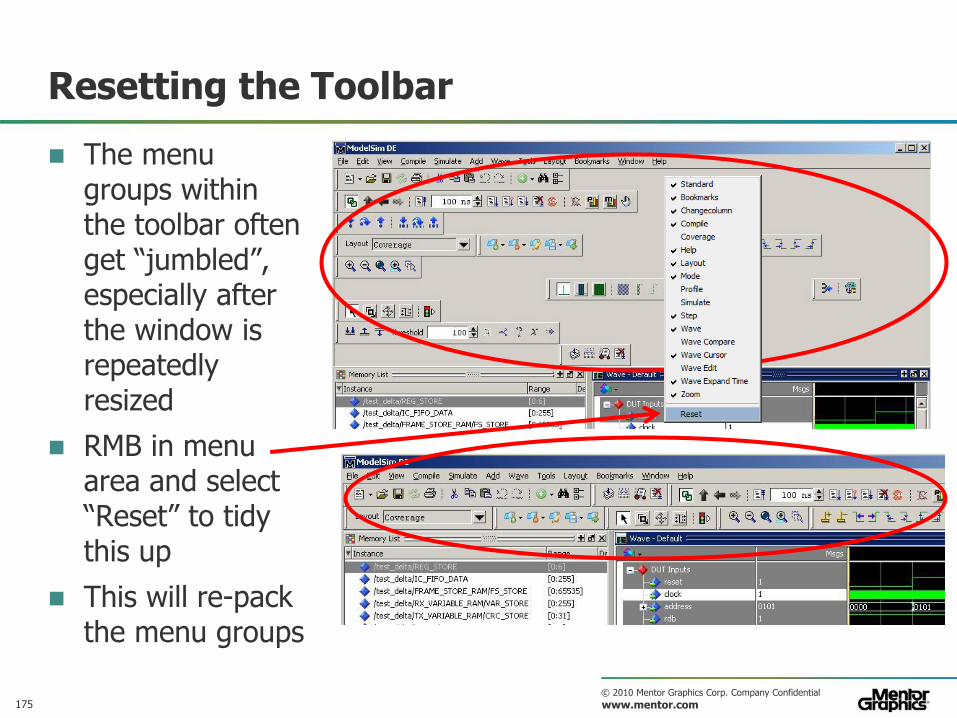
Resetting the Toolbar
The menu groups within the toolbar often get “jumbled”, especially after the window is repeatedly resized
RMB in menu area and select “Reset” to tidy this up
This will re-pack the menu groups
176 © 2010 Mentor Graphics Corp. Company Confidential
www.mentor.com
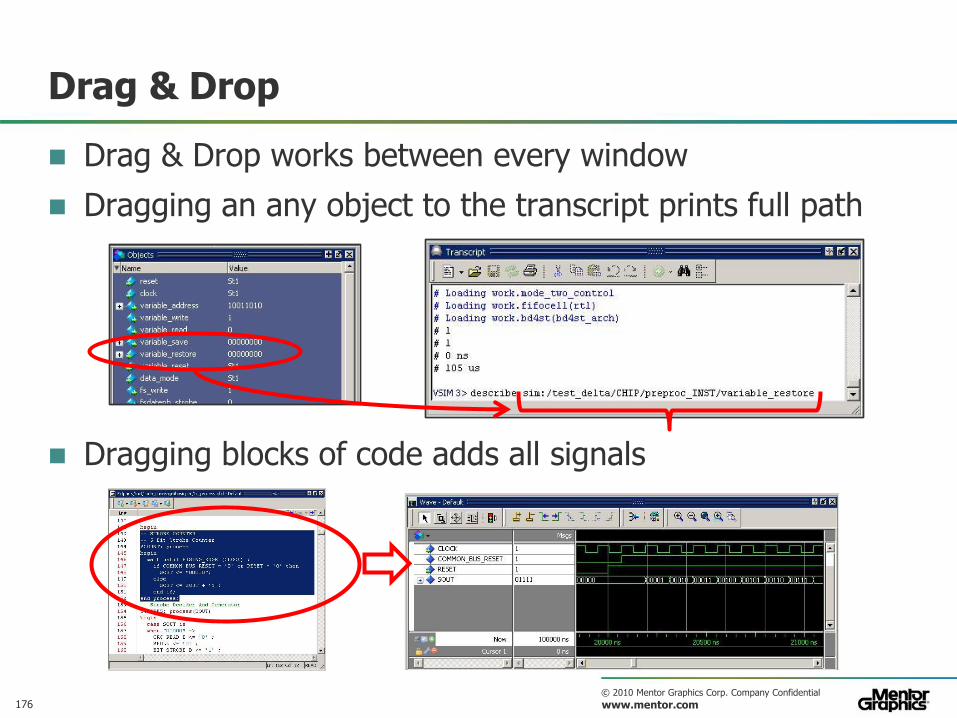
Drag & Drop
Drag & Drop works between every window
Dragging an any object to the transcript prints full path
Dragging blocks of code adds all signals
177 © 2010 Mentor Graphics Corp. Company Confidential
www.mentor.com
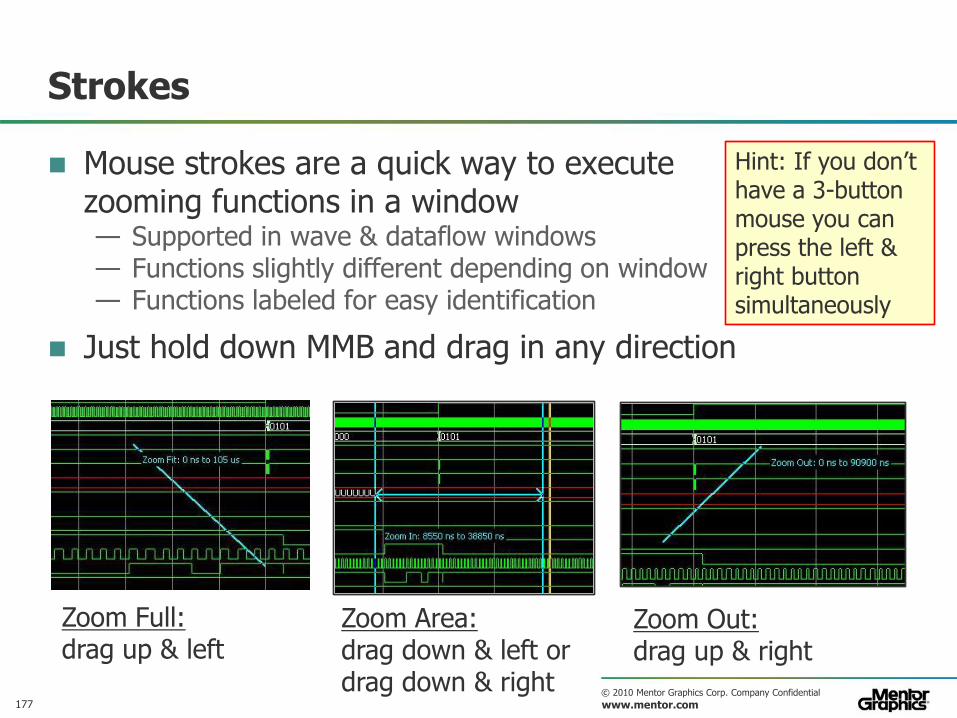
Strokes
Mouse strokes are a quick way to execute zooming functions in a window — Supported in wave & dataflow windows — Functions slightly different depending on window — Functions labeled for easy identification
Just hold down MMB and drag in any direction
Zoom Full: drag up & left
Zoom Area: drag down & left or drag down & right
Zoom Out: drag up & right
Hint: If you don’t have a 3-button mouse you can press the left & right button simultaneously
178 © 2010 Mentor Graphics Corp. Company Confidential
www.mentor.com
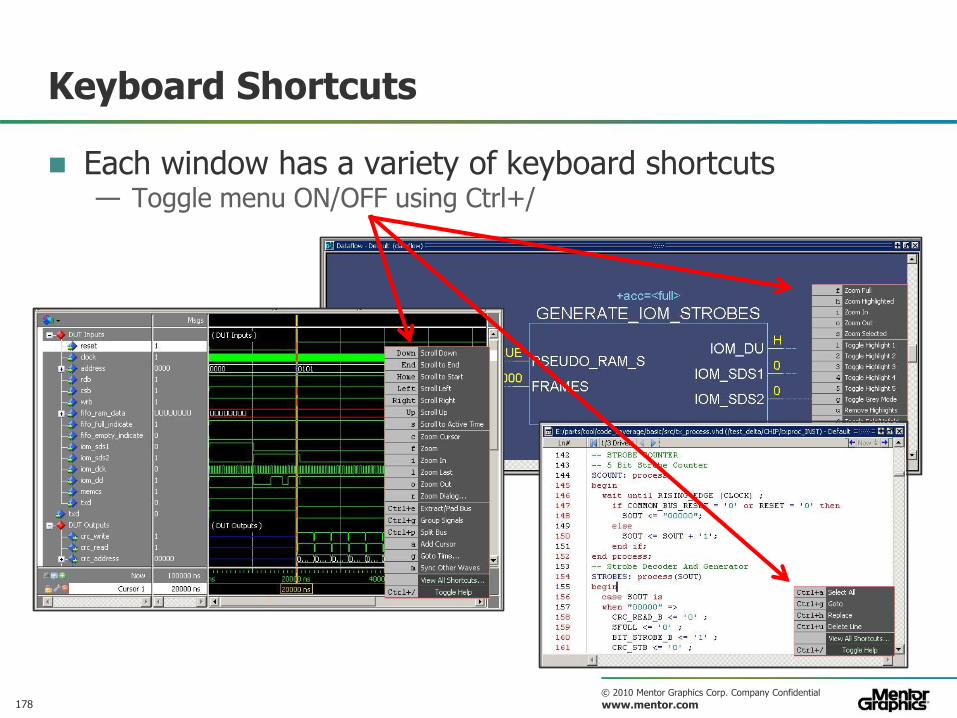
Keyboard Shortcuts
Each window has a variety of keyboard shortcuts — Toggle menu ON/OFF using Ctrl+/
179 © 2010 Mentor Graphics Corp. Company Confidential
www.mentor.com
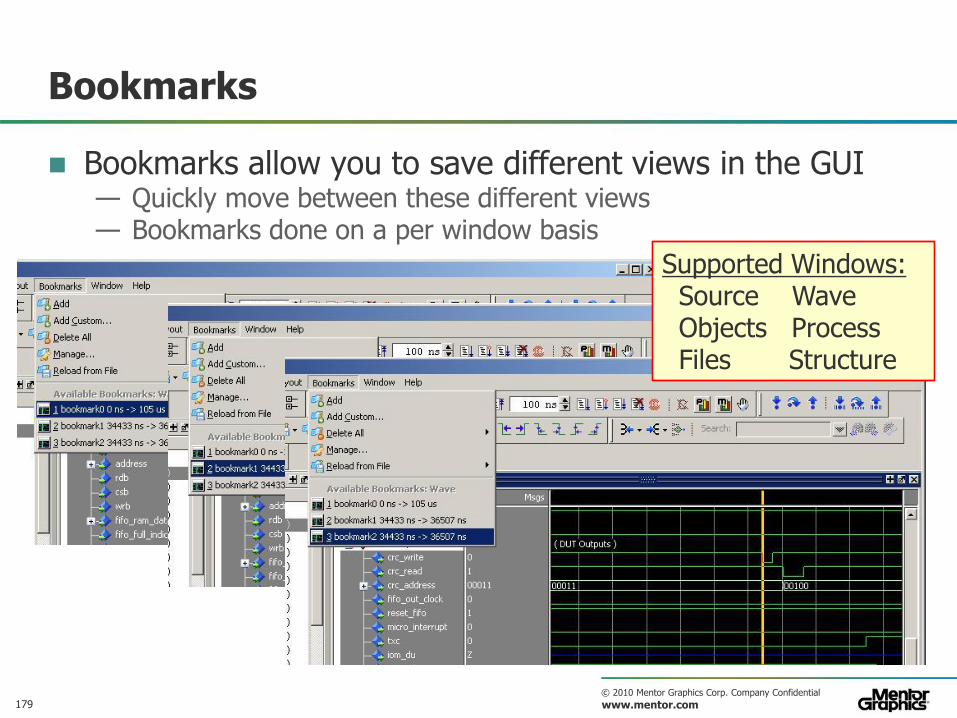
Bookmarks
Bookmarks allow you to save different views in the GUI — Quickly move between these different views — Bookmarks done on a per window basis
Supported Windows: Source Wave Objects Process Files Structure
180 © 2010 Mentor Graphics Corp. Company Confidential
www.mentor.com
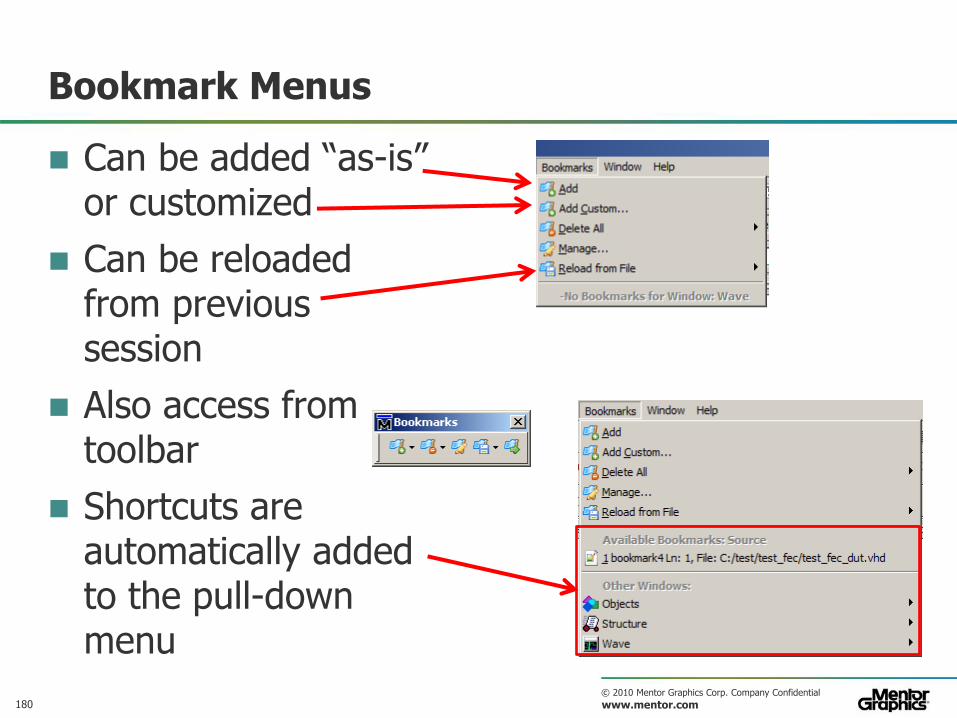
Bookmark Menus
Can be added “as-is” or customized
Can be reloaded from previous session
Also access from toolbar
Shortcuts are automatically added to the pull-down menu
181 © 2010 Mentor Graphics Corp. Company Confidential
www.mentor.com
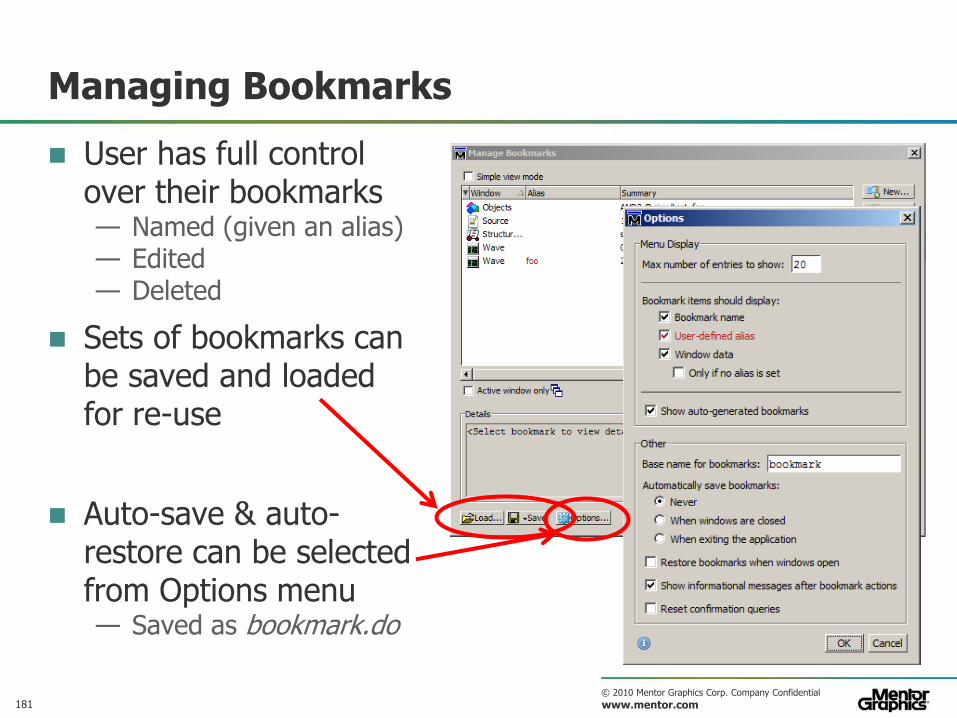
Managing Bookmarks
User has full control over their bookmarks — Named (given an alias) — Edited — Deleted
Sets of bookmarks can be saved and loaded for re-use
Auto-save & auto-restore can be selected from Options menu — Saved as bookmark.do
182 © 2010 Mentor Graphics Corp. Company Confidential
www.mentor.com
Agenda: ModelSim & Questa GUI Essentials
Introduction
Getting Help with the Tool
General ModelSim Operations
Projects
Managing Simulation Messages
Source Level Debugging
Viewing and Working with Waveforms
Graphical Dataflow
Summary
183 © 2010 Mentor Graphics Corp. Company Confidential
www.mentor.com
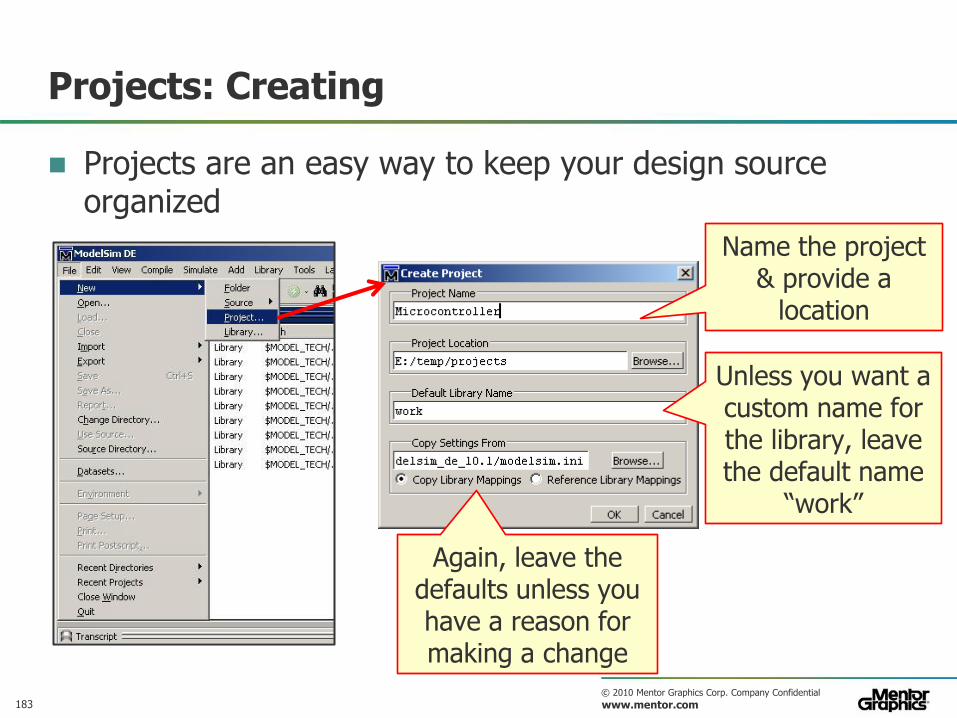
Projects: Creating
Projects are an easy way to keep your design source organized
Name the project & provide a
location
Unless you want a custom name for the library, leave the default name
“work”
Again, leave the defaults unless you have a reason for making a change
184 © 2010 Mentor Graphics Corp. Company Confidential
www.mentor.com
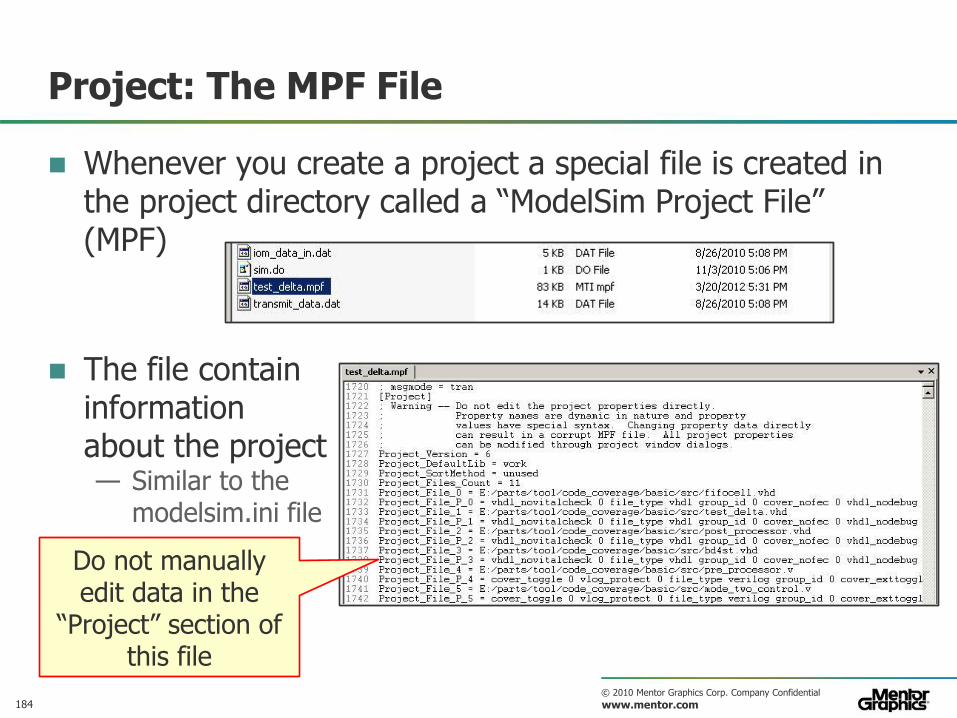
Project: The MPF File
Whenever you create a project a special file is created in the project directory called a “ModelSim Project File” (MPF)
The file contain information about the project — Similar to the
modelsim.ini file
Do not manually edit data in the
“Project” section of this file
185 © 2010 Mentor Graphics Corp. Company Confidential
www.mentor.com
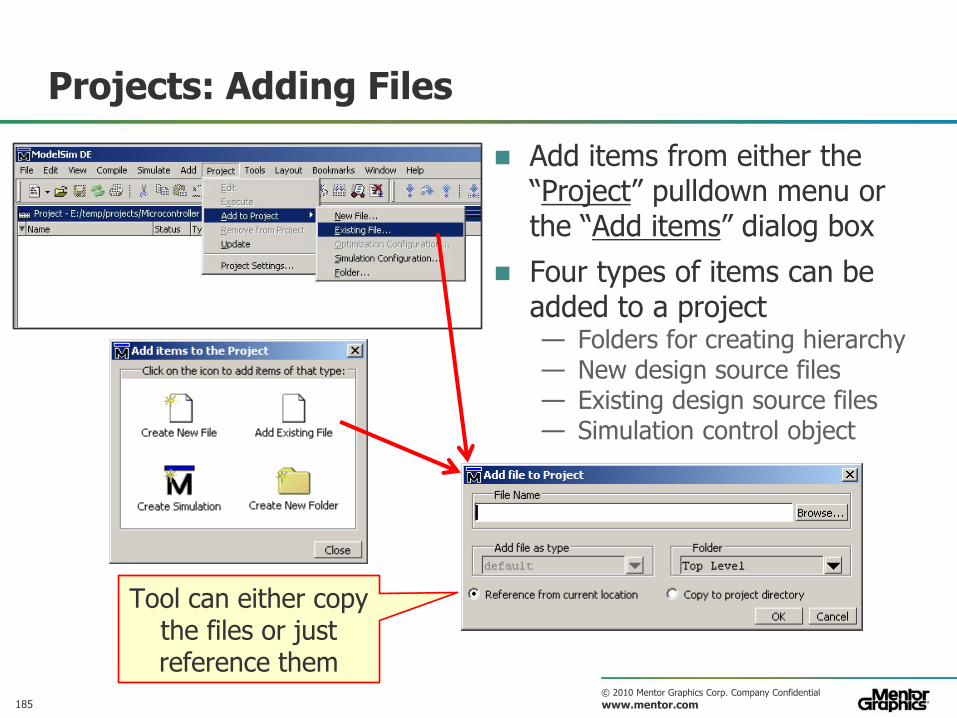
Projects: Adding Files
Add items from either the “Project” pulldown menu or the “Add items” dialog box
Four types of items can be added to a project — Folders for creating hierarchy — New design source files — Existing design source files — Simulation control object
Tool can either copy the files or just reference them
186 © 2010 Mentor Graphics Corp. Company Confidential
www.mentor.com
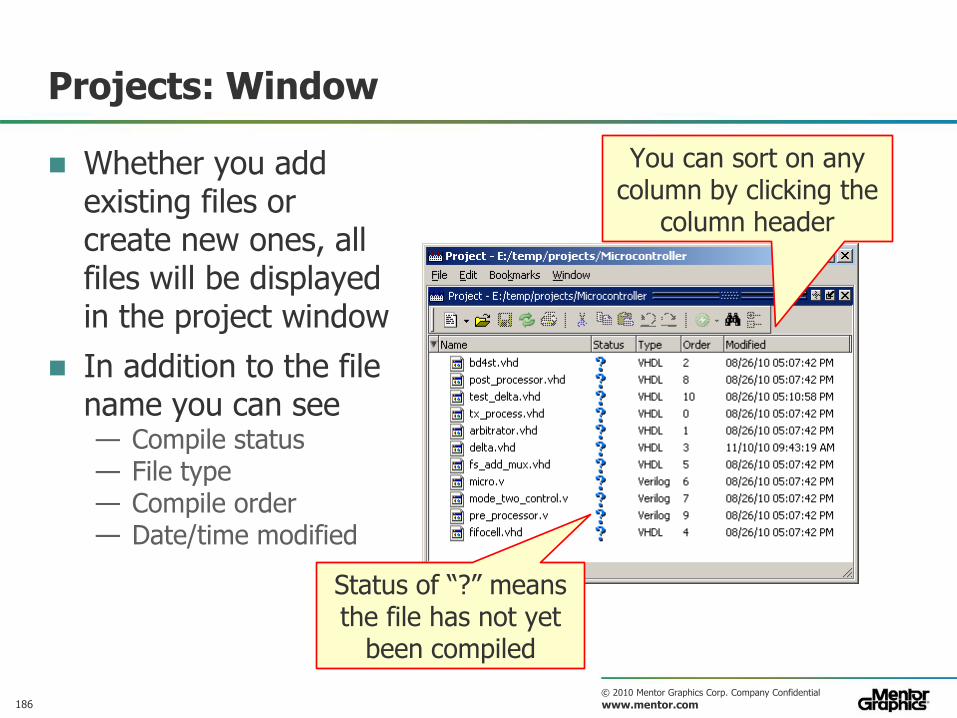
Projects: Window
Whether you add existing files or create new ones, all files will be displayed in the project window
In addition to the file name you can see — Compile status — File type — Compile order — Date/time modified
You can sort on any column by clicking the
column header
Status of “?” means the file has not yet
been compiled
187 © 2010 Mentor Graphics Corp. Company Confidential
www.mentor.com
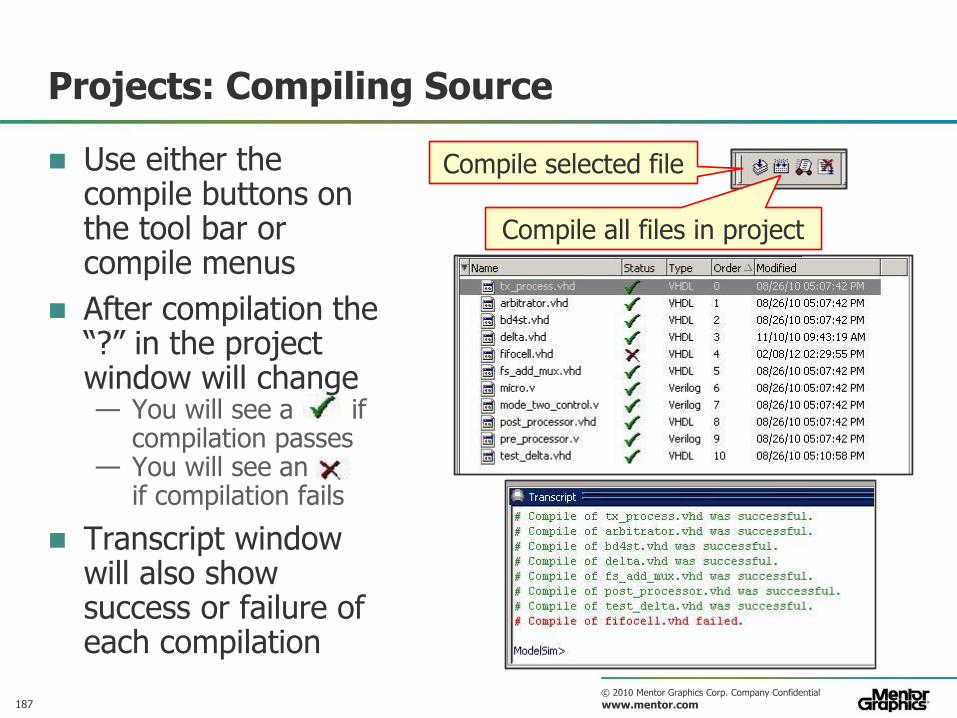
Projects: Compiling Source
Use either the compile buttons on the tool bar or compile menus
After compilation the “?” in the project window will change — You will see a if
compilation passes — You will see an
if compilation fails
Transcript window will also show success or failure of each compilation
Compile selected file
Compile all files in project
188 © 2010 Mentor Graphics Corp. Company Confidential
www.mentor.com
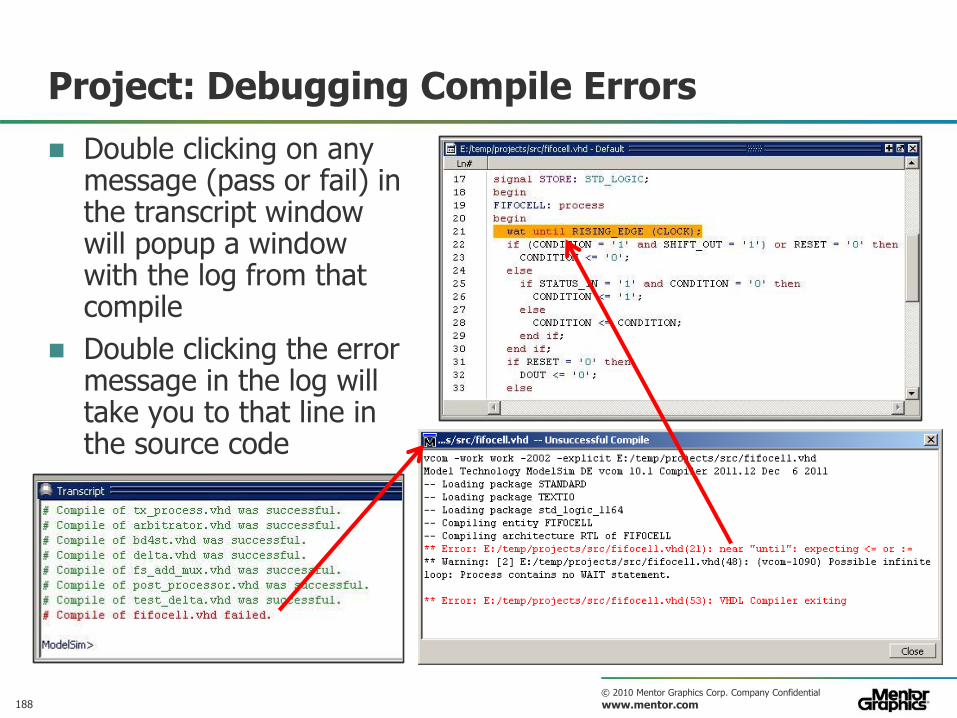
Project: Debugging Compile Errors
Double clicking on any message (pass or fail) in the transcript window will popup a window with the log from that compile
Double clicking the error message in the log will take you to that line in the source code
189 © 2010 Mentor Graphics Corp. Company Confidential
www.mentor.com
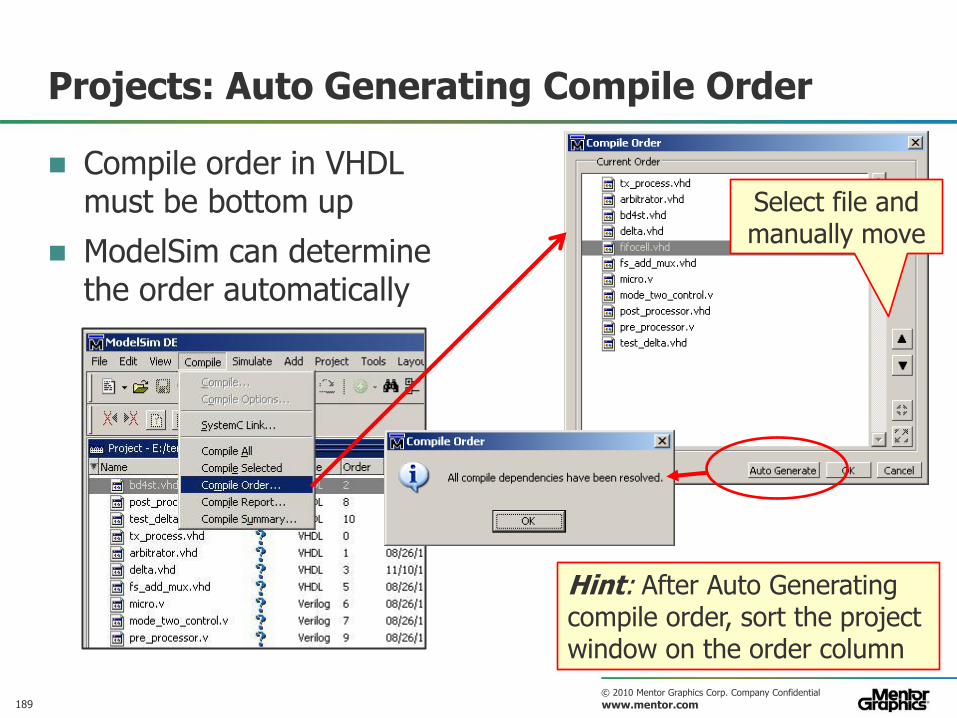
Projects: Auto Generating Compile Order
Compile order in VHDL must be bottom up
ModelSim can determine the order automatically
Select file and manually move
Hint: After Auto Generating compile order, sort the project window on the order column
190 © 2010 Mentor Graphics Corp. Company Confidential
www.mentor.com
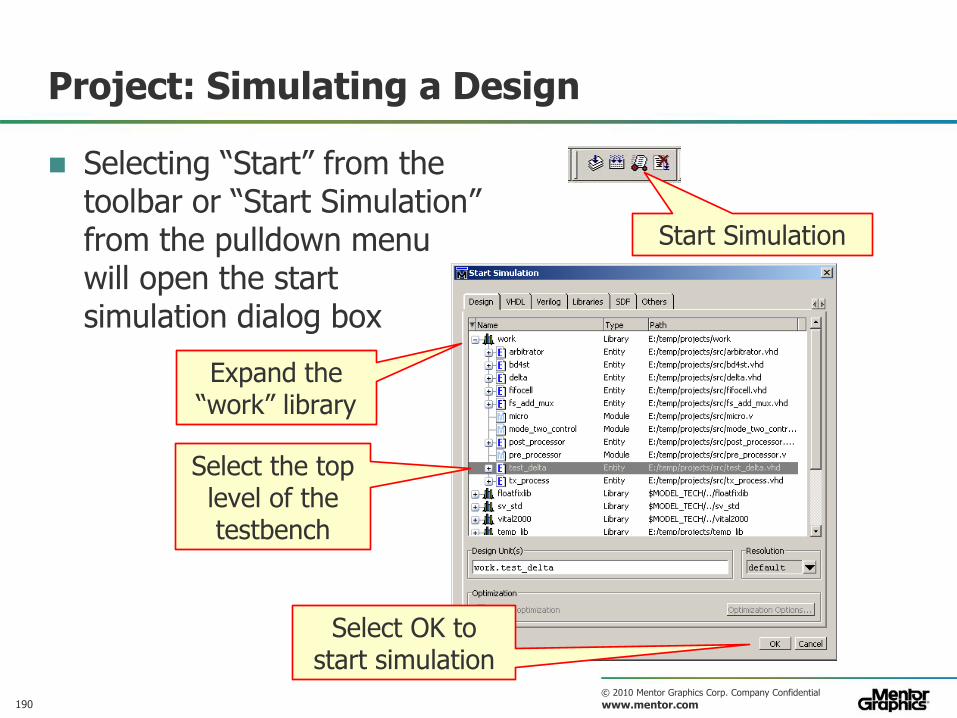
Project: Simulating a Design
Selecting “Start” from the toolbar or “Start Simulation” from the pulldown menu will open the start simulation dialog box
Start Simulation
Select the top level of the testbench
Expand the “work” library
Select OK to start simulation
191 © 2010 Mentor Graphics Corp. Company Confidential
www.mentor.com
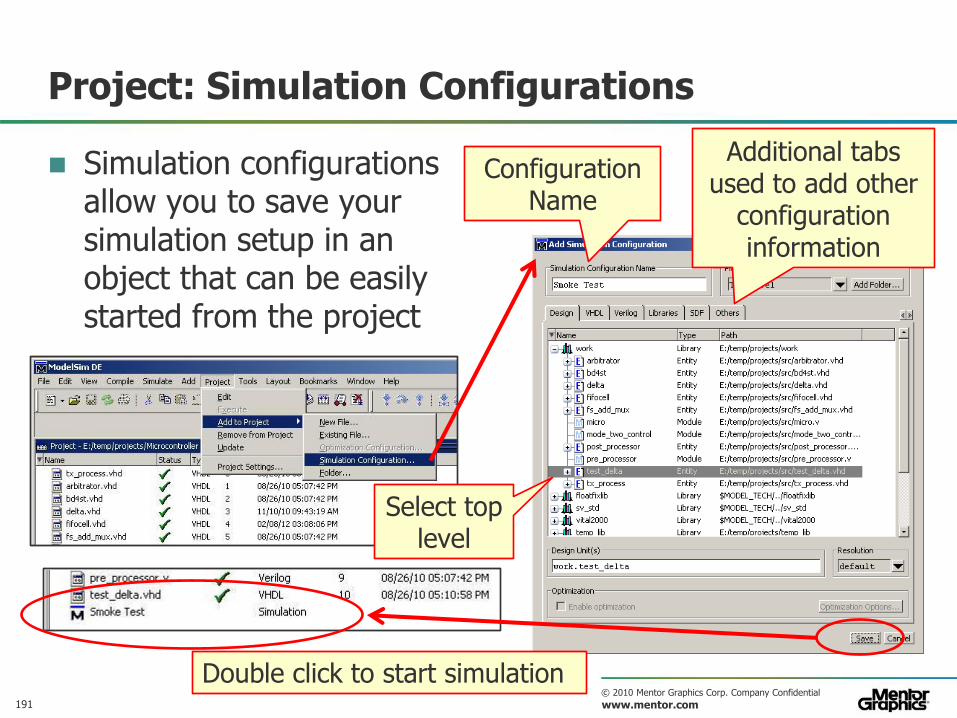
Project: Simulation Configurations
Simulation configurations allow you to save your simulation setup in an object that can be easily started from the project
Configuration Name
Select top level
Additional tabs used to add other
configuration information
Double click to start simulation
192 © 2010 Mentor Graphics Corp. Company Confidential
www.mentor.com
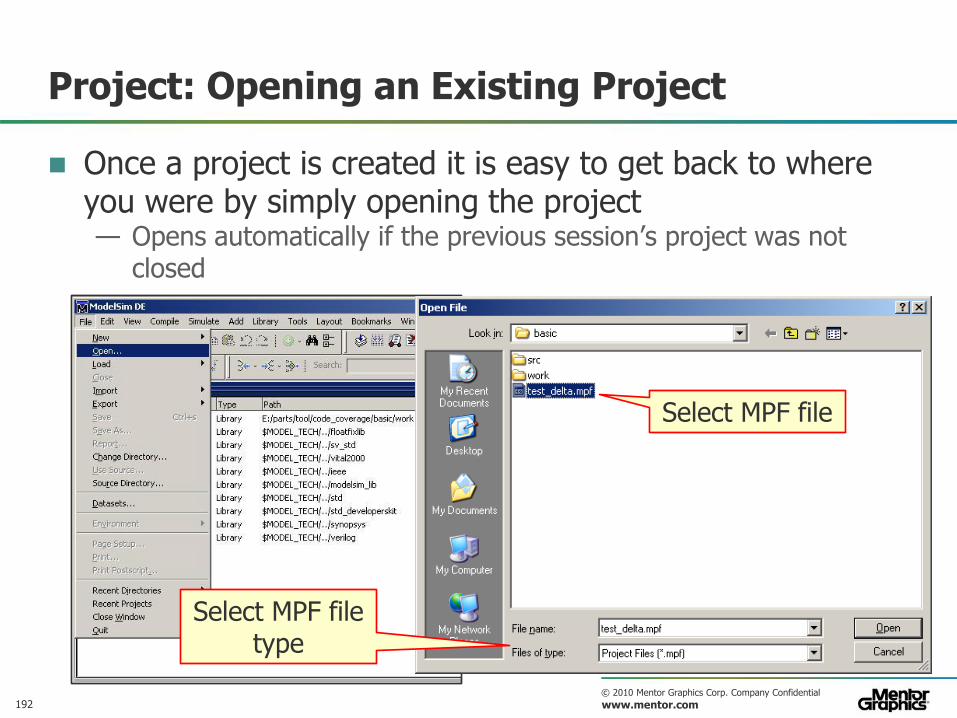
Project: Opening an Existing Project
Once a project is created it is easy to get back to where you were by simply opening the project — Opens automatically if the previous session’s project was not
closed
Select MPF file type
Select MPF file
193 © 2010 Mentor Graphics Corp. Company Confidential
www.mentor.com
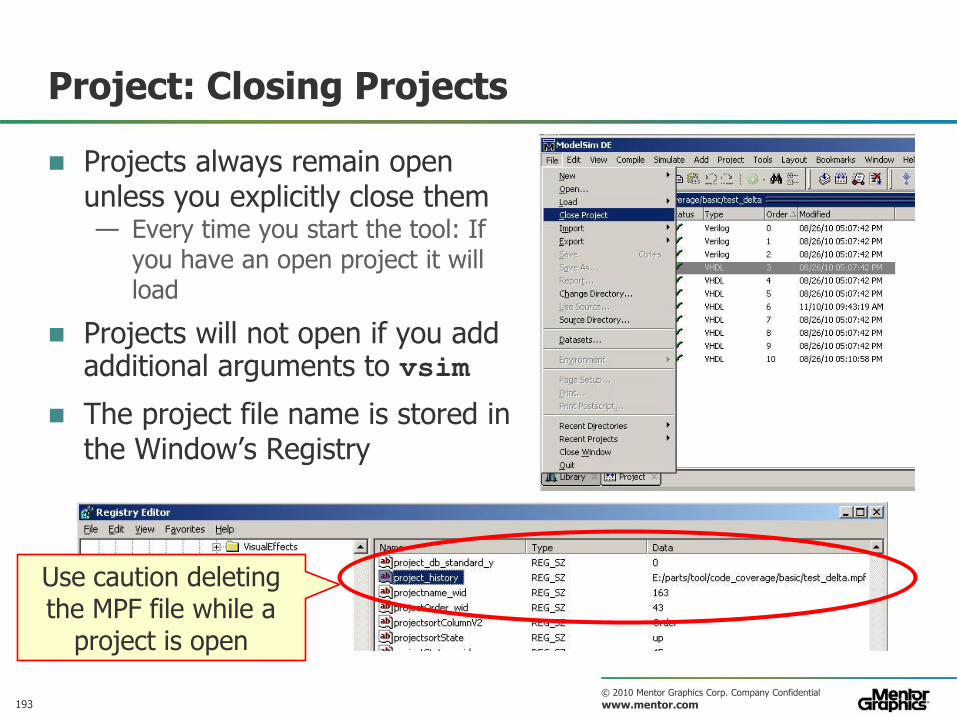
Project: Closing Projects
Projects always remain open unless you explicitly close them — Every time you start the tool: If
you have an open project it will load
Projects will not open if you add additional arguments to vsim
The project file name is stored in the Window’s Registry
Use caution deleting the MPF file while a
project is open
194 © 2010 Mentor Graphics Corp. Company Confidential
www.mentor.com
Agenda: ModelSim & Questa GUI Essentials
Introduction
Getting Help with the Tool
General ModelSim Operations
Projects
Managing Simulation Messages
Source Level Debugging
Viewing and Working with Waveforms
Graphical Dataflow
Summary
195 © 2010 Mentor Graphics Corp. Company Confidential
www.mentor.com
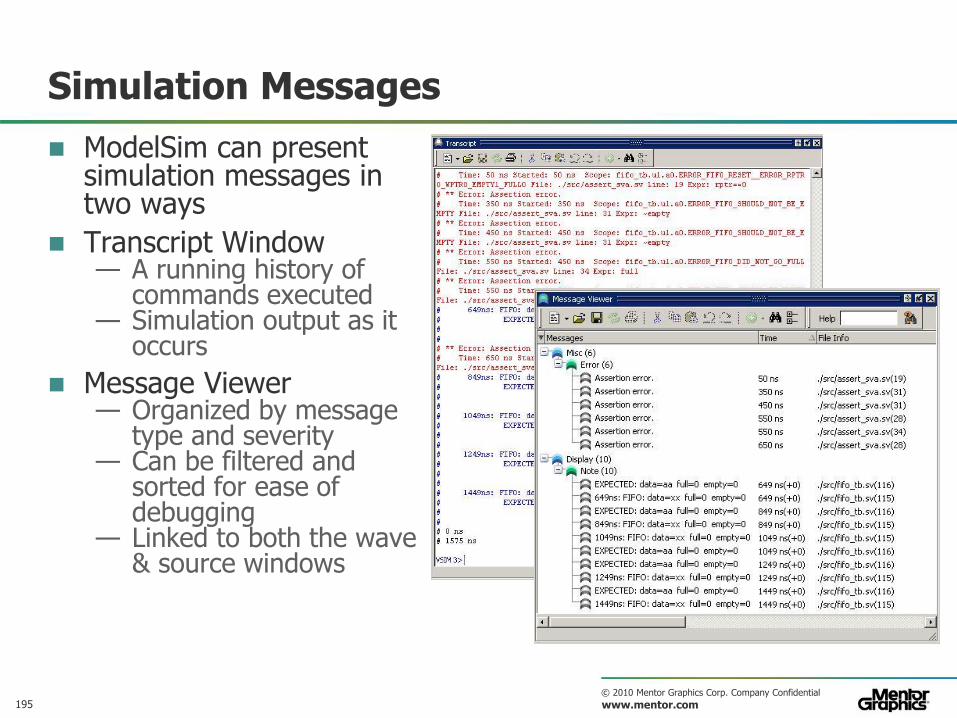
Simulation Messages
ModelSim can present simulation messages in two ways
Transcript Window — A running history of
commands executed — Simulation output as it
occurs
Message Viewer — Organized by message
type and severity — Can be filtered and
sorted for ease of debugging
— Linked to both the wave & source windows
196 © 2010 Mentor Graphics Corp. Company Confidential
www.mentor.com
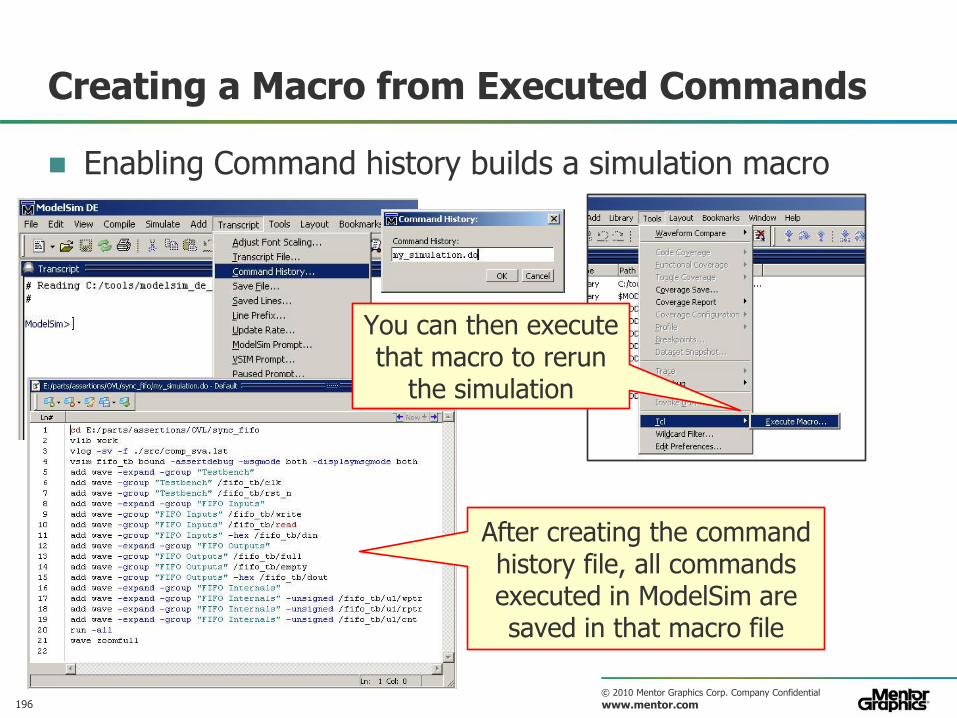
Creating a Macro from Executed Commands
Enabling Command history builds a simulation macro
After creating the command history file, all commands executed in ModelSim are saved in that macro file
You can then execute that macro to rerun
the simulation
197 © 2010 Mentor Graphics Corp. Company Confidential
www.mentor.com
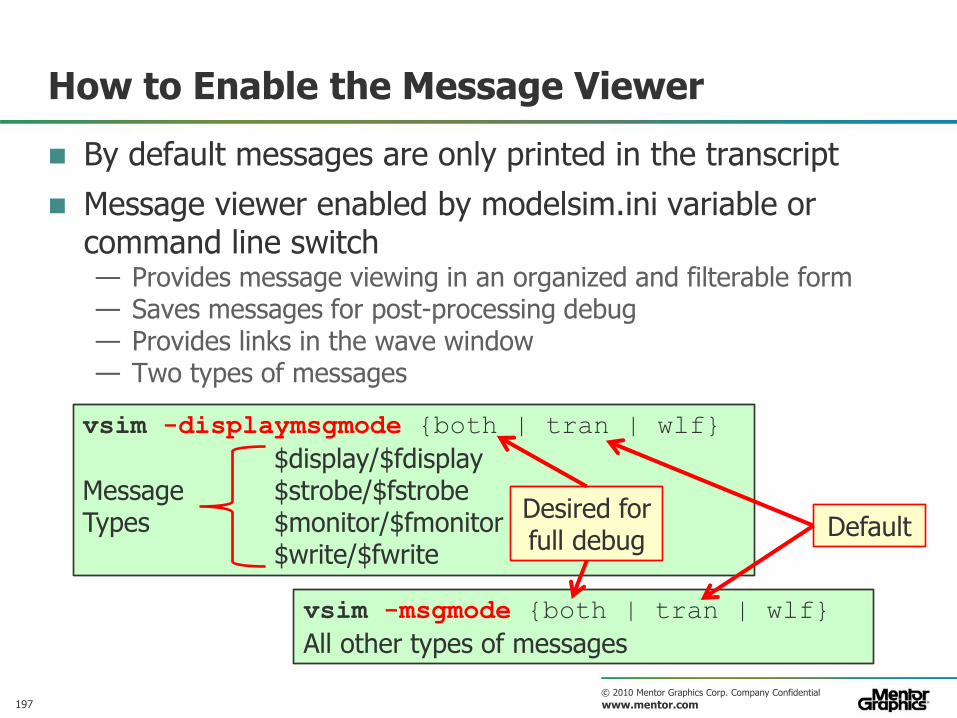
How to Enable the Message Viewer
By default messages are only printed in the transcript
Message viewer enabled by modelsim.ini variable or command line switch — Provides message viewing in an organized and filterable form — Saves messages for post-processing debug — Provides links in the wave window — Two types of messages
vsim -msgmode {both | tran | wlf}
All other types of messages
vsim -displaymsgmode {both | tran | wlf}
$display/$fdisplay Message $strobe/$fstrobe Types $monitor/$fmonitor $write/$fwrite
Default Desired for full debug
198 © 2010 Mentor Graphics Corp. Company Confidential
www.mentor.com
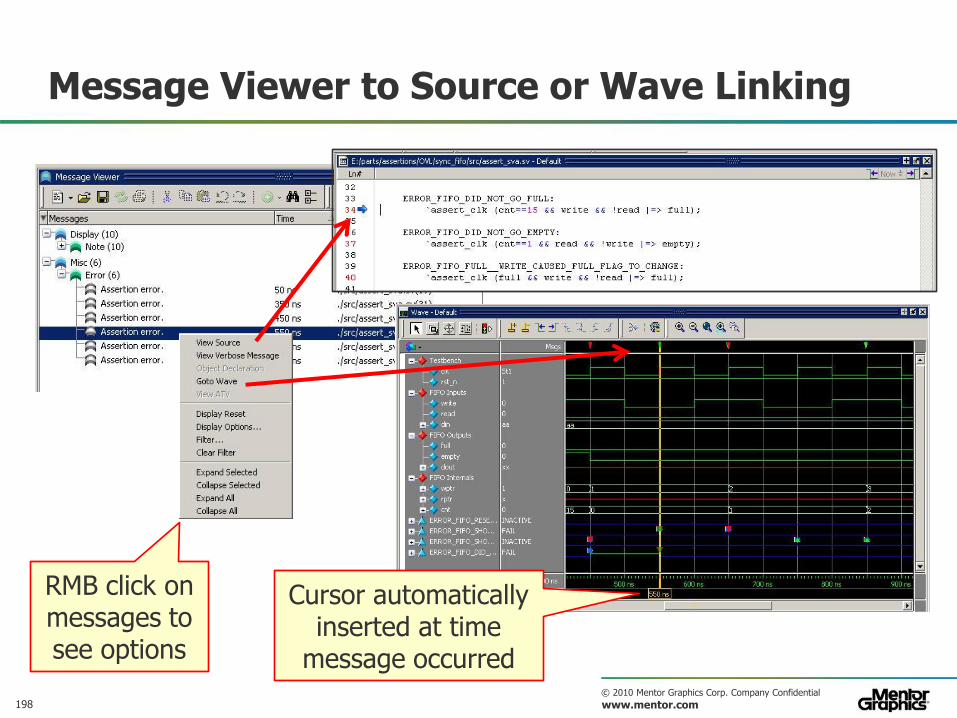
Message Viewer to Source or Wave Linking
RMB click on messages to see options
Cursor automatically inserted at time
message occurred
199 © 2010 Mentor Graphics Corp. Company Confidential
www.mentor.com
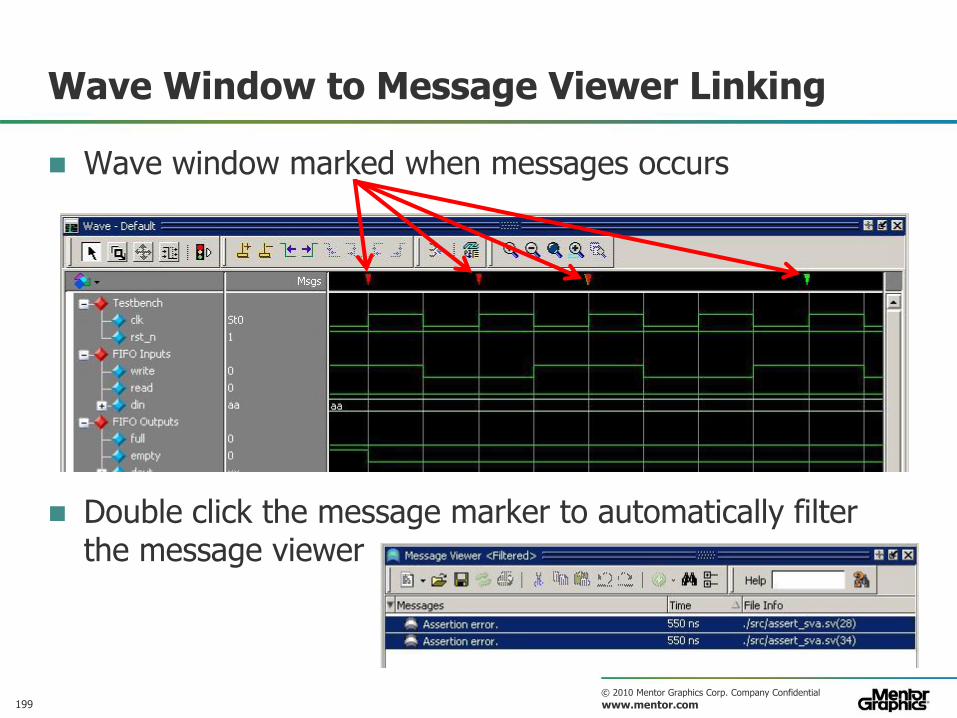
Wave Window to Message Viewer Linking
Wave window marked when messages occurs
Double click the message marker to automatically filter the message viewer
200 © 2010 Mentor Graphics Corp. Company Confidential
www.mentor.com
Agenda: ModelSim & Questa GUI Essentials
Introduction
Getting Help with the Tool
General ModelSim Operations
Projects
Managing Simulation Messages
Source Level Debugging
Viewing and Working with Waveforms
Graphical Dataflow
Summary
201 © 2010 Mentor Graphics Corp. Company Confidential
www.mentor.com
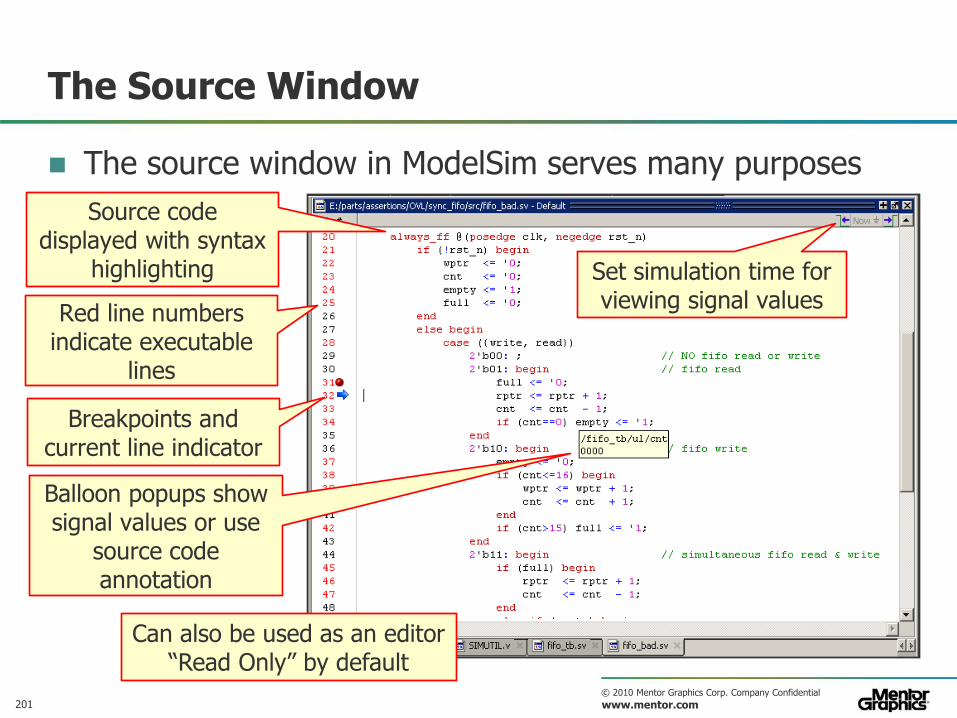
The Source Window
The source window in ModelSim serves many purposes
Source code displayed with syntax
highlighting
Red line numbers indicate executable
lines
Breakpoints and current line indicator
Balloon popups show signal values or use
source code annotation
Set simulation time for viewing signal values
Can also be used as an editor “Read Only” by default
202 © 2010 Mentor Graphics Corp. Company Confidential
www.mentor.com
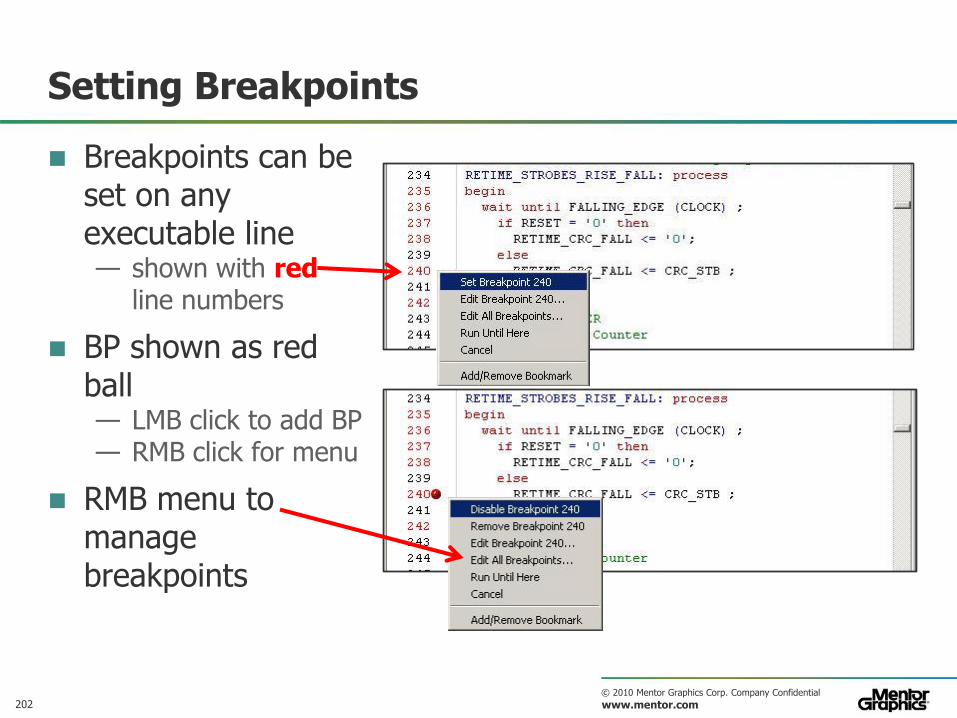
Setting Breakpoints
Breakpoints can be set on any executable line — shown with red
line numbers
BP shown as red ball — LMB click to add BP — RMB click for menu
RMB menu to manage breakpoints
203 © 2010 Mentor Graphics Corp. Company Confidential
www.mentor.com
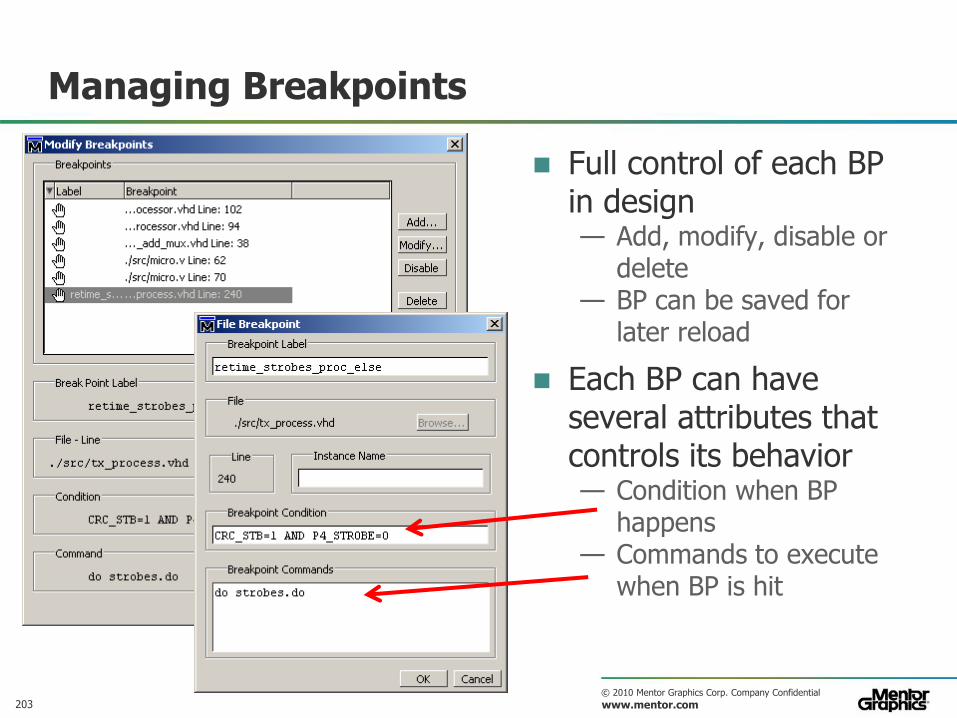
Managing Breakpoints
Full control of each BP in design — Add, modify, disable or
delete — BP can be saved for
later reload
Each BP can have several attributes that controls its behavior — Condition when BP
happens — Commands to execute
when BP is hit
204 © 2010 Mentor Graphics Corp. Company Confidential
www.mentor.com
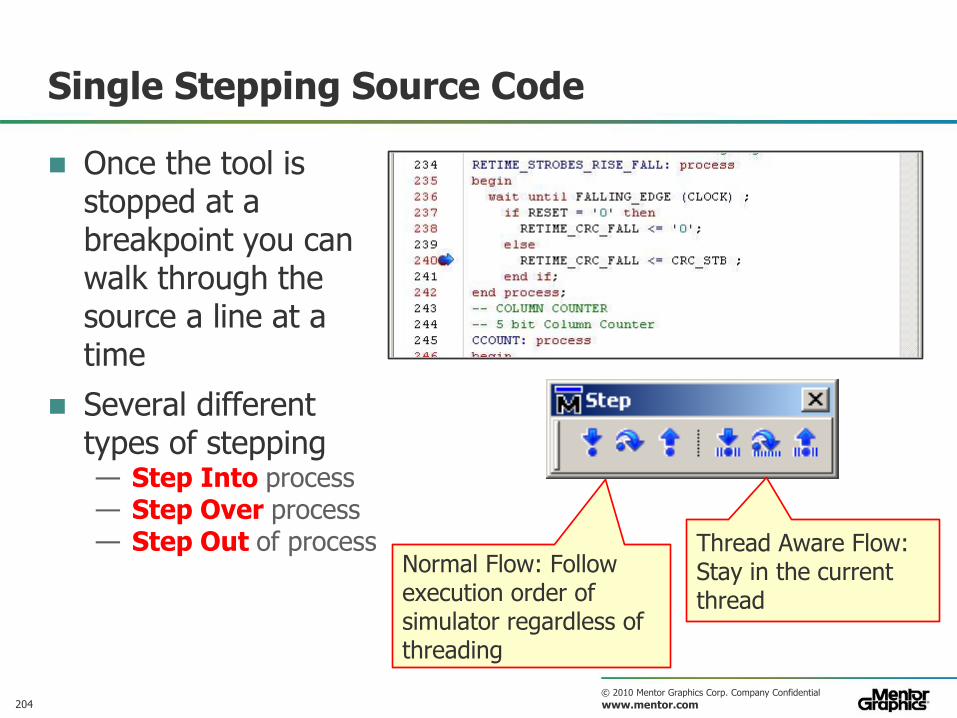
Single Stepping Source Code
Once the tool is stopped at a breakpoint you can walk through the source a line at a time
Several different types of stepping — Step Into process — Step Over process — Step Out of process
Normal Flow: Follow execution order of simulator regardless of threading
Thread Aware Flow: Stay in the current thread
205 © 2010 Mentor Graphics Corp. Company Confidential
www.mentor.com
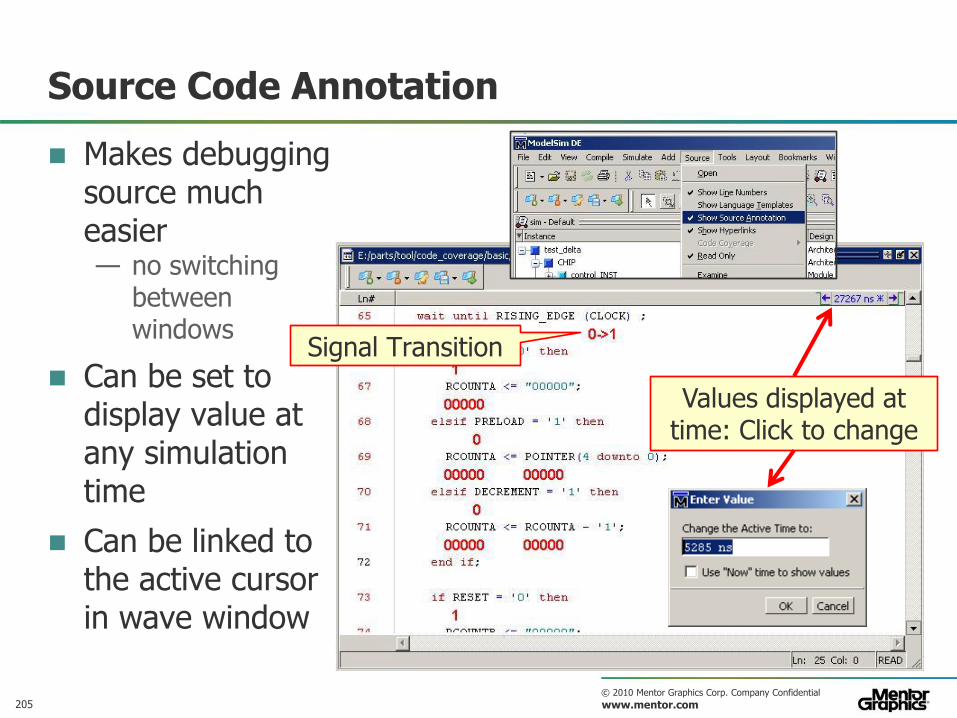
Source Code Annotation
Makes debugging source much easier — no switching
between windows
Can be set to display value at any simulation time
Can be linked to the active cursor in wave window
Signal Transition
Values displayed at time: Click to change
206 © 2010 Mentor Graphics Corp. Company Confidential
www.mentor.com
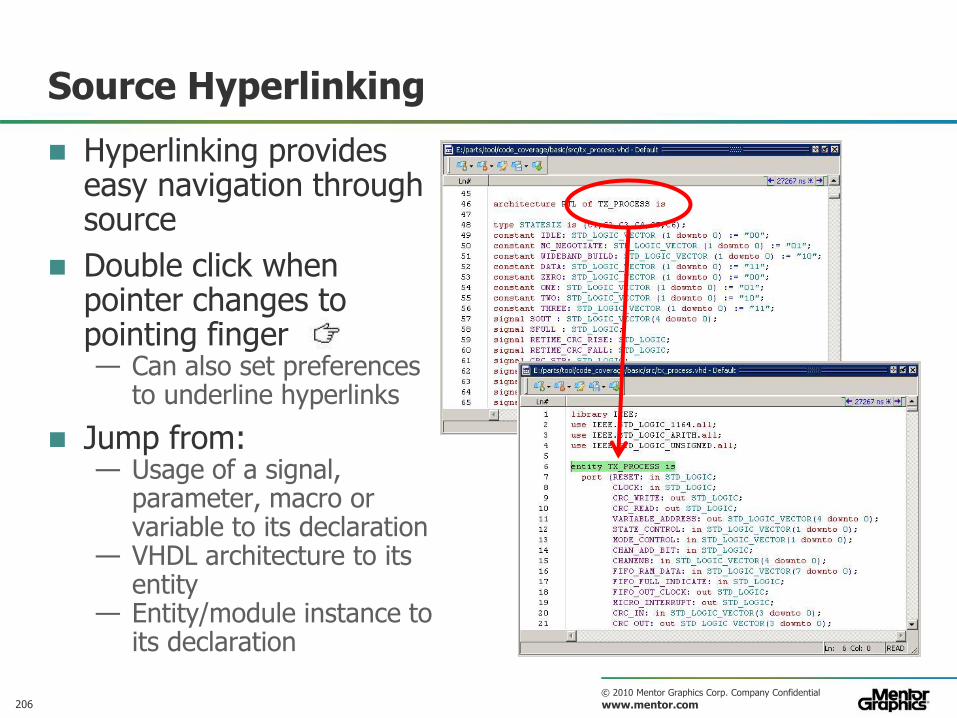
Source Hyperlinking
Hyperlinking provides easy navigation through source
Double click when pointer changes to pointing finger — Can also set preferences
to underline hyperlinks
Jump from: — Usage of a signal,
parameter, macro or variable to its declaration
— VHDL architecture to its entity
— Entity/module instance to its declaration
207 © 2010 Mentor Graphics Corp. Company Confidential
www.mentor.com
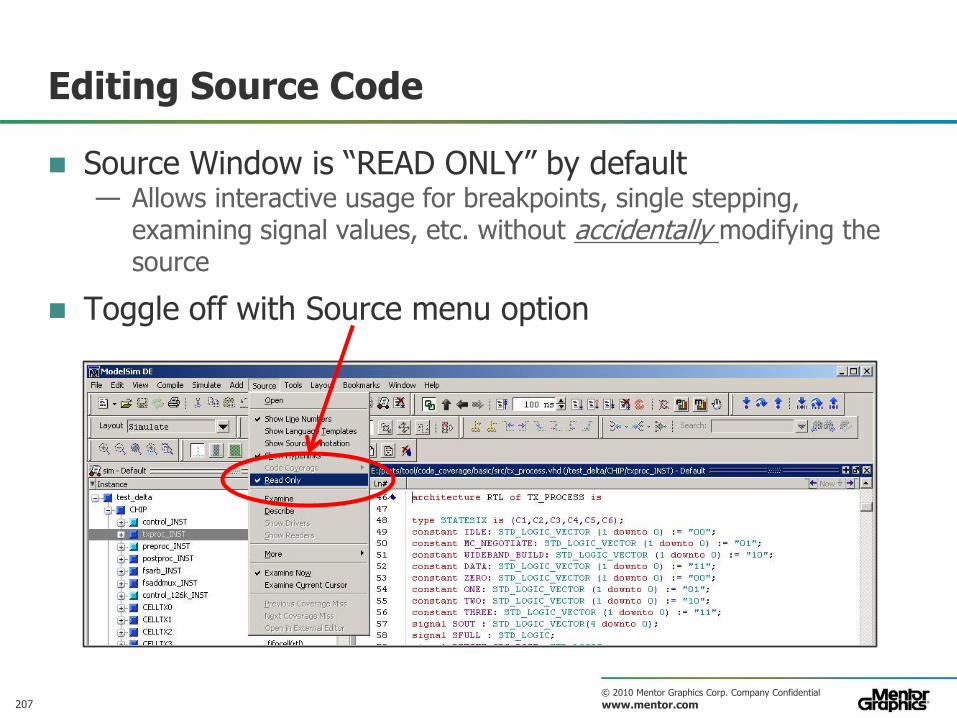
Editing Source Code
Source Window is “READ ONLY” by default — Allows interactive usage for breakpoints, single stepping,
examining signal values, etc. without accidentally modifying the source
Toggle off with Source menu option
208 © 2010 Mentor Graphics Corp. Company Confidential
www.mentor.com
Agenda: ModelSim & Questa GUI Essentials
Introduction
Getting Help with the Tool
General ModelSim Operations
Projects
Managing Simulation Messages
Source Level Debugging
Viewing and Working with Waveforms
Graphical Dataflow
Summary
209 © 2010 Mentor Graphics Corp. Company Confidential
www.mentor.com
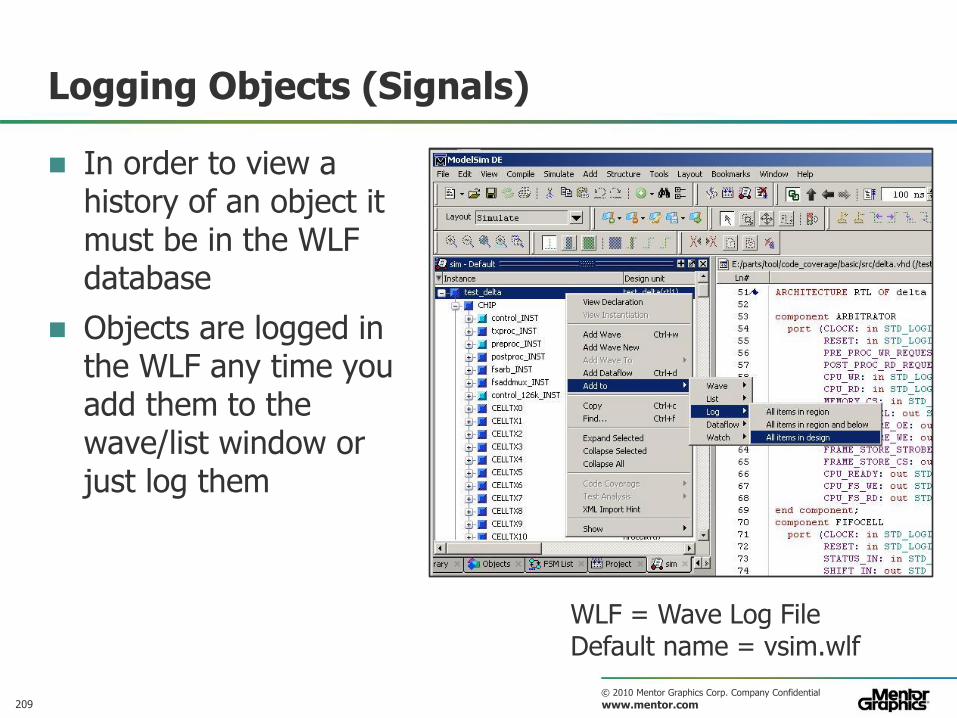
Logging Objects (Signals)
In order to view a history of an object it must be in the WLF database
Objects are logged in the WLF any time you add them to the wave/list window or just log them
WLF = Wave Log File Default name = vsim.wlf
210 © 2010 Mentor Graphics Corp. Company Confidential
www.mentor.com
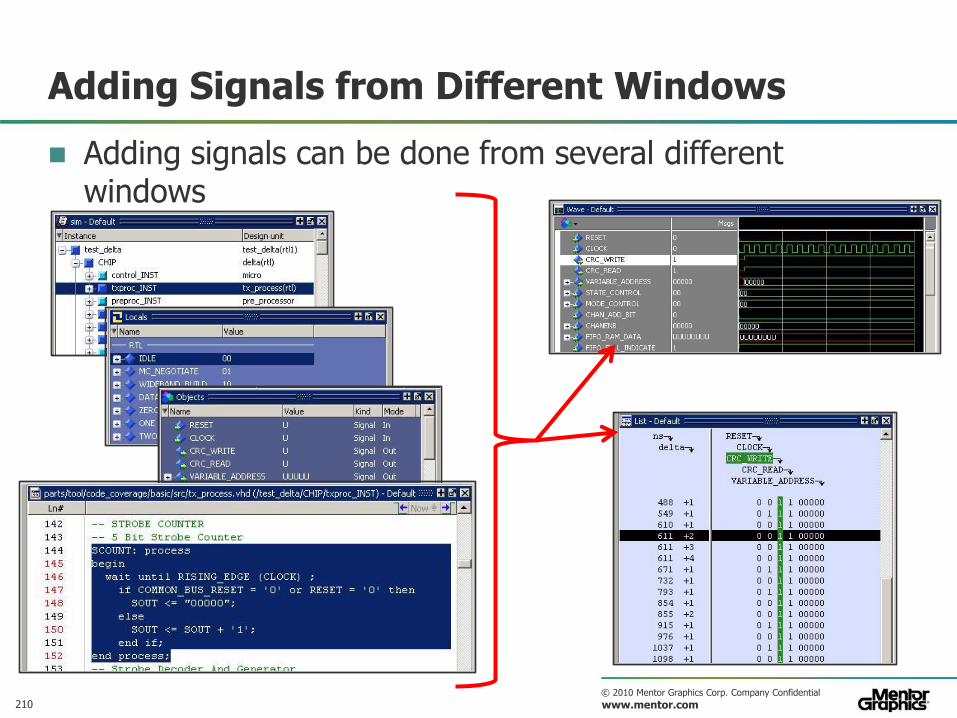
Adding Signals from Different Windows
Adding signals can be done from several different windows
211 © 2010 Mentor Graphics Corp. Company Confidential
www.mentor.com
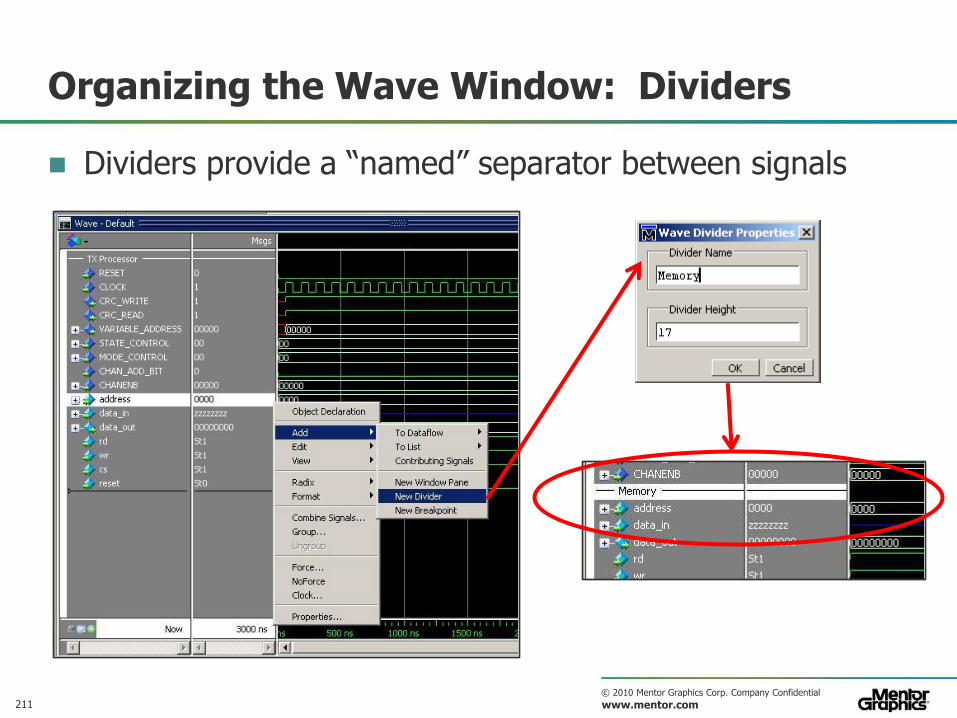
Organizing the Wave Window: Dividers
Dividers provide a “named” separator between signals
212 © 2010 Mentor Graphics Corp. Company Confidential
www.mentor.com
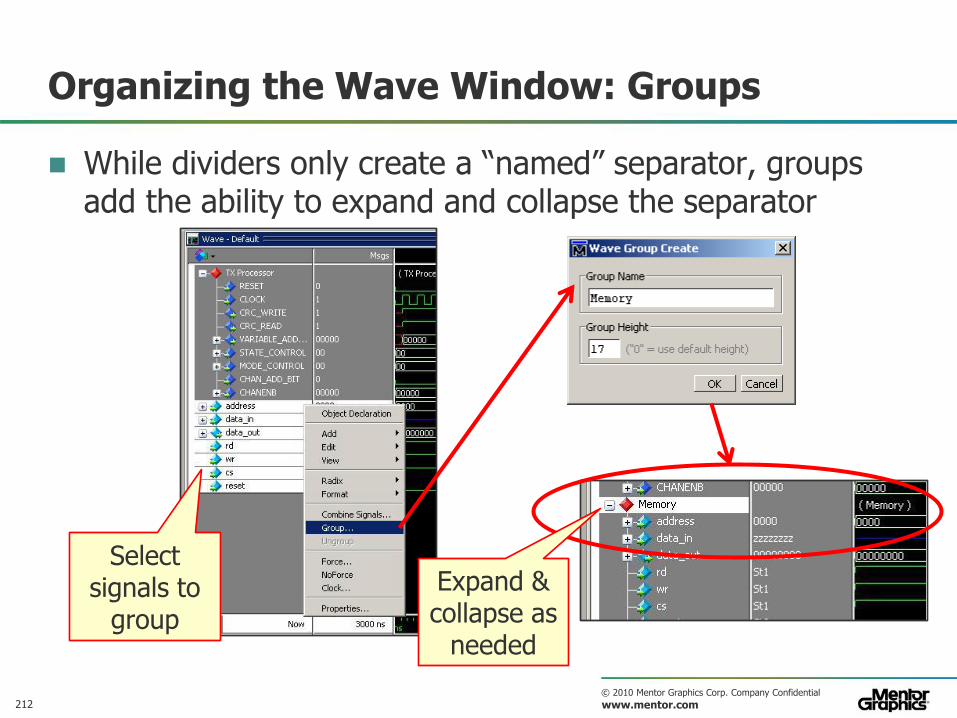
Organizing the Wave Window: Groups
While dividers only create a “named” separator, groups add the ability to expand and collapse the separator
Select signals to
group
Expand & collapse as
needed
213 © 2010 Mentor Graphics Corp. Company Confidential
www.mentor.com
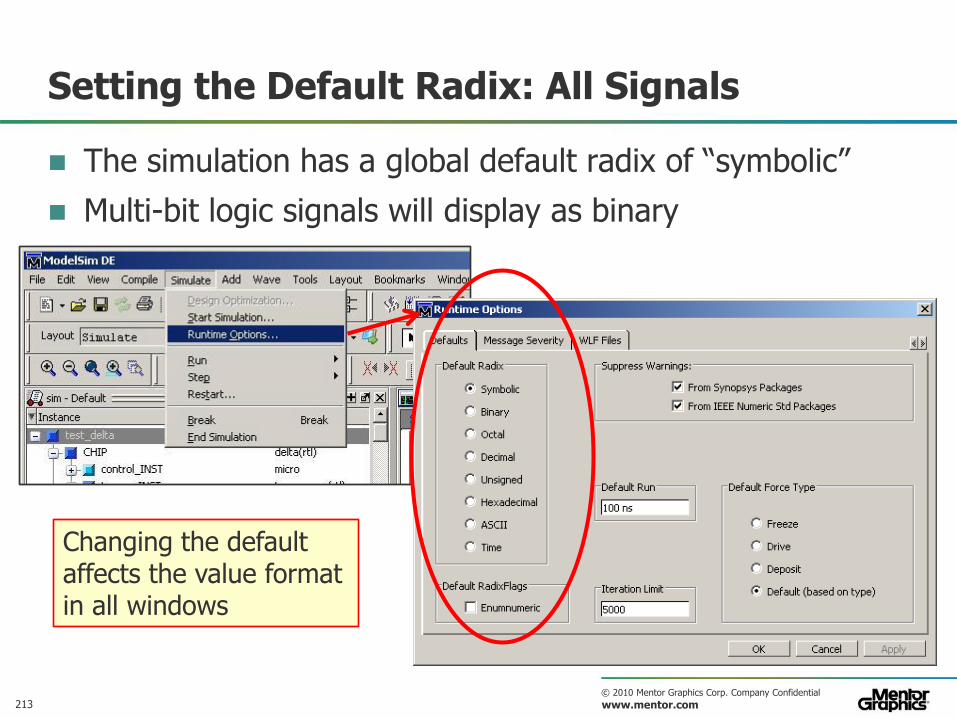
Setting the Default Radix: All Signals
The simulation has a global default radix of “symbolic”
Multi-bit logic signals will display as binary
Changing the default affects the value format in all windows
214 © 2010 Mentor Graphics Corp. Company Confidential
www.mentor.com
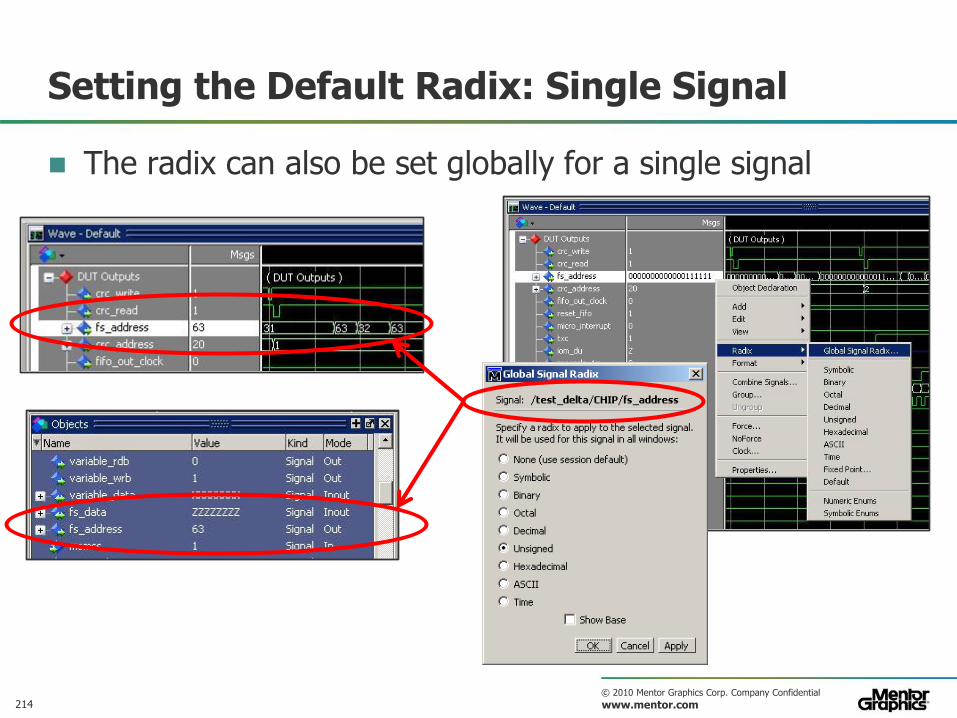
Setting the Default Radix: Single Signal
The radix can also be set globally for a single signal
215 © 2010 Mentor Graphics Corp. Company Confidential
www.mentor.com
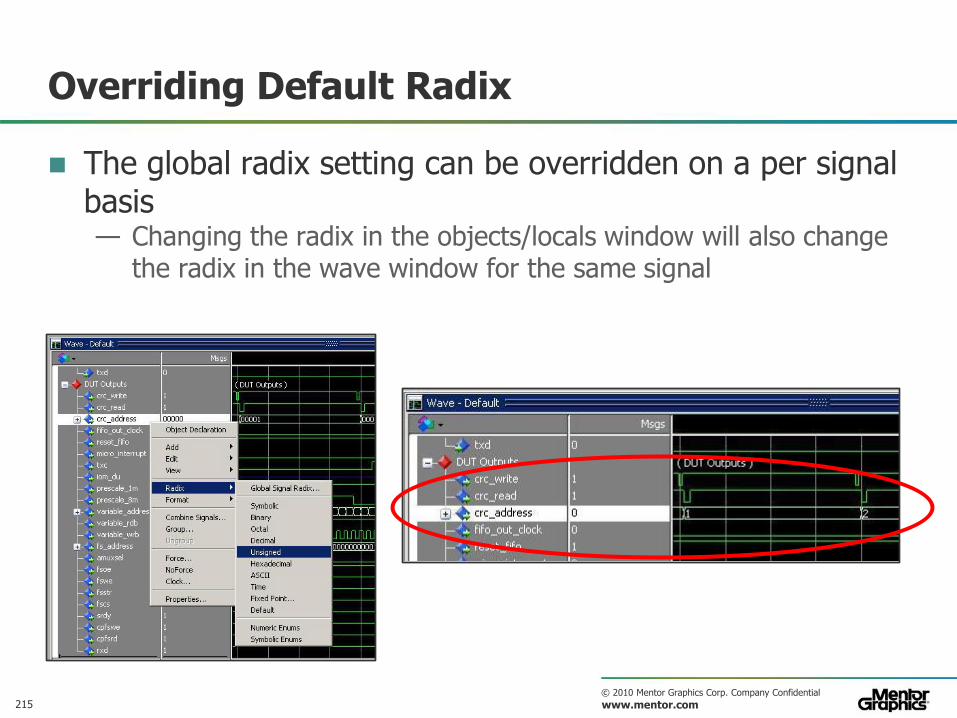
Overriding Default Radix
The global radix setting can be overridden on a per signal basis — Changing the radix in the objects/locals window will also change
the radix in the wave window for the same signal
216 © 2010 Mentor Graphics Corp. Company Confidential
www.mentor.com
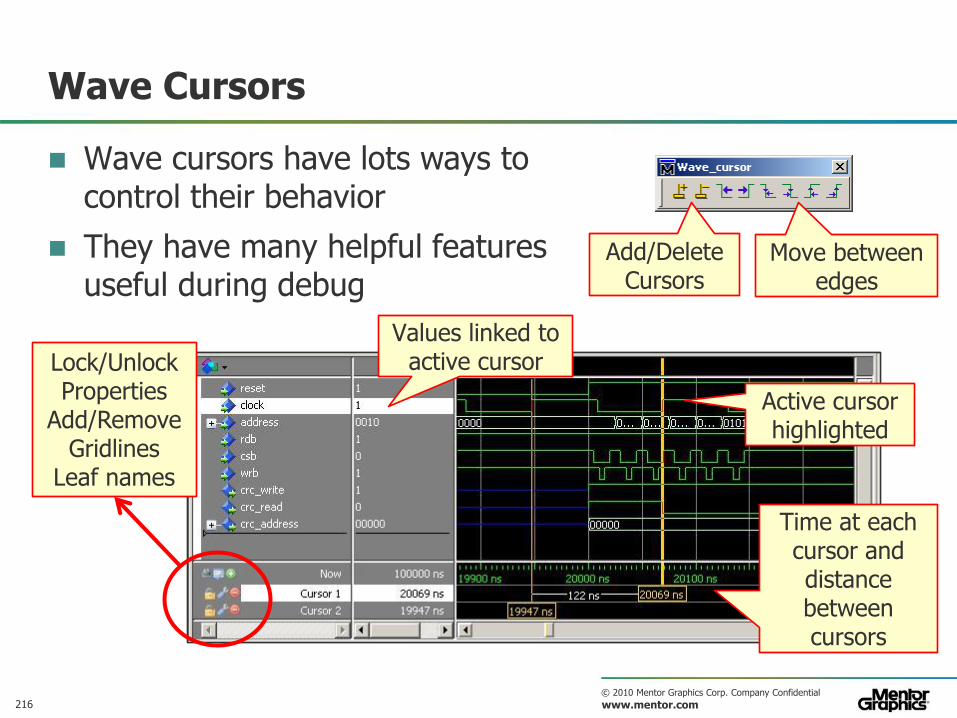
Wave Cursors
Wave cursors have lots ways to control their behavior
They have many helpful features useful during debug
Add/Delete Cursors
Move between edges
Active cursor highlighted
Values linked to active cursor
Time at each cursor and distance between cursors
Lock/Unlock Properties
Add/Remove Gridlines
Leaf names
217 © 2010 Mentor Graphics Corp. Company Confidential
www.mentor.com
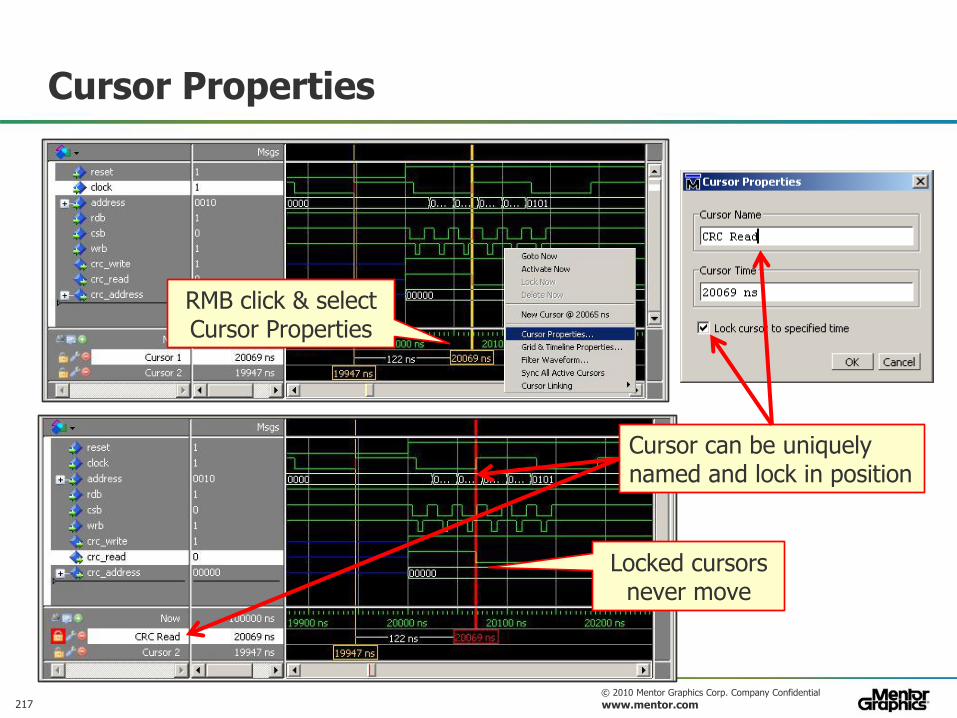
Cursor Properties
RMB click & select Cursor Properties
Cursor can be uniquely named and lock in position
Locked cursors never move
218 © 2010 Mentor Graphics Corp. Company Confidential
www.mentor.com
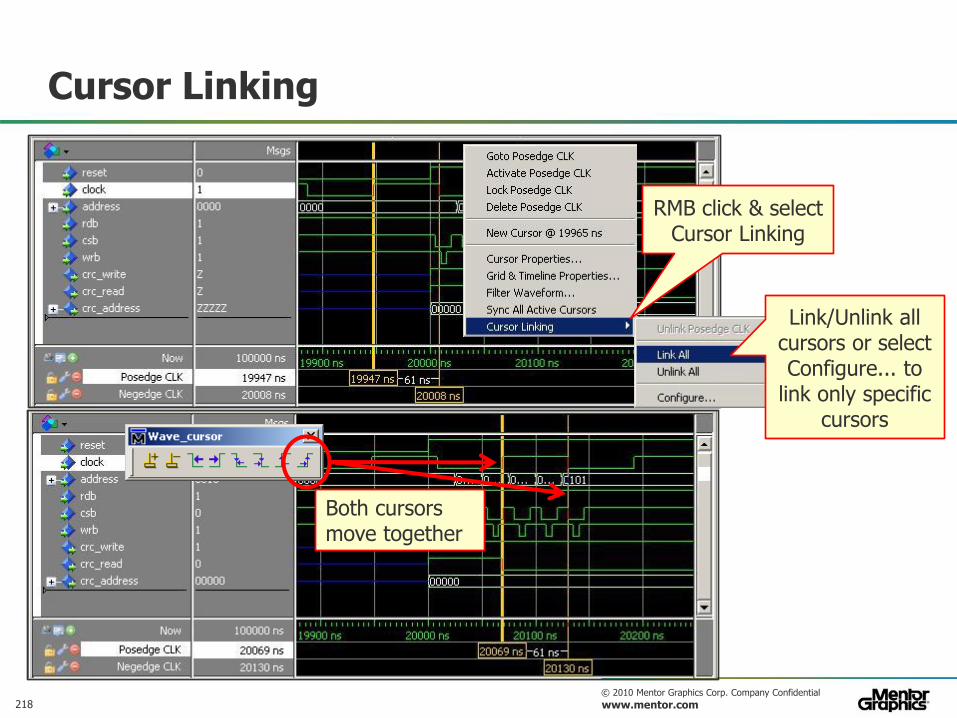
Cursor Linking
RMB click & select Cursor Linking
Link/Unlink all cursors or select Configure... to
link only specific cursors
Both cursors move together
219 © 2010 Mentor Graphics Corp. Company Confidential
www.mentor.com
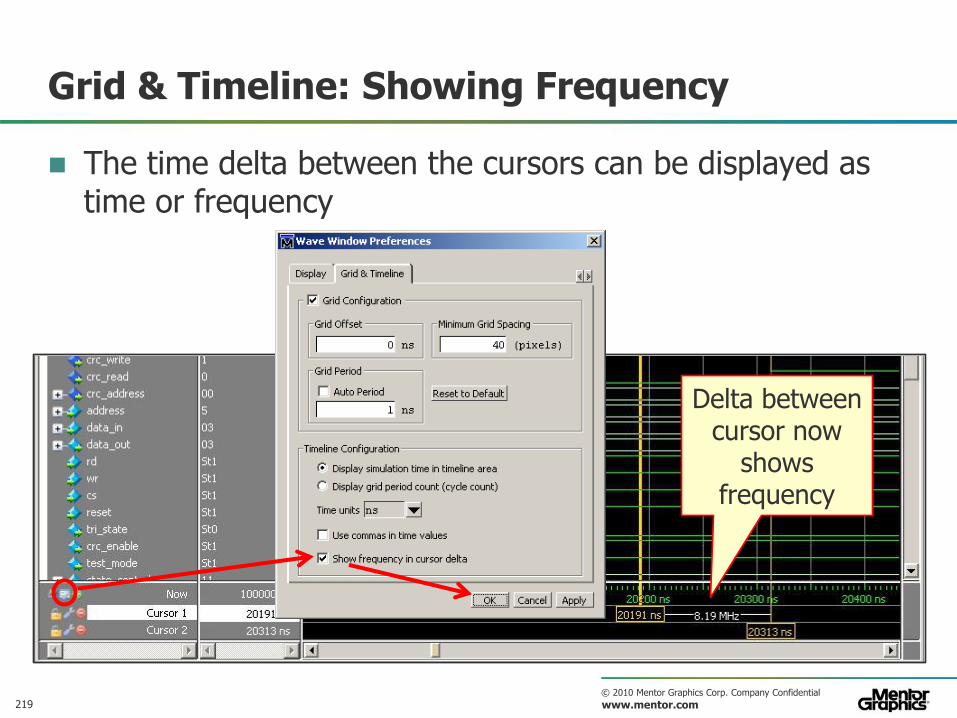
Grid & Timeline: Showing Frequency
The time delta between the cursors can be displayed as time or frequency
Delta between cursor now
shows frequency
220 © 2010 Mentor Graphics Corp. Company Confidential
www.mentor.com
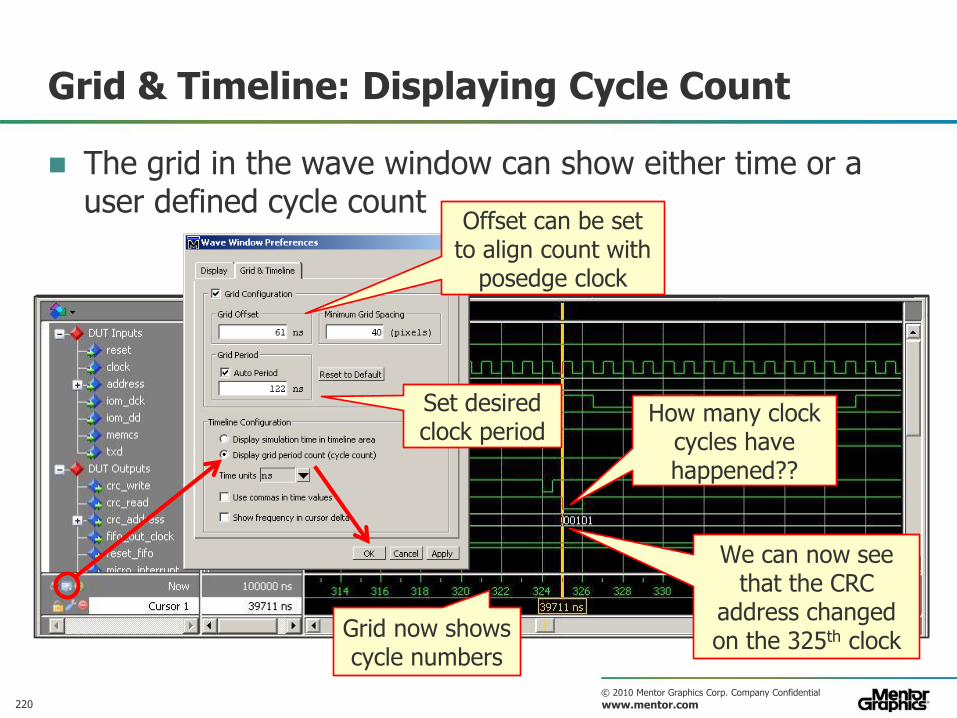
Grid & Timeline: Displaying Cycle Count
The grid in the wave window can show either time or a user defined cycle count
Set desired clock period
Offset can be set to align count with
posedge clock
Grid now shows cycle numbers
We can now see that the CRC
address changed on the 325th clock
How many clock cycles have happened??
221 © 2010 Mentor Graphics Corp. Company Confidential
www.mentor.com
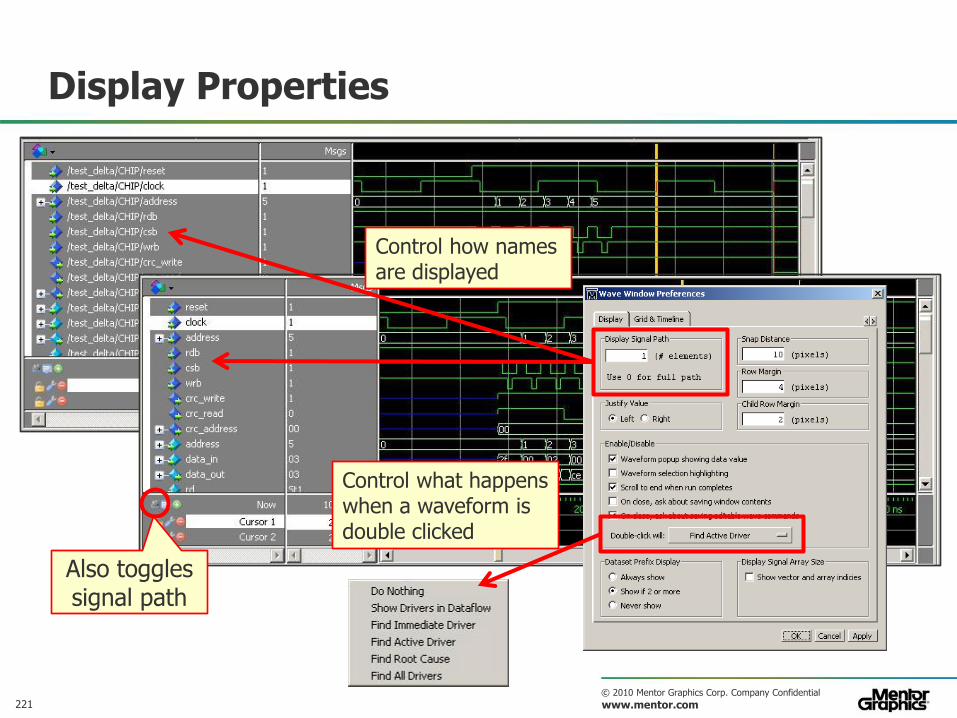
Display Properties
Also toggles signal path
Control how names are displayed
Control what happens when a waveform is double clicked
222 © 2010 Mentor Graphics Corp. Company Confidential
www.mentor.com
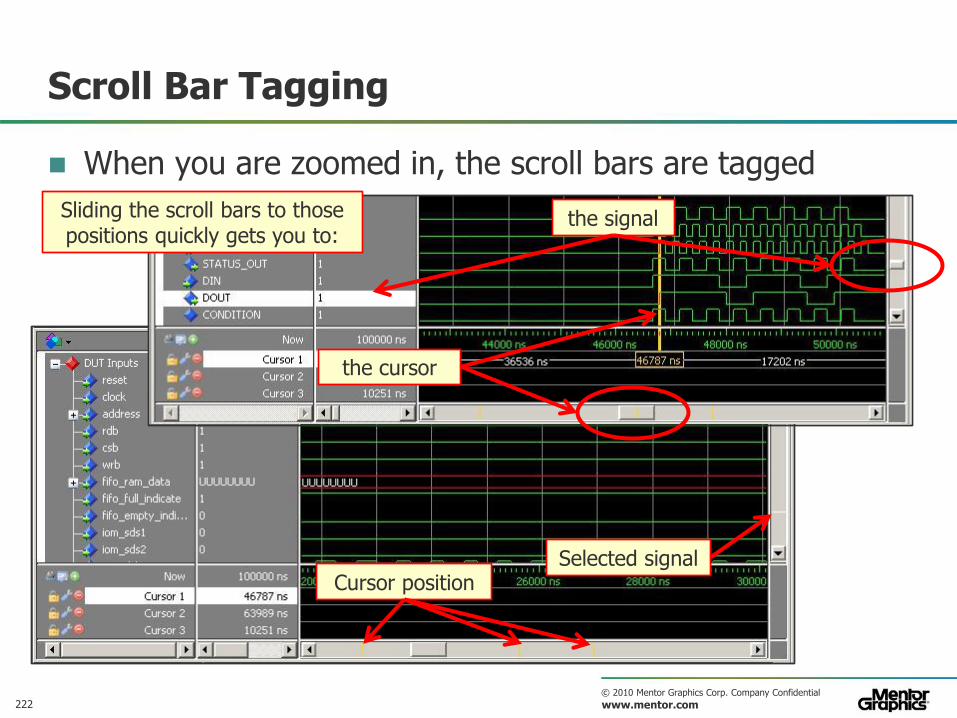
Scroll Bar Tagging
When you are zoomed in, the scroll bars are tagged
Cursor position Selected signal
the signal Sliding the scroll bars to those positions quickly gets you to:
the cursor
223 © 2010 Mentor Graphics Corp. Company Confidential
www.mentor.com
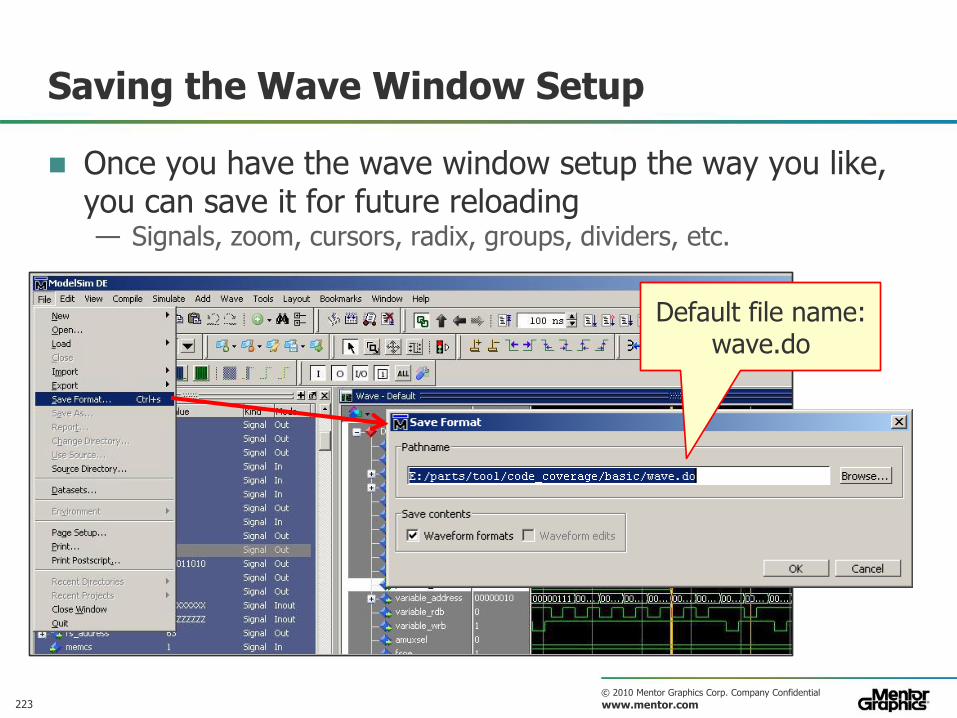
Saving the Wave Window Setup
Once you have the wave window setup the way you like, you can save it for future reloading — Signals, zoom, cursors, radix, groups, dividers, etc.
Default file name: wave.do
224 © 2010 Mentor Graphics Corp. Company Confidential
www.mentor.com
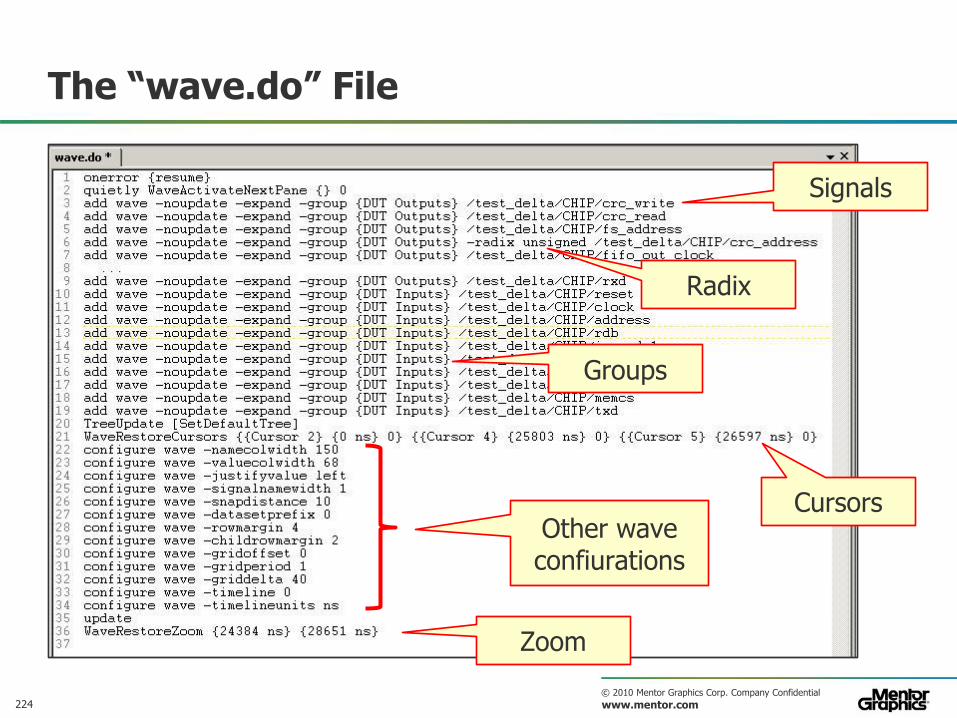
The “wave.do” File
Signals
Radix
Groups
Cursors
Zoom
Other wave confiurations
225 © 2010 Mentor Graphics Corp. Company Confidential
www.mentor.com
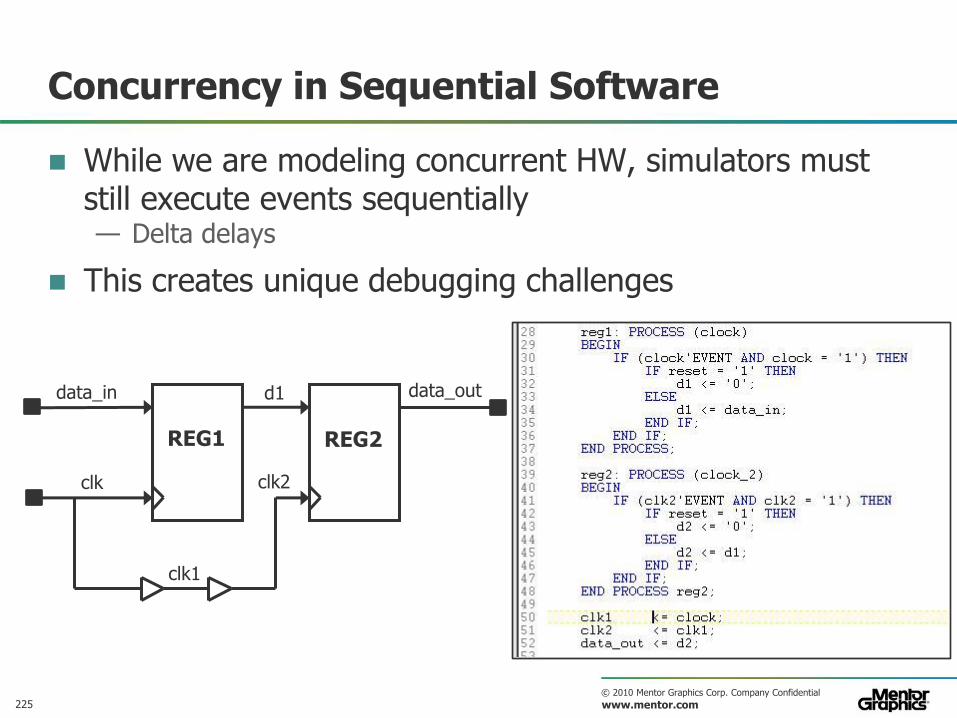
Concurrency in Sequential Software
While we are modeling concurrent HW, simulators must still execute events sequentially — Delta delays
This creates unique debugging challenges
d1 data_out data_in
clk2 clk
clk1
REG1 REG2
226 © 2010 Mentor Graphics Corp. Company Confidential
www.mentor.com
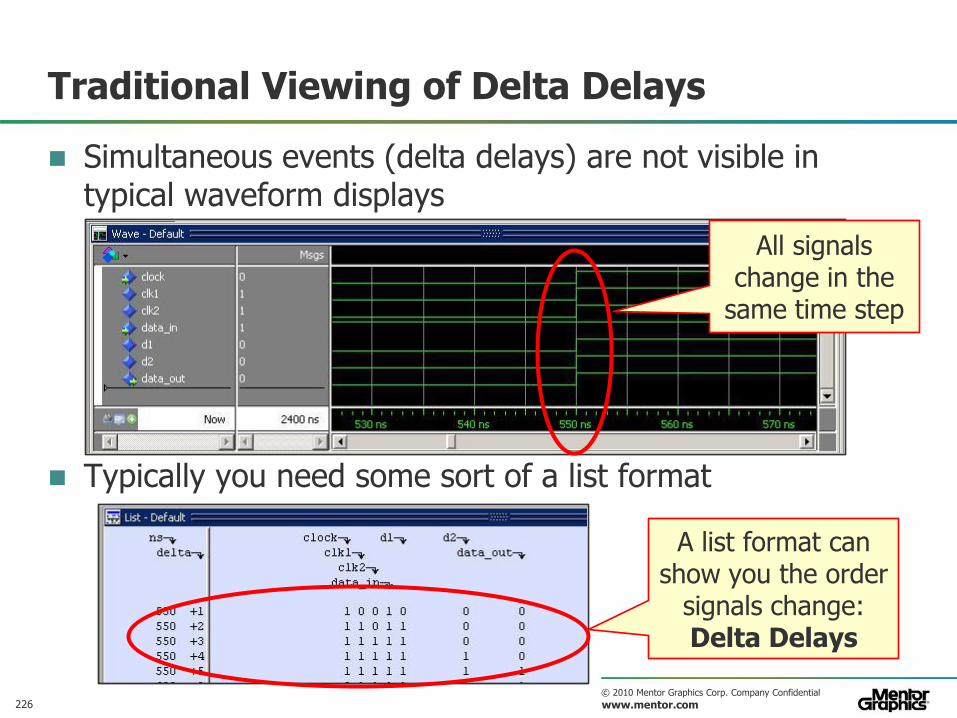
Traditional Viewing of Delta Delays
Simultaneous events (delta delays) are not visible in typical waveform displays
Typically you need some sort of a list format
All signals change in the
same time step
A list format can show you the order
signals change: Delta Delays
227 © 2010 Mentor Graphics Corp. Company Confidential
www.mentor.com
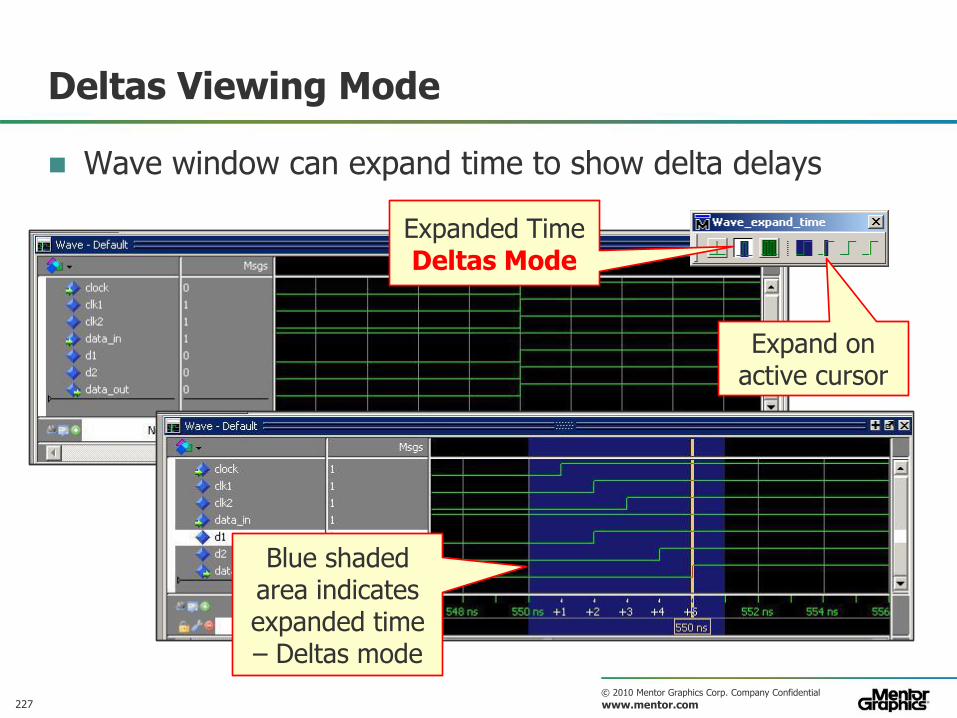
Deltas Viewing Mode
Wave window can expand time to show delta delays
Expanded Time Deltas Mode
Expand on active cursor
Blue shaded area indicates expanded time – Deltas mode
228 © 2010 Mentor Graphics Corp. Company Confidential
www.mentor.com
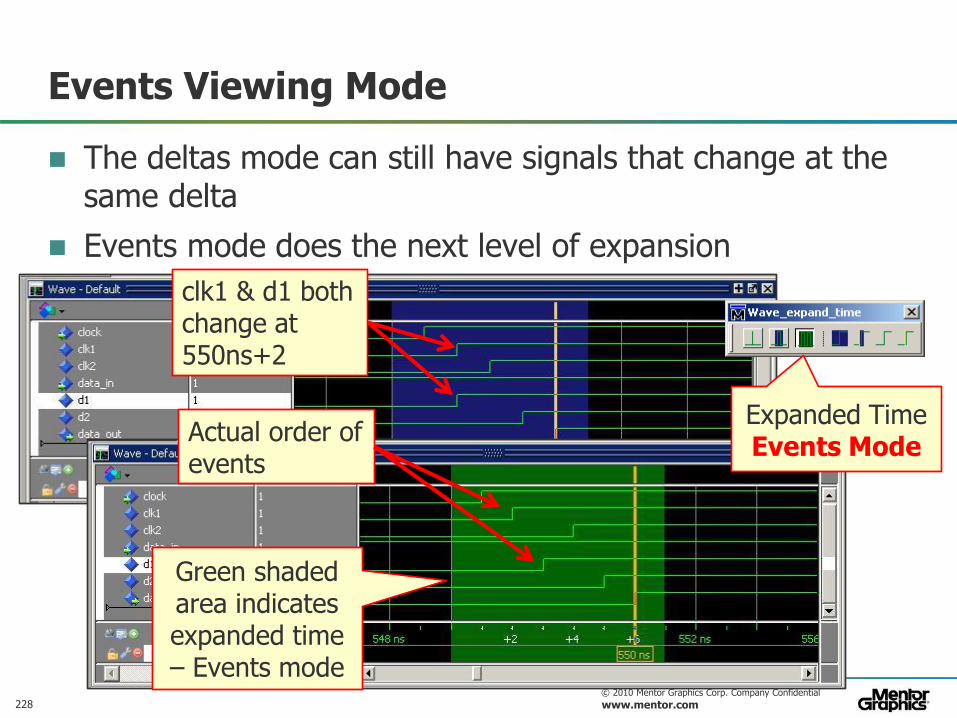
Events Viewing Mode
The deltas mode can still have signals that change at the same delta
Events mode does the next level of expansion
Expanded Time Events Mode
Green shaded area indicates expanded time – Events mode
clk1 & d1 both change at 550ns+2
Actual order of events
229 © 2010 Mentor Graphics Corp. Company Confidential
www.mentor.com
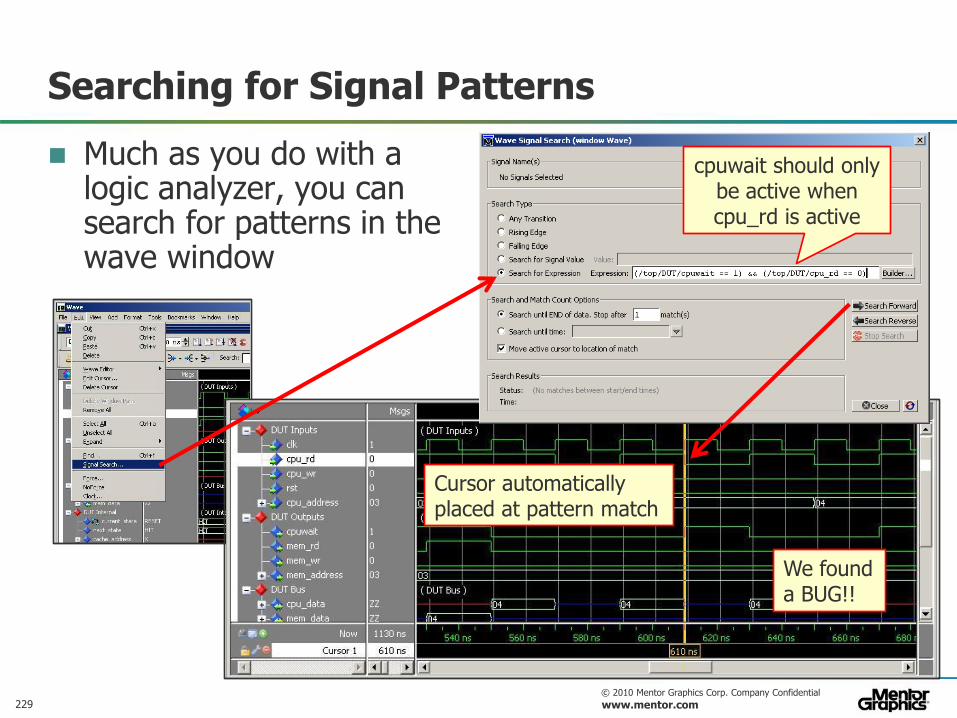
Searching for Signal Patterns
Much as you do with a logic analyzer, you can search for patterns in the wave window
cpuwait should only be active when cpu_rd is active
Cursor automatically placed at pattern match
We found a BUG!!
230 © 2010 Mentor Graphics Corp. Company Confidential
www.mentor.com
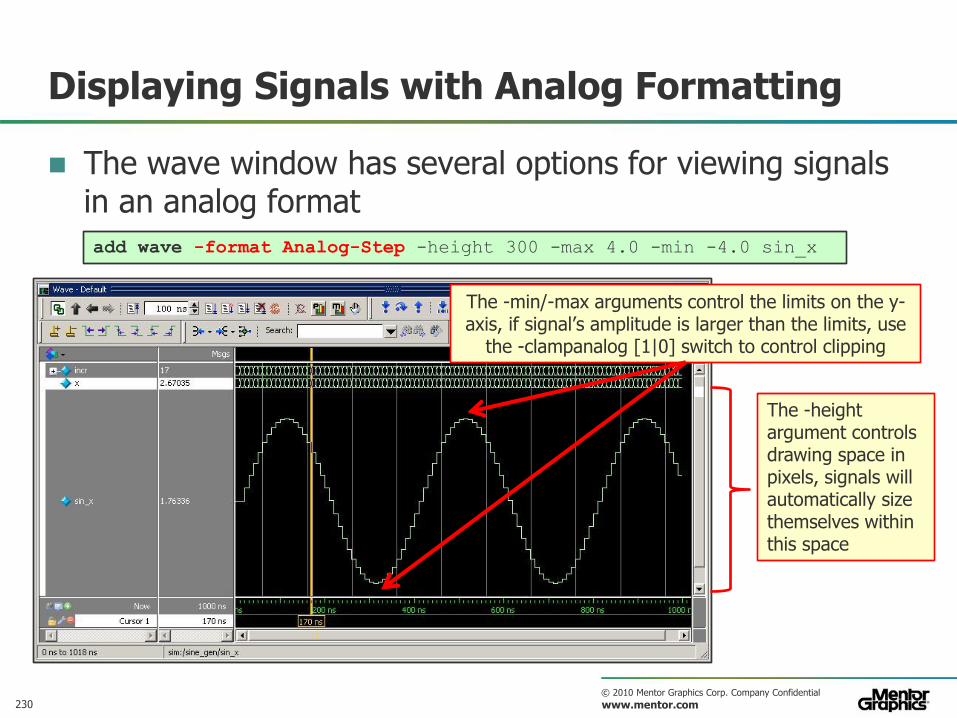
Displaying Signals with Analog Formatting
The wave window has several options for viewing signals in an analog format
add wave -format Analog-Step -height 300 -max 4.0 -min -4.0 sin_x
The -height argument controls drawing space in pixels, signals will automatically size themselves within this space
The -min/-max arguments control the limits on the y-axis, if signal’s amplitude is larger than the limits, use
the -clampanalog [1|0] switch to control clipping
231 © 2010 Mentor Graphics Corp. Company Confidential
www.mentor.com
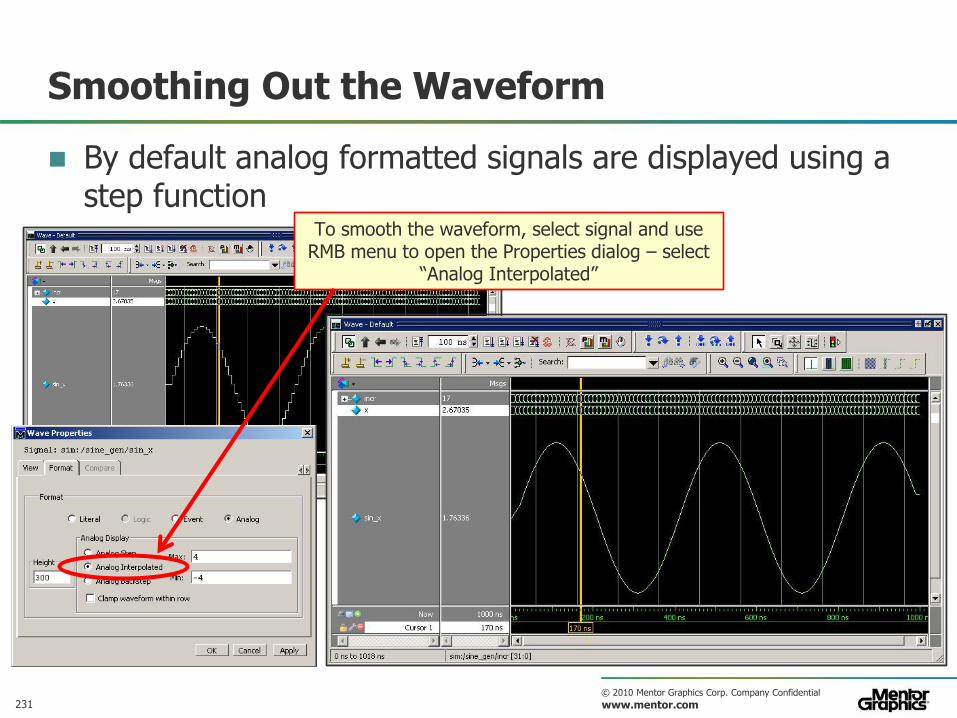
Smoothing Out the Waveform
By default analog formatted signals are displayed using a step function
To smooth the waveform, select signal and use RMB menu to open the Properties dialog – select
“Analog Interpolated”
232 © 2010 Mentor Graphics Corp. Company Confidential
www.mentor.com
Agenda: ModelSim & Questa GUI Essentials
Introduction
Getting Help with the Tool
General ModelSim Operations
Projects
Managing Simulation Messages
Source Level Debugging
Viewing and Working with Waveforms
Graphical Dataflow
Summary
233 © 2010 Mentor Graphics Corp. Company Confidential
www.mentor.com
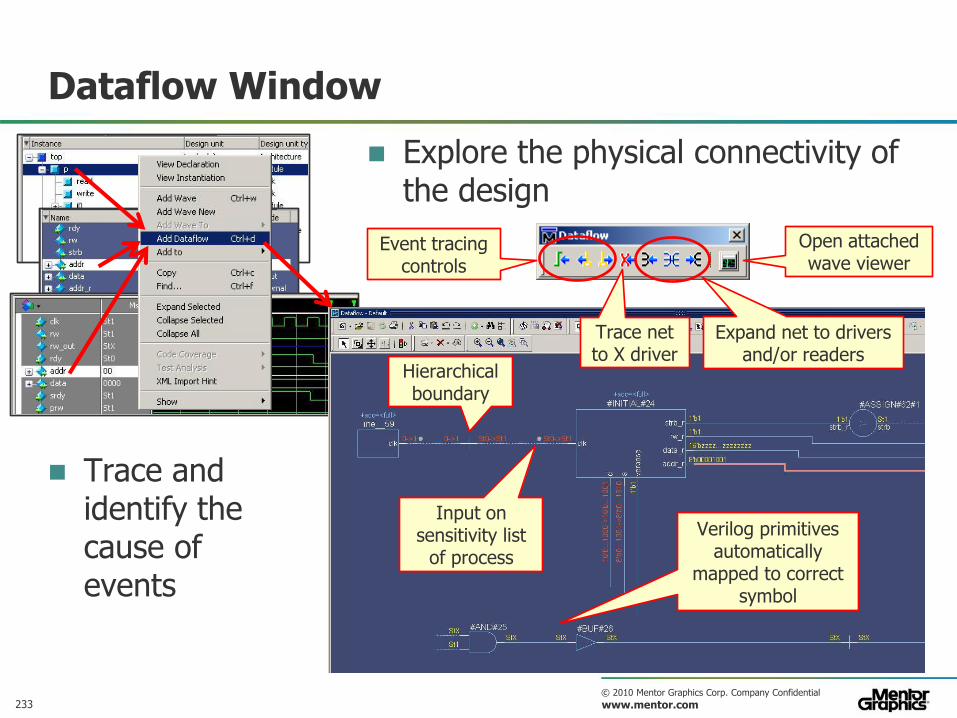
Dataflow Window
Explore the physical connectivity of the design
Event tracing controls
Trace net to X driver
Expand net to drivers and/or readers
Open attached wave viewer
Input on sensitivity list
of process
Verilog primitives automatically
mapped to correct symbol
Trace and identify the cause of events
Hierarchical boundary
234 © 2010 Mentor Graphics Corp. Company Confidential
www.mentor.com
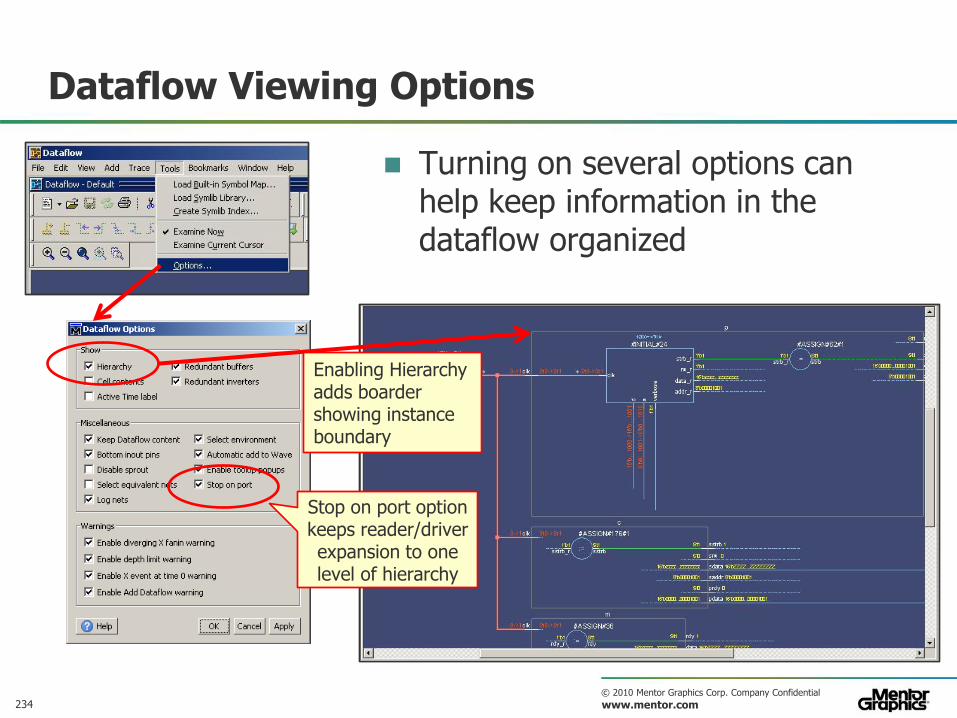
Dataflow Viewing Options
Turning on several options can help keep information in the dataflow organized
Enabling Hierarchy adds boarder showing instance boundary
Stop on port option keeps reader/driver expansion to one level of hierarchy
235 © 2010 Mentor Graphics Corp. Company Confidential
www.mentor.com
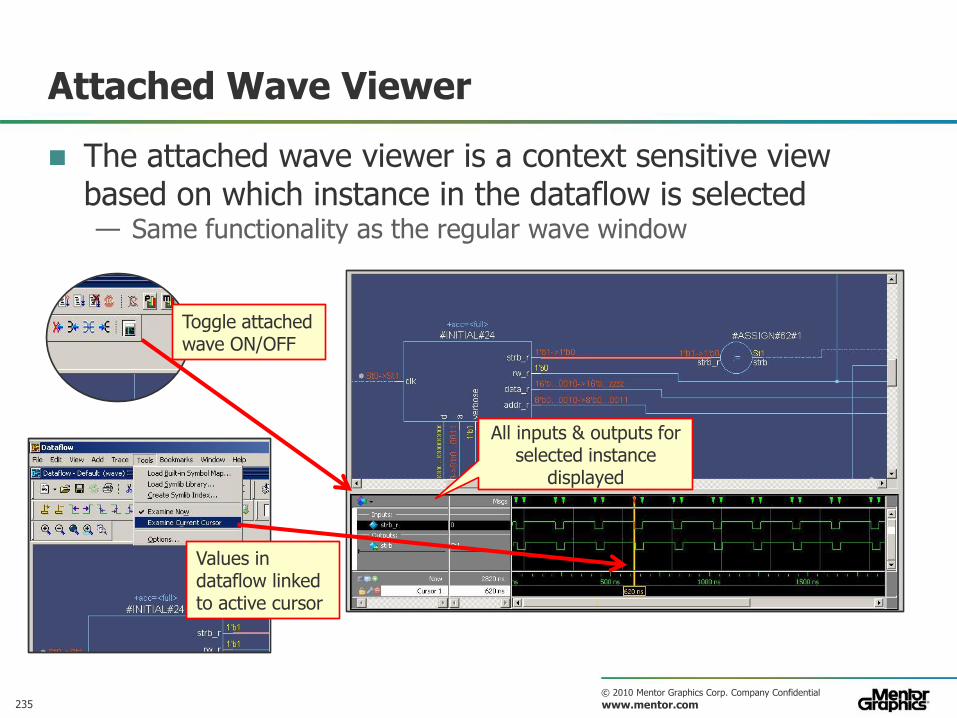
Attached Wave Viewer
The attached wave viewer is a context sensitive view based on which instance in the dataflow is selected — Same functionality as the regular wave window
Toggle attached wave ON/OFF
All inputs & outputs for selected instance
displayed
Values in dataflow linked to active cursor
236 © 2010 Mentor Graphics Corp. Company Confidential
www.mentor.com
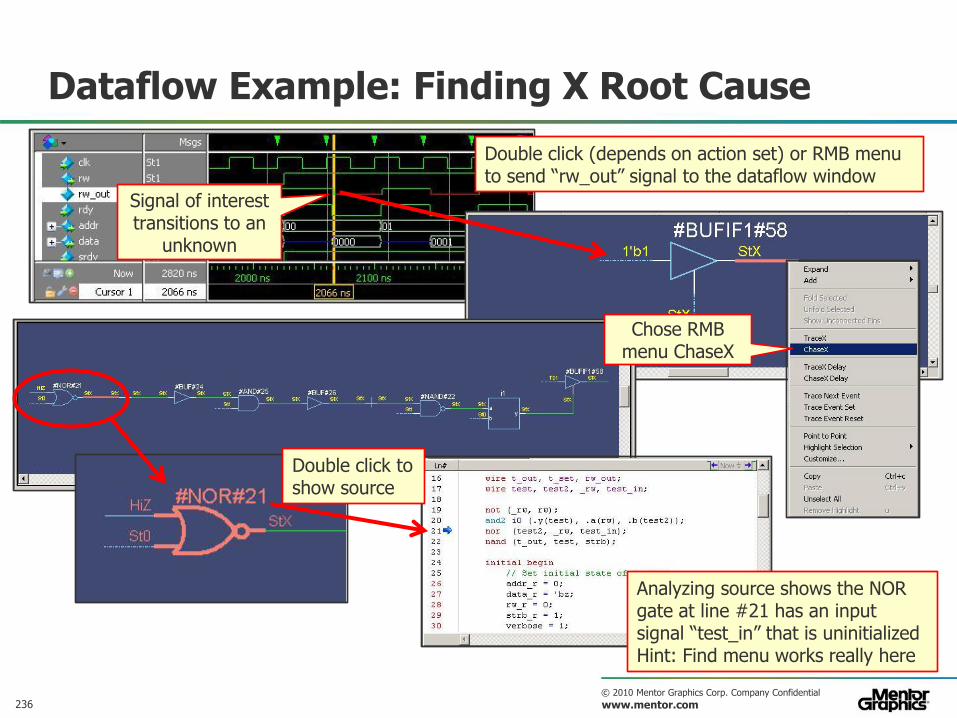
Dataflow Example: Finding X Root Cause
Signal of interest transitions to an
unknown
Double click (depends on action set) or RMB menu to send “rw_out” signal to the dataflow window
Chose RMB menu ChaseX
Analyzing source shows the NOR gate at line #21 has an input signal “test_in” that is uninitialized Hint: Find menu works really here
Double click to show source
237 © 2010 Mentor Graphics Corp. Company Confidential
www.mentor.com
Agenda: ModelSim & Questa GUI Essentials
Introduction
Getting Help with the Tool
General ModelSim Operations
Projects
Managing Simulation Messages
Source Level Debugging
Viewing and Working with Waveforms
Graphical Dataflow
Summary
238 © 2010 Mentor Graphics Corp. Company Confidential
www.mentor.com
Summary
Many great debug tools in ModelSim
Most people don’t know what’s there
What we have seen in this brief glance at our workshop will help you to be more effective in our GUI

239 © 2010 Mentor Graphics Corp. Company Confidential
www.mentor.com
Questions?