advanced feature extraction algorithms for
TRANSCRIPT
ADVANCED FEATURE EXTRACTIONALGORITHMS FOR AUTOMATICFINGERPRINT RECOGNITION
SYSTEMS
By
Chaohong Wu
April 2007
a dissertation submitted to the
faculty of the graduate school of state
university of new york at buffalo
in partial fulfillment of the requirements
for the degree of
doctor of philosophy

c© Copyright 2007
by
Chaohong Wu
ii
Abstract
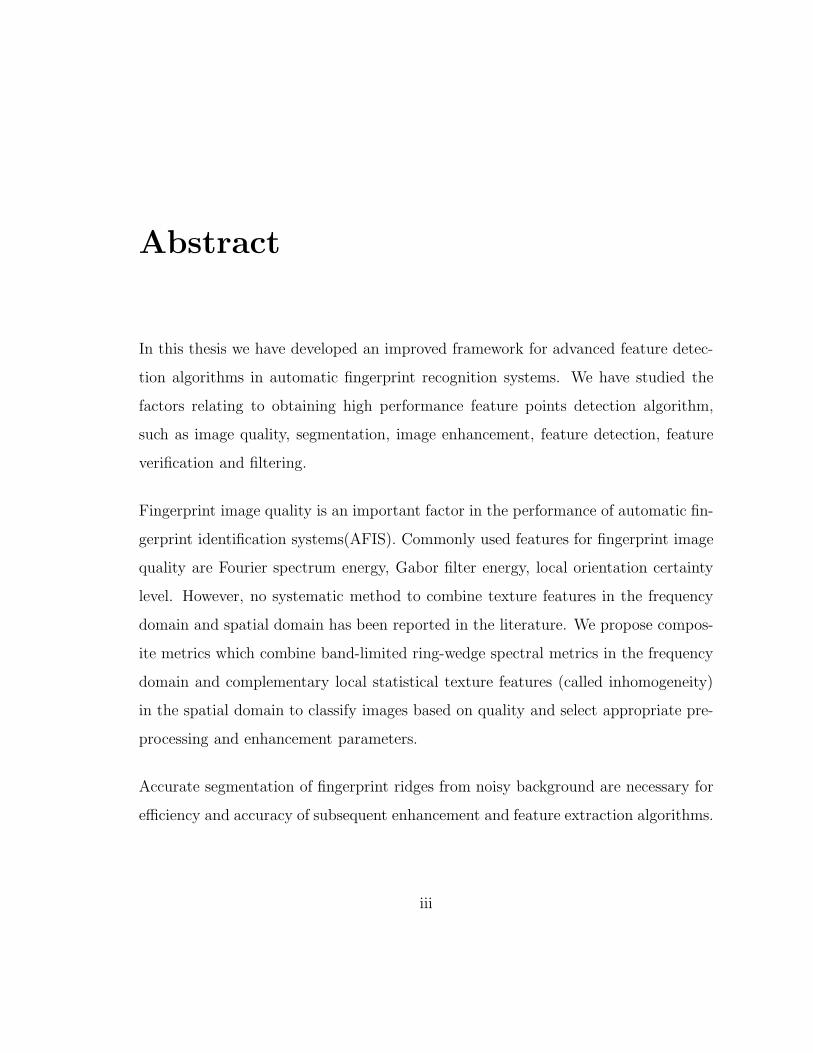
In this thesis we have developed an improved framework for advanced feature detec-
tion algorithms in automatic fingerprint recognition systems. We have studied the
factors relating to obtaining high performance feature points detection algorithm,
such as image quality, segmentation, image enhancement, feature detection, feature
verification and filtering.
Fingerprint image quality is an important factor in the performance of automatic fin-
gerprint identification systems(AFIS). Commonly used features for fingerprint image
quality are Fourier spectrum energy, Gabor filter energy, local orientation certainty
level. However, no systematic method to combine texture features in the frequency
domain and spatial domain has been reported in the literature. We propose compos-
ite metrics which combine band-limited ring-wedge spectral metrics in the frequency
domain and complementary local statistical texture features (called inhomogeneity)
in the spatial domain to classify images based on quality and select appropriate pre-
processing and enhancement parameters.
Accurate segmentation of fingerprint ridges from noisy background are necessary for
efficiency and accuracy of subsequent enhancement and feature extraction algorithms.
iii
There are two types of fingerprint segmentation algorithms: unsupervised and super-
vised. Unsupervised algorithms extract blockwise features such as local histogram of
ridge direction, gray-level variance, magnitude of the gradient in each image block,
and Gabor features. Supervised methods usually first extract features such as coher-
ence, average gray level, variance and Gabor response. In practice, the presence of
noise, low contrast area, and inconsistent contact of a fingerprint tip with the sen-
sor may result in loss of minutiae or produce of false minutiae. Supervised methods
are time consuming, and possibly has an overfitting problem. Technically, it is diffi-
cult to find the optimal threshold value for boundary blocks (for block level feature
based unsupervised methods), because it is uncertain what percentage of pixels in
the boundary block belong to either foreground versus background. We observe that
the strength of Harris points in the foreground is generally higher than in the back-
ground. Therefore the boundary ridge endings usually render stronger Harris corner
points. Some Harris points in noisy blobs might have higher strength, but they can
be filtered as outliers using the corresponding Gabor response. Our experiments show
that the efficiency and accuracy of the new method are significantly higher than those
of previously described methods.
Most fingerprint enhancement algorithms rely heavily on local orientation of ridge
flows. However, significant orientation changes also occur around the delta and core
points in fingerprint images, posing a challenge to the enhancement of ridge flows in
high-curvature regions. Instead of first identifying the singular points, we compute
the orientation coherence map and determine the minimum coherence regions as high-
curvature areas. We adaptively choose the Gaussian filter window sizes to smooth
the local orientation map. Because the smoothing operation is applied to local ridge
shape structures, it efficiently joins broken ridges without destroying the essential
singularities and enforces continuity of directional fields even in creases. Coherence
iv
has not previously been used to estimate ridge curvature, and curvature has not
been used to select filter scale in this field. Experimental results demonstrate the
effectiveness of our innovative method.
Traditional minutiae detection methods are usually composed of five steps: image seg-
mentation, image enhancement, binarization, thinning and extraction. Aberrations
and irregularities adversely affect the fingerprint thinning procedure, so a relatively
large number of spurious minutiae are introduced by the thinning operations. Two
new thinning-free minutiae detection algorithms have been developed in this thesis
to improve detection efficiency and accuracy. Experimental results show that our
algorithms achieve higher accuracy than the method described by NIST.
We have proposed an improved framework for extracting high accuracy minutiae set,
by integrating a robust point-based unsupervised segmentation algorithm, topological
pattern adaptive fingerprint enhancement algorithm with singularity preservation, a
thinning-free minutiae detection algorithm and new feature filtering, and verification
algorithms.
v

Contents
Abstract iii
1 Introduction 1
1.1 Basic Definitions . . . . . . . . . . . . . . . . . . . . . . . . . . . . . 5
1.1.1 System Error Rates . . . . . . . . . . . . . . . . . . . . . . . . 5
1.1.2 Fingerprint Features . . . . . . . . . . . . . . . . . . . . . . . 11
1.1.3 Global Ridge Pattern . . . . . . . . . . . . . . . . . . . . . . . 11
1.1.4 Local Ridge Detail . . . . . . . . . . . . . . . . . . . . . . . . 12
1.1.5 Intra-ridge Detail . . . . . . . . . . . . . . . . . . . . . . . . . 16
1.1.6 Texture Features: Gabor Feature and FFT phase-only feature 17
1.2 Technical Problems . . . . . . . . . . . . . . . . . . . . . . . . . . . . 18
1.2.1 Segmentation . . . . . . . . . . . . . . . . . . . . . . . . . . . 18
vi

1.2.2 Image Quality Assessment . . . . . . . . . . . . . . . . . . . . 18
1.2.3 Enhancement . . . . . . . . . . . . . . . . . . . . . . . . . . . 18
1.2.4 Feature Detection Accuracy . . . . . . . . . . . . . . . . . . . 19
1.3 Outline . . . . . . . . . . . . . . . . . . . . . . . . . . . . . . . . . . . 19
1.4 Benchmarks . . . . . . . . . . . . . . . . . . . . . . . . . . . . . . . . 20
2 Matching and Performance Evaluation Framework 22
2.1 Correlation-based Matching Algorithm . . . . . . . . . . . . . . . . . 22
2.1.1 Minutiae Triplet . . . . . . . . . . . . . . . . . . . . . . . . . 23
2.1.2 Multi-path Matching Algorithm . . . . . . . . . . . . . . . . . 25
2.1.3 Localized Size-specific Matching Algorithm . . . . . . . . . . . 28
3 Objective Fingerprint Image Quality Modeling 37
3.1 Background . . . . . . . . . . . . . . . . . . . . . . . . . . . . . . . . 37
3.2 Proposed Quality Classification Features . . . . . . . . . . . . . . . . 39
3.2.1 Global Quality Measure: Limited Ring-Wedge Spectral Energy 39
3.2.2 Local Quality Measure: Inhomogeneity and directional contrast 43
3.3 Adaptive Preprocessing Method . . . . . . . . . . . . . . . . . . . . . 44
vii
3.4 Experiments . . . . . . . . . . . . . . . . . . . . . . . . . . . . . . . . 46
3.5 Summary . . . . . . . . . . . . . . . . . . . . . . . . . . . . . . . . . 48
4 Robust Fingerprint Segmentation 49
4.1 Features for Fingerprint Segmentation . . . . . . . . . . . . . . . . . 50
4.2 Unsupervised Methods . . . . . . . . . . . . . . . . . . . . . . . . . . 54
4.3 Supervised Methods . . . . . . . . . . . . . . . . . . . . . . . . . . . 55
4.4 Evaluation Metrics . . . . . . . . . . . . . . . . . . . . . . . . . . . . 55
4.5 Proposed Segmentation Methods . . . . . . . . . . . . . . . . . . . . 56
4.5.1 Strength of Harris-corner points of a Fingerprint Image . . . . 58
4.6 Summary . . . . . . . . . . . . . . . . . . . . . . . . . . . . . . . . . 62
5 Adaptive Fingerprint Image Enhancement 68
5.1 Introduction . . . . . . . . . . . . . . . . . . . . . . . . . . . . . . . . 68
5.2 Local ridge orientation field Estimation . . . . . . . . . . . . . . . . . 69
5.3 Review of fingerprint image enhancement methods . . . . . . . . . . . 71
5.3.1 Spatial Domain . . . . . . . . . . . . . . . . . . . . . . . . . . 72
5.3.2 Frequency Domain . . . . . . . . . . . . . . . . . . . . . . . . 72
viii
5.4 New Noise Model . . . . . . . . . . . . . . . . . . . . . . . . . . . . . 74
5.4.1 Anisotropic Filter . . . . . . . . . . . . . . . . . . . . . . . . . 75
5.4.2 Orientation estimation . . . . . . . . . . . . . . . . . . . . . . 81
5.5 Singularity preserving fingerprint adaptive filtering . . . . . . . . . . 86
5.5.1 Computation of Ridge Orientation and High-Curvature Map . 87
5.5.2 Experiments . . . . . . . . . . . . . . . . . . . . . . . . . . . . 88
6 Feature Detection 92
6.1 Introduction . . . . . . . . . . . . . . . . . . . . . . . . . . . . . . . . 92
6.2 Previous Methods . . . . . . . . . . . . . . . . . . . . . . . . . . . . . 93
6.2.1 Skeletonization-based Minutiae Extraction . . . . . . . . . . . 93
6.2.2 Gray-Level Minutiae Extraction . . . . . . . . . . . . . . . . . 99
6.2.3 Binary-image based Minutiae Extraction . . . . . . . . . . . . 101
6.2.4 Machine Learning . . . . . . . . . . . . . . . . . . . . . . . . . 104
6.3 Proposed Chain-code Contour Tracing Algorithm . . . . . . . . . . . 106
6.4 Proposed Run-length Scanning Algorithm . . . . . . . . . . . . . . . 109
6.4.1 Definitions . . . . . . . . . . . . . . . . . . . . . . . . . . . . . 109
ix

6.4.2 One-pass embedding labeling run-length-wise thinning and minu-
tiae detection algorithm . . . . . . . . . . . . . . . . . . . . . 112
6.5 Minutiae Verification and Filtering . . . . . . . . . . . . . . . . . . . 115
6.5.1 Structural Methods . . . . . . . . . . . . . . . . . . . . . . . . 115
6.5.2 Learning Methods . . . . . . . . . . . . . . . . . . . . . . . . . 117
6.5.3 Minutiae verification and filtering rules for chain-coded contour
tracing method . . . . . . . . . . . . . . . . . . . . . . . . . . 117
6.6 Experiments . . . . . . . . . . . . . . . . . . . . . . . . . . . . . . . . 119
7 Conclusions 122
x

Chapter 1
Introduction
Today, we can obtain routine information from dedicated websites, retrieve easily in-
formation via search engines, manage our bank accounts and credit information, shop
online and bid for products. To access the internet safely, high-security authentica-
tion systems are essentials. According to 2002 the NTA Monitor Password Survey,
heavy web users have an average of 21 passwords, 81% of users choose a common
password and 30% write their passwords down or store them in a file. Most pass-
words can be guessed easily because users tend to pick easily-remembered passwords
which usually contain personal information such as pet name, home address. Due
to the vulnerability of conventional authentication systems, cybercrime has increased
in the past few years. According to the 2006 October special report in USA today,
FBI estimates annual U.S. buisinesses lost $67.2 billion because of computer-related
crimes. Identity authentication, which is based on biometric feature such as face, iris,
voice, hand geometry, retina, handwriting, fingerprint etc., can significantly decrease
the fraud. Among biometrics, fingerprint systems have been one of most widely re-
searched and deployed because of their easy access, low price of fingerprint sensors,
1
CHAPTER 1. INTRODUCTION 2
non-intrusive scanning, and relatively good performance[51].
In recent years, significant performance improvements have been achieved in commer-
cial automatic fingerprint recognition systems. However the state-of-the-art system
reported at the Fingerprint Verification Competition(FVC)2004 has total error rate
of 4% with 2% False Reject Rate (FRR) and False Accept Rate (FAR) [16]. The
Fingerprint Vendor Technology Evaluation (FpVTE) 2003, which was conducted by
the National Institute of Standards & Technology (NIST) on behalf of the Justice
Management Division (JMD) of the U.S. Department of Justice, reported the lowest
FRR of 0.1% at the FAR of 1%. Therefore, it is imperative to continue research on
improving the reliability, stability, performance and security of fingerprint recogni-
tion systems. Low quality fingerprint image, distortion, the partial image problems,
large fingerprint databases [16] are all major areas of research needed to improve the
accuracy of current systems.
Major causes for degradation of fingerprint image quality include the physiological
condition of fingers friction ridge skin and other physiological state of the fingers, per-
formance of the capture devices (device reliability, consistency, degradation of sensing
elements, image resolution, signal-to-noise ratio, etc.), acquisition environment (ex-
ternal light, temperature and humidity weather conditions), user/device interaction,
cleanliness of device surface, acquisition pressure, and contact area of the finger with
the scanner. Thus, current fingerprint recognition technologies are vulnerable to poor
quality images. According to recent report by the U.S. National Institute of Stan-
dards and Technology(NIST), 16% of the images collected are of sufficiently poor
quality to cause a significant deterioration of the overall system performance [46].
Many researchers in both academics and industry are working on improving the over-
all fingerprint recognition performance. Hardware efforts are focused on improving
CHAPTER 1. INTRODUCTION 3
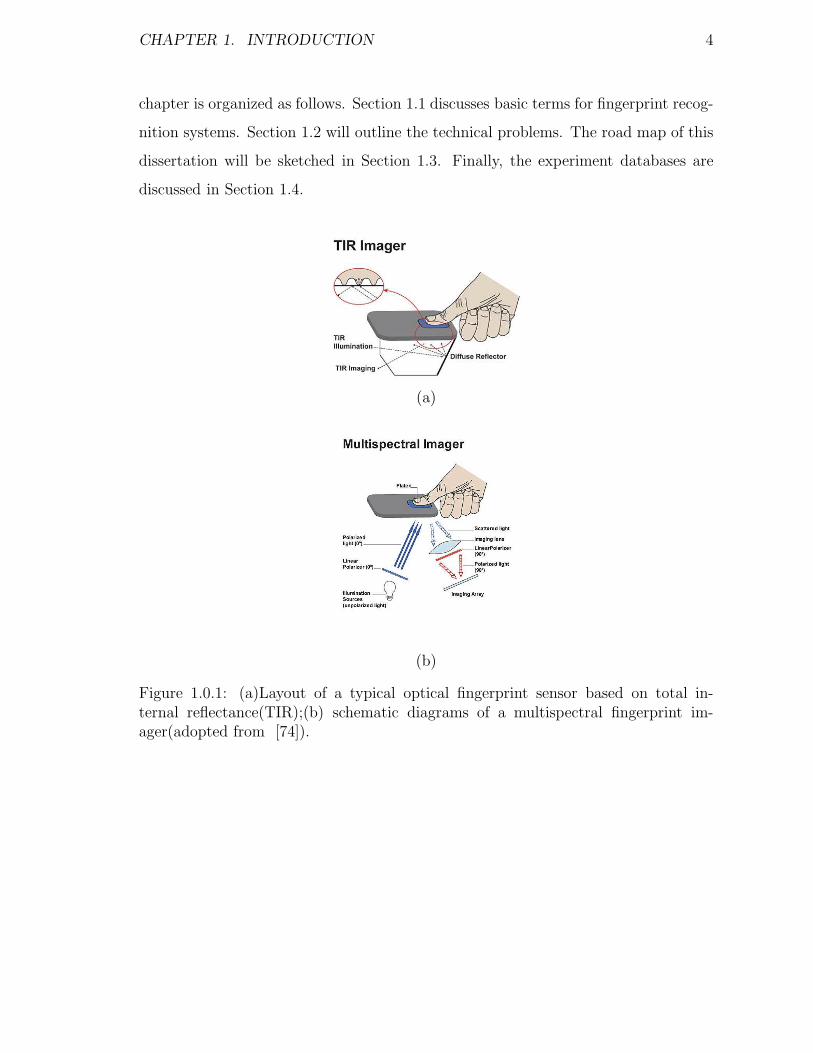
the acquisition device capability for obtaining high quality images. Lumidigm (New
Mexico, U.S.) has designed and developed an innovative high-performance finger-
print biometric imaging system, which incorporates a conventional fingerprint optical
sensor with a multispectal imager during each instance of image capture [74]. A
typical optical sensor is illustrated in Figure 1.0.1(a). It is based on total internal
reflectance(TIR). The inset in the upperleft of the Figure shows the intersection of
the optical mechanism that occurs at the fingerprint ridges and valleys. Fingerprint
ridges allow light to cross the platen interface so that the corresponding regions in
the collected image are dark. Fingerprint valleys permit TIR to occur so that the
regions corresponding to the valley in the collected image appears bright. The general
architecture for a multispectral imager is shown in Figure 1.0.1(b). The system ob-
tains the “subsurface internal fingerprint”, which is a complex pattern of collagen and
blood vessels that mirror the surface ridge pattern. Because of the different chemical
compositions of the living human skin, it exhibits varied absorbance properties and
scattering effects. Therefore, different wavelengths of light can cause the sensor to
not only acquire high quality images, but also provide capability for the automatic
liveness detection. Latent prints on the fingerprint image can pose a challenge to
segmentation procedure. Deformation in touch-based sensing technology also causes
problem due to contact between the elastic skin of the finger and a rigid surface.
TBS [63] designed an innovative touchless device (surround Imager) to address the
limitations of touch-based sensing devices. It combines five specially designed cam-
eras, and avoids the tedious, uncomfortable and error-prone rolling procedure required
by current capture technologies.
Software related efforts research are focused on feature detection, and matching al-
gorithms. This thesis will focus on robust feature detection algorithms. This first
CHAPTER 1. INTRODUCTION 4
chapter is organized as follows. Section 1.1 discusses basic terms for fingerprint recog-
nition systems. Section 1.2 will outline the technical problems. The road map of this
dissertation will be sketched in Section 1.3. Finally, the experiment databases are
discussed in Section 1.4.
(a)
(b)
Figure 1.0.1: (a)Layout of a typical optical fingerprint sensor based on total in-ternal reflectance(TIR);(b) schematic diagrams of a multispectral fingerprint im-ager(adopted from [74]).
CHAPTER 1. INTRODUCTION 5
1.1 Basic Definitions
In order to understand the structure of fingerprints and how the recognition system
works, we will introduce the terminology to facilitate discussion.
1.1.1 System Error Rates
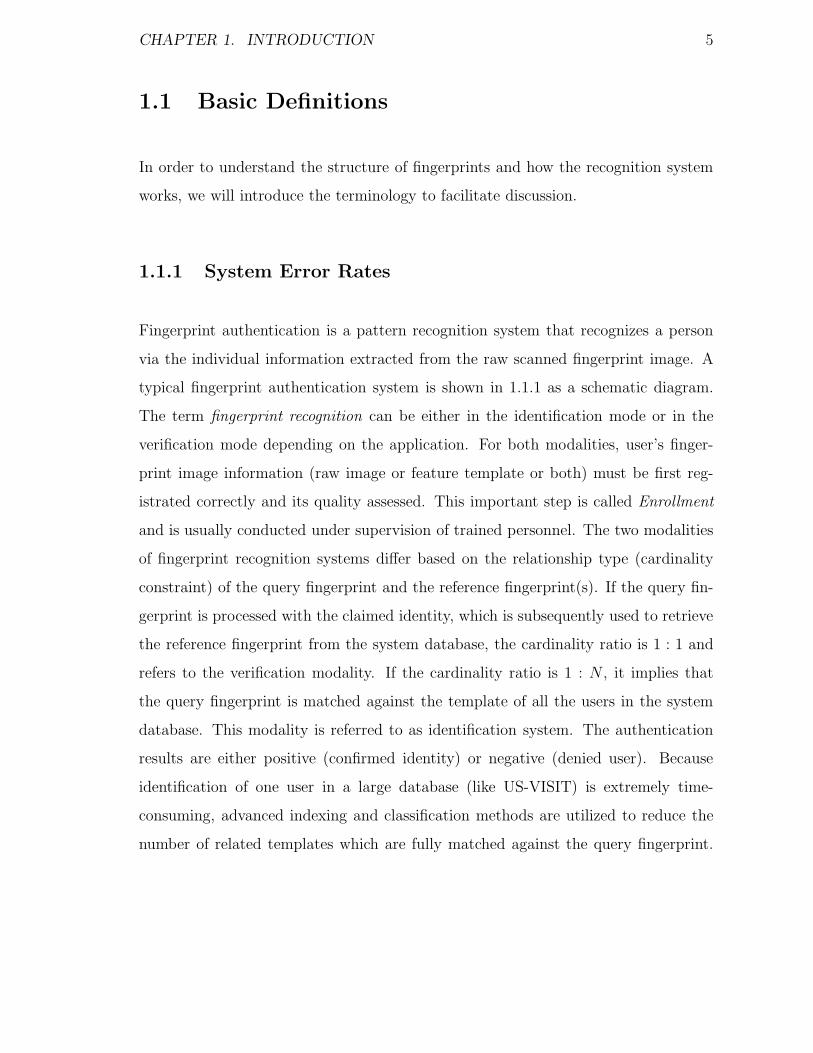
Fingerprint authentication is a pattern recognition system that recognizes a person
via the individual information extracted from the raw scanned fingerprint image. A
typical fingerprint authentication system is shown in 1.1.1 as a schematic diagram.
The term fingerprint recognition can be either in the identification mode or in the
verification mode depending on the application. For both modalities, user’s finger-
print image information (raw image or feature template or both) must be first reg-
istrated correctly and its quality assessed. This important step is called Enrollment
and is usually conducted under supervision of trained personnel. The two modalities
of fingerprint recognition systems differ based on the relationship type (cardinality
constraint) of the query fingerprint and the reference fingerprint(s). If the query fin-
gerprint is processed with the claimed identity, which is subsequently used to retrieve
the reference fingerprint from the system database, the cardinality ratio is 1 : 1 and
refers to the verification modality. If the cardinality ratio is 1 : N , it implies that
the query fingerprint is matched against the template of all the users in the system
database. This modality is referred to as identification system. The authentication
results are either positive (confirmed identity) or negative (denied user). Because
identification of one user in a large database (like US-VISIT) is extremely time-
consuming, advanced indexing and classification methods are utilized to reduce the
number of related templates which are fully matched against the query fingerprint.
CHAPTER 1. INTRODUCTION 6
Fingerprint patterns can be classified into five classes according to Henry classes[31]
for the purpose of pruning the database.
Figure 1.1.1: Schematic diagram of Fingerprint recognition Systems.
Due to the variations present on each instance of fingerprint capture no recognition
system can give an absolute answer about the individual’s identity; instead it pro-
vides the individual’s identity information with a certain confidence level based on
a similarity score. This is different from traditional authentication systems (such
as passwords) where the match is exact and an absolute “yes” or “no” answer is re-
turned. The validation procedure in such cases is based on whether the user can prove
the exclusive possessions(cards) or the secret knowledge (password or PIN number).
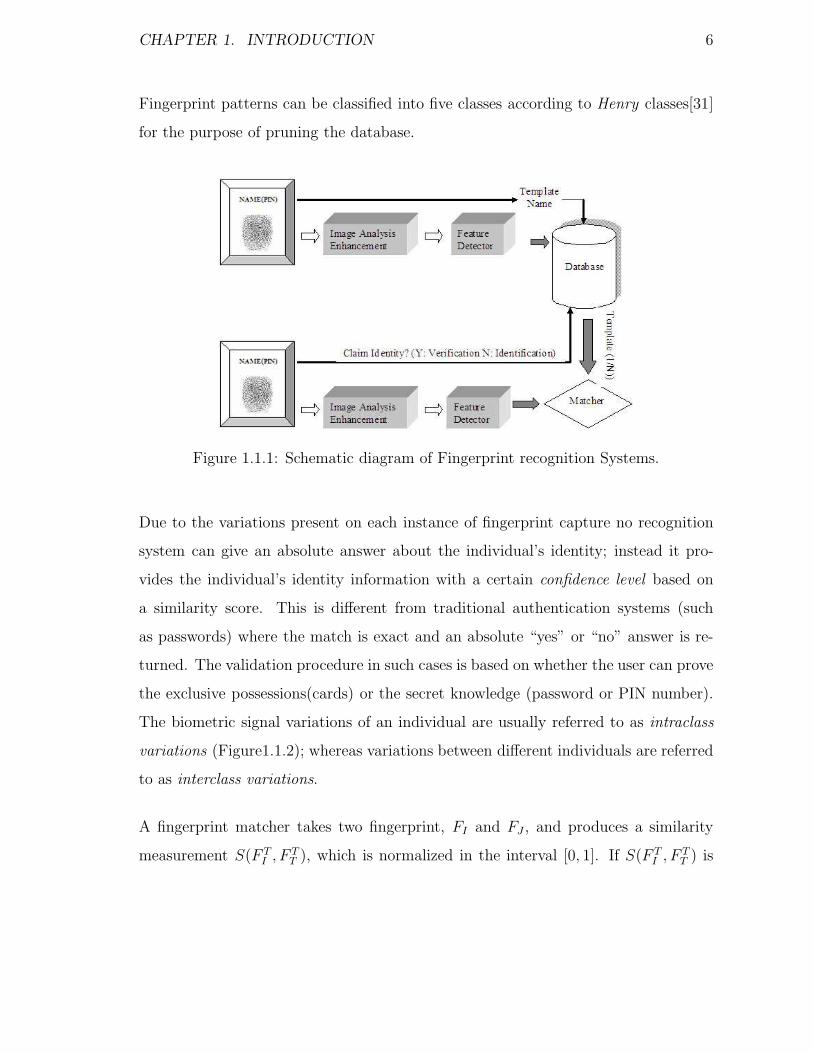
The biometric signal variations of an individual are usually referred to as intraclass
variations (Figure1.1.2); whereas variations between different individuals are referred
to as interclass variations.
A fingerprint matcher takes two fingerprint, FI and FJ , and produces a similarity
measurement S(F TI , F T
T ), which is normalized in the interval [0, 1]. If S(F TI , F T
T ) is
CHAPTER 1. INTRODUCTION 7
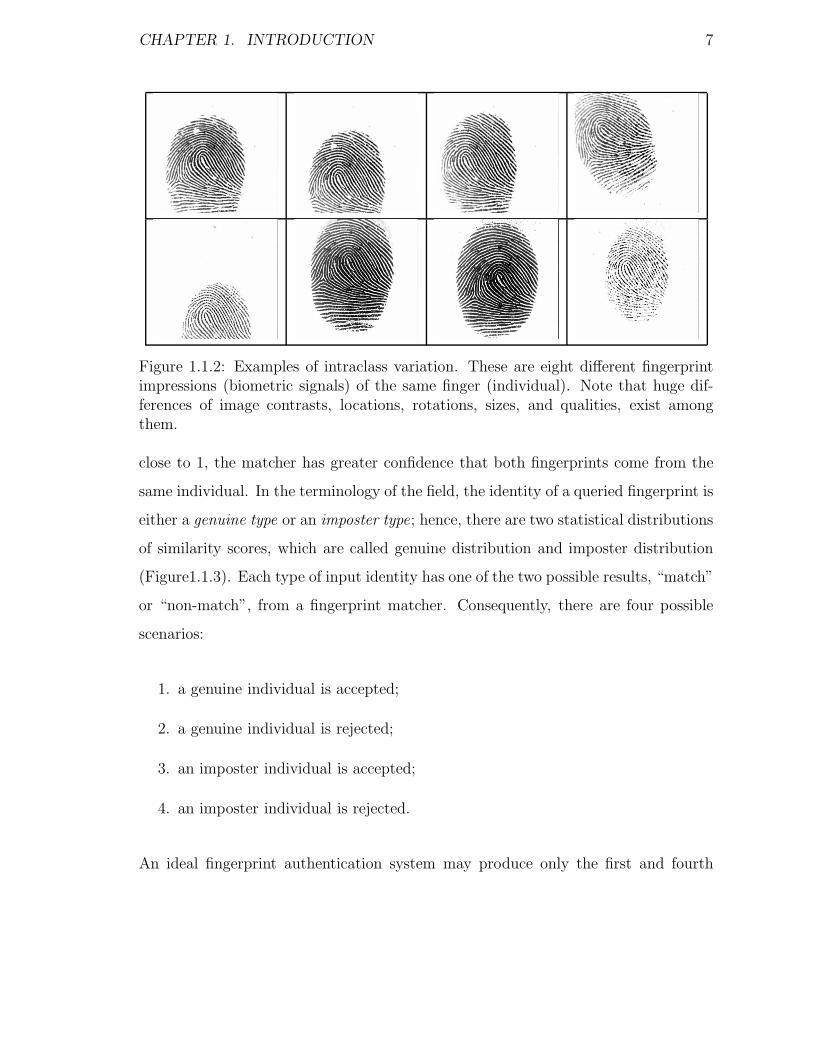
Figure 1.1.2: Examples of intraclass variation. These are eight different fingerprintimpressions (biometric signals) of the same finger (individual). Note that huge dif-ferences of image contrasts, locations, rotations, sizes, and qualities, exist amongthem.
close to 1, the matcher has greater confidence that both fingerprints come from the
same individual. In the terminology of the field, the identity of a queried fingerprint is
either a genuine type or an imposter type; hence, there are two statistical distributions
of similarity scores, which are called genuine distribution and imposter distribution
(Figure1.1.3). Each type of input identity has one of the two possible results, “match”
or “non-match”, from a fingerprint matcher. Consequently, there are four possible
scenarios:
1. a genuine individual is accepted;
2. a genuine individual is rejected;
3. an imposter individual is accepted;
4. an imposter individual is rejected.
An ideal fingerprint authentication system may produce only the first and fourth
CHAPTER 1. INTRODUCTION 8
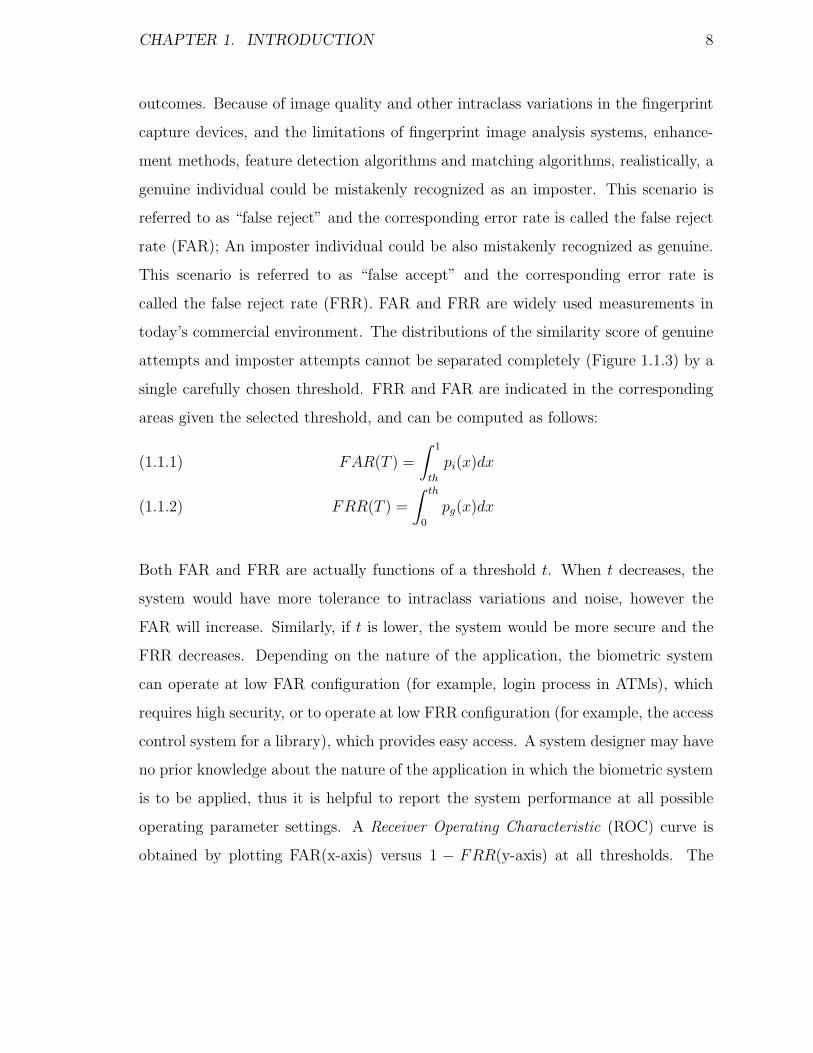
outcomes. Because of image quality and other intraclass variations in the fingerprint
capture devices, and the limitations of fingerprint image analysis systems, enhance-
ment methods, feature detection algorithms and matching algorithms, realistically, a
genuine individual could be mistakenly recognized as an imposter. This scenario is
referred to as “false reject” and the corresponding error rate is called the false reject
rate (FAR); An imposter individual could be also mistakenly recognized as genuine.
This scenario is referred to as “false accept” and the corresponding error rate is
called the false reject rate (FRR). FAR and FRR are widely used measurements in
today’s commercial environment. The distributions of the similarity score of genuine
attempts and imposter attempts cannot be separated completely (Figure 1.1.3) by a
single carefully chosen threshold. FRR and FAR are indicated in the corresponding
areas given the selected threshold, and can be computed as follows:
FAR(T ) =
∫ 1
th
pi(x)dx(1.1.1)
FRR(T ) =
∫ th
0
pg(x)dx(1.1.2)
Both FAR and FRR are actually functions of a threshold t. When t decreases, the
system would have more tolerance to intraclass variations and noise, however the
FAR will increase. Similarly, if t is lower, the system would be more secure and the
FRR decreases. Depending on the nature of the application, the biometric system
can operate at low FAR configuration (for example, login process in ATMs), which
requires high security, or to operate at low FRR configuration (for example, the access
control system for a library), which provides easy access. A system designer may have
no prior knowledge about the nature of the application in which the biometric system
is to be applied, thus it is helpful to report the system performance at all possible
operating parameter settings. A Receiver Operating Characteristic (ROC) curve is
obtained by plotting FAR(x-axis) versus 1 − FRR(y-axis) at all thresholds. The
CHAPTER 1. INTRODUCTION 9
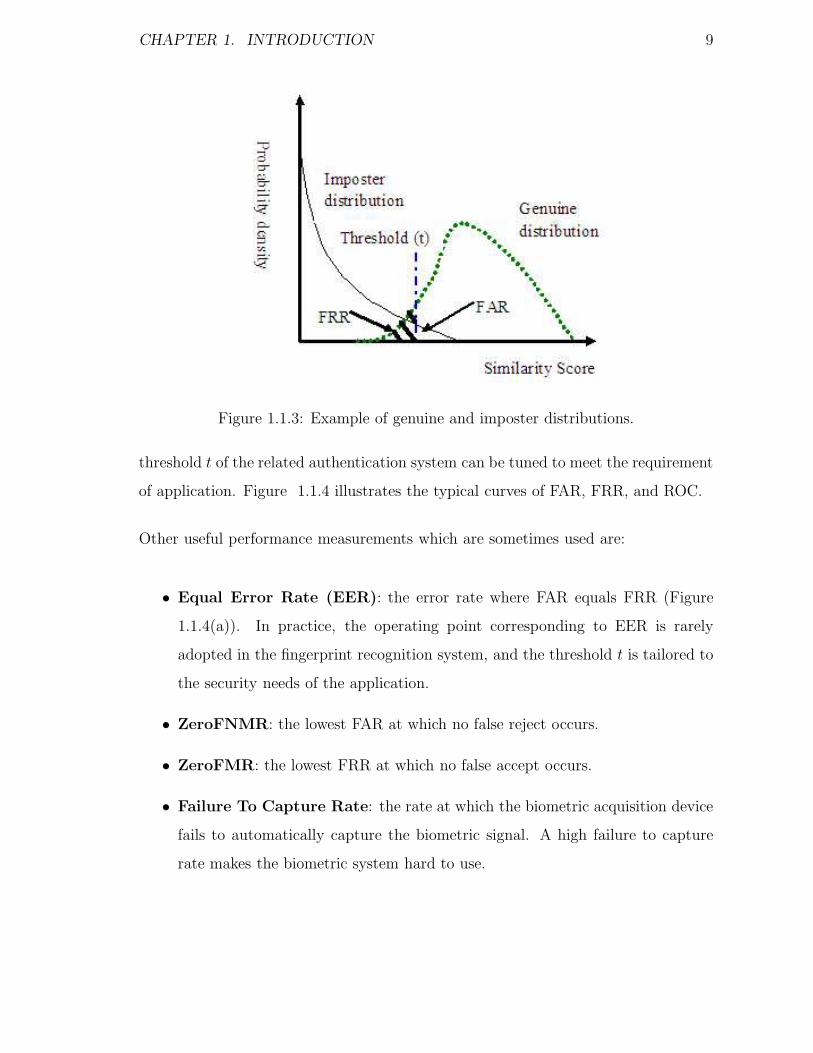
Figure 1.1.3: Example of genuine and imposter distributions.
threshold t of the related authentication system can be tuned to meet the requirement
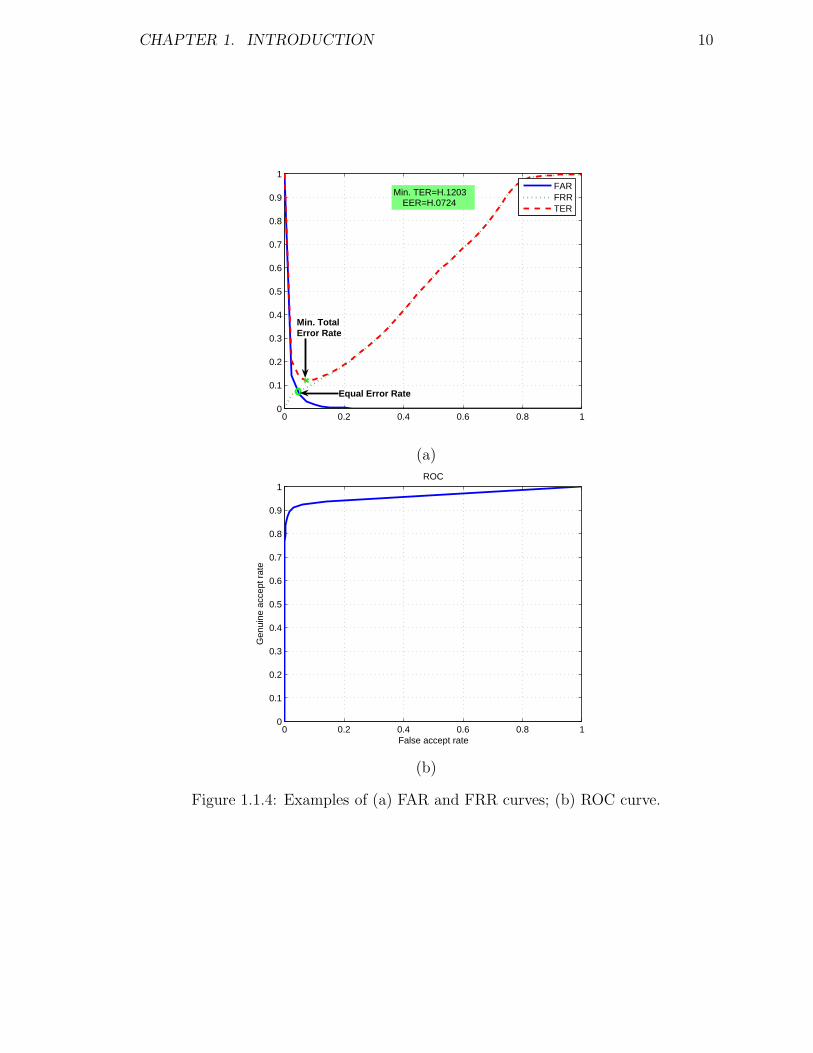
of application. Figure 1.1.4 illustrates the typical curves of FAR, FRR, and ROC.
Other useful performance measurements which are sometimes used are:
• Equal Error Rate (EER): the error rate where FAR equals FRR (Figure
1.1.4(a)). In practice, the operating point corresponding to EER is rarely
adopted in the fingerprint recognition system, and the threshold t is tailored to
the security needs of the application.
• ZeroFNMR: the lowest FAR at which no false reject occurs.
• ZeroFMR: the lowest FRR at which no false accept occurs.
• Failure To Capture Rate: the rate at which the biometric acquisition device
fails to automatically capture the biometric signal. A high failure to capture
rate makes the biometric system hard to use.
CHAPTER 1. INTRODUCTION 10
0 0.2 0.4 0.6 0.8 10
0.1
0.2
0.3
0.4
0.5
0.6
0.7
0.8
0.9
1
Min. TER=H.1203EER=H.0724
FARFRRTER
Equal Error Rate
Min. TotalError Rate
(a)
0 0.2 0.4 0.6 0.8 10
0.1
0.2
0.3
0.4
0.5
0.6
0.7
0.8
0.9
1
False accept rate
Gen
uine
acc
ept r
ate
ROC
(b)
Figure 1.1.4: Examples of (a) FAR and FRR curves; (b) ROC curve.

CHAPTER 1. INTRODUCTION 11
• Failure To Enroll Rate: the rate at which users are not able to enroll in the
system. This error mainly occurs when the biometric signal is rejected due to
its poor quality.
• Failure To Match Rate: occurs when the biometric system fails to convert
the input biometric signal into a machine readable/understandable biometric
template. Unlike FRR, a failure to match the error occurs at a stage prior to
the decision making stage in a biometric system.
1.1.2 Fingerprint Features
In [35], fingerprint features are classified into three classes. Level 1 features show
macro details of the ridge flow shape, Level 2 features (minutiae point) are discrimi-
native enough for recognition, and Level 3 features (pores) complement the uniqueness
of Level 2 features.
1.1.3 Global Ridge Pattern
A fingerprint is a pattern of alternating convex skin called ridges and concave skin
called valleys with a spiral-curve-like line shape (Figure 1.1.5). There are two types of
ridge flows: the pseudo-parallel ridge flows and high-curvature ridge flows which are
located around the core point and/or delta point(s). This representation relies on the
ridge structure, global landmarks and ridge pattern characteristics. The commonly
used global fingerprint features are:
• singular points – discontinuities in the orientation field. There are two types of
singular points. A core is the uppermost of the innermost curving ridge [31],

CHAPTER 1. INTRODUCTION 12
Figure 1.1.5: Global Fingerprint Ridge Flow Patterns.
and a delta point is the junction point where three ridge flows meet. They are
usually used for fingerprint registration, fingerprint classification.
• ridge orientation map – local direction of the ridge-valley structure. It is com-
monly utilized for classification, image enhancement, minutia feature verifica-
tion and filtering.
• ridge frequency map – the reciprocal of the ridge distance in the direction per-
pendicular to local ridge orientation. It is formally defined in [32] and is
extensively utilized for contextual filtering of fingerprint images.
This representation is sensitive to the quality of the fingerprint images [36]. However,
the discriminative abilities of this representation are limited due to absence of singular
points.
1.1.4 Local Ridge Detail
This is the most widely used and studied fingerprint representation. Local ridge
details are the discontinuities of local ridge structure referred to as minutiae. Sir
Francis Galton (1822-1922) was the first person who observed the structures and
permanence of minutiae. Therefore, minutiae are also called “Galton details”. They
CHAPTER 1. INTRODUCTION 13
are used by forensic experts to match two fingerprints.
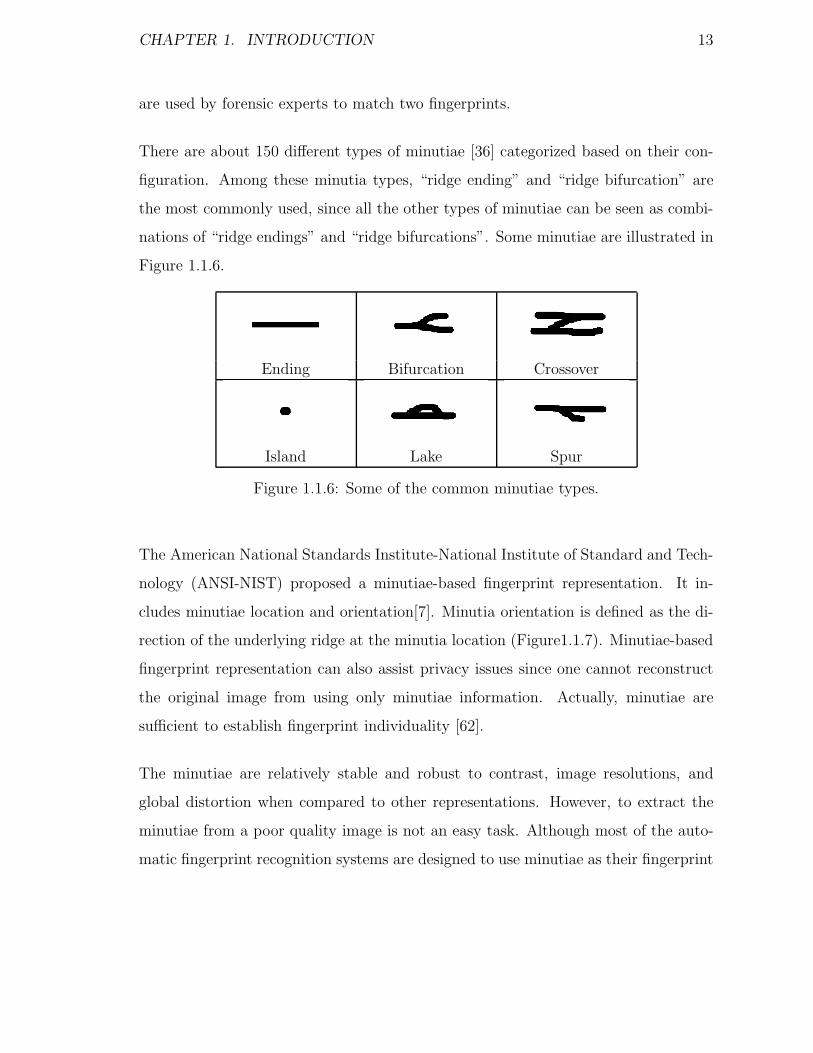
There are about 150 different types of minutiae [36] categorized based on their con-
figuration. Among these minutia types, “ridge ending” and “ridge bifurcation” are
the most commonly used, since all the other types of minutiae can be seen as combi-
nations of “ridge endings” and “ridge bifurcations”. Some minutiae are illustrated in
Figure 1.1.6.
Ending Bifurcation Crossover
Island Lake Spur
Figure 1.1.6: Some of the common minutiae types.
The American National Standards Institute-National Institute of Standard and Tech-
nology (ANSI-NIST) proposed a minutiae-based fingerprint representation. It in-
cludes minutiae location and orientation[7]. Minutia orientation is defined as the di-
rection of the underlying ridge at the minutia location (Figure1.1.7). Minutiae-based
fingerprint representation can also assist privacy issues since one cannot reconstruct
the original image from using only minutiae information. Actually, minutiae are
sufficient to establish fingerprint individuality [62].
The minutiae are relatively stable and robust to contrast, image resolutions, and
global distortion when compared to other representations. However, to extract the
minutiae from a poor quality image is not an easy task. Although most of the auto-
matic fingerprint recognition systems are designed to use minutiae as their fingerprint
CHAPTER 1. INTRODUCTION 14
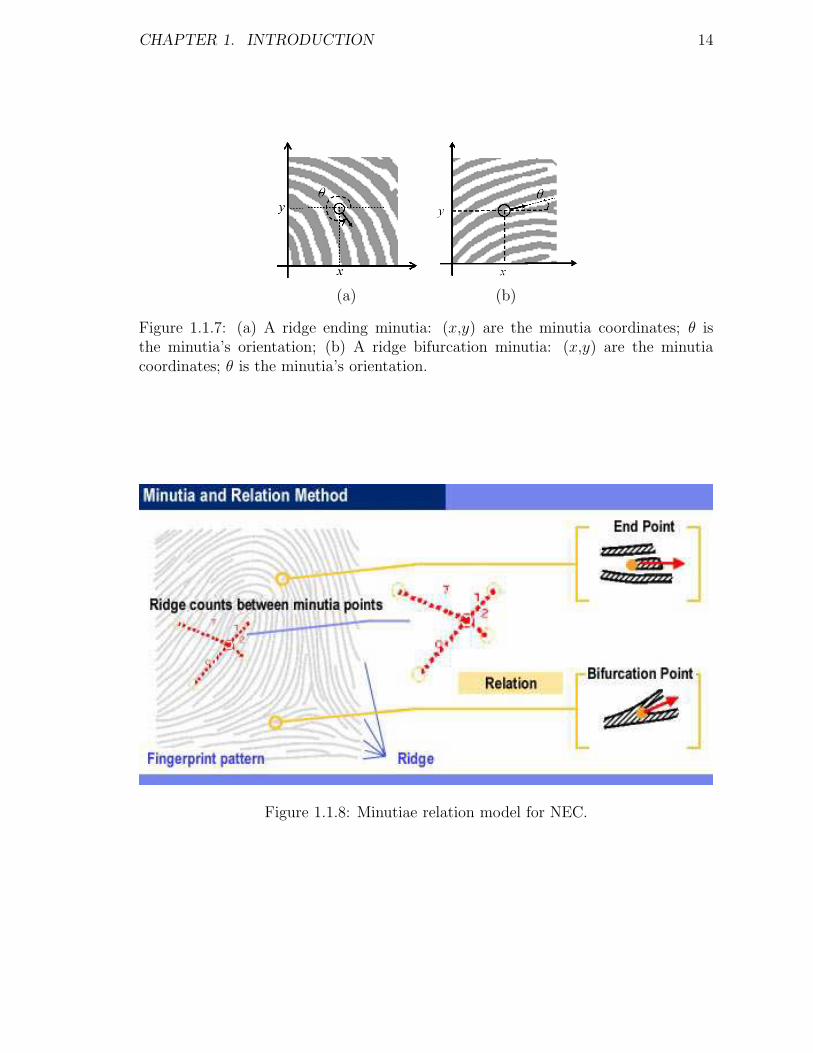
(a) (b)
Figure 1.1.7: (a) A ridge ending minutia: (x,y) are the minutia coordinates; θ isthe minutia’s orientation; (b) A ridge bifurcation minutia: (x,y) are the minutiacoordinates; θ is the minutia’s orientation.
Figure 1.1.8: Minutiae relation model for NEC.
CHAPTER 1. INTRODUCTION 15
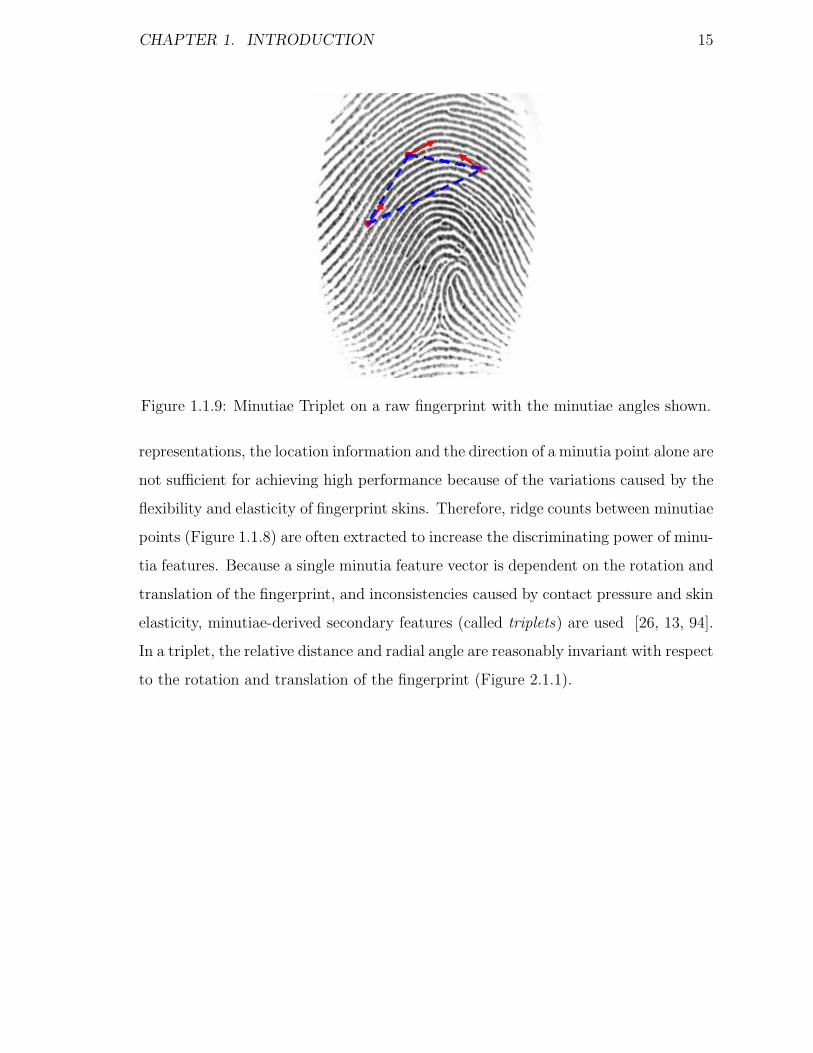
Figure 1.1.9: Minutiae Triplet on a raw fingerprint with the minutiae angles shown.
representations, the location information and the direction of a minutia point alone are
not sufficient for achieving high performance because of the variations caused by the
flexibility and elasticity of fingerprint skins. Therefore, ridge counts between minutiae
points (Figure 1.1.8) are often extracted to increase the discriminating power of minu-
tia features. Because a single minutia feature vector is dependent on the rotation and
translation of the fingerprint, and inconsistencies caused by contact pressure and skin
elasticity, minutiae-derived secondary features (called triplets) are used [26, 13, 94].
In a triplet, the relative distance and radial angle are reasonably invariant with respect
to the rotation and translation of the fingerprint (Figure 2.1.1).
CHAPTER 1. INTRODUCTION 16
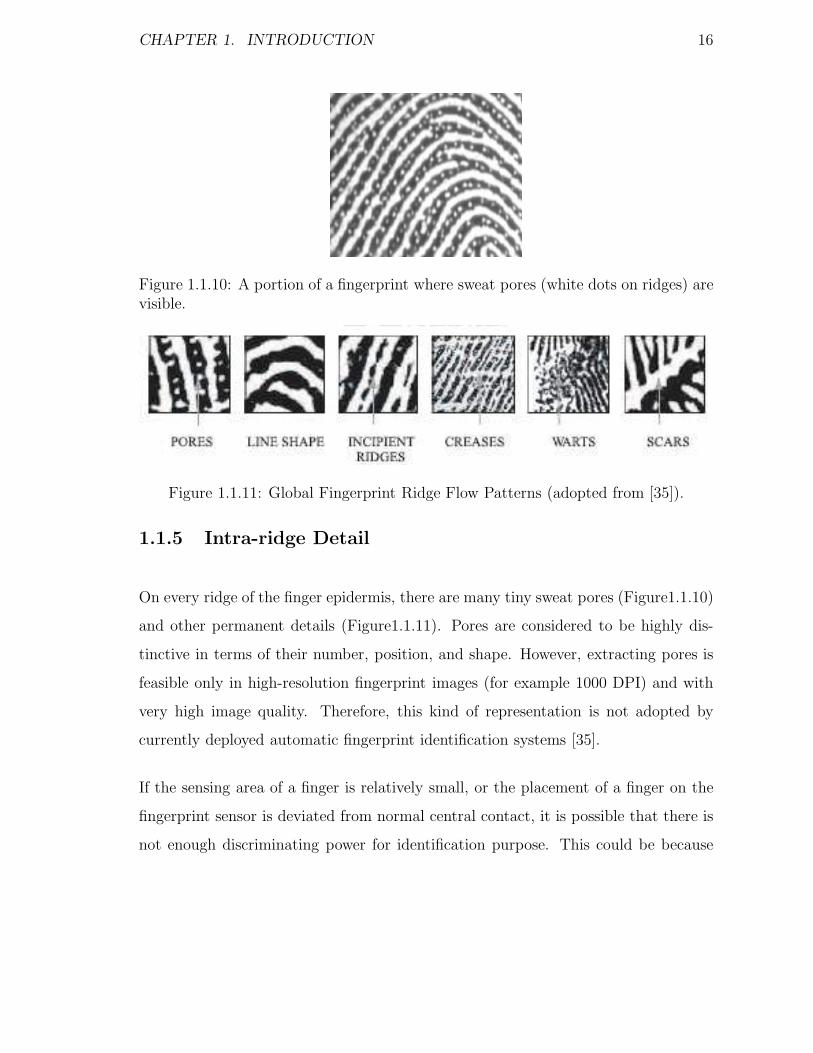
Figure 1.1.10: A portion of a fingerprint where sweat pores (white dots on ridges) arevisible.
Figure 1.1.11: Global Fingerprint Ridge Flow Patterns (adopted from [35]).
1.1.5 Intra-ridge Detail
On every ridge of the finger epidermis, there are many tiny sweat pores (Figure1.1.10)
and other permanent details (Figure1.1.11). Pores are considered to be highly dis-
tinctive in terms of their number, position, and shape. However, extracting pores is
feasible only in high-resolution fingerprint images (for example 1000 DPI) and with
very high image quality. Therefore, this kind of representation is not adopted by
currently deployed automatic fingerprint identification systems [35].
If the sensing area of a finger is relatively small, or the placement of a finger on the
fingerprint sensor is deviated from normal central contact, it is possible that there is
not enough discriminating power for identification purpose. This could be because

CHAPTER 1. INTRODUCTION 17
either most discriminative regions do not get included in the image, or because the
number of detected minutiae is not enough. Level 3 features can increase discrim-
inating capacity of Level 2 features. Experiments [35] demonstrate that a relative
20% reduction of EER is achieved if Level 3 features are integrated into the current
Level 1 and Level 2 features-based fingerprint recognition systems.
1.1.6 Texture Features: Gabor Feature and FFT phase-only
feature
Texture features have been extensively explored in fingerprint processing, and have
been applied to fingerprint classification, segmentation and matching [38, 73, 69, 34].
The fingerprint is tessellated into 16×16 cells [73], a bank of 8 directions Gabor filters
are used to convolve with each cell, and the variance of the energies of the 8 Gabor
filer responses in each cell is used as a feature vector. Because phase information in
the frequency domain is not affected by image translation and illumination changes,
it is also robust against noise. The only phase information that has been successfully
used thus far for low quality fingerprint recognition has been described in [34].

CHAPTER 1. INTRODUCTION 18
1.2 Technical Problems
1.2.1 Segmentation
The segmentation process needs to separate foreground from background with high
accuracy. Inclusion of noisy background can pose problems to the following enhance-
ment, feature extraction and matching performance. Exclusion of foreground de-
creases the matching performance especially partial in fingerprint images.
1.2.2 Image Quality Assessment
Objective estimation of fingerprint image quality is a nontrivial technical problem.
The commonly used features for fingerprint image quality are Fourier spectrum en-
ergy, Gabor filter energy, and local orientation certainty level. However, there is no
systematic method to combine the texture features in the frequency domain and spa-
tial domain. Combining the metrics in the frequency domain and the spatial domain
is a classification problem, which must be solved to select appropriate preprocessing
and enhancement parameters.
1.2.3 Enhancement
For good quality fingerprint images, most AFISs can accurately extract minutiae
points in the well defined ridge-valley regions of a fingerprint image where the ridge
orientation changes slowly, but can not get satisfactory results in the high-curvature
regions. Gabor filter has been used extensively to enhance fingerprint images, and

CHAPTER 1. INTRODUCTION 19
local ridge orientation and ridge frequency are critical parameters for high perfor-
mance. However, researchers have only used a single low-pass filter with the size of
5× 5 with the assumption that there is slow orientation change in local ridges. Noisy
regions like creases can not be smoothed successfully with a gaussian kernel of that
size. The inherent relationship between ridge topology and filter window size must
be studied.
1.2.4 Feature Detection Accuracy
Although there are several methods available for detecting minutiae, the technical
problems related to the improvement of feature extraction are still active fields of
research. All existing minutiae extraction methods need their corresponding fea-
ture verification and filtering procedure. We propose a chain-coded contour tracing
method for minutiae detection, and explore several heuristic rules for spurious minu-
tiae filtering associated with this thinning-free method.
1.3 Outline
In the second chapter we will summarize the-state-of-art matching algorithms, the
matching algorithms proposed by Jea in [39] will be discussed in detail because we
utilize Jea’s method for final performance evaluation.
In the third chapter we discuss features for fingerprint image quality estimation,
introduce new metrics in the frequency domain and the spatial domain, describe
the method for composite metrics and the application for image preprocessing and
enhancement.
CHAPTER 1. INTRODUCTION 20
The fourth chapter first discusses the types of fingerprint segmentation and the rela-
tive use of texture features. The reason for using point features is discussed, following
a review of the Harris corner point detection method. Finally we present a novel Harris
corner point based fingerprint segmentation algorithm with heuristic outliers filtering
method using Gabor filter.
Orientation smoothing and singularity-preserving image enhancement algorithms are
discussed in Chapter five. We investigate the ridge topological pattern, and propose
simple and efficient gradient-based localization and classification method. A new
noise model is also proposed in this chapter.
Chapter six will review available minutiae extraction methods, and compare their
advantages and disadvantages. Two thinning-free feature extraction methods: chain-
code contour tracing and two-pass run-length code scanning are presented in this
chapter. The corresponding feature filtering rules are discussed, and innovative
boundary minutiae filtering method is proposed.
Finally, chapter seven contains the summary of our work and contributions made.
1.4 Benchmarks
To compare our segmentation algorithm, enhancement algorithm and feature detec-
tion methods with published methods, publicly available fingerprint databases for
Fingerprint Verification Competition(FVC) in 2000, 2002 and 2004 [24] have been
chosen. Among them, only databases which are acquired by fingerprint sensors are
considered. Each database contains 880 fingerprints, originated from 110 different
fingers of untrained volunteers. The same finger is needed to give 8 impressions. The

CHAPTER 1. INTRODUCTION 21
Database Name Sensor Type Image Size Resolution(dpi)2000 DB1 Low-cost Optical Sensor 300 × 300 5002000 DB2 Low-cost Capacitive Sensor 256 × 364 5002000 DB3 Optical Sensor 448 × 478 5002002 DB1 Optical Sensor 388 × 374 5002002 DB2 Optical Sensor 296 × 560 5692002 DB2 Capacitive Sensor 300 × 300 5002004 DB1 Optical Sensor 640 × 480 5002004 DB2 Optical Sensor 328 × 364 5002004 DB3 Thermal Sweeping Sensor 300 × 480 500
Table 1.4.1: Parameters of the chosen databases
image properties for all the selected databases are shown in Table1.4.1.
Chapter 2
Matching and Performance
Evaluation Framework
2.1 Correlation-based Matching Algorithm
To verify the efficiency and accuracy of our proposed segmentation method, image
quality modeling, image enhancement strategy and feature detection algorithms, the
matching algorithm developed at CUBS [39] has been adopted. In Jea’s Disser-
tation [39], two matching methods, multi-path and localized size-specific matching
algorithm, were proposed. In the following sections, minutiae derived secondary fea-
ture called Triplet is discussed in detail, and then a simple sketch of multi-path
matching scheme is presented. This is followed by a detailed explanation of localized
size-specific fingerprint matching algorithm for completeness.
22
CHAPTER 2. MATCHING AND PERFORMANCE EVALUATION FRAMEWORK23
2.1.1 Minutiae Triplet
The minutiae-derived feature called Triplet was first proposed by Germain et al. [26].
They found that redundant combinations of three minutiae points not only form new
features which provide more discriminative information than does a single minutia
point, but also reduce deformation effects due to skin elasticity and inconsistent
contact pressure. Furthermore, side length constraints were used to guarantee a
relatively constant number of triplets, and an appropriate binning mechanism was
used to allow dynamic tolerance for irreproducible minutiae positions.
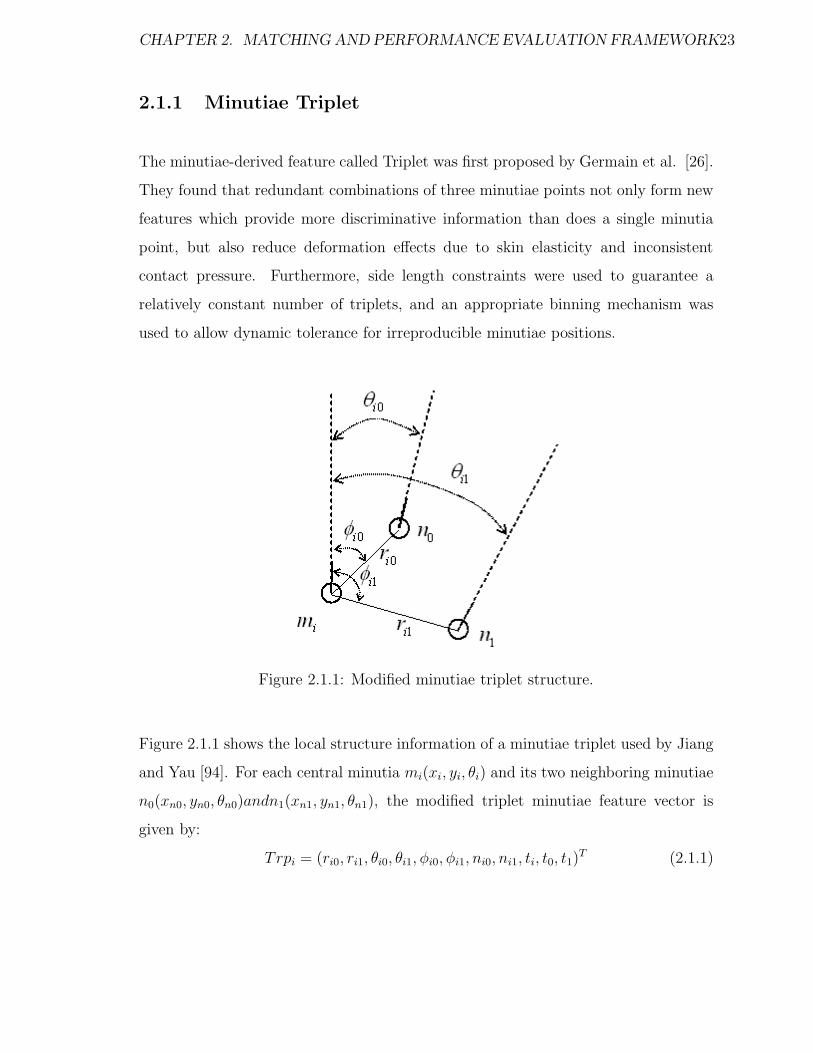
Figure 2.1.1: Modified minutiae triplet structure.
Figure 2.1.1 shows the local structure information of a minutiae triplet used by Jiang
and Yau [94]. For each central minutia mi(xi, yi, θi) and its two neighboring minutiae
n0(xn0, yn0, θn0)andn1(xn1, yn1, θn1), the modified triplet minutiae feature vector is
given by:
Trpi = (ri0, ri1, θi0, θi1, φi0, φi1, ni0, ni1, ti, t0, t1)T (2.1.1)
CHAPTER 2. MATCHING AND PERFORMANCE EVALUATION FRAMEWORK24
where ri0 and ri1 are the Euclidean distances between the central minutia mi and
its neighbors n0 and ni, respectively. θi0 and θi1 are the relative angles between the
central minutia mi and its neighbors n0 and ni, and φi0 and φi1 are the relative angles
formed by line segments min0 and min1 with respect to θi, respectively. ni0 and ni1
are the ridge counts between the central minutia mi and its neighbors n0 and ni,
respectively, and ti, t0, t1 represent the corresponding minutia type. Apparently, this
minutia-derived feature is invariant to the rotation and translation of the fingerprint,
and to some extent invariant to deformation. In [26], three minutiae points are or-
dered consistently by the side lengths of the formed triangle. In the implementation
of [39], minutiae are ordered in counter-clockwise according to the right-hand rule
of two vectors −−−→min0 and −−−→min1. Furthermore, ridge counts and minutiae types infor-
mation are not utilized because it is not reliable. Bifurcation minutia and ending
minutia might exchange under the varied impression pressure and dirt on the scanner
surface.
In [39], both matching algorithms utilize the same triplet local structure information
as input. There are three stages, namely local matching stage, validation stage and
similarity score calculation stages, as indicated by the multi-path algorithm. An ad-
ditional stage called extended matching in localized size-specific matching algorithm
have been inserted between the validation stage and the similarity score calculation
stage in the multi-path matching algorithm. We will present the multi-path matching
method in the following section [39].
CHAPTER 2. MATCHING AND PERFORMANCE EVALUATION FRAMEWORK25
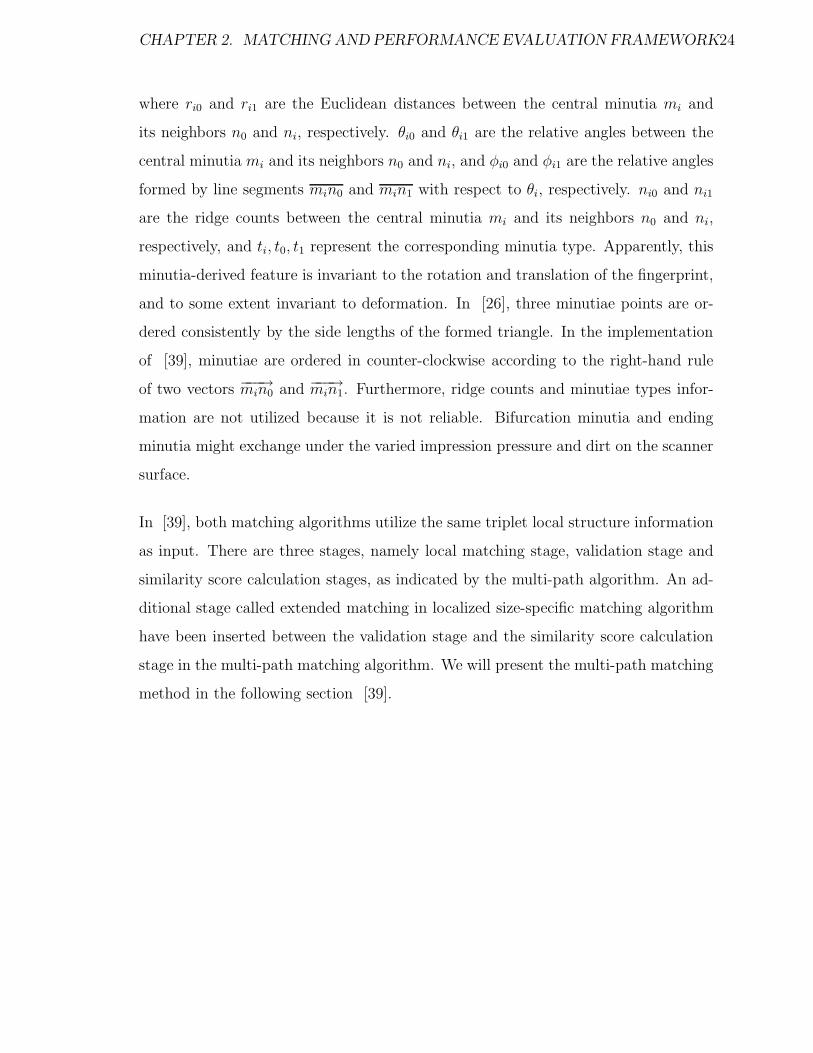
Figure 2.1.2: Multi-path Matching Schematic Flow.
2.1.2 Multi-path Matching Algorithm
A multi-path matching algorithm includes two matching methods:(i) brute-force match-
ing for small number of minutiae query and reference partial fingerprints; (ii) secondary-
feature matching for the relative larger number of minutiae in query and reference
fingerprints. Minimum cost maximum flow(MCF) algorithm is used by both matching
paths to get the optimal pairing of features.
Brute-force matching method checks all the possible matching scenarios, and selects
the match with the most number of matches as the final result. Each minutia point in
R and I are used as reference points. Choosing the appropriate matching methods in
terms of speed and accuracy is dependent on an empirical threshold(α) (Figure 2.1.2).
I and R represent the query fingerprint and reference fingerprint, respectively. Brute-
force matching is adopted in the two scenarios where either or both of the reference
fingerprint and query fingerprint have the number of minutiae less than α. This is
because brute-force matching is very time-consuming.

CHAPTER 2. MATCHING AND PERFORMANCE EVALUATION FRAMEWORK26
Figure 2.1.3: Dynamic tolerance bounding boxes.
Due to the possible deformation in the fingerprint image, dynamic tolerance is used
to reduce the distortion effects. The tolerance area is decided by three threshold func-
tions Thldr(·), Thldθ(·), and Thldφ(·). The distance thresholds function (Thldr(·)) is
more restrictive (smaller) when ri0 and ri1 are smaller and more flexible when ri0 and
ri1 are larger. On the other hand, the thresholds on angles (Thldθ(·) and Thldφ(·))
should be larger in order to allow large distortions when ri0 and ri1 are small, but
smaller when ri0 and ri1 are large (Figure2.1.3). The following empirical functions
are used to get the thresholds:
Thldr(r) = Dmax · max5, r · Dratio(2.1.2)
Thldθ(r) =
A1max · Clb if r ≥ Rmax
A1max · Cub if r ≤ Rmin
A1max · (Cub −(r−Rmin)(Cub−Clb)
(Rmax−Rmin)) otherwise
(2.1.3)
Thldφ(r) =
A2max · Clb if r ≥ Rmax
A2max · Cub if r ≤ Rmin
A2max · (Cub −(r−Rmin)(Cub−Clb)
(Rmax−Rmin)) otherwise
(2.1.4)
where Dmax, Dratio, A1max, A2max, Clb, Cub, Rmax, and Rmin are predefined constants.
These values are chosen differently in the local matching stage and validation stage,

CHAPTER 2. MATCHING AND PERFORMANCE EVALUATION FRAMEWORK27
since stricter constraints are desired in the latter case.
2.1.2.1 Local Matching Stage
This stage results in an initial registration, namely, highly-feasible corresponding local
triplet pairs between R and I.
2.1.2.2 Validation Stage
The candidate list, which is obtained in the initial registration stage, can only provide
local alignments. However, not all well-matched local structures are reliable, Jiang
and Yau [94] utilize the best fit local structure as reference points. In [39], a heuristic
validation procedure is used to check all the matched triplet pairs. First, orientation
differences between the two fingerprints are collected into bins of size of 10o. One
dominant bin and its neighbors are obtained to filter out the matched pairs which are
in the other trace bins. The top C best matched pairs as reference points instead of
first one [94]. The MCF algorithm with dynamic tolerance strategy is used again to
obtain the number of matched minutiae. The largest matched minutiae is taken as
the final result of this stage, and is used to calculate the similarity score detailed in
the following section.
2.1.2.3 Similarity Score Computation Stage
The result of this stage is used directly by the automatic fingerprint recognition
system to measure how close the two fingerprints are and perform authentication.
The most popular way to compute the similarity score is n2
sizeI×sizeR, where sizeI and

CHAPTER 2. MATCHING AND PERFORMANCE EVALUATION FRAMEWORK28
sizeR are the numbers of minutiae in the query fingerprint and reference fingerprint,
and n is the number of matched minutiae. In [10], 2nsizeI+sizeR
is claimed to generate
more consistent similarity scores. However, both methods are not reliable enough
when the fingerprints are of different sizes. In [39], the overlapping regions and the
average feature distances are integrated into a single reliable score calculation. The
overlapping areas are defined as convex hulls which enclose all the matched minutiae
in the query fingerprint and reference fingerprint.
The following information is needed to compute the similarity scores.
• n: the number of matched feature points;
• sizeI : the number of feature points on the query fingerprint (I );
• sizeR: the number of feature points on the reference fingerprint (R);
• OI : the number of feature points in the overlapping area of query fingerprint
(I );
• OR: the number of feature points in the overlapping area of reference fingerprint
(R);
• Savg: the average feature distance of all the matched features.
The details of scoring function are shown in Figure 2.1.4.
2.1.3 Localized Size-specific Matching Algorithm
In the multi-path matching strategy, matching of small partial fingerprints is per-
formed by an expansive brute-force matching when the number of feature points

CHAPTER 2. MATCHING AND PERFORMANCE EVALUATION FRAMEWORK29
Let S as the similarity score; Let heightc as the height of combined fingerprint ;Let widthc as the width of combined fingerprint ;Let maxh as the maximum possible height;Let maxw as the maximum possible width;Let Tm as a integer-valued threshold;If (N < 7 And (heightc > maxh Or widthc > maxw)) then
S = 0;Else
If (Oa < 5) thenOa = 5;
EndifIf (Ob < 5) then
Ob = 5;EndifIf (N > Tm And N > 3
5Oa And N > 35Ob) then
S = Savg;Else
S =N2Savg
OaOb;
If S > 1.0 thenS = 1.0;
EndifEndif
Endif
Figure 2.1.4: A heuristic rule for generating similarity scores.
CHAPTER 2. MATCHING AND PERFORMANCE EVALUATION FRAMEWORK30
present on the fingerprints is less than a certain threshold (α). The selection of α
is important to the system’s performance in terms of speed and accuracy. If α is
set too low, only those fingerprints which have few feature points would benefit from
brute-force matching. This may result in a high false reject rate (FRR), since most of
the participating fingerprints contain more feature points than α, and some of them
do not have enough feature points to obtain a successful match in the first stage of
secondary feature matching. On the other hand, a large α would yield most matches
via brute-force matching causng low speed and high false accept rate (FAR). Fur-
thermore, when each minutia is associated with only one triplet(secondary feature),
the local structure is neither reliable nor robust due to the influence of missing and
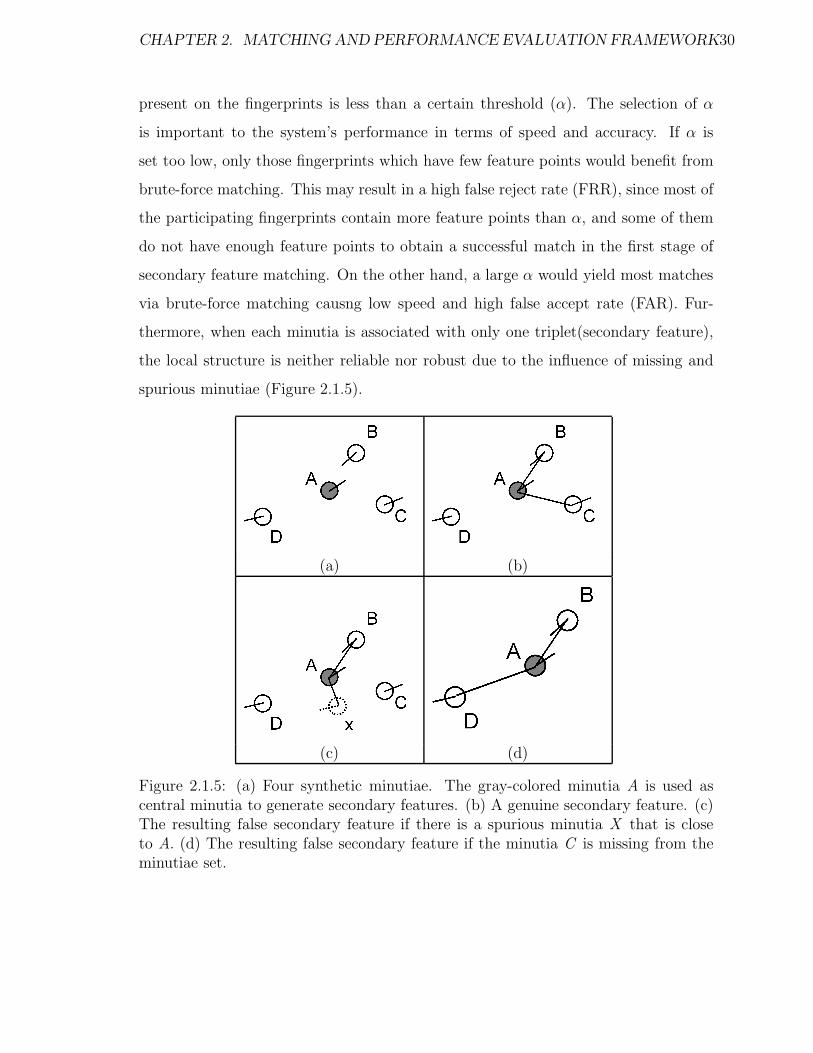
spurious minutiae (Figure 2.1.5).
(a) (b)
(c) (d)
Figure 2.1.5: (a) Four synthetic minutiae. The gray-colored minutia A is used ascentral minutia to generate secondary features. (b) A genuine secondary feature. (c)The resulting false secondary feature if there is a spurious minutia X that is closeto A. (d) The resulting false secondary feature if the minutia C is missing from theminutiae set.
CHAPTER 2. MATCHING AND PERFORMANCE EVALUATION FRAMEWORK31
The limitation of choosing an empirical threshold (α) for matching in a multi-path
matching method can be solved by localized size-specific algorithm, where a central
minutia is associated with many triplets formed from the k nearest neighboring minu-
tiae instead of the first nearest two. This enhances robustness of the local structure,
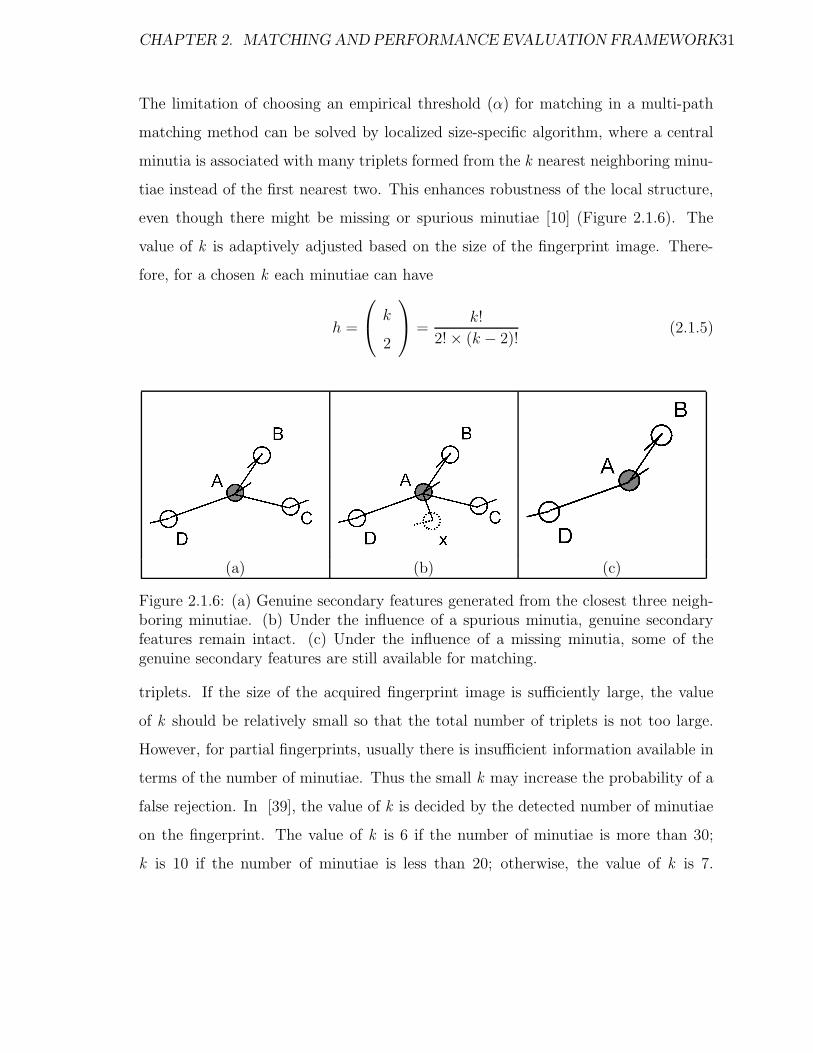
even though there might be missing or spurious minutiae [10] (Figure 2.1.6). The
value of k is adaptively adjusted based on the size of the fingerprint image. There-
fore, for a chosen k each minutiae can have
h =
k
2
=k!
2! × (k − 2)!(2.1.5)
(a) (b) (c)
Figure 2.1.6: (a) Genuine secondary features generated from the closest three neigh-boring minutiae. (b) Under the influence of a spurious minutia, genuine secondaryfeatures remain intact. (c) Under the influence of a missing minutia, some of thegenuine secondary features are still available for matching.
triplets. If the size of the acquired fingerprint image is sufficiently large, the value
of k should be relatively small so that the total number of triplets is not too large.
However, for partial fingerprints, usually there is insufficient information available in
terms of the number of minutiae. Thus the small k may increase the probability of a
false rejection. In [39], the value of k is decided by the detected number of minutiae
on the fingerprint. The value of k is 6 if the number of minutiae is more than 30;
k is 10 if the number of minutiae is less than 20; otherwise, the value of k is 7.
CHAPTER 2. MATCHING AND PERFORMANCE EVALUATION FRAMEWORK32
This heuristic rule can keep the number of triplets for every fingerprint around 600.
The increased number of triplets makes the matching process time-consuming. An
innovative indexing technique is used [39] to reduce computation complexity. The
indexing method clusters triplets according to geometric characteristics. The central
minutia is regarded as the origin point for reference. The plane is divided evenly into
8 non-overlapping quadrants, which are aligned with the orientation of the central
minutia (Figure 2.1.7(a)). Two neighboring minutiae in a triplet are labeled with the
quadrants which they are closest to (Figure 2.1.7(b)). This binning mechanism is
invariant to rotation, translation and scaling. Each triplet is located in the 2-4 bins.
Irregular triplets are removed if the angle between the central minutia and the two
neighboring minutiae are abnormal (either close to 180o or close to 0o). This method
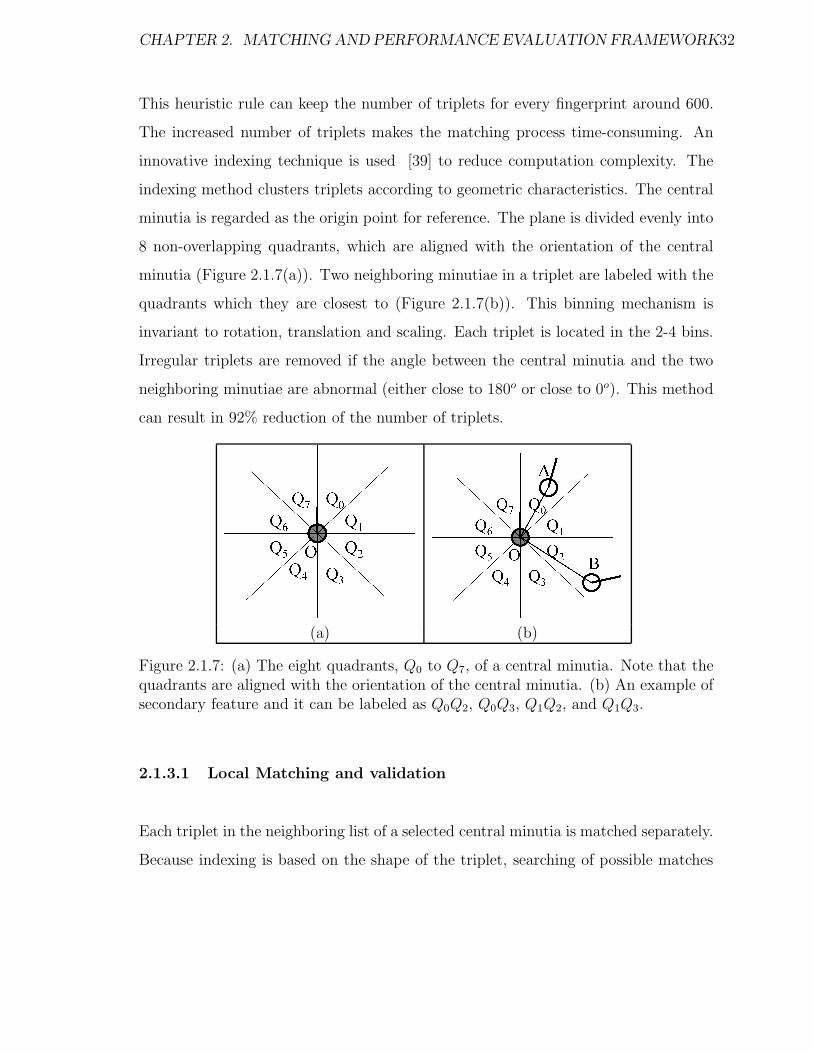
can result in 92% reduction of the number of triplets.
(a) (b)
Figure 2.1.7: (a) The eight quadrants, Q0 to Q7, of a central minutia. Note that thequadrants are aligned with the orientation of the central minutia. (b) An example ofsecondary feature and it can be labeled as Q0Q2, Q0Q3, Q1Q2, and Q1Q3.
2.1.3.1 Local Matching and validation
Each triplet in the neighboring list of a selected central minutia is matched separately.
Because indexing is based on the shape of the triplet, searching of possible matches
CHAPTER 2. MATCHING AND PERFORMANCE EVALUATION FRAMEWORK33
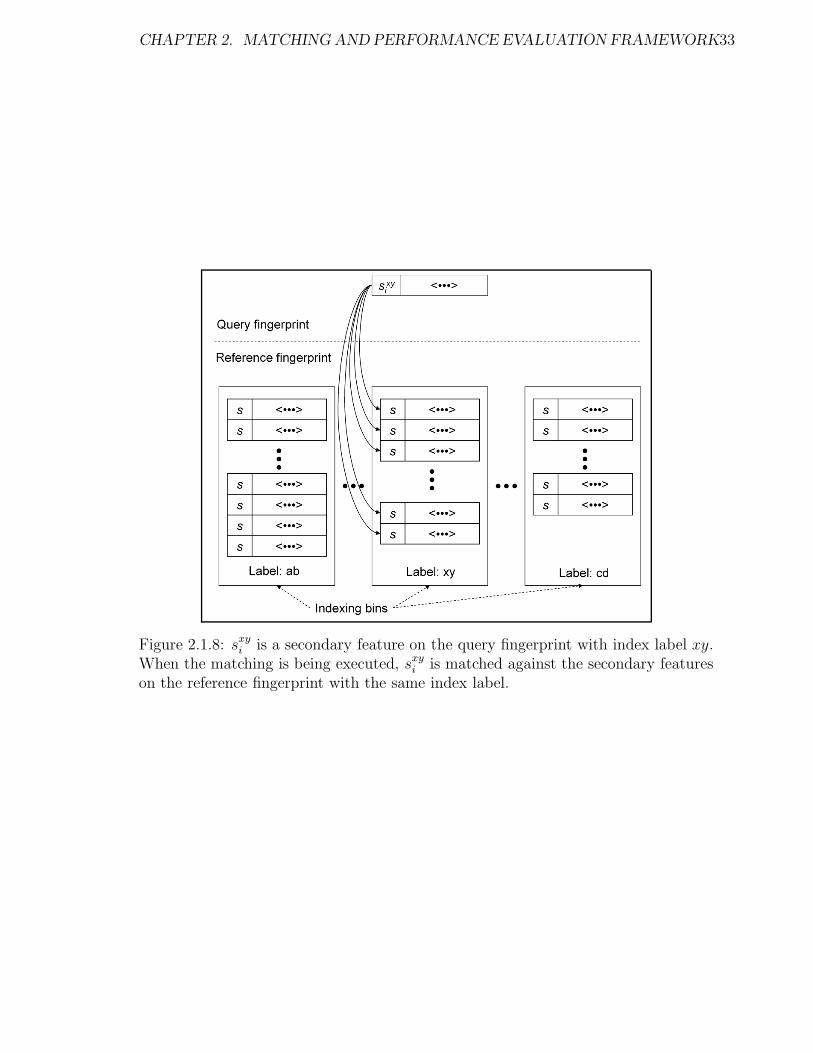
Figure 2.1.8: sxyi is a secondary feature on the query fingerprint with index label xy.
When the matching is being executed, sxyi is matched against the secondary features
on the reference fingerprint with the same index label.

CHAPTER 2. MATCHING AND PERFORMANCE EVALUATION FRAMEWORK34
for a given triple of a fixed index label, for example xy, need only focus on the bins
with the same index label. This is illustrated in Figure 2.1.3.1. The validation phase
utilize global context information to remove any incorrectly matched local structures.
The surviving candidate pairs in the validation stage are referred to as seeds for
subsequent extended matching.
2.1.3.2 Extended Matching
The approach proposed in [39] does not involve any global alignment to obtain the
extended matching of minutia points, and all the matchings are performed locally.
Since local distortion is easier to handle, the approach has a better chance of dealing
with the effect of fingerprint deformation. Moreover, the neighborhood list of a triplet
contains all the information needed for the extended match without a need for re-
calculation. The information is generated only once during the feature extraction
process. The extended match extends the searching to possible matches from the
immediate neighborhood around the previously matched minutiae. However, two
issues need to be addressed:
1. If the minutiae are densely clustered, the extended match can be restricted to
a small portion of the fingerprint, and may not propagate the match globally;
2. Since the extended match can start from any pair of matched feature points,
the selection of the best result is challenging. One solution is to use every pair
of seeds that are returned from the validation stage as starting points, and
chose the extended matching result with the largest number of matched feature
points as the final outcome. Another approach is to combine the extended
matching results with different starting points, since each extended matching
CHAPTER 2. MATCHING AND PERFORMANCE EVALUATION FRAMEWORK35
result represents the correspondence of a local portion of a fingerprint.
These two issues are solved by adding the seeds into each other’s neighborhood list.
This gives a better chance of propagating the match throughout the fingerprint. The
combination problem is automatically solved because each pair of matched seeds rep-
resents a different region of the participating fingerprints. The results have no conflicts
if the matching extends from one pair of seeds to another pair. Many methods can
be applied to find the optimal matching between the minutiae in the neighborhood
list of two matched seeds.
The extended matching chooses the starting points from the set of seeds, which are the
final result of the validation stage. This approach is more efficient than using all the
possible correspondence pairs as starting points. Given a pair of starting seeds on the
query (I ) and the reference (R) fingerprints, a breadth first search is simultaneously
executed on both fingerprints. Details of the extended matching is outlined in Figure
2.1.9.

CHAPTER 2. MATCHING AND PERFORMANCE EVALUATION FRAMEWORK36
Algorithm: ExtendedMatchInputs : NLq, the array of neighborhood lists of query fingerprint (I )
NLr, the array of neighborhood lists of reference fingerprint (R)SL, the array of seed pairs <sq, sr >
Outputs : M , the array of matched minutiae
Let Mlocal be an array for matched minutia pairs;Let SLflag be a boolean array to indicate if a pair of seeds has been used;Let Maskq be a boolean array to indicate if a minutia on I has found a match;Let Maskr be a boolean array to indicate if a minutia on R has found a match;Let Qq be a queue of minutiae on I that has found matched minutiae on R;Let Qr be a queue of minutiae on R that has found matched minutiae on I ;
Initialize all elements in SLflag, Maskq, and Maskr to false;FOR each seed pair, <sq, sr >, in SL
Insert sq into NLq[sq′ ], ∀sq′ ∈ SL, andsq′ 6= sq;Insert sr into NLr[sr′ ], ∀sr′ ∈ SL, andsr′ 6= sr;
ENDFORFOR <sq, sr > in SL
IF (SLflag[<sq, sr >] == true)CONTINUE;
ENDIFSLflag[<sq, sr >] =true;Qq = sq;Qr = sr;Maskq[sq] =true;Maskr[sr] =true;Mlocal = ;WHILE (Qq is not empty and Qr is not empty)
mq =DEQUEUE(Qq);mr =DEQUEUE(Qr);Find matched neighbors in NLq[mq] and NLr[mr];FOR each matched neighbor pair <mqi, mrj >
IF (Maskq[mqi] ==false and Maskq[mri] ==false)ENQUEUE(mqi);ENQUEUE(mrj);Maskq[mqi] =true;Maskr[mrj ] =true;Add <mqi, mrj > into Mlocal;
ENDIFENDFOR
ENDWHILEIF (SIZEOF(Mlocal) > SIZEOF(M))
M = Mlocal;ENDIF
ENDFORRETURN M ;
Figure 2.1.9: Outlines of proposed extended matching.
Chapter 3
Objective Fingerprint Image
Quality Modeling
3.1 Background
Real-time image quality assessment can greatly improve the accuracy of an AFIS. The
idea is to classify fingerprint images based on their quality and appropriately select
image enhancement parameters for different quality of images. Good quality images
require minor preprocessing and enhancement. Parameters for dry images (low qual-
ity) and wet images (low quality) should be automatically determined. We propose
a methodology of fingerprint image quality classification and automatic parameter
selection for fingerprint enhancement procedures.
Fingerprint image quality is utilized to evaluate the system performance [18, 48, 78,
82], assess enrollment acceptability [83] and improve the quality of databases, and
37
CHAPTER 3. OBJECTIVE FINGERPRINT IMAGE QUALITY MODELING 38
evaluate the performance of fingerprint sensors. Uchida [83] described a method
for fingerprint acceptability evaluation. It computes a spatially changing pattern of
gray level profile along with the frequency pattern of the images. The method uses
only a part of the image - ”observation lines” for feature extraction. It can classify
fingerprint images into two categories. Chen et al. [18] used fingerprint quality indices
in both the frequency domain and spatial domain to predict image enhancement,
feature extraction and matching. They used the FFT power spectrum based on global
features but do not compensate for the effect of image-to-image brightness variations.
Based on the assumption that good quality image blocks possess clear ridge-valley
clarity and have strong Gabor filters responses, Shen et al. [78] computed a bank
of Gabor filter responses for each image block and determined the image quality
with the standard deviations of all the Gabor responses. Hong et al. [32] applied a
sinusoidal wave model to dichotomize fingerprint image blocks into recoverable and
unrecoverable regions. Lim et al. [48] computed the local orientation certainty level
using the ratio of the maximum and minimum eigen values of gradient covariance
matrix and the orientation quality using the orientation flow.
In this chapter, we propose a limited ring-wedge spectral measure to estimate the
global fingerprint image features. We use the inhomogeneity and directional con-
trast to estimate local fingerprint image features. Five quality levels of fingerprint
images are defined. The enhancement parameter selection is based on the quality
classification. Significant improvement in system performance is achieved by using
the proposed methodology. Equal error rate(EER) was observed to drop from 1.82%
to 1.22%.

CHAPTER 3. OBJECTIVE FINGERPRINT IMAGE QUALITY MODELING 39
3.2 Proposed Quality Classification Features
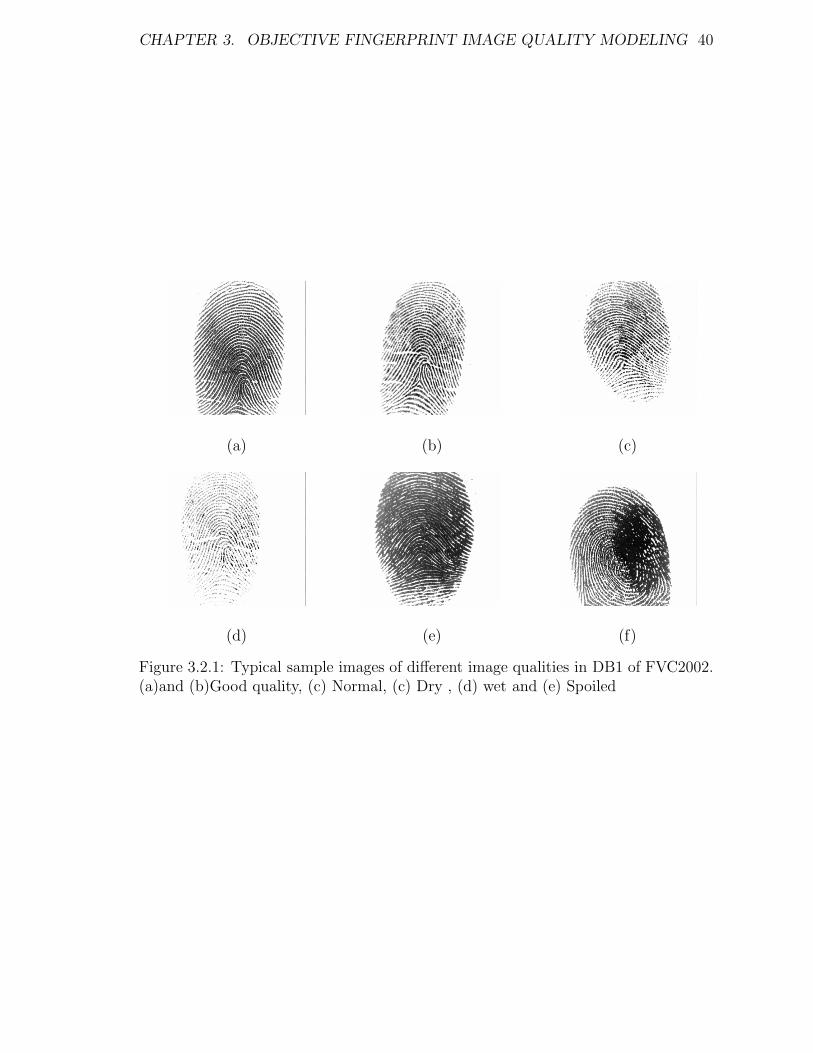
In Figure 3.2.1, sample fingerprint images of different qualities are taken from the
DB1 database of FVC 2002. The dry image blocks with light ridge pixels in finger-
prints are due to either slight pressure or dry skin surface. Smudge image blocks
in the fingerprints are due to wet skin environment, unclean skin surface or heavy
pressure.(Figure 1(c)). Other noise is caused by dirty sensors or damaged fingers.
The following five categories have been defined:
• Level 1- (good) clear ridge/valley contrast; easily-detected ridges; precisely-
located minutiae; easily-segmented.
• Level 2- (normal) Most of the ridges can be detected; ridge and valley contrast
is medium; fair amount of minutiae; possesses some poor quality blocks (dry or
smudge).
• Level 3- (Smudge/Wet) not well-separated ridges.
• Level 4- (Dry/lightly inked) broken ridges; only small part of ridges can be
separated.
• Level 5- (Spoiled) totally corrupted ridges.
3.2.1 Global Quality Measure: Limited Ring-Wedge Spectral
Energy
The images with the directionality pattern of periodic or almost periodic wave can be
represented by the Fourier spectrum [18, 27]. A fingerprint image is a good example
CHAPTER 3. OBJECTIVE FINGERPRINT IMAGE QUALITY MODELING 40
(a) (b) (c)
(d) (e) (f)
Figure 3.2.1: Typical sample images of different image qualities in DB1 of FVC2002.(a)and (b)Good quality, (c) Normal, (c) Dry , (d) wet and (e) Spoiled

CHAPTER 3. OBJECTIVE FINGERPRINT IMAGE QUALITY MODELING 41
of such types of texture. We represented the spectrum with the function S(r, θ),
where r is the radial distance from the origin and θ is the angular variable. Given a
digital image f(x, y), its Fourier transform F (u, v) is defined as:
F (u, v) =
∫
∞
−∞
∫
∞
−∞
f(x, y)e−j2π(ux+vy) dx dy(3.2.1)
|F (u, v)| represents the spectrum of the Fourier transform, and it can be simplified
by expressing in polar coordinates.
In [18], the FFT power spectrum based global feature does not compensate for
the effect of image-to-image brightness variations. It measures the entropy of the
energy distribution of 15 ring features, which are extracted using Butterworth low-
pass filters. We convert S(r, θ) to 1-D function Sθ(r) for each direction, and analyze
Sθ(r) for a fixed angle. Therefore, we can obtain the spectrum profile along a radial
direction from the origin. A global descriptor can be achieved by summing the discrete
variables:
S(r) =
π∑
θ=0
Sθ(r)(3.2.2)
Figure 3.2.2 shows the spectra for a pair of fingerprint images (one has good quality,
the other has low quality) from the same finger. We observe that there exists a char-
acteristic principal peak around the frequency of 40. Based on actual computations
and analysis of sample patterns, we compute the band energy between frequency 30
and frequency 60, which we will call the“limited ring-wedge spectral measure”. The
difference between good quality and low quality images is significant as indicated
by the existence of strong principal feature peak (the highest spectrum close to the
origin is the DC response) and major energy distribution. The new global feature
described above effectively indicates the clear layout of alternate ridge and valley
patterns. However, it still can not classify fingerprint images, which are of predomi-
nantly good quality but contains occasional low quality blocks or those which are of
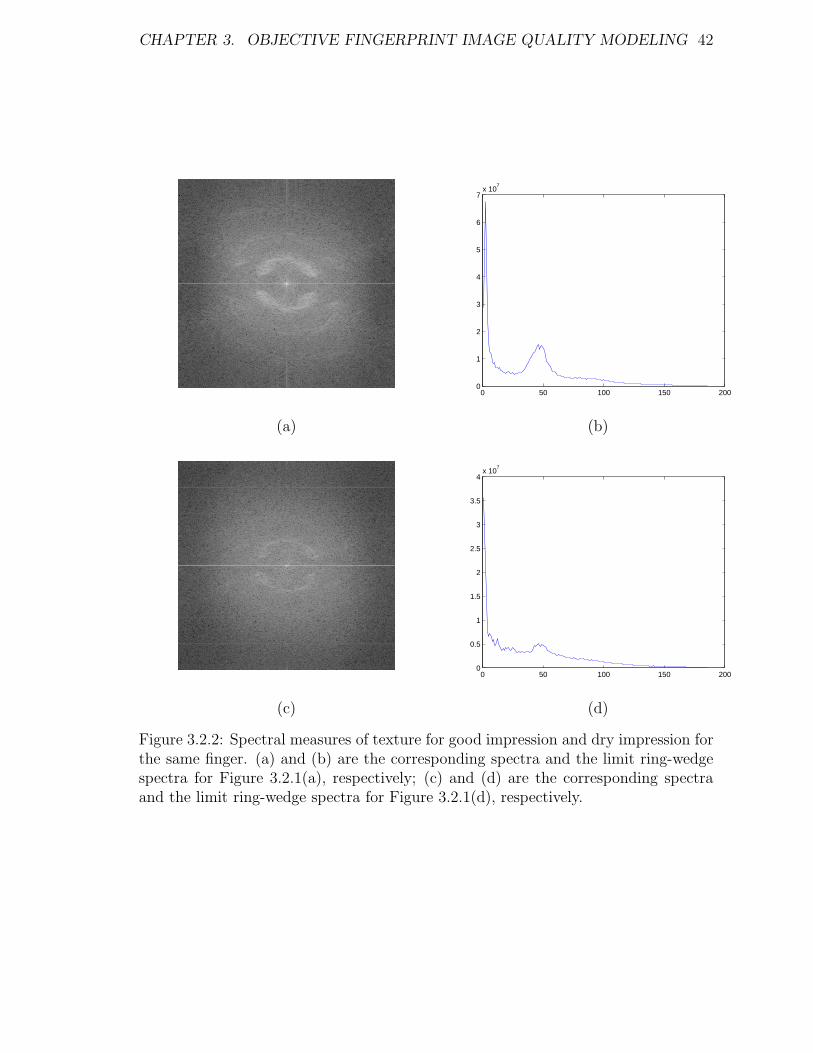
CHAPTER 3. OBJECTIVE FINGERPRINT IMAGE QUALITY MODELING 42
0 50 100 150 2000
1
2
3
4
5
6
7x 10
7
(a) (b)
0 50 100 150 2000
0.5
1
1.5
2
2.5
3
3.5
4x 10
7
(c) (d)
Figure 3.2.2: Spectral measures of texture for good impression and dry impression forthe same finger. (a) and (b) are the corresponding spectra and the limit ring-wedgespectra for Figure 3.2.1(a), respectively; (c) and (d) are the corresponding spectraand the limit ring-wedge spectra for Figure 3.2.1(d), respectively.

CHAPTER 3. OBJECTIVE FINGERPRINT IMAGE QUALITY MODELING 43
predominantly low quality but contain occasional good quality blocks. A statistical
descriptor of the local texture is necessary for such classification of fingerprint images.
3.2.2 Local Quality Measure: Inhomogeneity and directional
contrast
To quantify the local texture of the fingerprint images, statistical properties of the in-
tensity histogram [27] are well suited. Let Ii, L, and h(I) represent gray level intensity,
the number of possible gray level intensities and the histogram of the intensity levels,
respectively. Mean(m), standard deviation(σ), smoothness(R) and uniformity(U) can
be expressed as in equations 3-6. We define the block Inhomogeneity(inH) as the ra-
tio of the product between mean and Uniformity and the product between standard
deviation and smoothness.
m =L−1∑
i=0
Iih(Ii)(3.2.3)
σ =
√
√
√
√
L−1∑
i=0
(Ii − m)2h(Ii)(3.2.4)
R = 1 −1
1 + σ2(3.2.5)
U =L−1∑
i=0
h(Ii)2(3.2.6)
inH =m × U
σ × R(3.2.7)
In [14], low contrast regions map out smudges and lightly-inked areas of the finger-
print. There is very narrow distribution of pixel intensities in a low contrast area.
Thus the low flow maps flags blocks where the DFT analysis could not determine
CHAPTER 3. OBJECTIVE FINGERPRINT IMAGE QUALITY MODELING 44
a significant ridge flow. We used modified the ridge-valley orientation detector [14]
as a measure of local directional contrast. Directional contrast reflects the certainty
of local ridge flow orientation, and identifies damaged regions (Figure 3.2.1(d)). Ac-
cording to [14], for each pixel we calculate the sum of pixel values for 8 directions in
9×9 neighborhood, si. The values of smax and smin correspond to the most probable
directions of white pixels in valleys and black pixels in ridges. We average the values
of ratios smin/smax for block pixels to obtain the measure of directional contrast. By
visual examination we determined the threshold for this average. If the average is
bigger than threshold then the block does not have good directional contrast. The
minutiae, which are detected in these invalid flow areas or those that are located near
the invalid flow areas, are removed as false minutiae.
3.3 Adaptive Preprocessing Method
Fingerprint preprocessing is performed based on the frequency and statistical texture
features described above. In the low quality fingerprint images, the contrast is rel-
atively low, especially for light ridges with broken flows, smudge ridges/valleys, and
noisy background regions. A high peak in the histogram is usually generated for those
areas. Traditional histogram equalization can not perform well in this case. Good
quality originals might even be degraded. An alternative to global histogram equaliza-
tion is local adaptive histogram equalization(AHE) [27]. Local histogram is generated
only at a rectangular grid of points and the mappings for each pixel are generated
by interpolating mappings of the four nearest grid points. AHE, although acceptable
in some cases, tends to amplify the noise in poor contrast areas. This problem can
be reduced effectively by limiting the contrast enhancement to homogeneous areas.
The implementation of contrast limited adaptive histogram equalization(CLAHE) has

CHAPTER 3. OBJECTIVE FINGERPRINT IMAGE QUALITY MODELING 45
been described in [102]. Contrast enhancement is defined as the slope of the function
mapping input intensity to output intensity. CLAHE is performed by restricting the
slope of the mapping function, which is equivalent to clipping the height of the his-
togram. We associate the clip levels of contrast enhancement with the image quality
levels, which are classified using the proposed global and local image characteristic
features. We define a block as a good block when the Inhomogeneity(inH) is less
than 10 and average contrast(σ) is greater than 50 (See Fig 3.3.1). A block is defined
as wet block if the product of its mean(m) and standard deviation(σ) is less than a
threshold. A block is defined as dry block if its mean greater than a threshold, its
average contrast is between 20 and 50, and the ratio of its mean and average contrast
is greater than 5, and the ratio of its uniformity(U) and smoothness(R) is greater
than 20.
• If the percentage of the blocks with very low directional contrast is above 30%,
the image is classified as level 5. The margin of background can be excluded
for consideration because the average gray level of blocks in the background is
higher.
• If the limited ring-wedge spectral energy is below a threshold Sl, and the per-
centage of the good blocks, which are classified using Inhomogeneity and direc-
tional contrast, is below 30%, the image is classified as level 4. If the percentage
of dry blocks is above 30% then it is level 3 if the percentage of wet blocks is
above 30%;
• The images of level 1 possess high limited ring-wedge spectral energy and more
than 75% good blocks. The images of level 2 have medium limited ring-wedge
spectral energy and less than 75% good blocks.

CHAPTER 3. OBJECTIVE FINGERPRINT IMAGE QUALITY MODELING 46
(a) (b) (c)
Figure 3.3.1: Inhomogeneity(inH)values for different quality fingerprint blocks,(a)good block sample with inH of 0.1769 and standard deviation(σ) of 71.4442, (b)wet block sample with inH of 2.0275 and standard deviation(σ) of 29.0199, and (c)dry block sample with inH of 47.1083 and standard deviation(σ) of 49.8631.
Based on our experiments, exponential distribution is used as the desired histogram
shape (see equation (8)). Assume that f and g are input and output variables, respec-
tively, gmin is minimum pixel value, Pf(f) is the cumulative probability distribution,
and Hf(m) represents the histogram for the m level.
g = gmin −1
αln(1 − Pf(f))(3.3.1)
Pf(f) =
f∑
m=0
Hf(m)(3.3.2)
3.4 Experiments
Our methodology has been tested on FVC2002 DB1, which consists of 800 finger-
print images (100 distinct fingers, 8 impressions each). Image size is 374 × 388 and
the resolution is 500 dpi. To evaluate the methodology of correlating preprocessing
parameter selections to the fingerprint image characteristic features, we modified the
Gabor-based fingerprint enhancement algorithm [32] with adaptive enhancement of
high-curvature regions. Minutiae are detected using chaincode-based contour trac-
ing. In Figure 3.4, enhanced image of low quality image shown in Figure 3.2.1(d)
CHAPTER 3. OBJECTIVE FINGERPRINT IMAGE QUALITY MODELING 47
(a) (b)
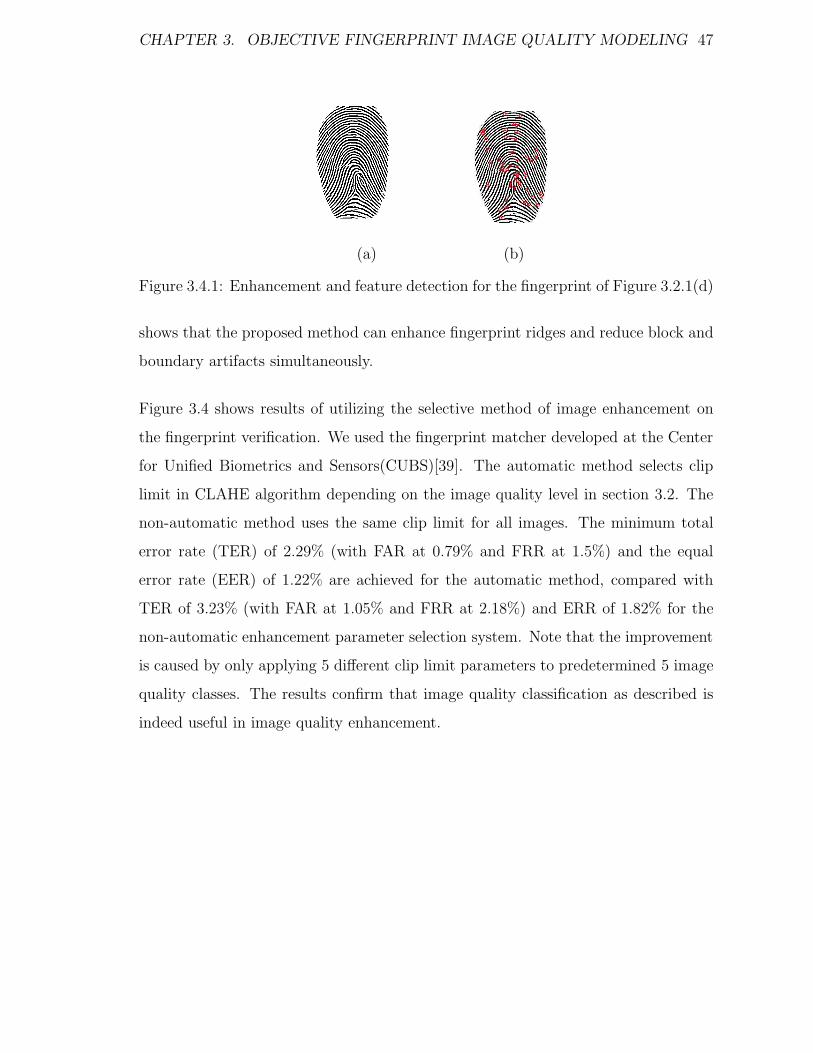
Figure 3.4.1: Enhancement and feature detection for the fingerprint of Figure 3.2.1(d)
shows that the proposed method can enhance fingerprint ridges and reduce block and
boundary artifacts simultaneously.
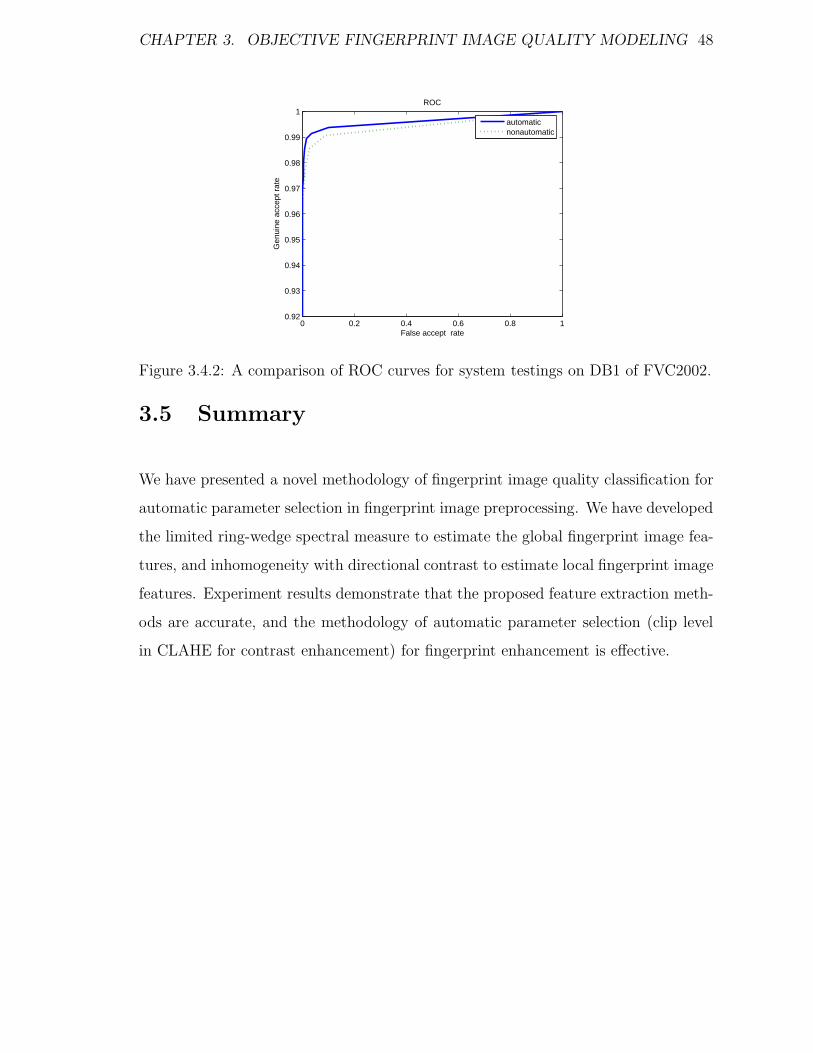
Figure 3.4 shows results of utilizing the selective method of image enhancement on
the fingerprint verification. We used the fingerprint matcher developed at the Center
for Unified Biometrics and Sensors(CUBS)[39]. The automatic method selects clip
limit in CLAHE algorithm depending on the image quality level in section 3.2. The
non-automatic method uses the same clip limit for all images. The minimum total
error rate (TER) of 2.29% (with FAR at 0.79% and FRR at 1.5%) and the equal
error rate (EER) of 1.22% are achieved for the automatic method, compared with
TER of 3.23% (with FAR at 1.05% and FRR at 2.18%) and ERR of 1.82% for the
non-automatic enhancement parameter selection system. Note that the improvement
is caused by only applying 5 different clip limit parameters to predetermined 5 image
quality classes. The results confirm that image quality classification as described is
indeed useful in image quality enhancement.
CHAPTER 3. OBJECTIVE FINGERPRINT IMAGE QUALITY MODELING 48
0 0.2 0.4 0.6 0.8 10.92
0.93
0.94
0.95
0.96
0.97
0.98
0.99
1ROC
False accept rate
Gen
uine
acc
ept r
ate
automaticnonautomatic
Figure 3.4.2: A comparison of ROC curves for system testings on DB1 of FVC2002.
3.5 Summary
We have presented a novel methodology of fingerprint image quality classification for
automatic parameter selection in fingerprint image preprocessing. We have developed
the limited ring-wedge spectral measure to estimate the global fingerprint image fea-
tures, and inhomogeneity with directional contrast to estimate local fingerprint image
features. Experiment results demonstrate that the proposed feature extraction meth-
ods are accurate, and the methodology of automatic parameter selection (clip level
in CLAHE for contrast enhancement) for fingerprint enhancement is effective.
Chapter 4
Robust Fingerprint Segmentation
A critical step in automatic fingerprint recognition is the accurate segmentation of
fingerprint images. The objective of fingerprint segmentation is to decide which part
of the image belongs to the foreground, which is of our interest for extracting fea-
tures for recognition and identification, and which part belongs to the background,
which is the noisy area around the boundary of the image. Unsupervised algorithms
extract blockwise features. Supervised methods usually first extract point features
like coherence, average gray level, variance and Gabor response, then a simple lin-
ear classifier is chosen for classification. This method provides accurate results, but
its computational complexity is higher than most unsupervised methods. We pro-
pose using Harris corner point features to discriminate foreground and background.
Around a corner point, shifting a window in any direction should give a large change
in intensity. We found that the strength of the Harris point in the fingerprint area
is much higher than that of Harris point in background area. Some Harris points
in noisy blobs might have higher strength, but it can be filtered as outliers using
the corresponding Gabor response. The experimental results prove the efficiency and
49
CHAPTER 4. ROBUST FINGERPRINT SEGMENTATION 50
accuracy of this new method.
Segmentation in low quality images is challenging. The first problem is the presence of
noise that results from dust and grease on the surface of live-scan fingerprint scanners.
The second problem is false traces which remain in the previous image acquisition.
The third problem is low contrast fingerprint ridges generated through inconsistent
contact, dry/wet finger surface. The fourth problem is the presence of an indistinct
boundary if the features in the fixed size of window are used. Finally, that is the
problem of segmentation features being sensitive to the quality of image.
Accurate segmentation of fingerprint images influences directly the performance of
minutiae extraction. If more background areas are included in the segmented finger-
print of interest, more false features are introduced; If some parts of the foreground
are excluded, useful feature points may be missed. We have developed a new unsu-
pervised segmentation method.
4.1 Features for Fingerprint Segmentation
Feature selection is the first step in designing the fingerprint segmentation algo-
rithm. There are two types of features used for fingerprint segmentation, i.e., block
features and pointwise features. In [8, 44], selected point features include local
mean, local variance, standard deviation, and Gabor response of the fingerprint im-
age. Local mean is calculated as Mean =∑
w I, local variance is calculated as
V ar =∑
w(I −Mean)2, where w is the window size centered on the processed pixel.
The Gabor response is the smoothed sum of Gabor energies for eight Gabor filter re-
sponses. Usually the Gabor response is higher in the foreground region than that in

CHAPTER 4. ROBUST FINGERPRINT SEGMENTATION 51
the background region. The coherence feature indicates the strength of the local win-
dow gradients centered on the processed point along the same dominant orientation.
Usually the coherence is also higher in the foreground than in the background, but
it may be influenced significantly by boundary signal and noise. Therefore, a single
coherence feature is not sufficient for robust segmentation. Systematic combination
of those features is necessary.
Coh =|∑
w(Gs,x, Gs,y)|
|∑
w(Gs,x, Gs,y)|=
√
(Gxx − Gyy)2 + 4G2xy
Gxx + Gyy(4.1.1)
Because pointwise-based segmentation method is time consuming, blockwise features
are usually used in the commercial automatic fingerprint recognition systems. Block
mean, block standard deviation, block gradient histogram [53, 52], block average
magnitude of the gradient [49] are some common features used for fingerprint seg-
mentation. In [17], gray-level pixel intensity-derived feature called block clusters
degree(CluD) has been introduced. CluD measures how well the ridge pixels are
clustered.
CluD =∑
i,j∈block
sign(Iij , Imgmean)sign(Dij, ThreCluD) (4.1.2)
Where,
Dij =
i+2∑
m=i−2
j+2∑
n=j−2
sign(Imn, Imgmean) (4.1.3)
sign(x, y) =
1 if x < y;
0 otherwise.(4.1.4)
Imgmean is the gray-level intensity mean of the whole image, and ThreCluD is an
empirical parameter.
Texture features, such as Fourier spectrum energy [61], Gabor feature [78, 4] and
Gaussian-Hermite Moments [86], have been also applied to fingerprint segmenta-
tion. Ridges and valleys in a fingerprint image are generally observed to possess

CHAPTER 4. ROBUST FINGERPRINT SEGMENTATION 52
a sinusoidal-shaped plane wave with a well-defined frequency and orientation [32],
whereas non-ridge regions does not conform to this surface wave model. In the areas
of background and noise, it is assumed that there is very little structure and hence
very little energy content in the Fourier spectrum. Each value of the energy image
E(x,y) indicates the energy content of the corresponding block. The fingerprint re-
gion may be differentiated from the background by thresholding the energy image.
The logarithm values of the energy are used to convert the large dynamic range to
a linear scale(Equation 4.1.5). A region mask is obtained by thresholding E(x, y).
However, uncleaned trace finger ridges and straight stripes are often get in the regions
of interest (Figure 4.1.1(c)).
E(x, y) = log
∫
r
∫
θ
|F (r, θ)|2
(4.1.5)
Gabor filter-based segmentation algorithm is a popularly used method [4, 78]. An
even symmetric Gabor filter has the following spatial form:
g(x, y, θ, f, σx, σy) = exp−1
2[x2
θ
σ2x
+y2
θ
σ2y
]cos(2πfxθ) (4.1.6)
For each block of size W × W centered at (x,y), 8 directional Gabor features are
computed for each block, and the standard deviation of the 8 Gabor features is used
for segmentation. The formula for calculating the magnitude of the Gabor feature is
defined as,
G(X, Y, θ, f, σx, σy) =
∣
∣
∣
∣
∣
∣
(w/2)−1∑
x0=−w/2
(w/2)−1∑
y0=−w/2
I(X + x0, Y + y0)g(x0, y0, θ, f, σx, σy)
∣
∣
∣
∣
∣
∣
(4.1.7)
However, fingerprint images with low contrast, false traces, and noisy complex back-
ground can not be segmented correctly by the Gabor filter-based method(Figure
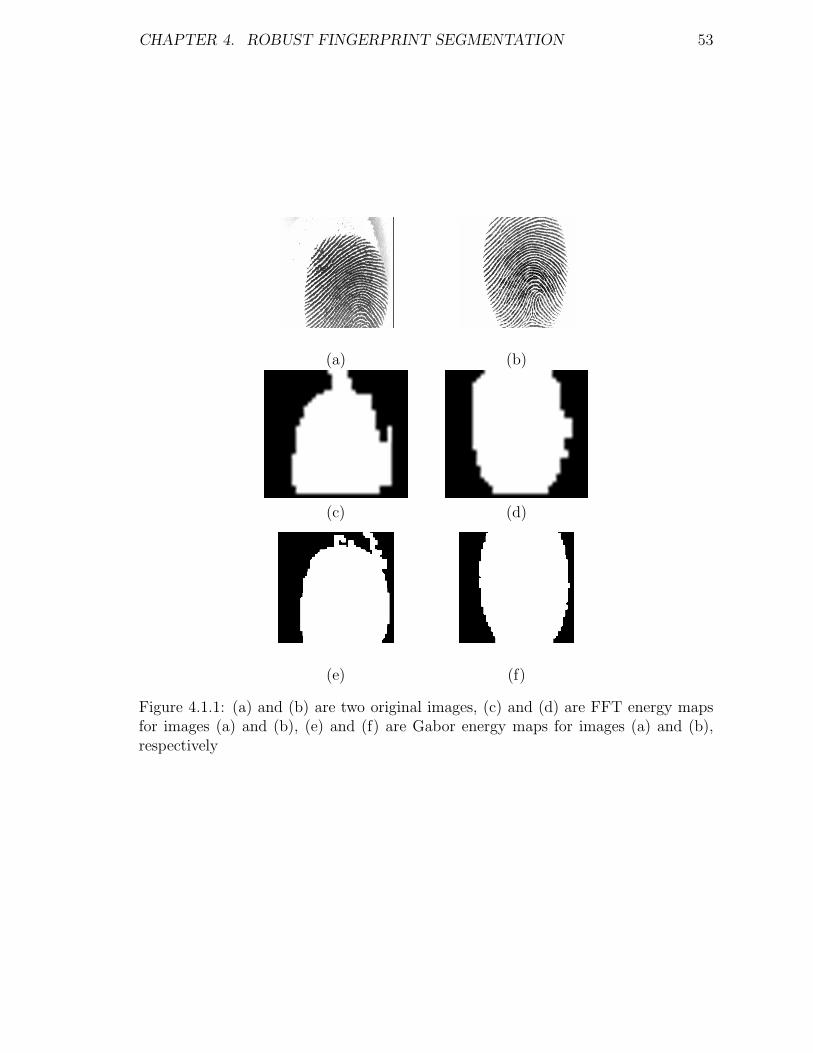
CHAPTER 4. ROBUST FINGERPRINT SEGMENTATION 53
(a) (b)
(c) (d)
(e) (f)
Figure 4.1.1: (a) and (b) are two original images, (c) and (d) are FFT energy mapsfor images (a) and (b), (e) and (f) are Gabor energy maps for images (a) and (b),respectively

CHAPTER 4. ROBUST FINGERPRINT SEGMENTATION 54
4.1.1(e)).
In [71], similarity is found between Hermite moments and Gabor filter. Gaussian-
Hermite Moments have been successfully used to segment fingerprint image in [86].
Orthogonal moments use orthogonal polynomials as transform kernels and produce
minimal information redundancy, Gaussian Hermite Moments(GHM) can represent
local texture features with minimal noise effect. The nth order Gaussian-filter smoothed
Hermite moments of one-dimension signal S(x) is defined as:
Hn(x, S(x)) =
∫ +∞
−∞
Bn(t)S(x + t) dt (4.1.8)
Where
Bn(t) = g(t, σ)Pn(t/σ) (4.1.9)
Where Pn(t/σ) is scaled Hermite polynomial function of order n, defined as
Pn(t) = (−1)net2(dn
dtn)e−t2 (4.1.10)
g(x, σ) = (2πσ2)−1
2 e−x2
2σ2 (4.1.11)
Similarly, 2D orthogonal GHM with order(p,q) can be defined as follows,
Hn(x, y, I(x, y)) =
∫ +∞
−∞
∫ +∞
−∞
g(t, v, σ)Hp,q(t
σ,t
σ)I(x + t, y + v) dtdv (4.1.12)
Where g(t, v, σ) is 2D Gaussian filter, Hp,q(tσ, t
σ) is the scaled 2D Hermite polynomial
of order (p, q).
4.2 Unsupervised Methods
Unsupervised algorithms extract blockwise features such as local histogram of ridge
orientation [52, 53], gray-level variance, magnitude of the gradient in each image
CHAPTER 4. ROBUST FINGERPRINT SEGMENTATION 55
block [70], Gabor feature [4, 8]. In practice, the presence of noise, low contrast area,
and inconsistent contact of a fingertip with the sensor may result in loss of minutiae
or more spurious minutiae.
4.3 Supervised Methods
Supervised method usually first extract several features like coherence, average gray
level, variance and Gabor response [8, 44, 61, 101], then a supervised machine learning
algorithm, such as a simple linear classifier [8], Hidden Markov Model(HMM) [44],
Neural Network [61, 101], is chosen for classification. This method provides accurate
results, but its computational complexity is higher than most unsupervised methods,
and needs time-intensive training, and possibly faces overfitting problems due to
presence of various noises.
4.4 Evaluation Metrics
Visual inspection can provide qualitative evaluation of fingerprint segmentation re-
sult. More strict objective evaluation method is indispensable to assess quantita-
tively segmentation algorithms. Let R1 represents standard segmentation pattern by
a fingerprint expert. Let R2 represent segmentation results by proposed automatic
segmentation algorithms. In pixel levels, two metrics: correct percentage(CP) and
mistaken percentage(MP) can be defined as follows:
CP =Region(R1 ∩ R2)
Region(R1)(4.4.1)
MP =Region(R1 − R2)
Region(R1)(4.4.2)
CHAPTER 4. ROBUST FINGERPRINT SEGMENTATION 56
Another quantitative evaluation method is based on minutiae extraction accuracy [8].
Our proposed minutiae extraction is applied to a fingerprint image segmented by a
human fingerprint expert and to that segmented by our algorithm. The number of
false and missed minutiae are counted for comparison.
4.5 Proposed Segmentation Methods
We propose using Harris corner point features [29, 54] to discriminate between fore-
ground and background. The Harris corner detector was developed originally as
features for motion tracking. It can reduce significantly the amount of computation
compared to the processing of tracking every pixel. It is translation and rotation in-
variant but not scale invariant. Around the corner, shifting a window in any direction
should give a large change in intensity. We also found that the strength of a Harris
point in the fingerprint area is much higher than that of a Harris point in the back-
ground area. Some Harris points in noisy blobs might have higher strength, but can
be filtered as outliers using corresponding Gabor response. Our experimental results
prove the efficiency and accuracy of this new method with markedly higher perfor-
mance than those of previously described methods. Corner points provide repeatable
points for matching, so some efficient methods have been designed [29, 54]. At a
corner, gradient is ill defined, so edge detectors perform poorly. In the region around
a corner, gradient has two or more different values. The corner point can be easily
recognized by examg a small window. Shifting the window around the corner point
in any direction should give a large change in gray-level intensity, and no obvious
change can be detected in “flat” regions and along the edge direction.
Given a point I(x,y), and a shift(∆x, ∆y), the auto-correlation function E is defined

CHAPTER 4. ROBUST FINGERPRINT SEGMENTATION 57
as:
E(x, y) =∑
w(x,y)
[I(xi, yi) − I(xi + ∆x, yi + ∆y)]2 (4.5.1)
and w(x,y)is window function centered on image point(x,y). For a small shift[∆x,∆y],
the shifted image is approximated by a Taylor expansion truncated to the first order
terms,
I(xi + ∆x, yi + ∆y) ≈ I(xi, yi) + [Ix(xi, yi)Iy(xi, yi)]
∆x
∆y
(4.5.2)
where Ix(xi, yi) and Iy(xi, yi) denote the partial derivatives w.r.t x and y, respectively.
Substituting approximation Equation 4.5.2 into Equation 4.5.1 yields,
E(x, y) =∑
w(x,y)[I(xi, yi) − I(xi + ∆x, yi + ∆y)]2
=∑
w(x,y)
I(xi, yi) − I(xi, yi) − [Ix(xi, yi)Iy(xi, yi)]
∆x
∆y
2
=∑
w(x,y)
−[Ix(xi, yi)Iy(xi, yi)]
∆x
∆y
2
=∑
w(x,y)
[Ix(xi, yi)Iy(xi, yi)]
∆x
∆y
2
= [∆x, ∆y]
∑
w(Ix(xi, yi))2
∑
w Ix(xi, yi)Iy(xi, yi)∑
w Ix(xi, yi)Iy(xi, yi)∑
w(Iy(xi, yi))2
∆x
∆y
= [∆x, ∆y]M(x, y)
∆x
∆y
(4.5.3)
That is,
E(∆x, ∆y) = [∆x, ∆y]M(x, y)
∆x
∆y
(4.5.4)
where M(x,y) is a 2×2 matrix computed from image derivatives, called auto-correlation

CHAPTER 4. ROBUST FINGERPRINT SEGMENTATION 58
Figure 4.5.1: Eigenvalues analysis of autocorrelation matrix.
matrix which captures the intensity structure of the local neighborhood.
M =∑
x,y
w(x, y)
(Ix(xi, yi))2 Ix(xi, yi)Iy(xi, yi)
Ix(xi, yi)Iy(xi, yi) (Iy(xi, yi))2
(4.5.5)
4.5.1 Strength of Harris-corner points of a Fingerprint Image
In order to detect intensity change in shift window, eigen value analysis of autocor-
relation matrix M can classify image points. Let λ1λ2 be the eigenvalues of auto-
correlation matrix M, and autocorrelation function E(∆x, ∆y) with the ellipse shape
constant. Figure 4.5.1 shows the local analysis.
In order to detect interest points, the original measure of corner response in [29] is :
R =det(M)
Trace(M)=
λ1λ2
λ1 + λ2
(4.5.6)
The auto-correlation matrix (M) captures the structure of the local neighborhood.
Based on eigenvalues(λ1, λ2) of M, interest points are located where there are two
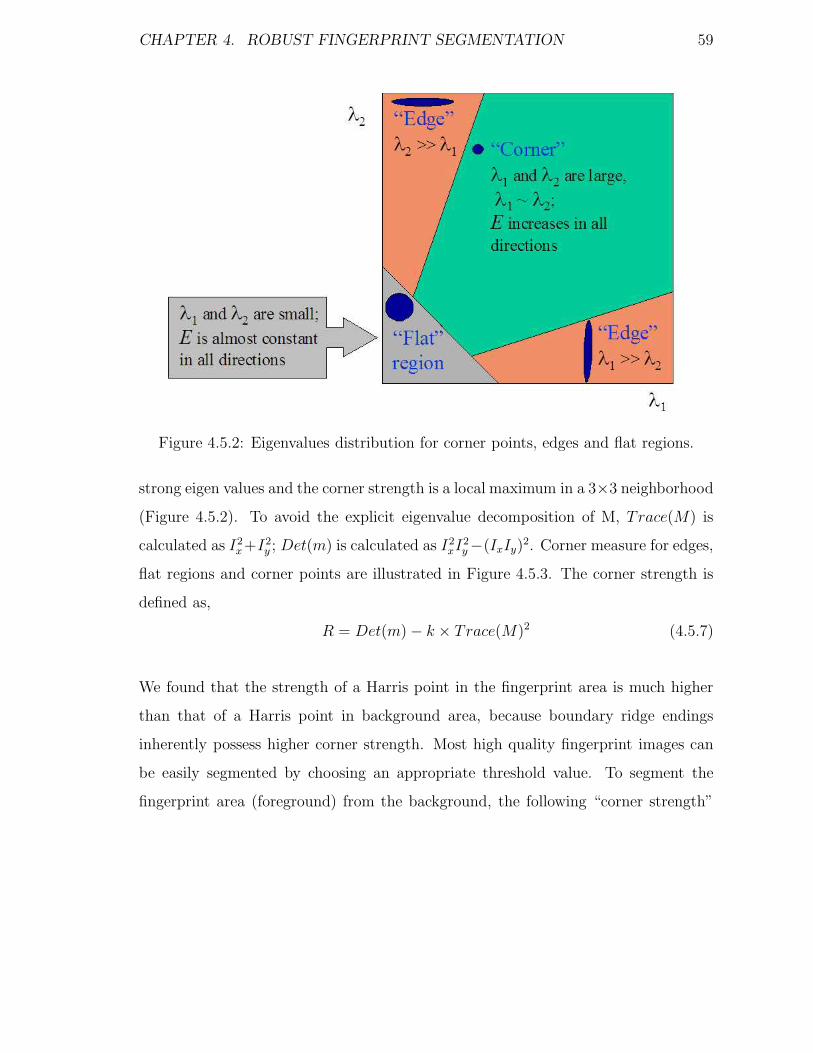
CHAPTER 4. ROBUST FINGERPRINT SEGMENTATION 59
Figure 4.5.2: Eigenvalues distribution for corner points, edges and flat regions.
strong eigen values and the corner strength is a local maximum in a 3×3 neighborhood
(Figure 4.5.2). To avoid the explicit eigenvalue decomposition of M, Trace(M) is
calculated as I2x+I2
y ; Det(m) is calculated as I2xI2
y −(IxIy)2. Corner measure for edges,
flat regions and corner points are illustrated in Figure 4.5.3. The corner strength is
defined as,
R = Det(m) − k × Trace(M)2 (4.5.7)
We found that the strength of a Harris point in the fingerprint area is much higher
than that of a Harris point in background area, because boundary ridge endings
inherently possess higher corner strength. Most high quality fingerprint images can
be easily segmented by choosing an appropriate threshold value. To segment the
fingerprint area (foreground) from the background, the following “corner strength”
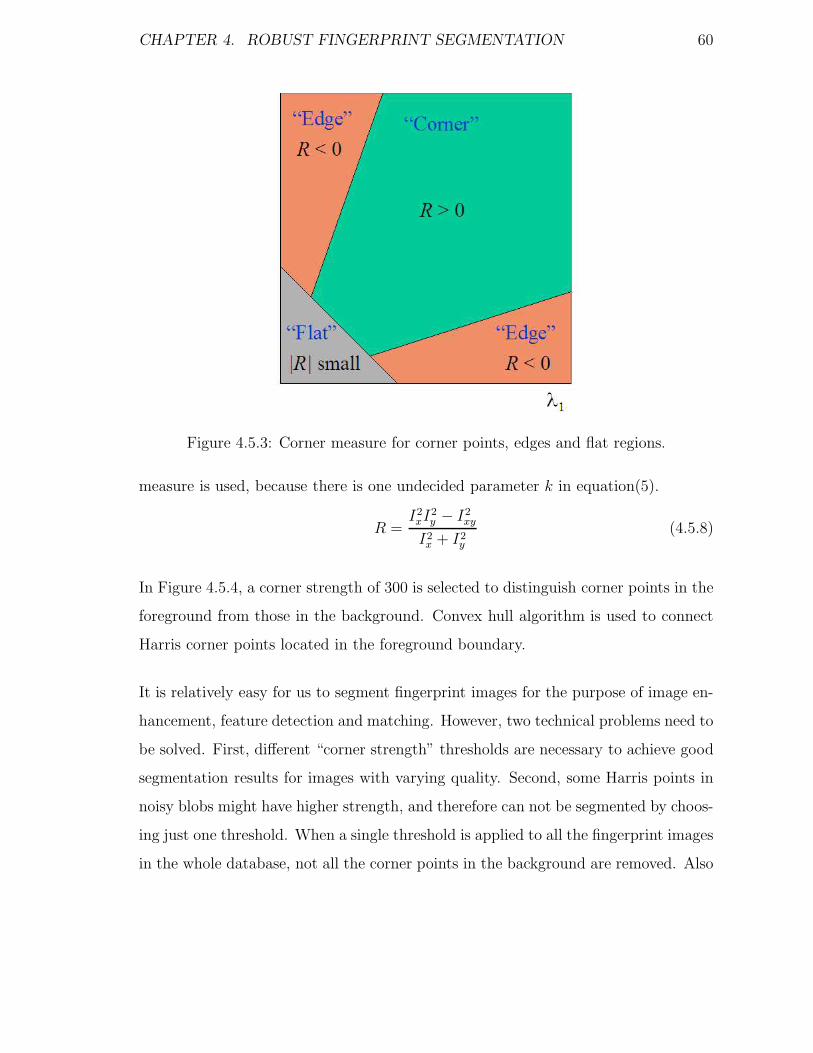
CHAPTER 4. ROBUST FINGERPRINT SEGMENTATION 60
Figure 4.5.3: Corner measure for corner points, edges and flat regions.
measure is used, because there is one undecided parameter k in equation(5).
R =I2xI
2y − I2
xy
I2x + I2
y
(4.5.8)
In Figure 4.5.4, a corner strength of 300 is selected to distinguish corner points in the
foreground from those in the background. Convex hull algorithm is used to connect
Harris corner points located in the foreground boundary.
It is relatively easy for us to segment fingerprint images for the purpose of image en-
hancement, feature detection and matching. However, two technical problems need to
be solved. First, different “corner strength” thresholds are necessary to achieve good
segmentation results for images with varying quality. Second, some Harris points in
noisy blobs might have higher strength, and therefore can not be segmented by choos-
ing just one threshold. When a single threshold is applied to all the fingerprint images
in the whole database, not all the corner points in the background are removed. Also
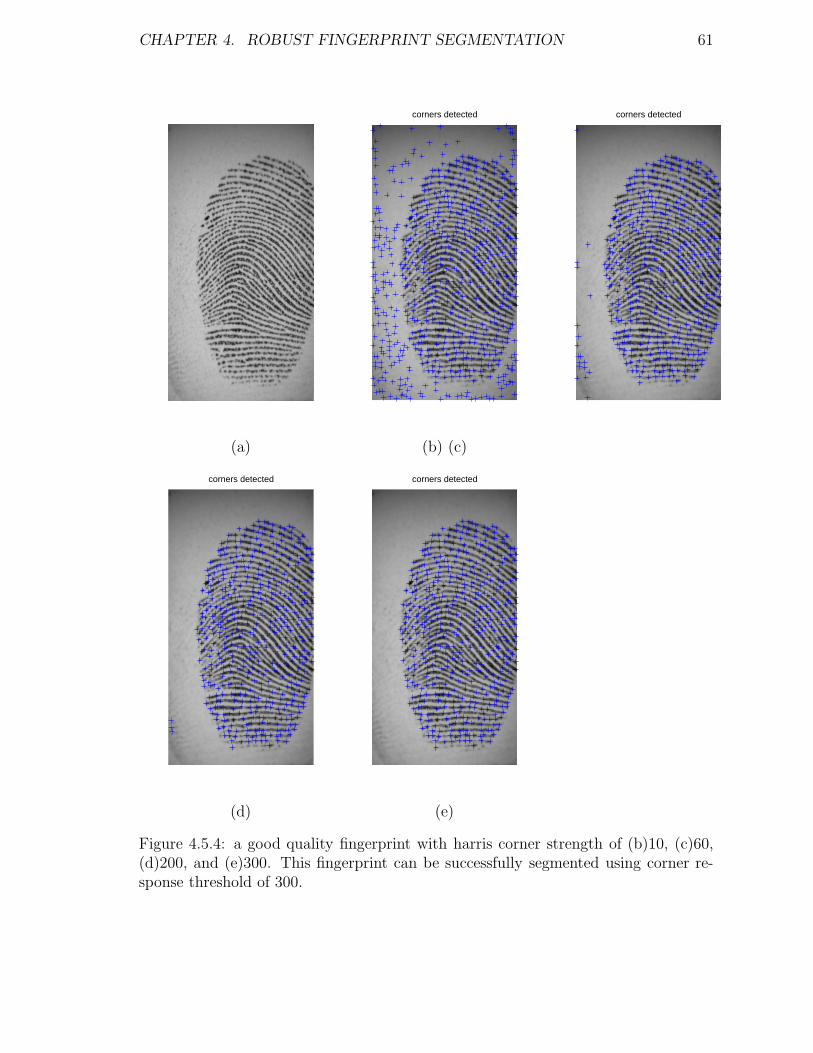
CHAPTER 4. ROBUST FINGERPRINT SEGMENTATION 61
corners detected corners detected
(a) (b) (c)
corners detected corners detected
(d) (e)
Figure 4.5.4: a good quality fingerprint with harris corner strength of (b)10, (c)60,(d)200, and (e)300. This fingerprint can be successfully segmented using corner re-sponse threshold of 300.
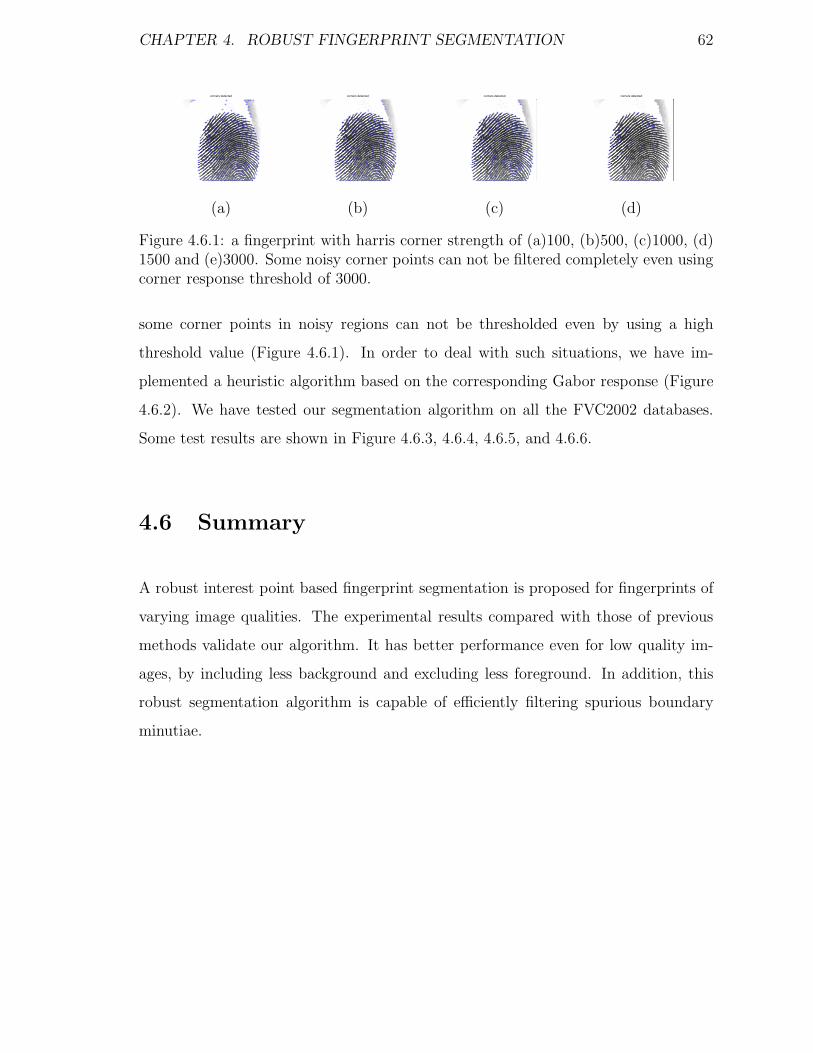
CHAPTER 4. ROBUST FINGERPRINT SEGMENTATION 62
corners detected corners detected corners detected corners detected
(a) (b) (c) (d)
Figure 4.6.1: a fingerprint with harris corner strength of (a)100, (b)500, (c)1000, (d)1500 and (e)3000. Some noisy corner points can not be filtered completely even usingcorner response threshold of 3000.
some corner points in noisy regions can not be thresholded even by using a high
threshold value (Figure 4.6.1). In order to deal with such situations, we have im-
plemented a heuristic algorithm based on the corresponding Gabor response (Figure
4.6.2). We have tested our segmentation algorithm on all the FVC2002 databases.
Some test results are shown in Figure 4.6.3, 4.6.4, 4.6.5, and 4.6.6.
4.6 Summary
A robust interest point based fingerprint segmentation is proposed for fingerprints of
varying image qualities. The experimental results compared with those of previous
methods validate our algorithm. It has better performance even for low quality im-
ages, by including less background and excluding less foreground. In addition, this
robust segmentation algorithm is capable of efficiently filtering spurious boundary
minutiae.
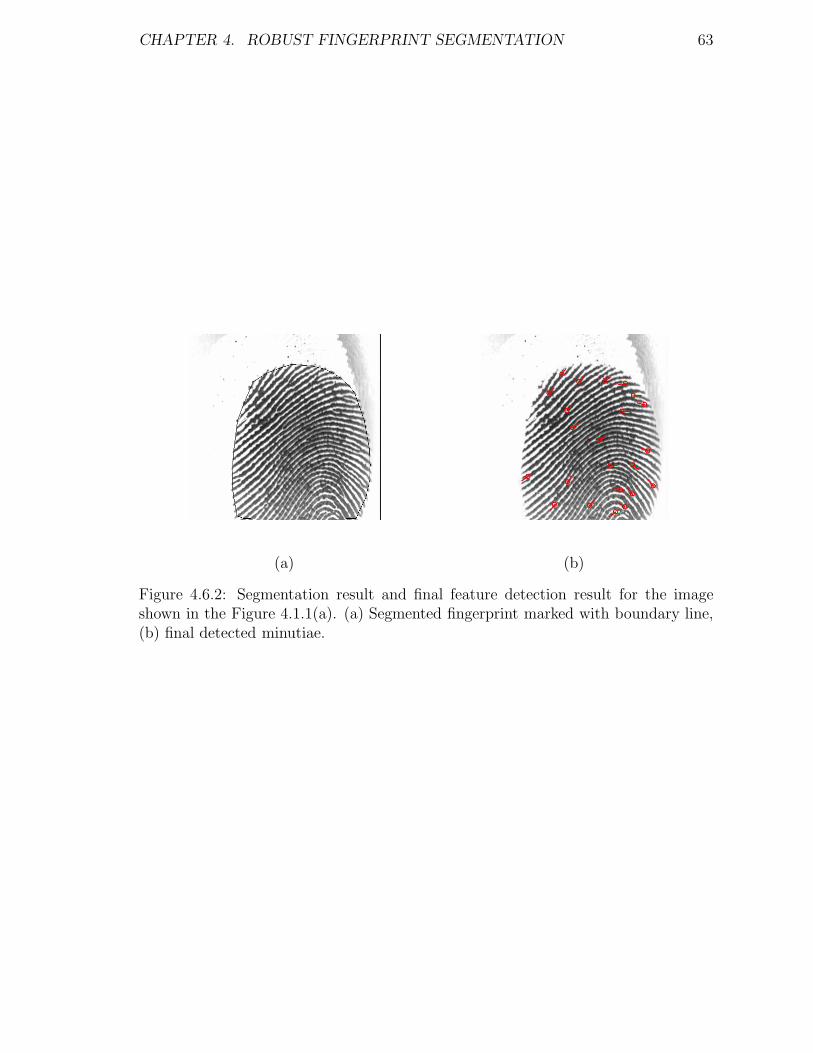
CHAPTER 4. ROBUST FINGERPRINT SEGMENTATION 63
(a) (b)
Figure 4.6.2: Segmentation result and final feature detection result for the imageshown in the Figure 4.1.1(a). (a) Segmented fingerprint marked with boundary line,(b) final detected minutiae.
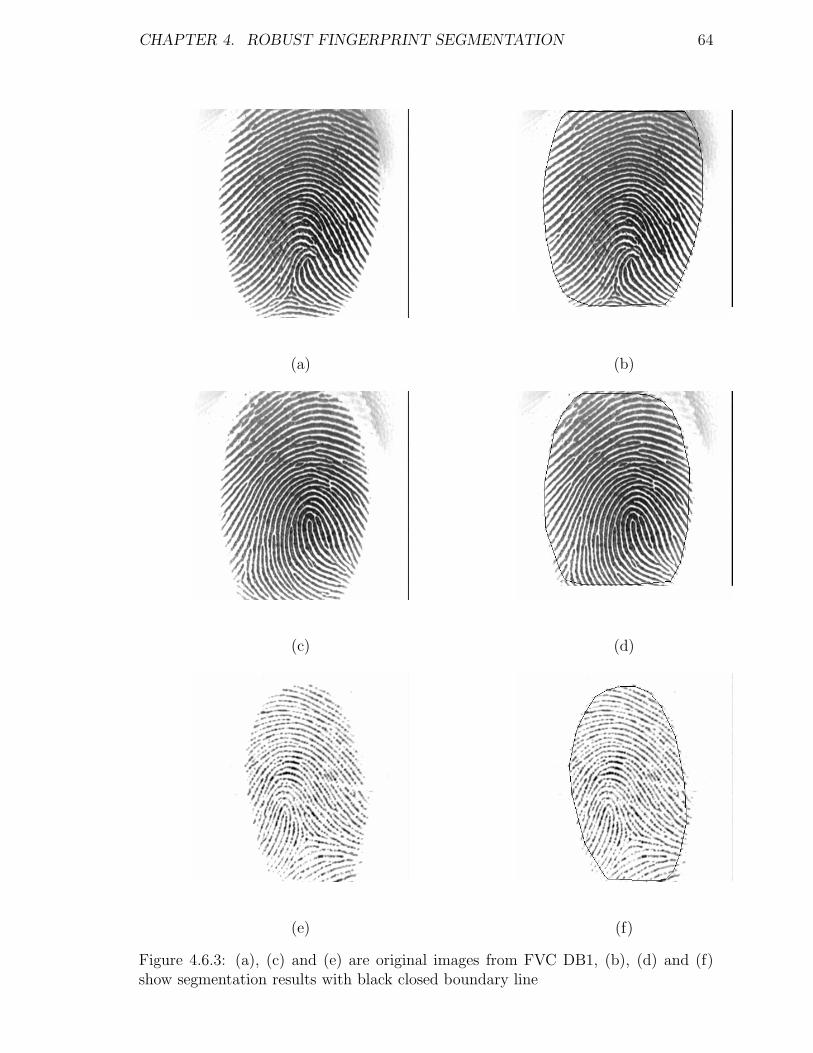
CHAPTER 4. ROBUST FINGERPRINT SEGMENTATION 64
(a) (b)
(c) (d)
(e) (f)
Figure 4.6.3: (a), (c) and (e) are original images from FVC DB1, (b), (d) and (f)show segmentation results with black closed boundary line
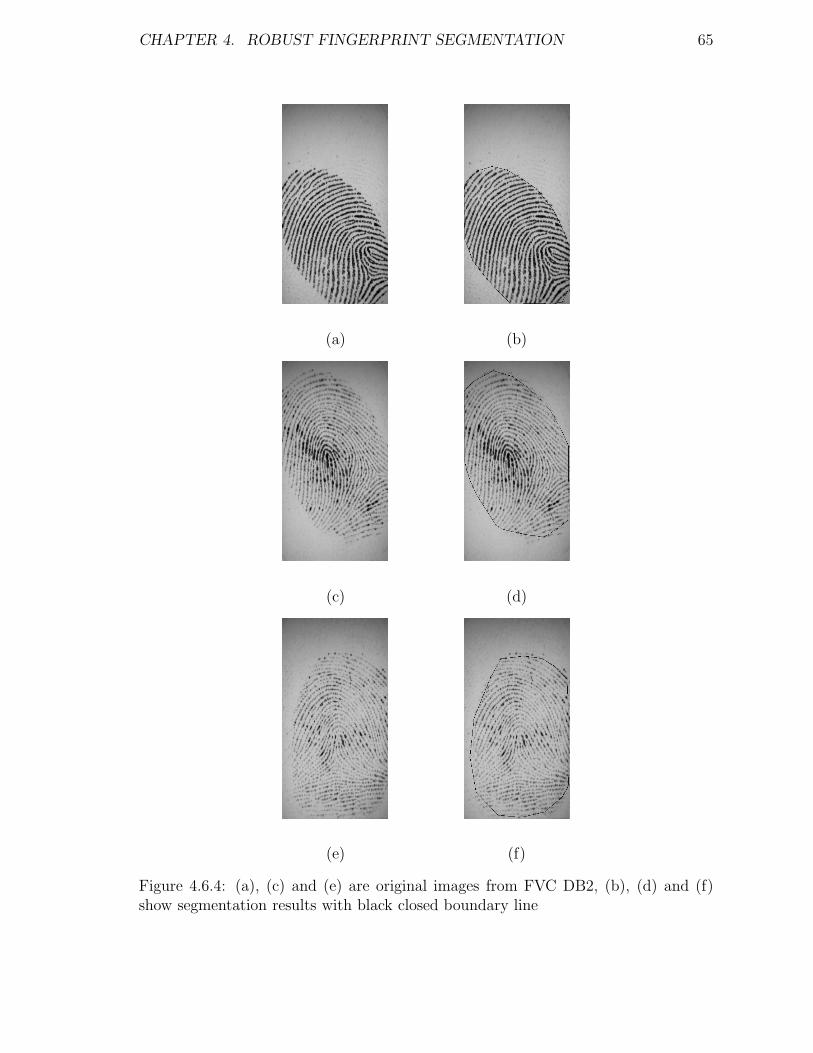
CHAPTER 4. ROBUST FINGERPRINT SEGMENTATION 65
(a) (b)
(c) (d)
(e) (f)
Figure 4.6.4: (a), (c) and (e) are original images from FVC DB2, (b), (d) and (f)show segmentation results with black closed boundary line
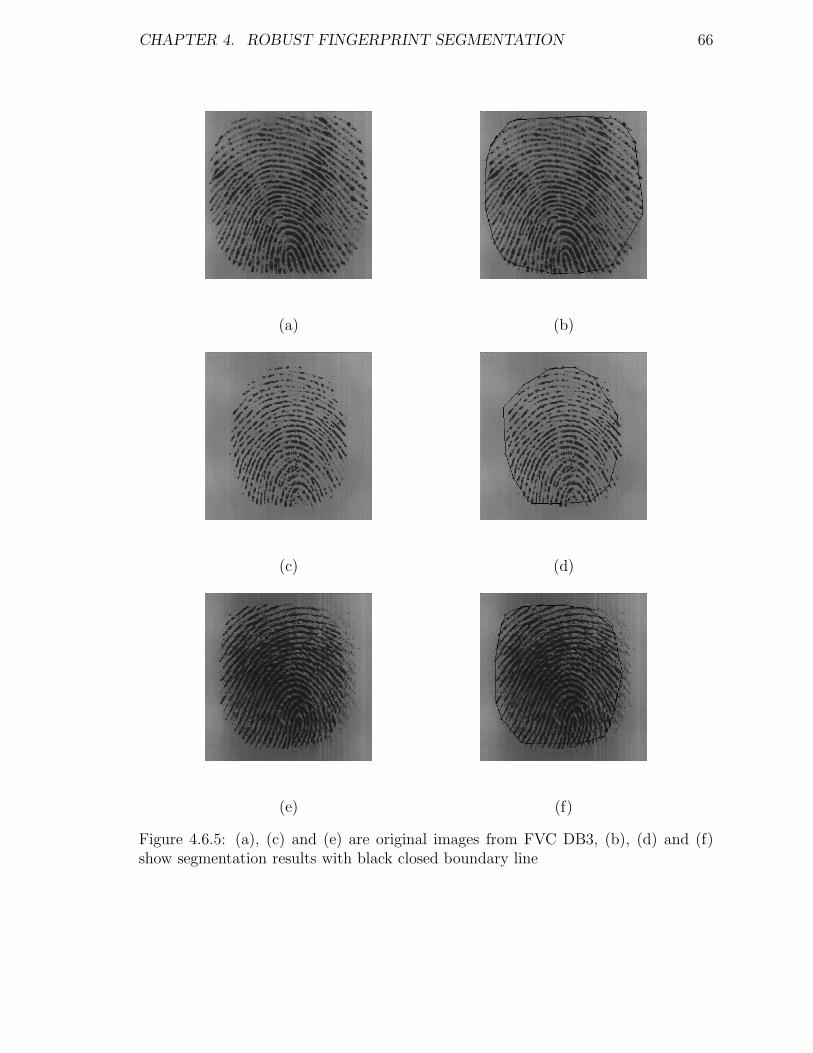
CHAPTER 4. ROBUST FINGERPRINT SEGMENTATION 66
(a) (b)
(c) (d)
(e) (f)
Figure 4.6.5: (a), (c) and (e) are original images from FVC DB3, (b), (d) and (f)show segmentation results with black closed boundary line
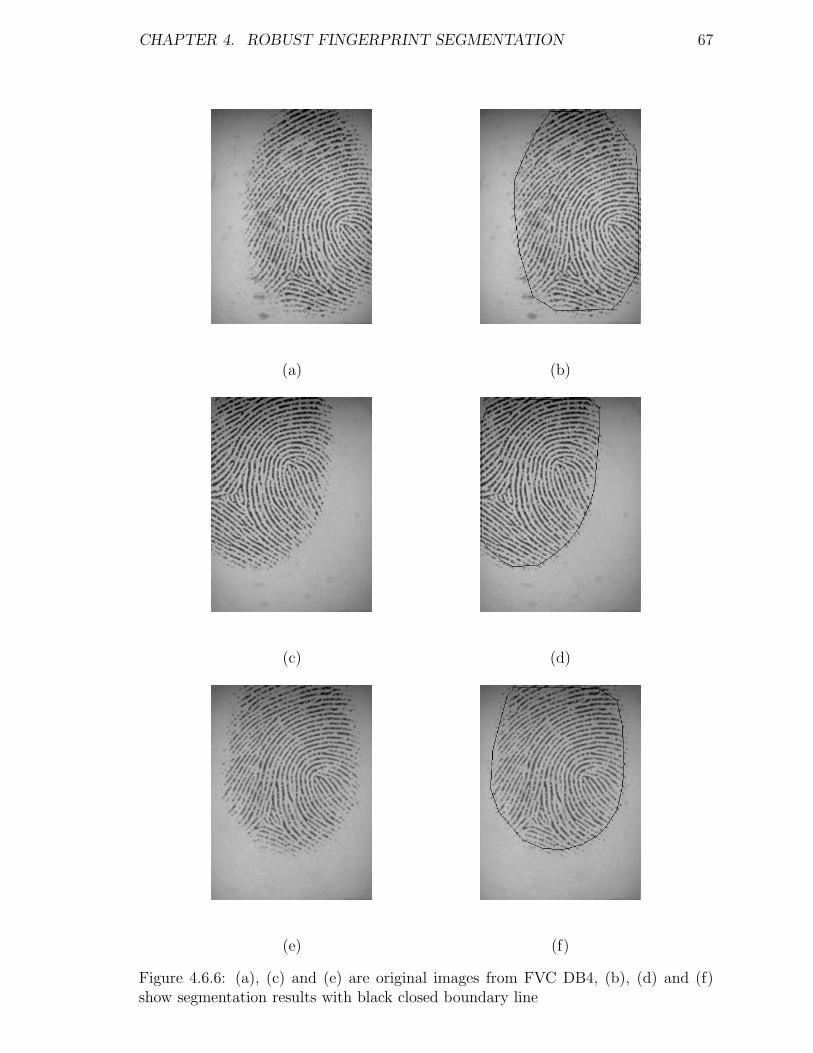
CHAPTER 4. ROBUST FINGERPRINT SEGMENTATION 67
(a) (b)
(c) (d)
(e) (f)
Figure 4.6.6: (a), (c) and (e) are original images from FVC DB4, (b), (d) and (f)show segmentation results with black closed boundary line
Chapter 5
Adaptive Fingerprint Image
Enhancement
5.1 Introduction
The performance of any fingerprint recognizer depends heavily on the fingerprint
image quality. Different types of noise in the fingerprint images pose difficulty for
recognizers. Most Automatic Fingerprint Identification Systems (AFIS) use some
form of image enhancement. Although several methods have been described in the
literature, there is still scope for improvement. In particular, effective methodology
of cleaning the valleys between the ridge contours are lacking. Fingerprint image
enhancement needs to perform the following tasks [60]:
1. Increase the contrast between the ridges and valleys.
2. Enhance locally ridges along the ridge orientation. The filter window size should
68

CHAPTER 5. ADAPTIVE FINGERPRINT IMAGE ENHANCEMENT 69
be adapted to the local ridge curvature [90]. It should be large enough to
increase the signal-to-noise ratio and complete the broken ridges in cuts and
creases, and average out noise such as artifacts in valleys. However, it should
not be too large to change the local ridge shape in the high-curvature regions
(around core and delta points).
3. Facilitate feature points detection, and the number of genuine minutiae should
be retained be the same as before enhancement.
4. Not change the ridge and valley structure and not flip minutiae type.
5. Improve the ridge clarity in the recoverable regions [32], and detect the unre-
coverable regions as useless regions for spurious minutiae filtering.
In order to facilitate: (i)minutiae point detection and spurious minutiae filtering,
and (ii) generation of less artifacts and smooth noise, accurate estimation of local
image parameters is important. Filter window size, local ridge orientation, local
ridge frequency and scale, ridge curvature as well as block image quality in terms of
ridge flow and contrast entropy must be estimated and/or modeled from the original
acquired image. The following section will review the methods for orientation field
estimation.
5.2 Local ridge orientation field Estimation
Orientation fields are very useful in image segmentation [52] and enhancement [91,
32], classification and ridge detection [15], coherence calculation and singular points
detection [9], and spurious minutiae filtering [92]. There are several techniques to
compute local ridge orientation fields. In [96], Wang, Hu and Phillips proposed a
CHAPTER 5. ADAPTIVE FINGERPRINT IMAGE ENHANCEMENT 70
orientation model using 2-D Fourier expansions in the phase plane. The method had
a low-computational cost, and worked well even for noisy fingerprints. In [80], Stock
and Swonger used ridge-valley mask with a fixed number of reference templates (8
slits) to calculate the orientation field. The variation of the gray-scale pixels should
be smaller along the local ridge direction and larger in the direction perpendicular.
This method is simple and easy to compute, but it considers only 8 limited directions,
and does not provide sufficient accuracy. The most common and accurate method is
based on gradient. The ridge direction can be obtained by averaging of gradients of
pixels in some neighborhood (blockwise). The gradient ∇(xi, yi) at point [xi, yi] of
image I is a two-dimensional vector [Gx(x, y), Gy(x, y)]T . It can be defined as follows:
Gx(x, y)
Gy(x, y)
= sign(Gx(x, y))∇I(x, y) = sign(∂I(x, y)
∂x)
∂I(x,y)∂x
∂I(x,y)∂y
(5.2.1)
One limitation of gradient-based direction estimation is the cancellation problem
when the gradients of two ridge sides represent the same ridge direction with opposite
directions. Kass and Witkin [43] solved this problem by doubling the angles of the
gradient vectors before averaging.
Block-level direction field is more often used for high-performance computation. Even
though overlapping blocks are used for noise suppression, aliasing artifacts are gen-
erated due to fixed subsampling size and uniform averaging-filter shape. Scale-space
theory [3, 81] can be used to smooth the orientation field by adapting to the ridge
shape. The Gaussian window size can be chosen based on the scale-space theory.
In [60], O’Gorman and Nickerson proposed a consistency-based orientation smooth-
ing method. The smoothing was performed from low to high resolution in the same
manner as in multi-scale-space theory [81]. Inconsistent blocks are split into four
subsquares of sizes 3W/4 × 3W/4 (i.e each was overlapped by 50%) till the required
consistency is achieved. Jain, Hong and Bolle [37] suggest an adaptive coarse to fine
CHAPTER 5. ADAPTIVE FINGERPRINT IMAGE ENHANCEMENT 71
smoothing of gradient tensor or angular data. It stopped when desired consistency
level was achieved. If the consistency level was above the threshold, then the local
orientation around the region was re-computed at a lower resolution level. The final
effect was that less smoothing was done for high-curvature regions around cores and
deltas. Donahue and Rokhlin [55] proposed an orientation smoothing method which
was based on a least-square minimization. Nakamura, Nagaoka and Minami [59]
proposed a stochastic relaxation technique for smoothing the orientation field which
discriminates the high-curved regions from the rest of the image. Bergengruen [58]
used the directional filters at a discrete number(3) of different scales, and selected the
scale which gave the highest gray-scale variance along the direction perpendicular to
the selected ridge direction.
5.3 Review of fingerprint image enhancement meth-
ods
Directional image enhancement can be performed in both spatial and frequency do-
mains. The constraints of a problem dictates which domain is suitable. Filtering
can be performed as a convolution task in the spatial domain, executed as multipli-
cation in the frequency domain. Background patterns which are often indiscernible
in the spatial domain are easily removed in the frequency domain. Similarly, a si-
nusoidal signal in broadband noise might be difficult to see in the time domain but
is readily visible in the frequency domain. The following two sections review image
enhancement techniques in the spatial domain and frequency domain, respectively.
CHAPTER 5. ADAPTIVE FINGERPRINT IMAGE ENHANCEMENT 72
5.3.1 Spatial Domain
Contextual filters with tuned local ridge orientation and frequency are averaged along
the ridge direction to link ridge gaps, fill pores, filter noise, and improve the clarity be-
tween ridges and valleys. O’Gorman and Nickerson [60] designed a bell-shaped filter
elongated along the ridge direction and cosine tapered in the direction perpendicular
to the ridge direction The filter design needs four main parameters: minimum and
maximum ridge width, and minimum and maximum valley width. A set of 16 rotated
versions of the mother filter with a step of 22.5o are obtained for image enhancement.
However, the parameters for the filter are not determined empirically, rather they are
estimated from the image. This makes it difficult to apply in large-scale real-time au-
tomatical fingerprint authentication systems. In [91], a non-linear filter is proposed
with local ridge direction tuned and dynamic filter window size adapted to the local
ridge curvature. The technical details of the method are described in the section 5.4.
5.3.2 Frequency Domain
Sherlock, Monro, and Millard [79] designed the following contextual filter in the
Fourier domain:
H(ρ, θ) = Hradial(ρ).Hdirection(θ) (5.3.1)
Here (ρ, θ) shows the polar co-ordinates in the Fourier domain, it can be separated into
ρ and θ components. Both Hradial(ρ) and Hdirection(θ) are defined as bandpass filters.
It assumes that the frequency is stable in the processed block, so only the direction
determines the shape of filter. A set of prefiltered images (8 or 16) are calculated
by convolving a set of prefilters with the image. The prefiltered image with the
orientation closest to the local ridge orientation is selected as the enhancement result.

CHAPTER 5. ADAPTIVE FINGERPRINT IMAGE ENHANCEMENT 73
Prefiltered images are combined to improve the enhancement accuracy in the high-
curvature regions when the pixel is close to singular points. Angular bandwidth of π/8
is selected for points away from singular points. The angular bandwidth π is selected
for points close to singular points. An empirical piecewise linear equation defines
angular bandwidth as a function of distance from the nearest singular point. However,
there is no discussion about singular point detection. Kamei and Mizoguchi [42]
designed a similar filter with the separable Hradial(ρ) and Hdirection(θ). Hradial(ρ)
defines the frequency filter, and Hdirection(θ) defines the directional filter. An energy
function is used to select the filters which match the ridge features.
Because it is time consuming to compute explicitly the local ridge orientation and
frequency, Candela et al. [14] and Willis and Myers [89] propose multiplying the
Fourier transform of the block by its power spectrum (of a power k):
Ienh[x, y] = F−1F (I[x, y]) × |F (I[x, y])|k (5.3.2)
The effect of multiplying the power spectrum (containing intrinsic major ridge orien-
tation and frequency) can achieve enhancement of the dominant spectral components
while attenuating the noisy spectral components. One limitation of this method
is that it needs overlapping neighboring blocks to eliminate discontinuity artifacts.
Pradenas [68] proposed directional image enhancement in the frequency domain. The
local direction estimation of the method was not limited to fit one of a set of pre-
defined directions. It performed better in noisy and high-curvature regions because
more than one direction in the high-curvature regions was enhanced.
CHAPTER 5. ADAPTIVE FINGERPRINT IMAGE ENHANCEMENT 74
5.4 New Noise Model
We observe that noisy valley pixels and the pixels in the interrupted ridge flow gap
are “impulse noises”. Therefore, we propose a new approach to fingerprint image
enhancement, which is based on integration of the Anisotropic Filter and the Di-
rectional Median Filter(DMF). Gaussian-distributed noises are reduced effectively by
Anisotropic Filter, whereas “impulse noises” are reduced efficiently by DMF. Usually,
a traditional median filter is the most effective method to remove pepper-and-salt
noise and other small artifacts. The proposed DMF can not only perform the original
tasks, but it can also join broken fingerprint ridges, fill out the holes in fingerprint
images, smooth irregular ridges, and remove some annoying small artifacts between
ridges. Our enhancement algorithm has been implemented and tested on fingerprint
images from FVC2002. Images of varying quality have been used to evaluate the
performance of our approach. We have compared with other methods described in
the literature in terms of matched minutiae, missed minutiae, spurious minutiae, and
flipped minutiae (between end points and bifurcation points).
Most enhancement methods (either in frequency domain or in spatial domain) can not
meet the needs of real-time AFIS in improving valley clarity and ridge flow continuity.
Most enhancement techniques rely heavily on the local ridge orientation. We have
developed an integrated method, which utilizes both the advantages of anisotropic
filter and directional median filter. The fingerprint images are first convolved with
the anisotropic filter, and are then filtered by the DMF. The pores in the fingerprint
ridge are completely removed (currently, use of pore features is not practical because
it requires very high quality fingerprint images), small to medium artifacts are cleared,
and broken ridges in most clear regions are joined. The following two subsection will
describe the two filters in detail.
CHAPTER 5. ADAPTIVE FINGERPRINT IMAGE ENHANCEMENT 75
5.4.1 Anisotropic Filter
Anisotropic filter reduces Gaussian-like noise similar to the Gabor filter in Hong’s
[32] work. Greenberg [28] modified the anisotropic filter by shaping the filter kernel
to process fingerprint images. It is essentially adapting the filter shape to the local
features (local intensity orientation) of the fingerprint image. The general form of the
anisotropic filter can be defined as follows:
H(x0, x) = V + Sρ(x − x0)exp
−
[
((x − x0) · n)2
σ21(x0)
+((x − x0) · n⊥)2
σ22(x0)
]
Where V and S are parameters for adjusting the phase intensity. The impact of the
neighborhood, σ21(x0) and σ2
2(x0) controls the shape of the filter kernel. n and n⊥ are
mutually normal unit vectors where n is along the direction of ridge line. ρ meets
the condition ρ(x) = 1 when |x| < r. r is the maximum support radius. In our
experiments, V and S are set to −2 and 10 respectively, ρ21(x0) = 2 and ρ2
2(x0) = 4
so that the Gaussian-shape is created with a 1 : 2 ratio between the two kernel axes.
According to Gonzalez [27]and Shapiro [77], median filtering is performed by re-
placing a pixel with the median value of the selected neighborhood. The median
filter performs well at filtering outliers points while leaving edges intact. The two-
dimensional (2D) standard median filter is defined as follows:
Definition 5.4.1 Given a gray-level image IM of size M × N with random impulse
noise distribution n, the observation OIM of original image is defined as,
OIM = IM + n
A median filter mask with suitably pre-selected window W of size (2k + 1) × (2l + 1)
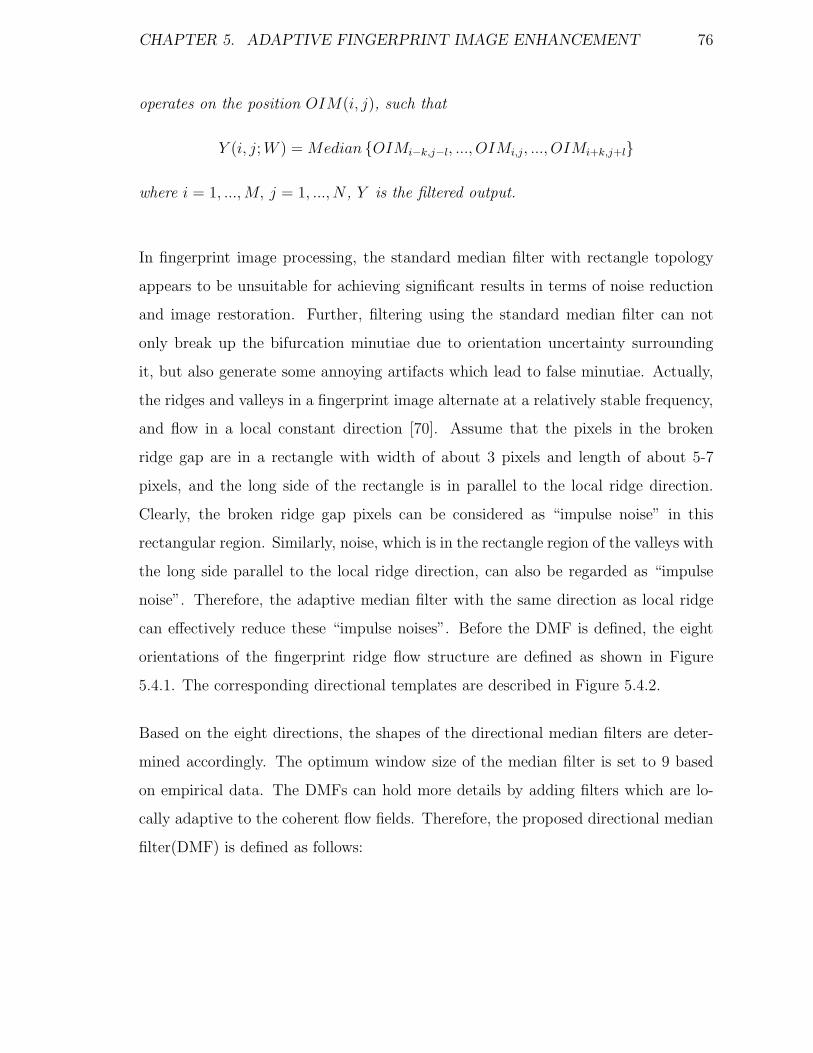
CHAPTER 5. ADAPTIVE FINGERPRINT IMAGE ENHANCEMENT 76
operates on the position OIM(i, j), such that
Y (i, j; W ) = Median OIMi−k,j−l, ..., OIMi,j, ..., OIMi+k,j+l
where i = 1, ..., M, j = 1, ..., N , Y is the filtered output.
In fingerprint image processing, the standard median filter with rectangle topology
appears to be unsuitable for achieving significant results in terms of noise reduction
and image restoration. Further, filtering using the standard median filter can not
only break up the bifurcation minutiae due to orientation uncertainty surrounding
it, but also generate some annoying artifacts which lead to false minutiae. Actually,
the ridges and valleys in a fingerprint image alternate at a relatively stable frequency,
and flow in a local constant direction [70]. Assume that the pixels in the broken
ridge gap are in a rectangle with width of about 3 pixels and length of about 5-7
pixels, and the long side of the rectangle is in parallel to the local ridge direction.
Clearly, the broken ridge gap pixels can be considered as “impulse noise” in this
rectangular region. Similarly, noise, which is in the rectangle region of the valleys with
the long side parallel to the local ridge direction, can also be regarded as “impulse
noise”. Therefore, the adaptive median filter with the same direction as local ridge
can effectively reduce these “impulse noises”. Before the DMF is defined, the eight
orientations of the fingerprint ridge flow structure are defined as shown in Figure
5.4.1. The corresponding directional templates are described in Figure 5.4.2.
Based on the eight directions, the shapes of the directional median filters are deter-
mined accordingly. The optimum window size of the median filter is set to 9 based
on empirical data. The DMFs can hold more details by adding filters which are lo-
cally adaptive to the coherent flow fields. Therefore, the proposed directional median
filter(DMF) is defined as follows:
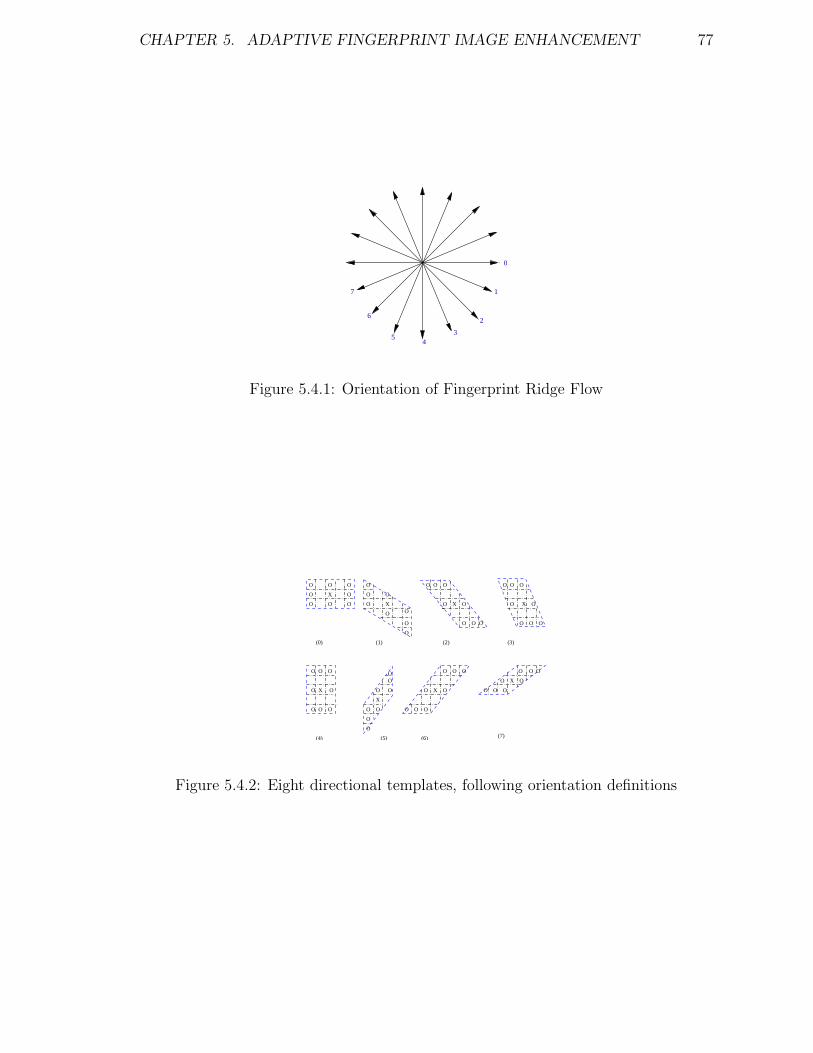
CHAPTER 5. ADAPTIVE FINGERPRINT IMAGE ENHANCEMENT 77
0
1
2
34
5
6
7
Figure 5.4.1: Orientation of Fingerprint Ridge Flow
O
(0)
O
O
O O
O
O
O
O
O
X
O
O
O
O O
O O
O O
O
O
(1) (2) (3)
O
O
X
O
O O
(4)
X
O O
O O
OX
O O
O
O
O X
O
O
O
O
O
X
OO
O
(5)
O O
OXO
OOO
OO X
O OO
O
O
O
O
OOO
O
(6) (7)
Figure 5.4.2: Eight directional templates, following orientation definitions
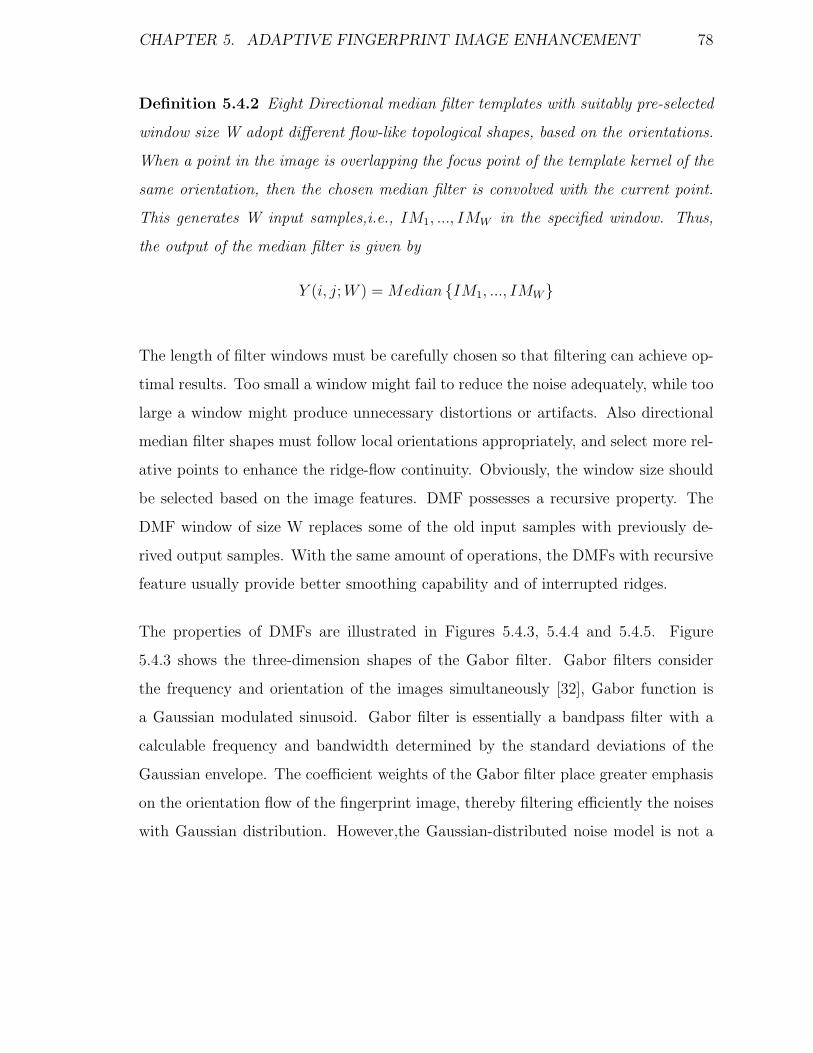
CHAPTER 5. ADAPTIVE FINGERPRINT IMAGE ENHANCEMENT 78
Definition 5.4.2 Eight Directional median filter templates with suitably pre-selected
window size W adopt different flow-like topological shapes, based on the orientations.
When a point in the image is overlapping the focus point of the template kernel of the
same orientation, then the chosen median filter is convolved with the current point.
This generates W input samples,i.e., IM1, ..., IMW in the specified window. Thus,
the output of the median filter is given by
Y (i, j; W ) = Median IM1, ..., IMW
The length of filter windows must be carefully chosen so that filtering can achieve op-
timal results. Too small a window might fail to reduce the noise adequately, while too
large a window might produce unnecessary distortions or artifacts. Also directional
median filter shapes must follow local orientations appropriately, and select more rel-
ative points to enhance the ridge-flow continuity. Obviously, the window size should
be selected based on the image features. DMF possesses a recursive property. The
DMF window of size W replaces some of the old input samples with previously de-
rived output samples. With the same amount of operations, the DMFs with recursive
feature usually provide better smoothing capability and of interrupted ridges.
The properties of DMFs are illustrated in Figures 5.4.3, 5.4.4 and 5.4.5. Figure
5.4.3 shows the three-dimension shapes of the Gabor filter. Gabor filters consider
the frequency and orientation of the images simultaneously [32], Gabor function is
a Gaussian modulated sinusoid. Gabor filter is essentially a bandpass filter with a
calculable frequency and bandwidth determined by the standard deviations of the
Gaussian envelope. The coefficient weights of the Gabor filter place greater emphasis
on the orientation flow of the fingerprint image, thereby filtering efficiently the noises
with Gaussian distribution. However,the Gaussian-distributed noise model is not a

CHAPTER 5. ADAPTIVE FINGERPRINT IMAGE ENHANCEMENT 79
-10-5
05
10-10
-5
0
5
10
-4-3-2-1012345
(a)
-10
-5
0
5
10 -10-5
05
10
-4-3-2-1012345
(b)
Figure 5.4.3: View of Gabor filter from (a)front and (b)side
good noise model for fingerprints. Pepper-salt noise, smudge in the valleys, inter-
rupted ridge lines can not explained by the Gaussian model. In fact, any single noise
model is too simple to explain the fingerprint image noise. Our proposed adaptive
median filter eliminate efficiently noises in the valleys. Figure 5.4.4 demonstrates
how the noise of medium size between the adjacent ridge lines can be removed. In
Figure 5.4.5, one hole with the size of four pixels can be filled out completely, this
saving a lot of post-processing steps in removing false minutiae. Repairing of broken
fingerprint ridge flow lines using DMFs can be illustrated similarly.
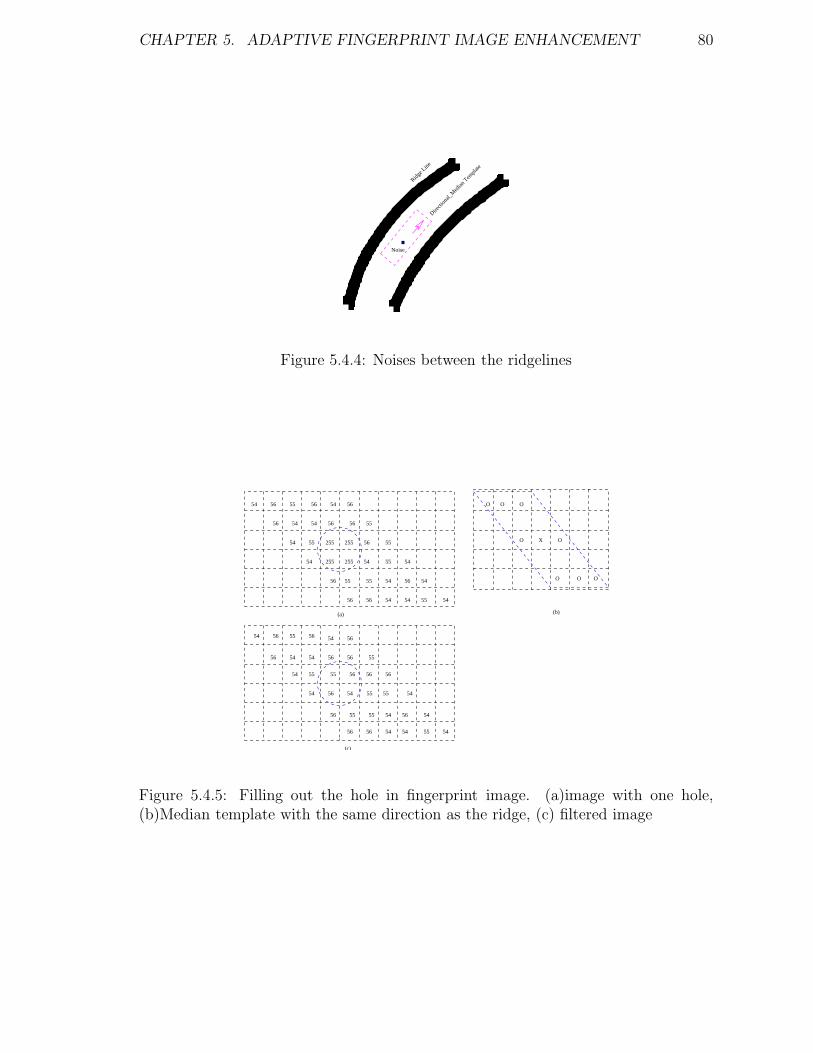
CHAPTER 5. ADAPTIVE FINGERPRINT IMAGE ENHANCEMENT 80
Ridge
Line
Directi
onal_
Med
ian T
empla
te
Noise
Figure 5.4.4: Noises between the ridgelines
56 55
56 54 54 56 56
56 54 565654
55
55
56 55
545554 255
25554 55 255
255 54
5654 54
55545656
O O
O
54 56 55 56 54 56
56 54 54 56 56 55
54 55 55 56
55
54 54
56 56
54
OXO
O
O
56 54 55 55 54
56 55 55 54 56 54
56 56 54 54 55 54
O
(a) (b)
(c)
Figure 5.4.5: Filling out the hole in fingerprint image. (a)image with one hole,(b)Median template with the same direction as the ridge, (c) filtered image
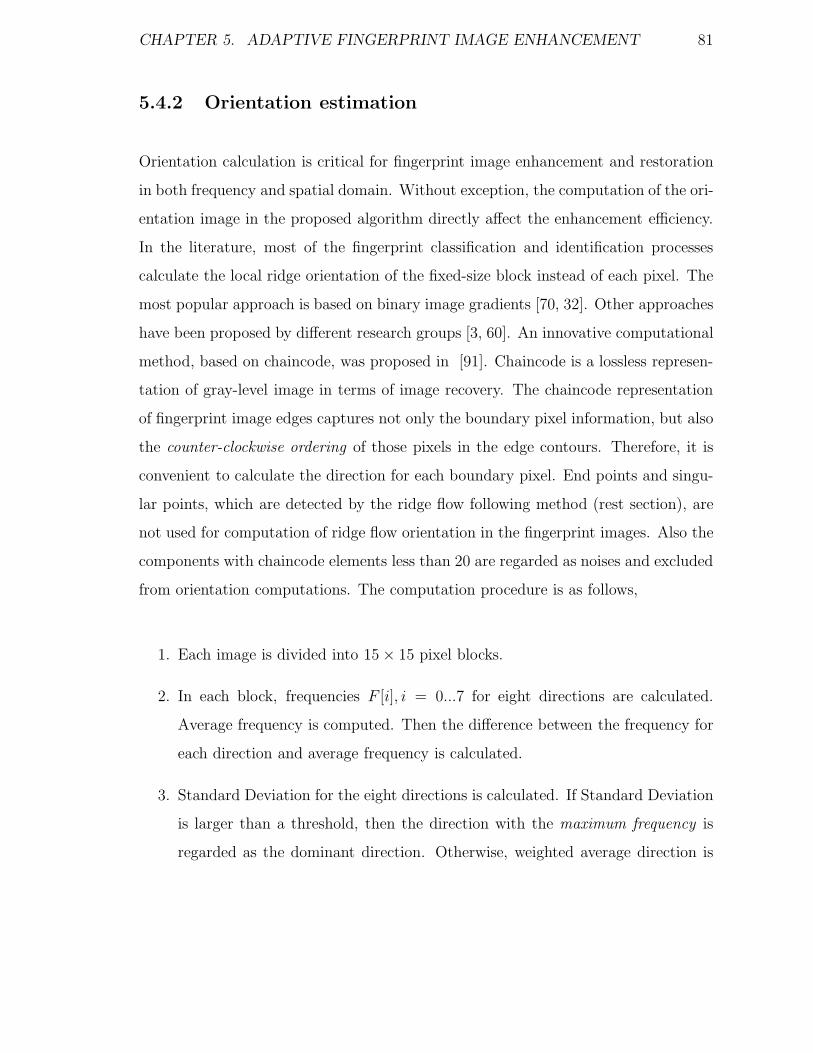
CHAPTER 5. ADAPTIVE FINGERPRINT IMAGE ENHANCEMENT 81
5.4.2 Orientation estimation
Orientation calculation is critical for fingerprint image enhancement and restoration
in both frequency and spatial domain. Without exception, the computation of the ori-
entation image in the proposed algorithm directly affect the enhancement efficiency.
In the literature, most of the fingerprint classification and identification processes
calculate the local ridge orientation of the fixed-size block instead of each pixel. The
most popular approach is based on binary image gradients [70, 32]. Other approaches
have been proposed by different research groups [3, 60]. An innovative computational
method, based on chaincode, was proposed in [91]. Chaincode is a lossless represen-
tation of gray-level image in terms of image recovery. The chaincode representation
of fingerprint image edges captures not only the boundary pixel information, but also
the counter-clockwise ordering of those pixels in the edge contours. Therefore, it is
convenient to calculate the direction for each boundary pixel. End points and singu-
lar points, which are detected by the ridge flow following method (rest section), are
not used for computation of ridge flow orientation in the fingerprint images. Also the
components with chaincode elements less than 20 are regarded as noises and excluded
from orientation computations. The computation procedure is as follows,
1. Each image is divided into 15 × 15 pixel blocks.
2. In each block, frequencies F [i], i = 0...7 for eight directions are calculated.
Average frequency is computed. Then the difference between the frequency for
each direction and average frequency is calculated.
3. Standard Deviation for the eight directions is calculated. If Standard Deviation
is larger than a threshold, then the direction with the maximum frequency is
regarded as the dominant direction. Otherwise, weighted average direction is
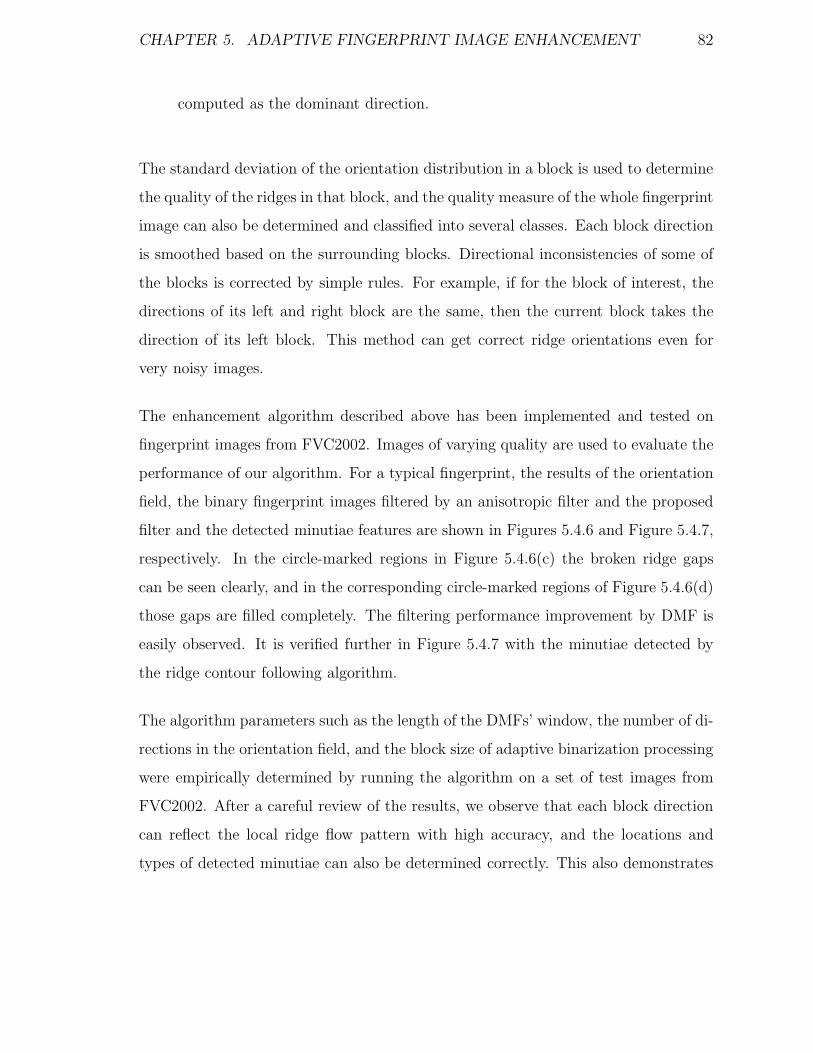
CHAPTER 5. ADAPTIVE FINGERPRINT IMAGE ENHANCEMENT 82
computed as the dominant direction.
The standard deviation of the orientation distribution in a block is used to determine
the quality of the ridges in that block, and the quality measure of the whole fingerprint
image can also be determined and classified into several classes. Each block direction
is smoothed based on the surrounding blocks. Directional inconsistencies of some of
the blocks is corrected by simple rules. For example, if for the block of interest, the
directions of its left and right block are the same, then the current block takes the
direction of its left block. This method can get correct ridge orientations even for
very noisy images.
The enhancement algorithm described above has been implemented and tested on
fingerprint images from FVC2002. Images of varying quality are used to evaluate the
performance of our algorithm. For a typical fingerprint, the results of the orientation
field, the binary fingerprint images filtered by an anisotropic filter and the proposed
filter and the detected minutiae features are shown in Figures 5.4.6 and Figure 5.4.7,
respectively. In the circle-marked regions in Figure 5.4.6(c) the broken ridge gaps
can be seen clearly, and in the corresponding circle-marked regions of Figure 5.4.6(d)
those gaps are filled completely. The filtering performance improvement by DMF is
easily observed. It is verified further in Figure 5.4.7 with the minutiae detected by
the ridge contour following algorithm.
The algorithm parameters such as the length of the DMFs’ window, the number of di-
rections in the orientation field, and the block size of adaptive binarization processing
were empirically determined by running the algorithm on a set of test images from
FVC2002. After a careful review of the results, we observe that each block direction
can reflect the local ridge flow pattern with high accuracy, and the locations and
types of detected minutiae can also be determined correctly. This also demonstrates
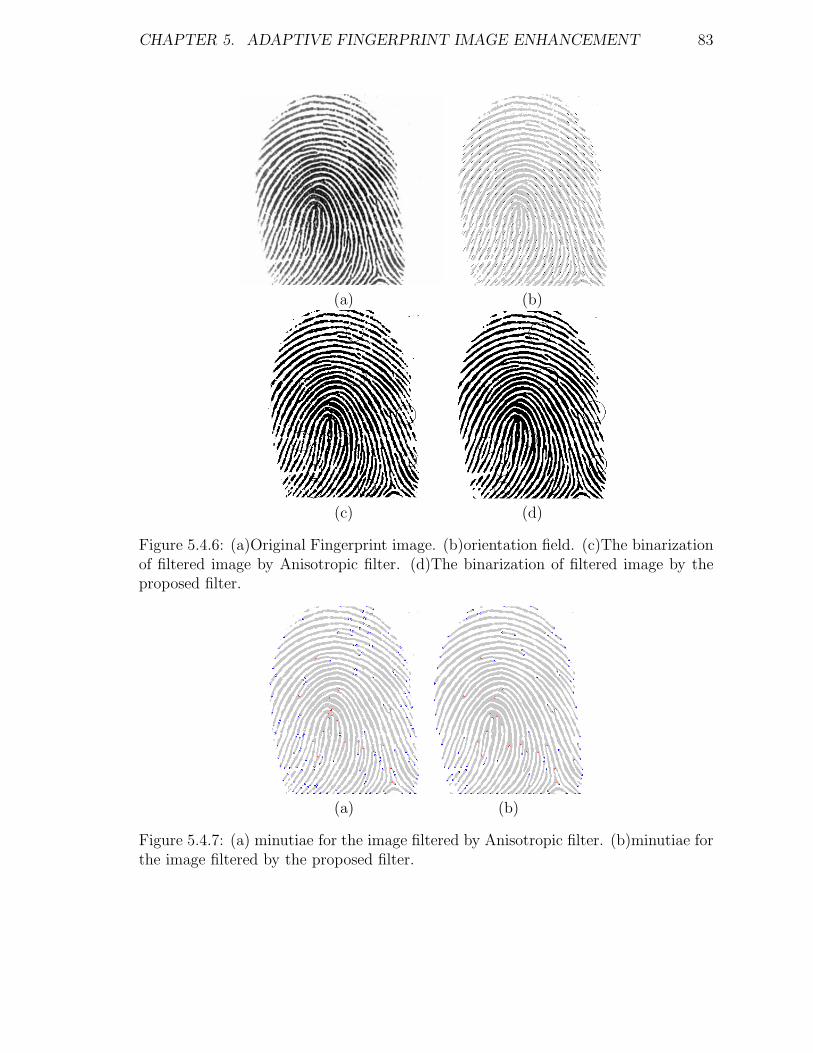
CHAPTER 5. ADAPTIVE FINGERPRINT IMAGE ENHANCEMENT 83
(a) (b)
(c) (d)
Figure 5.4.6: (a)Original Fingerprint image. (b)orientation field. (c)The binarizationof filtered image by Anisotropic filter. (d)The binarization of filtered image by theproposed filter.
(a) (b)
Figure 5.4.7: (a) minutiae for the image filtered by Anisotropic filter. (b)minutiae forthe image filtered by the proposed filter.
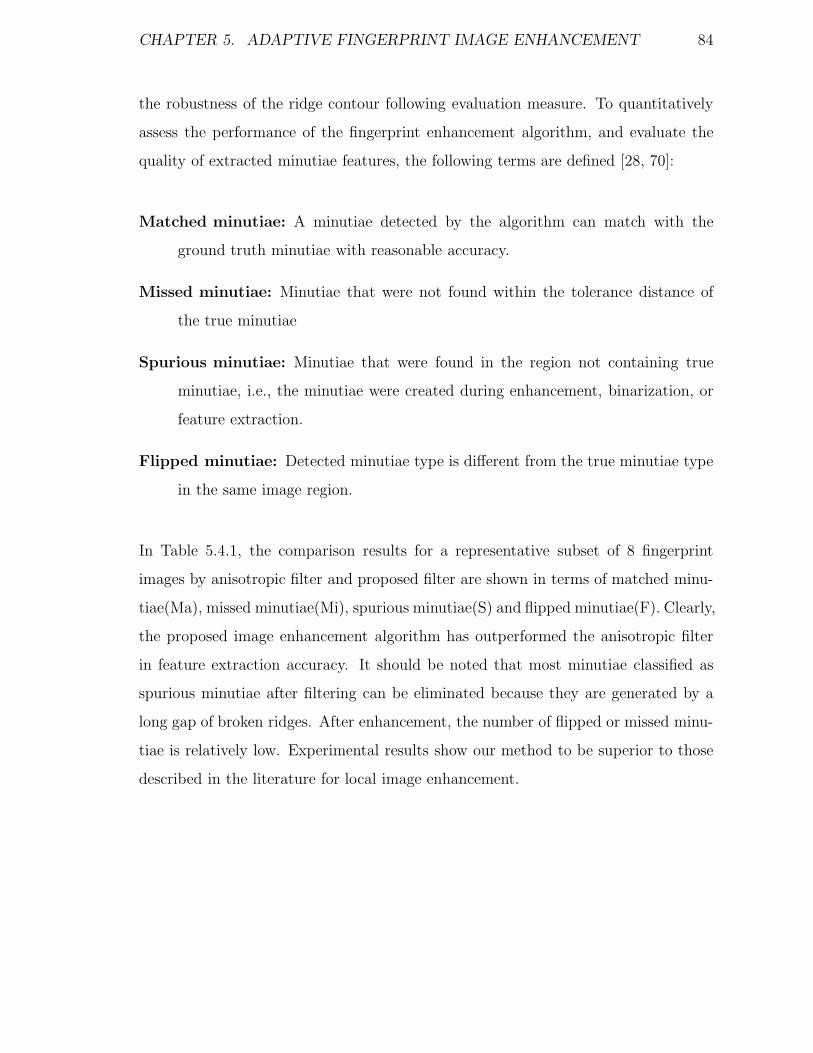
CHAPTER 5. ADAPTIVE FINGERPRINT IMAGE ENHANCEMENT 84
the robustness of the ridge contour following evaluation measure. To quantitatively
assess the performance of the fingerprint enhancement algorithm, and evaluate the
quality of extracted minutiae features, the following terms are defined [28, 70]:
Matched minutiae: A minutiae detected by the algorithm can match with the
ground truth minutiae with reasonable accuracy.
Missed minutiae: Minutiae that were not found within the tolerance distance of
the true minutiae
Spurious minutiae: Minutiae that were found in the region not containing true
minutiae, i.e., the minutiae were created during enhancement, binarization, or
feature extraction.
Flipped minutiae: Detected minutiae type is different from the true minutiae type
in the same image region.
In Table 5.4.1, the comparison results for a representative subset of 8 fingerprint
images by anisotropic filter and proposed filter are shown in terms of matched minu-
tiae(Ma), missed minutiae(Mi), spurious minutiae(S) and flipped minutiae(F). Clearly,
the proposed image enhancement algorithm has outperformed the anisotropic filter
in feature extraction accuracy. It should be noted that most minutiae classified as
spurious minutiae after filtering can be eliminated because they are generated by a
long gap of broken ridges. After enhancement, the number of flipped or missed minu-
tiae is relatively low. Experimental results show our method to be superior to those
described in the literature for local image enhancement.

CHAPTER 5. ADAPTIVE FINGERPRINT IMAGE ENHANCEMENT 85
Database Number Filter Ma Mi S FFVC2002 db1 1 8 Anisotropic 41 0 31 3
Proposed 41 0 8 2FVC2002 db1 15 8 Anisotropic 36 8 65 4
Proposed 37 6 14 2FVC2002 db1 20 6 Anisotropic 36 8 65 4
Proposed 37 6 14 2FVC2002 db1 72 8 Anisotropic 30 10 115 2
Proposed 37 6 23 1FVC2002 db1 59 6 Anisotropic 20 8 83 1
Proposed 29 3 20 1FVC2002 db1 89 1 Anisotropic 16 9 97 2
Proposed 24 4 16 1FVC2002 db1 96 5 Anisotropic 16 8 107 4
Proposed 25 3 28 3FVC2002 db1 102 6 Anisotropic 33 1 41 0
Proposed 40 0 11 0
Table 5.4.1: Performance comparison on testing set.
CHAPTER 5. ADAPTIVE FINGERPRINT IMAGE ENHANCEMENT 86
5.5 Singularity preserving fingerprint adaptive fil-
tering
Most AFISs can accurately extract minutiae in the well defined ridge-valley regions
of a fingerprint image where the ridge orientation changes slowly but cannot obtain
satisfactory results in the high-curvature regions [3, 87]. In [32], the Gabor filter was
used to enhance fingerprint images, and local ridge orientation and ridge frequency
were critical parameters for high performance. However, it may be insufficient that
only single low-pass filter with the size of 5×5 was adopted with the assumption that
there is slow orientation change in local ridges. Noisy regions like creases cannot be
smoothed successfully with such a size of Gaussian kernel.
Curvature estimation directly from ridge orientation fields has attracted a lot of re-
search effort [38, 88]. The coherence map reflects the local strength of the directional
field. It is computed based on the principal component analysis of local gradients
in [5]. We calculate an orientation coherence map and determine the minimum
coherence regions as high-curvature areas.
The basic idea of singularity-preserving fingerprint image filtering is that adaptive
Gaussian filter kernels are adapted directly to smooth local orientation map in terms
of ridge curvature. Because the smoothing operation is applied to the local ridge
shape structures, it joins efficiently the broken ridges without destroying essential
singularities and enforces continuity of directional fields even in creases.
CHAPTER 5. ADAPTIVE FINGERPRINT IMAGE ENHANCEMENT 87
5.5.1 Computation of Ridge Orientation and High-Curvature
Map
5.5.1.1 Gaussian Filtering
In a fingerprint image, additive noise in the orientation smoothing is correlated with
the local ridge curvature. The high-curvature regions centered around the delta and
core points need to be filtered by relatively small Gaussian kernel size σ, compared to
clear regions with almost parallel ridges. Because the Fourier transform of a Gaussian
is also a Gaussian, a Gaussian filter in the spatial domain performs like a low-pass
filter in the frequency domain [32].
5.5.1.2 Computation of Ridge Orientation and High-Curvature Map
The Gradient Square Tensor (GST) is the most commonly used robust flow pattern
orientation estimator. The direction of the gradient is an estimator of the local
orientation and is very sensitive to noise. Therefore, Gaussian filter regularization is
needed. Let Gx(i, j) and Gy(i, j) be the x and y components of the gradient vector at
point(i, j). To solve the cancellation problem of the gradient vector and its opposite
correspondence, the following tensor T is used to calculated the gradient direction:
T = ∇I∇IT =
Gx(i, j)2 Gx(i, j)Gy(i, j)
Gx(i, j)Gy(i, j) Gy(i, j)2
(5.5.1)
The final orientation estimate is obtained by an eigenvalue analysis of the smoothed
tensor.
Curvature at any point along a 2D curve is the change rate in the tangent direction
of the contour. The local orientation in a fingerprint image is computed by the GST,
CHAPTER 5. ADAPTIVE FINGERPRINT IMAGE ENHANCEMENT 88
and we define curvature as the ridge orientation change rate. In NFIS2 software
[88], high-curvature areas of the fingerprint are marked using two different measures:
vorticity (the cumulative change in ridge flow direction around all the neighbors of a
block) and curvature (the largest orientation change between a block’s ridge flow and
the ridge flow of each of its neighbors). In [87], singular points are determined first,
and the high-curvature areas are defined as squares of 100 side length, centered around
the core and delta points. In [3], a measure called “ridgeness” is defined, and points
of a fingerprint image are assigned “1” in areas with clear parallel ridges, and “0” in
areas with unclear ridges such as creases, fragmented ridges, blurred and over-inked
areas. Unfortunately, points in high curvature areas are assigned very small values.
In [38], Jain integrated the sine component of the orientation field in two regions
which were geometrically designed to capture the maximum curvature in the concave
ridges. However, it can not achieve precise and consistent reference points for the arch
type fingerprints, nor accurately locate the reference points in noisy images. Instead
of identifying the singular points, we calculate the orientation coherence map and
determine the minimum coherence regions as high-curvature areas. The coherence
map reflects the local strength of the directional field. It can be represented as the
ratio of the difference of the sum of two eigenvalues [5] and can be computed as
follows:
coh =
√
((Gxx − Gyy)2 + 4G2xy)
Gxx + Gyy(5.5.2)
where Gxx, Gyy and Gxy represent the variances and cross-variance of Gx and Gy.
5.5.2 Experiments
The proposed methodology is tested on FVC2002 DB1, which consists of 800 finger-
print images (100 distinct fingers, 8 impressions each). Image size is 374 × 388 and

CHAPTER 5. ADAPTIVE FINGERPRINT IMAGE ENHANCEMENT 89
50 100 150 200 250 300 350
50
100
150
200
250
300
350
(a) (b) (c)
50 100 150 200 250 300 350
50
100
150
200
250
300
350
(d) (e) (f)
Figure 5.5.1: Coherence-map based curvature estimation. (a) and (d) Original Im-ages. (b) and (e) corresponding coherence maps. (c) and (f) corresponding enhancedimages.
the resolution is 500dpi. To evaluate the methodology of adapting a Gaussian kernel
to the local ridge curvature of a fingerprint image, we have modified the Gabor-based
fingerprint enhancement algorithm [32] with two kernel sizes: the smaller one in high-
curvature regions and the larger one in ridge parallel regions. Minutiae is detected
using chaincode-based contour tracing [91]. We first utilize image quality features to
adaptively preprocess images and segment fingerprint foreground from background.
The gradient map of segmented images is computed, followed by the coherence map.
The coherence map is binarized by the threshold, and the high-curvature regions
are detected as the regions with lower coherence value in the coherence map. The
centroid and bounding-box of the high-curvature region can be used to dichotomize
image blocks into two regions, where different Gaussian kernels are utilized to smooth
the orientation map.The four sides for the bounding-box of the high-curvature region
are extended by about 16 pixels in this paper. This parameter is changed with the
different image size and resolution.
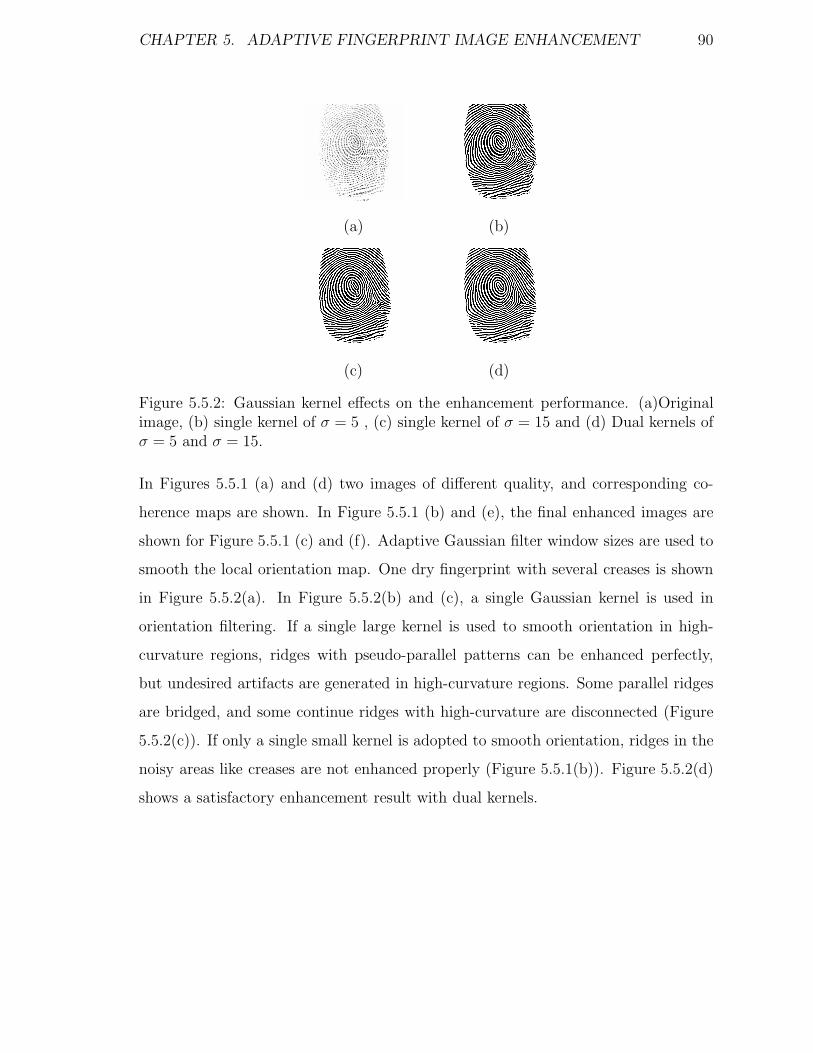
CHAPTER 5. ADAPTIVE FINGERPRINT IMAGE ENHANCEMENT 90
(a) (b)
(c) (d)
Figure 5.5.2: Gaussian kernel effects on the enhancement performance. (a)Originalimage, (b) single kernel of σ = 5 , (c) single kernel of σ = 15 and (d) Dual kernels ofσ = 5 and σ = 15.
In Figures 5.5.1 (a) and (d) two images of different quality, and corresponding co-
herence maps are shown. In Figure 5.5.1 (b) and (e), the final enhanced images are
shown for Figure 5.5.1 (c) and (f). Adaptive Gaussian filter window sizes are used to
smooth the local orientation map. One dry fingerprint with several creases is shown
in Figure 5.5.2(a). In Figure 5.5.2(b) and (c), a single Gaussian kernel is used in
orientation filtering. If a single large kernel is used to smooth orientation in high-
curvature regions, ridges with pseudo-parallel patterns can be enhanced perfectly,
but undesired artifacts are generated in high-curvature regions. Some parallel ridges
are bridged, and some continue ridges with high-curvature are disconnected (Figure
5.5.2(c)). If only a single small kernel is adopted to smooth orientation, ridges in the
noisy areas like creases are not enhanced properly (Figure 5.5.1(b)). Figure 5.5.2(d)
shows a satisfactory enhancement result with dual kernels.
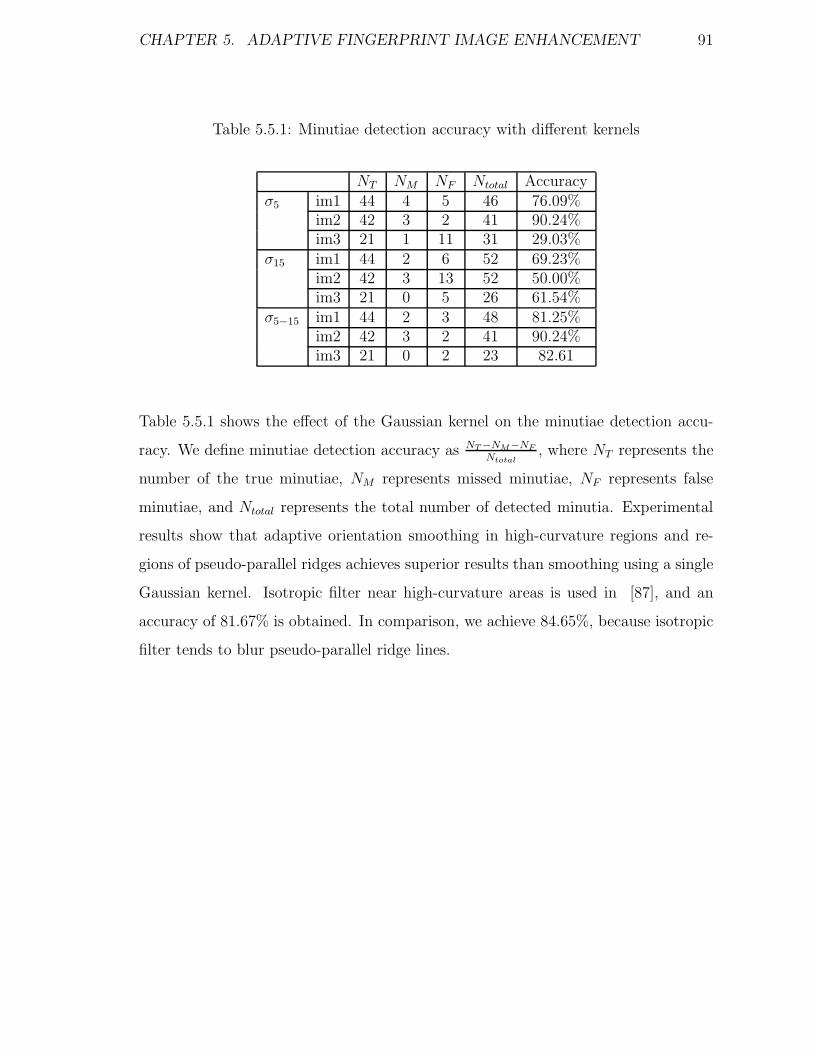
CHAPTER 5. ADAPTIVE FINGERPRINT IMAGE ENHANCEMENT 91
Table 5.5.1: Minutiae detection accuracy with different kernels
NT NM NF Ntotal Accuracyσ5 im1 44 4 5 46 76.09%
im2 42 3 2 41 90.24%im3 21 1 11 31 29.03%
σ15 im1 44 2 6 52 69.23%im2 42 3 13 52 50.00%im3 21 0 5 26 61.54%
σ5−15 im1 44 2 3 48 81.25%im2 42 3 2 41 90.24%im3 21 0 2 23 82.61
Table 5.5.1 shows the effect of the Gaussian kernel on the minutiae detection accu-
racy. We define minutiae detection accuracy as NT −NM−NF
Ntotal, where NT represents the
number of the true minutiae, NM represents missed minutiae, NF represents false
minutiae, and Ntotal represents the total number of detected minutia. Experimental
results show that adaptive orientation smoothing in high-curvature regions and re-
gions of pseudo-parallel ridges achieves superior results than smoothing using a single
Gaussian kernel. Isotropic filter near high-curvature areas is used in [87], and an
accuracy of 81.67% is obtained. In comparison, we achieve 84.65%, because isotropic
filter tends to blur pseudo-parallel ridge lines.

Chapter 6
Feature Detection
6.1 Introduction
An accurate representation of the fingerprint image is critical to automatic fingerprint
identification systems, because most deployed commercial large-scale systems are de-
pendent on feature-based matching, even though correlation-based matching methods
may have high performance when additional computation time is available. Among
all the fingerprint features, minutia point features with corresponding orientation
maps are unique enough to provide robust discriminative capacity [62], the minutiae
feature representation reduces the complex fingerprint recognition problem to a point
pattern matching problem. In order to achieve high-accuracy minutiae with varied
quality fingerprint images, segmentation algorithm needs to separate foreground from
noisy background without excluding any ridge-valley regions and not include mean-
ingless background. Image enhancement algorithm needs to keep the original ridge
92
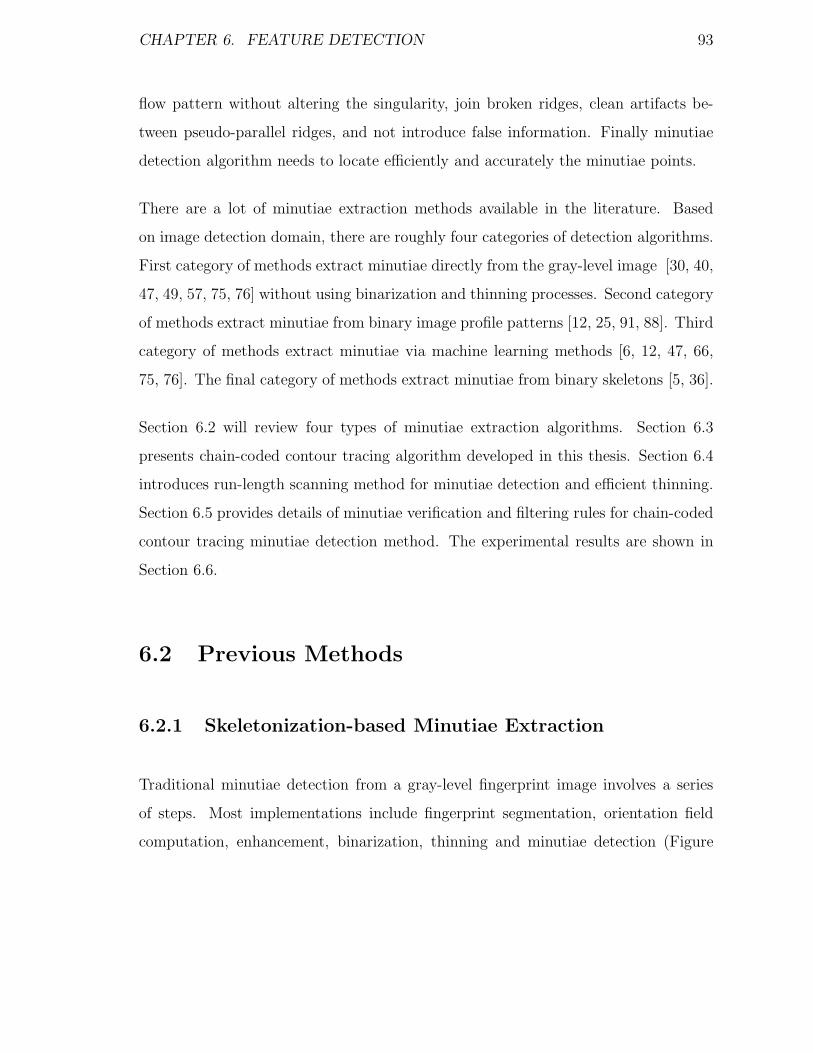
CHAPTER 6. FEATURE DETECTION 93
flow pattern without altering the singularity, join broken ridges, clean artifacts be-
tween pseudo-parallel ridges, and not introduce false information. Finally minutiae
detection algorithm needs to locate efficiently and accurately the minutiae points.
There are a lot of minutiae extraction methods available in the literature. Based
on image detection domain, there are roughly four categories of detection algorithms.
First category of methods extract minutiae directly from the gray-level image [30, 40,
47, 49, 57, 75, 76] without using binarization and thinning processes. Second category
of methods extract minutiae from binary image profile patterns [12, 25, 91, 88]. Third
category of methods extract minutiae via machine learning methods [6, 12, 47, 66,
75, 76]. The final category of methods extract minutiae from binary skeletons [5, 36].
Section 6.2 will review four types of minutiae extraction algorithms. Section 6.3
presents chain-coded contour tracing algorithm developed in this thesis. Section 6.4
introduces run-length scanning method for minutiae detection and efficient thinning.
Section 6.5 provides details of minutiae verification and filtering rules for chain-coded
contour tracing minutiae detection method. The experimental results are shown in
Section 6.6.
6.2 Previous Methods
6.2.1 Skeletonization-based Minutiae Extraction
Traditional minutiae detection from a gray-level fingerprint image involves a series
of steps. Most implementations include fingerprint segmentation, orientation field
computation, enhancement, binarization, thinning and minutiae detection (Figure
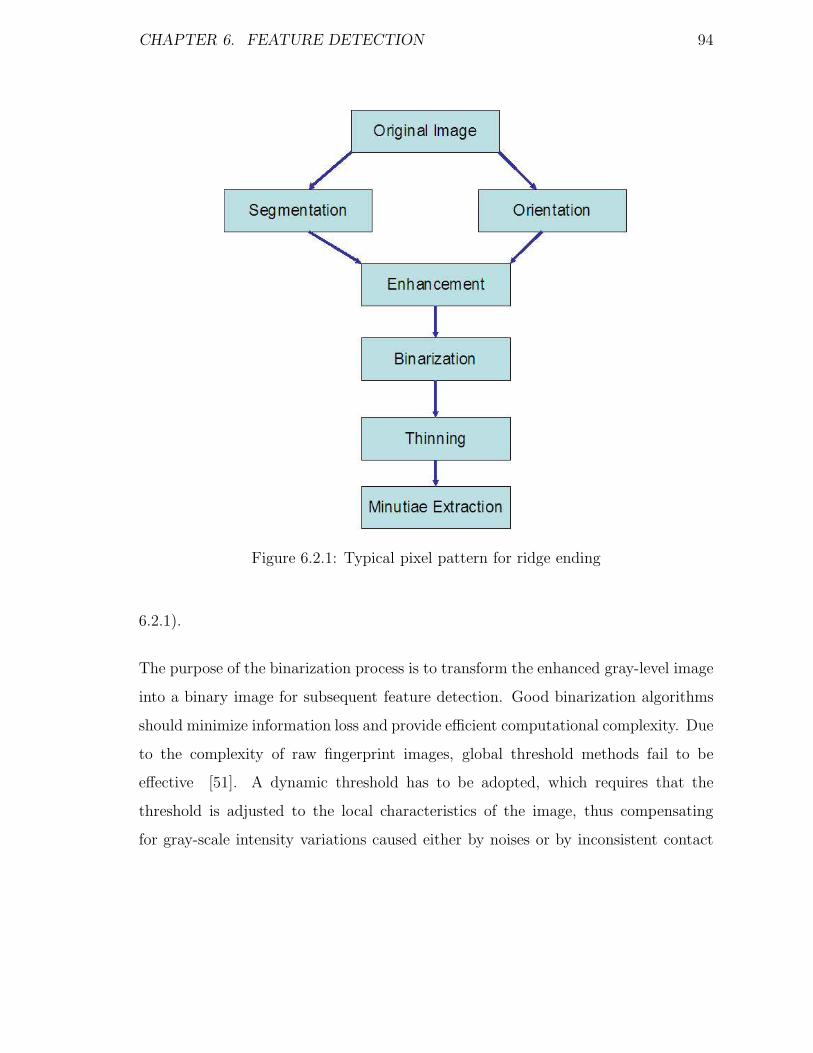
CHAPTER 6. FEATURE DETECTION 94
Figure 6.2.1: Typical pixel pattern for ridge ending
6.2.1).
The purpose of the binarization process is to transform the enhanced gray-level image
into a binary image for subsequent feature detection. Good binarization algorithms
should minimize information loss and provide efficient computational complexity. Due
to the complexity of raw fingerprint images, global threshold methods fail to be
effective [51]. A dynamic threshold has to be adopted, which requires that the
threshold is adjusted to the local characteristics of the image, thus compensating
for gray-scale intensity variations caused either by noises or by inconsistent contact
CHAPTER 6. FEATURE DETECTION 95
pressure during image acquisition.
The available fingerprint binarization methods are heavily dependent on the ridge
flow pattern characteristics of fingerprint images. Stock and Swonger [80] designed a
ridge valley filter mask (Figure 6.2.2), which is comprised of 8 slits along the eight
discrete directions and was first convolved with the image. There must exist a max-
imum average local gray-level intensity along the local ridge line orientation, if the
pixel is on a ridge line. Moayer and Fu [56] proposed an iterative algorithm using
repeated convolution by a Laplacian operator and a pair of dynamic thresholds which
are progressively moved towards an unique value. The pair of dynamic thresholds
change with each iteration and control the convergence rate to the binary pattern.
Xiao and Raafat [93] improved the method in [56] by incorporating a local threshold
method which takes into account of the contrast difference in local regions. Both
methods require repeated convolution operations and thus are time consuming. The
final binarization result relies on the choice of two dynamic thresholds. Coetzee and
Botha [21] first calculate the two binary images which are based on edge information
and gray-scale image profile respectively. Edge-based binary image is obtained by
filling in the area delimited by the edges. Gray-image based binary image is obtained
by the local threshold. The final binary image is the logical OR of two binary images.
The efficiency of this algorithm relies mainly on the efficiency of the edge detection
algorithm. Ratha et al. [70] proposed a binarization approach based on the peak
detection in the cross section gray-level profiles orthogonal to the local ridge orienta-
tion. The profiles are obtained by projecting pixel intensities onto the central section.
This method can not keep full width of the ridges, and tends to lose some information
because the resulting binary image can not truly reflect the original fingerprint image.
Domeniconi, Tari and Liang [22] observed that ridge pixels are local maxima along
the direction of one of the principal curvature where the other principal curvature is
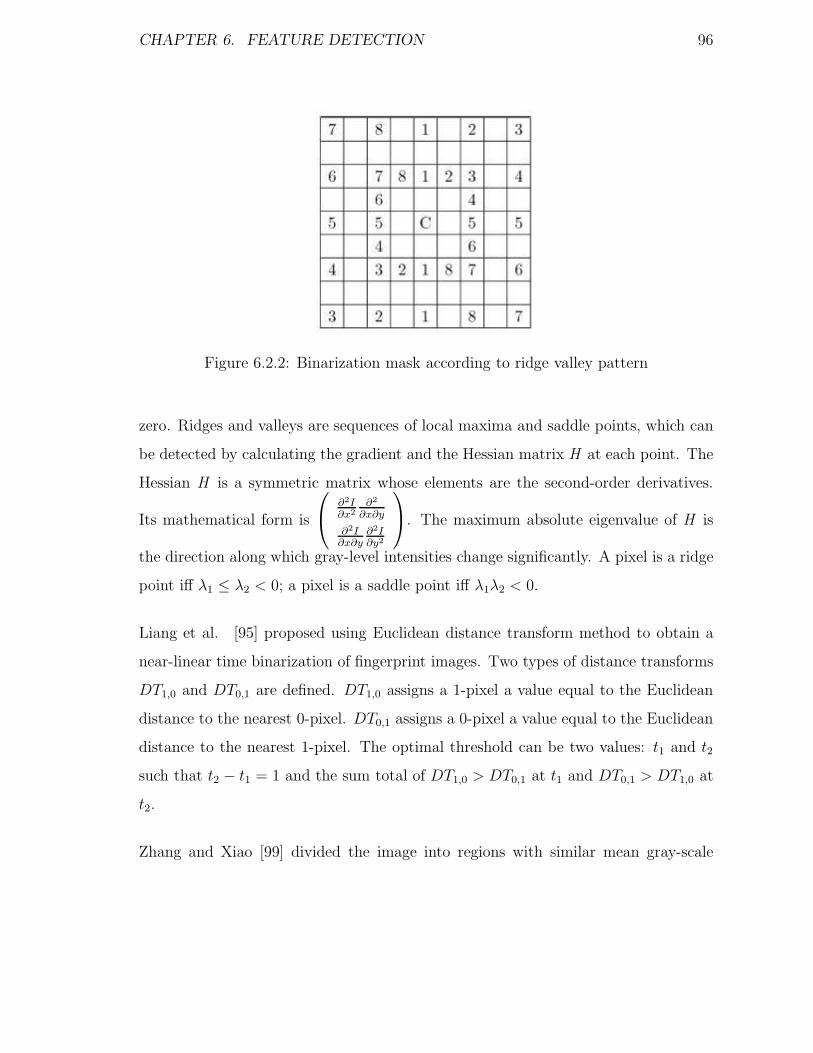
CHAPTER 6. FEATURE DETECTION 96
Figure 6.2.2: Binarization mask according to ridge valley pattern
zero. Ridges and valleys are sequences of local maxima and saddle points, which can
be detected by calculating the gradient and the Hessian matrix H at each point. The
Hessian H is a symmetric matrix whose elements are the second-order derivatives.
Its mathematical form is
∂2I∂x2
∂2
∂x∂y
∂2I∂x∂y
∂2I∂y2
. The maximum absolute eigenvalue of H is
the direction along which gray-level intensities change significantly. A pixel is a ridge
point iff λ1 ≤ λ2 < 0; a pixel is a saddle point iff λ1λ2 < 0.
Liang et al. [95] proposed using Euclidean distance transform method to obtain a
near-linear time binarization of fingerprint images. Two types of distance transforms
DT1,0 and DT0,1 are defined. DT1,0 assigns a 1-pixel a value equal to the Euclidean
distance to the nearest 0-pixel. DT0,1 assigns a 0-pixel a value equal to the Euclidean
distance to the nearest 1-pixel. The optimal threshold can be two values: t1 and t2
such that t2 − t1 = 1 and the sum total of DT1,0 > DT0,1 at t1 and DT0,1 > DT1,0 at
t2.
Zhang and Xiao [99] divided the image into regions with similar mean gray-scale
CHAPTER 6. FEATURE DETECTION 97
value for each block, and performed binarization with local threshold for each region
separately. they proposed robust uniform region generation scheme with well-designed
data structure which can be extended to image normalization.
Fingerprint thinning is usually implemented via morphological operation which re-
duces the width of ridges to a single pixel while preserving the extent and connectivity
of the original shape. Templates of 3× 3 and/or 3× 4, and 4× 3 windows are usually
utilized. Good fingerprint thinning algorithms should preserve the topology of the
object, keep the original connectivity, and generate few artifacts. A hole in ridge will
result in a skeleton with two spurious bifurcations, and a noise speckle will create two
spurious ridge endings. Therefore, it is critical to utilize regularization techniques,
which usually fill holes, remove small breaks, and eliminate ridge bridges [51]. Bazen
and Gerez [5] encode each 3 × 3 pixel neighborhood in a 9-bit integer. This number
is used as an index into a lookup table which contains the binary value after the
current thinning step. Two different lookup tables which both take care of a different
thinning direction are used iteratively, till the final skeleton is obtained.
An innovative rotation invariant thinning algorithm was proposed by Ahmed and
Ward in [2]. The method is iterative, but well-designed 20 rules can be applied
simultaneously to each pixel in the image, the system guarantees symmetrical thin-
ning, rotation invariance and high speed. The algorithm uses a set of rules over
8-neighbors of the pixel to be considered for deletion, but it can not properly handle
2-pixel wide lines. Authors extended the window to 20 pixels in all, and required
a set of rules to handle the 20 pixel set (around 220 possible configurations). Rock-
ett [72] improved the method of handling the case of the 2-pixel wide lines in [2] by
using two steps. Algorithm in [2] trims the image down to a skeleton which includes
2-pixel wide lines. A graph-based method determines whether a pixel in a two-pixel
wide line can be deleted without compromising the connectivity of the skeleton. This
CHAPTER 6. FEATURE DETECTION 98
rotation-invariant thinning algorithm was utilized in [64].
You et al. [98, 97] proposed a multiscale fingerprint thinning algorithm, which is
based on calculating the modulus minima of the wavelet transform. A random scale
of wavelet transform is first chosen to compute all wavelet minima. The obtained
skeleton ribbons of the underlying ridge (with the topologies of the ridge kept) are
thinner than the original shapes. A much smaller scale than the previous one is
selected to perform second wavelet transform. This procedure is repeated till one-
pixel wide ridge central line is eventually obtained. Experimental results showed that
relatively low computational time (than previous thinning methods) was achieved.
Run-length scanning with vertical and horizontal passes can improve the speed of the
fingerprint thinning task (Section 6.4).
After a skeleton of the fingerprint image is computed, extracting the minutiae from the
one-pixel wide ridge map is a trivial task. In the context of eight-connected neighbor
connectivity, a ridge ending point has only one neighbor. A bifurcation point possesses
more than two neighbors, and a normal ridge pixel has two neighbors. Minutiae
detection in a fingerprint skeleton is implemented by scanning thinned fingerprint
and counting the crossing number(cn) [51]. Therefore, the cn of the ridge ending
point, intermediate ridge point, and bifurcation point should be 1, 2 and more than
3, respectively. The cn can be defined as follows:
cn(p) =1
2
∑
i=1..8
|val(pimod8 − val(pi−1)| (6.2.1)
Where p0, p1..p7 are neighbors of p, val(p) ∈ (0, 1). Due to the limitations of the
skeletonization-based Minutiae Extraction, false minutiae caused by undesired spikes
and broken ridges need to be filtered by some heuristics [23, 70, 93].
CHAPTER 6. FEATURE DETECTION 99
6.2.2 Gray-Level Minutiae Extraction
Because the fingerprint image binarization might lead to information loss, and the
aberrations and irregularity of the binary fingerprint image adversely affect the fin-
gerprint thinning procedure, a relatively large number of spurious minutiae are in-
troduced by the binarization-thinning operations. Minutiae detection directly from
gray-level fingerprint images is a topic of research.
Based on the observation that a ridge line is composed of a set of pixels with local
maxima along one direction, Maio and Maltoni [49] proposed extracting the minutiae
directly from the gray-level image by following the ridge flow lines with the aid of the
local orientation field. This method attempts to find a local maximum relative to the
cross-section orthogonal to the ridge direction. From any starting point Pts(xc, yc)
with local direction θc in the fingerprint image, a new candidate point Ptn(xn, yn)
is obtained by tracing the ridge flow along the θc with fixed step of µ pixels from
Pts(xc, yc). A new section Ω containing the point Ptn(xn, yn) is orthogonal to θc.
The gray-level intensity maxima of Ω becomes Pts(xc, yc) to initiate another tracing
step. This procedure is iterated till all the minutiae are found. The optimal value
for the tracing step µ and section length σ are chosen based on the average width of
ridge lines. Jiang et al. [40] improved the method of Maio and Maltoni by choosing
dynamically the tracing step µ according to the change of ridge contrast and bending
level. A large step µ is used when the bending level of the local ridge is low and
intensity variations along the ridge direction is small. Otherwise a small step µ
value is used. Instead of tracing a single ridge, Liu et al. [41] proposed tracking a
central ridge and the two surrounding valleys simultaneously. In each cross section
Ω, a central maximum and two adjacent minima are located at each step, and the
ridge following step µ is dynamically determined based on the distance between the

CHAPTER 6. FEATURE DETECTION 100
lateral minima from the central maximum. Minutiae are extracted where the relation
〈minimum, maximum, minimum〉 is changed.
Linear Symmetry (LS) filter in [30, 57] is used to extract the minutiae based on
the concept that minutiae are local discontinuities of the LS vector field. Two types
of symmetries - parabolic symmetry and linear symmetry are adopted to model and
locate the points in the gray-scale image where there is lack of symmetry (Figure
6.2.3). If Dx and Dy represent the derivatives in x and y directions respectively, the
orientation tensor can be expressed as:
z = (Dx + iDy)2 (6.2.2)
The tensor Z can be implemented by convolving the gray-scale image with separable
Gaussians and their derivatives. A symmetry filter can be modeled by exp(imφ),
where m is its order. The following polynomial incorporated with a Gaussian window
function is utilized to approximate the symmetry filter:
hm = (x + iy)mexp(−x2 + y2
2σ2) (6.2.3)
In the fingerprint image, parabolic symmetry of order m = 1 is most similar to a
minutia point pattern. The following complex filtering can be applied to minutiae
detection:
PS =< z, h1 >=< (Dx + iDy)2, (x + iy).g(x, y) > (6.2.4)
Where 〈,〉 and g(x,y) represent 2D scalar product and Gaussian window, respectively.
Linear symmetry occurs at the points of coherent ridge flow. To detect linear sym-
metry reliably, second order complex moments I20 =< z, h0 > and I11 =< |z|, h0 >
are computed. The measure of LS is calculated as follows:
LS =I20
I11
=< z, h0 >
< |z|, h0 >(6.2.5)
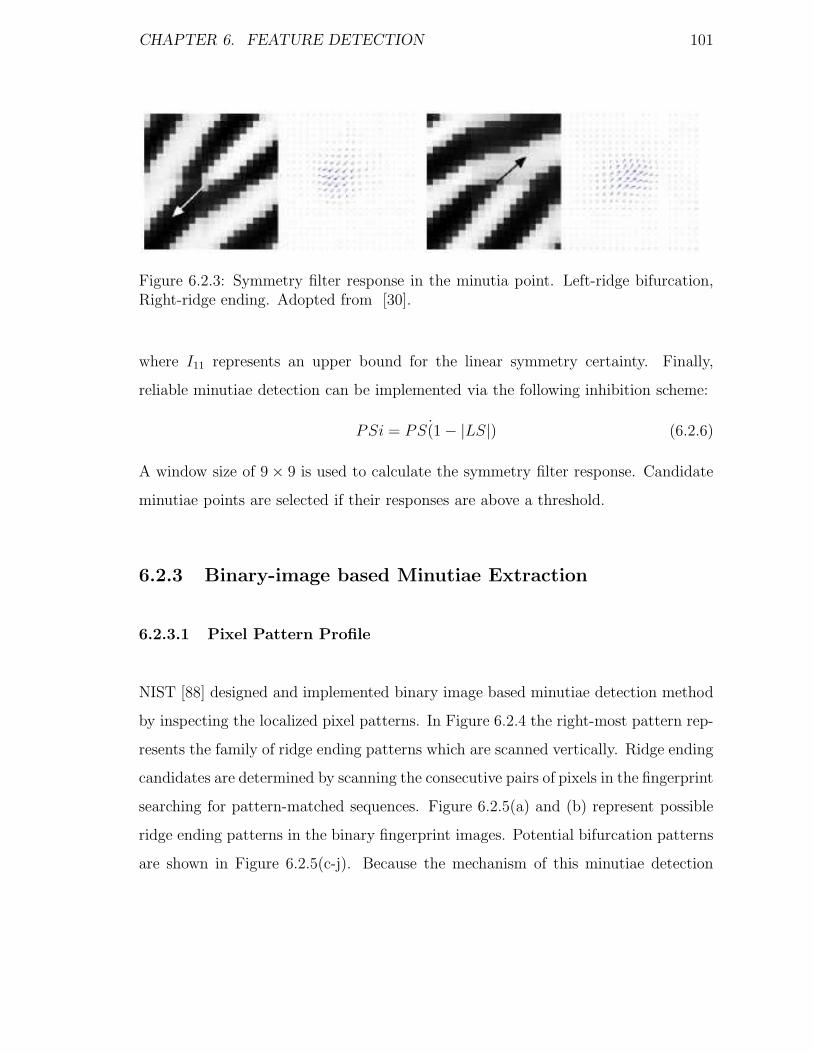
CHAPTER 6. FEATURE DETECTION 101
Figure 6.2.3: Symmetry filter response in the minutia point. Left-ridge bifurcation,Right-ridge ending. Adopted from [30].
where I11 represents an upper bound for the linear symmetry certainty. Finally,
reliable minutiae detection can be implemented via the following inhibition scheme:
PSi = PS (1 − |LS|) (6.2.6)
A window size of 9 × 9 is used to calculate the symmetry filter response. Candidate
minutiae points are selected if their responses are above a threshold.
6.2.3 Binary-image based Minutiae Extraction
6.2.3.1 Pixel Pattern Profile
NIST [88] designed and implemented binary image based minutiae detection method
by inspecting the localized pixel patterns. In Figure 6.2.4 the right-most pattern rep-
resents the family of ridge ending patterns which are scanned vertically. Ridge ending
candidates are determined by scanning the consecutive pairs of pixels in the fingerprint
searching for pattern-matched sequences. Figure 6.2.5(a) and (b) represent possible
ridge ending patterns in the binary fingerprint images. Potential bifurcation patterns
are shown in Figure 6.2.5(c-j). Because the mechanism of this minutiae detection
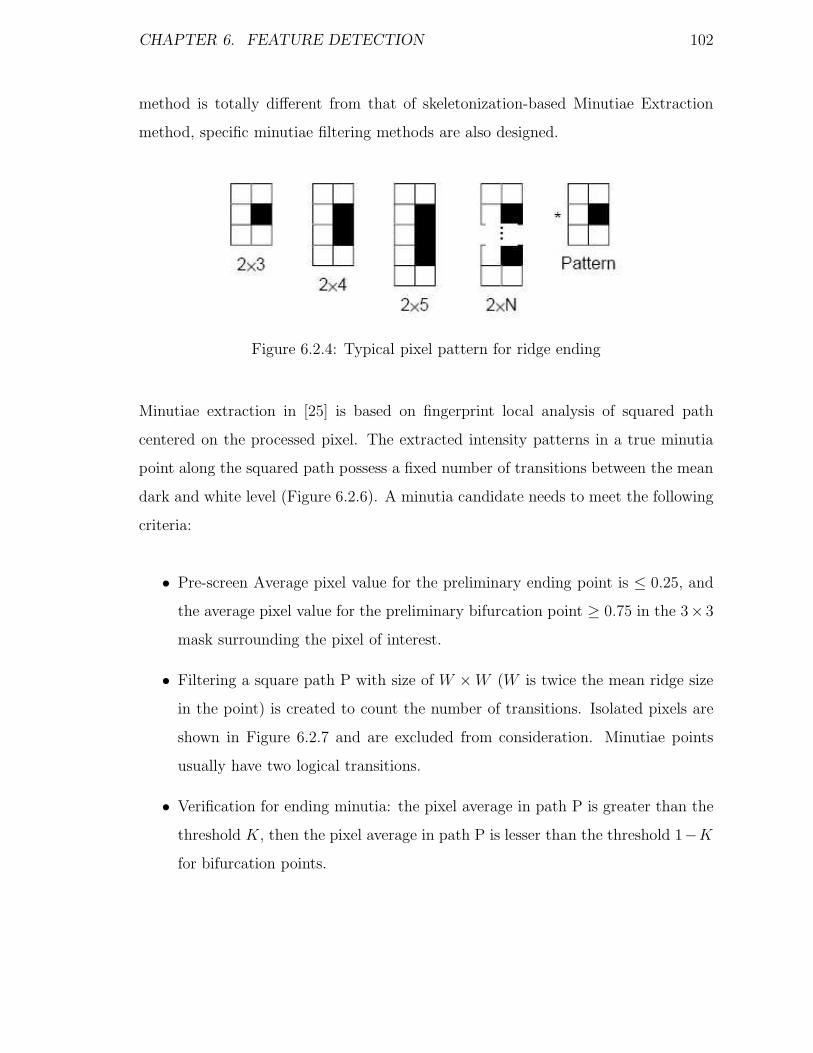
CHAPTER 6. FEATURE DETECTION 102
method is totally different from that of skeletonization-based Minutiae Extraction
method, specific minutiae filtering methods are also designed.
Figure 6.2.4: Typical pixel pattern for ridge ending
Minutiae extraction in [25] is based on fingerprint local analysis of squared path
centered on the processed pixel. The extracted intensity patterns in a true minutia
point along the squared path possess a fixed number of transitions between the mean
dark and white level (Figure 6.2.6). A minutia candidate needs to meet the following
criteria:
• Pre-screen Average pixel value for the preliminary ending point is ≤ 0.25, and
the average pixel value for the preliminary bifurcation point ≥ 0.75 in the 3× 3
mask surrounding the pixel of interest.
• Filtering a square path P with size of W × W (W is twice the mean ridge size
in the point) is created to count the number of transitions. Isolated pixels are
shown in Figure 6.2.7 and are excluded from consideration. Minutiae points
usually have two logical transitions.
• Verification for ending minutia: the pixel average in path P is greater than the
threshold K, then the pixel average in path P is lesser than the threshold 1−K
for bifurcation points.
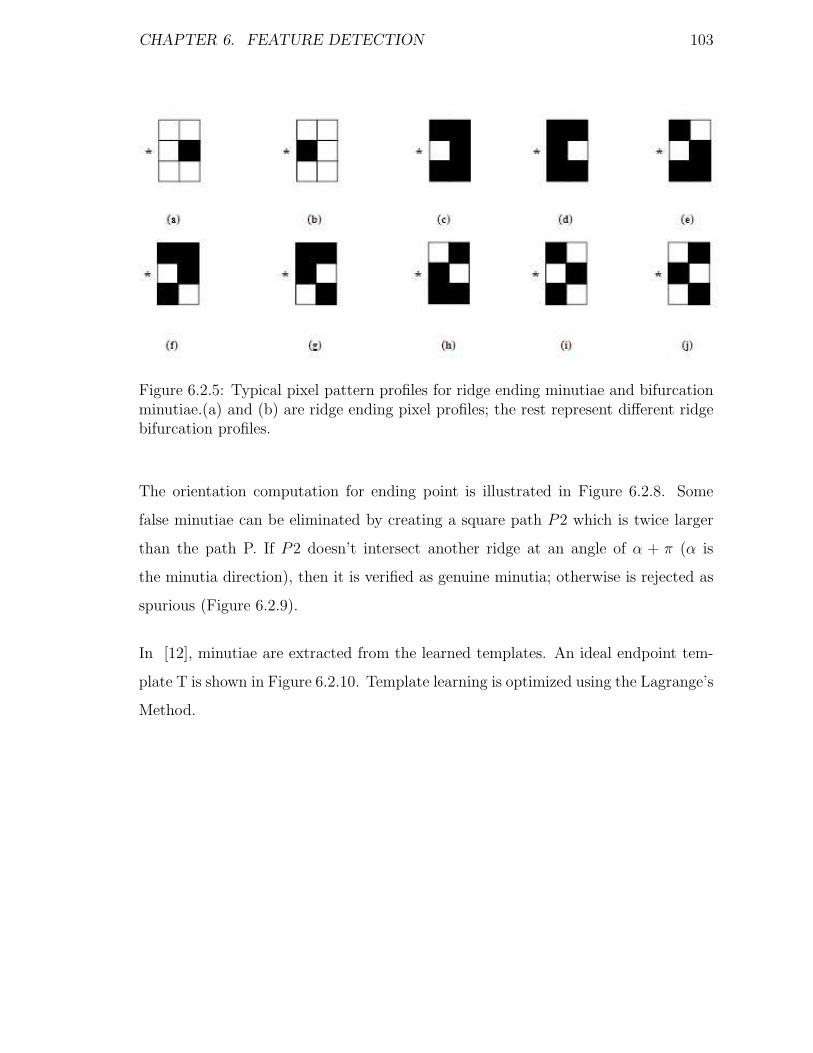
CHAPTER 6. FEATURE DETECTION 103
Figure 6.2.5: Typical pixel pattern profiles for ridge ending minutiae and bifurcationminutiae.(a) and (b) are ridge ending pixel profiles; the rest represent different ridgebifurcation profiles.
The orientation computation for ending point is illustrated in Figure 6.2.8. Some
false minutiae can be eliminated by creating a square path P2 which is twice larger
than the path P. If P2 doesn’t intersect another ridge at an angle of α + π (α is
the minutia direction), then it is verified as genuine minutia; otherwise is rejected as
spurious (Figure 6.2.9).
In [12], minutiae are extracted from the learned templates. An ideal endpoint tem-
plate T is shown in Figure 6.2.10. Template learning is optimized using the Lagrange’s
Method.
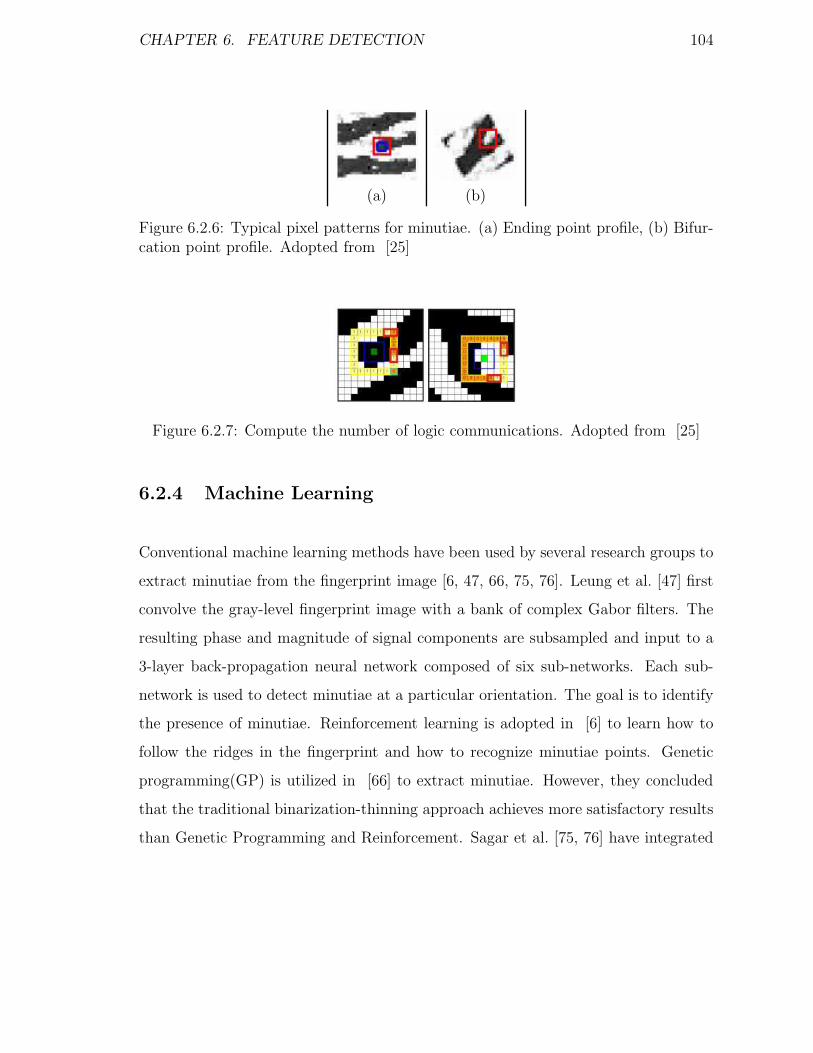
CHAPTER 6. FEATURE DETECTION 104
(a) (b)
Figure 6.2.6: Typical pixel patterns for minutiae. (a) Ending point profile, (b) Bifur-cation point profile. Adopted from [25]
Figure 6.2.7: Compute the number of logic communications. Adopted from [25]
6.2.4 Machine Learning
Conventional machine learning methods have been used by several research groups to
extract minutiae from the fingerprint image [6, 47, 66, 75, 76]. Leung et al. [47] first
convolve the gray-level fingerprint image with a bank of complex Gabor filters. The
resulting phase and magnitude of signal components are subsampled and input to a
3-layer back-propagation neural network composed of six sub-networks. Each sub-
network is used to detect minutiae at a particular orientation. The goal is to identify
the presence of minutiae. Reinforcement learning is adopted in [6] to learn how to
follow the ridges in the fingerprint and how to recognize minutiae points. Genetic
programming(GP) is utilized in [66] to extract minutiae. However, they concluded
that the traditional binarization-thinning approach achieves more satisfactory results
than Genetic Programming and Reinforcement. Sagar et al. [75, 76] have integrated
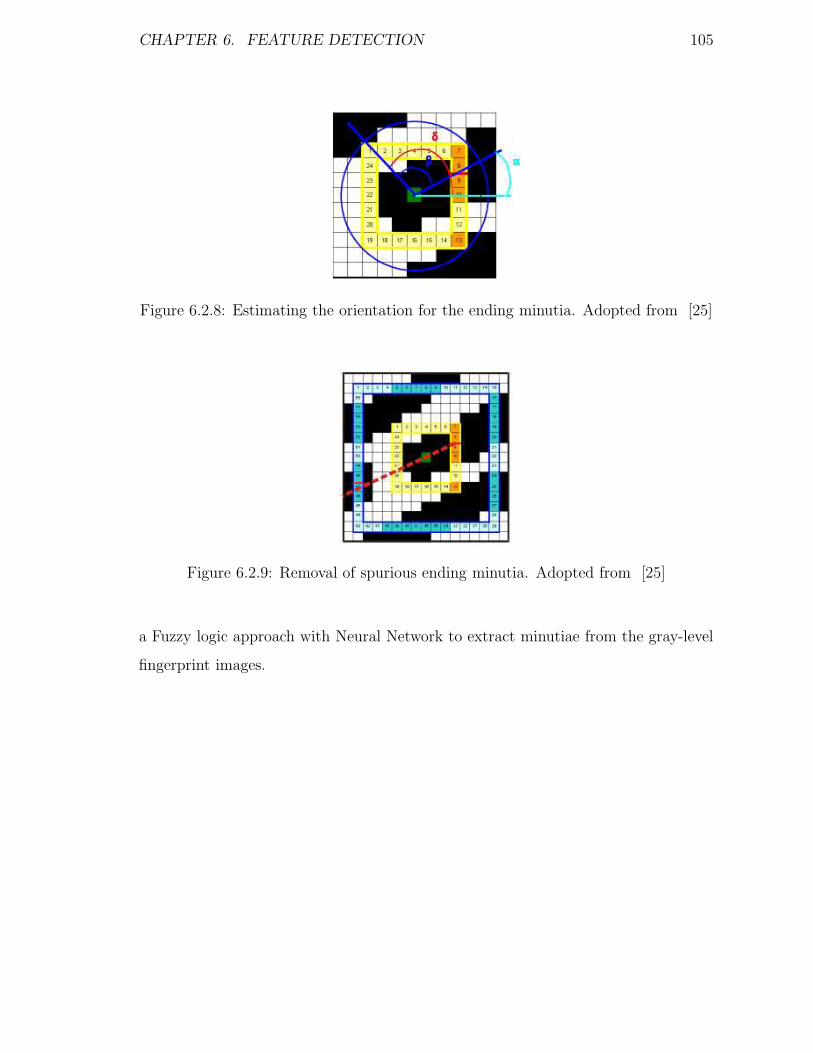
CHAPTER 6. FEATURE DETECTION 105
Figure 6.2.8: Estimating the orientation for the ending minutia. Adopted from [25]
Figure 6.2.9: Removal of spurious ending minutia. Adopted from [25]
a Fuzzy logic approach with Neural Network to extract minutiae from the gray-level
fingerprint images.

CHAPTER 6. FEATURE DETECTION 106
Figure 6.2.10: Typical template T for an ending minutia point. Adopted from [12]
6.3 Proposed Chain-code Contour Tracing Algo-
rithm
Commonly used minutiae extraction algorithms that are based on thinning are iter-
ative. They are computationally expensive and produce artifacts such as spurs and
bridges. We propose a chain coded contour tracing method to avoid these problems.
Chain codes yield a wide range of information about the contour such as curvature,
direction, length, etc. As the contour of the ridges is traced consistently in a counter-
clockwise direction, the minutiae points are encountered as locations where the con-
tour has a significant turn. Specifically, the ridge ending occurs as a significant left
turn and the bifurcation, as a significant right turn in the contour. Analytically, the
turning direction may be determined by considering the sign of the cross product of
the incoming and outgoing vectors at each point. The product is right handed if the
sign of the following equation is positive and left handed if the sign is negative (Figure
6.3.1(b)&(c)). If we assume that the two normalized vectors are Pin = (x1, y1) and
Pout = (x2, y2), then the turn corner is the ending candidate if sign(−→Pin ×
−−→Pout) > 0;
the turn corner is the bifurcation candidate if sign(−→Pin ×
−−→Pout) < 0 (see Figure 6.3.2).
The angle θ between the normalized vectors Pin and Pout is critical in locating the
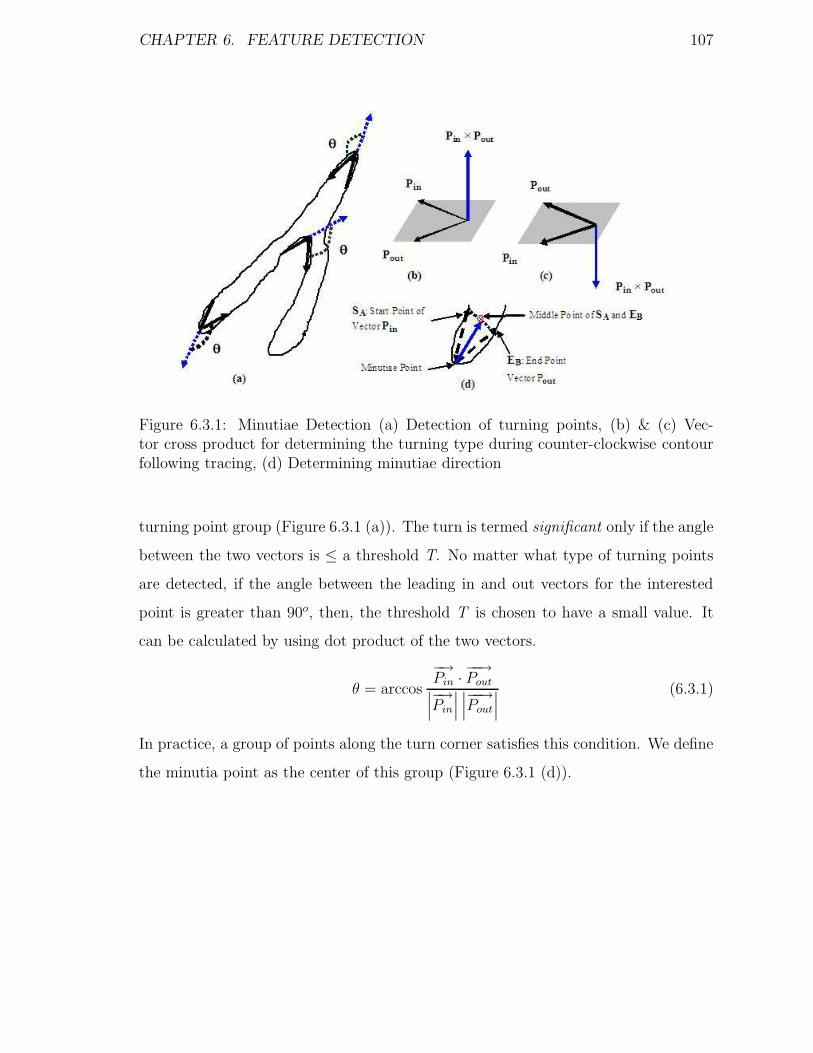
CHAPTER 6. FEATURE DETECTION 107
Figure 6.3.1: Minutiae Detection (a) Detection of turning points, (b) & (c) Vec-tor cross product for determining the turning type during counter-clockwise contourfollowing tracing, (d) Determining minutiae direction
turning point group (Figure 6.3.1 (a)). The turn is termed significant only if the angle
between the two vectors is ≤ a threshold T. No matter what type of turning points
are detected, if the angle between the leading in and out vectors for the interested
point is greater than 90o, then, the threshold T is chosen to have a small value. It
can be calculated by using dot product of the two vectors.
θ = arccos
−→Pin ·
−−→Pout
∣
∣
∣
−→Pin
∣
∣
∣
∣
∣
∣
−−→Pout
∣
∣
∣
(6.3.1)
In practice, a group of points along the turn corner satisfies this condition. We define
the minutia point as the center of this group (Figure 6.3.1 (d)).
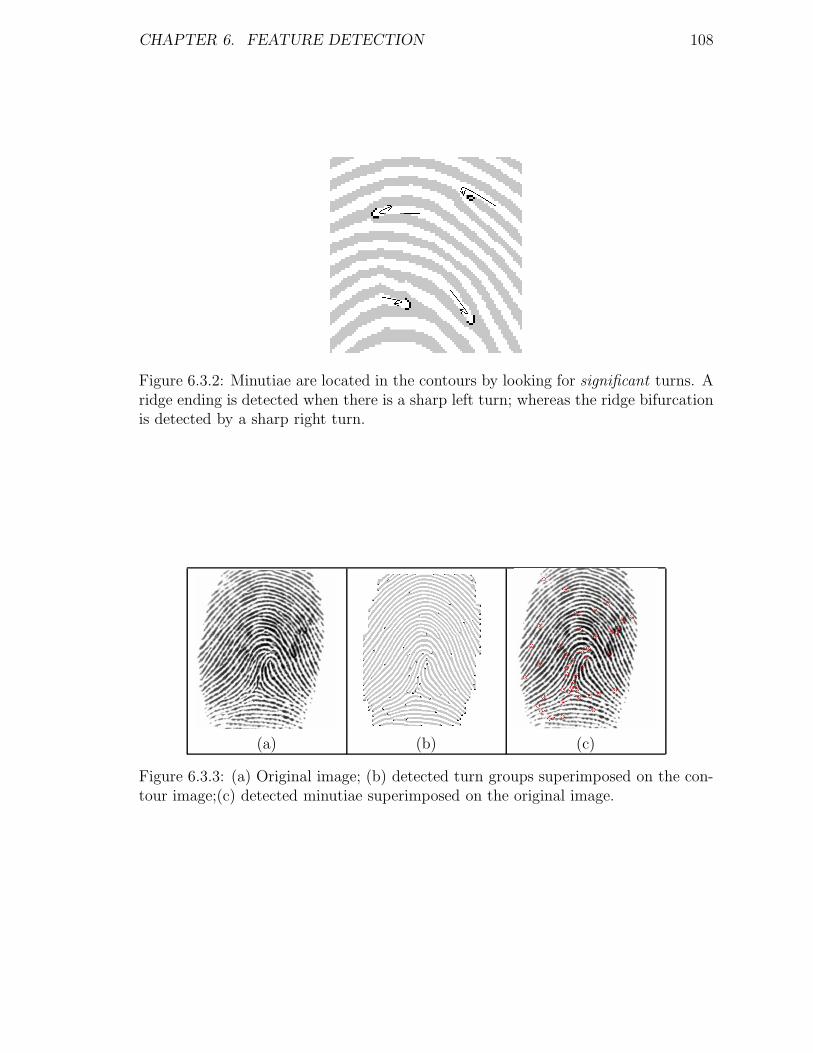
CHAPTER 6. FEATURE DETECTION 108
Figure 6.3.2: Minutiae are located in the contours by looking for significant turns. Aridge ending is detected when there is a sharp left turn; whereas the ridge bifurcationis detected by a sharp right turn.
(a) (b) (c)
Figure 6.3.3: (a) Original image; (b) detected turn groups superimposed on the con-tour image;(c) detected minutiae superimposed on the original image.

CHAPTER 6. FEATURE DETECTION 109
6.4 Proposed Run-length Scanning Algorithm
A good fingerprint image thinning algorithm should possesses the following character-
istics: fast computation, convergence to skeleton of unit width, work well on varying
ridge width, generate less spikes, preserve connectivity of skeleton, prevent excessive
erosion. The run-length-coding based method can speed up the thinning process be-
cause it does not need to go through multiple passes to get a thinned image of unit
width. It retains continuity because it calculates the medial point for each run, and
adjusts locally and adaptively the connectivities of consecutive runs in the same ridge
with the same labels. It reduces distortion in the junction area (singular points and
bifurcation points) by a new merging algorithm.
From the frequency map, the median frequency is used to calculate the threshold of
the run length. If the length of the horizontal run is greater than a threshold, it is
not used to calculate the medial point. Instead, the vertical run should be used to
calculate the medial point. Similarly, if the length of the vertical run is greater than
the threshold, this run should not be used to calculate the medial point. Instead the
horizontal run should be used.
6.4.1 Definitions
Two 2-dimensional arrays, f and t, are used to represent the original fingerprint image
and its skeleton, respectively. The pixel with the value of one and the pixel with the
value of zero represent objects and the background, respectively. Some definitions are
needed to describe the thinning method and feature detection algorithm. The mask
in Figure 6.4.1(a) is used for region labeling in the horizontal scan, and the mask in
Figure 6.4.1(b) is used for region labeling in the vertical scan. A simple modification

CHAPTER 6. FEATURE DETECTION 110
f(i−1, j−1) f(i−1, j) f(i−1, j+1)
f(i, j−1) f(i ,j)
f(i−1, j)f(i−1, j−1)
f(i, j)f(i, j−1)
f(i+1, j−1)
(a) (b)
Figure 6.4.1: Masks for region identification (a)Horizontal scan and (b)Vertical scan
needs to be made for column-runs.
Definition 6.4.1 Scanline – a one-pixel-wide horizontal (or vertical) line that crosses
the fingerprint image from left to right (or from up to down), is used to find the
horizontal runs (or vertical runs).
Definition 6.4.2 Horizontal runs – this deals with vertical or slanted ridges with an
angle greater than 45o and less than 135o. Find the pair of points (Point L and R) in
each horizontal run, i.e., L(i, j) = 0, L(i, j - 1) = 1, and L(i, j + 1) = 0; R(i, j)=
0, R(i, j - 1) = 0, and R(i, j + 1) = 1. If the length of run is less than or equal to a
threshold, calculate the medial point of this run.
In order to reduce the computational complexity, a simple threshold, instead of the
calculation of the run histogram, is used to find the runs for skeletonization.
Definition 6.4.3 Vertical runs – this deals with horizontal or slanted ridges with an
angle less than 45o or greater than 135o. Find the pair of points (Point U and D) in

CHAPTER 6. FEATURE DETECTION 111
1 1 1 1
1 1 1
1 1 1 1
1 1 1
1 1 1 1 1 1 1
1 1 1 1 1 1 1
1 1 1 1 1 1
1 1 1 1 1
2 2 2
2 2 2
2 2 2
1
1 1 1
1 1 1
1 1 1 1 1
1 1 1 1 1 1 1
1 1 1
1 1 1 1
1 1 1
2 2 2
2 2 2 2
2 2 2
(a) (b)
Figure 6.4.2: Illustration of junction runs. (a)Convergence run and (b)Divergencerun
each vertical run, i.e., U(i, j) = 0, U(i - 1, j) = 1, and U(i + 1, j) = 0; D(i, j)= 0,
R(i - 1, j) = 0, and R(i +1 , j) = 1. If the length of run is less than or equal to a
threshold, calculate the medial point of this run.
Definition 6.4.4 Convergence run – one relatively longer horizontal (vertical) run
that overlaps with two consecutive horizontal (vertical) runs in the previous scanline.
Refer to the filled run in Figure 6.4.2(a).
Definition 6.4.5 Divergence run – one relatively long horizontal (vertical) run over-
laps with two consecutive horizontal (vertical) runs in the next scanline. Refer to the
filled run in Figure 6.4.2(b).
Definition 6.4.6 Ending run – first run or last run for one fingerprint ridge. The
middle point of each ending run is the ending minutia candidate point.
Label collision appears to be very common occurrences in the bifurcation point regions
and singular point regions. The mask shape for horizontal scans is used to define the
label collision pixel (with question mark). L(i, j) is used to express the label of pixel(i,
j).

CHAPTER 6. FEATURE DETECTION 112
3 3 3
3 3 3 3
4 ?4
5 5 5 5 5 5 5
5 5 5 9/B ?
1 1 1
1 1 1
1 1
1 1 1 ?
2 2 2
2 2
2 2 2
(a) (b) (c)
Figure 6.4.3: Illustration of label collision types. (a)Label collision type A, (b) Labelcollision type B, and (c)Label collision type C
Definition 6.4.7 Label collision type A – it usually appears in the protrusive parts
of the ridge. It meets the following two constraints: (1)L(i, j − 1) > L(i − 1, j +
1); (2)L(i − 1, j − 1) 6= L(i, j − 1)(Figure 6.4.3(a)).
Definition 6.4.8 Label collision type B – it usually appears in the middle pixels of the
second run which overlaps with divergence run. It meets the following two constraints:
(1) L(i, j − 1) > L(i − 1, j + 1); (2)L(i − 1, j − 1) = 0 (Figure 6.4.3(b)).
Definition 6.4.9 Label collision type C – it usually appears in the convergence run,
i.e., cross section in the ridge line of “Y” shape. It meets the following two conditions:
(1)L(i, j − 1) < L(i − 1, j + 1); (2)L(i− 1, j) = 0(Figure 6.4.3(c)).
6.4.2 One-pass embedding labeling run-length-wise thinning
and minutiae detection algorithm
We need only one pass to get runs for fingerprint images, and simultaneously label
according to the order of the masks described in Figure 2. The runs, which contain
bifurcation point, will be detected when label collisions occur. For the case of hori-
zontal scan, we start scanning from left to right, and up to down. For vertical scan,

CHAPTER 6. FEATURE DETECTION 113
we start scanning from up to down, left to right. If one relatively longer run overlaps
with below two consecutive runs, one run has the same label with the longer run,
and the other has a different label, the phenomenon of label collision type type A will
occur, so the longer run will be a divergence run. If one relatively long run overlaps
with above two consecutive runs, one run has the same label with the longer run,
and the other has different label. The phenomenon of label collision type type C will
occur, so the longer run will be the convergence run. The data structure for the run is:
start point, end point, medial point coordinates, label and parent run. For each label,
the standard depth-first graph traversal algorithm is used to track consecutive runs
and make a minor local adjustment to maintain local connectivity. We have modified
the line adjacency graph data structure [65], because there are more ridges (strokes
in character recognition) in the fingerprint image. The stack data structure for each
label is: label, top run, number counter, runs (record of each run order number). For
the divergence runs and convergence runs, the data structure is coordinates, junction
type, label, run and index. The details for the algorithm are as follows (This is for
horizontal scans. Similar method exists for vertical scans):
1. Initialize L(nr, nc), nr and nc–row and column number of the fingerprint
image respectively. set the run length threshold value.
2. for each scanline
3. for each pixel
4. if the start point for one run is found
5. check L(i-1,j-1),L(i-1,j+1) and L(i, j-1)
6. case 1: if L(i − 1, j − 1) 6= 0, and the label of previous run
equals to L(i-1,j-1), and the row coordinate equal
to current scanline, record it in the bifurcation
point array

CHAPTER 6. FEATURE DETECTION 114
7. increase bifurcation run counter
8. record index,run number, medial point coordinates
9. increase label value by 1, record junction type
to divergence
10. case 2: if either of L(i − 1, j) and L(i − 1, j + 1)
is not equal to zero,
11. set L(i,j) = L(i-1, j) or L(i-1, j+1)
12. set the label of current run to L(i,j)
13. case 3: Otherwise, set the new label for current run, and
increase the label value by 1
14. check the ending point for the run, two cases
15. if current pixel is the last element for this scanline
16. record the ending point, run length, medial point coordinates
17. if there is label collision type C in current run,
record it in the bifurcation point array
18. increase bifurcation run counter
19. record index, type, run number, medial point coordinates
20. increase label value by 1
21. if current pixel is the last element for current run
22. record the ending point, run length, medial point coordinate
23. check whether label collision type B occurs
24. decrease label number by 1 to compensate wrong label
started from the starting point of current run
25. set L(i,j) = L(i-1, j+1)
26. check whether label collision type A occur and
27. if L(i-1, j-1)= 0 and the y coordinate of the
top element for L(i, j-1) equals to that of
CHAPTER 6. FEATURE DETECTION 115
the top element for L(i-1,j+1)
28. record bifurcation point as step 7–9
29. check whether label collision type C occurs
30. if yes, record bifurcation point as step 7–9
31. if current pixel is the middle element of one run.
32 repeat step 22-28
6.5 Minutiae Verification and Filtering
Although there are a lot of minutiae detection algorithms available in the literature,
minutiae detection accuracy can not reach 100%. Before minutiae filtering and verifi-
cation, minutiae detection accuracy could be relatively low because there are always
some missing minutiae and/or spurious minutiae in the extracted minutiae set. There
are some common spurious minutiae filtering techniques such as removal of islands
(ridge ending fragments and spurious ink marks) and lakes (interior voids in ridges),
and boundary minutiae filtering. Each detection algorithm needs ad hoc spurious
filtering methods.
6.5.1 Structural Methods
Xiao and Faafat [93] combined statistical and structural approaches to post-process
detected minutiae (Figure 6.5.1). The minutiae were associated with the length of
corresponding ridges, the angle, and the number of facing minutiae in a neighborhood.
This rule-based algorithm connected ending minutiae(Figure 6.5.1 (a) and (b)) that
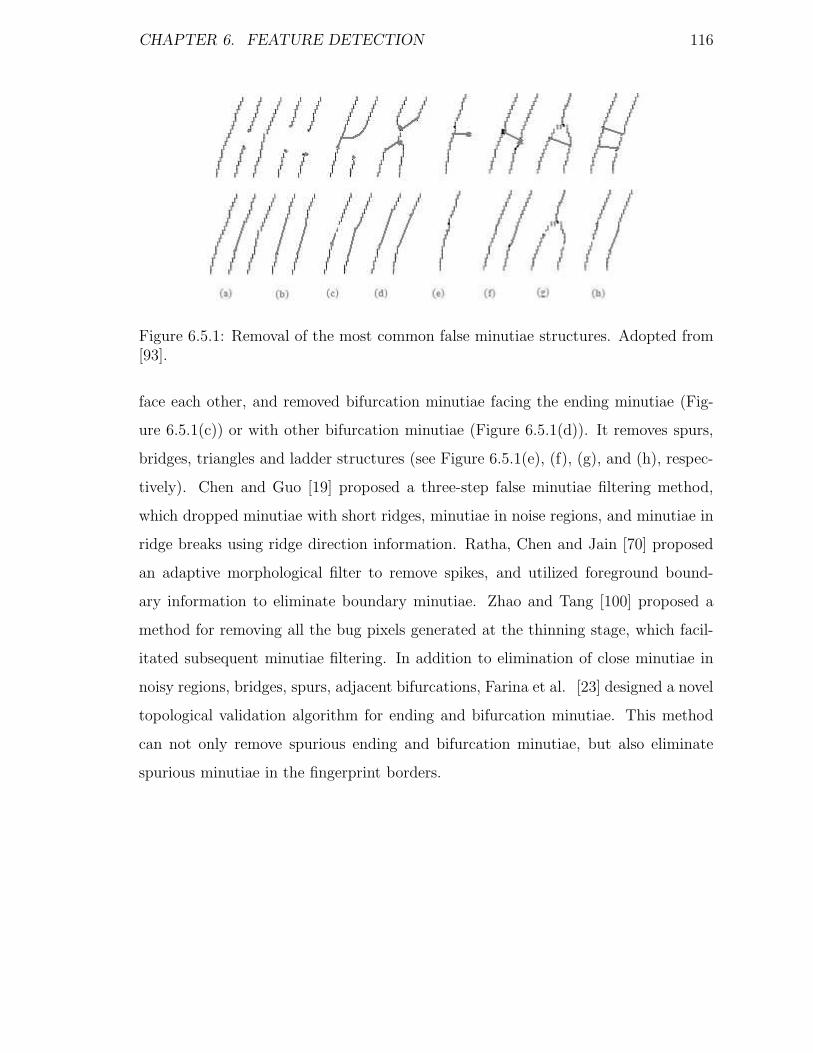
CHAPTER 6. FEATURE DETECTION 116
Figure 6.5.1: Removal of the most common false minutiae structures. Adopted from[93].
face each other, and removed bifurcation minutiae facing the ending minutiae (Fig-
ure 6.5.1(c)) or with other bifurcation minutiae (Figure 6.5.1(d)). It removes spurs,
bridges, triangles and ladder structures (see Figure 6.5.1(e), (f), (g), and (h), respec-
tively). Chen and Guo [19] proposed a three-step false minutiae filtering method,
which dropped minutiae with short ridges, minutiae in noise regions, and minutiae in
ridge breaks using ridge direction information. Ratha, Chen and Jain [70] proposed
an adaptive morphological filter to remove spikes, and utilized foreground bound-
ary information to eliminate boundary minutiae. Zhao and Tang [100] proposed a
method for removing all the bug pixels generated at the thinning stage, which facil-
itated subsequent minutiae filtering. In addition to elimination of close minutiae in
noisy regions, bridges, spurs, adjacent bifurcations, Farina et al. [23] designed a novel
topological validation algorithm for ending and bifurcation minutiae. This method
can not only remove spurious ending and bifurcation minutiae, but also eliminate
spurious minutiae in the fingerprint borders.

CHAPTER 6. FEATURE DETECTION 117
6.5.2 Learning Methods
Based on gray-scale profile of detected minutiae, several methods utilize machine
learning techniques to validate and verify reliability of minutiae. Bhanu, Boshra and
Tan [11] verify each minutia through correlation with logical templates along the
local ridge direction. Maio and Maltoni [50] propose a shared-weights neural network
verifier for their gray-scale minutiae detection algorithm [49]. The original gray-level
image is first normalized with respect to their angle and the local ridge frequency, and
the dimensionality of the normalized neighborhoods is reduced through Karhunen-
Loeve transform [33]. Based on the ending/bifurcation duality characteristics, both
the original neighborhood and its negative version are used to train and classify. Their
experimental results demonstrate that the filtering method offers significant reduction
in spurious minutiae and flipped minutiae, even though there is some increase in the
number of missed minutiae.
Chikkerur et al. [20] propose a minutiae verifier based on Gabor texture informa-
tion surrounding the minutiae. Prabhakar et al. [67] verify minutiae based on the
gray-scale neighborhoods extracted from normalized and enhanced original image. A
Learning Vector Quantizer [45] is used to classify the resulting gray-level patterns
so that genuine minutiae and spurious minutiae are discriminated in a supervised
manner.
6.5.3 Minutiae verification and filtering rules for chain-coded
contour tracing method
The feature extraction process is inexact and results in the two forms of errors outlined
below.

CHAPTER 6. FEATURE DETECTION 118
1. Missing minutiae: The feature extraction algorithm fails to detect existing minu-
tia when the minutiae is obscured by surrounding noise or poor ridge structures.
2. Spurious minutia: The feature extraction algorithm falsely identifies a noisy
ridge structure such as a crease, ridge break or gaps as minutiae.
The causes for the spurious minutiae are very particular to the feature extraction
process. In our approach, spurious minutiae are generated mostly by irregular or
discontinuous contours. Therefore, minutiae extraction is usually followed by a post-
processing step that tries to eliminate the false positives. It has been shown that this
refinement can result in considerable improvement in the accuracy of a minutia based
matching algorithm.
We use a set of simple heuristic rules to eliminate false minutiae (See Figure 6.5.2)
1. We merge the minutiae that are within a certain distance of each other and
have similar angles. This is to merge the false positives that arise out of dis-
continuities along the significant turn of the contour.
2. If the direction of the minutiae is not consistent with the local ridge orientation,
then it is discarded. This removes minutiae that arise out of noise in the contour.
3. We remove the pair of opposing minutiae that are within a certain distance of
each other. This rule removes the minutiae that occur at either ends of a ridge
break.
4. If the local structure of a ridge or valley ending is not Y-shaped and too wide,
then it is removed because it lies on a malformed ridge and valley structure.
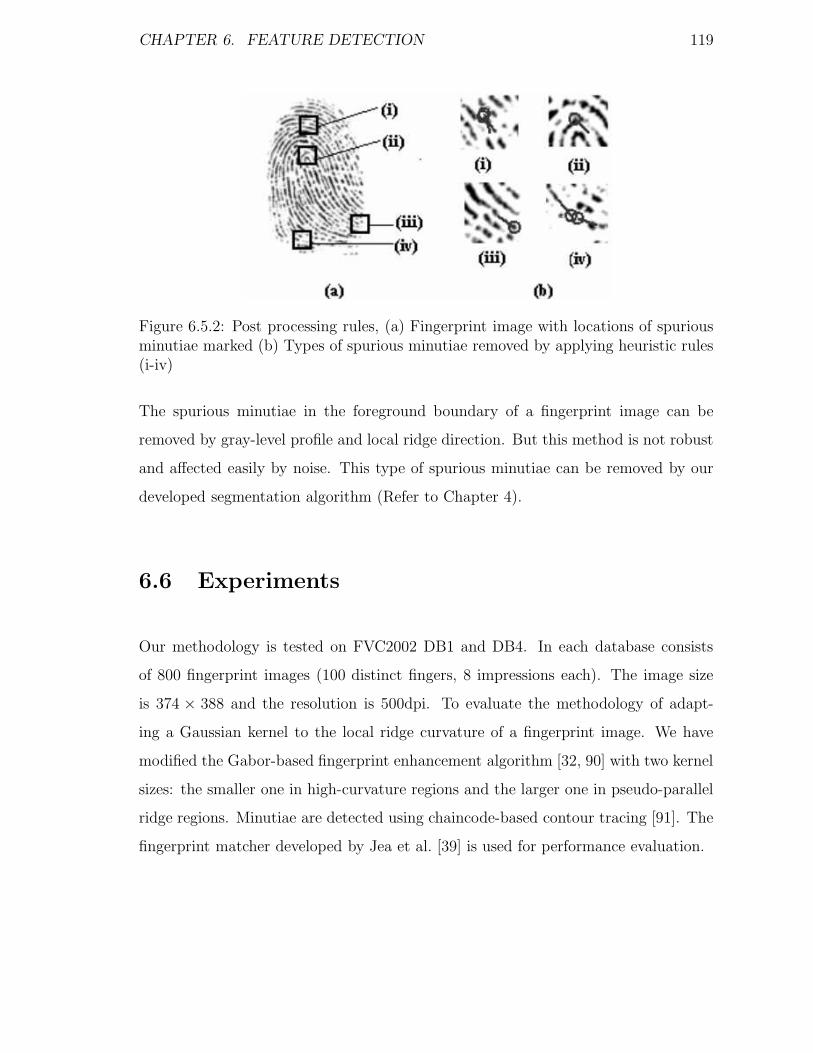
CHAPTER 6. FEATURE DETECTION 119
Figure 6.5.2: Post processing rules, (a) Fingerprint image with locations of spuriousminutiae marked (b) Types of spurious minutiae removed by applying heuristic rules(i-iv)
The spurious minutiae in the foreground boundary of a fingerprint image can be
removed by gray-level profile and local ridge direction. But this method is not robust
and affected easily by noise. This type of spurious minutiae can be removed by our
developed segmentation algorithm (Refer to Chapter 4).
6.6 Experiments
Our methodology is tested on FVC2002 DB1 and DB4. In each database consists
of 800 fingerprint images (100 distinct fingers, 8 impressions each). The image size
is 374 × 388 and the resolution is 500dpi. To evaluate the methodology of adapt-
ing a Gaussian kernel to the local ridge curvature of a fingerprint image. We have
modified the Gabor-based fingerprint enhancement algorithm [32, 90] with two kernel
sizes: the smaller one in high-curvature regions and the larger one in pseudo-parallel
ridge regions. Minutiae are detected using chaincode-based contour tracing [91]. The
fingerprint matcher developed by Jea et al. [39] is used for performance evaluation.
CHAPTER 6. FEATURE DETECTION 120
Our methodology has been tested on low quality images from FVC2002. To validate
the efficiency of the proposed segmentation method, the widely-used Gabor filter-
based segmentation algorithm [4, 78] and NIST segmentation [14] are utilized for
comparison.
Our segmentation method has an advantage over other methods in terms of boundary
spurious minutiae filtering. Figure 6.6.1 (a) and (b) show unsuccessful boundary
minutiae filtering using the NIST method [14]. It removes spurious minutiae pointing
to invalid blocks and removes spurious minutiae near invalid blocks.Invalid blocks
are defined as blocks with no detectable ridge flow. However, boundary blocks are
more complicated. So the method in [14] fails to remove most of the boundary
minutiae. Figures 6.6.1 (c) and (d) show the filtering results of our method. In
Comparing Figure 6.6.1(a) against (c) and (b) and (d), 30 and 17 boundary minutiae
are filtered, respectively. Performance evaluations for FVC2002 DB1 and DB4 are
shown in Figure 6.6.2. For DB1, ERR for false boundary minutiae filtering using
our proposed segmented mask is 0.0106 and EER while for NIST boundary filtering
is 0.0125. For DB4, ERR for false boundary minutiae filtering using our proposed
segmented mask is 0.0453 and EER while for NIST boundary filtering is 0.0720.
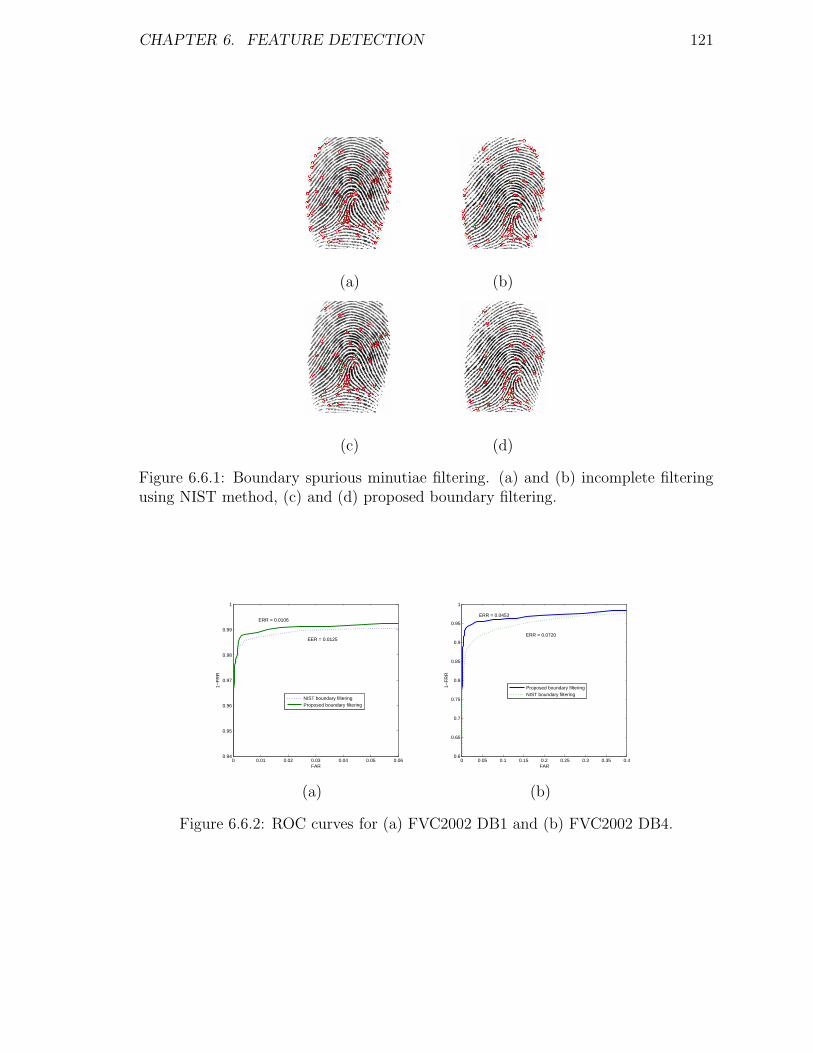
CHAPTER 6. FEATURE DETECTION 121
(a) (b)
(c) (d)
Figure 6.6.1: Boundary spurious minutiae filtering. (a) and (b) incomplete filteringusing NIST method, (c) and (d) proposed boundary filtering.
0 0.01 0.02 0.03 0.04 0.05 0.060.94
0.95
0.96
0.97
0.98
0.99
1
FAR
1−F
RR
NIST boundary filtering Proposed boundary filtering
ERR = 0.0106
EER = 0.0125
0 0.05 0.1 0.15 0.2 0.25 0.3 0.35 0.40.6
0.65
0.7
0.75
0.8
0.85
0.9
0.95
1
FAR
1−F
RR
Proposed boundary filteringNIST boundary filtering
ERR = 0.0453
ERR = 0.0720
(a) (b)
Figure 6.6.2: ROC curves for (a) FVC2002 DB1 and (b) FVC2002 DB4.
Chapter 7
Conclusions
The contributions of this thesis are:
• Novel fingerprint image quality classification metrics are proposed for automat-
ically selecting fingerprint preprocessing and enhancement parameters.
• Innovative corner point feature based segmentation method with efficient bound-
ary spurious minutiae filtering capability. Noisy corner points are eliminated as
outliers using Otsu’s thresholding of Gabor features.
• Adaptive image enhancement filter design depends on the topology of the ridge
pattern. Simple gradient based coherence map is used to locate high curvature
regions around core and/or delta point(s). Statistical texture features are used
to separate noisy regions from singular regions.
• Two thinning-free feature detection algorithms have been developed to produce
high accuracy feature sets. The minutiae verification and filtering rules for
chain-coded contour tracing algorithm are have been implemented.
122

CHAPTER 7. CONCLUSIONS 123
Image quality is related directly to the final performance of automatic fingerprint au-
thentication systems. Good quality fingerprint images need only minor preprocessing
and enhancement for accurate feature detection algorithm. But low quality fingerprint
images need preprocessing to increase contrast, and reduce different types of noises.
An adaptive segmentation algorithm and enhancement filter must be designed. Hy-
brid image quality measures are proposed in this thesis to classify fingerprint images
and perform corresponding automatic selection of preprocessing parameters. Band-
limited ring-wedge spectrum energy of the Fourier transform is used to characterize
the global ridge flow pattern. Local statistical texture features are used to charac-
terize block-level features. Combination of image quality measure in the frequency
domain and in the spatial domain can provide quantitative quality estimation. Our
method considers the size of fingerprint ridge flows, partial fingerprint image informa-
tion such as appearance of singularity points, the distance between singularity points
and the closest foreground boundary.
When some background is included in the segmented regions of interest, noisy pixels
also generate a lot of spurious minutiae because these noisy pixels are also enhanced
during preprocessing and enhancement steps. It is difficult to determine the threshold
value in blockwise segmentation methods, because one does not know what percentage
of pixels in the boundary blocks belong to foreground. Therefore, it is impossible for
blockwise segmentation to filter boundary spurious minutiae. We take advantage of
the strength property of the Harris corner point, and perform statistical analysis of
Harris corner points in the foreground and the background. It is found that the
strength of the Harris corner points in the ridge regions is usually much higher than
that in the non-ridge regions. Although some Harris points possess high strength
and can not be removed by thresholding, they lie on noisy regions with low Gabor
response, and so can be eliminated as outliers. The foreground boundary contour is
CHAPTER 7. CONCLUSIONS 124
located among remaining Harris points by the convex hull method.
Fingerprint ridge flow patterns can be categorized into two types: pseudo-parallel
ridges and high-curvature ridges surrounding singular points. Enhancement filters
should follow the ridge topological patterns, and filter window size in the regions
of different ridge patterns should be dynamically adjusted to local ridge flow. In
order to repair broken ridges, clean noise in the valley, and retain local ridge flow
shapes, accurate ridge orientation estimation is critical. In order to deal with the
problem of ambiguous ridge orientations at singular points like minutiae or cores and
deltas, some models have been proposed which allow the co-existence of multiple ridge
orientations at a single point. However, it is then difficult to perform enhancement if
there is no local dominant ridge direction. We introduce the coherence map to locate
high-curvature regions. Local ridge direction is filtered with Gaussian kernel size
adapted to the local ridge topology. Furthermore, local statistical texture features
are used to distinguish singular regions with noisy smudge regions, even though the
coherence values in the two regions are similar.
Gray-level minutiae extraction algorithm works well only for good quality fingerprint
images. Thinning based minutiae detection algorithms are time-consuming, and the
position of detected minutiae shifts by the ridge width. Irregularity and abberation
of ridge flows produce spurious minutiae. Two thinning-free minutiae extraction
methods are proposed, and the minutiae filtering algorithms for chain-coded contour
tracing method have been developed.
Bibliography
[1] M. Ahmed and R. Ward. A rotation invariant rule-based thinning algorithm for
character recognition. Pattern Analysis and Machine Intelligence, IEEE Trans-
actions on, 24(12):1672–1678, 2002.
[2] A. Almansa and T. Lindeberg. Fingerprint enhancement by shape adaptation
of scale-space operators with automatic scale selection. IEEE Transactions on
Image Processing, 9(12):2027–2042, 2000.
[3] F. Alonso-Fernandez, J. Fierrez-Aguilar, and J. Ortega-Garcia. An enhanced
gabor filter-based segmentation algorithm for fingerprint recognition systems. In
Proceedings of the 4th International Symposium on Image and Signal Processing
and Analysis(ISPA 2005), pages 239–244, 2005.
[4] A.M.Bazen and S.H.Gerez. “Achievement and challenges in fingerprint recogni-
tion”. In Biometric Solutions for Authentication i an e-World, pages pp.23–57,
2002.
[5] S. A.M.Bazen, M. Van Otterlo and M. Poel. “Areinforcement learning agent
for minutiae extraction from fingerprints”. In Proc. BNAIC, pages pp.329–336,
2001.
125
BIBLIOGRAPHY 126
[6] American national standard for information systems, data format for the inter-
change of fingerprint information, 1993. Doc# ANSI/NIST-CSL 1-1993.
[7] A. Bazen and S. Gerez. Segmentation of fingerprint images. In Proc. Workshop
on Circuits Systems and Signal Processing (ProRISC 2001), pages pp. 276–280,
2001.
[8] A. M. Bazen and S. H. Gerez. Systematic methods for the computation of
the directional fields and singular points of fingerprints. Pattern Analysis and
Machine Intelligence, IEEE Transactions on, 24(7):905–919, 2002. 0162-8828.
[9] A. M. Bazen and S. H. Gerez. “Fingerprint matching by thin-plate spline mod-
eling of elastic deformations”. Pattern Recognition, 36(8):1859–1867, 2003.
[10] B. Bhanu, M. Boshra, and T. Xuejun. Logical templates for feature extrac-
tion in fingerprint images. In International Conference on Pattern Recognition,
volume 2, pages 846–850 vol.2, 2000.
[11] B. Bhanu and T. Xuejun. Learned templates for feature extraction in fingerprint
images. In Computer Vision and Pattern Recognition (CVPR), volume 2, pages
II–591–II–596 vol.2, 2001.
[12] B. Bir and T. Xuejun. “Fingerprint indexing based on novel features of minutiae
triplets”. Pattern Analysis and Machine Intelligence, IEEE Transactions on,
25(5):616–622, 2003.
[13] G. T. Candela, P. J. Grother, C. I. Watson, R. A. Wilkinson, and C. L. Wilson.
“PCASYS - a pattern-level classification automation system for fingerprints”.
Technical Report NISTIR 5647, American National Standards Institute, 1995.
BIBLIOGRAPHY 127
[14] R. Cappelli, A. Lumini, D. Maio, and D. Maltoni. Fingerprint classification by
directional image partitioning. Pattern Analysis and Machine Intelligence, IEEE
Transactions on, 21(5):402–421, 1999. 0162-8828.
[15] R. Cappelli, D. Maio, J. L. Wayman, and A. K. Jain. “Performance evaluation
of fingerprint verification systems”. IEEE Transactions on Pattern Analysis and
Machine Intelligence, 28(1):3–18, 2006.
[16] X. Chen, J. Tian, J. Cheng, and X. Yang. Segmentation of fingerprint im-
ages using linear classifier. EURASIP Journal on Applied Signal Processing,
2004(4):480–494, 2004. doi:10.1155/S1110865704309194.
[17] Y. Chen, S. Dass, and A. Jain. “Fingerprint quality indices for predicting au-
thentication performance”. AVBPA, pages 160–170, 2005.
[18] Z. Chen and C. H. Kuo. A topology-based matching algorithm for fingerprint
authentication. In IEEE International Carnahan Conference on Security Tech-
nology, pages 84–87, 1991.
[19] S. Chikkerur, V. Govindaraju, S. Pankanti, R. Bolle, and N. Ratha. Novel ap-
proaches for minutiae verification in fingerprint images. In Seventh IEEE Work-
shops on Application of Computer Vision (WACV/MOTION’05), volume 1,
pages 111–116, 2005.
[20] L. Coetzee and E. C. Botha. Fingerprint recognition in low quality images.
Pattern Recognition, 26(10):1441–1460, 1993.
[21] C. Domeniconi, S. Tari, and P. Liang. Direct gray scale ridge reconstruction in
fingerprint images. In Proceedings of the 1998 IEEE International Conference on
Acoustics, Speech, and Signal Processing(ICASSP), volume 5, pages 2941–2944
vol.5, 1998.
BIBLIOGRAPHY 128
[22] A. Farina, Z. M. Kovacs-Vajna, and A. Leone. Fingerprint minutiae extraction
from skeletonized binary images. Pattern Recognition, 32(5):877–889, 1999.
[23] “Fingerprint verification competition(FVC)”, available at
http://bias.csr.unibo.it.
[24] M. Gamassi, V. Piuri, and F. Scotti. Fingerprint local analysis for high-
performance minutiae extraction. In IEEE International Conference on Image
Processing(ICIP), volume 3, pages III–265–8, 2005.
[25] R. S. Germain, A. Califano, and S. Colville. “Fingerprint matching using trans-
formation parameter clustering”. Computational Science and Engineering, IEEE
Computing in Science & Engineering, 4(4):42–49, 1997.
[26] R. C. Gonzalez and R. E. Woods. “Digital Image Processing”. Prentice Hall,
Upper Saddle River, NJ, 2002.
[27] S. Greenberg, M. Aladjem, and D. Kogan. Fingerprint image enhancement using
filtering techniques. Real–Time Imaging, 8:227–236, 2002.
[28] C. Harris and M. Stephens. A combined corner and edge detector. In Proc. in
Alvey Vision Conference, pages pp. 147–151, 1988.
[29] K. K. Hartwig Fronthaler and J. Bigun. “Local feature extraction in fingerprints
by complex filtering”. In Advances in Biometric Person Authentication, LNCS,
volume 3781, pages pp.77–84, 2005.
[30] E. Henry. “Classification and Uses of Finger Prints”. Routledge, London, 1900.
[31] L. Hong, Y. Wan, and A. K. Jain. “Fingerprint image enhancement: Algo-
rithms and performance evaluation”. IEEE Transactions on Pattern Analysis
and Machine Intelligence, 20(8):777–789, 1998.
BIBLIOGRAPHY 129
[32] J. I.T. “Principle Component Analysis”. Springer-Verlag, New York, 1986.
[33] A. K. Jain, Y. Chen, and M. Demirkus. “A fingerprint recognition algorithm
combining phase-based image matching and feature-based matching”. In Proc.
of International Conference on Biometrics (ICB), pages 316–325, 2005.
[34] A. K. Jain, Y. Chen, and M. Demirkus. “Pores and ridges: Fingerprint match-
ing using level 3 features”. In Proc. of International Conference on Pattern
Recognition (ICPR), volume 4, pages 477–480, 2006.
[35] A. K. Jain, L. Hong, S. Pankanti, and R. Bolle. “An identity authentication
system using fingerprints”. Proc. IEEE, 85(9):1365–1388, 1997.
[36] A. K. Jain, L. Hong, and B. R. “On-line fingerprint verification”. IEEE Trans-
actions on Pattern Analysis and Machine Intelligence, 19(4):302–314, 1997.
[37] A. K. Jain, S. Prabhakar, L. Hong, and S. Pankanti. “Filterbank-based finger-
print matching”. Image Processing, IEEE Transactions on, 9(5):846–859, 2000.
[38] T.-Y. Jea. “Minutiae-Based Partical Fingerprint Recognition”. PhD thesis, Uni-
versity at Buffalo, the State University of New York, 2005.
[39] X. Jiang, W.-Y. Yau, and W. Ser. Detecting the fingerprint minutiae by adaptive
tracing the gray-level ridge. Pattern Recognition, 34(5):999–1013, 2001.
[40] L. Jinxiang, H. Zhongyang, and C. Kap Luk. Direct minutiae extraction from
gray-level fingerprint image by relationship examination. In International Con-
ference on Image Processing(ICIP), volume 2, pages 427–430 vol.2, 2000.
[41] T. Kamei and M. Mizoguchi. Image filter design for fingerprint enhancement. In
International Symposium on Computer Vision, pages 109–114, 1995.
BIBLIOGRAPHY 130
[42] M. Kass and A. Witkin. Analyzing oriented patterns. Computer Vision, Graph-
ics, and Image Processing, 37(3):362–385, 1987.
[43] S. Klein, A. M. Bazen, and R. Veldhuis. “fingerprint image segmentation based
on hidden markov models”. In 13th Annual workshop in Circuits, Systems and
Signal Processing, in Proc. ProRISC 2002, 2002.
[44] T. Kohonen, J. Kangas, J. Laaksonen, and K. Torkkola. Lvqpak: A software
package for the correct application of learning vector quantization algorithms. In
International Joint Conference on Neural Networks, volume 1, pages 725–730,
1992.
[45] N. Latta. “US VISIT: Keeping america’s doors open and our nation secure”. In
Biometric Consortium, 2004.
[46] M. T. Leung, W. E. Engeler, and P. Frank. Fingerprint image processing using
neural networks. In TENCON 90, IEEE Region 10 Conference on Computer and
Communication Systems, pages 582–586 vol.2, 1990.
[47] E. Lim, X. Jiang, and W. Yau. “Fingerprint quality and validity analysis”. ICIP,
pages 469–472, 2002.
[48] D. Maio and D. Maltoni. Direct gray-scale minutiae detection in fingerprints.
IEEE Transactions on Pattern Analysis and Machine Intelligence, 19(1):27–40,
1997.
[49] D. Maio and D. Maltoni. Neural network based minutiae filtering in fingerprints.
In Fourteenth International Conference Pattern Recognition, volume 2, pages
1654–1658, 1998.
[50] D. Maltoni, D. Maio, A. K. Jain, and S. Prabhakar. “Handbook of Fingerprint
Recognition”. Springer, 2003.
BIBLIOGRAPHY 131
[51] B. M. Mehtre and B. Chatterjee. Segmentation of fingerprint images – a com-
posite method. Pattern Recognition, 22(4):381–385, 1989.
[52] B. M. Mehtre, N. N. Murthy, S. Kapoor, and B. Chatterjee. Segmentation of
fingerprint images using the directional image. Pattern Recognition, 20(4):429–
435, 1987.
[53] K. Mikolajczyk and C. Schmid. Scale affine invariant interest point detectors.
International Journal of Computer Vision, 60(1):pp.63–86, 2004.
[54] D. M.L. and R. S.I. On the use of level curves in image analysis. CVGIP: Image
Understanding, 57(2):185–203, 1993.
[55] B. Moayer and K. S. Fu. “a tree system approach for fingerprint pattern recogni-
tion”. Pattern Analysis and Machine Analysis, IEEE Transactions on, 8(3):376
– 387, 1986.
[56] K. Nilsson and J. Bign. “Using linear symmetry features as a pre-processing step
for fingerprint images”. In AVBPA, pages pp.247–252, 2001.
[57] B. O. Preprocessing of poor quality fingerprint images. In Proc. XIV Int. Conf.
Chilean Computer Science Soc., 1994.
[58] N. O., N. Y., and M. T. A restoration algorithm of fingerprint images. Syst.
Comput. Jpn., 17(6):31, 1986.
[59] L. O’Gorman and J. V. Nickerson. An approach to fingerprint filter design.
Pattern Recognition, 22(1):29–38, 1989.
[60] A. C. Pais Barreto Marques and A. C. Gay Thome. A neural network fingerprint
segmentation method. In Fifth International Conference on Hybrid Intelligent
Systems(HIS 05), page 6 pp., 2005.
BIBLIOGRAPHY 132
[61] S. Pankanti, S. Prabhakar, and A. K. Jain. “On the individuality of fingerprints”.
IEEE Transactions on Pattern Analysis and Machine Intelligence, 24(8):1010–
1025, 2002.
[62] G. Parziale and E. Diaz-Santana. “The surround imager: A multi-camera touch-
less device to acquire 3d rolled-equivalent fingerprints”. In Proc. of IAPR Int.
Conf. on Biometrics, LNCS, volume 3832, pages pp.244–250, 2006.
[63] P. M. Patil, S. R. Suralkar, and F. B. Sheikh. Rotation invariant thinning al-
gorithm to detect ridge bifurcations for fingerprint identification. In 17th IEEE
International Conference on Tools with Artificial Intelligence, page 8 pp., 2005.
[64] T. Pavlidis. Vectorizer and feature extractor for document recognition. Computer
Vision, Graphics, and Image Processin, 35(1):111–127, 1986.
[65] A. B. P.G.M. Van Der Meulen, H. Shcipper and S. Gerez. “Pmdpg: A distributed
object-oriented genetic programming environment”. In Proc. ASCI conference,
pages pp.284–491, 2001.
[66] S. Prabhakar, A. K. Jain, and S. Pankanti. Learning fingerprint minutiae location
and type. Pattern Recognition, 36(8):1847–1857, 2003.
[67] R. Pradenas. Directional enhancement in the frequency domain of fingerprint
images. In Human Detection and Positive Identification: Methods and Technolo-
gies, SPIE, volume 2932, pages 150–160, 1997.
[68] C. Qin-Sheng, M. Defrise, and F. Deconinck. “Symmetric phase-only matched
filtering of fourier-mellin transforms for image registration and recognition”. Pat-
tern Analysis and Machine Analysis, IEEE Transactions on, 16(12):1156–1168,
1994.
BIBLIOGRAPHY 133
[69] N. K. Ratha, S. Chen, and A. K. Jain. Adaptive flow orientation-based feature
extraction in fingerprint images. Pattern Recognition, 28(11):1657–1672, 1995.
[70] C. J. Rivero-Moreno and S. Bres. “conditions of similarity between hermite and
gabor filters as models of the human visual system”. In Computer Analysis of
Images and Patterns, LNCS, volume 2756, pages pp.762–769, 2004.
[71] P. I. Rockett. An improved rotation-invariant thinning algorithm. Pattern Anal-
ysis and Machine Intelligence, IEEE Transactions on, 27(10):1671–1674, 2005.
[72] A. Ross, A. K. Jain, and J. Reisman. “A hybrid fingerprint matcher”. Pattern
Recognition, 36(7):1661–1673, 2003.
[73] R. Rowe and K. A. Nixon. “Fingerprint enhancement using a multispectral
sensor”. In Biometrics Technology for Human Identification II, volume 5779,
pages pp.81–93, 2005.
[74] V. K. Sagar and K. J. B. Alex. Hybrid fuzzy logic and neural network model for
fingerprint minutiae extraction. In Neural Networks, 1999. IJCNN ’99. Interna-
tional Joint Conference on, volume 5, pages 3255–3259 vol.5, 1999.
[75] V. K. Sagar, D. B. L. Ngo, and K. C. K. Foo. Fuzzy feature selection for
fingerprint identification. In Security Technology, 1995. Proceedings. Institute of
Electrical and Electronics Engineers 29th Annual 1995 International Carnahan
Conference on, pages 85–90, 1995.
[76] L. G. Shapiro and G. C. Stockman. Computer Vision. Prentice Hall, Upper
Saddle River, NJ, 2000.
[77] L. Shen, A. Kot, and W. Koo. “Quality measures of fingerprint images”. AVBPA,
pages 266–271, 2001.
BIBLIOGRAPHY 134
[78] B. G. Sherlock, D. M. Monro, and K. Millard. Fingerprint enhancement by direc-
tional fourier filtering. Vision, Image and Signal Processing, IEE Proceedings-,
141(2):87–94, 1994. 1350-245X.
[79] R. Stock and C. Swonger. “development and evaluation of a reader of fingerprint
minutiae”. Technical Report XM-2478-X1:13-17, Cornell Aeronautical Labora-
tory, 1969.
[80] L. T. “Scale Space Theory in Computer Vision”. Kluwer Academic Publisher,
Boston, 1994.
[81] E. Tabassi and C. L. Wilson. “A new approach to fingerprint image quality”.
ICIP, pages 37–40, 2005.
[82] K. Uchida. “Image-based approach to fingerprint acceptability assessment”.
ICBA, pages 294–300, 2004.
[83] L. Wang, H. Suo, and M. Dai. Fingerprint image segmentation based on gaussian-
hermite moments. In Advanced Data Mining and Applications, LNCS3584, pages
446–454, 2005.
[84] S. Wang and Y. Wang. Fingerprint enhancement in the singular point area.
IEEE Signal Processing Letters, 11(1):16–19, January 2004.
[85] C. I. Watson, M. D. Garris, E. Tabassi, C. L. Wilson, R. M. MsCabe, and
S. Janet. “User’s Guide to NIST Fingerprint Image Software2(NFIS2)”. NIST,
2004.
[86] A. J. Willis and L. Myers. A cost-effective fingerprint recognition system for use
with low-quality prints and damaged fingertips. Pattern Recognition, 34(2):255–
270, 2001.
BIBLIOGRAPHY 135
[87] C. Wu and V. Govindaraju. Singularity preserving fingerprint image adaptive
filtering. In IEEE International Conference on Image Processing (ICIP), pages
313–316, 2006.
[88] C. Wu, Z. Shi, and V. Govindaraju. Fingerprint image enhancement method us-
ing directional median filter. In Biometric Technology for Human Identification,
SPIE, volume 5404, pages 66–75, 2004.
[89] C. Wu, S. Tulyakov, and V. Govindaraju. Image quality measures for finger-
print image enhancement. In International Workshop on Multimedia Content
Representation, Classification and Security(MRCS), volume LNCS 4105, pages
215–222, 2006.
[90] Q. Xiao and H. Raafat. Fingerprint image postprocessing: A combined statistical
and structural approach. Pattern Recognition, 24(10):985–992, 1991.
[91] J. Xudong and Y. Wei-Yun. “Fingerprint minutiae matching based on the local
and global structures”. In Proc. of International Conference on Pattern Recog-
nition (ICPR), volume 2, pages 1038–1041 vol.2, 2000.
[92] A. B. Xuefeng Liang and T. Asano. A near-linear time algorithm for binarization
of fingerprint images using distance transform. In Combinatorial Image Analysis,
pages 197–208, 2004.
[93] W. Yi, H. Jiankun, and P. Damien. A fingerprint orientation model based on
2d fourier expansion (fomfe) and its application to singular-point detection and
fingerprint indexing. Pattern Analysis and Machine Intelligence, IEEE Trans-
actions on, 29(4):573–585, 2007. 0162-8828.
[94] X. You, B. Fang, V. Y. Y. Tang, and J. Huang. Multiscale approach for thinning
ridges of fingerprint. In Second Iberian Conference on Pattern Recognition and
Image Analysis, volume LNCS 3523, pages 505–512, 2005.
BIBLIOGRAPHY 136
[95] T. Yuan Yan and Y. Xinge. Skeletonization of ribbon-like shapes based on a new
wavelet function. Pattern Analysis and Machine Intelligence, IEEE Transactions
on, 25(9):1118–1133, 2003.
[96] Z. Yuheng and X. Qinghan. An optimized approach for fingerprint binarization.
In International Joint Conference on Neural Networks, pages 391–395, 2006.
[97] F. Zhao and X. Tang. Preprocessing and postprocessing for skeleton-based fin-
gerprint minutiae extraction. Pattern Recognition, 40(4):1270–1281, 2007.
[98] E. Zhu, J. Yin, C. Hu, and G. Zhang. A systematic method for fingerprint ridge
orientation estimation and image segmentation. Pattern Recognition, 39(8):1452–
1472, 2006.
[99] K. Zuiderveld. “Contrast Limited Adaptive Histogram Equalization”. Academic
Press, 1994.