advanced analytics for your special inventory challenges · advanced analytics for your special...
TRANSCRIPT

Advanced Analytics for Your Special Inventory Challenges
1
PSMC April 29, 2015 1
Overview
• What are your special inventory challenges? • Risk hedging strategies for dealing with demand uncertainty • Readiness-based sparing (RBS) methods for optimizing
system availability • System-of-system modeling for complex operations and
objectives • Assessing your organization’s requirements
2
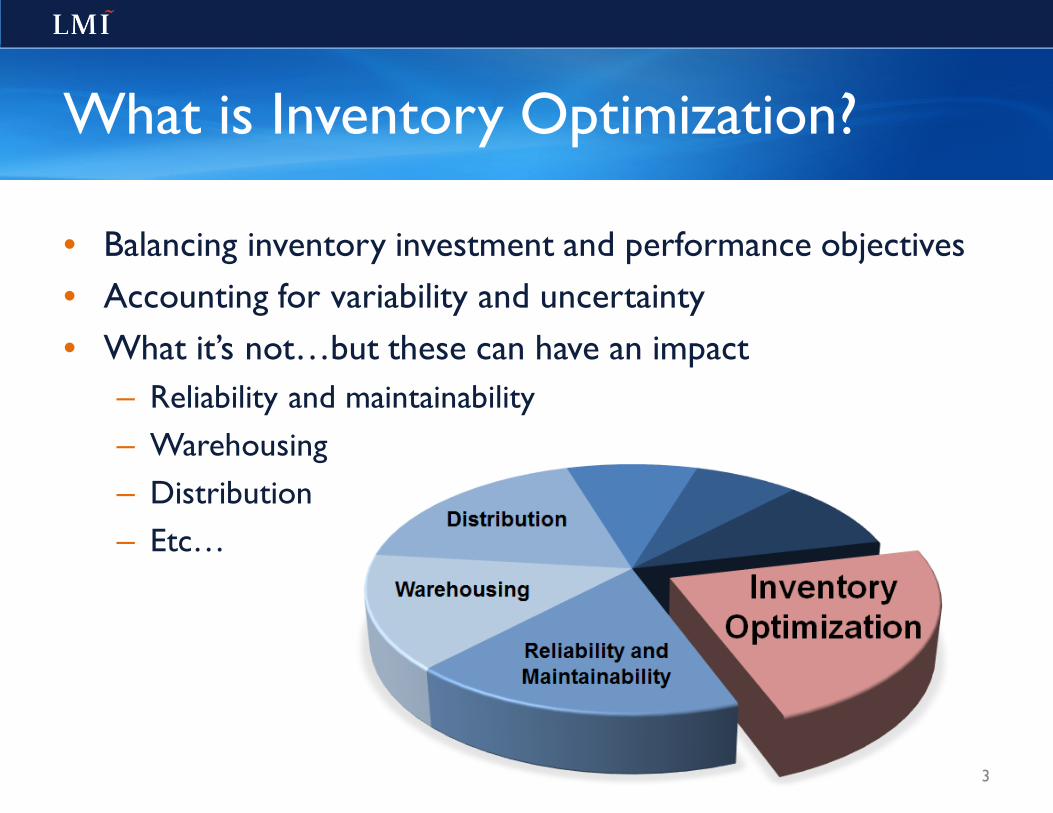
What is Inventory Optimization?
3
• Balancing inventory investment and performance objectives • Accounting for variability and uncertainty • What it’s not…but these can have an impact
– Reliability and maintainability – Warehousing – Distribution – Etc…

Why Inventory Optimization?
• Inventory exists for a business purpose – What are your organization’s strategies and priorities – Who are you…there are often competing interests even
within an organization
• Because of diverse objectives, having a range of inventory strategies to choose from is better than a point solution
• Quality solutions are ones that efficiently deliver your desired business outcomes
4
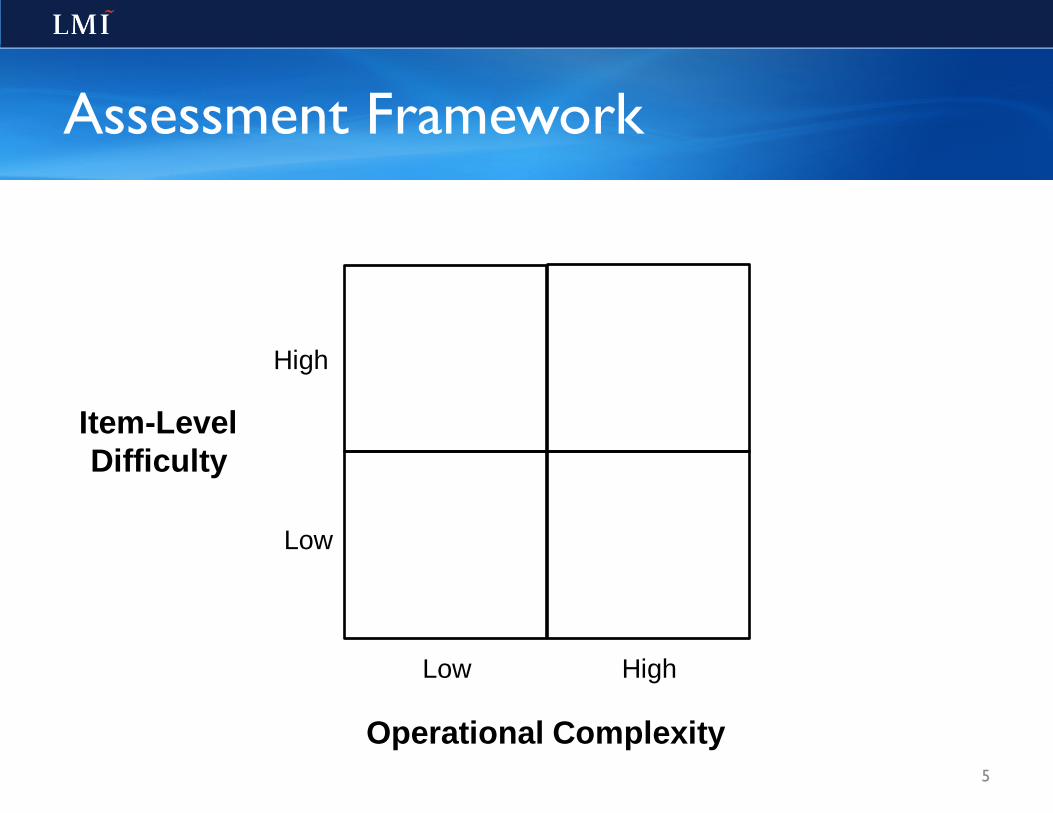
Assessment Framework
Operational Complexity
Low High
Item-Level Difficulty
Low
High
5
Assessment Framework
Operational Complexity
Low High
Item-Level Difficulty
Low
High
6
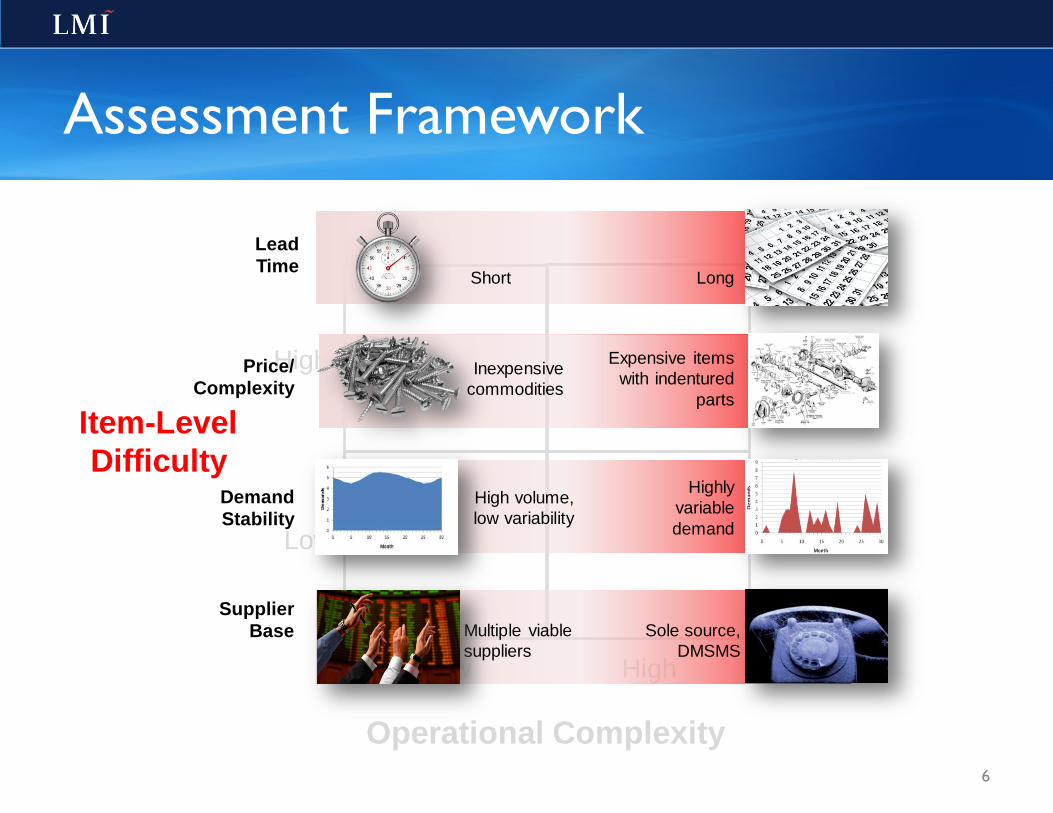
Short Long
Lead Time
High volume, low variability
Highly variable demand
Demand Stability
Inexpensive commodities
Expensive items with indentured
parts
Price/ Complexity
Multiple viable suppliers
Sole source, DMSMS
Supplier Base
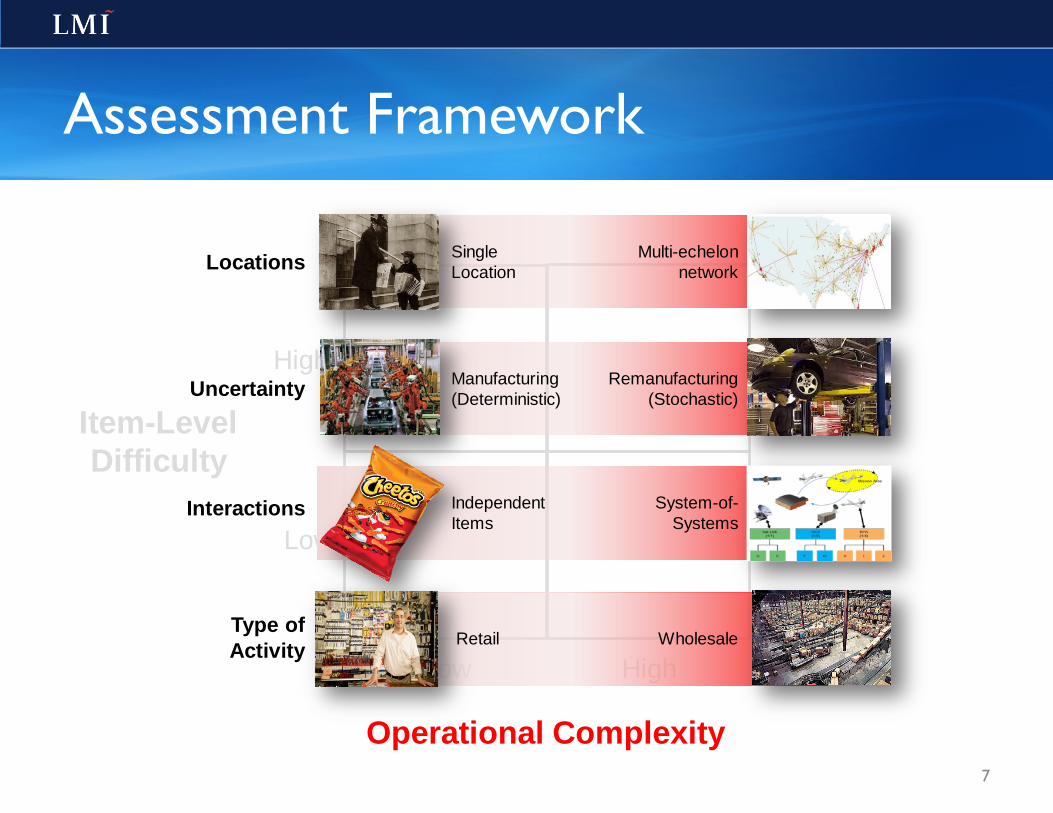
Assessment Framework
Operational Complexity
Low High
Item-Level Difficulty
Low
High
7
Manufacturing (Deterministic)
Remanufacturing (Stochastic) Uncertainty
Independent Items
System-of-Systems
Interactions
Single Location
Multi-echelon network Locations
Retail Wholesale Type of Activity
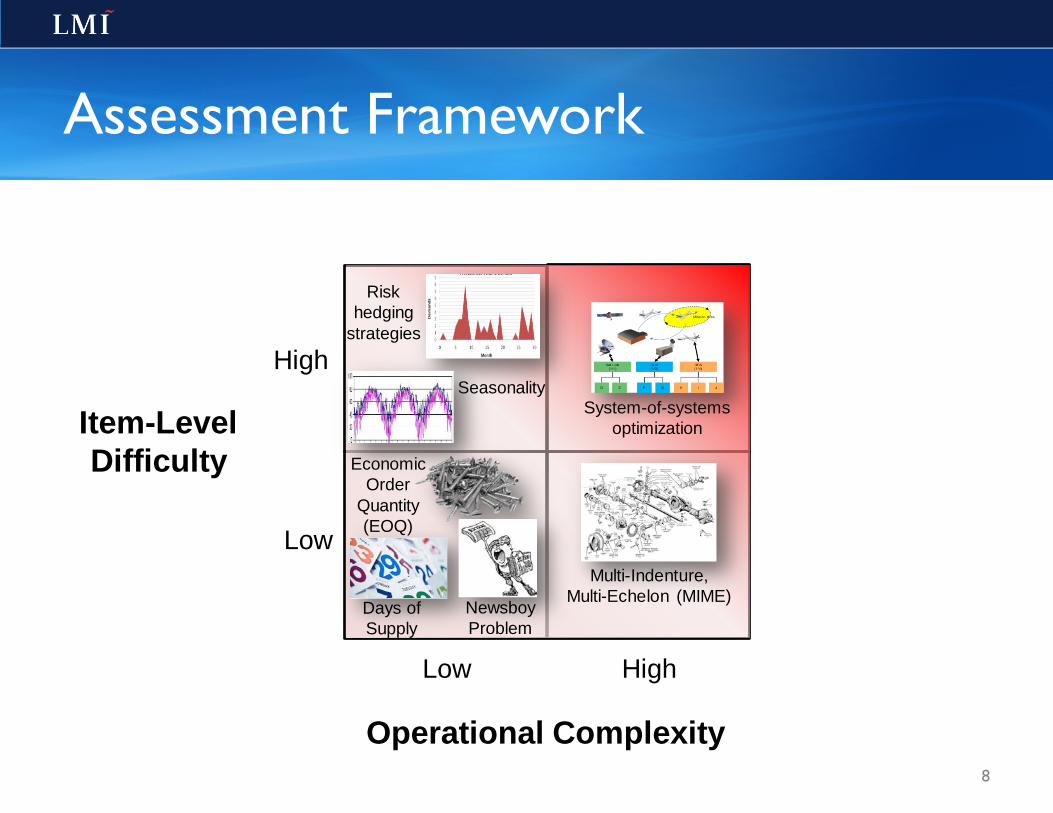
Assessment Framework
Operational Complexity
Low High
Item-Level Difficulty
Low
High
8
Economic Order
Quantity (EOQ)
Risk hedging
strategies
System-of-systems optimization
Multi-Indenture, Multi-Echelon (MIME)
Seasonality
Newsboy Problem
Days of Supply

What Are Your Inventory Challenges?
9
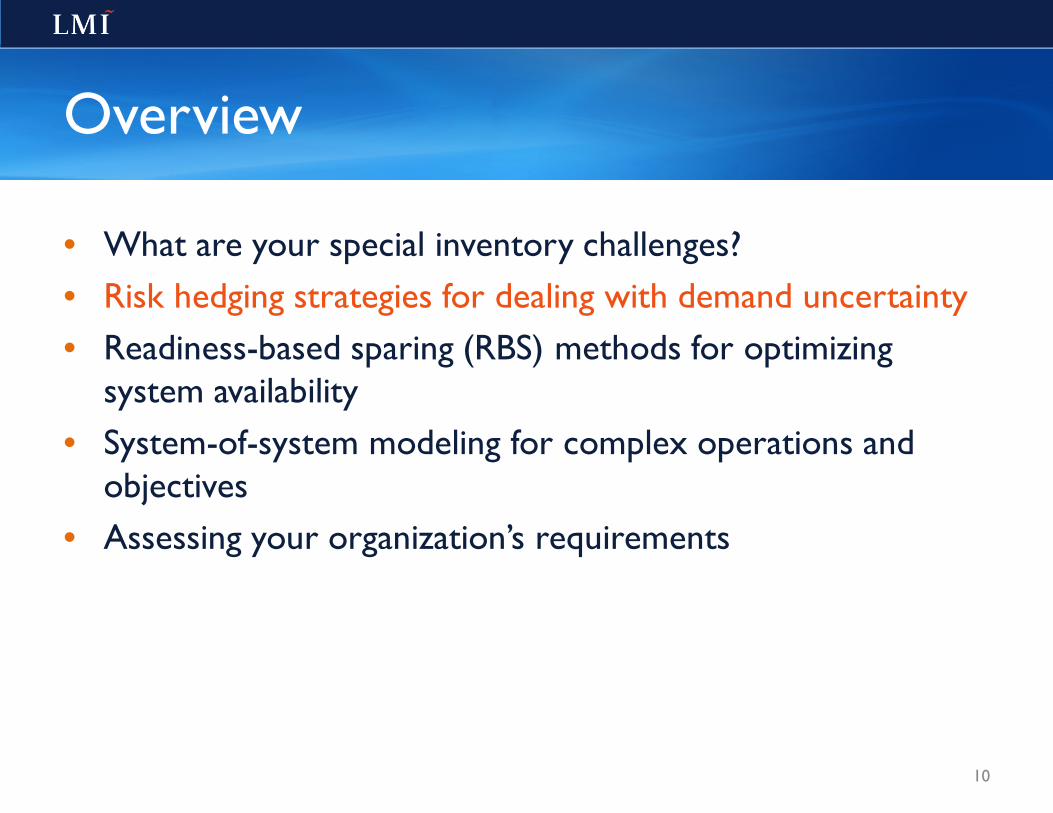
Overview
• What are your special inventory challenges? • Risk hedging strategies for dealing with demand uncertainty • Readiness-based sparing (RBS) methods for optimizing
system availability • System-of-system modeling for complex operations and
objectives • Assessing your organization’s requirements
10
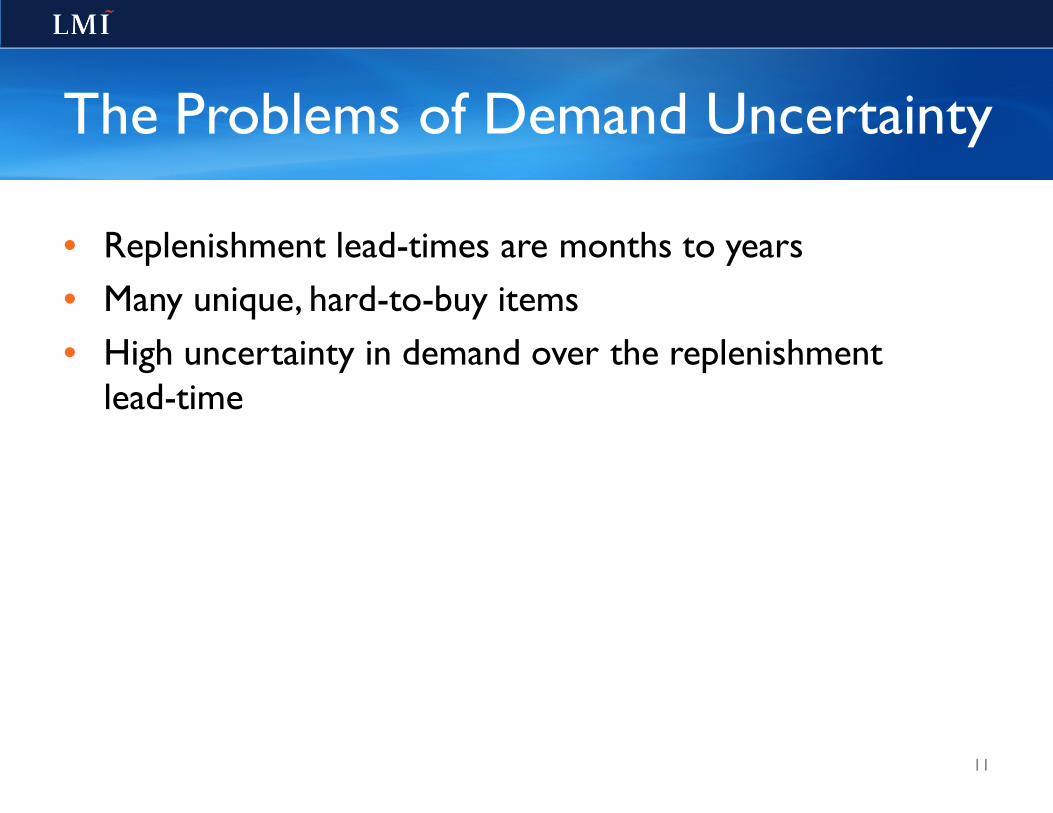
The Problems of Demand Uncertainty
• Replenishment lead-times are months to years • Many unique, hard-to-buy items • High uncertainty in demand over the replenishment
lead-time
11
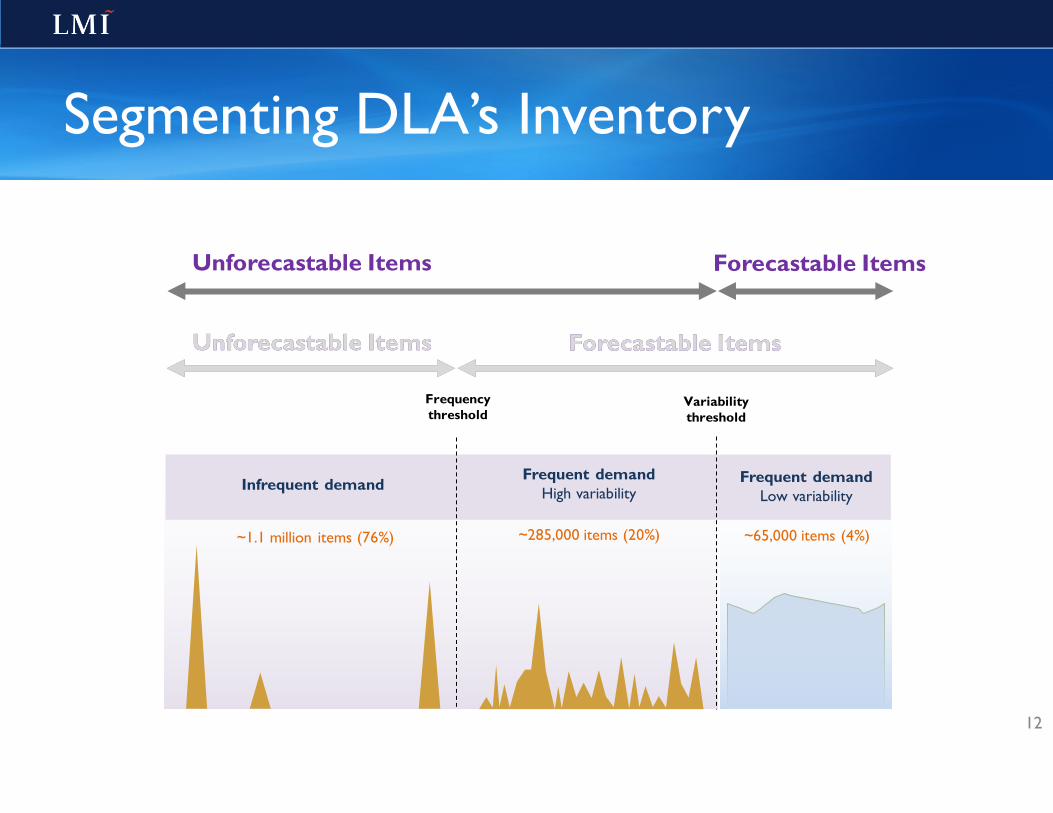
12
Infrequent demand
Frequency threshold
~1.1 million items (76%)
Unforecastable Items Forecastable Items
Frequent demand High variability
Frequent demand Low variability
Variability threshold
~65,000 items (4%) ~285,000 items (20%)
Unforecastable Items Forecastable Items
Unforecastable Items Forecastable Items
Segmenting DLA’s Inventory
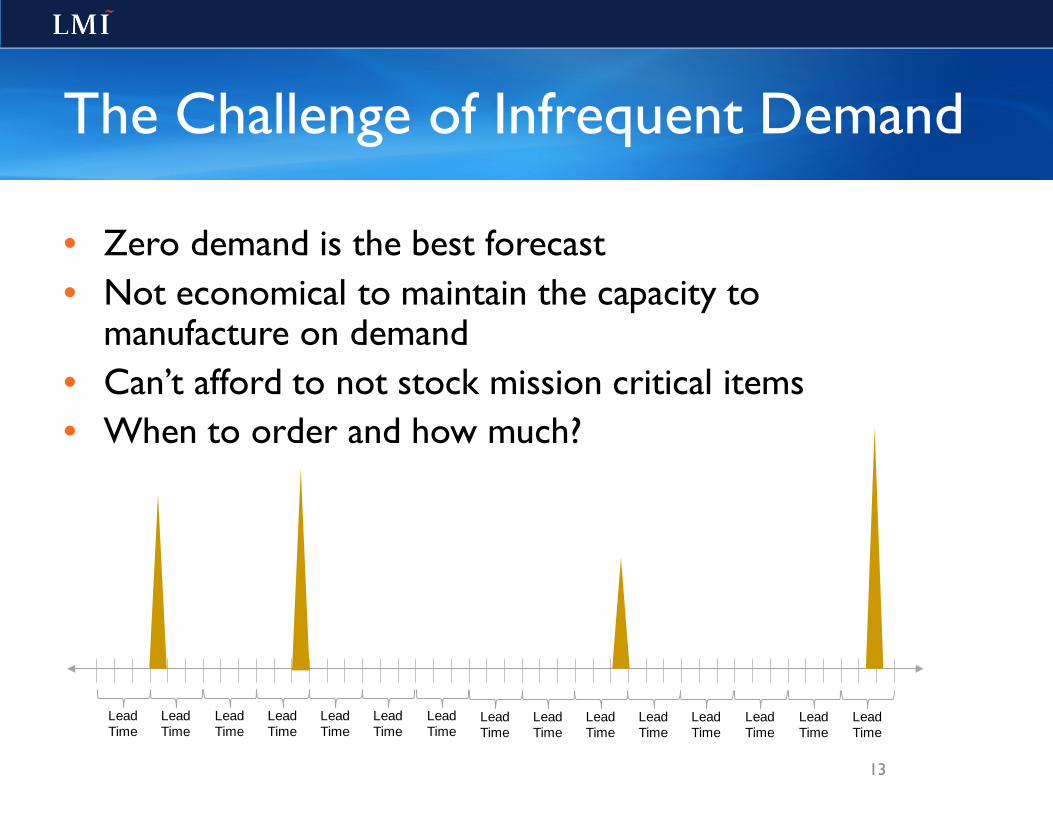
• Zero demand is the best forecast • Not economical to maintain the capacity to
manufacture on demand • Can’t afford to not stock mission critical items • When to order and how much?
Lead Time
Lead Time
Lead Time
Lead Time
Lead Time
Lead Time
Lead Time
Lead Time
Lead Time
Lead Time
Lead Time
Lead Time
Lead Time
Lead Time
Lead Time
The Challenge of Infrequent Demand
13
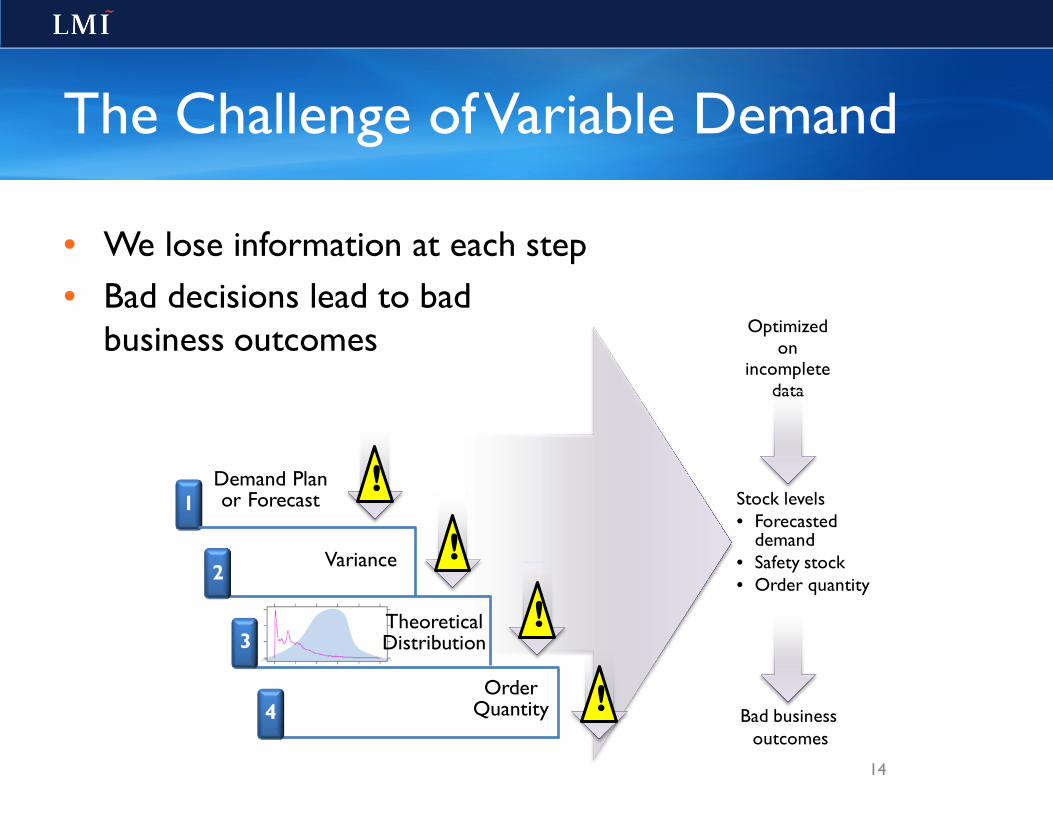
! Demand Plan or Forecast 1
! Variance 2
Optimized on
incomplete data
Stock levels • Forecasted
demand • Safety stock • Order quantity
Bad business outcomes
! Theoretical Distribution 3
Order Quantity 4 !
The Challenge of Variable Demand
• We lose information at each step • Bad decisions lead to bad
business outcomes
14
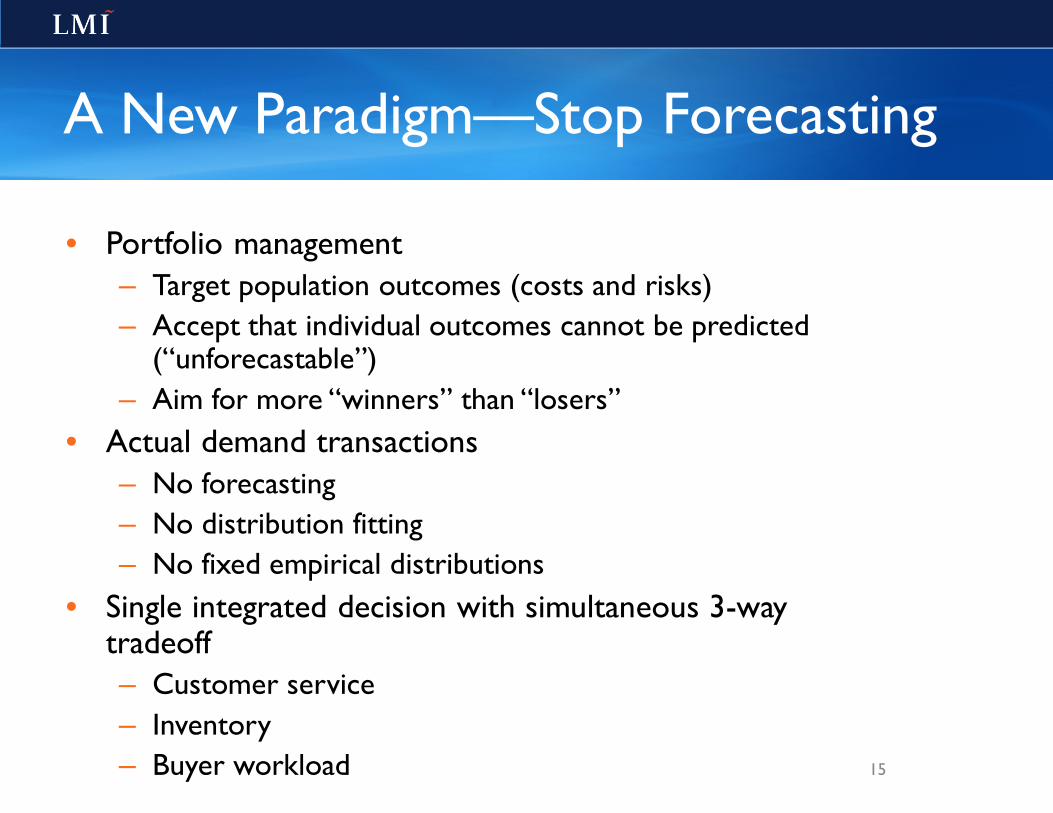
• Portfolio management – Target population outcomes (costs and risks) – Accept that individual outcomes cannot be predicted
(“unforecastable”) – Aim for more “winners” than “losers”
• Actual demand transactions – No forecasting – No distribution fitting – No fixed empirical distributions
• Single integrated decision with simultaneous 3-way tradeoff – Customer service – Inventory – Buyer workload
A New Paradigm—Stop Forecasting
15

• Order when inventory gets down to some % of Peak demand
• Order a quantity based on unit price
100%
50%
Peak
Min = R
eorder point
Residual risk
Min = (Price-based mult.) (Peak demand) Max = Min + (Price-based order qty.)
How to get good values for multipliers & order quantity
Infrequent Demand
16

17
Developed an objective function ∑c(s,S) that captures real-world messiness
How do we solve the objective function for min/max?
Inter-arrival time
Demand size
Year
Inve
ntor
y le
ve
01020304050
2006 2007 2008 2009
Real world does not conform to traditional distributions
Frequent, Highly Variable Demand
• Compute objective function based on inventory investment, wait time, and procurement workload
• Solve the objective function for the best min/max values
• Use an empirical rather than a theoretical distribution
• Use simulations to test the robustness of solutions—don’t assess with the same model you used to generate your solutions
• Select best parameter set to meet your business goals
Key Elements of Risk Hedging
18
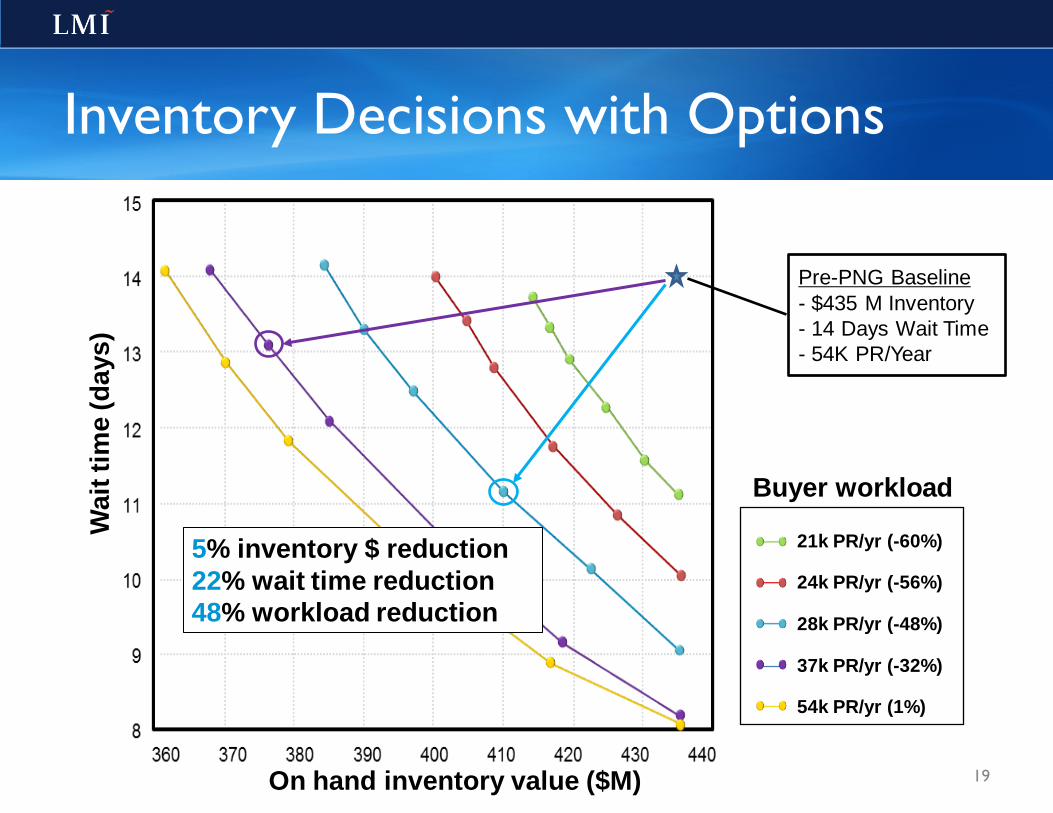
Inventory Decisions with Options
19
Wai
t tim
e (d
ays)
On hand inventory value ($M)
21k PR/yr (-60%)
24k PR/yr (-56%)
28k PR/yr (-48%)
37k PR/yr (-32%)
54k PR/yr (1%)
Buyer workload
Pre-PNG Baseline - $435 M Inventory - 14 Days Wait Time - 54K PR/Year
13% inventory $ reduction 9% wait time reduction 32% workload reduction
5% inventory $ reduction 22% wait time reduction 48% workload reduction

↓ $600 million Excess on-hand inventory value
↓ 35 percent Recommended annual buys
↓ $127 million Estimated labor savings from
unnecessary buys and cancellations over five years
↓ 70 percent Cancelled buys
↓ $2 billion Estimated savings in working
capital over five years
↑ 4 points Material availability
2 years after implementation
at DLA, the items in PNG
have produced significant
results 20
Results for DLA


Overview
• What are your special inventory challenges? • Risk hedging strategies for dealing with demand uncertainty • Readiness-based sparing (RBS) methods for optimizing
system availability • System-of-system modeling for complex operations and
objectives • Assessing your organization’s requirements
22
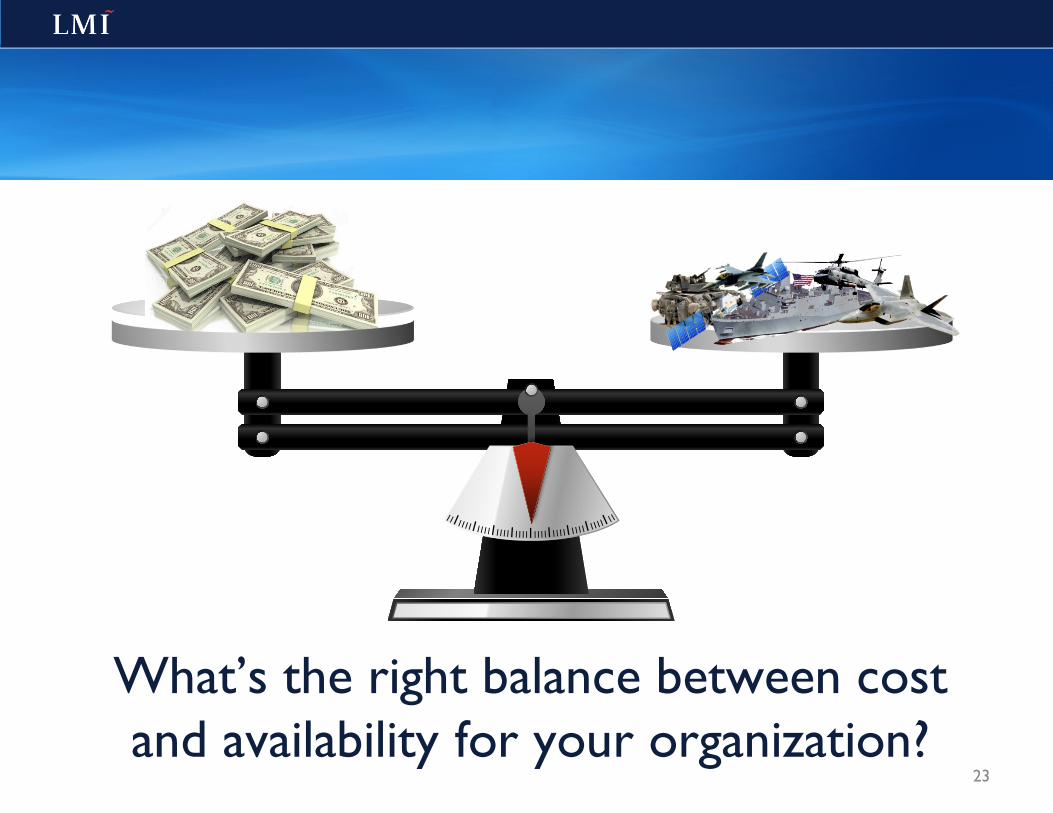
What’s the right balance between cost and availability for your organization?
23

System Availability Approach
• Item-level objective functions such as fill rate, profit, inventory turns, … don’t capture the impact on the overall system – Average of item performance is not always consistent with
your organization’s goals – Example: Fill rate concentrates on low-cost, high-demand
items, accepts infrequent, but long-lasting backorders on expensive, low-demand items
24

Tell me how I’m going to be measured and I’ll tell you
how I’m going to behave …just don’t blame me
for my dysfunctional behavior
25
Expected Backorders
• Calculating EBOs for a given stock level is an important foundation for RBS theory – Backorders have a duration – Not a “lost sales” case
• EBO computation algorithms come in varying degrees of complexity – Multi-indenture – Multi-echelon – Cannibalization/partial cannibalization
26
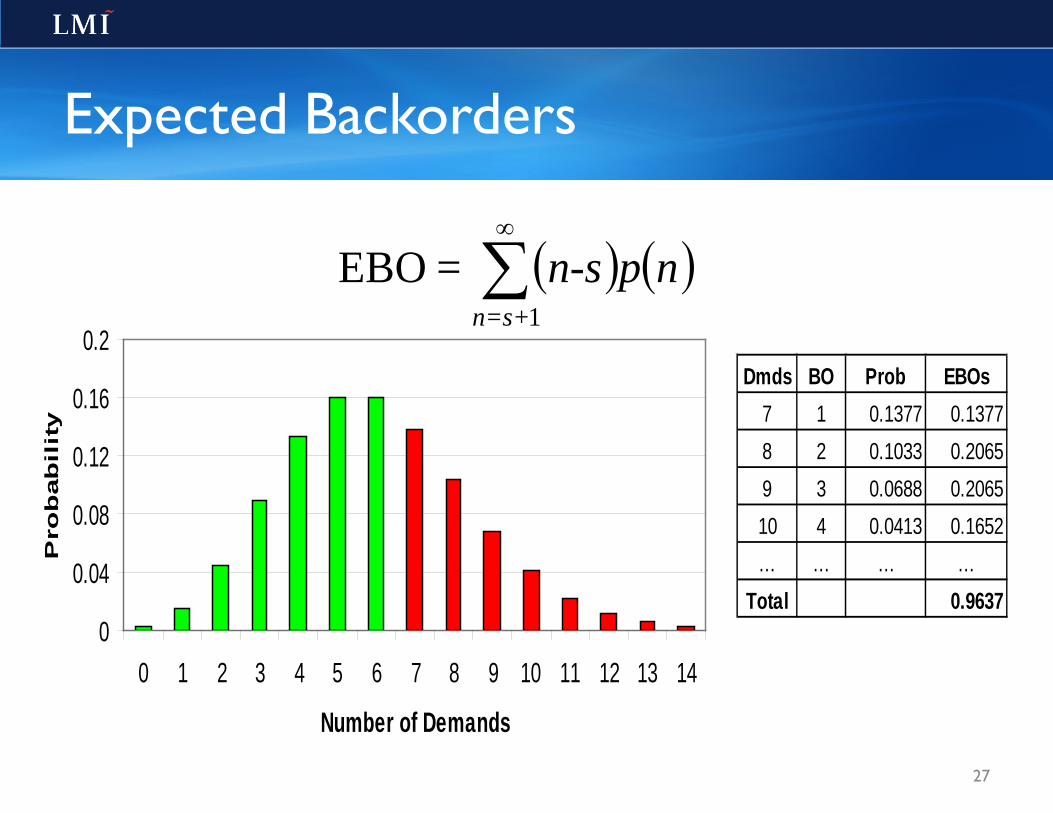
Expected Backorders
0
0.04
0.08
0.12
0.16
0.2
0 1 2 3 4 5 6 7 8 9 10 11 12 13 14
Number of Demands
Pro
bab
ilit
y
Dmds BO Prob EBOs7 1 0.1377 0.13778 2 0.1033 0.20659 3 0.0688 0.206510 4 0.0413 0.1652… … … …
Total 0.9637
( ) ( )npn-sn=s+∑∞
1
=EBO
27
Readiness-Based Sparing in Practice
• Embed EBO calculations in a marginal analysis routine – Iteratively add items to the shopping list based upon “bang-
per-buck”
• Graphical representation of this marginal analysis process is a “cost-availability curve” – As we add items, both the cost and availability increase…but
exhibit diminishing marginal return – Each point on the curve has an associated shopping list
28
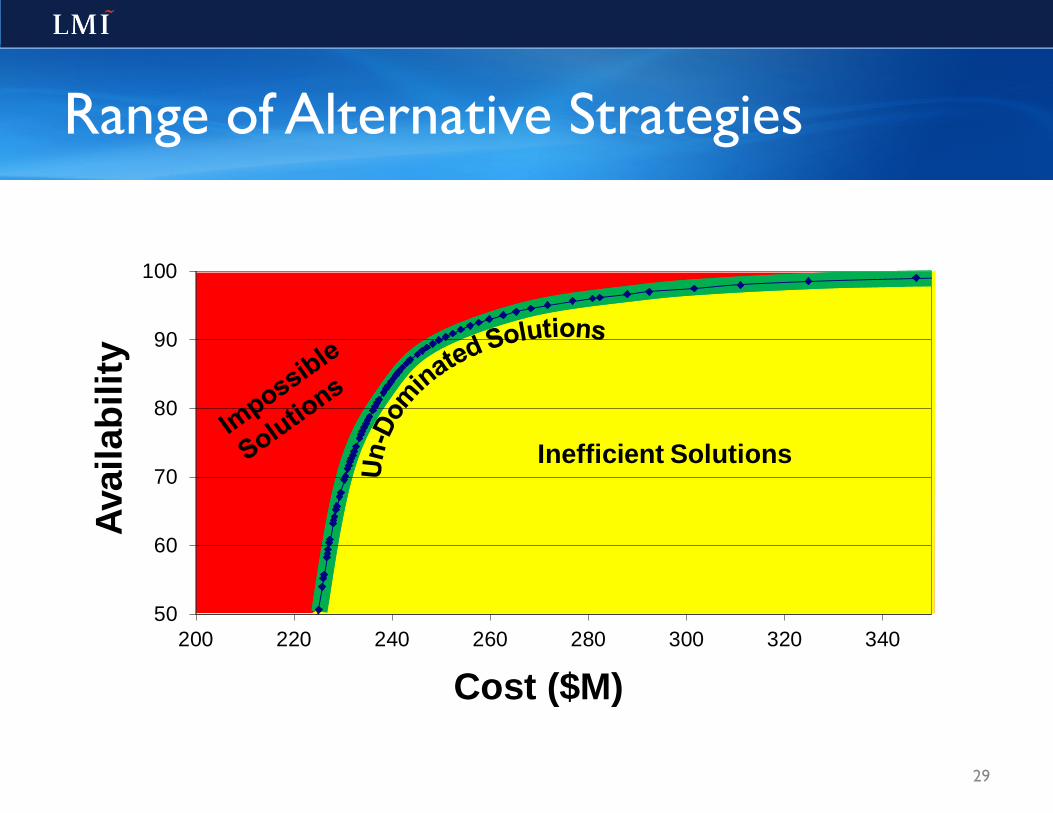
Range of Alternative Strategies
Inefficient Solutions
29
Cost ($M)
Avai
labi
lity
50
60
70
80
90
100
200 220 240 260 280 300 320 340

50
60
70
80
90
100
200 220 240 260 280 300 320 340
Picking the Right Solution for You
Cost ($M)
Avai
labi
lity
30

Air Force
31

Overview
• What are your special inventory challenges? • Risk hedging strategies for dealing with demand uncertainty • Readiness-based sparing (RBS) methods for optimizing
system availability • System-of-system modeling for complex operations and
objectives • Assessing your organization’s requirements
33
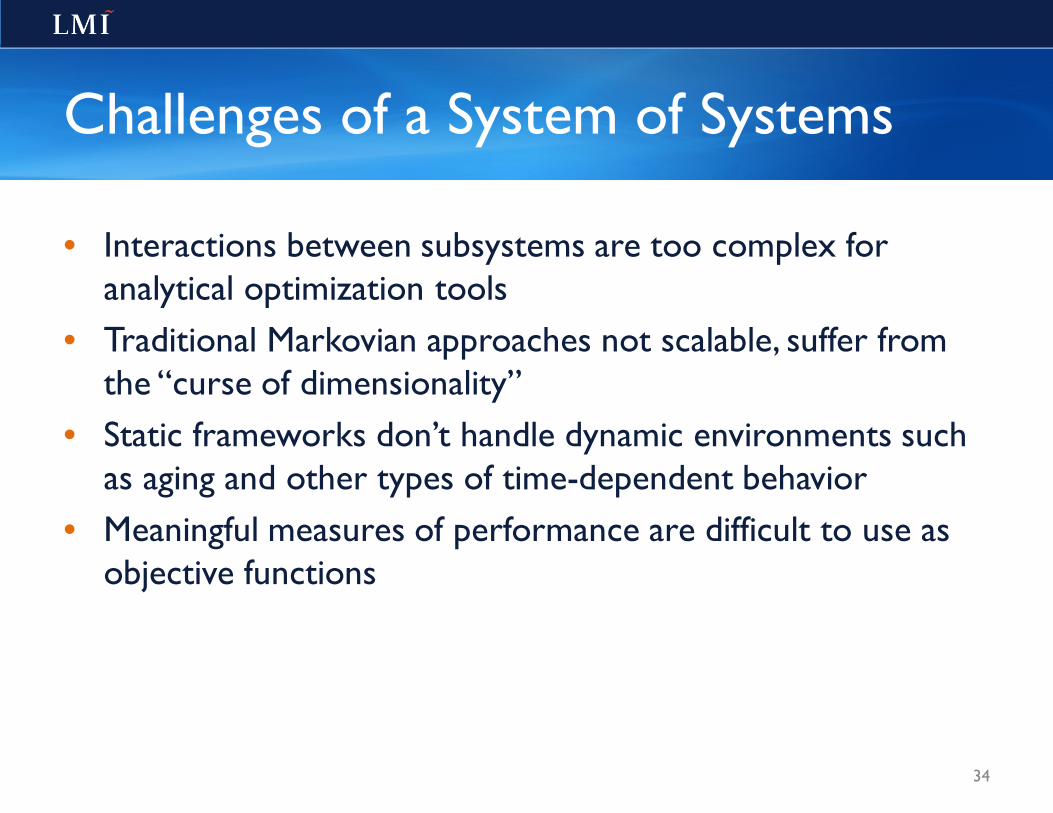
Challenges of a System of Systems
• Interactions between subsystems are too complex for analytical optimization tools
• Traditional Markovian approaches not scalable, suffer from the “curse of dimensionality”
• Static frameworks don’t handle dynamic environments such as aging and other types of time-dependent behavior
• Meaningful measures of performance are difficult to use as objective functions
34
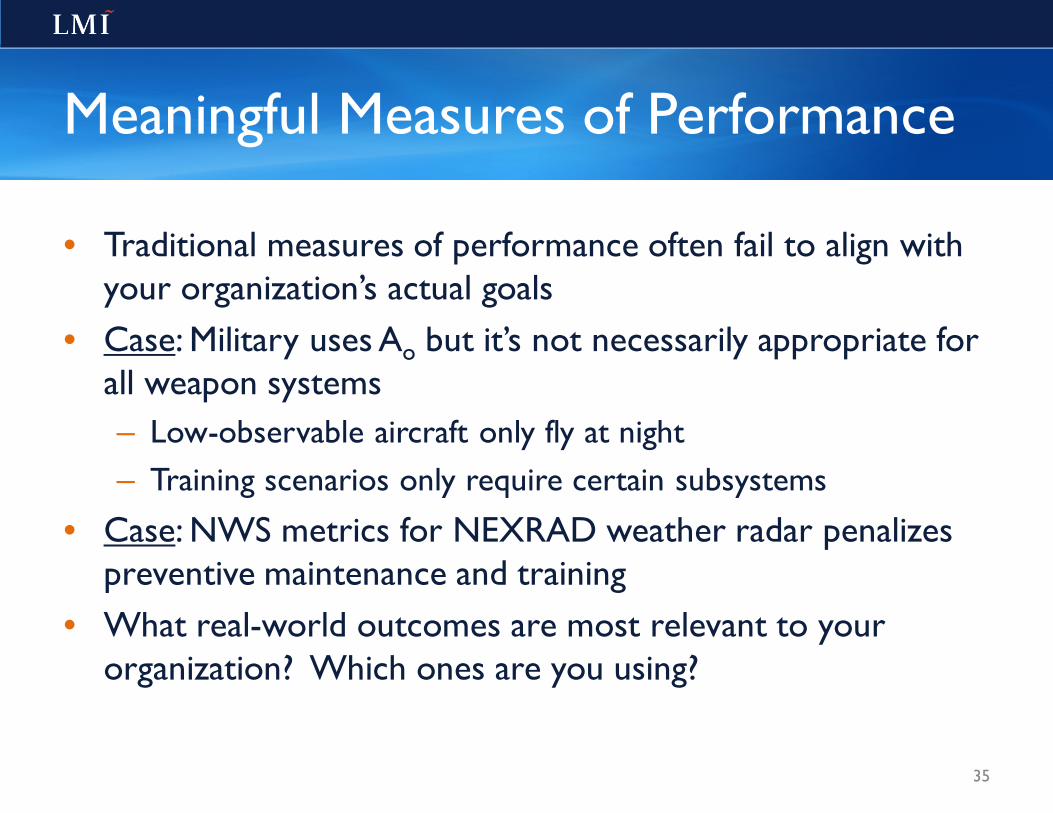
Meaningful Measures of Performance
• Traditional measures of performance often fail to align with your organization’s actual goals
• Case: Military uses Ao but it’s not necessarily appropriate for all weapon systems – Low-observable aircraft only fly at night – Training scenarios only require certain subsystems
• Case: NWS metrics for NEXRAD weather radar penalizes preventive maintenance and training
• What real-world outcomes are most relevant to your organization? Which ones are you using?
35

Are you looking under the streetlight
just because the light’s better there?
36

Simulation Optimization Methodology
• Stochastic Petri net tool models mission scenario – Monte Carlo simulation allows us to relax Markovian
assumptions, delivers richer results
• Analytical solution performs inventory optimization for individual subsystems – Produces rapid solutions with broad range of capabilities
• Parametric process iteratively converges on macrosystem solutions – Optimizes your inventory solutions against your true mission
accomplishment targets
37
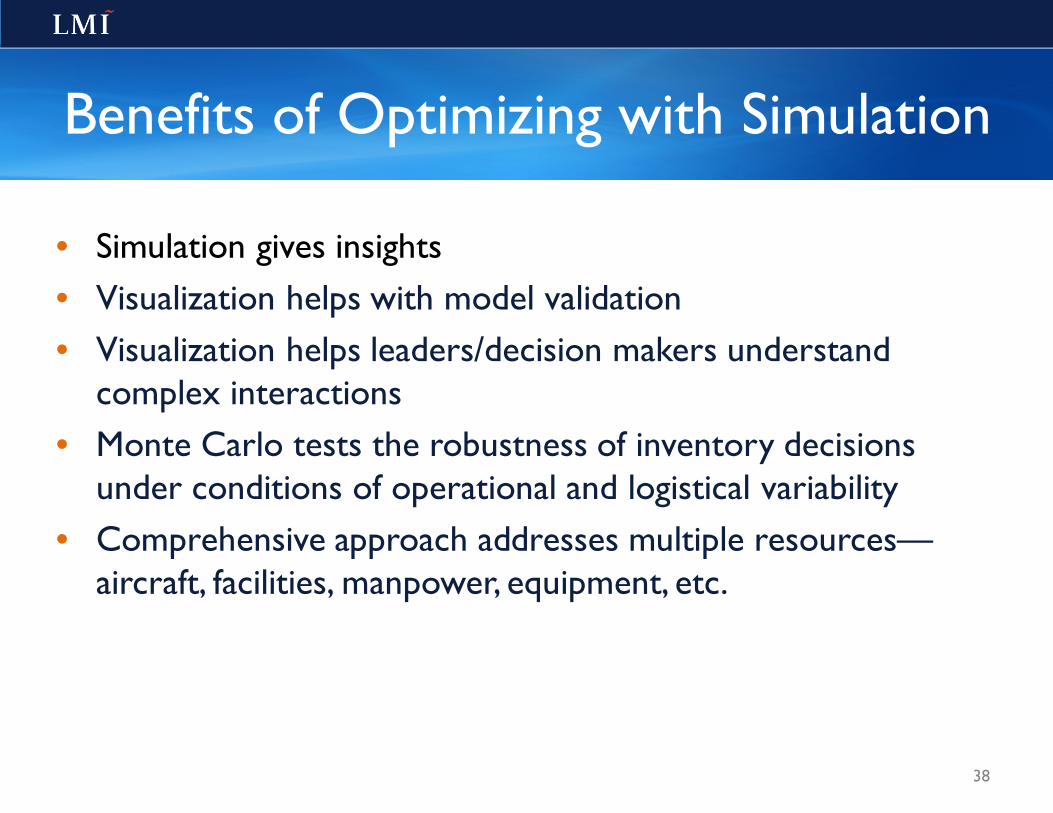
Benefits of Optimizing with Simulation
• Simulation gives insights • Visualization helps with model validation • Visualization helps leaders/decision makers understand
complex interactions • Monte Carlo tests the robustness of inventory decisions
under conditions of operational and logistical variability • Comprehensive approach addresses multiple resources—
aircraft, facilities, manpower, equipment, etc.
38
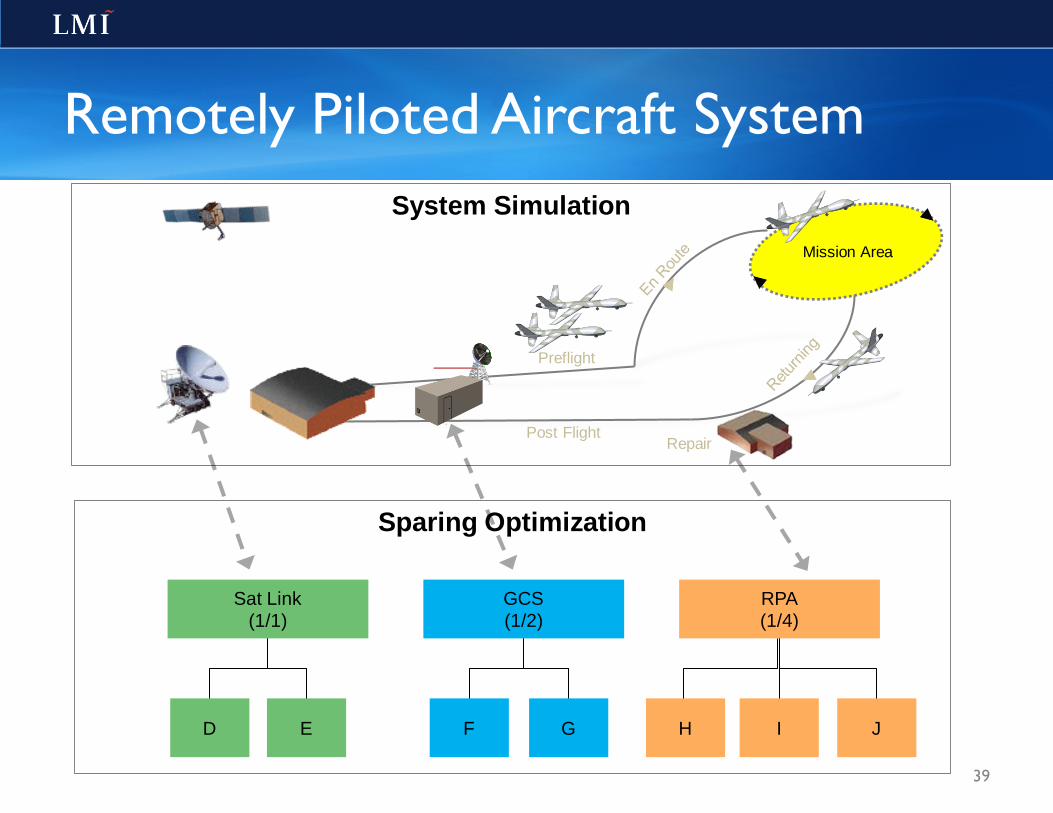
Sparing Optimization
System Simulation
Remotely Piloted Aircraft System
Preflight
Post Flight Repair
Sat Link (1/1)
GCS (1/2)
RPA (1/4)
D F H E I J G
Mission Area
39
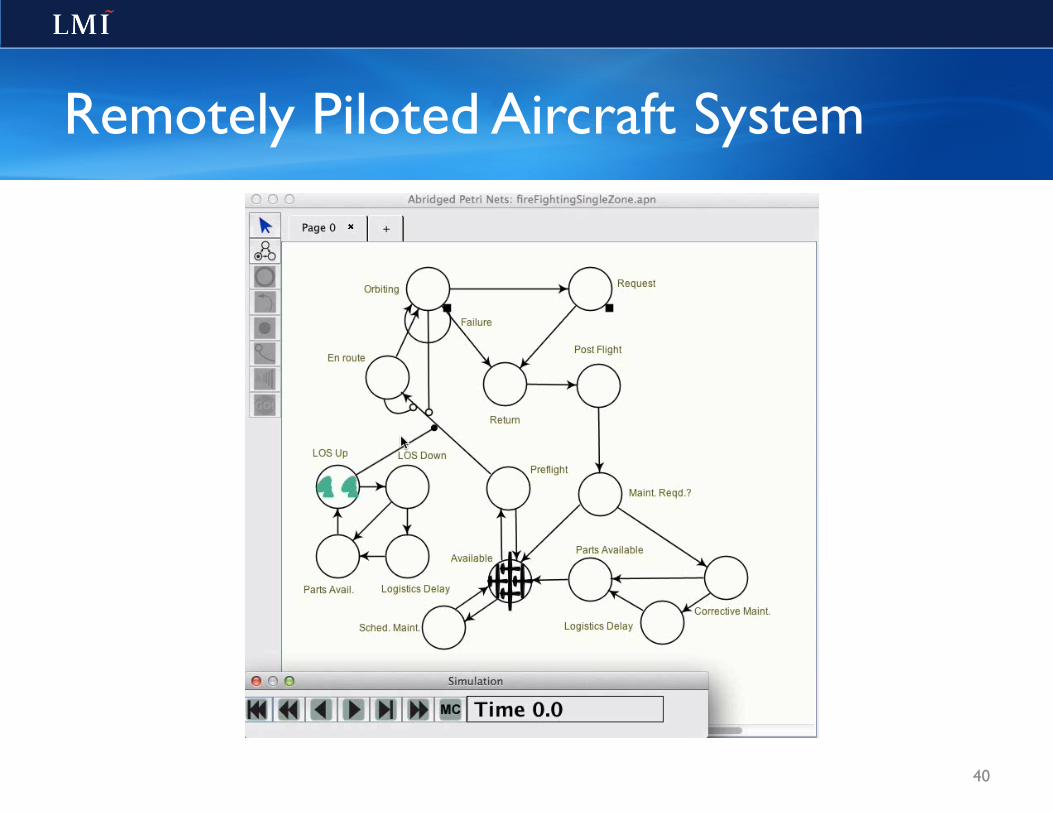
Remotely Piloted Aircraft System
40
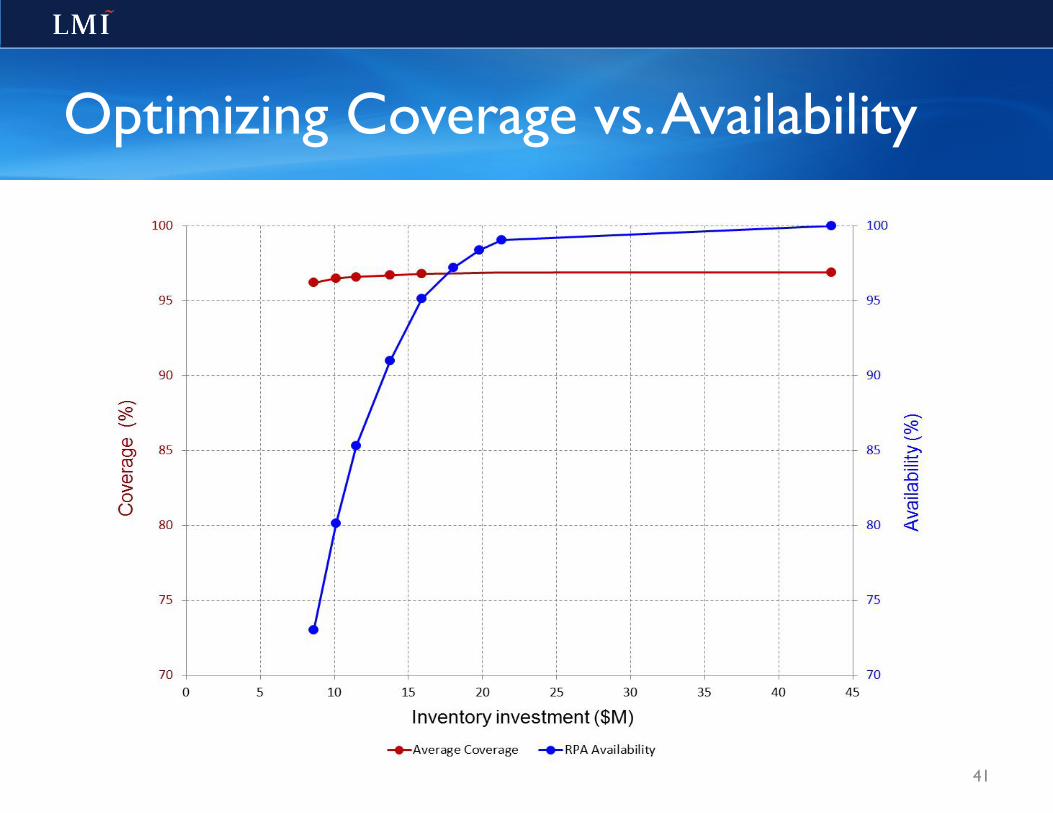
Optimizing Coverage vs. Availability
41
Overview
• What are your special inventory challenges? • Risk hedging strategies for dealing with demand uncertainty • Readiness-based sparing (RBS) methods for optimizing
system availability • System-of-system modeling for complex operations and
objectives • Assessing your organization’s requirements
42
Some Supply Chain Questions
• What are my organization’s true objectives for its inventory? • What objectives are we currently using to manage our
inventory? • Do the characteristics of our items pose special
management challenges? • Does our operating environment require advanced analytical
tools and techniques? • How can we make our inventory work for us?
43

Questions and
Discussion 44