adsorption and reaction of hydrogen sulfide on thin-film cerium oxide
TRANSCRIPT
Available online at www.sciencedirect.com
www.elsevier.com/locate/susc
Surface Science 601 (2007) 4931–4938
Adsorption and reaction of hydrogen sulfide on thin-filmcerium oxide q
D.R. Mullins *, T.S. McDonald
Oak Ridge National Laboratory, P.O. Box 2008, MS 6201, Oak Ridge, TN 37831-6201, United States
Received 13 July 2007; accepted for publication 16 August 2007Available online 23 August 2007
Abstract
The adsorption and reaction of hydrogen sulfide, H2S, have been studied on cerium oxide thin films that were vapor deposited onRu(0001). The behavior of the H2S was examined as a function of Ce oxidation state. H2S weakly chemisorbs on fully oxidizedCeO2 desorbing near 155 K. Hydrogen from the H2S reacts with the surface O to desorb as water between 200 K and 450 K. Whenca. 20% of the Ce4+ is reduced to Ce3+ more H2S dissociates to –OH and –SH and water is produced near 580 K. When the ceria isca. 70% reduced, water formation is suppressed and H2 desorbs near 580 K. S 2p photoelectron spectroscopy indicates the decompositionof H2S into –SH and then –S as the sample is annealed from 100 K to 600 K. O 1s photoemission indicated the presence of H2O and –OH.Published by Elsevier B.V.
Keywords: Cerium; Thermal desorption spectroscopy; Soft X-ray photoelectron spectroscopy; Hydrogen sulfide
1. Introduction
Sulfur is a pervasive environmental pollutant. Traceamounts of sulfur in fossil fuels such as coal and gasolinecan be oxidized to SOX during combustion. SOX speciesare toxic in their own right but also produce acid rain whencombined with moisture in the upper atmosphere. S is alsoknown to poison automotive three-way catalysts and NOX
storage materials.Cerium oxide is a key component in automotive exhaust
catalysts. Its primary function is an O storage medium,releasing O under fuel rich conditions and absorbing Oduring lean fuel conditions. The facile removal of O fromthe ceria lattice produces an accommodating site for
0039-6028/$ - see front matter Published by Elsevier B.V.
doi:10.1016/j.susc.2007.08.007
q The submitted manuscript has been authored by a contractor of theUS Government under Contract No. DE-AC05-00OR22725. Accordingly,the US Government retains a nonexclusive, royalty-free license to publishor reproduce the published form of this contribution, or allow others to doso, for US Government purposes.
* Corresponding author. Tel.: +1 865 574 2796; fax: +1 865 576 5235.E-mail address: [email protected] (D.R. Mullins).
adsorption of S in the O vacancy. The replacement of Oby S reduces the O storage capacity of the ceria.
The S-containing molecules in fossil fuels are mostlycomplex polyaromatic species. However, the study of theinteraction of simple S-containing molecules withmodel catalytic surfaces provides the building blocks forunderstanding the interactions of more complex chemicalspecies.
H2S adsorption has been studied on MgO(100) [1],Al2O3 [2], Cr3O4/Cr2O3 [3], Cu2O [4], UO2 [5], TiO2 [6,7]and ZnO [8]. The general observation is that the S interactswith the cationic centers and H2S deprotonates to produceadsorbed HS and S. There is no tendency to produce SOX
species. This is in contrast to the adsorption of SO2 onoxide surfaces [9–12], including ceria [13–15], where the Sinteracts with the O anions to produce surface sulfateand sulfite.
The results in this paper suggest similar results specifi-cally that H2S decomposes on ceria to produce adsorbedSH and S. There is no evidence of SOX species. There isa clear indication of water desorption following H2S expo-sure which suggests that S replaces O in the lattice.
T [K]100 200 300 400
RG
A in
tens
ity (
arb)
0
1
2
3
4
5
6
<5% Ce3+
20% Ce3+
H2S (Mass 34)
40% Ce3+
55% Ce3+
70% Ce3+
90% Ce3+
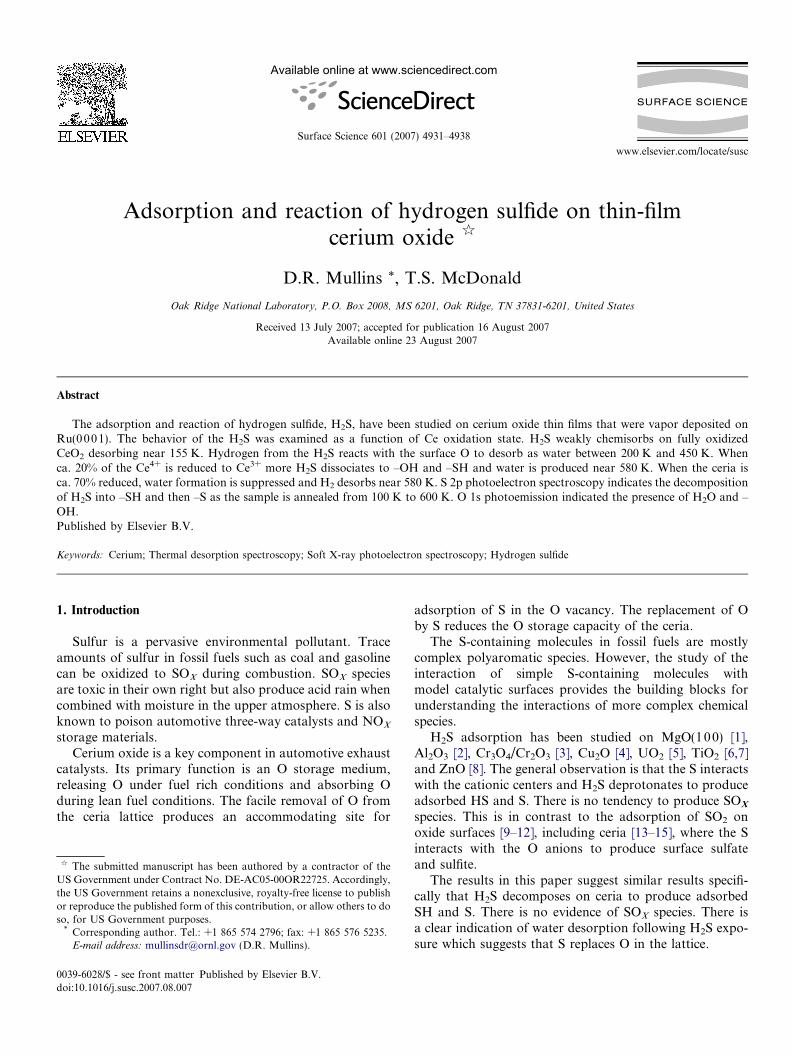
Fig. 1. Desorption of H2S following H2S exposure to CeOX(111) at 100 Kas a function of the Ce oxidation state.
4932 D.R. Mullins, T.S. McDonald / Surface Science 601 (2007) 4931–4938
The adsorption and decomposition of H2S can be com-pared with O-containing adsorbates such as H2O [16,17],CH3OH [18–20] and CH2O [21]. These molecules bind tothe surface through the O atom. The adsorption is facili-tated by O vacancies on the surface but they are also capa-ble of adsorbing on a fully oxidized surface. This suggeststhat adsorption occurs in both atop sites and threefold hol-low site on the Ce cations. In this study it is shown thatmuch less S adsorbs compared to O species indicating thatadsorption in the low coordination sites is not as favorablefor S.
2. Experimental
The experiments were performed in two different UHVchambers. The temperature programmed desorption(TPD) experiments were performed in a chamber at OakRidge National Laboratory. The temperature was rampedat 3 K/s and the sample was biased �70 V to prevent elec-trons generated by the mass spectrometer ionizer fromstimulating reactions at the surface. The chamber was alsoequipped with a cylindrical mirror analyzer and an Mg an-ode X-ray source. Ce 3d, 4d or valence band photoemissionspectra were used to determine the Ce oxidation state [22].Soft X-ray photoelectron spectroscopy (sXPS) was per-formed in a chamber at the National Synchrotron LightSource. Experiments were conducted on beamline U12A.S 2p and O 1s sXPS spectra were recorded using 410 eVand 600 eV excitation, respectively. The binding energieswere referenced relative to the Ru(0 001) Fermi edge.Other extrinsic factors that could influence peak position,such as charging or band bending, were checked by record-ing the Ce 4d spectrum at a given photon energy [20].
CeO2(111) films were grown in situ on Ru(0 001) as hasbeen described previously [23,24]. Briefly, CeO2(111) wasproduced by depositing Ce metal in an 16O2 ambient of2 · 10�7 Torr while the Ru was at 700 K. In one series ofexperiments 18O2 (Cambridge Isotopes, >95 at% 18O) wasused in order to study the incorporation of lattice oxygeninto the reaction products. The Ce flux was monitored bya mass spectrometer during deposition to ensure reproduc-ible results. After deposition the sample was annealed to900 K. The ceria films were estimated to be ca. 5 nm thickbased on the attenuation of the Ru AES or Ru 3d XPSintensities. In general, the films used in the sXPS experi-ments may have been slightly thicker than those used inthe TPD experiments. Reduced cerium oxide films wereproduced by growing a film at a lower oxygen pressureor by exposing a CeO2(111) film to methanol as describedpreviously [20].
In the TPD experiments, exposures of H2S (Matheson,99.5%) were performed through a directed doser to en-hance the gas flux on the CeO2 surface, to minimize expo-sure to the sample holder and to the back of the Ru(000 1)substrate and to minimize the background signal duringTPD [17]. A typical 200 second exposure was approxi-mately equal to 20 L (1 L = 1 · 10�6 Torr s). Exposures
in the sXPS experiments were performed by backfillingthe chamber through a leak valve.
3. Results
3.1. Temperature programmed desorption
H2S was adsorbed on fully oxidized and partially re-duced ceria at 100 K. The only desorption products wereH2S, H2O and H2. In particular, no SX (monitored by frag-ments at Mass 32 or 64) or SOX products were observed.The temperature programmed desorption was studied asa function of the Ce oxidation state. The desorption ofH2S (Mass 34), H2O (Mass 18) and H2 (Mass 2) are shownin Figs. 1–3, respectively. The top spectra from the oxidizedCeO2 surface in each figure were recorded after modifica-tions had been made to improve the chamber vacuum.Hence the baselines are flatter and the H2 and H2O spectrahave less noise.
Weakly chemisorbed H2S desorbs at 155 K on oxidizedCeO2 (Fig. 1, top). As the surface becomes more reduced,the desorption energy of the H2S decreases nearly linearlywith the Ce oxidation state. When the surface is ca. 90%Ce3+ the H2S desorption temperature is 115 K. There areno H2S desorption states at higher temperatures fromany of the ceria surfaces.
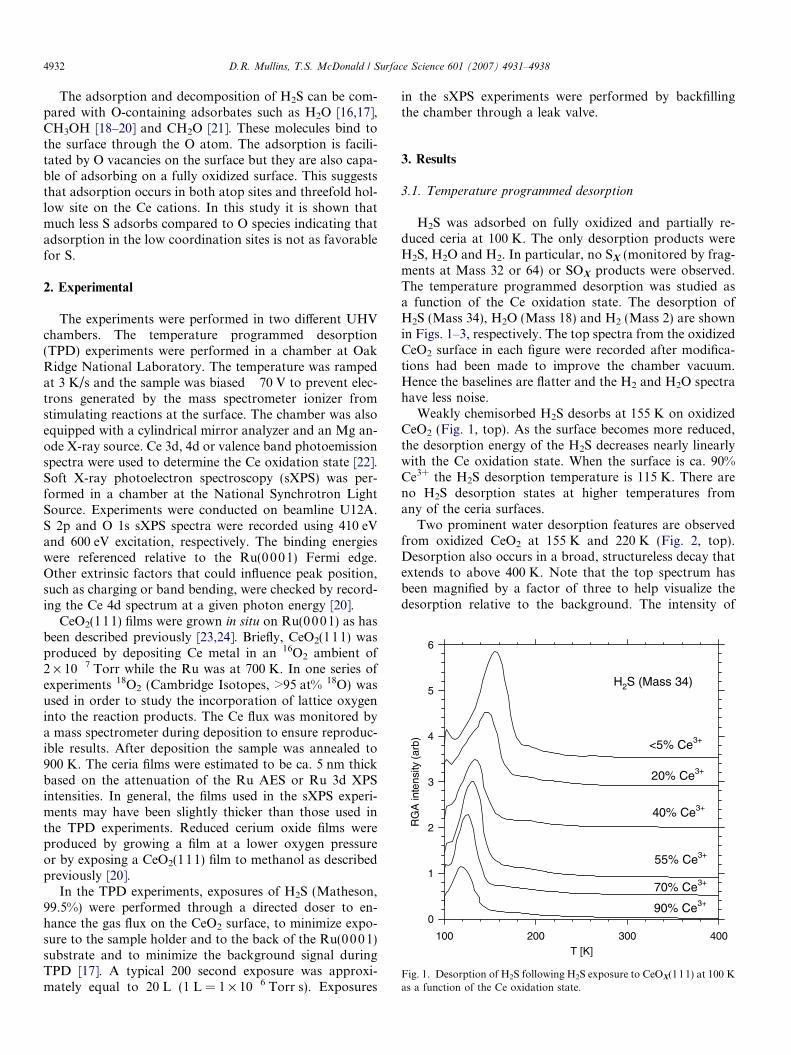
Two prominent water desorption features are observedfrom oxidized CeO2 at 155 K and 220 K (Fig. 2, top).Desorption also occurs in a broad, structureless decay thatextends to above 400 K. Note that the top spectrum hasbeen magnified by a factor of three to help visualize thedesorption relative to the background. The intensity of
T [K]100 200 300 400 500 600 700 800
RG
A in
tens
ity (
arb)
0
1
2
3
<5% Ce3+ (x3)
20% Ce3+
H2O (Mass 18)
40% Ce3+
55% Ce3+
70% Ce3+
90% Ce3+
Fig. 2. Desorption of H2O following H2S exposure to CeOX(111) at100 K as a function of the Ce oxidation state.
T [K]100 200 300 400 500 600 700 800
RG
A in
tens
ity (
arb)
0
1
2
3
<5% Ce3+
20% Ce3+
H2 (Mass 2)
40% Ce3+
55% Ce3+
70% Ce3+
90% Ce3+
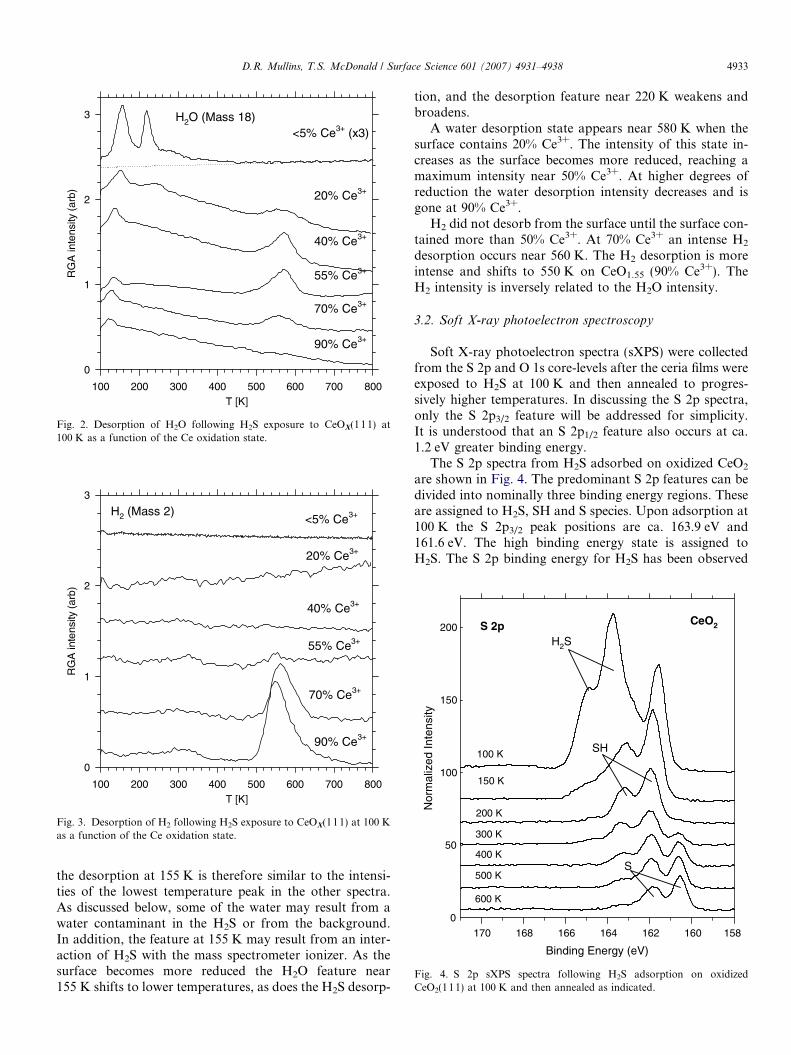
Fig. 3. Desorption of H2 following H2S exposure to CeOX(111) at 100 Kas a function of the Ce oxidation state.
Binding Energy (eV)
158160162164166168170
Nor
mal
ized
Inte
nsity
0
50
100
150
200
100 K
200 K
600 K
150 K
300 K
400 K
500 K
S 2pH2S
SH
S
CeO2
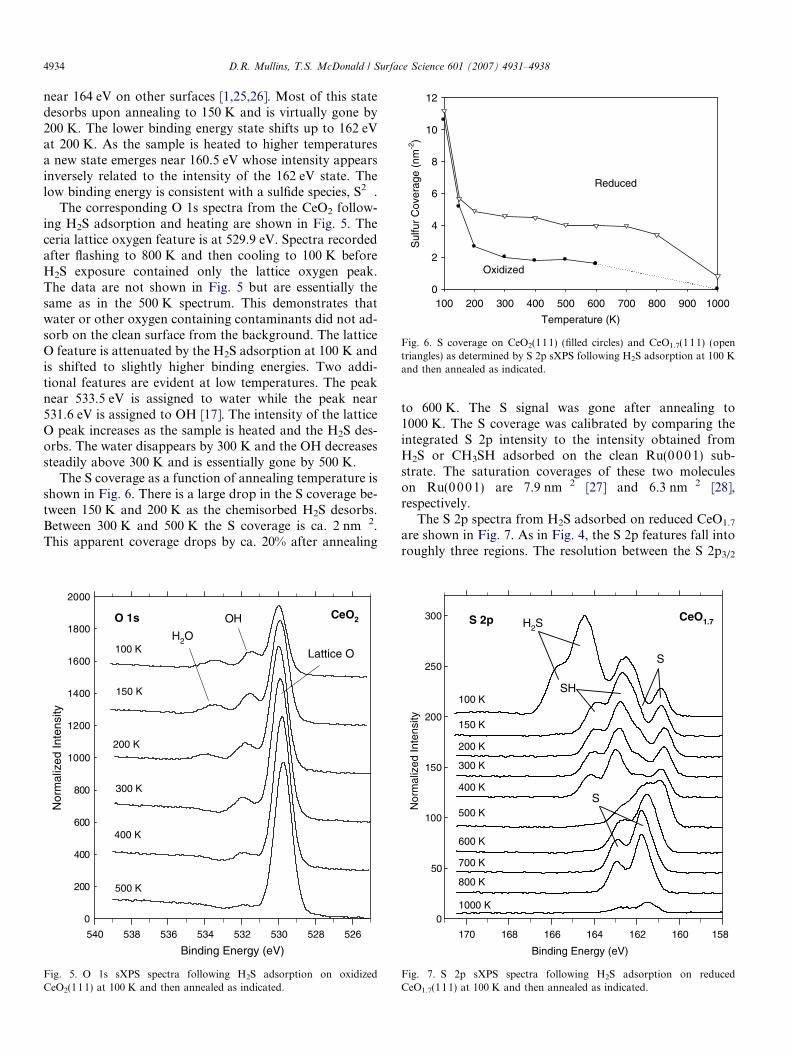
Fig. 4. S 2p sXPS spectra following H2S adsorption on oxidizedCeO2(111) at 100 K and then annealed as indicated.
D.R. Mullins, T.S. McDonald / Surface Science 601 (2007) 4931–4938 4933
the desorption at 155 K is therefore similar to the intensi-ties of the lowest temperature peak in the other spectra.As discussed below, some of the water may result from awater contaminant in the H2S or from the background.In addition, the feature at 155 K may result from an inter-action of H2S with the mass spectrometer ionizer. As thesurface becomes more reduced the H2O feature near155 K shifts to lower temperatures, as does the H2S desorp-
tion, and the desorption feature near 220 K weakens andbroadens.
A water desorption state appears near 580 K when thesurface contains 20% Ce3+. The intensity of this state in-creases as the surface becomes more reduced, reaching amaximum intensity near 50% Ce3+. At higher degrees ofreduction the water desorption intensity decreases and isgone at 90% Ce3+.
H2 did not desorb from the surface until the surface con-tained more than 50% Ce3+. At 70% Ce3+ an intense H2
desorption occurs near 560 K. The H2 desorption is moreintense and shifts to 550 K on CeO1.55 (90% Ce3+). TheH2 intensity is inversely related to the H2O intensity.
3.2. Soft X-ray photoelectron spectroscopy
Soft X-ray photoelectron spectra (sXPS) were collectedfrom the S 2p and O 1s core-levels after the ceria films wereexposed to H2S at 100 K and then annealed to progres-sively higher temperatures. In discussing the S 2p spectra,only the S 2p3/2 feature will be addressed for simplicity.It is understood that an S 2p1/2 feature also occurs at ca.1.2 eV greater binding energy.
The S 2p spectra from H2S adsorbed on oxidized CeO2
are shown in Fig. 4. The predominant S 2p features can bedivided into nominally three binding energy regions. Theseare assigned to H2S, SH and S species. Upon adsorption at100 K the S 2p3/2 peak positions are ca. 163.9 eV and161.6 eV. The high binding energy state is assigned toH2S. The S 2p binding energy for H2S has been observed
Temperature (K)
100 200 300 400 500 600 700 800 900 1000
Sul
fur
Cov
erag
e (n
m-2
)
0
2
4
6
8
10
12
Oxidized
Reduced
Fig. 6. S coverage on CeO2(111) (filled circles) and CeO1.7(111) (opentriangles) as determined by S 2p sXPS following H2S adsorption at 100 Kand then annealed as indicated.
4934 D.R. Mullins, T.S. McDonald / Surface Science 601 (2007) 4931–4938
near 164 eV on other surfaces [1,25,26]. Most of this statedesorbs upon annealing to 150 K and is virtually gone by200 K. The lower binding energy state shifts up to 162 eVat 200 K. As the sample is heated to higher temperaturesa new state emerges near 160.5 eV whose intensity appearsinversely related to the intensity of the 162 eV state. Thelow binding energy is consistent with a sulfide species, S2�.
The corresponding O 1s spectra from the CeO2 follow-ing H2S adsorption and heating are shown in Fig. 5. Theceria lattice oxygen feature is at 529.9 eV. Spectra recordedafter flashing to 800 K and then cooling to 100 K beforeH2S exposure contained only the lattice oxygen peak.The data are not shown in Fig. 5 but are essentially thesame as in the 500 K spectrum. This demonstrates thatwater or other oxygen containing contaminants did not ad-sorb on the clean surface from the background. The latticeO feature is attenuated by the H2S adsorption at 100 K andis shifted to slightly higher binding energies. Two addi-tional features are evident at low temperatures. The peaknear 533.5 eV is assigned to water while the peak near531.6 eV is assigned to OH [17]. The intensity of the latticeO peak increases as the sample is heated and the H2S des-orbs. The water disappears by 300 K and the OH decreasessteadily above 300 K and is essentially gone by 500 K.
The S coverage as a function of annealing temperature isshown in Fig. 6. There is a large drop in the S coverage be-tween 150 K and 200 K as the chemisorbed H2S desorbs.Between 300 K and 500 K the S coverage is ca. 2 nm�2.This apparent coverage drops by ca. 20% after annealing
Binding Energy (eV)
526528530532534536538540
Nor
mal
ized
Inte
nsity
0
200
400
600
800
1000
1200
1400
1600
1800
2000
100 K
200 K
500 K
H2O
Lattice O
OH
150 K
300 K
400 K
O 1s CeO2
Fig. 5. O 1s sXPS spectra following H2S adsorption on oxidizedCeO2(111) at 100 K and then annealed as indicated.
to 600 K. The S signal was gone after annealing to1000 K. The S coverage was calibrated by comparing theintegrated S 2p intensity to the intensity obtained fromH2S or CH3SH adsorbed on the clean Ru(0 001) sub-strate. The saturation coverages of these two moleculeson Ru(0 001) are 7.9 nm�2 [27] and 6.3 nm�2 [28],respectively.
The S 2p spectra from H2S adsorbed on reduced CeO1.7
are shown in Fig. 7. As in Fig. 4, the S 2p features fall intoroughly three regions. The resolution between the S 2p3/2
Binding Energy (eV)
158160162164166168170
Nor
mal
ized
Inte
nsity
0
50
100
150
200
250
300
200 K
300 K
500 K
700 K
1000 K
100 K
150 K
400 K
600 K
800 K
S 2p
S
SH
H2S
S
CeO1.7
Fig. 7. S 2p sXPS spectra following H2S adsorption on reducedCeO1.7(111) at 100 K and then annealed as indicated.
D.R. Mullins, T.S. McDonald / Surface Science 601 (2007) 4931–4938 4935
and S 2p1/2 components is worse than it was on the oxi-dized CeO2 surface (Fig. 4) perhaps indicating moreadsorption states and greater heterogeneity. The signalassociated with the chemisorbed H2S, located between164 eV and 166 eV, disappears between 100 K and 150 K.At 150 K there are two states with S 2p3/2 peak positionsat ca. 162.8 eV and 160.8 eV. The higher binding energystate has ca. twice the intensity of the lower binding energystate. The spectra are largely unchanged as the sample isannealed to 400 K. There is only a small decrease in theintensity of the shoulder near 162 eV. Upon annealing to500 K there is an abrupt change in the spectrum with thedisappearance of the state at 163 eV and an increase inintensity near 161.8 eV. As the sample is heated further,the lowest binding energy state near 160.8 eV collapses intothe feature near 161.8 eV. After heating to 1000 K, the S 2pintensity decreases.
The S coverage on the reduced surface is shown by theopen triangles in Fig. 6. The coverage at 100 K is similarto what was observed on the oxidized surface. The cover-age drops upon annealing to 150 K as H2S desorbs butthen there is only a gradual 20% decrease as the sampleis heated from 150 K to 800 K.
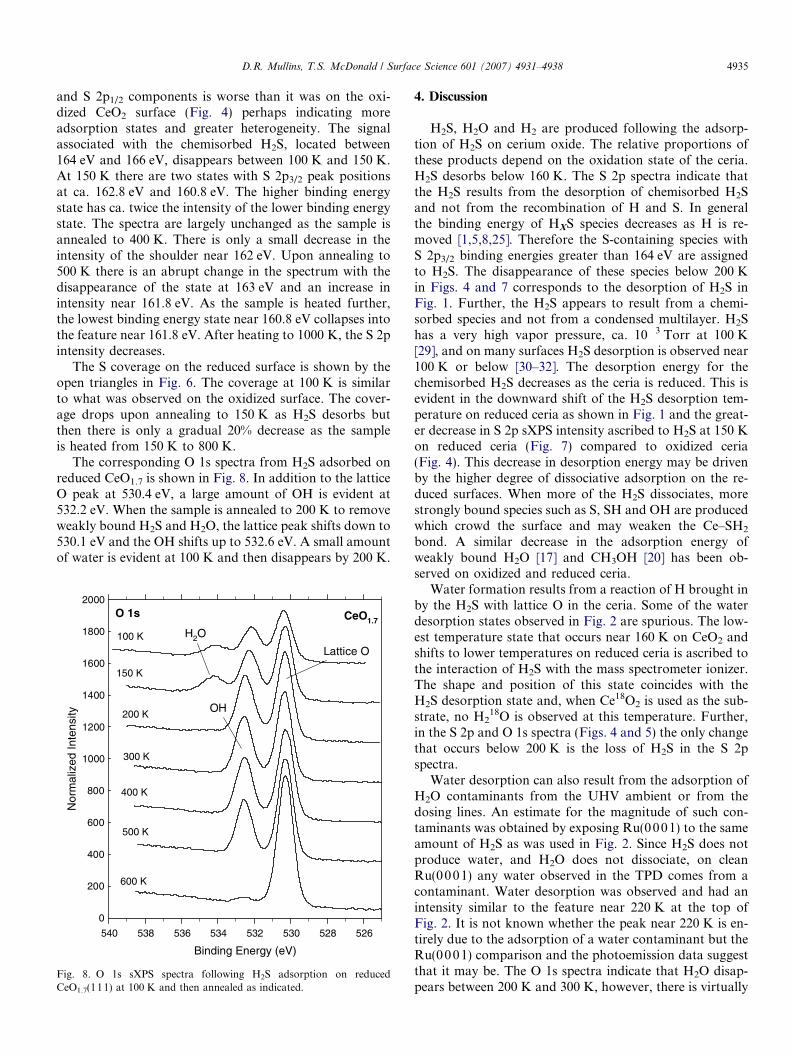
The corresponding O 1s spectra from H2S adsorbed onreduced CeO1.7 is shown in Fig. 8. In addition to the latticeO peak at 530.4 eV, a large amount of OH is evident at532.2 eV. When the sample is annealed to 200 K to removeweakly bound H2S and H2O, the lattice peak shifts down to530.1 eV and the OH shifts up to 532.6 eV. A small amountof water is evident at 100 K and then disappears by 200 K.
Binding Energy (eV)
526528530532534536538540
Nor
mal
ized
Inte
nsity
0
200
400
600
800
1000
1200
1400
1600
1800
2000
300 K
200 K
500 K
Lattice O
OH
600 K
400 K
150 K
100 K H2O
CeO1.7O 1s
Fig. 8. O 1s sXPS spectra following H2S adsorption on reducedCeO1.7(111) at 100 K and then annealed as indicated.
4. Discussion
H2S, H2O and H2 are produced following the adsorp-tion of H2S on cerium oxide. The relative proportions ofthese products depend on the oxidation state of the ceria.H2S desorbs below 160 K. The S 2p spectra indicate thatthe H2S results from the desorption of chemisorbed H2Sand not from the recombination of H and S. In generalthe binding energy of HXS species decreases as H is re-moved [1,5,8,25]. Therefore the S-containing species withS 2p3/2 binding energies greater than 164 eV are assignedto H2S. The disappearance of these species below 200 Kin Figs. 4 and 7 corresponds to the desorption of H2S inFig. 1. Further, the H2S appears to result from a chemi-sorbed species and not from a condensed multilayer. H2Shas a very high vapor pressure, ca. 10�3 Torr at 100 K[29], and on many surfaces H2S desorption is observed near100 K or below [30–32]. The desorption energy for thechemisorbed H2S decreases as the ceria is reduced. This isevident in the downward shift of the H2S desorption tem-perature on reduced ceria as shown in Fig. 1 and the great-er decrease in S 2p sXPS intensity ascribed to H2S at 150 Kon reduced ceria (Fig. 7) compared to oxidized ceria(Fig. 4). This decrease in desorption energy may be drivenby the higher degree of dissociative adsorption on the re-duced surfaces. When more of the H2S dissociates, morestrongly bound species such as S, SH and OH are producedwhich crowd the surface and may weaken the Ce–SH2
bond. A similar decrease in the adsorption energy ofweakly bound H2O [17] and CH3OH [20] has been ob-served on oxidized and reduced ceria.
Water formation results from a reaction of H brought inby the H2S with lattice O in the ceria. Some of the waterdesorption states observed in Fig. 2 are spurious. The low-est temperature state that occurs near 160 K on CeO2 andshifts to lower temperatures on reduced ceria is ascribed tothe interaction of H2S with the mass spectrometer ionizer.The shape and position of this state coincides with theH2S desorption state and, when Ce18O2 is used as the sub-strate, no H2
18O is observed at this temperature. Further,in the S 2p and O 1s spectra (Figs. 4 and 5) the only changethat occurs below 200 K is the loss of H2S in the S 2pspectra.
Water desorption can also result from the adsorption ofH2O contaminants from the UHV ambient or from thedosing lines. An estimate for the magnitude of such con-taminants was obtained by exposing Ru(0 001) to the sameamount of H2S as was used in Fig. 2. Since H2S does notproduce water, and H2O does not dissociate, on cleanRu(00 01) any water observed in the TPD comes from acontaminant. Water desorption was observed and had anintensity similar to the feature near 220 K at the top ofFig. 2. It is not known whether the peak near 220 K is en-tirely due to the adsorption of a water contaminant but theRu(00 01) comparison and the photoemission data suggestthat it may be. The O 1s spectra indicate that H2O disap-pears between 200 K and 300 K, however, there is virtually
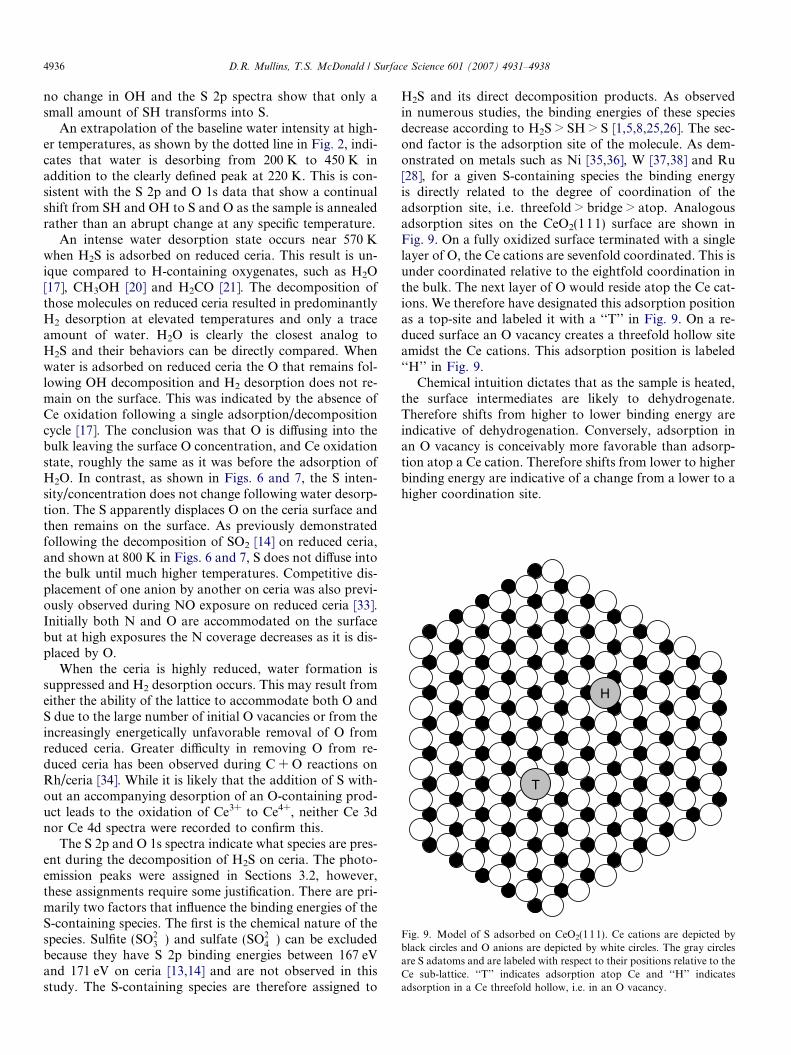
T
H
Fig. 9. Model of S adsorbed on CeO2(111). Ce cations are depicted byblack circles and O anions are depicted by white circles. The gray circlesare S adatoms and are labeled with respect to their positions relative to theCe sub-lattice. ‘‘T’’ indicates adsorption atop Ce and ‘‘H’’ indicatesadsorption in a Ce threefold hollow, i.e. in an O vacancy.
4936 D.R. Mullins, T.S. McDonald / Surface Science 601 (2007) 4931–4938
no change in OH and the S 2p spectra show that only asmall amount of SH transforms into S.
An extrapolation of the baseline water intensity at high-er temperatures, as shown by the dotted line in Fig. 2, indi-cates that water is desorbing from 200 K to 450 K inaddition to the clearly defined peak at 220 K. This is con-sistent with the S 2p and O 1s data that show a continualshift from SH and OH to S and O as the sample is annealedrather than an abrupt change at any specific temperature.
An intense water desorption state occurs near 570 Kwhen H2S is adsorbed on reduced ceria. This result is un-ique compared to H-containing oxygenates, such as H2O[17], CH3OH [20] and H2CO [21]. The decomposition ofthose molecules on reduced ceria resulted in predominantlyH2 desorption at elevated temperatures and only a traceamount of water. H2O is clearly the closest analog toH2S and their behaviors can be directly compared. Whenwater is adsorbed on reduced ceria the O that remains fol-lowing OH decomposition and H2 desorption does not re-main on the surface. This was indicated by the absence ofCe oxidation following a single adsorption/decompositioncycle [17]. The conclusion was that O is diffusing into thebulk leaving the surface O concentration, and Ce oxidationstate, roughly the same as it was before the adsorption ofH2O. In contrast, as shown in Figs. 6 and 7, the S inten-sity/concentration does not change following water desorp-tion. The S apparently displaces O on the ceria surface andthen remains on the surface. As previously demonstratedfollowing the decomposition of SO2 [14] on reduced ceria,and shown at 800 K in Figs. 6 and 7, S does not diffuse intothe bulk until much higher temperatures. Competitive dis-placement of one anion by another on ceria was also previ-ously observed during NO exposure on reduced ceria [33].Initially both N and O are accommodated on the surfacebut at high exposures the N coverage decreases as it is dis-placed by O.
When the ceria is highly reduced, water formation issuppressed and H2 desorption occurs. This may result fromeither the ability of the lattice to accommodate both O andS due to the large number of initial O vacancies or from theincreasingly energetically unfavorable removal of O fromreduced ceria. Greater difficulty in removing O from re-duced ceria has been observed during C + O reactions onRh/ceria [34]. While it is likely that the addition of S with-out an accompanying desorption of an O-containing prod-uct leads to the oxidation of Ce3+ to Ce4+, neither Ce 3dnor Ce 4d spectra were recorded to confirm this.
The S 2p and O 1s spectra indicate what species are pres-ent during the decomposition of H2S on ceria. The photo-emission peaks were assigned in Sections 3.2, however,these assignments require some justification. There are pri-marily two factors that influence the binding energies of theS-containing species. The first is the chemical nature of thespecies. Sulfite (SO2�
3 ) and sulfate (SO2�4 ) can be excluded
because they have S 2p binding energies between 167 eVand 171 eV on ceria [13,14] and are not observed in thisstudy. The S-containing species are therefore assigned to
H2S and its direct decomposition products. As observedin numerous studies, the binding energies of these speciesdecrease according to H2S > SH > S [1,5,8,25,26]. The sec-ond factor is the adsorption site of the molecule. As dem-onstrated on metals such as Ni [35,36], W [37,38] and Ru[28], for a given S-containing species the binding energyis directly related to the degree of coordination of theadsorption site, i.e. threefold > bridge > atop. Analogousadsorption sites on the CeO2(111) surface are shown inFig. 9. On a fully oxidized surface terminated with a singlelayer of O, the Ce cations are sevenfold coordinated. This isunder coordinated relative to the eightfold coordination inthe bulk. The next layer of O would reside atop the Ce cat-ions. We therefore have designated this adsorption positionas a top-site and labeled it with a ‘‘T’’ in Fig. 9. On a re-duced surface an O vacancy creates a threefold hollow siteamidst the Ce cations. This adsorption position is labeled‘‘H’’ in Fig. 9.
Chemical intuition dictates that as the sample is heated,the surface intermediates are likely to dehydrogenate.Therefore shifts from higher to lower binding energy areindicative of dehydrogenation. Conversely, adsorption inan O vacancy is conceivably more favorable than adsorp-tion atop a Ce cation. Therefore shifts from lower to higherbinding energy are indicative of a change from a lower to ahigher coordination site.
D.R. Mullins, T.S. McDonald / Surface Science 601 (2007) 4931–4938 4937
There are three species evident on oxidized ceria (Fig. 4).Consistent with the TPD data (Fig. 1), the S 2p state at thehighest binding energy desorbs below 200 K and is ascribedto H2S. The features at 162 eV and 160.5 eV are tentativelyassigned to SH and S, respectively, adsorbed atop Ce4+ cat-ions, i.e. the ‘‘T’’ site in Fig. 9. As shown in Fig. 6, the Scoverage is ca. 2 nm�2. This exceeds the number of Ovacancies likely to be present on the oxidized surface. Afully reduced Ce2O3 surface has only 2 vacancies nm�2
[23]. Therefore it is likely that the S binds atop the Ce4+
rather than in isolated O vacancies. The transition from162 eV to 160.5 eV likely results from the loss of H sincea change to a more highly coordinated adsorption sitewould increase rather than decrease the binding energy.
Qualitatively this assignment is consistent with the O 1 sand TPD data. The TPD spectra show a broad desorptionof water from 200 K to 450 K. Further, the O 1s spectrashow formation of OH at low temperatures and a mono-tonic decrease in the intensity of the OH with temperature.This is consistent with the partial decomposition of H2S atlow temperature to form OH and SH followed by thedecomposition and reaction of SH with OH to form Sand H2O. It is not clear whether the amount of water pro-duced and the amount of OH observed in Fig. 5 quantita-tively balance the amount of H supplied by the H2S. Someof the H could have been lost by H2 or H2O formationupon exposure at 100 K. H dissolution into the bulk mayalso be occurring.
H2S is also observed at the highest binding energies onreduced ceria in Fig. 7 and desorbs by 150 K. As on theoxidized surface, the species near 161 eV is assigned to Sadsorbed atop a Ce cation. The increase in binding energyrelative to the fully oxidized surface is consistent with pre-vious observations of SO2 [14], CH3OH [20], H2O [17] andH2CO [21] where nominally the same species has a higherbinding energy on reduced ceria compared to the oxidizedsurface. The state near 161.8 eV is formed at the highesttemperatures after all of the H2 and H2O has desorbed.This is assigned to S in an O vacancy site. The binding en-ergy of this species is similar to what was previously re-ported following the decomposition of SO2 on reducedceria [14]. Note that due to a recalibration of the bindingenergies [20], the binding energies reported for SO2 wereca. 0.5 eV too high.
The dominant features between 162 eV and 163 eV areassigned to SH species. The breadth of these features witha shoulder evident at 162 eV and the valley filled in betweenthe doublets at 163.5 eV indicate the presence of at leasttwo states with the predominant species being SH in a va-cancy site at 163 eV and SH in a top-site at ca. 162 eV. Thelower binding energy SH component appears to decay firstbetween 150 K and 300 K. The other SH component disap-pears suddenly between 400 K and 500 K. This transforma-tion does not appear to be consistent with either the O 1s(Fig. 8) or TPD (Figs. 2 and 3) data. There is no corre-sponding change in the O 1s spectra that would indicatea reaction with OH species. There is also no H2O or H2
desorption evident between 400 K and 500 K. The disap-pearance of the OH in the O 1s spectra between 500 Kand 600 K is consistent with the TPD. The change in theS 2p spectra can only be rationalized if H is dissolving intothe bulk.
The decrease in the S intensity above 800 K is caused byS dissolution into the bulk. Similar behavior was observedfollowing the decomposition of SO2. In that case the disso-lution rather than the desorption of S was demonstrated bygently sputtering the sample to remove surface S and thenannealing to restore S from the bulk [14].
5. Conclusions
H2S chemisorbs on both oxidized and reducedCeOX(111). Upon annealing a substantial amount of theH2S desorbs below 200 K. Some of the hydrogen sulfidedissociates to produce SH and OH on the surface. On oxi-dized ceria the hydrogen reacts with the surface O to des-orb as water between 200 K and 450 K. Atomic S is lefton the surface. When the ceria is initially reduced, theOH and SH are stabilized on the surface and water desorbsin a well defined reaction near 560 K. On highly reducedceria it becomes more difficult to remove O from the sur-face and H2 desorbs instead. H2S, SH and S are readilyidentified in S 2p photoemission and the surface decompo-sition was characterized as a function of Ce oxidation stateand temperature.
Acknowledgements
Research sponsored by the Division of Chemical Sci-ences, Geosciences, and Biosciences, Office of Basic EnergySciences, US Department of Energy, under Contract DE-AC05-00OR22725 with Oak Ridge National Laboratory,managed and operated by UT-Battelle, LLC. The NationalSynchrotron Light Source, Brookhaven National Labora-tory, is supported by the US Department of Energy, Divi-sion of Materials Sciences and Division of ChemicalSciences under Contract No. DE-AC02-98CH10886.
References
[1] J.A. Rodriguez, T. Jirsak, S. Chaturvedi, Journal of Chemical Physics111 (1999) 8077.
[2] J.A. Rodriguez, S. Chaturvedi, M. Kuhn, J. Hrbek, Journal ofPhysical Chemistry B 102 (1998) 5511.
[3] J.A. Rodriguez, S. Chaturvedi, M. Kuhn, J. vanEk, U. Diebold, P.S.Robbert, H. Geisler, C.A. Ventrice, Journal of Chemical Physics 107(1997) 9146.
[4] J.Y. Lin, J.A. May, S.V. Didziulis, E.I. Solomon, Journal of theAmerican Chemical Society 114 (1992) 4718.
[5] Q.F. Wu, B.V. Yakshinskiy, T.E. Madey, Surface Science 523 (2003)1.
[6] D.D. Beck, J.M. White, C.T. Ratcliffe, Journal of Physical Chemistry90 (1986) 3123.
[7] A. Fahmi, J. Ahdjoudj, C. Minot, Surface Science 352 (1996) 529.[8] J.A. Rodriguez, T. Jirsak, S. Chaturvedi, J. Hrbek, Surface Science
407 (1998) 171.
4938 D.R. Mullins, T.S. McDonald / Surface Science 601 (2007) 4931–4938
[9] K.E. Smith, V.E. Henrich, Surface Science 225 (1990) 47.[10] X.M. Li, V.E. Henrich, Physical Review B 48 (1993) 17486.[11] D.R. Warburton, D. Purdie, C.A. Muryn, K. Prabhakaran, P.L.
Wincott, G. Thornton, Surface Science 270 (1992) 305.[12] J.A. Rodriguez, T. Jirsak, S. Chaturvedi, M. Kuhn, Surface Science
442 (1999) 400.[13] J.A. Rodriguez, T. Jirsak, A. Freitag, J.C. Hanson, J.Z. Larese, S.
Chaturvedi, Catalysis Letters 62 (1999) 113.[14] S.H. Overbury, D.R. Mullins, D.R. Huntley, L. Kundakovic, Journal
of Physical Chemistry B 103 (1999) 11308.[15] R.M. Ferriz, R.J. Gorte, J.M. Vohs, Catalysis Letters 82 (2002) 123.[16] M.A. Henderson, C.L. Perkins, M.H. Engelhard, S. Thevuthasan,
C.H.F. Peden, Surface Science 526 (2003) 1.[17] L. Kundakovic, D.R. Mullins, S.H. Overbury, Surface Science 457
(2000) 51.[18] R.M. Ferriz, G.S. Wong, T. Egami, J.M. Vohs, Langmuir 17 (2001)
2464.[19] A. Siokou, R.M. Nix, Journal of Physical Chemistry B 103 (1999)
6984.[20] D.R. Mullins, M.D. Robbins, J. Zhou, Surface Science 600 (2006)
1547.[21] J. Zhou, D.R. Mullins, Surface Science 600 (2006) 1540.[22] D.R. Mullins, S.H. Overbury, D.R. Huntley, Surface Science 409
(1998) 307.[23] D.R. Mullins, P.V. Radulovic, S.H. Overbury, Surface Science 429
(1999) 186.
[24] J.L. Lu, H.J. Gao, S. Shaikhutdinov, H.J. Freund, Surface Science600 (2006) 5004.
[25] D.R. Huntley, Surface Science 240 (1990) 13.[26] S.Y. Li, J.A. Rodriguez, J. Hrbek, H.H. Huang, G.Q. Xu, Surface
Science 366 (1996) 29.[27] S.R. Kelemen, T.E. Fischer, Surface Science 87 (1979) 53.[28] D.R. Mullins, P.F. Lyman, Journal of Physical Chemistry 97 (1993)
12008.[29] R.E. Honig, H.O. Hook, RCA Review 21 (1960) 360.[30] R.J. Koestner, M. Salmeron, E.B. Kollin, J.L. Gland, Surface Science
172 (1986) 668.[31] A.J. Leavitt, T.P. Beebe, Surface Science 314 (1994) 23.[32] R. Mcgrath, A.A. Macdowell, T. Hashizume, F. Sette, P.H. Citrin,
Physical Review Letters 64 (1990) 575.[33] S.H. Overbury, D.R. Mullins, D.R. Huntley, L. Kundakovic, Journal
of Catalysis 186 (1999) 296.[34] D.R. Mullins, K. Zhang, Journal of Physical Chemistry B 105 (2001)
1374.[35] D.R. Mullins, D.R. Huntley, T. Tang, D.K. Saldin, W.T. Tysoe,
Surface Science 380 (1997) 468.[36] D.R. Mullins, D.R. Huntley, S.H. Overbury, Surface Science 323
(1995) L287.[37] D.R. Mullins, P.F. Lyman, S.H. Overbury, Surface Science 277
(1992) 64.[38] D.R. Mullins, P.F. Lyman, Journal of Physical Chemistry 97 (1993)
9226.