adoption of new service development tools in the financial service industry
TRANSCRIPT

Adoption of New Service Development Tools in the Financial Service Industry
Dayu Jin, Kah-Hin Chai, Kay-Chuan TanDepartment of Industrial and Systems Engineering
National University of Singapore
Introduction - Background
2
• New service development (NSD) is important; however NSD success rate is low.
Success rate is as low as 58% (Griffin, 1997).
NSD lacks structured processes and services just “happen” ((de Jong and Vermeulen, 2003).
• Various NSD tools have been proposed. Prototyping services (Shostack, 1984).
Identifying customer needs (Alam, 2002).
Trouble-shooting causes of potential problems (Dorsh et al., 1997).
Introduction – Motivations
• There is no systematic review of the NSD tools used in NSD projects (Menor et al., 2002).
• It is not clear about the role of key factors in influencing the adoption of NSD tools (Kettinger et al., 1997).
3
1) What are the NSD tools that can facilitate NSD process?
2) What are the factors influencing the adoption of NSD tools in service firms?
Literature Review (1)
4
• NPD tools studies
• NSD tools studies
Usage is low (Mahajan and Wind, 1992; Nijssen and Lieshout, 1995).
To improve success rate and to identify problem (Mahajan and Wind, 1992; Nijssen and Lieshout, 1995).
Overall satisfaction (Mahajan and Wind, 1992).
Correlate with NPD success (Nijssen and Lieshout, 1995; González and Palacios, 2002; Yeh et al., 2008).
General (e.g., Bitran and Pedrosa, 1998; Edvardsson et al., 2000; Alam, 2002; Antony, 2004).
Specific (e.g., Shostack, 1984; Wind et al., 1989; Ko and Lee, 2000; Ahn and Skudlark, 2002).
Lack of systematic studies on NSD tools.
Literature Review (2)
5
Organizational adoption of innovation
Innovation characteristics – relative advantage, compatibility, and complexity (Tornatzky and Klein, 1982; Rogers, 1995).
Organizational factors – resources and specialization (Rosner, 1968; Kimberly and Evanisko, 1981; Greenhalgh et al., 2004).
Institutional environment – pressures from competitors, customers, and suppliers (DiMaggio and Powell, 1983; Wu et al., 2003).
Link determinants directly to the adoption while ignore the decision-making process.
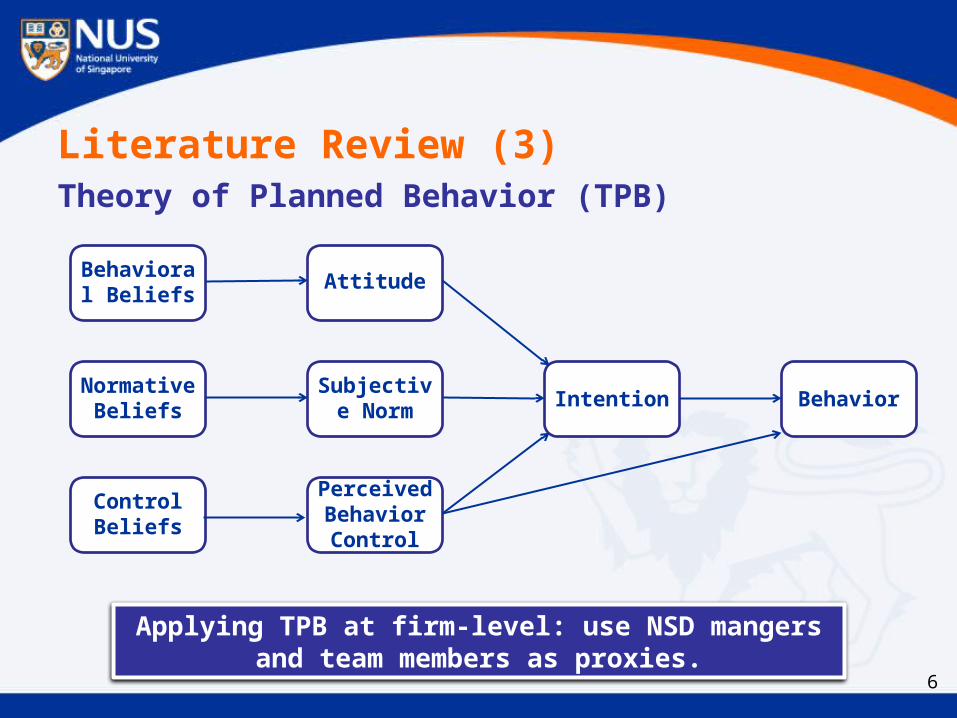
Literature Review (3)Theory of Planned Behavior (TPB)
6
Applying TPB at firm-level: use NSD mangers and team members as proxies.
Behavioral Beliefs
Normative Beliefs
Control Beliefs
Attitude
Subjective Norm
Perceived Behavior Control
Intention Behavior
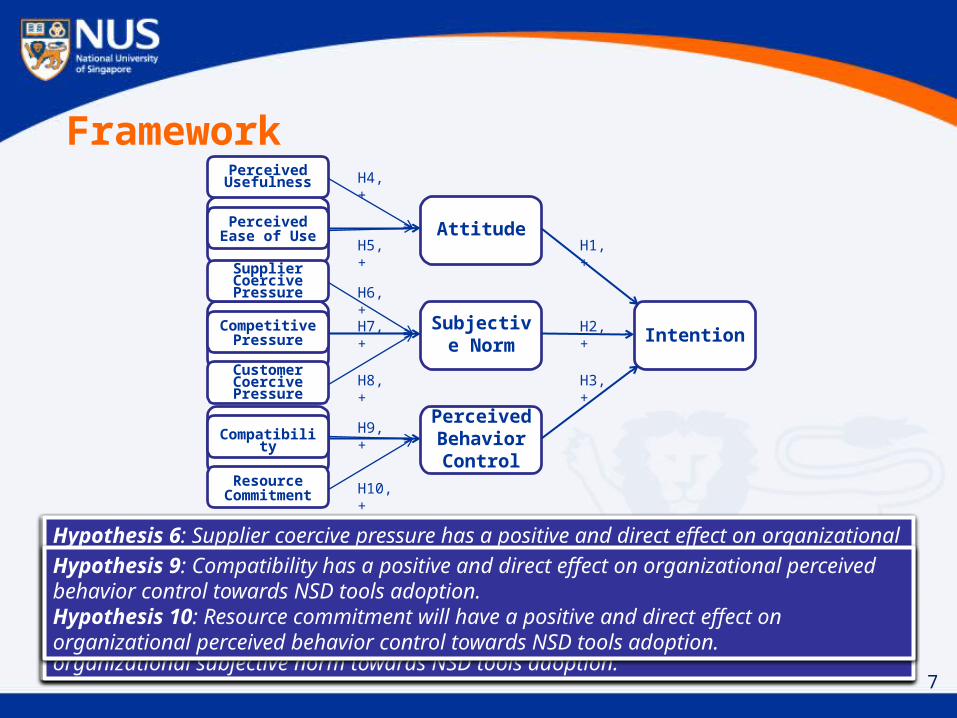
Framework
Attitude
Subjective Norm
Perceived Behavior Control
Intention
Behavioral Beliefs
Normative Beliefs
Control Beliefs
H1, +
H2, +
H3, +
Hypothesis 1: Attitude towards adopting NSD tools has a positive and direct effect on the intention to adopt these tools.Hypothesis 2: Subjective norm towards adopting NSD tools has a positive and direct effect on the intention to adopt these tools.Hypothesis 3: Perceived behavior control towards adopting NSD tools has a positiveand direct effect on the intention to adopt these tools.
Perceived Usefulness
Perceived Ease of Use
Supplier Coercive Pressure
Competitive Pressure
Customer Coercive Pressure
Compatibility
Resource Commitment
H4, +
H5, +
H6, +
H7, +
H8, +
H9, +
H10, +
Hypothesis 4: Perceived usefulness has a positive and direct effect on organizational attitude towards NSD tools adoption.Hypothesis 5: Perceived ease of use has a positive and direct effect on organizational attitudes towards NSD tools adoption.
Hypothesis 6: Supplier coercive pressure has a positive and direct effect on organizational subjective norm towards NSD tools adoption.Hypothesis 7: Competitive pressure has a positive and direct effect on organizational subjective norm towards NSD tools adoption.Hypothesis 8: Customer coercive pressure has a positive and direct effect on organizational subjective norm towards NSD tools adoption.
Hypothesis 9: Compatibility has a positive and direct effect on organizational perceived behavior control towards NSD tools adoption.Hypothesis 10: Resource commitment will have a positive and direct effect on organizational perceived behavior control towards NSD tools adoption.
7
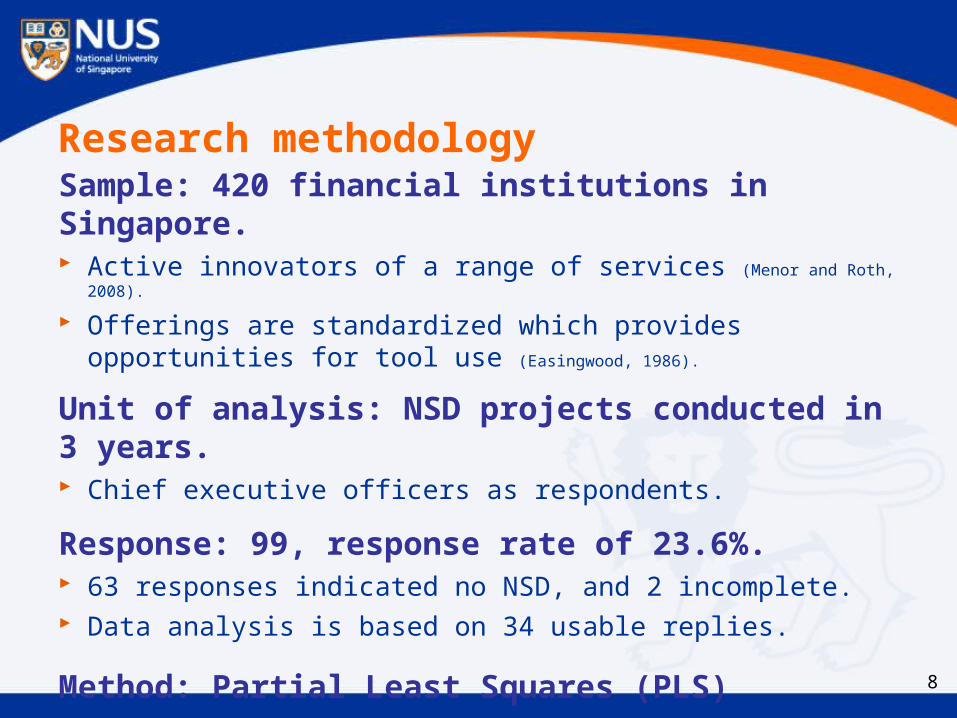
Research methodologySample: 420 financial institutions in Singapore. Active innovators of a range of services (Menor and Roth, 2008).
Offerings are standardized which provides opportunities for tool use (Easingwood, 1986).
Unit of analysis: NSD projects conducted in 3 years. Chief executive officers as respondents.
Response: 99, response rate of 23.6%. 63 responses indicated no NSD, and 2 incomplete. Data analysis is based on 34 usable replies.
Method: Partial Least Squares (PLS) Use of both reflective and formative measures. Accurate results under small sample.
8
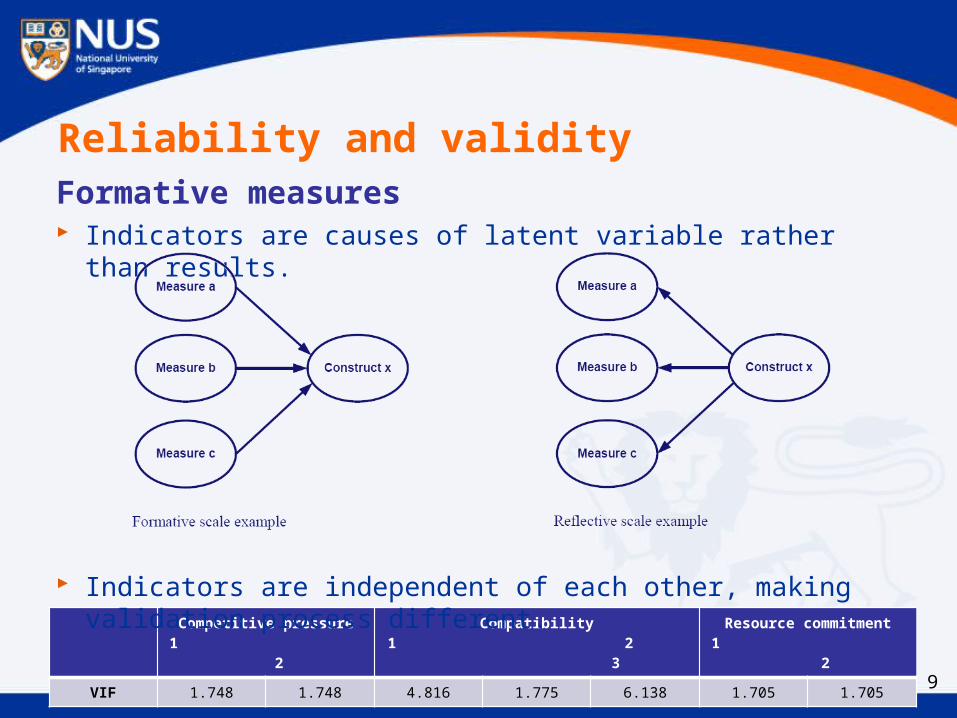
Reliability and validity
9
Competitive pressure1 2
Compatibility1 2 3
Resource commitment1 2
VIF 1.748 1.748 4.816 1.775 6.138 1.705 1.705
Formative measures Indicators are causes of latent variable rather than results.
Indicators are independent of each other, making validation process different.
10
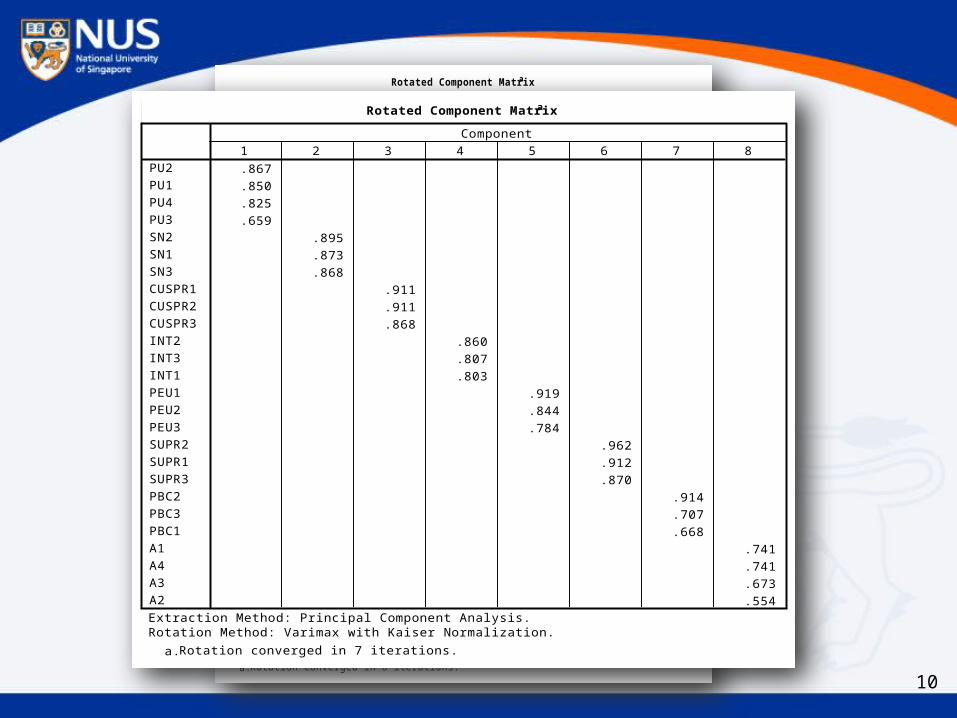
Rotated Component Matrixa
.848
.835
.829
.652
.557 .515
.876
.853
.831
.621
.859
.809
.766
.859
.789
.746
.556
.532
.908
.897
.857
.898
.804
.638
.611
.545
.940
.909
.871
.758
.738
.608
SN2
SN1
SN3
CMPT3
CMPT1
PU2
PU1
PU4
PU3
INT2
INT3
INT1
CMPT2
PEU1
PEU2
PEU3
COMPR1
COMPR3
CUSPR1
CUSPR2
CUSPR3
PBC2
RECS2
PBC3
PBC1
RESC1
SUPR2
SUPR1
SUPR3
A3
A4
A1
A2
1 2 3 4 5 6 7 8
Component
Extraction Method: Principal Component Analysis. Rotation Method: Varimax with Kaiser Normalization.
Rotation converged in 8 iterations.a.
Rotated Component Matrixa
.867
.850
.825
.659
.895
.873
.868
.911
.911
.868
.860
.807
.803
.919
.844
.784
.962
.912
.870
.914
.707
.668
.741
.741
.673
.554
PU2
PU1
PU4
PU3
SN2
SN1
SN3
CUSPR1
CUSPR2
CUSPR3
INT2
INT3
INT1
PEU1
PEU2
PEU3
SUPR2
SUPR1
SUPR3
PBC2
PBC3
PBC1
A1
A4
A3
A2
1 2 3 4 5 6 7 8
Component
Extraction Method: Principal Component Analysis. Rotation Method: Varimax with Kaiser Normalization.
Rotation converged in 7 iterations.a.
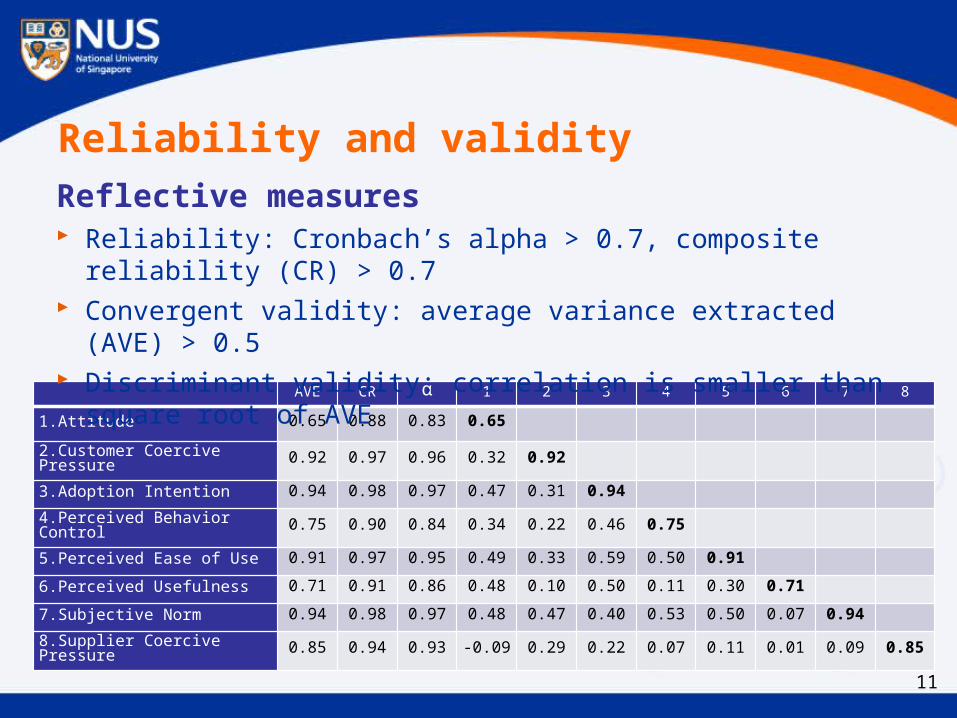
Reliability and validity
11
AVE CR α 1 2 3 4 5 6 7 8
1.Attitude 0.65 0.88 0.83 0.65
2.Customer Coercive Pressure 0.92 0.97 0.96 0.32 0.92
3.Adoption Intention 0.94 0.98 0.97 0.47 0.31 0.94
4.Perceived Behavior Control 0.75 0.90 0.84 0.34 0.22 0.46 0.75
5.Perceived Ease of Use 0.91 0.97 0.95 0.49 0.33 0.59 0.50 0.91
6.Perceived Usefulness 0.71 0.91 0.86 0.48 0.10 0.50 0.11 0.30 0.71
7.Subjective Norm 0.94 0.98 0.97 0.48 0.47 0.40 0.53 0.50 0.07 0.94
8.Supplier Coercive Pressure 0.85 0.94 0.93 -0.09 0.29 0.22 0.07 0.11 0.01 0.09 0.85
Reflective measures Reliability: Cronbach’s alpha > 0.7, composite reliability (CR) > 0.7 Convergent validity: average variance extracted (AVE) > 0.5 Discriminant validity: correlation is smaller than square root of AVE
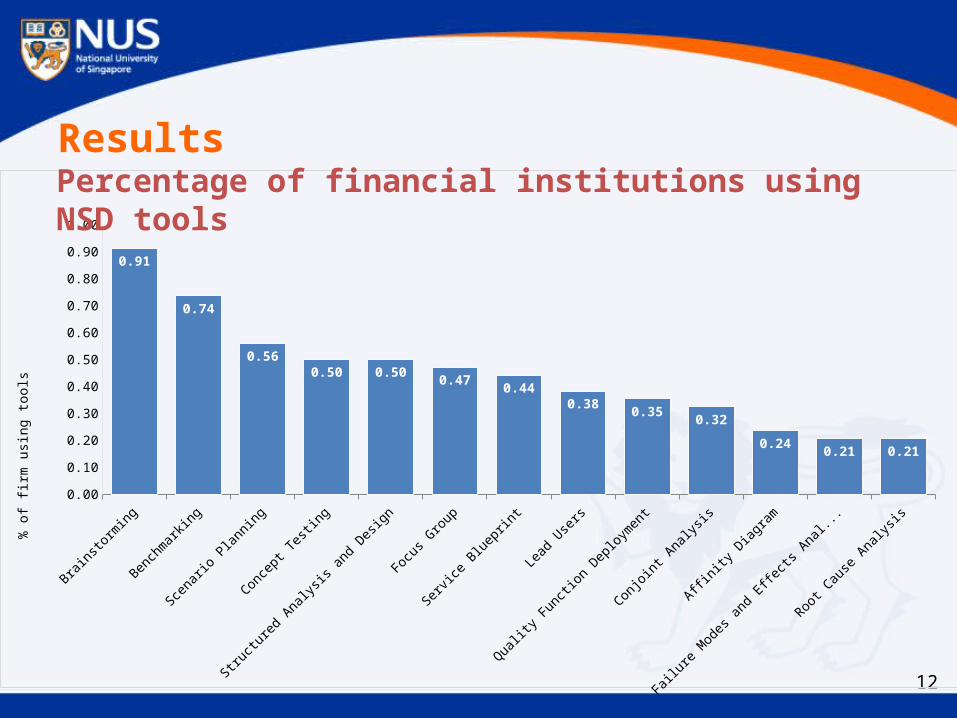
Results
12
Brainsto
rming
Bench
marking
Scenari
o Planning
Concept T
esting
Structu
red Analy
sis an
d Design
Focu
s Gro
up
Servi
ce Bluep
rint
Lead User
s
Quality
Functi
on Deploym
ent
Conjoint Analy
sis
Affinity Diag
ram
Failu
re Modes
and Eff
ects A
nalysis
Root Cau
se Analy
sis0.00
0.10
0.20
0.30
0.40
0.50
0.60
0.70
0.80
0.90
1.00
0.91
0.74
0.560.50 0.50 0.47 0.44
0.38 0.35 0.32
0.24 0.21 0.21
% o
f firm
usin
g to
ols
Percentage of financial institutions using NSD tools
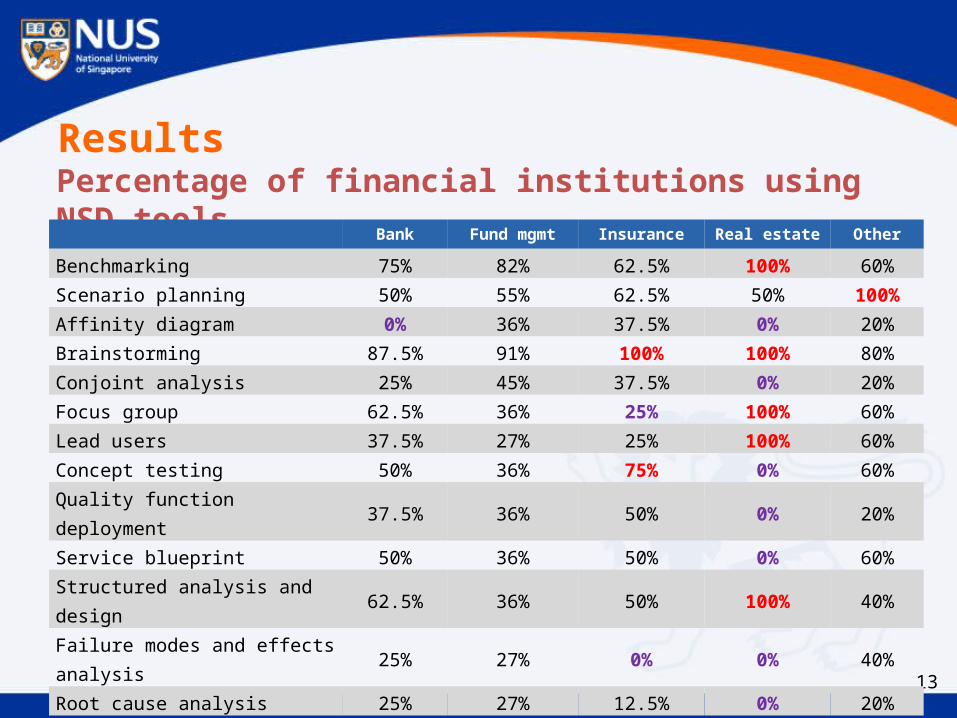
Results
13
Percentage of financial institutions using NSD toolsBank Fund mgmt Insurance Real estate Other
Benchmarking 75% 82% 62.5% 100% 60%Scenario planning 50% 55% 62.5% 50% 100%Affinity diagram 0% 36% 37.5% 0% 20%Brainstorming 87.5% 91% 100% 100% 80%Conjoint analysis 25% 45% 37.5% 0% 20%Focus group 62.5% 36% 25% 100% 60%Lead users 37.5% 27% 25% 100% 60%Concept testing 50% 36% 75% 0% 60%Quality function deployment 37.5% 36% 50% 0% 20%Service blueprint 50% 36% 50% 0% 60%Structured analysis and design 62.5% 36% 50% 100% 40%Failure modes and effects analysis 25% 27% 0% 0% 40%Root cause analysis 25% 27% 12.5% 0% 20%
■ Significantly higher than usage in other industries (p<5) ■ Significantly lower than usage in other industries (p<.05)
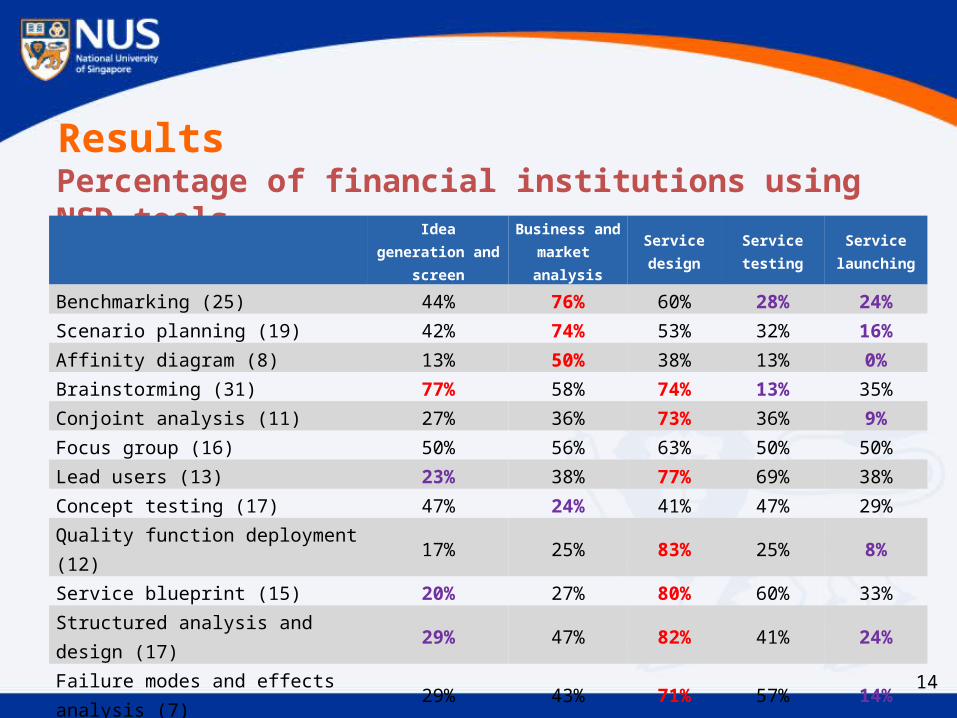
Results
14
Percentage of financial institutions using NSD toolsIdea generation and
screenBusiness and
market analysisService design Service testing Service
launching
Benchmarking (25) 44% 76% 60% 28% 24%Scenario planning (19) 42% 74% 53% 32% 16%Affinity diagram (8) 13% 50% 38% 13% 0%Brainstorming (31) 77% 58% 74% 13% 35%Conjoint analysis (11) 27% 36% 73% 36% 9%Focus group (16) 50% 56% 63% 50% 50%Lead users (13) 23% 38% 77% 69% 38%Concept testing (17) 47% 24% 41% 47% 29%Quality function deployment (12) 17% 25% 83% 25% 8%Service blueprint (15) 20% 27% 80% 60% 33%Structured analysis and design (17) 29% 47% 82% 41% 24%Failure modes and effects analysis (7) 29% 43% 71% 57% 14%Root cause analysis (7) 43% 57% 29% 43% 57%
■ Significantly higher than usage in other NSD stages (p<.05)
■ Significantly lower than usage in other NSD stages (p<.05)
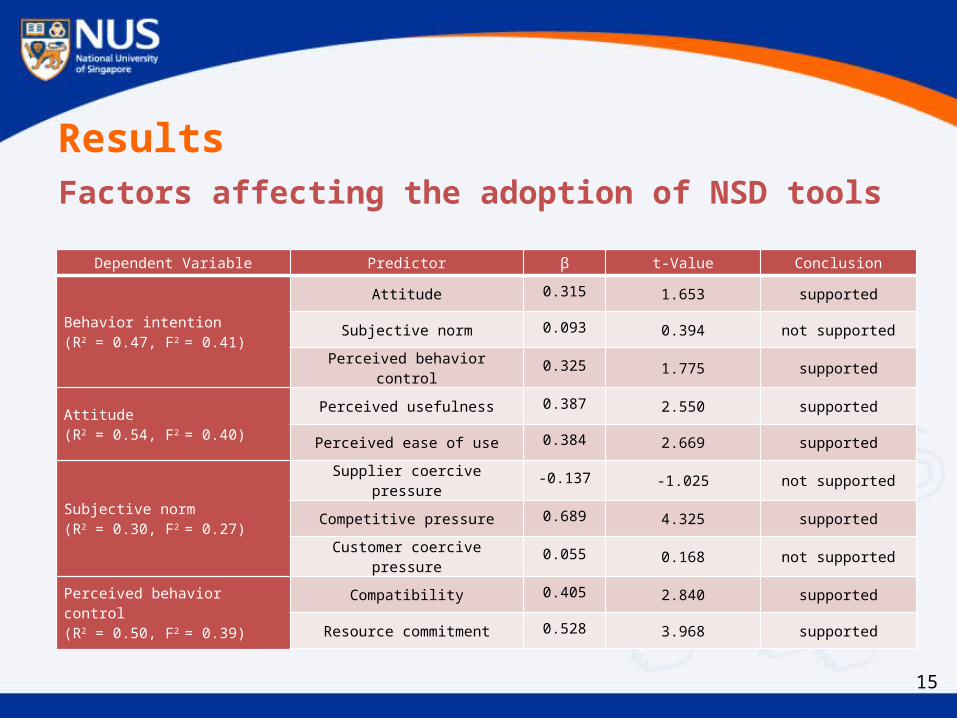
ResultsFactors affecting the adoption of NSD tools
15
Dependent Variable Predictor β t-Value Conclusion
Behavior intention(R2 = 0.47, F2 = 0.41)
Attitude 0.315 1.653 supported
Subjective norm 0.093 0.394 not supported
Perceived behavior control 0.325 1.775 supported
Attitude(R2 = 0.54, F2 = 0.40)
Perceived usefulness 0.387 2.550 supported
Perceived ease of use 0.384 2.669 supported
Subjective norm(R2 = 0.30, F2 = 0.27)
Supplier coercive pressure -0.137 -1.025 not supported
Competitive pressure 0.689 4.325 supported
Customer coercive pressure 0.055 0.168 not supported
Perceived behavior control(R2 = 0.50, F2 = 0.39)
Compatibility 0.405 2.840 supported
Resource commitment 0.528 3.968 supported
Implications/ConclusionsProvided a systematic review on the use of NSD tools. When to use which NSD tool in NSD project.
Conceptualized a framework explaining the adoption of NSD tools in service firms. Provide implications for future development of new NSD tools by
both scholars and practitioners. Suitable to understand the adoption of innovation in service firms.
Extended the application of TPB to firm-level other than confined it to individual-level. In accordance with the survey method.
16

Thank you!