additive manufacturing: a study on ti-6al-4v and
TRANSCRIPT

materials
Article
Cross-Contamination Quantification in Powders forAdditive Manufacturing: A Study on Ti-6Al-4V andMaraging Steel
Eleonora Santecchia 1,2,* , Paolo Mengucci 2 , Andrea Gatto 3, Elena Bassoli 3 ,Silvio Defanti 3 and Gianni Barucca 2
1 Consorzio Interuniversitario Nazionale per la Scienza e Tecnologia dei Materiali (INSTM-UdR Ancona),Via Brecce Bianche 12, 60131 Ancona, Italy
2 Dipartimento SIMAU, Università Politecnica delle Marche, Via Brecce Bianche 12, 60131 Ancona, Italy3 Università di Modena e Reggio Emilia, Dipartimento DIEF, Via Vivarelli 10, 41125 Modena, Italy* Correspondence: [email protected]; Tel.: +39-0712204751
Received: 28 June 2019; Accepted: 20 July 2019; Published: 24 July 2019�����������������
Abstract: Metal additive manufacturing is now taking the lead over traditional manufacturingtechniques in applications such as aerospace and biomedicine, which are characterized by lowproduction volumes and high levels of customization. While fulfilling these requirements is thestrength of metal additive manufacturing, respecting the tight tolerances typical of the mentionedapplications is a harder task to accomplish. Powder bed fusion (PBF) is a class of additivemanufacturing in which layers of metal powder are fused on top of each other by a high-energybeam (laser or electron beam) according to a computer-aided design (CAD) model. The quality ofraw powders for PBF affects the mechanical properties of additively manufactured parts strongly,and therefore it is crucial to avoid the presence of any source of contamination, particularlycross-contamination. In this study, the identification and quantification of cross-contaminationin powders of Ti-6Al-4V and maraging steel was performed using scanning electron microscopy(SEM) and energy-dispersive spectroscopy (EDS) techniques. Experimental results showed anoverall good reliability of the developed method, opening the way for applications in machinelearning environments.
Keywords: PBF; cross-contamination; Ti-6Al-4V; maraging steel
1. Introduction
Manufacturing complex shapes without additional costs is certainly one of the outstandingadvantages of metal additive manufacturing. This range of techniques also allows a high freedomof design with consequent savings in materials and weight. One of the most widely used additivemanufacturing techniques for metals and alloys is laser powder bed fusion (PBF), during which layersof powder feedstock are selectively fused one on top of the other by a high-energy laser, while unfusedpowder supports the manufactured part [1]. More than fifty process parameters can be finely tunedto customize the microstructure of the used metallic material and the mechanical behavior of thefinal part [2,3]. However, while machine working parameters can be fixed quite reliably, one of thekeys to ensuring repeatability of the laser powder bed fusion process is the quality of the powderfeedstock. Currently, the market offer is based on atomized pure metals and pre-alloyed metal powdershaving particle sizes in the range of 10–45 µm, which must fulfill mandatory requirements such as thecompliance to chemistry specifications (alloying elements and interstitials) and the ability to spreadevenly across the machine’s build platform. All these properties can be controlled through different
Materials 2019, 12, 2342; doi:10.3390/ma12152342 www.mdpi.com/journal/materials

Materials 2019, 12, 2342 2 of 11
characterization methods, ranging from laser diffraction and scanning electron microscopy (particlesize and morphology) to Hall and Carney funnels to assess the flowability, and X-ray diffraction (XRD),computed tomography (CT), and spectroscopic equipment to check the chemical composition andcrystallinity [4–7].
When it comes to high-end application fields such as medicine and aerospace, and/or whenthe designed additively manufactured part is intended to be used for structural applications, afurther crucial requirement, often underrated, is that the metal powder feedstock must be free fromany foreign particulate contamination, such as light elements contamination (i.e., oxidation) andcross-contamination (exogenous), which is linked to the accidental mixing of metal powders having adifferent chemical composition [8,9]. Some combinations of metal powders’ cross-contamination wereshown to have a detrimental effect on the mechanical properties, as reported by Brandão et al. [10] forTi-6Al-4V and W, and by Gatto et al. [11] for maraging steel and metal oxides.
As suggested by Frazier [12], “alternatives to conventional qualification methods must be foundbased upon validated models, probabilistic methods and part similarities among others”, and whileASTM and other regulatory agencies are making a strong effort to develop new standards for additivemanufacturing (AM), there is still a long way to go. New sets of standards will address the whole themanufacturing process chain, with a particular focus on critical applications (i.e., structural, aerospace,and biomedical).
Concerning the quality of the metal powder feedstock, the presence of a small amount (lower than1 wt.%) of cross-contamination is not expected to significantly modify the rheological and macroscopicproperties of the powder (granulometry, flowability, etc.), and cannot be identified with conventionallaboratory XRD equipment. Therefore, the most commonly applied characterization techniques to checkthe morphology, dimensions, and inhomogeneities of metal powder feedstock are X-ray computedtomography (CT) and scanning electron microscopy (SEM) [4,13–16]. However, other characterizationtechniques such as electron backscattered diffraction (EBSD), secondary ions mass spectrometry(SIMS), and X-ray photoelectron spectroscopy (XPS) could be of high interest for cross-contaminationdetection and characterization. X-ray CT has proven to be extremely powerful for defects identificationin AM parts generated by porosity [17] and/or cross-contamination [10,18]. On the other hand,automated systems such as computer-controlled SEM (CCSEM) equipped with software dedicated topowders identification and analysis in a particle-by-particle (PxP) approach [19] have a high potentialfor the determination of exogenous contamination detection and, therefore, feedstock qualification.Furthermore, image analysis software can be used to analyze results from CT scan and scanningelectron microscopy micrographs [13]. SEMs are often equipped with energy-dispersive spectroscopy(EDS) detectors, which allow verification of the inhomogeneities in the chemical composition of thepowders and easy identification and location of the cross-contamination in the sample [20].
Although the topic of spatter powders having different particle size than the virgin feedstock butthe same chemical composition (besides an increased oxygen content) has already been addressed inthe literature [21–23], the focus of this study is on the investigation of cross-contamination having adifferent chemical composition than the feedstock material, but comparable powder particle size.
Moreover, while many papers focus on the inspection of the powder feedstock to identify thecontamination, there is a lack of experimental methods which can lead to a quantification of thecontaminant. Therefore, the aim of the present paper was to develop an easy and reliable quantificationprocedure which is also effective for low cross-contamination concentrations (≤1 wt.%), based on astatistical approach which couples the SEM and EDS characterization techniques. The combination ofthe chemical information given by the backscattered electrons (BSE) signal in SEM and the EDS spectraand elemental maps was used to spot the contamination and then clearly quantify it. The experimentalresults indicate that by finely tuning the SEM–BSE working parameters, it is possible to enhancethe quality of the acquired micrographs, suggesting a feasible implementation of the developedimage-based quantification procedure in a machine learning environment.

Materials 2019, 12, 2342 3 of 11
2. Materials and Methods
The starting materials for the present study were two EOS (Electro Optical Systems GmbH,Krailling, Germany) virgin powders: (i) MaragingSteel MS1 [24], and (ii) Titanium Ti64 [25]. The firstone is a maraging steel corresponding to US classification 18% Ni Maraging 300 and European 1.2709,while the latter is a Ti-6Al-4V alloy, corresponding to ISO 5832-3, ASTM F1472, and ASTM B348.
A controlled cross-contamination between the two powders was introduced in terms of weightpercentage, so that samples of Ti-6Al-4V (Ti64) contaminated with maraging steel (MS) were preparedin 0.5, 1, and 2.5 wt.% concentrations, labelled Ti64 + 0.5MS, Ti64 + 1MS, and Ti64 + 2.5MS, respectively.The opposite mix was also evaluated, where the maraging steel powder was contaminated with thesame amount in wt.% of Ti64 powder as mentioned above (namely MS + 0.5Ti64, MS + 1Ti64, MS +
2.5Ti64).A small amount of powder was sampled according to ASTM F3049-14 (standard B215) and
dispersed on an aluminum foil, to avoid further contaminations. The powder was then accuratelyspread with a spatula to prevent the superimposition of the powder particles, and it was attached on ascanning electron microscopy (SEM) stub using a graphite adhesive.
Scanning electron microscopy (SEM) observations were performed on a Zeiss Supra 40field-emission SEM (Carl Zeiss Microscopy GmbH, Jena, Germany) equipped with a Bruker Z200microanalysis (Bruker Nano GmbH, Berlin, Germany) for the energy-dispersive spectroscopy (EDS)inspections. Powders were accurately spread and attached on stubs for SEM; three stubs werecharacterized for each cross-contamination condition.
The chemical compositions of the pure and contaminated powders were checked by collectingthree EDS spectra of each stub (three for each cross-contamination sample) on areas at the same lowmagnification (200×), using 20 keV accelerating voltage. A total area of 9 mm × 9 mm (ca.) occupiedby powder coming from the same contaminated batch was investigated by quantitative EDS.
Further investigations were performed using the backscattered electrons signal and keeping theworking parameters fixed for all the samples: (i) 60 µm aperture, (ii) 500×magnification, (iii) 8.3 mmworking distance. Five micrographs for each stub were processed using the developed image analysismethod, and the respective EDS elemental maps were acquired and used to confirm the presence andlocation of the contaminants. This procedure allows the investigation of a total area of 1.5 mm × 1.5 mm(ca.) for each powder mixture.
Concerning the accelerating voltage, a range of observations was carried out in order get anoptimized balance between the EDS signal and the backscattered electrons contrast/brightness signalfor SEM imaging.
This approach is advisable because BSE contrast depends on the chemical composition of themixed materials and, for some combinations, the BSE signal could not generate a detectable contrast.
As can be seen in Figure 1, two powder mixtures (MS + 1T64 and Ti64 + 1MS) were taken as anexample of the overall situation, and micrographs were acquired using the same SEM parametersexcept for the beam accelerating voltage which was varied from 10 to 25 keV. It is worth mentioningthat no micrographs related to the 20 keV are shown, since during the contrast/brightness regulationthe saturation of the BSE signal was reached before a clear image could be acquired. Therefore, with thecurrent samples and the considered working parameters, the 20 keV which were used to acquire thechemical compositions were avoided during the rest of the measuring procedure. The most strikingdetail of Figure 1 is that while in the MS + 1Ti64 samples there is a clear contrast difference between theTi-based particles (darker) and the Fe-based ones (brighter), the same cannot be said for the oppositesamples (Ti64 + 1MS) at 10 keV. However, following the scanning electron microscopy theory [26],the BSE contrast should be enhanced by increasing accelerating voltage. This is confirmed by the15 keV and even more by the 25 keV micrographs (Figure 1), but in the latter case the information linkedto the particles’ morphology was lost and this lack of details makes the 25 keV condition unusable.Following this investigation, an accelerating voltage of 15 keV was selected for the observations of allthe cross-contamination samples.

Materials 2019, 12, 2342 4 of 11Materials 2019, 12, x FOR PEER REVIEW 4 of 11
Figure 1. Comparison of micrographs taken at different values of accelerating voltage, for two cross-contamination samples, MS + 1Ti64 (upper row) and Ti64 + 1MS (lower row).
Five micrographs were taken for each sample and then processed using the ImageJ software (version 1.51i, NIH, Bethesda, MD, USA) [27]; after the application of a fast Fourier transform (FFT) bandpass filter to binarize the micrographs, the “threshold” tool was used to isolate particles, whose details were then acquired using the “analyze particles” plugin. To easily spot the contaminants in the virgin feedstock, an EDS elemental map was acquired for each micrograph, and only the main element of the cross-contamination powder was mapped (Ti for Ti64 and Fe for MS). The full graphical procedure is reported in Figure 2.
Figure 2. A graphical explanation of the procedure applied to the considered micrographs in order to highlight the cross-contamination particles and to measure them. FFT: fast Fourier transform.
To quantify the cross-contamination in each sample, the percentage ratio between the area occupied by the contamination particles and the virgin powder particles was calculated and labelled as “area ratio”, using only the information of the SEM–EDS system.
In order to show typical failure due to cross-contamination, specimens were built by direct metal laser sintering (DMLS), a powder bed fusion (PBF) technique equipped with an Yb (ytterbium) fibre laser system (EOSINT-M270, Electro Optical Systems GmbH, Krailling, Germany). DMLS ran under
Figure 1. Comparison of micrographs taken at different values of accelerating voltage, for twocross-contamination samples, MS + 1Ti64 (upper row) and Ti64 + 1MS (lower row).
Five micrographs were taken for each sample and then processed using the ImageJ software(version 1.51i, NIH, Bethesda, MD, USA) [27]; after the application of a fast Fourier transform (FFT)bandpass filter to binarize the micrographs, the “threshold” tool was used to isolate particles, whosedetails were then acquired using the “analyze particles” plugin. To easily spot the contaminants inthe virgin feedstock, an EDS elemental map was acquired for each micrograph, and only the mainelement of the cross-contamination powder was mapped (Ti for Ti64 and Fe for MS). The full graphicalprocedure is reported in Figure 2.
Materials 2019, 12, x FOR PEER REVIEW 4 of 11
Figure 1. Comparison of micrographs taken at different values of accelerating voltage, for two cross-contamination samples, MS + 1Ti64 (upper row) and Ti64 + 1MS (lower row).
Five micrographs were taken for each sample and then processed using the ImageJ software (version 1.51i, NIH, Bethesda, MD, USA) [27]; after the application of a fast Fourier transform (FFT) bandpass filter to binarize the micrographs, the “threshold” tool was used to isolate particles, whose details were then acquired using the “analyze particles” plugin. To easily spot the contaminants in the virgin feedstock, an EDS elemental map was acquired for each micrograph, and only the main element of the cross-contamination powder was mapped (Ti for Ti64 and Fe for MS). The full graphical procedure is reported in Figure 2.
Figure 2. A graphical explanation of the procedure applied to the considered micrographs in order to highlight the cross-contamination particles and to measure them. FFT: fast Fourier transform.
To quantify the cross-contamination in each sample, the percentage ratio between the area occupied by the contamination particles and the virgin powder particles was calculated and labelled as “area ratio”, using only the information of the SEM–EDS system.
In order to show typical failure due to cross-contamination, specimens were built by direct metal laser sintering (DMLS), a powder bed fusion (PBF) technique equipped with an Yb (ytterbium) fibre laser system (EOSINT-M270, Electro Optical Systems GmbH, Krailling, Germany). DMLS ran under
Figure 2. A graphical explanation of the procedure applied to the considered micrographs in order tohighlight the cross-contamination particles and to measure them. FFT: fast Fourier transform.
To quantify the cross-contamination in each sample, the percentage ratio between the area occupiedby the contamination particles and the virgin powder particles was calculated and labelled as “arearatio”, using only the information of the SEM–EDS system.
In order to show typical failure due to cross-contamination, specimens were built by direct metallaser sintering (DMLS), a powder bed fusion (PBF) technique equipped with an Yb (ytterbium) fibrelaser system (EOSINT-M270, Electro Optical Systems GmbH, Krailling, Germany). DMLS ran under a
Materials 2019, 12, 2342 5 of 11
protective inert gas atmosphere (oxygen lower than 1.5%) and the sintering parameters were set asfollows: 200 W laser power, 0.2 mm diameter of the laser spot, 0.02 mm of layer thickness, scan speedup to 7 m/s, and building speed between 2 and 20 mm3/s. SEM observations and EDS analysis wereused to characterize the fracture area of the contaminated samples.
3. Results and Discussion
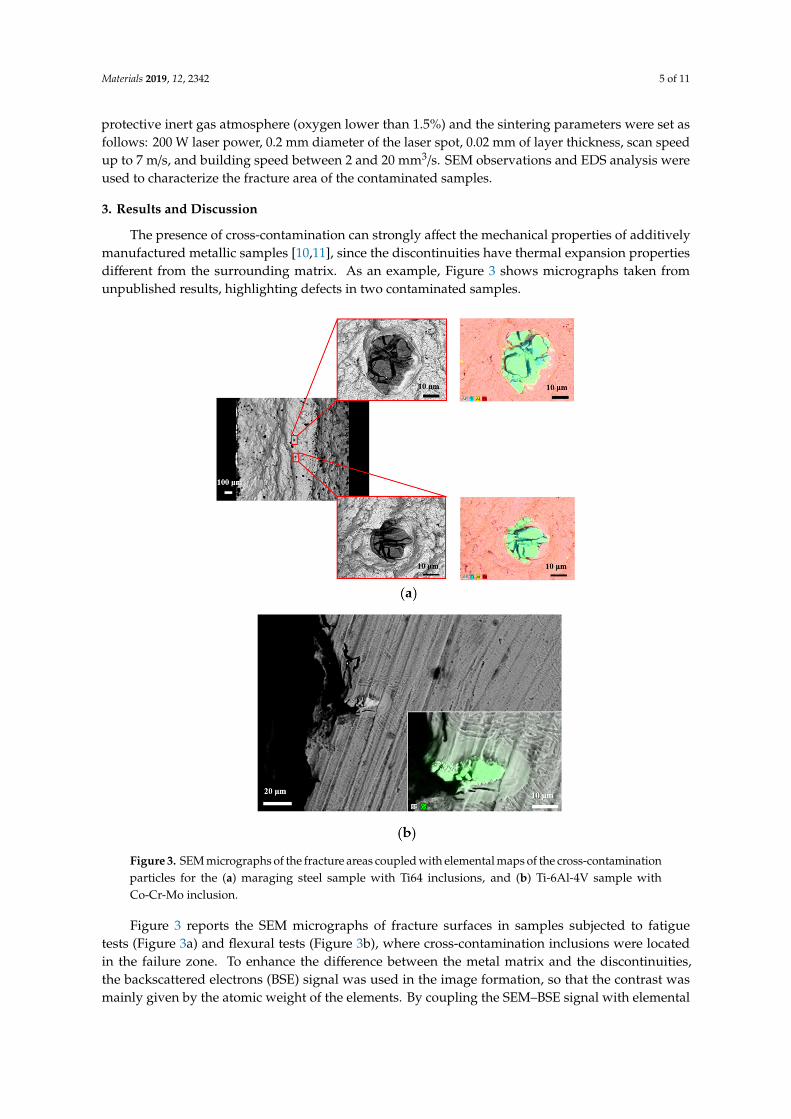
The presence of cross-contamination can strongly affect the mechanical properties of additivelymanufactured metallic samples [10,11], since the discontinuities have thermal expansion propertiesdifferent from the surrounding matrix. As an example, Figure 3 shows micrographs taken fromunpublished results, highlighting defects in two contaminated samples.
Materials 2019, 12, x FOR PEER REVIEW 5 of 11
a protective inert gas atmosphere (oxygen lower than 1.5%) and the sintering parameters were set as follows: 200 W laser power, 0.2 mm diameter of the laser spot, 0.02 mm of layer thickness, scan speed up to 7 m/s, and building speed between 2 and 20 mm3/s. SEM observations and EDS analysis were used to characterize the fracture area of the contaminated samples.
3. Results and Discussion
The presence of cross-contamination can strongly affect the mechanical properties of additively manufactured metallic samples [10,11], since the discontinuities have thermal expansion properties different from the surrounding matrix. As an example, Figure 3 shows micrographs taken from unpublished results, highlighting defects in two contaminated samples.
Figure 3. SEM micrographs of the fracture areas coupled with elemental maps of the cross-contamination particles for the (a) maraging steel sample with Ti64 inclusions, and (b) Ti-6Al-4V sample with Co-Cr-Mo inclusion.
Figure 3 reports the SEM micrographs of fracture surfaces in samples subjected to fatigue tests (Figure 3a) and flexural tests (Figure 3b), where cross-contamination inclusions were located in the failure zone. To enhance the difference between the metal matrix and the discontinuities, the backscattered electrons (BSE) signal was used in the image formation, so that the contrast was mainly given by the atomic weight of the elements. By coupling the SEM–BSE signal with elemental maps given by the energy dispersive spectroscopy (EDS) device, it was possible to fully characterize the contaminants.
Figure 3. SEM micrographs of the fracture areas coupled with elemental maps of the cross-contaminationparticles for the (a) maraging steel sample with Ti64 inclusions, and (b) Ti-6Al-4V sample withCo-Cr-Mo inclusion.
Figure 3 reports the SEM micrographs of fracture surfaces in samples subjected to fatiguetests (Figure 3a) and flexural tests (Figure 3b), where cross-contamination inclusions were locatedin the failure zone. To enhance the difference between the metal matrix and the discontinuities,the backscattered electrons (BSE) signal was used in the image formation, so that the contrast wasmainly given by the atomic weight of the elements. By coupling the SEM–BSE signal with elemental
Materials 2019, 12, 2342 6 of 11
maps given by the energy dispersive spectroscopy (EDS) device, it was possible to fully characterizethe contaminants.
In Figure 3a the inclusions had the typical compositions of another raw powder for additivemanufacturing (namely, Ti64), while the discontinuity in Figure 3b had the typical composition of theCo-Cr-Mo AM raw powder. It must be stressed that in Figure 3b the contaminant particle was totallymelted with the rest of the manufactured sample, and clearly acted as the crack’s generation site, beingthe weakest point of the part.
A crucial aspect that needs to be considered is the new perspective from where scientists andtechnicians need to look at failure analysis. Only by etching the Ti-6Al-4V alloy with the Keller’setchant (95 mL H2O, 2.5 mL HNO3, 1.5 mL HCl, 1.0 mL HF) was it possible to highlight the presenceof a cross-contamination element in the failure zone of Figure 3b, because the Co-Cr-Mo particle wasperfectly mixed with the Ti64 matrix. The values of liquidus temperature for the two powders arequite close, being 1395 ◦C for the Co-Cr-Mo alloy and 1660 ◦C for Ti-6Al-4V; therefore, since the PBFsystem’s parameters were optimized to successfully melt the Ti64 particles, the first temperature wassurely exceeded during the powder bed fusion process.
Figure 3 suggests that two types of cross-contamination can be classified in metal additivemanufacturing. The first one can be named solidus–liquids and corresponds to the situation highlightedin Figure 3a, where the contaminant particles have a liquidus temperature higher than the metal matrixand therefore act as brittle unmelted discontinuities, such as those observed by Brandão et al. [10] andGatto et al. [11]. The second type of cross-contamination can be named liquidus–liquidus, and matchesthe situation shown in Figure 3b, where the metal matrix and the contaminants were fused togetherbecause during the additive manufacturing process, the action of the high-energy beam raised thetemperature above the liquidus level of the two alloys.
Both inclusions highlighted in Figure 3 show dimensions comparable with a single powderparticle [28,29], suggesting the high degree of dependence between failure and the presence of suchan impurity.
The compositions of all the powder samples were obtained by collecting EDS data from largeareas (200× magnification) to get wt.% values representing the average situation in the sample.Deconvolution was used to resolve elements’ peaks overlap, and quantitative analysis was performedby the EDS software (ZAF correction [26]). Table 1 shows the results for the MS-based samples, wherethe wt.% of Ti and Al detected in contaminated samples were considerably higher than the nominalvalues. Moreover, these values increased as the wt.% of cross-contamination increased, showing astrong connection between the two, although not a direct proportionality.
Table 1. Comparison of wt.% concentrations (mean values and standard deviations) of major maragingsteel (MS) elements (Ni, Co, Mo) and contaminants (Ti, Al).
Powders Ni Co Mo Ti Al
MS (nominal) 17–19 8.5–9.5 4.5–5.2 0.6–0.8 0.05–0.15MS pure 16.0 ± 0.3 10.7 ± 0.1 3.7 ± 0.2 0.9 ± 0.1 0.02 ± 0.01
MS + 0.5Ti64 15.4 ± 0.3 10.8 ± 0.1 3.5 ± 0.2 1.5 ± 0.2 0.05 ± 0.01MS + 1Ti64 16.1 ± 0.2 10.4 ± 0.1 4.7 ± 0.5 4.0 ± 0.1 0.6 ± 0.3
MS + 2.5Ti64 15.6 ± 0.1 11.2 ± 0.1 4.9 ± 0.2 6 ± 1 0.7 ± 0.2
The cobalt concentration was higher than the nominal value owing to the Fe secondary fluorescencelinked to the proximity of their characteristic energy values, the Fe Kβ peak being at 7.06 keV while theCo Kα peak is at 6.92 keV.
Weight percentages of the main elements in Ti64 samples are reported in Table 2 and comparedwith the nominal composition.

Materials 2019, 12, 2342 7 of 11
Table 2. Comparison of wt.% concentrations (mean values and standard deviations) of major Ti64 (Ti,Al) and contaminant (Fe) elements.
Powders Al V Fe
Ti64 (nominal) 5.50–6.75 3.5–4.5 <0.30Ti64 pure 5.9 ± 0.2 2.72 ± 0.03 ND 1
Ti64 + 0.5MS 5.4 ± 0.1 3.0 ± 0.1 ND 1
Ti64 + 1MS 5.9 ± 0.1 2.6 ± 0.1 0.8 ± 0.1Ti64 + 2.5MS 5.3 ± 0.4 3.4 ± 0.1 1.3 ± 0.1
1 Not detectable.
Although the increment of iron content was consistent with the contamination introduced inthe samples, the values obtained by collecting the signal from large areas were always lower thanreal contamination values (Table 2). The use of quantitative EDS analysis on large areas showed thatcross-contamination could be highlighted quite reliably. This was also confirmed for the maraging steelsamples, despite the remarkable amount of titanium which present in the nominal composition of thealloy. Note that for the sake of simplicity, only the main alloy elements are reported in Tables 1 and 2.
Figure 4 shows typical SEM–BSE micrographs of the MS-based samples with different amounts ofTi64 cross-contamination, together with the respective EDS elemental maps (only Ti was mapped forthe sake of simplicity), while representative micrographs and EDS maps of the Ti64-based samples arereported in Figure 5.
Materials 2019, 12, x FOR PEER REVIEW 7 of 11
Ti64 + 0.5MS 5.4 ± 0.1 3.0 ± 0.1 ND 1
Ti64 + 1MS 5.9 ± 0.1 2.6 ± 0.1 0.8 ± 0.1 Ti64 + 2.5MS 5.3 ± 0.4 3.4 ± 0.1 1.3 ± 0.1
1 Not detectable.
Although the increment of iron content was consistent with the contamination introduced in the samples, the values obtained by collecting the signal from large areas were always lower than real contamination values (Table 2). The use of quantitative EDS analysis on large areas showed that cross-contamination could be highlighted quite reliably. This was also confirmed for the maraging steel samples, despite the remarkable amount of titanium which present in the nominal composition of the alloy. Note that for the sake of simplicity, only the main alloy elements are reported in Tables 1 and 2.
Figure 4 shows typical SEM–BSE micrographs of the MS-based samples with different amounts of Ti64 cross-contamination, together with the respective EDS elemental maps (only Ti was mapped for the sake of simplicity), while representative micrographs and EDS maps of the Ti64-based samples are reported in Figure 5.
Figure 4. SEM–BSE micrographs of the MS-based cross-contamination samples: (a) MS + 0.5Ti64, (b) MS + 1Ti64, (c) MS + 2.5Ti64, and the respective energy-dispersive spectroscopy (EDS) elemental maps: (d) MS + 0.5Ti64, (e) MS + 1Ti64, (f) MS + 2.5Ti64. Blue particles correspond to Ti64.
Figure 4. SEM–BSE micrographs of the MS-based cross-contamination samples: (a) MS + 0.5Ti64,(b) MS + 1Ti64, (c) MS + 2.5Ti64, and the respective energy-dispersive spectroscopy (EDS) elementalmaps: (d) MS + 0.5Ti64, (e) MS + 1Ti64, (f) MS + 2.5Ti64. Blue particles correspond to Ti64.
Materials 2019, 12, 2342 8 of 11Materials 2019, 12, x FOR PEER REVIEW 8 of 11
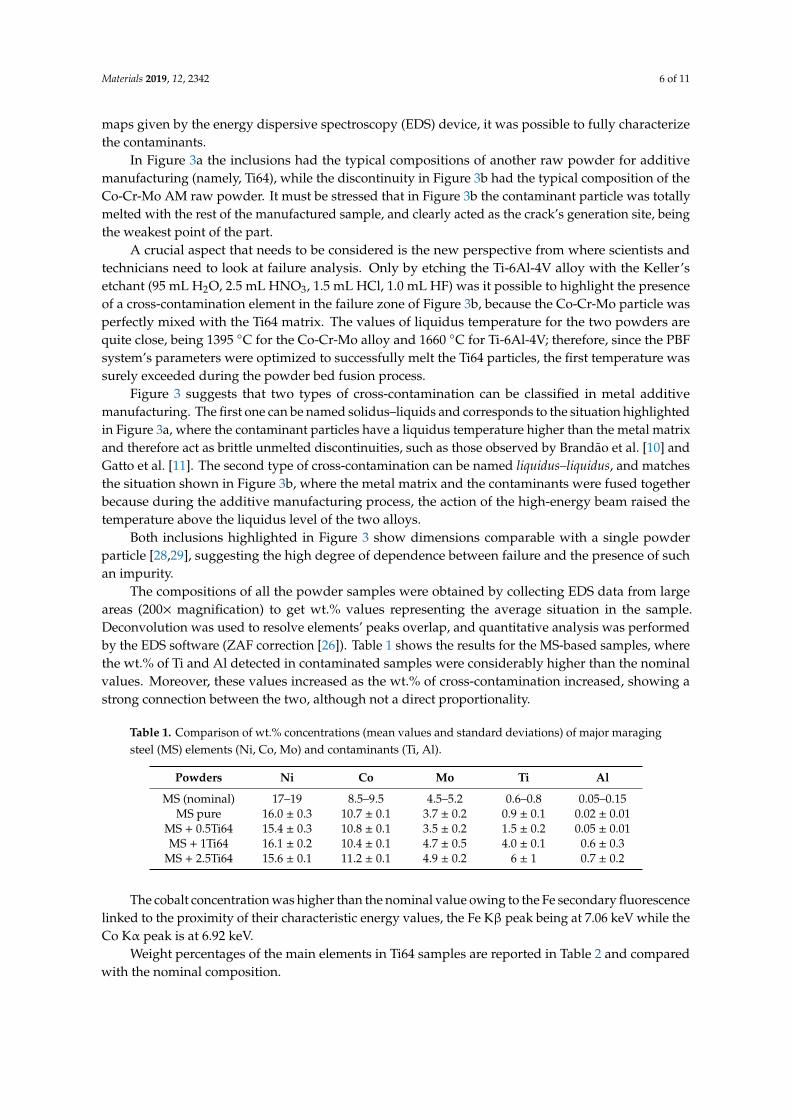
Figure 5. SEM–BSE micrographs of the Ti-based cross-contamination samples: (a) Ti64 + 0.5MS, (b) Ti64 + 1MS, (c) Ti64 + 2.5MS, and the respective EDS elemental maps: (d) Ti64 + 0.5MS, (e) Ti64 + 1MS, (f) Ti64 + 2.5MS. Red particles correspond to maraging steel.
Note that in Figures 4 and 5, despite the same amount of cross-contamination introduced in terms of weight percentage, the number of particles revealed by the EDS elemental maps in MS-based and Ti64-based samples were extremely different (much higher in the former condition). Figures 4 and 5 suggest that density is the key to successfully detecting cross-contamination in metal powder feedstock for powder bed fusion. Indeed, despite the same amount of cross-contamination introduced in terms of weight percentage, the number of particles revealed by the EDS elemental maps in MS-based and Ti64-based samples were extremely different: This was due to the densities of the two powders: ρMS = 8.0–8.1 g/cm3 and ρTi64 = 4.41 g/cm3. Therefore, to reach the same weight percentage of cross-contamination, a larger number of Ti64 particles is necessary [30].
By applying the procedure shown in the experimental section, a comparative evaluation of the percentage ratio of the area occupied by the virgin and cross-contamination particles (namely, the “area ratio”) was calculated for all the samples, and the results are shown in Table 3.
Table 3. Mean values and standard deviations of the calculated area ratio for all the samples.
Sample Name Area Ratio (%) MS + 0.5Ti64 2.0 ± 0.2 MS + 1Ti64 3.6 ± 0.3
MS + 2.5Ti64 9.7 ± 0.6 Ti64 + 0.5MS 1.1 ± 0.4 Ti64 + 1MS 2.0 ± 0.2
Ti64 + 2.5MS 5.2 ± 0.2
The numerical values of the calculated area ratios in Table 3 show a direct proportionality with the amounts of introduced cross-contamination and, despite being extremely phenomenological, these area ratio values confirm the information arising from Figures 4 and 5—that is, in order to reach the same amount of cross-contamination, a larger area should be occupied by the lightest contaminant powder. Moreover, the experimental results highlight that a comparative analysis of powder samples based on the combination of SEM–BSE micrographs and EDS elemental analysis is not only feasible, but was also characterized by an overall good level of reliability.
Figure 5. SEM–BSE micrographs of the Ti-based cross-contamination samples: (a) Ti64 + 0.5MS, (b)Ti64 + 1MS, (c) Ti64 + 2.5MS, and the respective EDS elemental maps: (d) Ti64 + 0.5MS, (e) Ti64 + 1MS,(f) Ti64 + 2.5MS. Red particles correspond to maraging steel.
Note that in Figures 4 and 5, despite the same amount of cross-contamination introduced in termsof weight percentage, the number of particles revealed by the EDS elemental maps in MS-based andTi64-based samples were extremely different (much higher in the former condition). Figures 4 and 5suggest that density is the key to successfully detecting cross-contamination in metal powder feedstockfor powder bed fusion. Indeed, despite the same amount of cross-contamination introduced in termsof weight percentage, the number of particles revealed by the EDS elemental maps in MS-basedand Ti64-based samples were extremely different: This was due to the densities of the two powders:ρMS = 8.0–8.1 g/cm3 and ρTi64 = 4.41 g/cm3. Therefore, to reach the same weight percentage ofcross-contamination, a larger number of Ti64 particles is necessary [30].
By applying the procedure shown in the experimental section, a comparative evaluation of thepercentage ratio of the area occupied by the virgin and cross-contamination particles (namely, the “arearatio”) was calculated for all the samples, and the results are shown in Table 3.
Table 3. Mean values and standard deviations of the calculated area ratio for all the samples.
Sample Name Area Ratio (%)
MS + 0.5Ti64 2.0 ± 0.2MS + 1Ti64 3.6 ± 0.3
MS + 2.5Ti64 9.7 ± 0.6Ti64 + 0.5MS 1.1 ± 0.4Ti64 + 1MS 2.0 ± 0.2
Ti64 + 2.5MS 5.2 ± 0.2
The numerical values of the calculated area ratios in Table 3 show a direct proportionality withthe amounts of introduced cross-contamination and, despite being extremely phenomenological, thesearea ratio values confirm the information arising from Figures 4 and 5—that is, in order to reach thesame amount of cross-contamination, a larger area should be occupied by the lightest contaminantpowder. Moreover, the experimental results highlight that a comparative analysis of powder samplesbased on the combination of SEM–BSE micrographs and EDS elemental analysis is not only feasible,but was also characterized by an overall good level of reliability.
Materials 2019, 12, 2342 9 of 11
Following the detrimental effect of cross-contamination in powders for additive manufacturingreported in the literature [10,11] and the micrographs in Figure 3, a further study focusing on thedetermination of the link between the amount of cross-contamination in the powder feedstock and themechanical properties of the additively manufactured parts is currently ongoing.
4. Conclusions
The presence of contaminants in metal powders for laser powder bed fusion is a technologicalchallenge which is still limiting the use of this additive manufacturing technique. The present papershows different possible effects of the presence of cross-contaminations in metal powder feedstock.Moreover, to verify and quantify the contamination, a combination of SEM–BSE observations, EDSanalysis, and a subsequent image analysis procedure was used.
The main conclusions can be listed as follows:
• Two cross-contamination phenomena linked with the nature of the contaminant were observedand labelled, suggesting new perspectives for failure analysis procedures;
• By collecting EDS spectra on large areas of intentionally contaminated powder samples andcomparing the elemental quantification with the nominal and pure powder compositions, thepresence of the cross-contamination was detected;
• A fine tuning of SEM parameters allows optimization of the contrast information of the BSEmicrographs and aids in obtaining reliable results with the EDS elemental mapping;
• When cross-contamination must be detected and measured, the density of the contaminant is themost relevant physical property;
• The use of the calculated area ratio between virgin powder particles and contaminants allowednumerical estimation of the cross-contamination. The experimental results showed a goodagreement with the ratio of introduced cross-contamination amounts.
The results suggest the need to diversify material requirement in order to establish potentialcross-contamination tolerance limits according to the targeted application. Because it is based onalready well-established characterization techniques and reliable software, the implementation of thesuggested image-based procedure in a machine learning environment could be the first step towardsthe next generation of quality standards of AM metal powder feedstock for high-end applications.
Author Contributions: Methodology, validation, and investigation E.S., P.M., and G.B.; conceptualization, A.G.,E.B., and S.D.; writing—original draft preparation, E.S. and P.M.; writing—review and editing, G.B., A.G., E.B.,and S.D.
Funding: This project has received funding from the European Union’s Horizon 2020 research and innovationprogramme under grant agreement No 723699. This publication reflects only the authors’ view and the Commissionis not responsible for any use that may be made of the information it contains.
Conflicts of Interest: The authors declare no conflict of interest.
References
1. Sun, S.; Brandt, M.; Easton, M. Laser Additive Manufacturing Materials, Design, Technologies, and Applications,1st ed.; Woodhead Publishing: Sawston, UK, 2017.
2. Seifi, M.; Salem, A.; Beuth, J.; Harrysson, O.; Lewandowski, J.J. Overview of Materials Qualification Needsfor Metal Additive Manufacturing. JOM 2016, 68, 747–764. [CrossRef]
3. Singh, S.; Ramakrishna, S.; Singh, R. Materials issues in additive manufacturing: A review. J. Manuf. Process.2017, 25, 185–200. [CrossRef]
4. Slotwinski, J.A.; Garboczi, E.J.; Stutzman, P.E.; Ferraris, C.F.; Watson, S.S.; Peltz, M.A. Characterization ofMetal Powders Used for Additive Manufacturing. J. Res. Natl. Inst. Stand Technol. 2014, 119, 460–493.[CrossRef] [PubMed]
5. Qian, M. Metal powder for additive manufacturing. JOM 2015, 67, 536–537. [CrossRef]

Materials 2019, 12, 2342 10 of 11
6. Slotwinski, J.A.; Garboczi, E.J. Metrology needs for metal additive manufacturing powders. JOM 2015, 67,538–543. [CrossRef]
7. Denti, L.; Sola, A.; Defanti, S.; Sciancalepore, C.; Bondioli, F. Effect of powder recycling in laser-based powderbed fusion of Ti-6Al-4V. Manuf. Technol. 2019, 19, 190–196. [CrossRef]
8. Hedberg, Y.; Norell, M.; Linhardt, P.; Bergqvist, H.; Odnevall Wallinder, I. Influence of surface oxidecharacteristics and speciation on corrosion, electrochemical properties and metal release of atomized 316Lstainless steel powders. Int. J. Electrochem. Sci. 2012, 7, 11655–11677.
9. Simchi, A. The role of particle size on the laser sintering of iron powder. Met. Mater. Trans. B 2004, 35,937–948. [CrossRef]
10. Brandão, A.D.; Gerard, R.; Gumpinger, J.; Beretta, S.; Makaya, A.; Pambaguian, L.; Ghidini, T. Challenges inAdditive Manufacturing of Space Parts: Powder Feedstock Cross-Contamination and Its Impact on EndProducts. Materials 2017, 10, 522. [CrossRef]
11. Gatto, A.; Bassoli, E.; Denti, L. Repercussions of powder contamination on the fatigue life of additivemanufactured maraging steel. Addit. Manuf. 2018, 24, 13–19. [CrossRef]
12. Frazier, W.E. Metal Additive Manufacturing: A Review. J. Mater. Eng. Perform. 2014, 23, 1917–1928.[CrossRef]
13. Sutton, A.T.; Kriewall, C.S.; Leu, M.C.; Newkirk, J.W. Powder characterisation techniques and effects ofpowder characteristics on part properties in powder-bed fusion processes. Virtual Phys. Prototyp. 2017, 12,3–29. [CrossRef]
14. Strondl, A.; Lyckfeldt, O.; Brodin, H.; Ackelid, U. Characterization and Control of Powder Properties forAdditive Manufacturing. JOM 2015, 67, 549–554. [CrossRef]
15. Tofail, S.A.M.; Koumoulos, E.P.; Bandyopadhyay, A.; Bose, S.; O’Donoghue, L.; Charitidis, C. Additivemanufacturing: Scientific and technological challenges, market uptake and opportunities. Mater. Today 2018,21, 22–37. [CrossRef]
16. Sutton, A.T.; Kriewall, C.S.; Leu, M.C.; Newkirk, J.W. Powders for additive manufacturing processes:Characterization techniques and effects on part properties. In Solid Freeform Fabrication 2016, Proceedingsof the 26th Annual International Solid Freeform Fabrication Symposium, Austin, TX, USA, 10–12 August 2015;University of Texas at Austin: Austin, TX, USA, 2015.
17. Bernier, F.; Tahara, R.; Gendron, M. Additive manufacturing powder feedstock characterization using X-raytomography. Met. Powder Rep. 2018, 73, 158–162. [CrossRef]
18. Montazeri, M.; Yavari, R.; Rao, P.; Boulware, P. In-process monitoring of material cross-contamination defectsin laser powder bed fusion. J. Manuf. Sci. Eng. 2018, 140, 111001. [CrossRef]
19. Kennedy, S.; Dalley, A.M.; Kotyk, G.J. Additive manufacturing: Assessing metal powder quality throughcharacterizing feedstock and contaminants. J. Mater. Eng. Perform. 2019, 28, 728–740. [CrossRef]
20. Murphy, T.F.; Schade, C.T.; Zwiren, A. Using automated image analysis for characterization of additivemanufacturing powders. Int. J. Powder Met. 2018, 54, 47–59.
21. Gasper, A.N.D.; Hickman, D.; Ashcroft, I.; Sharma, S.; Wang, X.; Szost, B.; Johns, D.; Clare, A.T. Oxide andspatter powder formation during laser powder bed fusion of Hastelloy X. Powder Technol. 2019, 354, 333–337.[CrossRef]
22. Ali, U.; Esmaeilizadeh, R.; Ahmed, F.; Sarker, D.; Muhammad, W.; Keshavarzkermani, A.; Mahmoodkhani, Y.;Marzbanrad, E.; Toyserkani, E. Identification and characterization of spatter particles and their effect onsurface roughness, density and mechanical response of 17-4 PH stainless steel laser powder-bed fusion parts.Mater. Sci. Eng. A 2019, 756, 98–107. [CrossRef]
23. Esmaeilizadeh, R.; Ali, U.; Keshavarzkermani, A.; Mahmoodkhani, Y.; Marzbanrad, E.; Toyserkani, E. On theeffect of spatter particles distribution on the quality of Hastelloy X parts made by laser powder-bed fusionadditive manufacturing. J. Manuf. Process 2019, 37, 11–20. [CrossRef]
24. Material Data Sheet for EOS MS1 for EOSINT M270. Available online: https://www.eos.info/eos_binaries0/eos/04f875d5141d28f7/8ecee6ee388d/MS-MS1-M270-M280_200W_Material_data_sheet_05-14_en.pdf (accessedon 10 February 2019).
25. Material Data Sheet for EOS Ti64 for EOSINT M290. Available online: https://www.eos.info/eos_binaries0/eos/a4eeb73865d54434/5926811b3739/Ti-Ti64_9011-0014_9011-0039_M290_Material_data_sheet_11-17_en.pdf(accessed on 11 February 2019).
Materials 2019, 12, 2342 11 of 11
26. Goldstein, J.I.; Newbury, D.E.; Joy, D.C.; Lyman, C.E.; Echlin, P.; Lifshin, E.; Sawyer, L.; Michael, J.R. ScanningElectron Microscopy and X-Ray Microanalysis, 3rd ed.; Springer: Berlin/Heidelberg, Germany, 2003.
27. Rasband, W.S. Image J; National Institutes of Health: Bethesda, MD, USA, 2016. Available online: http://imagej.nih.gov/ij/ (accessed on 1 March 2019).
28. Mengucci, P.; Gatto, A.; Bassoli, E.; Denti, L.; Fiori, F.; Girardin, E.; Bastianoni, P.; Rutkowski, B.;Czyrska-Filemonowicz, A.; Barucca, G. Effects of build orientation and element partitioning on microstructureand mechanical properties of biomedical Ti-6Al-4V alloy produced by laser sintering. J. Mech. Behav. Biomed.Mater. 2017, 71, 1–9. [CrossRef] [PubMed]
29. Barucca, G.; Santecchia, E.; Majni, G.; Girardin, E.; Bassoli, E.; Denti, L.; Gatto, A.; Iuliano, L.; Moskalewicz, T.;Mengucci, P. Structural characterization of biomedical Co–Cr–Mo components produced by direct metallaser sintering. Mater. Sci. Eng. C 2015, 48, 263–269. [CrossRef] [PubMed]
30. Santecchia, E.; Mengucci, P.; Gatto, A.; Bassoli, E.; Denti, L.; Bondioli, F.; Barucca, G. Development of a reliablemethod for contamination detection in raw metal powders for additive manufacturing. In Proceedings ofthe EuroPM18, Bilbao, Spain, 14–18 October 2018; EPMA: Shrewsbury, UK, 2018.
© 2019 by the authors. Licensee MDPI, Basel, Switzerland. This article is an open accessarticle distributed under the terms and conditions of the Creative Commons Attribution(CC BY) license (http://creativecommons.org/licenses/by/4.0/).