addendum to environmental and social impact … responsibility/csr/documents/add… · tebodin...
TRANSCRIPT
Tebodin
Tebodin Middle East Ltd. Tebodin Middle East Ltd.
Ahmed Ghanem Mazroui Building Al Faseela Plaza 1272
Hamdan Street Majlis Altawon Highway
Tourist Club Area Al Nuwaidrath 646
P.O. Box 2652 P.O. Box 2822
Abu Dhabi Manama
United Arab Emirates Kingdom of Bahrain
Author: M. van der Vorst
- Telephone: +971 2 406 6276
- E-mail: [email protected]
October 28, 2014
Order number: 10921.00
Document number: 3311003
Revision: E
Addendum to Environmental and Social Impact Assessment Report
Client: Bechtel
Project: Alba Potline (6) and Power Plant (PS 5) Expansion

This page is intentionally blank.

Tebodin Middle East Ltd.
Addendum to Environmental and Social Impact Assessment Report
Order number: 10921.00
Document number: 3311003
Revision: E
October 28, 2014
Page 4 / 63
This page is intentionally blank.
Tebodin Middle East Ltd.
Addendum to Environmental and Social Impact Assessment Report
Order number: 10921.00
Document number: 3311003
Revision: E
October 28, 2014
Page 5 / 63
Table of contents
List of Figures 7
List of Tables 7
Abbreviations and Units 8
1 Executive Summary 10
2 Introduction 13
2.1 Addendum Scope 13
2.2 Previous Environmental Studies 15
3 Project Description - Project Changes 17
3.1 Construction Phase 17
3.2 Operation Phase 17
3.2.1 Black Start 18
3.2.2 Power Station Shut-down 19
3.2.3 Maintenance 19
3.2.4 Sewage treatment plant (STP) 19
3.3 Overall Project Schedule 20
4 Environmental Impacts 23
4.1 Introduction and Overview 23
4.2 Air Quality 23
4.2.1 Construction Phase 23
4.2.2 Operation Phase - Sewage Treatment Plant 24
4.2.3 Operation phase - Emissions after expansion with third power unit at PS5 24
4.2.3.1 Emission Inventory Option A - Emissions of Criteria Pollutants (SO2, NOx, HF and PM10) 26
4.2.3.2 Predicted Ambient Air Pollutant Concentrations 28
4.2.3.3 Concentrations at Sensitive Receptors 30
4.2.3.4 SO2 Concentrations 33
4.2.3.5 NO2 Concentrations 34
4.2.3.6 Impact on nearby industrial facilities 35
4.2.3.7 Compliance with the 2030 National Land Use Strategy 35
4.3 Water 37
4.3.1 Construction Phase 37
4.3.2 Operation Phase 37
4.4 Soil and Groundwater 37
4.4.1 Construction Phase 37
4.4.2 Operation Phase 38
4.5 Ecology 38
4.6 Energy Use 38
4.6.1 Construction Phase 38
4.6.2 Operation Phase 39
4.7 Waste Management 40
4.7.1 Construction Phase 40
4.7.2 Operation Phase 41
4.8 Traffic 43
4.8.1 Construction Phase 43
4.8.2 Operation Phase 43
4.9 Visual 43
4.10 Noise 44
4.10.1 Construction Phase 44
4.10.2 Operation Phase 44
4.10.2.1 Noise Modelling 44
4.10.2.2 Noise Emission Inventory 44
4.10.2.3 Noise Modelling Results – Operation phase 44
Tebodin Middle East Ltd.
Addendum to Environmental and Social Impact Assessment Report
Order number: 10921.00
Document number: 3311003
Revision: E
October 28, 2014
Page 6 / 63
4.11 Occupational Health and Safety 49
4.12 Cultural Heritage 49
4.13 Social and Economic Environment 49
4.14 Summary of Impact Changes 50
4.15 Summary of Impact Findings 51
5 Alternatives 57
6 Conclusions 59
References 61
List of Appendices 63
Tebodin Middle East Ltd.
Addendum to Environmental and Social Impact Assessment Report
Order number: 10921.00
Document number: 3311003
Revision: E
October 28, 2014
Page 7 / 63
List of Figures
Figure 1: Design Changes in Power Station 5 ........................................................................................... 14
Figure 2: Sensitive Receptors .................................................................................................................... 30
Figure 3: Overview of Noise Contributions from Alba operations to the surroundings ............................. 47
Figure 4: Predicted Noise Levels close to Alba’s Fence line ..................................................................... 48
List of Tables
Table 1: Design Changes ........................................................................................................................... 17
Table 2: Key Project Milestones ................................................................................................................. 21
Table 3: Overview of Threats to Air Quality and Protective Measures in Operational Phase ................... 24
Table 4: Applied Emission Factors for Power Stations .............................................................................. 26
Table 5: Major Emissions to Air – Criteria Pollutants ................................................................................. 27
Table 6: Air Quality Assessment Summary Results – Maximum Predicted Concentrations .................... 29
Table 7: Air Quality Assessment Summary Results – Number of Exceedances ...................................... 29
Table 8: Maximum Ground Level Concentrations at Sensitive Receptors ................................................ 31
Table 9: Predicted Total Correlated Concentrations at Sensitive Receptors ............................................ 33
Table 10: Total and specific annual electricity consumption ..................................................................... 39
Table 11: Gas Consumption ....................................................................................................................... 40
Table 12: Wastes from Power Stations (tpy) .............................................................................................. 41
Table 13: Dross ........................................................................................................................................... 42
Table 14: Alba operating noise levels at Alba fence lines ......................................................................... 45
Table 15: Summary of Impacts related to additional Power Station .......................................................... 50
Table 16: Impact Rating Categories ........................................................................................................... 51
Table 17: Summary of the potential impacts .............................................................................................. 52
Tebodin Middle East Ltd.
Addendum to Environmental and Social Impact Assessment Report
Order number: 10921.00
Document number: 3311003
Revision: E
October 28, 2014
Page 8 / 63
Abbreviations and Units
Abbreviations
Alba Aluminium Bahrain
CTG Combustion Turbine Generator
DLN Dry Low NOx
EIA Environmental Impact Assessment
EPC Engineering Procurement and Construction
ESIA Environmental and Social Impact Assessment
EWA Electricity and Water Authority
FHM First Hot Metal
GDP Gross Domestic Product
GLCs Ground Level Concentrations
GT Gas Turbine
H2S Hydrogen Sulphide
HF Hydrogen Fluoride (Gaseous Fluoride)
HGP Hot Gas Path
LHM Last Hot Metal
MI Major Inspection
NFPA National Fire Protection Association
NO2 Nitrogen Dioxide
NOx Nitrogen Oxides
OHS Occupational Health and Safety
PM10 Particulate Matter with a diameter smaller than 10 µg
SCE Supreme Council for Environment
SO2 Sulphur Dioxide
STP Sewage Treatment Plant
TME Tebodin Middle East Ltd.
US United States
VDC Vertical Direct Chill
VOC Volatile Organic Carbons
Tebodin Middle East Ltd.
Addendum to Environmental and Social Impact Assessment Report
Order number: 10921.00
Document number: 3311003
Revision: E
October 28, 2014
Page 9 / 63
Units
% Per cent
dB(A) A-weighted Decibel
km2
Square Kilometre
kWh/kg Kilowatt-hour per kilogram
m3
Cubic Metre
MW Mega-Watt
tpy Tonnes per Year
MMSCF/D Million Standard Cubic Feet per Day
SCF/Ton Standard Cubic Foot Per Ton
kg/tAl Kilogram per tonne Aluminium
mg/Nm3
Milligram per Normal Cubic Metre
Tebodin Middle East Ltd.
Addendum to Environmental and Social Impact Assessment Report
Order number: 10921.00
Document number: 3311003
Revision: E
October 28, 2014
Page 10 / 63
1 Executive Summary
Aluminium Bahrain (Alba) commenced its operations in 1971 and has operated with increasing success and growing
production over 30 years. Alba is planning a further expansion from its current level of production of approximately
884,000 tonnes per annum of Primary Aluminium to a nominal production capacity of 1,446,321 tonnes of aluminium
per annum via an additional Potline and Power Station (the Line 6 (L6) & Power Station 5 (PS5) Project).
Tebodin was commissioned to undertake an Environmental and Social Impact Assessment (ESIA) of the Proposed
Line 6 Expansion Plan in accordance with Ministerial Order number 1 of 1998, to determine whether this project
should be allowed to proceed from an Environmental and Social perspective. An ESIA report was submitted to the
authorities in June 2014.
However after submittal of the ESIA report, design changes were made for the power station configuration. Tebodin
prepared this addendum to inform SCE on these changes and to assess the change in impacts on the environment.
The initial design of PS5, for which the ESIA was prepared, comprised two (2) F class units. In the current design
change, an extra F class unit is added to the power station. Furthermore, the existing PS-2 will be shut-down and
150MW additional power will no longer be sourced from the Electricity and Water Authority (EWA) grid.
Based on this ESIA addendum it can be concluded that majority of the environmental impacts by adding the third F
class power generation unit are identical compared with previous ESIA study. Some impacts have been slightly
reduced (air quality during operational phase, no use of groundwater), and some impacts have slightly increased
(traffic during construction phase, construction waste, noise during operational phase).
Based on a detailed study of both Alba’s existing and planned operations, as well as an impact analysis and
comparison with national and international standards and policies, Tebodin’s findings and recommendations are set
out in this report and can be summarized as follows:
1. The envisaged expansion meets all current environmental legislative requirements in Bahrain and will utilise
what can be regarded as Best Available Technologies.
2. Tebodin is accordingly of the opinion that, subject to the qualifications set out in clause 4 below, the plan for the
Line 6 (L6) & Power Station 5 (PS5) Project is acceptable with respect to the environmental standards and that
unacceptable environmental impacts are not expected related to this expansion. We accordingly recommend
that the Project receive Environmental Approval from the concerned authorities.
3. Having analysed both the positive and negative impacts of the project, Tebodin is of the opinion that adverse
environmental impacts that we believe could arise from the project can be mitigated satisfactorily, subject to the
implementation of the recommended mitigation measures listed below explained in more detail in this report:
a. Stricter operating practices would be implemented in line with those considered for Potline 6 to reduce
the SO2 and HF emissions for Potline 4 and Potline 5.
b. Alba proceeds to retire Power Stations 1 and 2;
Tebodin Middle East Ltd.
Addendum to Environmental and Social Impact Assessment Report
Order number: 10921.00
Document number: 3311003
Revision: E
October 28, 2014
Page 11 / 63
c. Alba’s environmental monitoring protocol should be expanded to include the monitoring
recommendations brought forward in the ESIA report;
d. The environmental management control in Alba’s ISO 14001 certified management system be extended
to the Potline 6 expansion;
e. Efforts to reduce waste and wastewater taking into account the recommendations described in this
ESIA, e.g. regarding Spent Pot Lining wastes and sulphur waste reduction should be continued;
f. Alba should actively consider the other minor suggestions and recommendations in this report and
implement them to the extent that they are relevant, feasible and practicable.
g. Alba, together with land developers will investigate a revised location of its waste water outfall to sea
ensuring proper mixing, taking into account Bahrain’s Master Plan 2030.
It is noted that Alba is ISO 14001 certified, and is continuously improving its environmental performance. A concrete
example is that environmental improvement is one of the 5 Key parameters chosen as part of Alba’s 5 year Strategic
Plan, and involves commitment to reduce unrecycled waste by 25% in the following 5 years, notwithstanding the
growth in production and activity from the expansions.
It is also evident that the proposed expansion project will have a number of positive impacts. For example, it is clear
that there will be positive socio-economic impacts. A number of positive environmental impacts are also likely; key
amongst is the eventual retirement of the old Power Stations 1 and 2 and its replacement by a new more energy
efficient power station with low NOX emissions.
Tebodin also believes, given Alba’s continuing commitment to their environmental performance, that the
environmental impacts associated with the expansion can be effectively managed and minimised.

Tebodin Middle East Ltd.
Addendum to Environmental and Social Impact Assessment Report
Order number: 10921.00
Document number: 3311003
Revision: E
October 28, 2014
Page 12 / 63
This page is intentionally blank.
Tebodin Middle East Ltd.
Addendum to Environmental and Social Impact Assessment Report
Order number: 10921.00
Document number: 3311003
Revision: E
October 28, 2014
Page 13 / 63
2 Introduction
This addendum has been prepared to inform the Supreme Council for Environment (SCE) on the design changes
related to Aluminium Bahrain (Alba)’s Potline (L6) and Power Plant (PS 5) expansion project.
Alba, located in the Kingdom of Bahrain, commenced its operations in 1971 with an annual capacity of 120,000
tonnes per year (tpy). Over the years additional production facilities were added. The current Alba smelter consists
of five (5) Potlines supplied with electrical power by four (4) on-site power stations. Alba’s total production was
912,700 tpy in 2013. Alba‘s total annual production would be a nominal 924,654 tpy at the crept, future increased
production, for Potline 1 through 5. The smelter would consume a nominal average power demand of approximately
1,575 Mega-Watt (MW) including Potlines, smelter and inter-bus power losses.
Alba is presently considering expanding its smelter operations to include an additional Potline 6 (L6), a Power
Station 5 (PS 5), and supporting facilities.
Alba awarded the feasibility study to Bechtel Corporation. Bechtel, with Alba’s approval, retained the services of
Tebodin Middle East (TME) to conduct an Environmental and Social Impact Assessment (ESIA) study as requested
by the General Directorate of Environment & Wildlife Protection.
This study was submitted to SCE in June 2014 [1]1. However after submittal of the ESIA report, design changes
were made for the power station configuration. TME prepared this addendum to inform SCE on these changes and
to assess the change in impacts on the environment.
2.1 Addendum Scope
As indicated in the ESIA, the existing Alba aluminium smelter is spread across an approximate area of 3.5 square
kilometre (km2) with an existing five (5) Potlines, three (3) Cast Houses, three (3) Paste Plants, a dedicated Carbon
Plant, ten (10) Fume Treatment Plants, port facilities, and four (4) power stations. At the port, Alba’s facilities include
a 550,000 tpy coke calcining plant and a water desalination plant.
The initial design of PS 5, for which the ESIA was prepared, comprised two (2) F class units. In the current design
change, an extra F class unit is added to the power station, hereafter referred to as PS-5C. Furthermore, the existing
PS-2 will be shut-down and additional power2 will no longer be sourced from the Electricity and Water Authority
(EWA) grid.
This will result in the following additions (more details provided in Chapter 3):
� Additional F class unit for Power Station 5;
� Increased capacity of water storage tanks; and
1 Numbering corresponds with references listed at the end of this report.
2 Up to 150 Mega Watt (MW)
Tebodin Middle East Ltd.
Addendum to Environmental and Social Impact Assessment Report
Order number: 10921.00
Document number: 3311003
Revision: E
October 28, 2014
Page 14 / 63
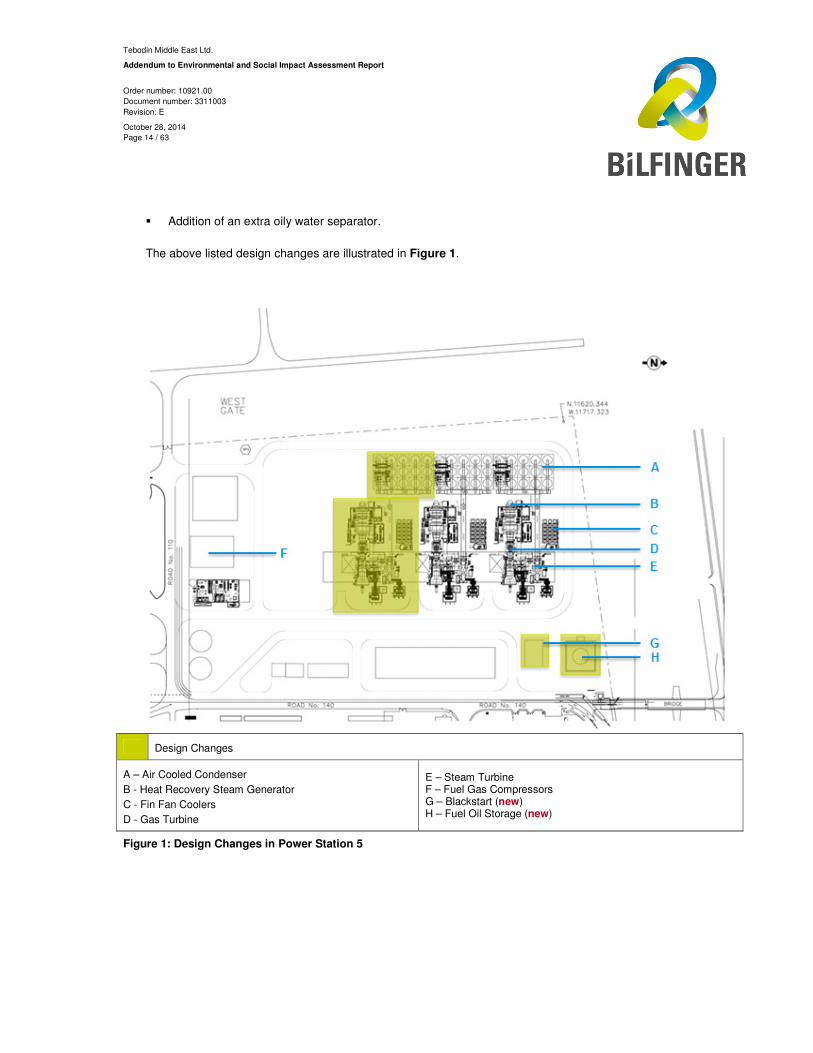
� Addition of an extra oily water separator.
The above listed design changes are illustrated in Figure 1.
Design Changes
A – Air Cooled Condenser
B - Heat Recovery Steam Generator
C - Fin Fan Coolers
D - Gas Turbine
E – Steam Turbine F – Fuel Gas Compressors G – Blackstart (new) H – Fuel Oil Storage (new)
Figure 1: Design Changes in Power Station 5
Tebodin Middle East Ltd.
Addendum to Environmental and Social Impact Assessment Report
Order number: 10921.00
Document number: 3311003
Revision: E
October 28, 2014
Page 15 / 63
The scope of this addendum is to assess the additional environmental impacts3 related to this “new” design. This
means that the previous environmental impacts combined with “new” potential impacts are assessed for each
environmental aspect.
Considering the design changes, the effect on ambient air quality as well as the impact on ambient noise has been
assessed quantitatively using, respectively, CALLPUFF and Sound PLAN software. Changes for other companies
have been assessed qualitatively.
Also, future developments based on Bahrain’s Economic Vision 2030, which was launched in October 2008, have
been taken into account in this addendum (where feasible).
2.2 Previous Environmental Studies
In 2003, an Environmental Impact Assessment (EIA) was prepared by TME for the proposed expansion of Potline 5
and Potline 6. However, Potline 6 was never constructed. Alba received approval for the EIA in 2003 from the
competent regulatory authorities.
Recently, an Environmental Scoping Report (ESR) was prepared by Tebodin and submitted to SCE on 16th January
2014 for the proposed expansion. The ESR described the proposed project, available environmental baseline data,
proposed environmental baseline surveys, anticipated environmental impacts and methodology for executing the
ESIA for the project.
Subsequent to the approval of the Environmental Scoping Report4 TME prepared the ESIA which was submitted to
SCE on the 9th of June 2014 [1]. Also, on August 28th a stakeholders meeting was held to present the first result of
the submitted ESIA.
3 Positive as well as potential negative impacts.
4 The ESR was approved by SCE with comments on March 5, 2014. Comments on the ESR were subsequently discussed with the authorities on March 18,
2014.

Tebodin Middle East Ltd.
Addendum to Environmental and Social Impact Assessment Report
Order number: 10921.00
Document number: 3311003
Revision: E
October 28, 2014
Page 16 / 63
This page is intentionally blank.
Tebodin Middle East Ltd.
Addendum to Environmental and Social Impact Assessment Report
Order number: 10921.00
Document number: 3311003
Revision: E
October 28, 2014
Page 17 / 63
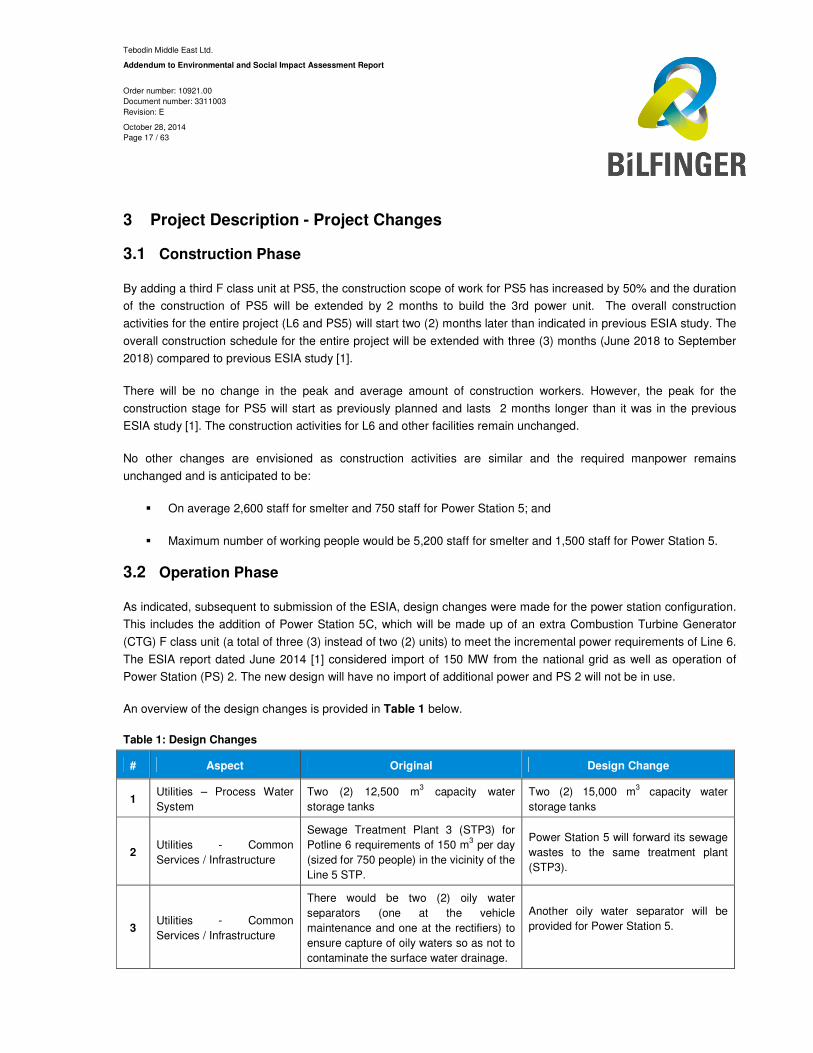
3 Project Description - Project Changes
3.1 Construction Phase
By adding a third F class unit at PS5, the construction scope of work for PS5 has increased by 50% and the duration
of the construction of PS5 will be extended by 2 months to build the 3rd power unit. The overall construction
activities for the entire project (L6 and PS5) will start two (2) months later than indicated in previous ESIA study. The
overall construction schedule for the entire project will be extended with three (3) months (June 2018 to September
2018) compared to previous ESIA study [1].
There will be no change in the peak and average amount of construction workers. However, the peak for the
construction stage for PS5 will start as previously planned and lasts 2 months longer than it was in the previous
ESIA study [1]. The construction activities for L6 and other facilities remain unchanged.
No other changes are envisioned as construction activities are similar and the required manpower remains
unchanged and is anticipated to be:
� On average 2,600 staff for smelter and 750 staff for Power Station 5; and
� Maximum number of working people would be 5,200 staff for smelter and 1,500 staff for Power Station 5.
3.2 Operation Phase
As indicated, subsequent to submission of the ESIA, design changes were made for the power station configuration.
This includes the addition of Power Station 5C, which will be made up of an extra Combustion Turbine Generator
(CTG) F class unit (a total of three (3) instead of two (2) units) to meet the incremental power requirements of Line 6.
The ESIA report dated June 2014 [1] considered import of 150 MW from the national grid as well as operation of
Power Station (PS) 2. The new design will have no import of additional power and PS 2 will not be in use.
An overview of the design changes is provided in Table 1 below.
Table 1: Design Changes
# Aspect Original Design Change
1 Utilities – Process Water
System
Two (2) 12,500 m3 capacity water
storage tanks
Two (2) 15,000 m3 capacity water
storage tanks
2 Utilities - Common
Services / Infrastructure
Sewage Treatment Plant 3 (STP3) for
Potline 6 requirements of 150 m3 per day
(sized for 750 people) in the vicinity of the
Line 5 STP.
Power Station 5 will forward its sewage
wastes to the same treatment plant
(STP3).
3 Utilities - Common
Services / Infrastructure
There would be two (2) oily water
separators (one at the vehicle
maintenance and one at the rectifiers) to
ensure capture of oily waters so as not to
contaminate the surface water drainage.
Another oily water separator will be
provided for Power Station 5.

Tebodin Middle East Ltd.
Addendum to Environmental and Social Impact Assessment Report
Order number: 10921.00
Document number: 3311003
Revision: E
October 28, 2014
Page 18 / 63
# Aspect Original Design Change
4 Power Plant
Two (2) combined cycle units, each
nominally 450 MW in a 1x1x1
configuration. NOx emissions would be
100 mg/Nm3.
Three (3) combined cycle units, each
nominally 450 MW in a 1x1x1
configuration. For each unit, the major
process equipment and support
systems are the same as in the original
design. NOx emissions are considered
as 51 mg/Nm3.
5 Power Import
Up to 150 MW of power would be
sourced from the Electricity and Water
Authority (EWA) grid for normal
operations.
No import from the grid.
6 Back-up System None, as power from EWA grid can be
used.
A black start unit, either of
aeroderivative gas turbine or
reciprocating engine design, capable of
firing either natural gas or distillate for
emergency start-up of PS5, including a
distillate day tank with containment
walls and delivery pumps.
7 Existing Power Stations Operation of existing PS 2.
PS 2 will not be in use.
Groundwater consumption by PS 2 will
be stopped.
3.2.1 Black Start
During normal operation, the electric power used within the plant is provided from the power station. However, if all
of the power stations main generators are shut down, external power is required to re-start PS5. As the new design
will not use power from the Electricity and Water Authority (EWA) grid, a black start is used as a power back-up
system.
To provide a black start, diesel generators with a capacity of 18 to 22 MW will be used. These generators require the
installation of a diesel storage tank (see Figure 1) with a storage capacity of 140 cubic metres (m3), sufficient for one
day operation.
In case of external power requirement, the black start operated for approximately one (1) hour wherein it will be used
to start-up the first Gas Turbine (GT). When this turbine becomes self-sustaining the power from that GT will be used
to drive the Load Commuted Inverter (LCI) to start the second and third unit.
The black start will be tested quarterly for a half- to one hour which is expected to require 6,128 gallons or 23.2 m3 of
diesel fuel per year.
Tebodin Middle East Ltd.
Addendum to Environmental and Social Impact Assessment Report
Order number: 10921.00
Document number: 3311003
Revision: E
October 28, 2014
Page 19 / 63
3.2.2 Power Station Shut-down
Power station 2 (PS2) will be shut down and will be made available for emergency backup conditions, in case any of
the other power stations are not available. Therefore PS 2 will not be demolished. The ESIA report submitted in June
2014 [1] still considered PS 2 operational for a period per year. PS2 is an old power station with a relatively low
efficiency and with higher emissions to air. Replacing PS2 will therefore improve the energy efficiency (ratio of
natural gas used to produce an amount of electricity) and reduce emissions to air.
3.2.3 Maintenance
Alba schedules regular maintenance for its combustion and steam turbines. For the existing power stations PS3 and
PS4, the annual scheduled combustion inspection outages are for approximately six (6) days per combustion
turbine. Each combustion turbine is also scheduled every four (4) years for either a Hot Gas Path (HGP) or Major
Inspection (MI), each of which requires approximately thirty-six (36) days to complete. For PS5 and the “F” class
machines the combustion inspection takes place over a seven (7) day (one (1) week) period during which the
combustor section is disassembled to inspect the fuel nozzles, liners, transition pieces, spark assemblies, flame
detectors and flow sleeves.
Approximately every four (4) years, a major overhaul is scheduled for PS5, for a period of approximately forty-nine
(49) days (seven (7) weeks). The scheduling of these inspections and outages are based on the technology
providers’ recommendations with regard to hours of operation, number of starts and trips, runbacks, etc. Steam
turbines are maintained on a similar basis within the technology provider’ recommendations.
3.2.4 Sewage treatment plant (STP)
As stated in the ESIA report dated June 2014 [1], a new sewage treatment plant will be added as part of the
proposed expansion (section 6.3.2.4 of ESIA report). SCE has requested for more details regarding the proposed
STP.
The new Sewage Treatment Plant (STP-3) with a design capacity of 150 m3 per day (sized for 750 people) will be
erected in the vicinity of L5 STP for the treatment of waste water generated from L6, PS 5, and the proposed
supporting facilities associated with the expansion project. Sources of waste water received at STP-3 for treatment
includes; new cafeteria and change rooms facility as well as the administration building, domestic sewage, etc.
Consistent with STP-1 and STP-2, the proposed STP-3 would be based on an extended aeration activated sludge
process and will generate Treated Sewage Effluent (TSE) which will be used for irrigation throughout the plant. The
treated water therefore will have to comply with the Bahrain irrigation water standards. The discharged effluent will
be similar in quality to that being produced currently, and on that basis is not expected to result in impacts of any
significance. Arrangements have been made through a contractor who will dispose the associated sludge to Asker
landfill.
Some more background information is provided in this ESIA addendum describing the anticipated environmental
impacts of STPs; however, since the process technology is not known at this stage, performing a quantitative and
detailed impact assessment of the STP is not possible.
Tebodin Middle East Ltd.
Addendum to Environmental and Social Impact Assessment Report
Order number: 10921.00
Document number: 3311003
Revision: E
October 28, 2014
Page 20 / 63
The organization responsible for the design, construction and operation of the STP facility will be decided on through
a tendering procedure. The selected technology provider must adhere to extensive specifications developed to
ensure compliance with engineering performance criteria, environmental regulations and other criteria. For example,
basic specifications for influent, effluent, and a number of other projects characteristics are defined for Tenders.
Multiple treatment processes are available, such as:
• Extended Aeration (EA);
• Sequential Batch Reactor (SBR);
• Membrane Bio Reactor (MBR);
• Moving Bed Biofilm Reactor (MBBR).
In principle, these alternatives are all variations of activated sludge treatment; however, they may offer different
benefits with respect to aspects such as space utilisation, residence time, purification security/risks, along with
practical and financial considerations. Actual performance is, however, more related to individual plant design (i.e.
capacity, buffering, etc.), management, and performance limits/controls of the treatment facilities. For example,
combinations of different treatment processes can be incorporated to achieve the desired performance for a specific
wastewater situation.
The STP design specifications should include the minimisation of odour, noise and other nuisance impacts;
assurance of ability to consistently achieve the required effluent standards for irrigation; and assurance of ability to
achieve the required sludge quality for disposal in a landfill.
The main concern related to atmospheric emission and air quality during the operation of an STP is odour and H2S
emissions.
3.3 Overall Project Schedule
All construction activities (starting with site preparation) will start 2 months later (postponed from August to October)
and the overall construction schedule (L6 and PS5) will extend three (3) months further than indicated in previous
ESIA report (postponed from June to September). Construction activities for L6 and other facilities remain
unchanged.
The original project schedule would result in the First Hot Metal (FHM) on December 1st 2017 and the Last Hot Metal
(LHM) on June 1st 2018. FHM is now expected on the 1st of March 2018, whereas LHM is scheduled for 1st
September 2018. Table 2 below provides the original project schedule and the revised project schedule, considering
the third power generation unit at PS5.
Tebodin Middle East Ltd.
Addendum to Environmental and Social Impact Assessment Report
Order number: 10921.00
Document number: 3311003
Revision: E
October 28, 2014
Page 21 / 63
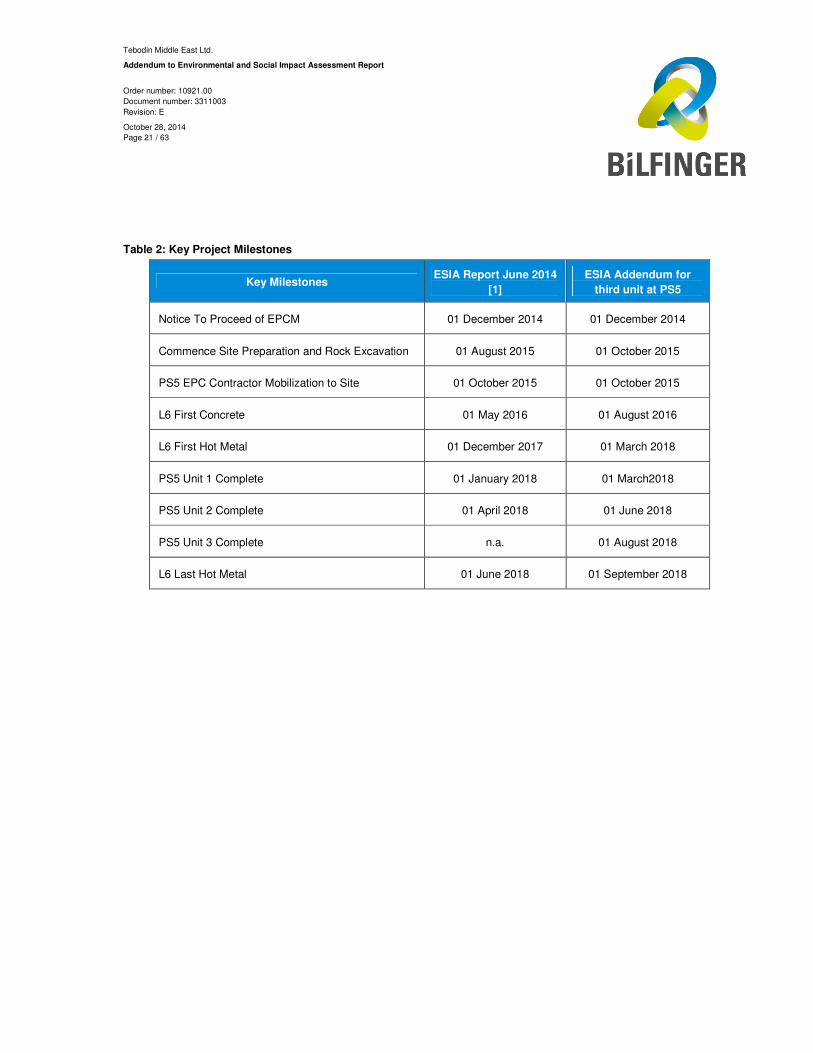
Table 2: Key Project Milestones
Key Milestones ESIA Report June 2014
[1] ESIA Addendum for
third unit at PS5
Notice To Proceed of EPCM 01 December 2014 01 December 2014
Commence Site Preparation and Rock Excavation 01 August 2015 01 October 2015
PS5 EPC Contractor Mobilization to Site 01 October 2015 01 October 2015
L6 First Concrete 01 May 2016 01 August 2016
L6 First Hot Metal 01 December 2017 01 March 2018
PS5 Unit 1 Complete 01 January 2018 01 March2018
PS5 Unit 2 Complete 01 April 2018 01 June 2018
PS5 Unit 3 Complete n.a. 01 August 2018
L6 Last Hot Metal 01 June 2018 01 September 2018

Tebodin Middle East Ltd.
Addendum to Environmental and Social Impact Assessment Report
Order number: 10921.00
Document number: 3311003
Revision: E
October 28, 2014
Page 22 / 63
This page is intentionally blank.
Tebodin Middle East Ltd.
Addendum to Environmental and Social Impact Assessment Report
Order number: 10921.00
Document number: 3311003
Revision: E
October 28, 2014
Page 23 / 63
4 Environmental Impacts
4.1 Introduction and Overview
The ESIA, the environmental aspects of the Alba operation have been described, together with a description of the
state of the environment that is currently affected by operations of the existing Alba plant, and that may be affected
by the proposed development. Impacts on the environment are a function of these two components, namely the
environmental aspects of the operation (existing and proposed) and the state or vulnerability of the existing
environment that may be affected by those aspects.
In this addendum, possible impacts of the proposed design changes on the environment are assessed in the same
order as previously done for the ESIA. By doing so, the addendum can be used in reference to the environmental
impacts identified previously.
The impacts of the design change are assessed based on assessment matrices with low, medium or high ratings,
based on the severity and the duration (for planned / normal aspects) or likelihood (for unplanned aspects) of their
occurrence.
4.2 Air Quality
4.2.1 Construction Phase
The construction phase activities resulting in air emissions - such as clearing of land and related excavation,
operation of heavy machinery, vehicle movements, et cetera – are the same for the activities required for the design
change.
Therefore, the construction phase activities related to the design change are not expected to result in different
impacts to air quality as the activities are of the same nature.
All construction activities (starting with Site Prep) will start 2 months later and the overall construction schedule (L6
and PS5) will extend (3) months further than indicated in previous ESIA report. The peak and average of
construction workers remain unchanged; however, the peak construction activities for PS5 will start as previously
planned and lasts for two (2) months longer than in the previous study of June 2014 [1].
The slight change in duration of the construction period and the shift of 2 month longer peak construction period for
PS5 will lead to higher emissions to air due to the two (2) month higher construction intensity and vehicle
movements. The change in construction intensity for the third power generation unit is not expected to have a
significant effect taken into consideration that the same mitigation and control measures, as advised in the ESIA, are
incorporated by the Engineering Procurement and Construction (EPC) Contractor.
Tebodin Middle East Ltd.
Addendum to Environmental and Social Impact Assessment Report
Order number: 10921.00
Document number: 3311003
Revision: E
October 28, 2014
Page 24 / 63
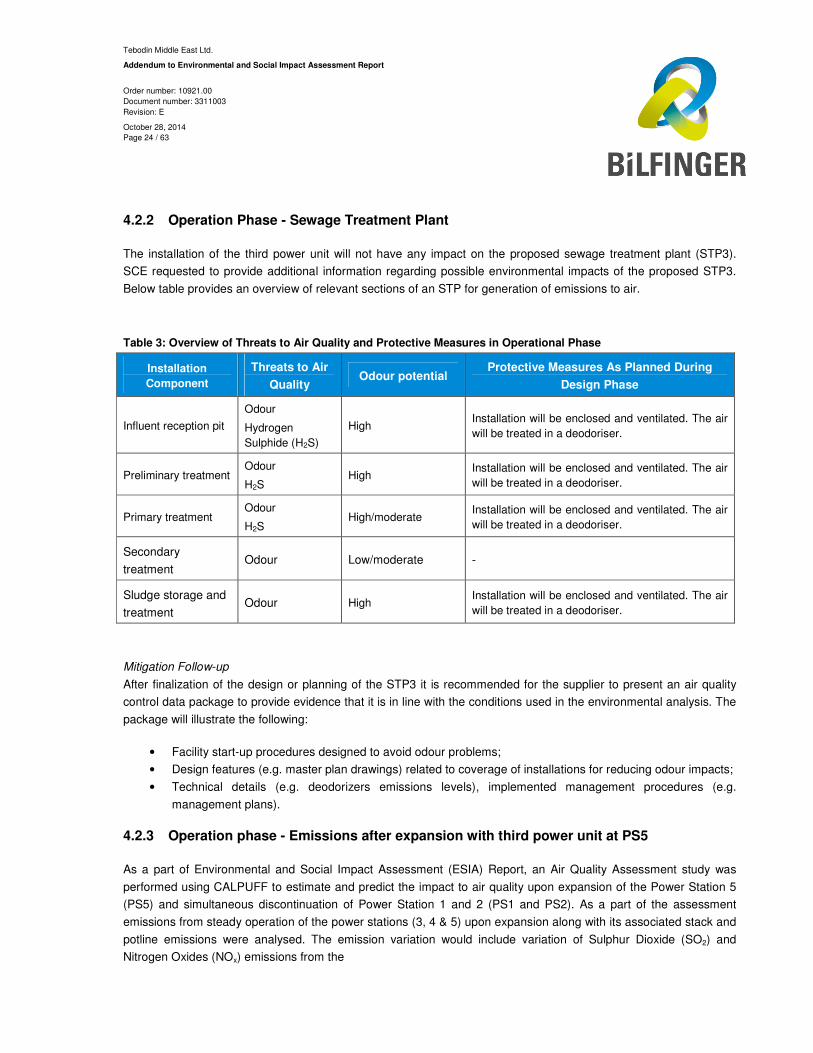
4.2.2 Operation Phase - Sewage Treatment Plant
The installation of the third power unit will not have any impact on the proposed sewage treatment plant (STP3).
SCE requested to provide additional information regarding possible environmental impacts of the proposed STP3.
Below table provides an overview of relevant sections of an STP for generation of emissions to air.
Table 3: Overview of Threats to Air Quality and Protective Measures in Operational Phase
Installation
Component
Threats to Air
Quality Odour potential
Protective Measures As Planned During
Design Phase
Influent reception pit
Odour
Hydrogen
Sulphide (H2S)
High Installation will be enclosed and ventilated. The air
will be treated in a deodoriser.
Preliminary treatment Odour
H2S High
Installation will be enclosed and ventilated. The air
will be treated in a deodoriser.
Primary treatment Odour
H2S High/moderate
Installation will be enclosed and ventilated. The air
will be treated in a deodoriser.
Secondary
treatment Odour Low/moderate -
Sludge storage and
treatment Odour High
Installation will be enclosed and ventilated. The air
will be treated in a deodoriser.
Mitigation Follow-up
After finalization of the design or planning of the STP3 it is recommended for the supplier to present an air quality
control data package to provide evidence that it is in line with the conditions used in the environmental analysis. The
package will illustrate the following:
• Facility start-up procedures designed to avoid odour problems;
• Design features (e.g. master plan drawings) related to coverage of installations for reducing odour impacts;
• Technical details (e.g. deodorizers emissions levels), implemented management procedures (e.g.
management plans).
4.2.3 Operation phase - Emissions after expansion with third power unit at PS5
As a part of Environmental and Social Impact Assessment (ESIA) Report, an Air Quality Assessment study was
performed using CALPUFF to estimate and predict the impact to air quality upon expansion of the Power Station 5
(PS5) and simultaneous discontinuation of Power Station 1 and 2 (PS1 and PS2). As a part of the assessment
emissions from steady operation of the power stations (3, 4 & 5) upon expansion along with its associated stack and
potline emissions were analysed. The emission variation would include variation of Sulphur Dioxide (SO2) and
Nitrogen Oxides (NOx) emissions from the
Tebodin Middle East Ltd.
Addendum to Environmental and Social Impact Assessment Report
Order number: 10921.00
Document number: 3311003
Revision: E
October 28, 2014
Page 25 / 63
units assuming there would be no change in the stack and potline emissions. There will be no emissions of HF
(Hydrogen Fluoride) and PM10 (Particulate Matter with a diameter smaller than 10 µg) from the natural gas fired
power stations. The study is an update of existing air quality assessment to include the above inclusions and will
focus on the effects of proposed project emissions against Bahrain Air Quality Standards. Therefore, Ground Level
Concentrations (GLCs) of these components, hereafter referred to as criteria pollutants, were predicted using a
CALPUFF air dispersion model and the results discussed in the forthcoming sections.
The assessment considered the following scenario:
• Scenario A- Option A: The Scenario includes an addition of new Power Station (Power Station 5, (PS5)),
which consist of three (3) gas turbines. The addition of the turbine within PS5 would replace existing Power
Station (PS2), which would be on a stand-by mode. The emissions from the addition of PS5 is combined
with the emissions from Scenario-3 (future mitigated operation), which consists of Pot Line -1 through 6,
with Sulphur Dioxide (SO2) emissions from all reduction lines at 24.7 kilogram per tonne Aluminium (kg/tAl)
(maximum emissions recorded between 2007-2012) and total fluoride emissions from the high amperage
potlines L4 and L5 set at 0.6 kg/tAl, as per L6. Moreover, lower Nitrogen Oxides (NOx) emitting scenario
from 100 milligram per Normal Cubic Metre (mg/Nm3) to 51 mg/Nm3 is considered.
The black-start facility as described in section 3.2.1 will be tested quarterly for a half- to one hour, which is expected
to require approximately 23 m3 of diesel fuel per year. The combustion emissions from this periodic testing will add
to SO2, NOx and PM10 levels in ambient air. However, due to the limited fuel consumption and limited operation
(maximum 4 hours per year), impacts to ambient air quality from this activity are considered not significant.
The ambient air quality in Alba’s surroundings is being influenced by a variety of activities, such as:
• Emissions from the Al Riffa power plant, 3 kilometres north of Alba contributing to the NOx and SO2
concentrations in ambient air, especially in the Riffa residential area.
• Emissions from BAPCO facilities (flares, vents, fugitive emissions, combustion emissions, etc.) contributing
to concentrations of NOx, SO2, PM10, VOC etc. in ambient air;
• Emissions from industries surrounding Alba (east and south) contributing to the NOx, SO2, PM10, VOC etc.
concentrations in ambient air;
• Vehicle emissions on roads in Alba’s surroundings contributing to the NOx, SO2, PM10, VOC etc.
concentrations in ambient air.
No information was available on anticipated changes in the activities from above sources possibly leading to
additional emissions or reduced emissions, and therefore anticipated impacts to ambient air quality in Alba’s
surroundings. It can be anticipated that in case the Al Riffa Power Plant will be decommissioned, levels of NOx and
SO2 levels in ambient air in the surroundings, such as Riffa residential area will be significantly reduced.
Since no details are available, these developments, if any, cannot be considered in this assessment.
Tebodin Middle East Ltd.
Addendum to Environmental and Social Impact Assessment Report
Order number: 10921.00
Document number: 3311003
Revision: E
October 28, 2014
Page 26 / 63
4.2.3.1 Emission Inventory Option A - Emissions of Criteria Pollutants (SO2, NOx, HF and PM10)
The emissions from this scenario were determined based on addition of 3 power trains for PS5 and discontinuance
of PS2. PS2 shall be as a stand-by and be used during emergency conditions. Therefore the scenario considered is
crept existing operations with discontinuation of PS2 and addition of L6 and Power Stations 5 operating at
nameplate production capacity. SO2 emissions from all reduction lines are set at 24.7 kg/tAl (maximum emissions
recorded between 2007-2012) and total fluoride emissions from the high amperage potlines L4 and L5 are set at 0.6
kg/tAl, as per L6. Moreover, lower NOx emissions from PS 5 are considered compared to the previous performed air
quality assessments [1].
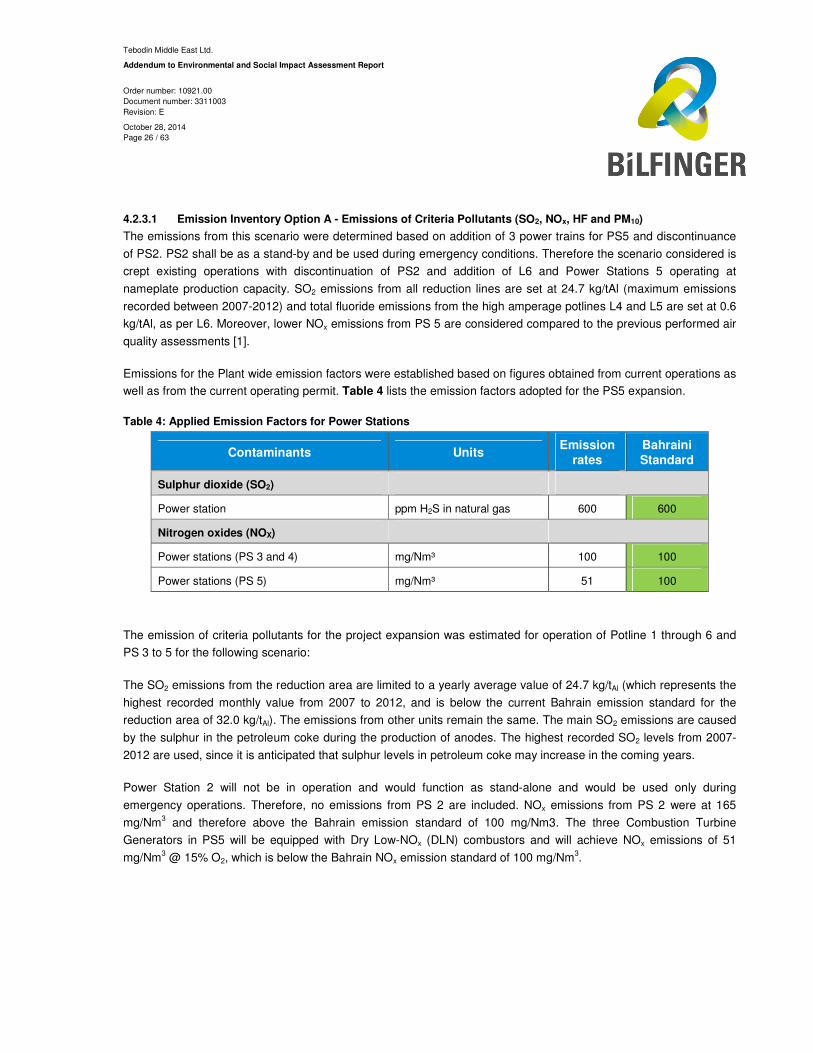
Emissions for the Plant wide emission factors were established based on figures obtained from current operations as
well as from the current operating permit. Table 4 lists the emission factors adopted for the PS5 expansion.
Table 4: Applied Emission Factors for Power Stations
Contaminants Units Emission
rates
Bahraini
Standard
Sulphur dioxide (SO2)
Power station ppm H2S in natural gas 600 600
Nitrogen oxides (NOX)
Power stations (PS 3 and 4) mg/Nm³ 100 100
Power stations (PS 5) mg/Nm³ 51 100
The emission of criteria pollutants for the project expansion was estimated for operation of Potline 1 through 6 and
PS 3 to 5 for the following scenario:
The SO2 emissions from the reduction area are limited to a yearly average value of 24.7 kg/tAl (which represents the
highest recorded monthly value from 2007 to 2012, and is below the current Bahrain emission standard for the
reduction area of 32.0 kg/tAl). The emissions from other units remain the same. The main SO2 emissions are caused
by the sulphur in the petroleum coke during the production of anodes. The highest recorded SO2 levels from 2007-
2012 are used, since it is anticipated that sulphur levels in petroleum coke may increase in the coming years.
Power Station 2 will not be in operation and would function as stand-alone and would be used only during
emergency operations. Therefore, no emissions from PS 2 are included. NOx emissions from PS 2 were at 165
mg/Nm3 and therefore above the Bahrain emission standard of 100 mg/Nm3. The three Combustion Turbine
Generators in PS5 will be equipped with Dry Low-NOx (DLN) combustors and will achieve NOx emissions of 51
mg/Nm3 @ 15% O2, which is below the Bahrain NOx emission standard of 100 mg/Nm3.
Tebodin Middle East Ltd.
Addendum to Environmental and Social Impact Assessment Report
Order number: 10921.00
Document number: 3311003
Revision: E
October 28, 2014
Page 27 / 63
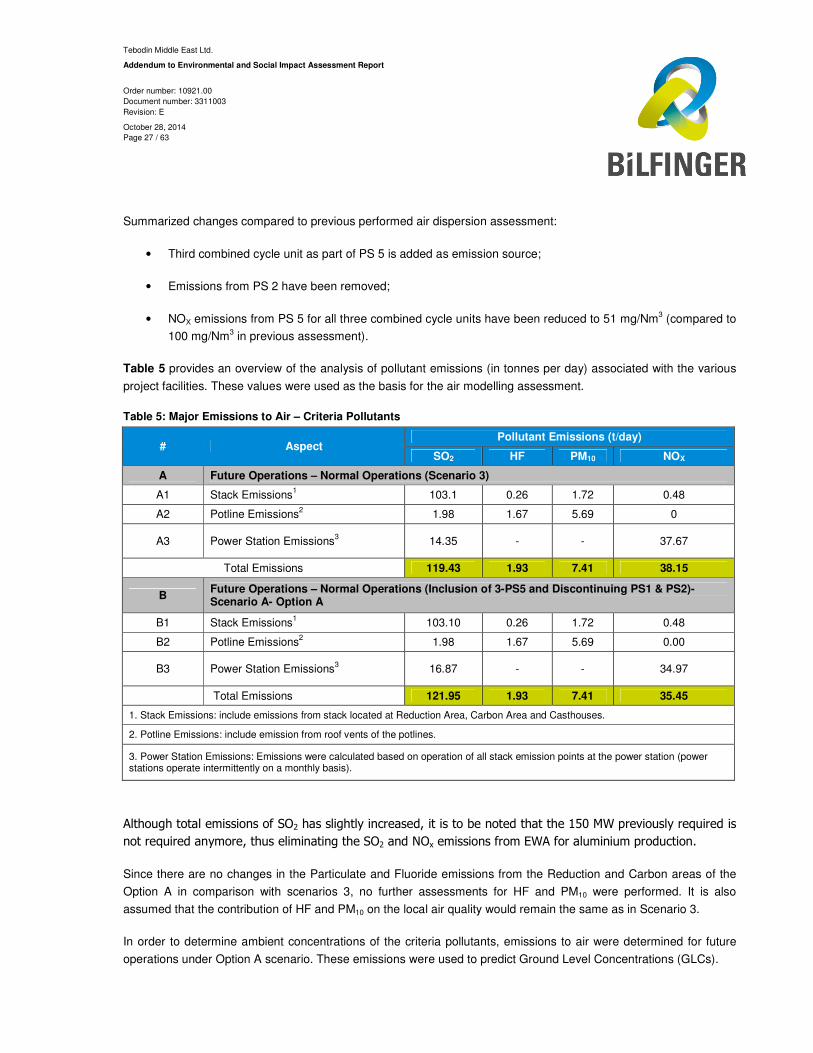
Summarized changes compared to previous performed air dispersion assessment:
• Third combined cycle unit as part of PS 5 is added as emission source;
• Emissions from PS 2 have been removed;
• NOX emissions from PS 5 for all three combined cycle units have been reduced to 51 mg/Nm3 (compared to
100 mg/Nm3 in previous assessment).
Table 5 provides an overview of the analysis of pollutant emissions (in tonnes per day) associated with the various
project facilities. These values were used as the basis for the air modelling assessment.
Table 5: Major Emissions to Air – Criteria Pollutants
# Aspect Pollutant Emissions (t/day)
SO2 HF PM10 NOX
A Future Operations – Normal Operations (Scenario 3)
A1 Stack Emissions1 103.1 0.26 1.72 0.48
A2 Potline Emissions2 1.98 1.67 5.69 0
A3 Power Station Emissions3 14.35 - - 37.67
Total Emissions 119.43 1.93 7.41 38.15
B Future Operations – Normal Operations (Inclusion of 3-PS5 and Discontinuing PS1 & PS2)- Scenario A- Option A
B1 Stack Emissions1 103.10 0.26 1.72 0.48
B2 Potline Emissions2 1.98 1.67 5.69 0.00
B3 Power Station Emissions3 16.87 - - 34.97
Total Emissions 121.95 1.93 7.41 35.45
1. Stack Emissions: include emissions from stack located at Reduction Area, Carbon Area and Casthouses.
2. Potline Emissions: include emission from roof vents of the potlines.
3. Power Station Emissions: Emissions were calculated based on operation of all stack emission points at the power station (power stations operate intermittently on a monthly basis).
Although total emissions of SO2 has slightly increased, it is to be noted that the 150 MW previously required is
not required anymore, thus eliminating the SO2 and NOx emissions from EWA for aluminium production.
Since there are no changes in the Particulate and Fluoride emissions from the Reduction and Carbon areas of the
Option A in comparison with scenarios 3, no further assessments for HF and PM10 were performed. It is also
assumed that the contribution of HF and PM10 on the local air quality would remain the same as in Scenario 3.
In order to determine ambient concentrations of the criteria pollutants, emissions to air were determined for future
operations under Option A scenario. These emissions were used to predict Ground Level Concentrations (GLCs).
Tebodin Middle East Ltd.
Addendum to Environmental and Social Impact Assessment Report
Order number: 10921.00
Document number: 3311003
Revision: E
October 28, 2014
Page 28 / 63
4.2.3.2 Predicted Ambient Air Pollutant Concentrations
In order to assess the contribution of Alba on the regional and local ambient concentration, CALPUFF air dispersion
model was used to predict the Proposed Option A operations. Where ambient air quality data was available at
selected receptor locations, Alba’s contribution for current operations was established and subsequently
extrapolated for the situation after expansion. Results of the air dispersion modelling are presented in Table 6. Along
with Isopleth contours of the scenarios at standard average time (hourly, daily, yearly average values).
The effect on ambient air quality was assessed for the following criteria pollutants:
� change in NO2 concentrations; and
� change in SO2 concentrations;
Concentration predictions were obtained using one (1) full year of the meteorological simulation. The resulting
overall maxima for the different averaging periods (annual mean, 24-hours and 1-hour depending on available air
quality standards) are highlighted in subsequent sections.
As shown in Table 6, maximum predicted concentrations of NO2 were found to be within all applicable limits for all
scenarios. In addition, maximum predicted ground level concentrations of SO2 were within applicable limits for the
annual mean averaging period.
Table 7 states the correlated total maximum predicted concentrations; i.e. it includes the actual background data
plus the model predicted data for Alba’s contribution alone, where the baseline existing case model data has been
adjusted to correlate with the actual data, henceforth stated as “correlated”.
For SO2; exceedances (see definition below) were predicted for both 24-hour average concentration (Bahraini limit
125 µg SO2 /m3) and one-hour average concentration (Bahraini limit 350 µg SO2 /m3) for the future Option A
Scenario, which are 176 µg SO2 /m3 and 429 µg SO2/m3 respectively. The exceedances were also reported for
Scenario 3, which were 162 µg SO2/m3 and 430 µg SO2/m
3 for 24-hour average concentration and one-hour average
concentration respectively.
It needs to be emphasised that all these exceedances are located within close proximity of the Alba facilities and not
at residential areas. Table 6 below summarises the maximum values of predicted concentrations for the criteria
pollutants for the Scenarios 3 and Option A, for hourly, daily and yearly values as applicable per regulations.
Exceedances are defined as concentration higher than the value set in the Bahrain Ambient Air Quality Standard
(BAAQS) recorded over for consecutive 3 time averaged concentration (hourly, daily and annual).
• Exceedance of hourly value: if a single receptor records three consecutive occurrences over the hourly
BAAQS.
• Exceedance of daily value: if a single receptor records 3 exceedances of the hourly BAAQ for 3 consecutive
days then it is recorded as exceedance of the daily value.
Tebodin Middle East Ltd.
Addendum to Environmental and Social Impact Assessment Report
Order number: 10921.00
Document number: 3311003
Revision: E
October 28, 2014
Page 29 / 63
• Exceedance of annual value: if 3 consecutive daily occurrences were recorded for a single receptor then
that particular receptor is assumed to have an exceedance of the annual value.
The extent of the exceedances of SO2 is discussed in more detail in Section 4.2.3.4.
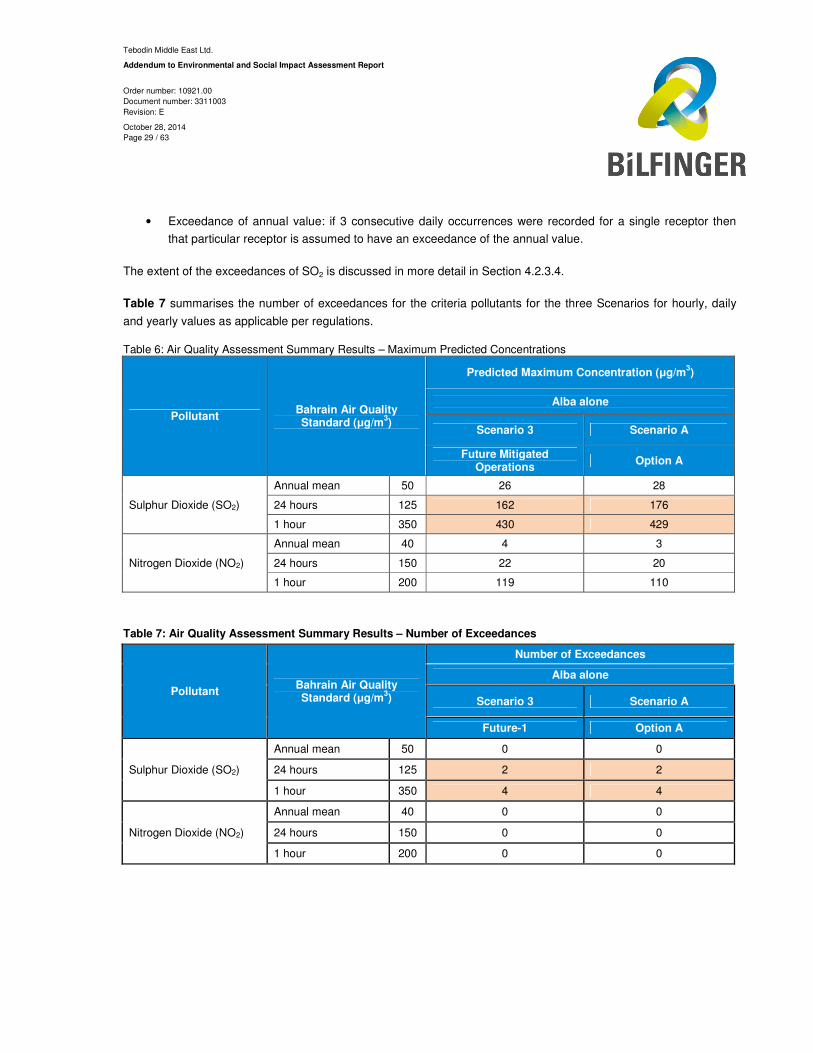
Table 7 summarises the number of exceedances for the criteria pollutants for the three Scenarios for hourly, daily
and yearly values as applicable per regulations.
Table 6: Air Quality Assessment Summary Results – Maximum Predicted Concentrations
Pollutant Bahrain Air Quality Standard (µg/m
3)
Predicted Maximum Concentration (µg/m3)
Alba alone
Scenario 3 Scenario A
Future Mitigated Operations
Option A
Sulphur Dioxide (SO2)
Annual mean 50 26 28
24 hours 125 162 176
1 hour 350 430 429
Nitrogen Dioxide (NO2)
Annual mean 40 4 3
24 hours 150 22 20
1 hour 200 119 110
Table 7: Air Quality Assessment Summary Results – Number of Exceedances
Pollutant Bahrain Air Quality Standard (µg/m
3)
Number of Exceedances
Alba alone
Scenario 3 Scenario A
Future-1 Option A
Sulphur Dioxide (SO2)
Annual mean 50 0 0
24 hours 125 2 2
1 hour 350 4 4
Nitrogen Dioxide (NO2)
Annual mean 40 0 0
24 hours 150 0 0
1 hour 200 0 0
Tebodin Middle East Ltd.
Addendum to Environmental and Social Impact Assessment Report
Order number: 10921.00
Document number: 3311003
Revision: E
October 28, 2014
Page 30 / 63
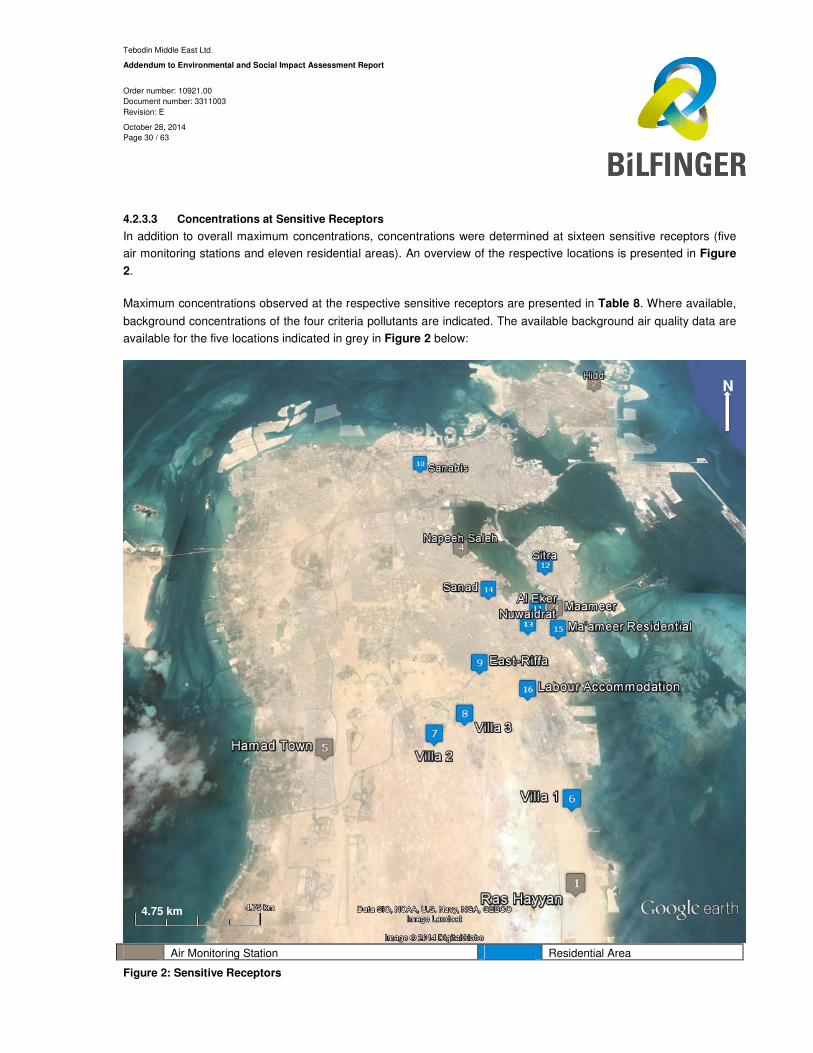
4.2.3.3 Concentrations at Sensitive Receptors
In addition to overall maximum concentrations, concentrations were determined at sixteen sensitive receptors (five
air monitoring stations and eleven residential areas). An overview of the respective locations is presented in Figure
2.
Maximum concentrations observed at the respective sensitive receptors are presented in Table 8. Where available,
background concentrations of the four criteria pollutants are indicated. The available background air quality data are
available for the five locations indicated in grey in Figure 2 below:
Air Monitoring Station Residential Area
Figure 2: Sensitive Receptors
4.75 km
N
Tebodin Middle East Ltd.
Addendum to Environmental and Social Impact Assessment Report
Order number: 10921.00
Document number: 3311003
Revision: E
October 28, 2014
Page 31 / 63
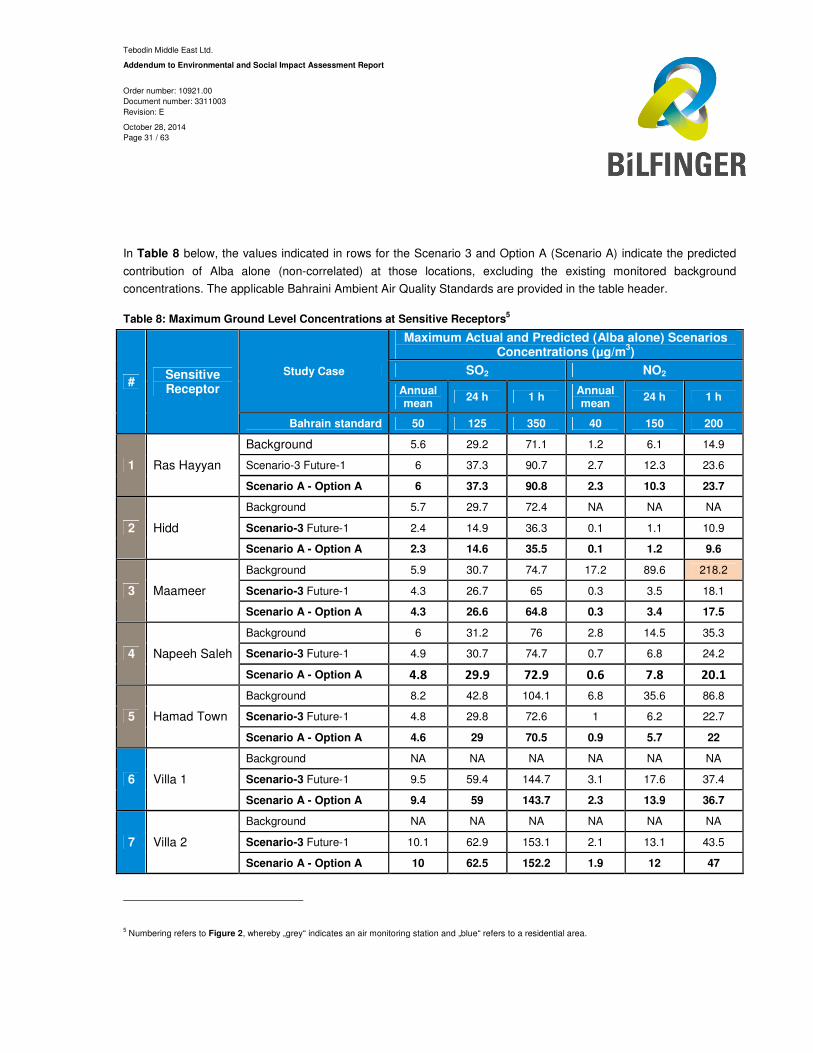
In Table 8 below, the values indicated in rows for the Scenario 3 and Option A (Scenario A) indicate the predicted
contribution of Alba alone (non-correlated) at those locations, excluding the existing monitored background
concentrations. The applicable Bahraini Ambient Air Quality Standards are provided in the table header.
Table 8: Maximum Ground Level Concentrations at Sensitive Receptors5
# Sensitive Receptor
Study Case
Maximum Actual and Predicted (Alba alone) Scenarios Concentrations (µg/m
3)
SO2 NO2
Annual mean
24 h 1 h Annual mean
24 h 1 h
Bahrain standard 50 125 350 40 150 200
1 Ras Hayyan
Background 5.6 29.2 71.1 1.2 6.1 14.9
Scenario-3 Future-1 6 37.3 90.7 2.7 12.3 23.6
Scenario A - Option A 6 37.3 90.8 2.3 10.3 23.7
2 Hidd
Background 5.7 29.7 72.4 NA NA NA
Scenario-3 Future-1 2.4 14.9 36.3 0.1 1.1 10.9
Scenario A - Option A 2.3 14.6 35.5 0.1 1.2 9.6
3 Maameer
Background 5.9 30.7 74.7 17.2 89.6 218.2
Scenario-3 Future-1 4.3 26.7 65 0.3 3.5 18.1
Scenario A - Option A 4.3 26.6 64.8 0.3 3.4 17.5
4 Napeeh Saleh
Background 6 31.2 76 2.8 14.5 35.3
Scenario-3 Future-1 4.9 30.7 74.7 0.7 6.8 24.2
Scenario A - Option A 4.8 29.9 72.9 0.6 7.8 20.1
5 Hamad Town
Background 8.2 42.8 104.1 6.8 35.6 86.8
Scenario-3 Future-1 4.8 29.8 72.6 1 6.2 22.7
Scenario A - Option A 4.6 29 70.5 0.9 5.7 22
6 Villa 1
Background NA NA NA NA NA NA
Scenario-3 Future-1 9.5 59.4 144.7 3.1 17.6 37.4
Scenario A - Option A 9.4 59 143.7 2.3 13.9 36.7
7 Villa 2
Background NA NA NA NA NA NA
Scenario-3 Future-1 10.1 62.9 153.1 2.1 13.1 43.5
Scenario A - Option A 10 62.5 152.2 1.9 12 47
5 Numbering refers to Figure 2, whereby „grey“ indicates an air monitoring station and „blue“ refers to a residential area.
Tebodin Middle East Ltd.
Addendum to Environmental and Social Impact Assessment Report
Order number: 10921.00
Document number: 3311003
Revision: E
October 28, 2014
Page 32 / 63
# Sensitive Receptor
Study Case
Maximum Actual and Predicted (Alba alone) Scenarios Concentrations (µg/m
3)
SO2 NO2
Annual mean
24 h 1 h Annual mean
24 h 1 h
Bahrain standard 50 125 350 40 150 200
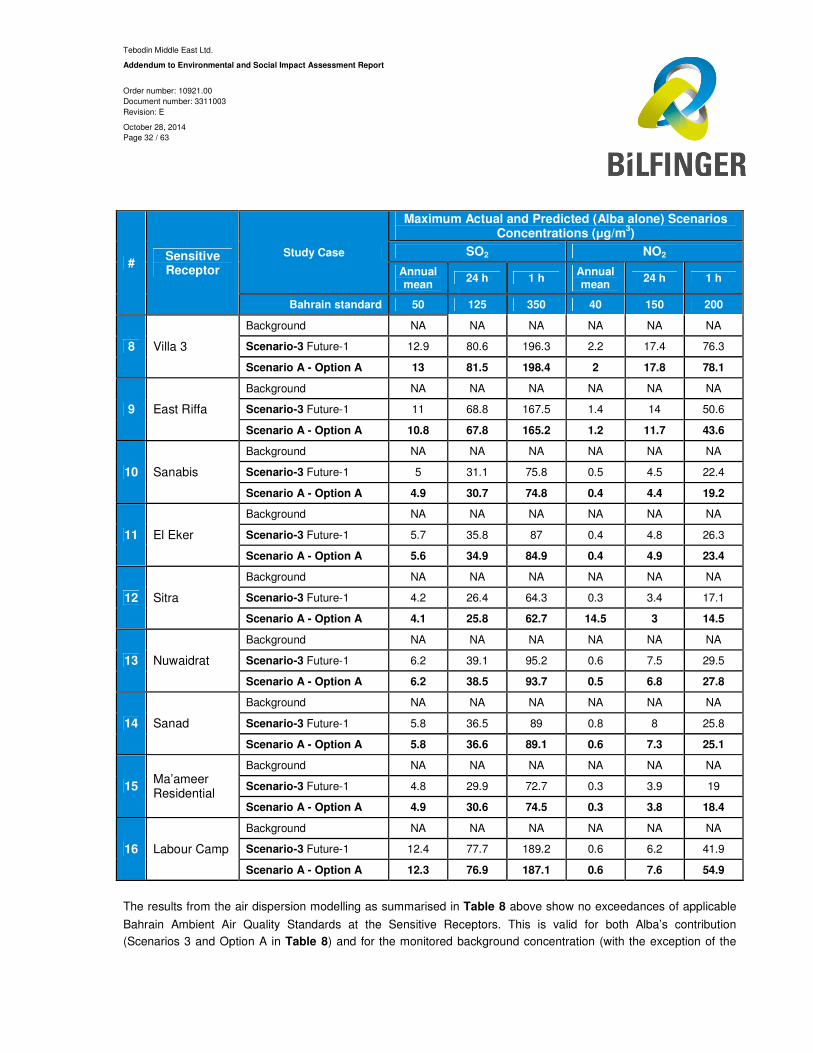
8 Villa 3
Background NA NA NA NA NA NA
Scenario-3 Future-1 12.9 80.6 196.3 2.2 17.4 76.3
Scenario A - Option A 13 81.5 198.4 2 17.8 78.1
9 East Riffa
Background NA NA NA NA NA NA
Scenario-3 Future-1 11 68.8 167.5 1.4 14 50.6
Scenario A - Option A 10.8 67.8 165.2 1.2 11.7 43.6
10 Sanabis
Background NA NA NA NA NA NA
Scenario-3 Future-1 5 31.1 75.8 0.5 4.5 22.4
Scenario A - Option A 4.9 30.7 74.8 0.4 4.4 19.2
11 El Eker
Background NA NA NA NA NA NA
Scenario-3 Future-1 5.7 35.8 87 0.4 4.8 26.3
Scenario A - Option A 5.6 34.9 84.9 0.4 4.9 23.4
12 Sitra
Background NA NA NA NA NA NA
Scenario-3 Future-1 4.2 26.4 64.3 0.3 3.4 17.1
Scenario A - Option A 4.1 25.8 62.7 14.5 3 14.5
13 Nuwaidrat
Background NA NA NA NA NA NA
Scenario-3 Future-1 6.2 39.1 95.2 0.6 7.5 29.5
Scenario A - Option A 6.2 38.5 93.7 0.5 6.8 27.8
14 Sanad
Background NA NA NA NA NA NA
Scenario-3 Future-1 5.8 36.5 89 0.8 8 25.8
Scenario A - Option A 5.8 36.6 89.1 0.6 7.3 25.1
15 Ma’ameer Residential
Background NA NA NA NA NA NA
Scenario-3 Future-1 4.8 29.9 72.7 0.3 3.9 19
Scenario A - Option A 4.9 30.6 74.5 0.3 3.8 18.4
16 Labour Camp
Background NA NA NA NA NA NA
Scenario-3 Future-1 12.4 77.7 189.2 0.6 6.2 41.9
Scenario A - Option A 12.3 76.9 187.1 0.6 7.6 54.9
The results from the air dispersion modelling as summarised in Table 8 above show no exceedances of applicable
Bahrain Ambient Air Quality Standards at the Sensitive Receptors. This is valid for both Alba’s contribution
(Scenarios 3 and Option A in Table 8) and for the monitored background concentration (with the exception of the
Tebodin Middle East Ltd.
Addendum to Environmental and Social Impact Assessment Report
Order number: 10921.00
Document number: 3311003
Revision: E
October 28, 2014
Page 33 / 63
NO2 1-hour monitored background concentration at Maameer which is located about 5.5 km from Alba). Note: any
other background values for sensitive receptors 6 to 16 are not accounted for as these are not available.
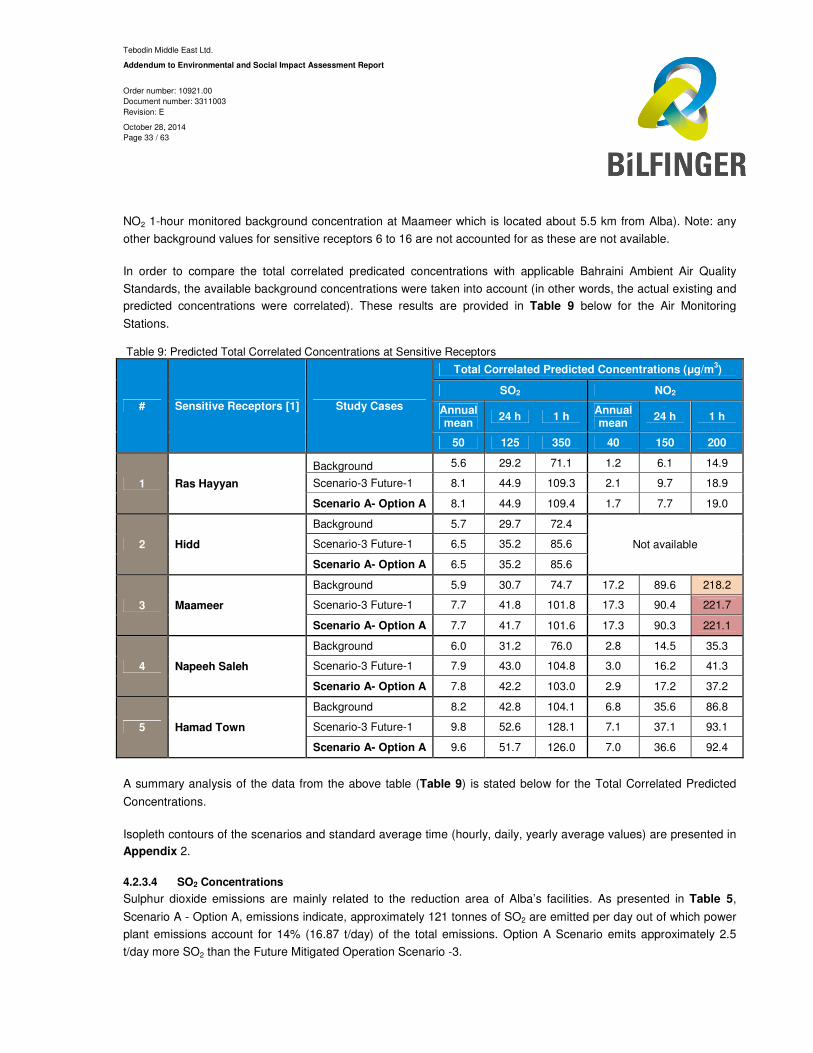
In order to compare the total correlated predicated concentrations with applicable Bahraini Ambient Air Quality
Standards, the available background concentrations were taken into account (in other words, the actual existing and
predicted concentrations were correlated). These results are provided in Table 9 below for the Air Monitoring
Stations.
Table 9: Predicted Total Correlated Concentrations at Sensitive Receptors
# Sensitive Receptors [1] Study Cases
Total Correlated Predicted Concentrations (µg/m3)
SO2 NO2
Annual mean
24 h 1 h Annual mean
24 h 1 h
50 125 350 40 150 200
1 Ras Hayyan
Background 5.6 29.2 71.1 1.2 6.1 14.9
Scenario-3 Future-1 8.1 44.9 109.3 2.1 9.7 18.9
Scenario A- Option A 8.1 44.9 109.4 1.7 7.7 19.0
2 Hidd
Background 5.7 29.7 72.4
Not available Scenario-3 Future-1 6.5 35.2 85.6
Scenario A- Option A 6.5 35.2 85.6
3 Maameer
Background 5.9 30.7 74.7 17.2 89.6 218.2
Scenario-3 Future-1 7.7 41.8 101.8 17.3 90.4 221.7
Scenario A- Option A 7.7 41.7 101.6 17.3 90.3 221.1
4 Napeeh Saleh
Background 6.0 31.2 76.0 2.8 14.5 35.3
Scenario-3 Future-1 7.9 43.0 104.8 3.0 16.2 41.3
Scenario A- Option A 7.8 42.2 103.0 2.9 17.2 37.2
5 Hamad Town
Background 8.2 42.8 104.1 6.8 35.6 86.8
Scenario-3 Future-1 9.8 52.6 128.1 7.1 37.1 93.1
Scenario A- Option A 9.6 51.7 126.0 7.0 36.6 92.4
A summary analysis of the data from the above table (Table 9) is stated below for the Total Correlated Predicted
Concentrations.
Isopleth contours of the scenarios and standard average time (hourly, daily, yearly average values) are presented in
Appendix 2.
4.2.3.4 SO2 Concentrations
Sulphur dioxide emissions are mainly related to the reduction area of Alba’s facilities. As presented in Table 5,
Scenario A - Option A, emissions indicate, approximately 121 tonnes of SO2 are emitted per day out of which power
plant emissions account for 14% (16.87 t/day) of the total emissions. Option A Scenario emits approximately 2.5
t/day more SO2 than the Future Mitigated Operation Scenario -3.
Tebodin Middle East Ltd.
Addendum to Environmental and Social Impact Assessment Report
Order number: 10921.00
Document number: 3311003
Revision: E
October 28, 2014
Page 34 / 63
4.2.3.4.1 1-Hour Average Concentrations
The maximum predicted 1-hour average SO2 concentration based on contribution of Alba to the regional background
for Option A, is at Ras Hayyan (located downwind of the project site) at 91 µg SO2 /m3. The background
concentration at this monitoring station is 71 µg SO2 /m3. The correlated emissions at Ras Hayyan based on Option
A operating conditions is 109.4 µg SO2 /m3, which is similar to Scenario 3 (109.3 µg SO2 /m3) and which is well
below the Bahraini AAQS (350 µg SO2 /m3).
As shown in Table 6 presenting the maximum concentrations by Alba alone, future maximum 1-hour average
concentrations caused by Alba alone is 430 µg SO2/m3 (Scenario 3), while Option A scenario predicts 429 µg
SO2/m3. The maximum ground level concentration for Option A (Scenario A) conditions, is projected to increase by
approximately 43% compared to the existing operations.
4.2.3.4.2 24-Hour Average Concentrations
The maximum predicted 24-hour average SO2 concentration based on contribution of Alba to the regional
background for Scenario A - Option A, is 176 µg SO2 /m3, which is 41% higher than the Bahraini AAQS for 125 µg
SO2 /m3. The maximum recorded contribution was recorded at Ras Hayyan. The maximum predicted concentration
contribution of Alba alone at Ras Hayyan is 37.3 µg SO2 /m3. The background concentration at Ras Hayyan
monitoring station is 29.2 µg SO2 /m3 and the corresponding correlated emissions based on Option A operating
conditions is 44.9 µg SO2 /m3, which is similar to Scenario 3 (44.9 µg SO2 /m
3) and is well below the Bahraini AAQS
(125 µg SO2 /m3).
The 24-hour average maximum concentration is predicted to be within 1 km distance from the boundary line, which
is consistent with the hourly predicted concentration. SO2 concentrations are predicted to increase by 43 % for
Option A compared to the baseline conditions.
4.2.3.4.3 Annual Mean Concentrations
As shown in Table 6, annual predicated SO2 concentrations were found to be below the stipulated Bahraini AAQS
(50 µg SO2 /m3). The highest predicted annual SO2 concentration for Option A is 28 µg/m3 while 26 µg SO2 /m
3 for
Scenario-3.
4.2.3.5 NO2 Concentrations
It is predicted that Nitrogen Dioxide (NO2) emissions will be in compliance with the applicable Bahrain Ambient Air
Quality Standards. However, monitored background concentrations indicate that hourly values for NO2 are being
exceeded at Maameer (218 µg/m3 vs standard of 200 µg/m3). The modelling study predicted an over prediction of
the NO2 concentration at the receptors and the correlated predicted values as given in Table 9 have been corrected
to the baseline concentration.
As stated in Table 6, Alba’s existing contribution to the maximum recorded hourly air quality of 218 µg/m3 at
Maameer is only 7% (14.55 µg/m3). This means that other sources (industrial facilities, traffic) are causing the
majority of the NO2 emissions in the Maameer area.
Tebodin Middle East Ltd.
Addendum to Environmental and Social Impact Assessment Report
Order number: 10921.00
Document number: 3311003
Revision: E
October 28, 2014
Page 35 / 63
4.2.3.5.1 1-Hour Average Concentrations
The maximum predicted 1-hour NO2 concentration from Alba’s Option A operations is 110 µg/m3 along the facility
fence line, which is less than the 1-hour Average Bahraini AAQS of 200 µg/m3. The maximum predicted
concentration would be 4% less than the maximum predicted concentration during Scenario 3.
The total correlated hourly NO2 concentrations at Maameer will increase by 8 % for Option A (17.5 µg NO2 /m3).
Overall, the total correlated maximum hourly NO2 values will increase by 4 % for Option A, which is comparable to
Scenario 3.
4.2.3.5.2 24-Hour Average Concentrations
The maximum 24-hour NO2 concentration from Alba’s Option A operations is predicted to be 20 µg/m3 along the
facility fence line, which is less than Bahraini 24-hour Average AAQS of 150 µg/m3. The maximum contribution of
Alba future Option A operations is at Ras Hayyan Monitoring Station, where a maximum correlated contribution is
7.7 µg/m3.
4.2.3.5.3 Annual Mean Concentrations
As shown in Table 6, annual predicated NO2 concentrations were found to be below the stipulated Bahraini AAQS
(40 µg /m3). The maximum predicted annual NO2 concentration by Alba alone for the baseline conditions is 3 µg /m3,
3 µg /m3, 4 µg /m3 for Option A, Scenario 2 and Scenario-3 respectively.
4.2.3.6 Impact on nearby industrial facilities
The study conducted indicated that there would be no impact on the local air quality for HF and PM10 due to the
operations of the Power Station 5 (PS5). The total predicted SO2 concentrations will be above the ambient air quality
standards near the vicinity of Alba, which is concurrent with the Scenario-3 studied as a part of the ESIA. Since
these areas are used by industrial facilities where people will be present only during working hours, Ambient Air
Quality Standards are not directly applicable. Bahraini AAQS are applicable for locations such as hospitals, schools,
and residential areas of continuous exposure. Evaluation and impact of the air pollutants on the health has been
described in the Section of the health aspect of the study has been reported in Section 6.2.4.
4.2.3.7 Compliance with the 2030 National Land Use Strategy
In conjunction with the Bahrain’s National Land Use Strategy, the pollutants which are expected to exceed the
Bahrain AAQS were plotted on the 2030 Land Use Strategy Map (isopleth contour are presented in Appendix 2).
Based on the Option A study, 1 hour and 24 hour average SO2 concentrations were plotted. In addition, yearly
average data for HF was plotted on the 2030 map as well. As predicted in the Section 4.2.3.4.1 and 4.2.3.4.2, the
exceedances were located within the proposed 2030 industrial area, which is located southwest of Alba. It has been
identified that all exceedances are located within the area earmarked as industrial area. No impact to the residential
or environmentally sensitive receptors would result from the emissions from Alba upon operation of Option A.
Tebodin Middle East Ltd.
Addendum to Environmental and Social Impact Assessment Report
Order number: 10921.00
Document number: 3311003
Revision: E
October 28, 2014
Page 36 / 63
This however, does not consider the cumulative impacts to air quality caused by the following activities as indicated
on the 2030 Land Use Strategy Map:
� Expansion of heavy industry north and east of Alba
� Quarry south of Alba
� Proposed Bahrain – Qatar Causeway
Currently no details on these activities are available, nor to which extent these activities will be developed. However,
it can be assumed that the increased industrial activities and increased traffic travelling to and from the industrial
areas and on the Bahrain – Qatar causeway will have a detrimental impact on air quality for parameters such as SOx,
NOx, PM10 in Alba’s surroundings.
Tebodin Middle East Ltd.
Addendum to Environmental and Social Impact Assessment Report
Order number: 10921.00
Document number: 3311003
Revision: E
October 28, 2014
Page 37 / 63
4.3 Water
4.3.1 Construction Phase
The construction activities, related to the new design, resulting in the generation of waste water are unchanged from
the previous assessed situation. Dewatering is anticipated for the same location (Vertical Direct Chill (VDC) pit) and
likewise it is assumed that waste water during construction phase will be collected in holding tanks and periodically
disposed-off by approved waste collectors. Also, the waste water will not be connected to Alba’s existing waste
water systems and will be disposed-off in a manner complaint with the applicable Bahraini regulations and
standards.
It is to be noted that details with regards to quantities are currently not available. Therefore no quantitative
assessment with relation to the construction of the current and previous design was carried out.
4.3.2 Operation Phase
Similar to the previous design, the additional make-up water demand for PS 5 will be supplied from the calciner plant
or from the water storage tanks during the calciner shutdown.
Originally, an additional water consumption of approximately fifteen (15) m3 per hour was anticipated for PS 5 for the
boiler feed water as well as for cooling purposes of the two (2) F class units. As PS 2 will be shut-down in the
changed design, it is envisioned that the water consumption remains, or is less than, fifteen (15) m3 per hour.
Therefore, no change in impacts on water usage is expected, except for the type of water being utilized (water from
calciner versus groundwater).
4.4 Soil and Groundwater
4.4.1 Construction Phase
As the nature of construction activities will remain unchanged, no additional impacts are expected for the impact on
physical changes of soil. Also, the impact from excavation on groundwater will remain the same, as the location will
remain unchanged – as indicated in the ESIA, given the depth of the groundwater (between 15 and 18m) at the
proposed facility, and the extent of the excavations, it is unlikely that there will be any direct impact on groundwater
as a result of excavations.
Moreover, impacts related to chemical changes of soil are of similar nature. Considering implementation of
management measures (advised in the ESIA) to reduce the threat of accidental spillage during the construction
phase, no additional impact is envisioned.
Tebodin Middle East Ltd.
Addendum to Environmental and Social Impact Assessment Report
Order number: 10921.00
Document number: 3311003
Revision: E
October 28, 2014
Page 38 / 63
4.4.2 Operation Phase
Similar, no changes to the physical properties of soil are expected during operations. However, during operations,
storage of chemicals and wastes has the potential to impact the quality of the soil.
In the new design, potential spills from the diesel storage tank required for the black start have the potential for soil
contamination. Therefore, soil protection measures – a bund or wall sized for 100 per cent (%) of tank capacity plus
water quantity to create foam - have been incorporated in the design.
Presently, groundwater is used as process water for PS2. However, as PS 2 will no longer be operated the impact
from groundwater abstraction will reduce as a result of the new design.
Taken the above in consideration, no additional impacts on soil and groundwater are expected.
4.5 Ecology
Similar to the previous design, the expansion will occur within Alba’s industrial site which has little ecological value.
The proposed location of the off-site construction lay-down areas west of the existing Alba facility will remain at the
same location. As shown earlier, neither of the areas is of a high ecological value.
Again, the construction phase activities will have an impact on existing ecological features. However, it is assumed
that after proper site restoration, the site can be restored to conditions similar to current conditions.
Therefore, impacts during the construction phase are again considered to be marginal, as long as the sites are
restored as much as possible to their original condition.
4.6 Energy Use
4.6.1 Construction Phase
The source and peak requirement of fuel and electrical power will remain the same and is as follows:
� Construction power will, in general, be provided from the existing plant distribution system;
� The peak construction load including temporary site lighting is estimated at 5 MW; and
� The peak construction load for PS5 is approximately 2-3 MW.
As shown before, this figure is insignificant compared to the total installed capacity and will thus have a marginal
impact on electrical energy use.
The extra fuel quantities (diesel and gasoline), required for onsite machinery during the additional three months
construction period, will not have a significant impact on total energy use.
Tebodin Middle East Ltd.
Addendum to Environmental and Social Impact Assessment Report
Order number: 10921.00
Document number: 3311003
Revision: E
October 28, 2014
Page 39 / 63
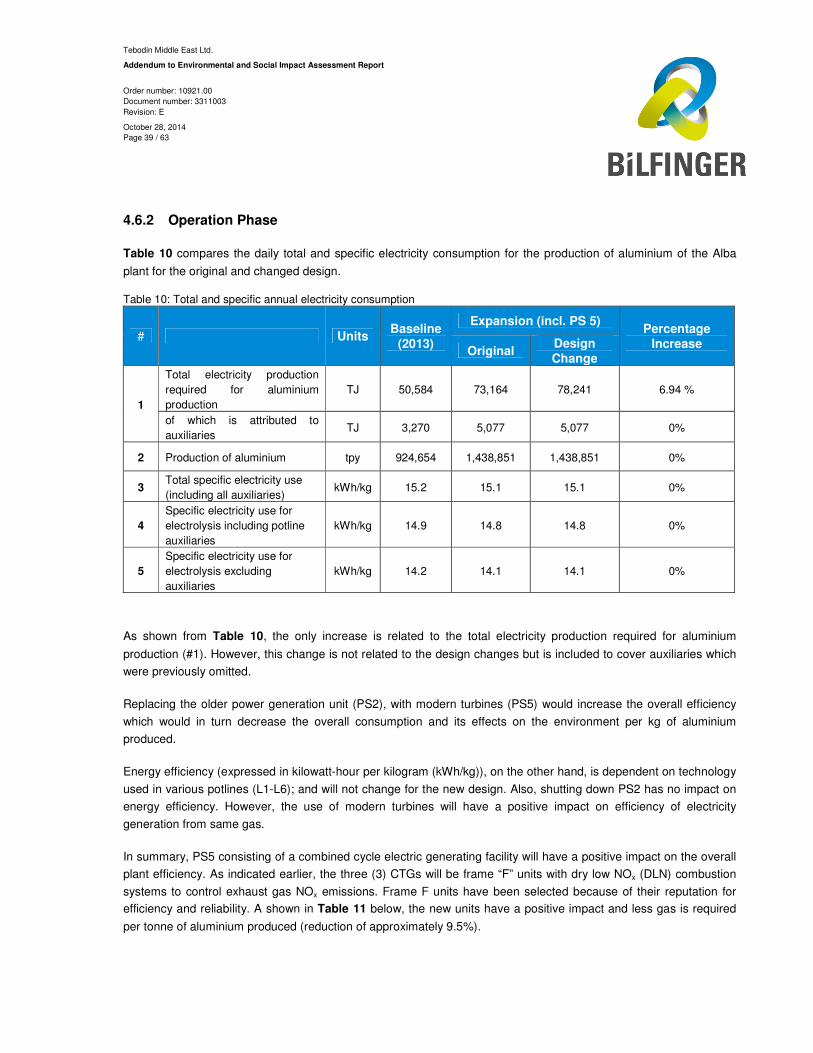
4.6.2 Operation Phase
Table 10 compares the daily total and specific electricity consumption for the production of aluminium of the Alba
plant for the original and changed design.
Table 10: Total and specific annual electricity consumption
# Units Baseline
(2013)
Expansion (incl. PS 5) Percentage
Increase Original
Design
Change
1
Total electricity production
required for aluminium
production
TJ 50,584 73,164 78,241 6.94 %
of which is attributed to
auxiliaries TJ 3,270 5,077 5,077 0%
2 Production of aluminium tpy 924,654 1,438,851 1,438,851 0%
3 Total specific electricity use
(including all auxiliaries) kWh/kg 15.2 15.1 15.1 0%
4
Specific electricity use for
electrolysis including potline
auxiliaries
kWh/kg 14.9 14.8 14.8 0%
5
Specific electricity use for
electrolysis excluding
auxiliaries
kWh/kg 14.2 14.1 14.1 0%
As shown from Table 10, the only increase is related to the total electricity production required for aluminium
production (#1). However, this change is not related to the design changes but is included to cover auxiliaries which
were previously omitted.
Replacing the older power generation unit (PS2), with modern turbines (PS5) would increase the overall efficiency
which would in turn decrease the overall consumption and its effects on the environment per kg of aluminium
produced.
Energy efficiency (expressed in kilowatt-hour per kilogram (kWh/kg)), on the other hand, is dependent on technology
used in various potlines (L1-L6); and will not change for the new design. Also, shutting down PS2 has no impact on
energy efficiency. However, the use of modern turbines will have a positive impact on efficiency of electricity
generation from same gas.
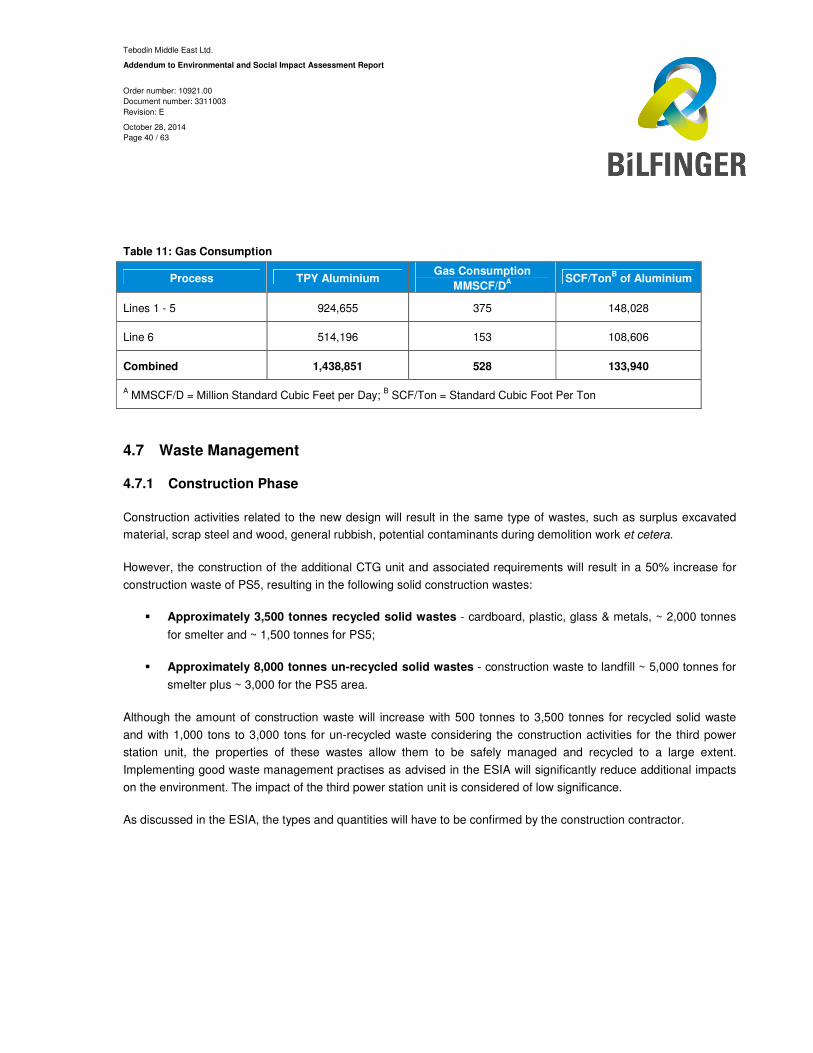
In summary, PS5 consisting of a combined cycle electric generating facility will have a positive impact on the overall
plant efficiency. As indicated earlier, the three (3) CTGs will be frame “F” units with dry low NOx (DLN) combustion
systems to control exhaust gas NOx emissions. Frame F units have been selected because of their reputation for
efficiency and reliability. A shown in Table 11 below, the new units have a positive impact and less gas is required
per tonne of aluminium produced (reduction of approximately 9.5%).
Tebodin Middle East Ltd.
Addendum to Environmental and Social Impact Assessment Report
Order number: 10921.00
Document number: 3311003
Revision: E
October 28, 2014
Page 40 / 63
Table 11: Gas Consumption
Process TPY Aluminium Gas Consumption
MMSCF/DA SCF/Ton
B of Aluminium
Lines 1 - 5 924,655 375 148,028
Line 6 514,196 153 108,606
Combined 1,438,851 528 133,940
A MMSCF/D = Million Standard Cubic Feet per Day;
B SCF/Ton = Standard Cubic Foot Per Ton
4.7 Waste Management
4.7.1 Construction Phase
Construction activities related to the new design will result in the same type of wastes, such as surplus excavated
material, scrap steel and wood, general rubbish, potential contaminants during demolition work et cetera.
However, the construction of the additional CTG unit and associated requirements will result in a 50% increase for
construction waste of PS5, resulting in the following solid construction wastes:
� Approximately 3,500 tonnes recycled solid wastes - cardboard, plastic, glass & metals, ~ 2,000 tonnes
for smelter and ~ 1,500 tonnes for PS5;
� Approximately 8,000 tonnes un-recycled solid wastes - construction waste to landfill ~ 5,000 tonnes for
smelter plus ~ 3,000 for the PS5 area.
Although the amount of construction waste will increase with 500 tonnes to 3,500 tonnes for recycled solid waste
and with 1,000 tons to 3,000 tons for un-recycled waste considering the construction activities for the third power
station unit, the properties of these wastes allow them to be safely managed and recycled to a large extent.
Implementing good waste management practises as advised in the ESIA will significantly reduce additional impacts
on the environment. The impact of the third power station unit is considered of low significance.
As discussed in the ESIA, the types and quantities will have to be confirmed by the construction contractor.
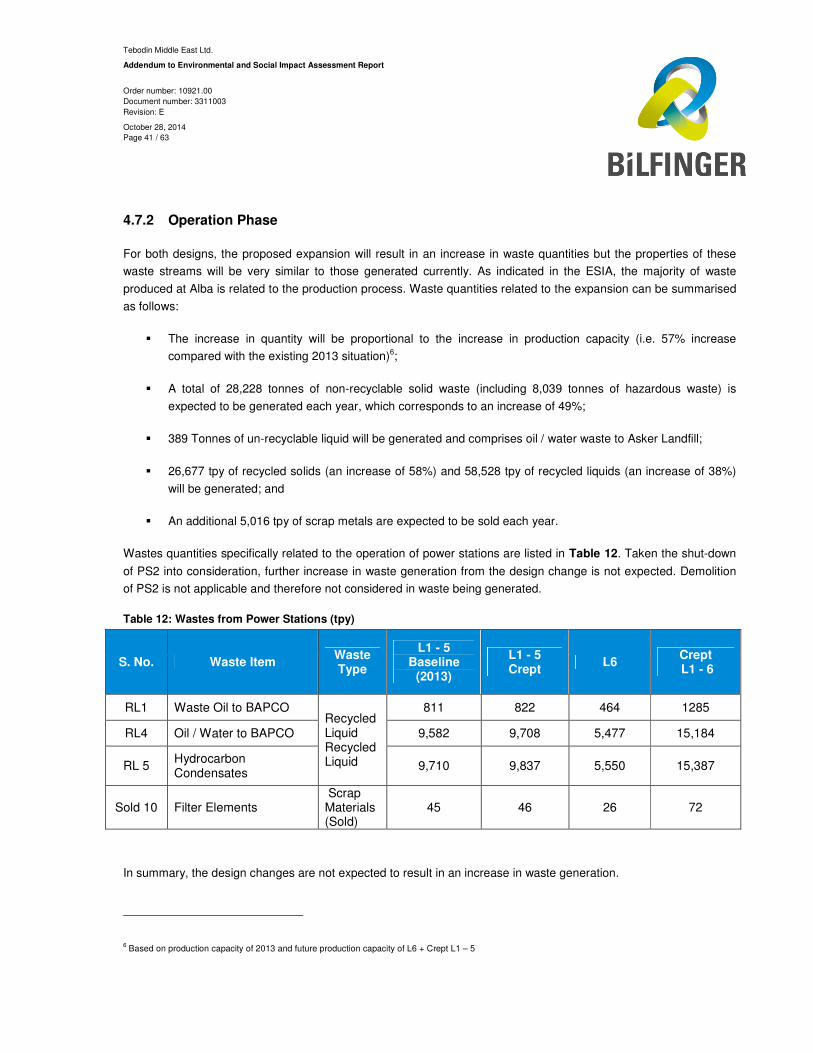
Tebodin Middle East Ltd.
Addendum to Environmental and Social Impact Assessment Report
Order number: 10921.00
Document number: 3311003
Revision: E
October 28, 2014
Page 41 / 63
4.7.2 Operation Phase
For both designs, the proposed expansion will result in an increase in waste quantities but the properties of these
waste streams will be very similar to those generated currently. As indicated in the ESIA, the majority of waste
produced at Alba is related to the production process. Waste quantities related to the expansion can be summarised
as follows:
� The increase in quantity will be proportional to the increase in production capacity (i.e. 57% increase
compared with the existing 2013 situation)6;
� A total of 28,228 tonnes of non-recyclable solid waste (including 8,039 tonnes of hazardous waste) is
expected to be generated each year, which corresponds to an increase of 49%;
� 389 Tonnes of un-recyclable liquid will be generated and comprises oil / water waste to Asker Landfill;
� 26,677 tpy of recycled solids (an increase of 58%) and 58,528 tpy of recycled liquids (an increase of 38%)
will be generated; and
� An additional 5,016 tpy of scrap metals are expected to be sold each year.
Wastes quantities specifically related to the operation of power stations are listed in Table 12. Taken the shut-down
of PS2 into consideration, further increase in waste generation from the design change is not expected. Demolition
of PS2 is not applicable and therefore not considered in waste being generated.
Table 12: Wastes from Power Stations (tpy)
S. No. Waste Item Waste Type
L1 - 5 Baseline
(2013)
L1 - 5 Crept
L6 Crept L1 - 6
RL1 Waste Oil to BAPCO Recycled Liquid Recycled Liquid
811 822 464 1285
RL4 Oil / Water to BAPCO 9,582 9,708 5,477 15,184
RL 5 Hydrocarbon Condensates
9,710 9,837 5,550 15,387
Sold 10 Filter Elements Scrap Materials (Sold)
45 46 26 72
In summary, the design changes are not expected to result in an increase in waste generation.
6 Based on production capacity of 2013 and future production capacity of L6 + Crept L1 – 5
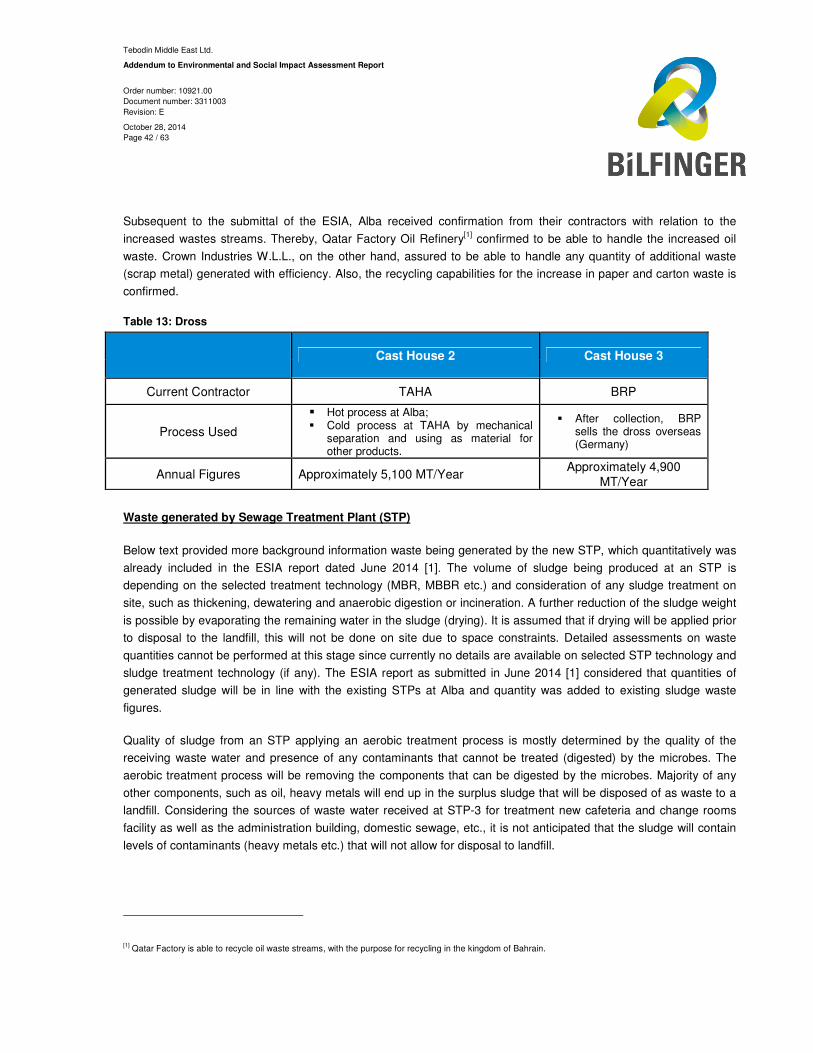
Tebodin Middle East Ltd.
Addendum to Environmental and Social Impact Assessment Report
Order number: 10921.00
Document number: 3311003
Revision: E
October 28, 2014
Page 42 / 63
Subsequent to the submittal of the ESIA, Alba received confirmation from their contractors with relation to the
increased wastes streams. Thereby, Qatar Factory Oil Refinery[1] confirmed to be able to handle the increased oil
waste. Crown Industries W.L.L., on the other hand, assured to be able to handle any quantity of additional waste
(scrap metal) generated with efficiency. Also, the recycling capabilities for the increase in paper and carton waste is
confirmed.
Table 13: Dross
Cast House 2 Cast House 3
Current Contractor TAHA BRP
Process Used
� Hot process at Alba; � Cold process at TAHA by mechanical
separation and using as material for other products.
� After collection, BRP sells the dross overseas (Germany)
Annual Figures Approximately 5,100 MT/Year Approximately 4,900
MT/Year
Waste generated by Sewage Treatment Plant (STP)
Below text provided more background information waste being generated by the new STP, which quantitatively was
already included in the ESIA report dated June 2014 [1]. The volume of sludge being produced at an STP is
depending on the selected treatment technology (MBR, MBBR etc.) and consideration of any sludge treatment on
site, such as thickening, dewatering and anaerobic digestion or incineration. A further reduction of the sludge weight
is possible by evaporating the remaining water in the sludge (drying). It is assumed that if drying will be applied prior
to disposal to the landfill, this will not be done on site due to space constraints. Detailed assessments on waste
quantities cannot be performed at this stage since currently no details are available on selected STP technology and
sludge treatment technology (if any). The ESIA report as submitted in June 2014 [1] considered that quantities of
generated sludge will be in line with the existing STPs at Alba and quantity was added to existing sludge waste
figures.
Quality of sludge from an STP applying an aerobic treatment process is mostly determined by the quality of the
receiving waste water and presence of any contaminants that cannot be treated (digested) by the microbes. The
aerobic treatment process will be removing the components that can be digested by the microbes. Majority of any
other components, such as oil, heavy metals will end up in the surplus sludge that will be disposed of as waste to a
landfill. Considering the sources of waste water received at STP-3 for treatment new cafeteria and change rooms
facility as well as the administration building, domestic sewage, etc., it is not anticipated that the sludge will contain
levels of contaminants (heavy metals etc.) that will not allow for disposal to landfill.
[1]
Qatar Factory is able to recycle oil waste streams, with the purpose for recycling in the kingdom of Bahrain.
Tebodin Middle East Ltd.
Addendum to Environmental and Social Impact Assessment Report
Order number: 10921.00
Document number: 3311003
Revision: E
October 28, 2014
Page 43 / 63
4.8 Traffic
4.8.1 Construction Phase
All construction activities will start two (2) months later and the overall construction schedule (L6 and PS5) will
extend (3) months further than indicated in previous ESIA report. The peak and average of construction workers
remain unchanged; however, the peak construction activities for PS5 will start as previously planned and lasts for
two (2) months longer than in the previous study of June 2014 [1].
There will be no change in routing and logistics of construction traffic. Due to the fact that the peak construction
phase for PS5 will be extended with 2 months, the traffic intensity will increase from 90 vehicles per day, six days
per week to 180 vehicles per day, six days per week during these two additional months of peak PS5 construction.
The total traffic (860 and 575 vehicles per day during peak and non-peak construction respectively) is not expected
to change. However, due to the extended overall construction period (plus one month) and extended peak
construction period (plus two months) the cumulative amount of traffic will increase slightly.
4.8.2 Operation Phase
Due to the nature of the design change, the operation of the additional Power Station unit is not expected to result in
any additional traffic.
4.9 Visual
As indicated in the ESIA, the prevailing industrial visual character of Alba and its immediate surrounds will not be
dramatically changed by the proposed expansion. Taken the proposed design changes into consideration, no
additional impacts are expected during construction or operation as:
� The nature of construction activities remains the same;
� The location of the laydown area will be unchanged; and
� The additional CTG unit (PS5C) will be of the same dimensions as two (2) units proposed earlier.
Tebodin Middle East Ltd.
Addendum to Environmental and Social Impact Assessment Report
Order number: 10921.00
Document number: 3311003
Revision: E
October 28, 2014
Page 44 / 63
4.10 Noise
4.10.1 Construction Phase
The additional power station will not change any construction activities or use of construction equipment compared
to the ESIA study submitted in June 2014 [1]. The potential noise sources during the construction phase will be the
same i.e. from construction equipment, DG units, compactors, excavators, construction vehicles, etc. The source
noise levels of construction equipment will be maintained in such a way as to comply with applicable regulatory
requirements. Same noise levels will be generated as considered in the ESIA report (June 2014); however, the
overall construction phase will be extended with one (1) month, and peak construction activity for PS5 will be
extended with two months.
Noise levels during the construction phase, including the construction of a third power station unit are considered not
to have a significant impact on residential receptors.
4.10.2 Operation Phase
A noise modelling study was performed for the expansion with L6 and PS-5 comprising only two F class units. An
updated noise model was prepared considering an additional F class unit south of the proposed two F class units.
Accordingly, a quantitative assessment through noise modelling was conducted as part of ESIA addendum study to
determine the additional contributions to the ambient noise levels from the proposed expansion project.
4.10.2.1 Noise Modelling
The noise modelling for evaluation of noise contributions was conducted using SoundPLAN developed by
Braunstein & Berndt GmbH, Germany. The model is based on sound pressure wave divergence. SoundPLAN is a
Microsoft Windows based software tool, which can accept multiple stationary noise sources.
4.10.2.2 Noise Emission Inventory
The various noise generating sources identified and utilised for modelling are as presented in Appendix 3.
4.10.2.3 Noise Modelling Results – Operation phase
Figure 3 and Figure 4 below provide the overview of Noise Contributions from Alba (baseline noise levels inclusive
of L-6 operations) to the surroundings. The noise contributions include traffic movements to and from the site and on
site. The different colours indicate the noise levels in dB (A).
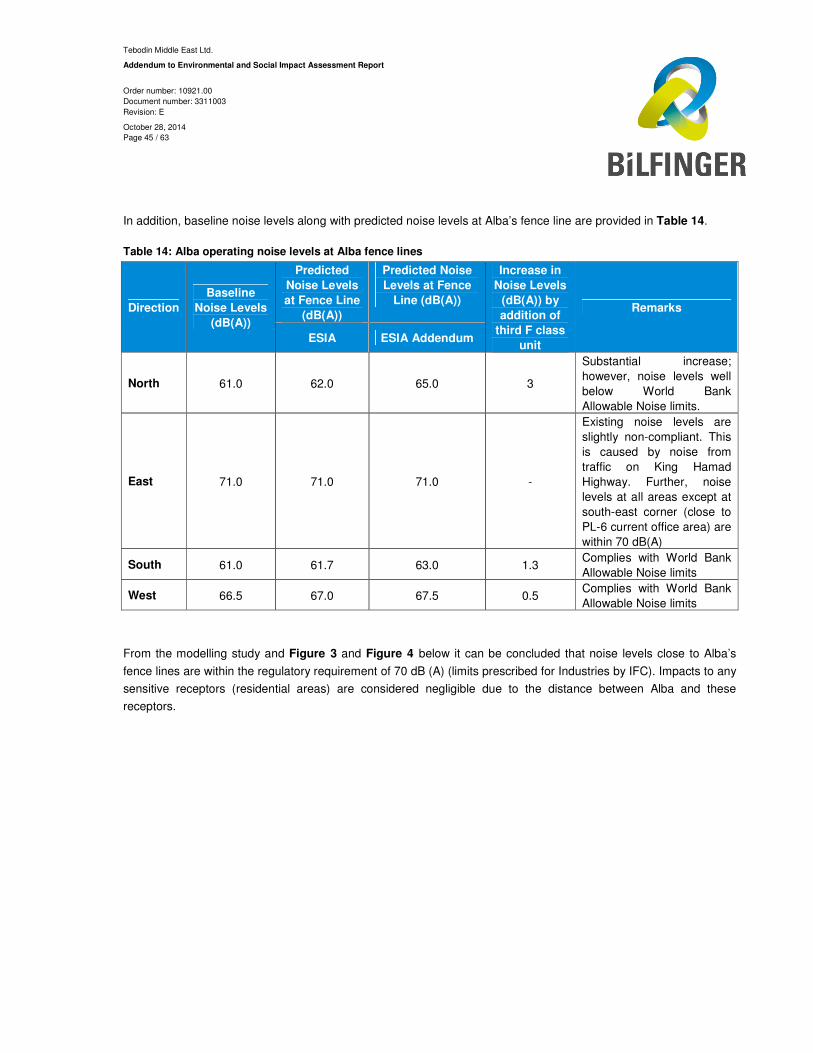
Tebodin Middle East Ltd.
Addendum to Environmental and Social Impact Assessment Report
Order number: 10921.00
Document number: 3311003
Revision: E
October 28, 2014
Page 45 / 63
In addition, baseline noise levels along with predicted noise levels at Alba’s fence line are provided in Table 14.
Table 14: Alba operating noise levels at Alba fence lines
Direction
Baseline
Noise Levels
(dB(A))
Predicted
Noise Levels
at Fence Line
(dB(A))
Predicted Noise
Levels at Fence
Line (dB(A))
Increase in
Noise Levels
(dB(A)) by
addition of
third F class
unit
Remarks
ESIA ESIA Addendum
North 61.0 62.0 65.0 3
Substantial increase;
however, noise levels well
below World Bank
Allowable Noise limits.
East 71.0 71.0 71.0 -
Existing noise levels are
slightly non-compliant. This
is caused by noise from
traffic on King Hamad
Highway. Further, noise
levels at all areas except at
south-east corner (close to
PL-6 current office area) are
within 70 dB(A)
South 61.0 61.7 63.0 1.3 Complies with World Bank
Allowable Noise limits
West 66.5 67.0 67.5 0.5 Complies with World Bank
Allowable Noise limits
From the modelling study and Figure 3 and Figure 4 below it can be concluded that noise levels close to Alba’s
fence lines are within the regulatory requirement of 70 dB (A) (limits prescribed for Industries by IFC). Impacts to any
sensitive receptors (residential areas) are considered negligible due to the distance between Alba and these
receptors.

Tebodin Middle East Ltd.
Addendum to Environmental and Social Impact Assessment Report
Order number: 10921.00
Document number: 3311003
Revision: E
October 28, 2014
Page 46 / 63
This page is intentionally blank.
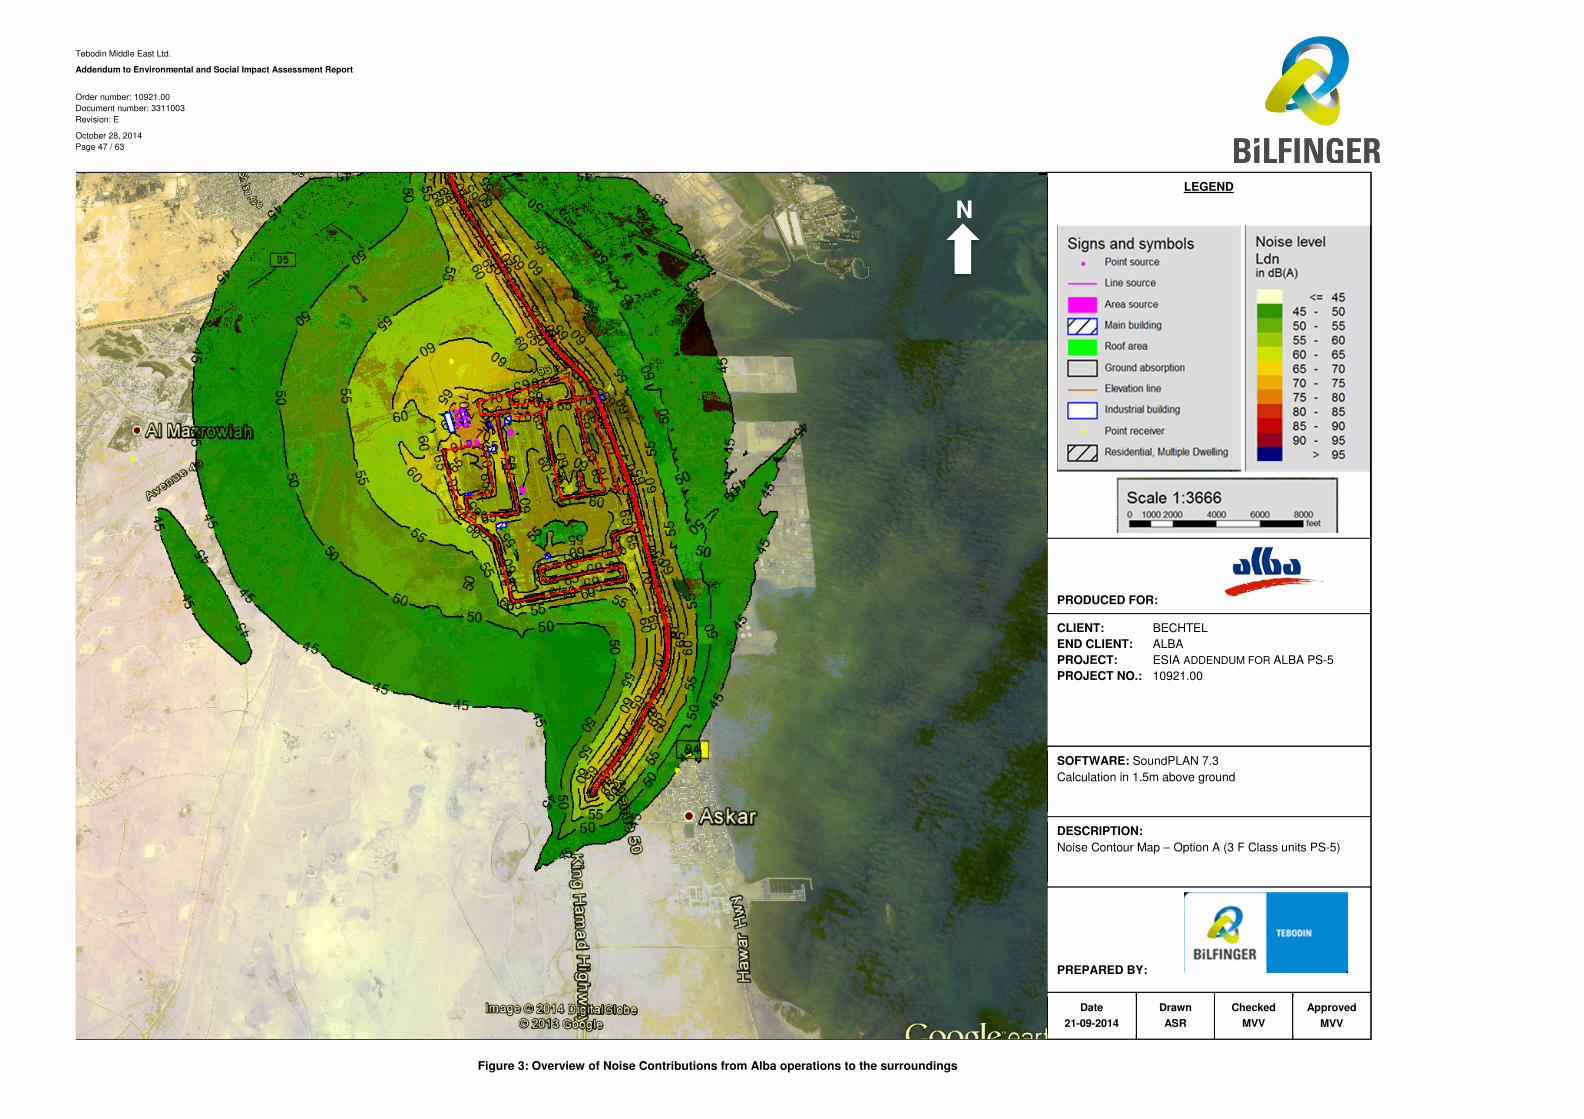
Tebodin Middle East Ltd.
Addendum to Environmental and Social Impact Assessment Report
Order number: 10921.00
Document number: 3311003
Revision: E
October 28, 2014
Page 47 / 63
Figure 3: Overview of Noise Contributions from Alba operations to the surroundings
LEGEND
PRODUCED FOR:
CLIENT: BECHTEL
END CLIENT: ALBA
PROJECT: ESIA ADDENDUM FOR ALBA PS-5
PROJECT NO.: 10921.00
SOFTWARE: SoundPLAN 7.3
Calculation in 1.5m above ground
PREPARED BY:
DESCRIPTION:
Noise Contour Map – Option A (3 F Class units PS-5)
Date
21-09-2014
Approved
MVV
Checked
MVV
Drawn
ASR
N
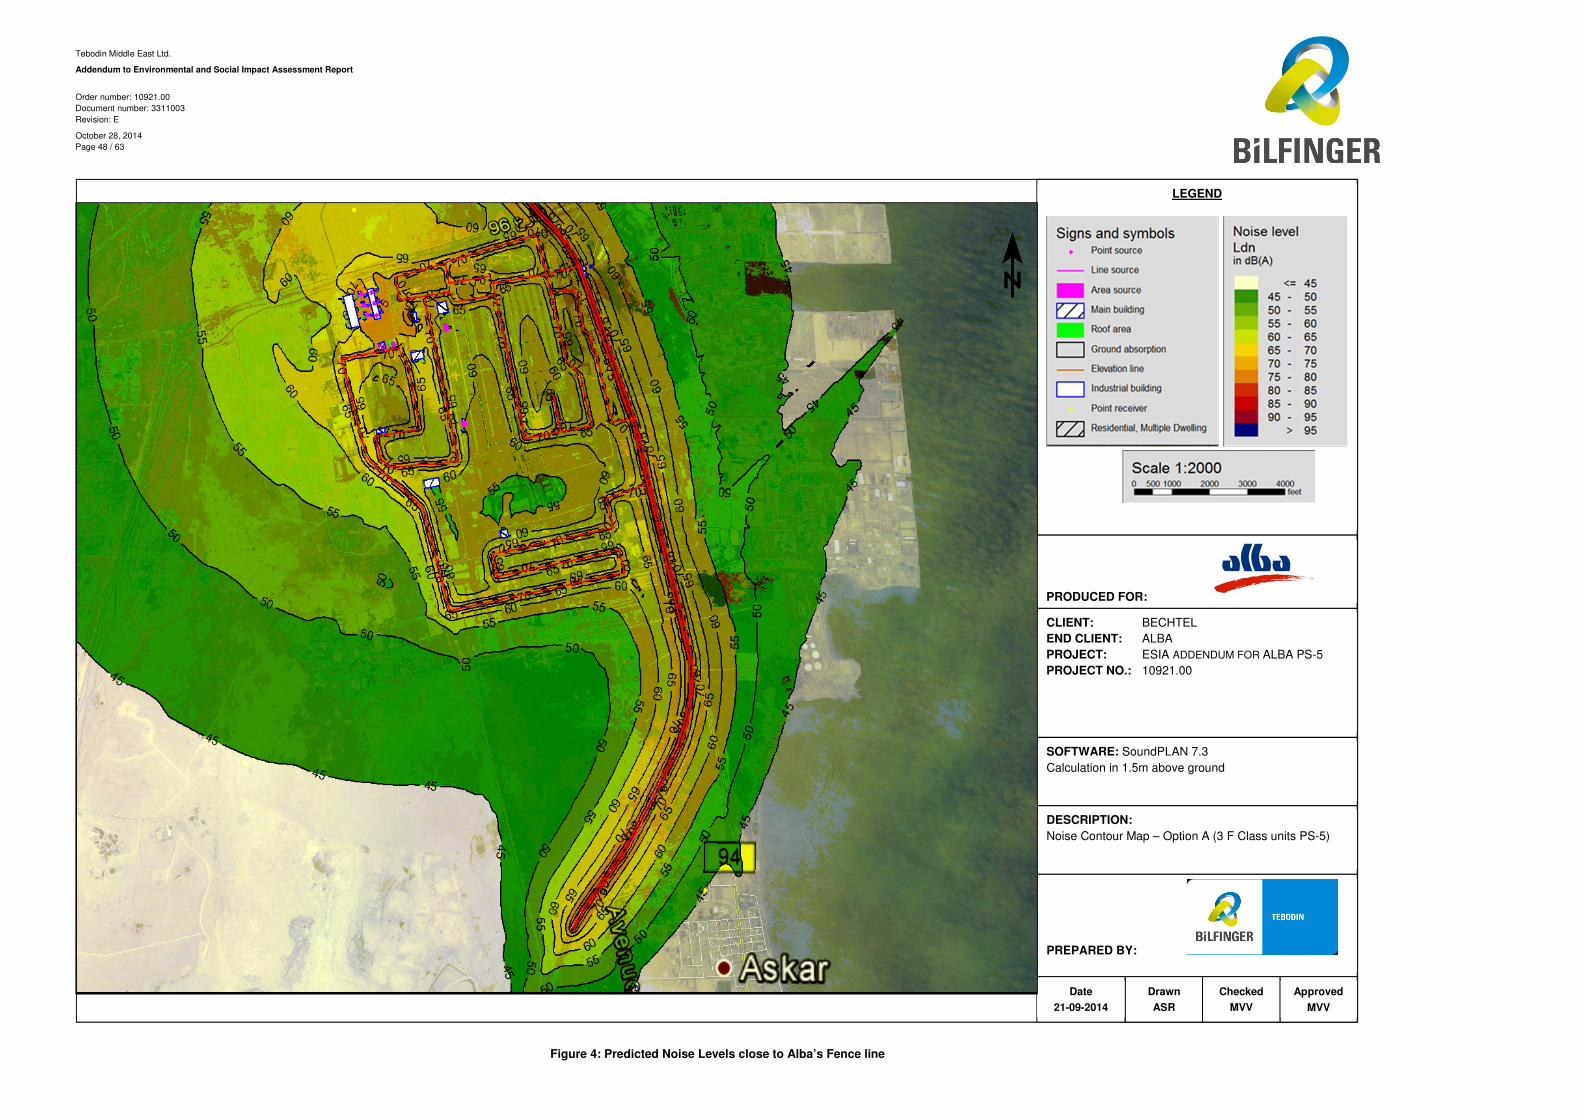
Tebodin Middle East Ltd.
Addendum to Environmental and Social Impact Assessment Report
Order number: 10921.00
Document number: 3311003
Revision: E
October 28, 2014
Page 48 / 63
Figure 4: Predicted Noise Levels close to Alba’s Fence line
LEGEND
PRODUCED FOR:
CLIENT: BECHTEL
END CLIENT: ALBA
PROJECT: ESIA ADDENDUM FOR ALBA PS-5
PROJECT NO.: 10921.00
SOFTWARE: SoundPLAN 7.3
Calculation in 1.5m above ground
PREPARED BY:
DESCRIPTION:
Noise Contour Map – Option A (3 F Class units PS-5)
Date
21-09-2014
Approved
MVV
Checked
MVV
Drawn
ASR
Tebodin Middle East Ltd.
Addendum to Environmental and Social Impact Assessment Report
Order number: 10921.00
Document number: 3311003
Revision: E
October 28, 2014
Page 49 / 63
4.11 Occupational Health and Safety
In line with the ESIA, activities during construction and operations of the proposed expansion present a range of
possible occupational health and safety (OHS) risks.
Again, for the most part occupational health and safety issues are best addressed by ensuring that there are
appropriate management controls in place, which are continually reviewed and improved. An additional control
measure is the use of foam protection7 as fire fighting measure for the new black start (diesel generators) and diesel
storage tank.
Further, no changes with relation to OHS risk are envisioned for the new design.
4.12 Cultural Heritage
Given that the adjusted design will not result in a change in location, and as there are no archaeological or culturally
significant sites in the area proposed for the expansion, the possible impacts of the construction activities on cultural
heritage remain negligible.
4.13 Social and Economic Environment
The ESIA assessed potentially social-economic effects of the proposed expansion in relation to investment benefits
and job creation aspects. Thereby high positive impacts were associated with job creation and contribution to Gross
Domestic Product (GDP), whereas the trade balance during construction was found to be moderately adverse, as a
result of capital outflows for the purchase of materials and equipment.
As indicated earlier (Section 3.1), the employment of craft labour during the construction phase will remain the
same, with the only change of a three month longer construction period. Therefore, the design change will slightly
improve the job opportunities assessed earlier – due to the extended construction period of three months. The
additional permanent employment opportunities at Alba (547 permanent jobs) will remain unchanged.
Considering the above, the effect of the design change on the socio-economic environment is negligible.
7 Based on United States (US) National Fire Protection Association (NFPA) – 11.
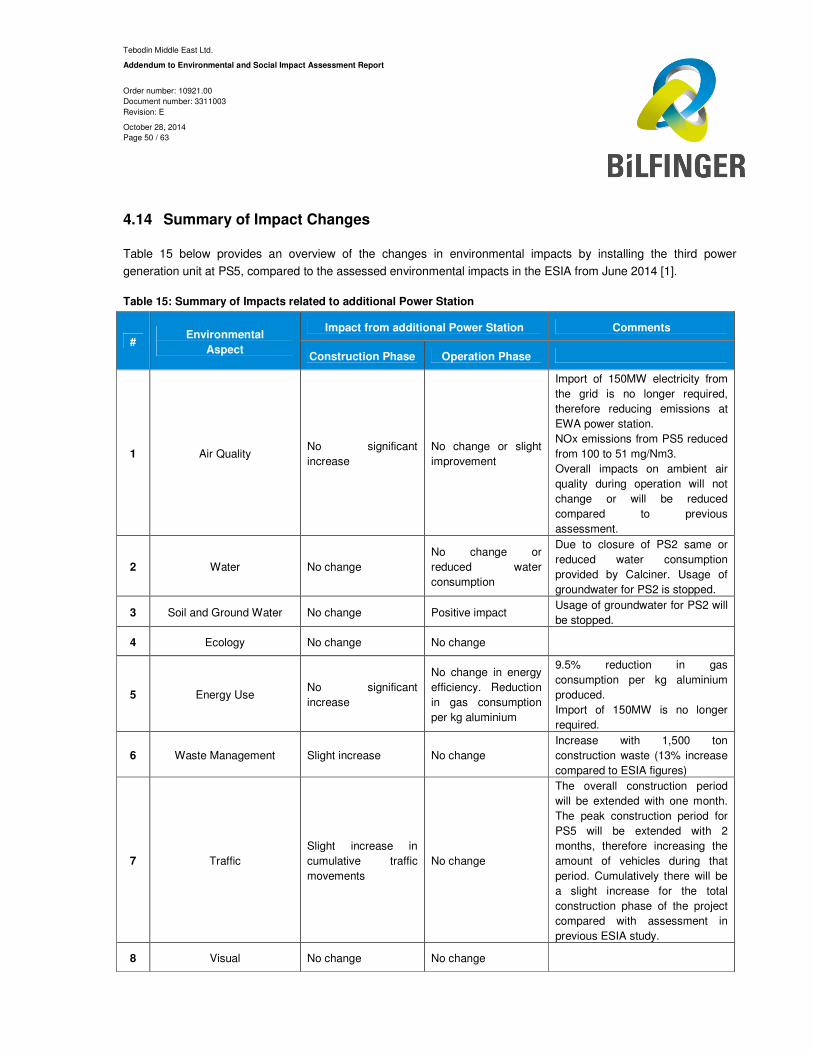
Tebodin Middle East Ltd.
Addendum to Environmental and Social Impact Assessment Report
Order number: 10921.00
Document number: 3311003
Revision: E
October 28, 2014
Page 50 / 63
4.14 Summary of Impact Changes
Table 15 below provides an overview of the changes in environmental impacts by installing the third power
generation unit at PS5, compared to the assessed environmental impacts in the ESIA from June 2014 [1].
Table 15: Summary of Impacts related to additional Power Station
# Environmental
Aspect
Impact from additional Power Station Comments
Construction Phase Operation Phase
1 Air Quality No significant
increase
No change or slight
improvement
Import of 150MW electricity from
the grid is no longer required,
therefore reducing emissions at
EWA power station.
NOx emissions from PS5 reduced
from 100 to 51 mg/Nm3.
Overall impacts on ambient air
quality during operation will not
change or will be reduced
compared to previous
assessment.
2 Water No change
No change or
reduced water
consumption
Due to closure of PS2 same or
reduced water consumption
provided by Calciner. Usage of
groundwater for PS2 is stopped.
3 Soil and Ground Water No change Positive impact Usage of groundwater for PS2 will
be stopped.
4 Ecology No change No change
5 Energy Use No significant
increase
No change in energy
efficiency. Reduction
in gas consumption
per kg aluminium
9.5% reduction in gas
consumption per kg aluminium
produced.
Import of 150MW is no longer
required.
6 Waste Management Slight increase No change
Increase with 1,500 ton
construction waste (13% increase
compared to ESIA figures)
7 Traffic
Slight increase in
cumulative traffic
movements
No change
The overall construction period
will be extended with one month.
The peak construction period for
PS5 will be extended with 2
months, therefore increasing the
amount of vehicles during that
period. Cumulatively there will be
a slight increase for the total
construction phase of the project
compared with assessment in
previous ESIA study.
8 Visual No change No change
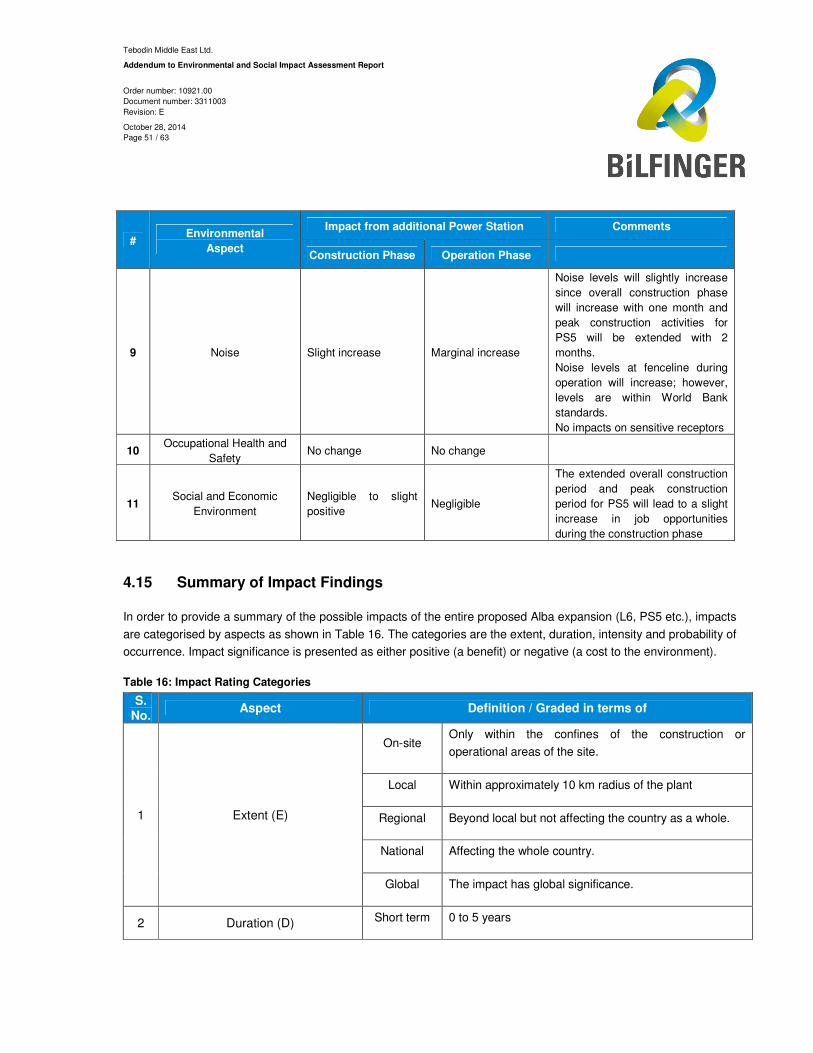
Tebodin Middle East Ltd.
Addendum to Environmental and Social Impact Assessment Report
Order number: 10921.00
Document number: 3311003
Revision: E
October 28, 2014
Page 51 / 63
# Environmental
Aspect
Impact from additional Power Station Comments
Construction Phase Operation Phase
9 Noise Slight increase Marginal increase
Noise levels will slightly increase
since overall construction phase
will increase with one month and
peak construction activities for
PS5 will be extended with 2
months.
Noise levels at fenceline during
operation will increase; however,
levels are within World Bank
standards.
No impacts on sensitive receptors
10 Occupational Health and
Safety No change No change
11 Social and Economic
Environment
Negligible to slight
positive Negligible
The extended overall construction
period and peak construction
period for PS5 will lead to a slight
increase in job opportunities
during the construction phase
4.15 Summary of Impact Findings
In order to provide a summary of the possible impacts of the entire proposed Alba expansion (L6, PS5 etc.), impacts
are categorised by aspects as shown in Table 16. The categories are the extent, duration, intensity and probability of
occurrence. Impact significance is presented as either positive (a benefit) or negative (a cost to the environment).
Table 16: Impact Rating Categories
S.
No. Aspect Definition / Graded in terms of
1 Extent (E)
On-site Only within the confines of the construction or
operational areas of the site.
Local Within approximately 10 km radius of the plant
Regional Beyond local but not affecting the country as a whole.
National Affecting the whole country.
Global The impact has global significance.
2 Duration (D) Short term 0 to 5 years
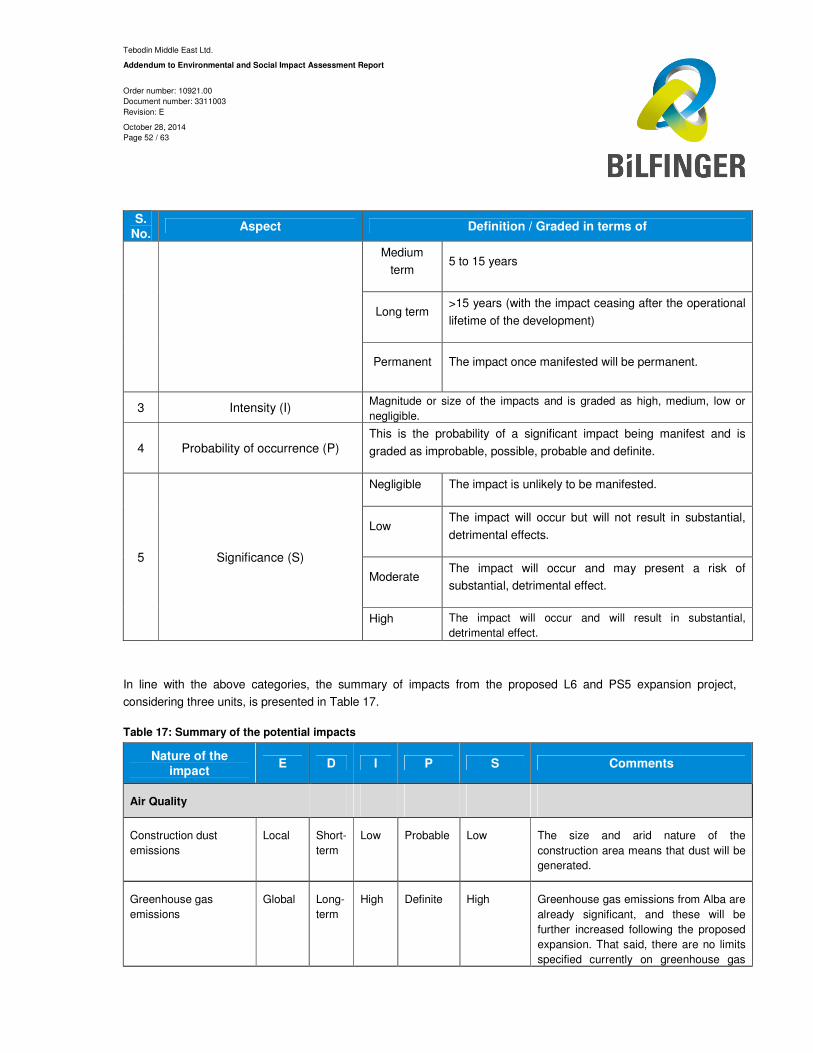
Tebodin Middle East Ltd.
Addendum to Environmental and Social Impact Assessment Report
Order number: 10921.00
Document number: 3311003
Revision: E
October 28, 2014
Page 52 / 63
S.
No. Aspect Definition / Graded in terms of
Medium
term 5 to 15 years
Long term >15 years (with the impact ceasing after the operational
lifetime of the development)
Permanent The impact once manifested will be permanent.
3 Intensity (I) Magnitude or size of the impacts and is graded as high, medium, low or
negligible.
4 Probability of occurrence (P) This is the probability of a significant impact being manifest and is
graded as improbable, possible, probable and definite.
5 Significance (S)
Negligible The impact is unlikely to be manifested.
Low The impact will occur but will not result in substantial,
detrimental effects.
Moderate The impact will occur and may present a risk of
substantial, detrimental effect.
High The impact will occur and will result in substantial,
detrimental effect.
In line with the above categories, the summary of impacts from the proposed L6 and PS5 expansion project,
considering three units, is presented in Table 17.
Table 17: Summary of the potential impacts
Nature of the
impact E D I P S Comments
Air Quality
Construction dust
emissions
Local Short-
term
Low Probable Low The size and arid nature of the
construction area means that dust will be
generated.
Greenhouse gas
emissions
Global Long-
term
High Definite High Greenhouse gas emissions from Alba are
already significant, and these will be
further increased following the proposed
expansion. That said, there are no limits
specified currently on greenhouse gas
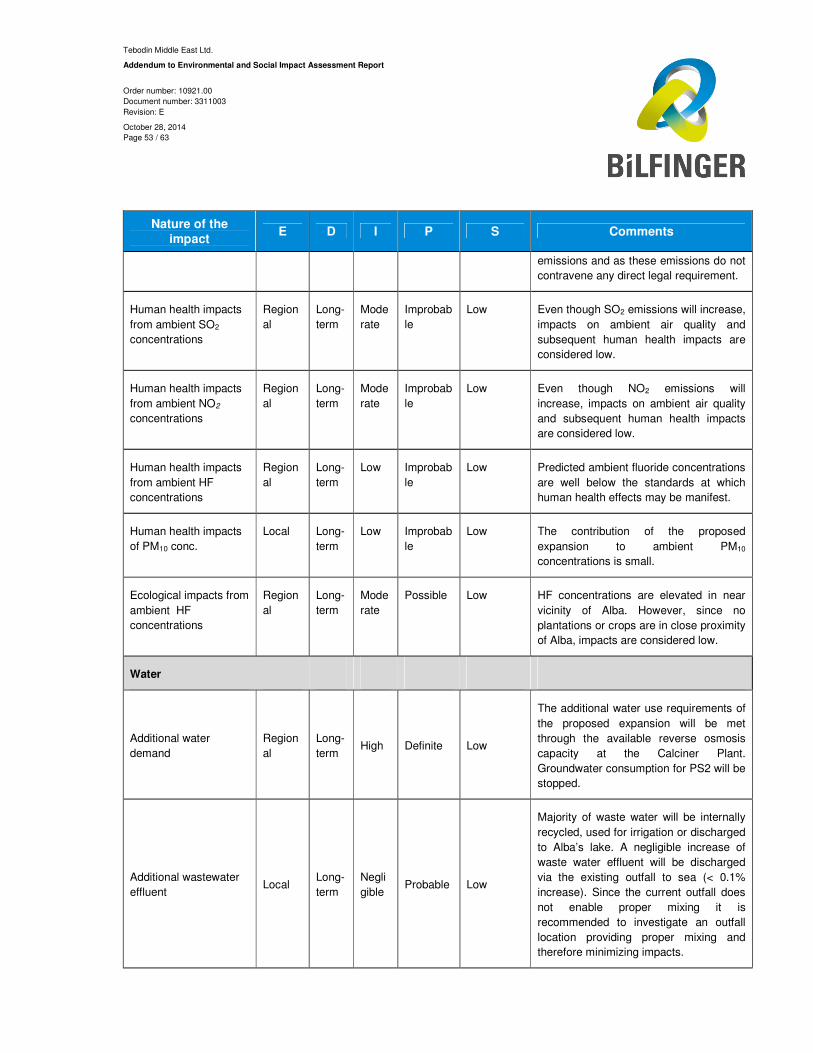
Tebodin Middle East Ltd.
Addendum to Environmental and Social Impact Assessment Report
Order number: 10921.00
Document number: 3311003
Revision: E
October 28, 2014
Page 53 / 63
Nature of the
impact E D I P S Comments
emissions and as these emissions do not
contravene any direct legal requirement.
Human health impacts
from ambient SO2
concentrations
Region
al
Long-
term
Mode
rate
Improbab
le
Low Even though SO2 emissions will increase,
impacts on ambient air quality and
subsequent human health impacts are
considered low.
Human health impacts
from ambient NO2
concentrations
Region
al
Long-
term
Mode
rate
Improbab
le
Low Even though NO2 emissions will
increase, impacts on ambient air quality
and subsequent human health impacts
are considered low.
Human health impacts
from ambient HF
concentrations
Region
al
Long-
term
Low Improbab
le
Low Predicted ambient fluoride concentrations
are well below the standards at which
human health effects may be manifest.
Human health impacts
of PM10 conc.
Local Long-
term
Low Improbab
le
Low The contribution of the proposed
expansion to ambient PM10
concentrations is small.
Ecological impacts from
ambient HF
concentrations
Region
al
Long-
term
Mode
rate
Possible Low HF concentrations are elevated in near
vicinity of Alba. However, since no
plantations or crops are in close proximity
of Alba, impacts are considered low.
Water
Additional water
demand
Region
al
Long-
term High Definite Low
The additional water use requirements of
the proposed expansion will be met
through the available reverse osmosis
capacity at the Calciner Plant.
Groundwater consumption for PS2 will be
stopped.
Additional wastewater
effluent Local
Long-
term
Negli
gible Probable Low
Majority of waste water will be internally
recycled, used for irrigation or discharged
to Alba’s lake. A negligible increase of
waste water effluent will be discharged
via the existing outfall to sea (< 0.1%
increase). Since the current outfall does
not enable proper mixing it is
recommended to investigate an outfall
location providing proper mixing and
therefore minimizing impacts.
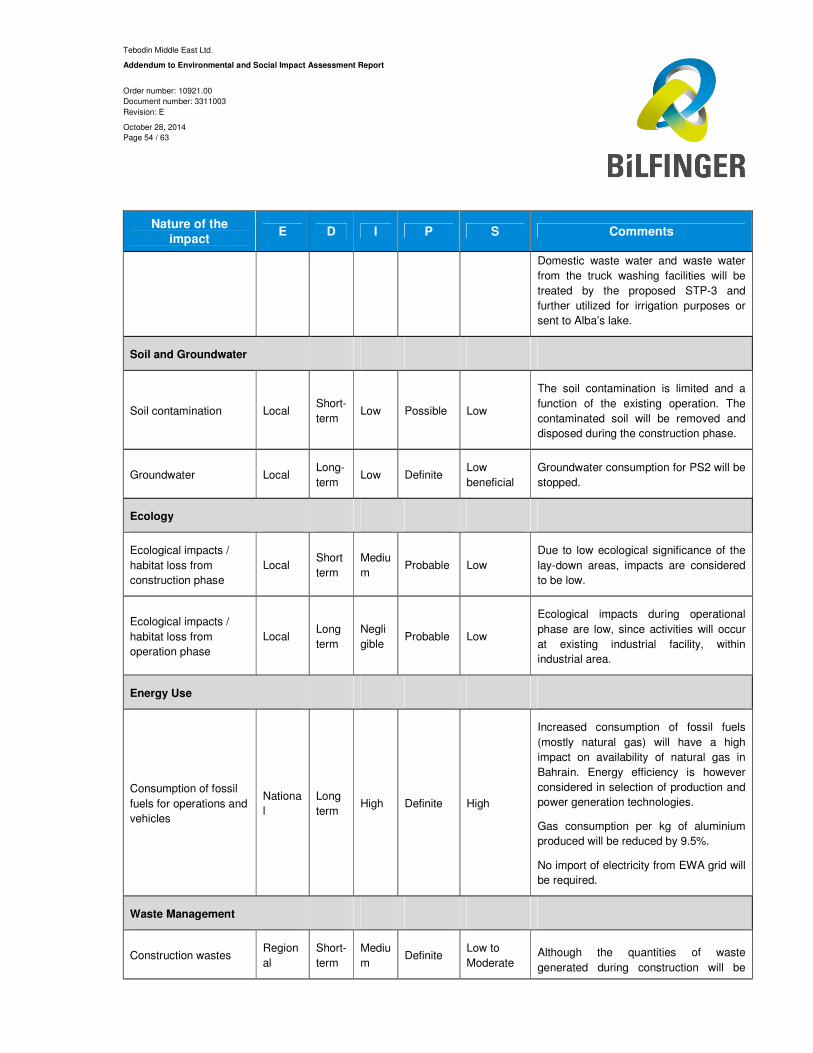
Tebodin Middle East Ltd.
Addendum to Environmental and Social Impact Assessment Report
Order number: 10921.00
Document number: 3311003
Revision: E
October 28, 2014
Page 54 / 63
Nature of the
impact E D I P S Comments
Domestic waste water and waste water
from the truck washing facilities will be
treated by the proposed STP-3 and
further utilized for irrigation purposes or
sent to Alba’s lake.
Soil and Groundwater
Soil contamination Local Short-
term Low Possible Low
The soil contamination is limited and a
function of the existing operation. The
contaminated soil will be removed and
disposed during the construction phase.
Groundwater Local Long-
term Low Definite
Low
beneficial
Groundwater consumption for PS2 will be
stopped.
Ecology
Ecological impacts /
habitat loss from
construction phase
Local Short
term
Mediu
m Probable Low
Due to low ecological significance of the
lay-down areas, impacts are considered
to be low.
Ecological impacts /
habitat loss from
operation phase
Local Long
term
Negli
gible Probable Low
Ecological impacts during operational
phase are low, since activities will occur
at existing industrial facility, within
industrial area.
Energy Use
Consumption of fossil
fuels for operations and
vehicles
Nationa
l
Long
term High Definite High
Increased consumption of fossil fuels
(mostly natural gas) will have a high
impact on availability of natural gas in
Bahrain. Energy efficiency is however
considered in selection of production and
power generation technologies.
Gas consumption per kg of aluminium
produced will be reduced by 9.5%.
No import of electricity from EWA grid will
be required.
Waste Management
Construction wastes Region
al
Short-
term
Mediu
m Definite
Low to
Moderate Although the quantities of waste
generated during construction will be
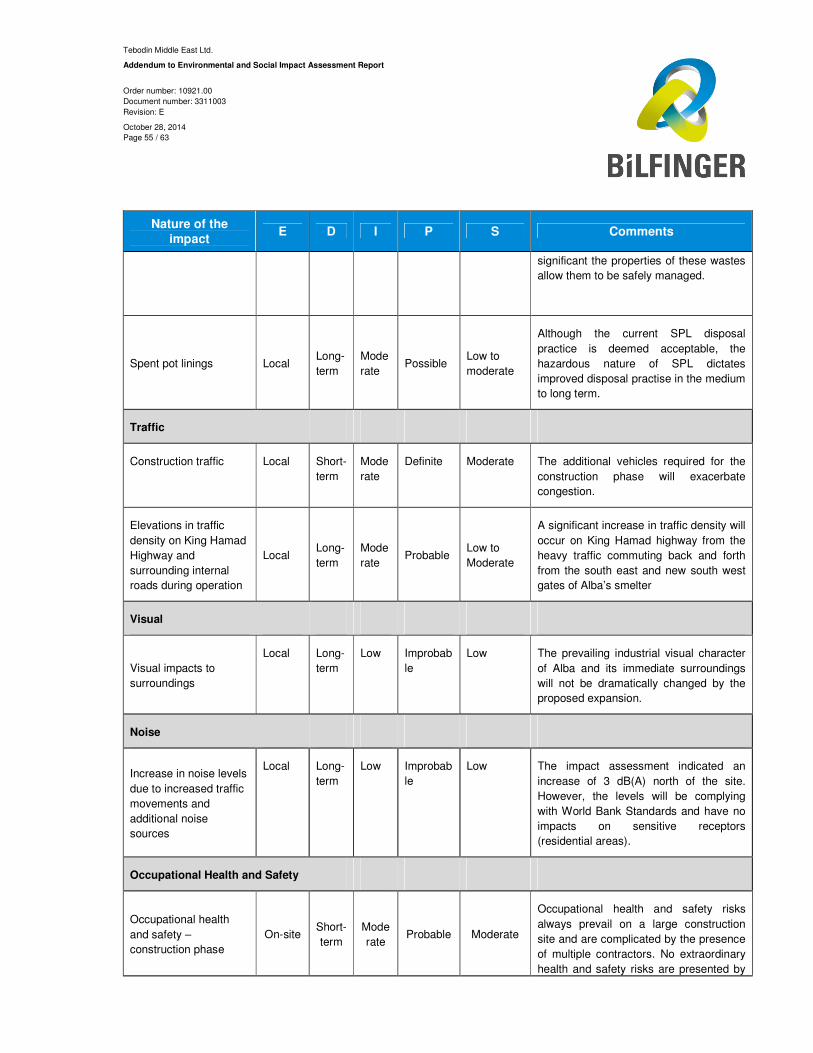
Tebodin Middle East Ltd.
Addendum to Environmental and Social Impact Assessment Report
Order number: 10921.00
Document number: 3311003
Revision: E
October 28, 2014
Page 55 / 63
Nature of the
impact E D I P S Comments
significant the properties of these wastes
allow them to be safely managed.
Spent pot linings Local Long-
term
Mode
rate Possible
Low to
moderate
Although the current SPL disposal
practice is deemed acceptable, the
hazardous nature of SPL dictates
improved disposal practise in the medium
to long term.
Traffic
Construction traffic Local Short-
term
Mode
rate
Definite Moderate The additional vehicles required for the
construction phase will exacerbate
congestion.
Elevations in traffic
density on King Hamad
Highway and
surrounding internal
roads during operation
Local Long-
term
Mode
rate Probable
Low to
Moderate
A significant increase in traffic density will
occur on King Hamad highway from the
heavy traffic commuting back and forth
from the south east and new south west
gates of Alba’s smelter
Visual
Visual impacts to
surroundings
Local Long-
term
Low Improbab
le
Low The prevailing industrial visual character
of Alba and its immediate surroundings
will not be dramatically changed by the
proposed expansion.
Noise
Increase in noise levels
due to increased traffic
movements and
additional noise
sources
Local Long-
term
Low Improbab
le
Low The impact assessment indicated an
increase of 3 dB(A) north of the site.
However, the levels will be complying
with World Bank Standards and have no
impacts on sensitive receptors
(residential areas).
Occupational Health and Safety
Occupational health
and safety –
construction phase
On-site Short-
term
Mode
rate Probable Moderate
Occupational health and safety risks
always prevail on a large construction
site and are complicated by the presence
of multiple contractors. No extraordinary
health and safety risks are presented by
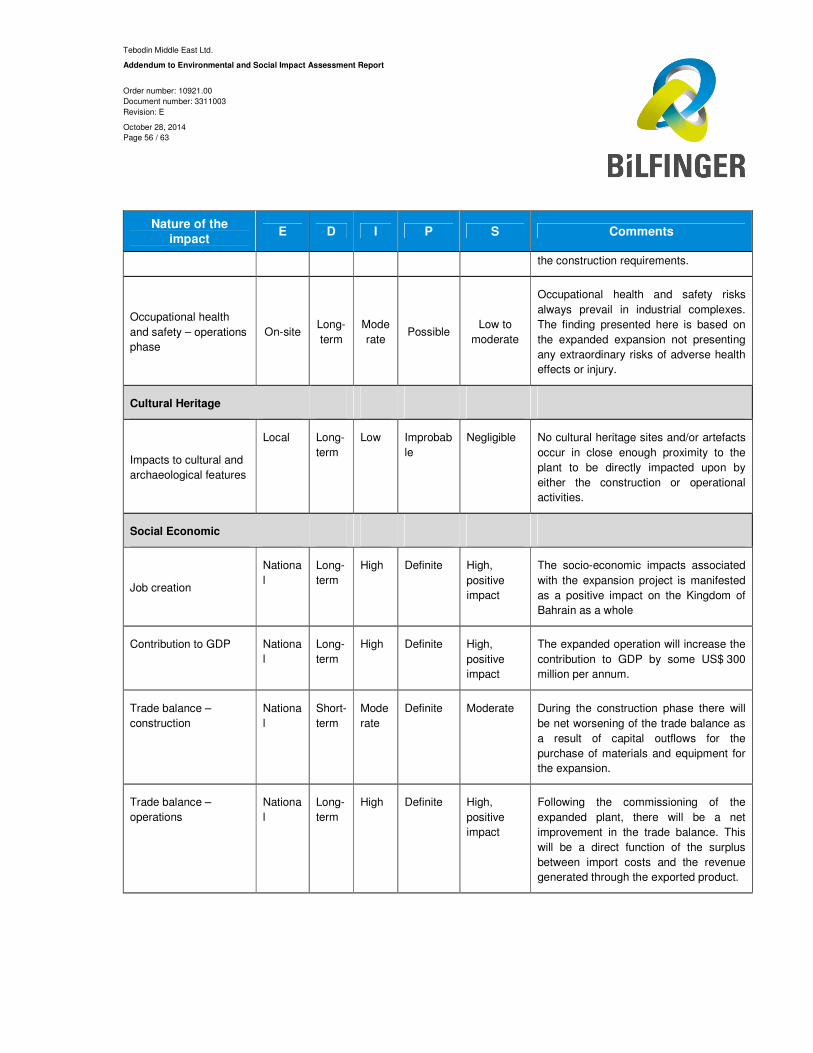
Tebodin Middle East Ltd.
Addendum to Environmental and Social Impact Assessment Report
Order number: 10921.00
Document number: 3311003
Revision: E
October 28, 2014
Page 56 / 63
Nature of the
impact E D I P S Comments
the construction requirements.
Occupational health
and safety – operations
phase
On-site Long-
term
Mode
rate Possible
Low to
moderate
Occupational health and safety risks
always prevail in industrial complexes.
The finding presented here is based on
the expanded expansion not presenting
any extraordinary risks of adverse health
effects or injury.
Cultural Heritage
Impacts to cultural and
archaeological features
Local Long-
term
Low Improbab
le
Negligible No cultural heritage sites and/or artefacts
occur in close enough proximity to the
plant to be directly impacted upon by
either the construction or operational
activities.
Social Economic
Job creation
Nationa
l
Long-
term
High Definite High,
positive
impact
The socio-economic impacts associated
with the expansion project is manifested
as a positive impact on the Kingdom of
Bahrain as a whole
Contribution to GDP Nationa
l
Long-
term
High Definite High,
positive
impact
The expanded operation will increase the
contribution to GDP by some US$ 300
million per annum.
Trade balance –
construction
Nationa
l
Short-
term
Mode
rate
Definite Moderate During the construction phase there will
be net worsening of the trade balance as
a result of capital outflows for the
purchase of materials and equipment for
the expansion.
Trade balance –
operations
Nationa
l
Long-
term
High Definite High,
positive
impact
Following the commissioning of the
expanded plant, there will be a net
improvement in the trade balance. This
will be a direct function of the surplus
between import costs and the revenue
generated through the exported product.

Tebodin Middle East Ltd.
Addendum to Environmental and Social Impact Assessment Report
Order number: 10921.00
Document number: 3311003
Revision: E
October 28, 2014
Page 57 / 63
5 Alternatives
The technology considered for the third power generation unit will be identical to the earlier two power generation units.
Adding a third power generation unit at PS5 will have no impacts on the alternatives assessment included in previous ESIA
study [1].

Tebodin Middle East Ltd.
Addendum to Environmental and Social Impact Assessment Report
Order number: 10921.00
Document number: 3311003
Revision: E
October 28, 2014
Page 58 / 63
This page is intentionally blank.
Tebodin Middle East Ltd.
Addendum to Environmental and Social Impact Assessment Report
Order number: 10921.00
Document number: 3311003
Revision: E
October 28, 2014
Page 59 / 63
6 Conclusions
Alba is presently considering expanding its smelter operations to include an additional Potline 6 (L6), a Power
Station 5 (PS 5), and supporting facilities. An Environmental and Social Impact Assessment (ESIA) study as
requested by the General Directorate of Environment & Wildlife Protection was submitted to SCE in June 2014.
However after submittal of the ESIA report, design changes were made for the power station configuration. TME
prepared this addendum to inform SCE on these changes and to assess the change in impacts on the environment.
The initial design of PS 5, for which the ESIA was prepared, comprised two (2) F class units. In the current design
change, an extra F class unit is added to the power station, hereafter referred to as PS-5C. Furthermore, the existing
PS-2 will be shut-down and 150MW additional power will no longer be sourced from the Electricity and Water
Authority (EWA) grid.
Based on this ESIA addendum it can be concluded that majority of the environmental impacts by adding the third F
class power generation unit are identical compared with previous ESIA study. Some impacts have been slightly
reduced (air quality during operational phase, no use of groundwater), and some impacts have slightly increased
(traffic during construction phase, construction waste, noise during operational phase).
Of the impacts assessed only two pose a significant risk of impact to the environmental. The first of these is the
greenhouse gas emissions that will be generated by the proposed expansion. It is well recognised that aluminium
smelters are significant producers of greenhouse gas emissions as is the case for Alba for both the current
operations as well as those that will be generated by the proposed expansion.
The second significant impact is that associated with the relatively high SO2 and HF emissions. The results of the
analysis show that the total correlated predicted SO2 and HF concentrations in the ambient air at indicated sensitive
receptors comply with the applicable standards for both the present and future cases. However, there are
exceedances of SO2 and HF levels in the area from Alba’s fence line to several kilometres south to south-west.
Based on the modelling analysis for the maximum allowable Bahraini emissions criteria, the contribution of criteria
pollutants were found to be temporal in nature, since long term average are well below the Bahraini AAQS, except
for HF. Therefore, a scenario with additional mitigation measures was evaluated to reduce the impact of HF. This
scenario also incorporated lower SO2 source emission ratios, in line with current Alba operations. This scenario is
retained as the scenario applied for the proposed expansion project.
The Best Available Technology considered in the design of proposed Potline 6 and Power Station 5 limit the
emissions from the expansion to the extent possible. Furthermore, commitments are made to limit the source
emissions for existing Potline 4 and Potline 5 via mitigation through stricter operating practices in line with those
considered for Potline 6.
The amount of effluents to sea is expected to remain similar to those of the current operations with the exception of
a minimal quantity generated by the Power Station. Recommendations with regards to the marine outfall are
provided.
Positive impacts include the increased economic growth that will be brought about by the spending on the project as
well as the increased revenues that will be generated by the expanded operation. In addition, the construction phase
will see some 4,000 temporary jobs with some 500 permanent jobs being created at the expanded plant. The

Tebodin Middle East Ltd.
Addendum to Environmental and Social Impact Assessment Report
Order number: 10921.00
Document number: 3311003
Revision: E
October 28, 2014
Page 60 / 63
expanded operation will also keep Alba globally competitive in terms of its unit costs of production, and also
capitalise on the continued growth in demand for primary aluminium.
The ESIA has been concluded by presenting mitigation together with recommendations that should be implemented
on the proposed expansion. Implementation of the mitigation and recommendations will ensure that the expanded
plant does not result in an impact on the environment, and that it will meet the principles of development that is
environmentally, socially and economically sustainable.
Tebodin Middle East Ltd.
Addendum to Environmental and Social Impact Assessment Report
Order number: 10921.00
Document number: 3311003
Revision: E
October 28, 2014
Page 61 / 63
References
1. Tebodin Middle East Ltd. Alba Potline (6) and Power Plant (PS 5) Expansion - Environmental and Social
Impact Assessment Report. Doc. No. 3311002, Rev. C, 9th June 2014

Tebodin Middle East Ltd.
Addendum to Environmental and Social Impact Assessment Report
Order number: 10921.00
Document number: 3311003
Revision: E
October 28, 2014
Page 62 / 63
This page is intentionally blank.
Tebodin Middle East Ltd.
Addendum to Environmental and Social Impact Assessment Report
Order number: 10921.00
Document number: 3311003
Revision: E
October 28, 2014
Page 63 / 63
List of Appendices
Appendix 1: Site Layout
Appendix 2: Air Dispersion Isopleths
Appendix 3: Noise Modelling Methodology

Appendix 1: Site Layout
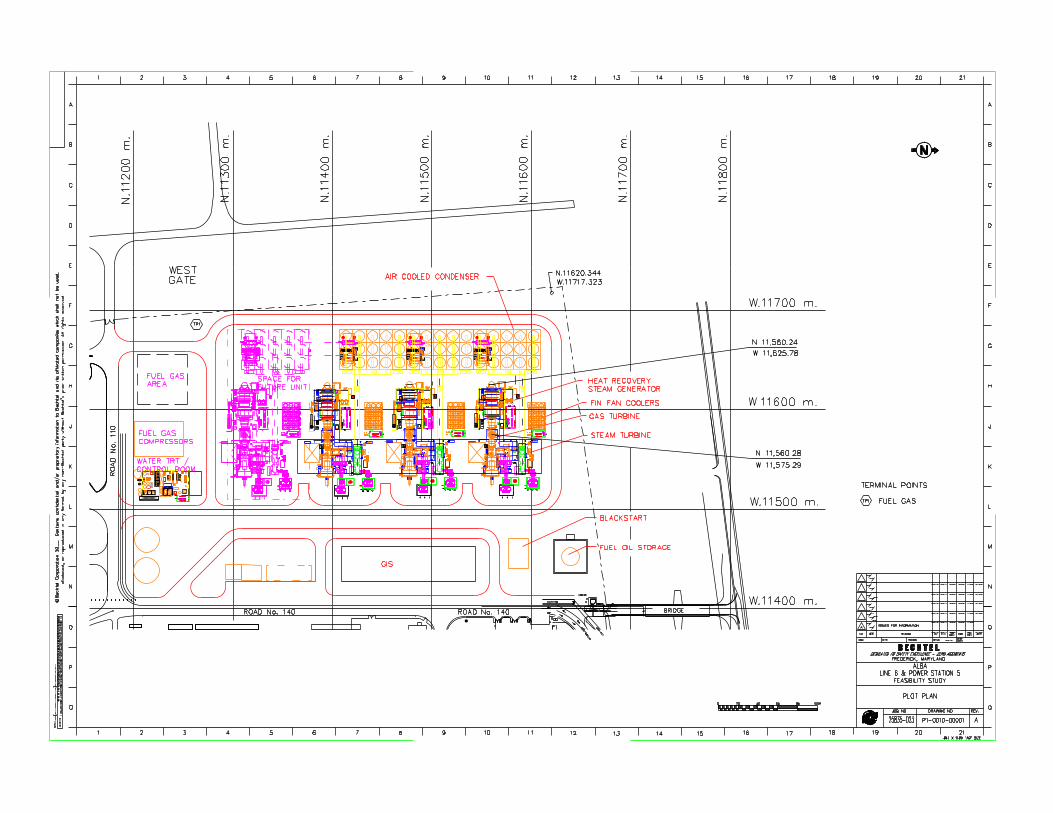
GUARDHOUSE
EXIS
TIN
G TREN
CH
WEIGH BRIDGE
EXIS
TIN
G R
OA
D No.10
RO
AD
No.
110
ROAD No. 140 ROAD No. 140
N.11620.344
W.11717.323
BRIDGE
EXISTING TRENCH
GATE WEST
AIR COOLED CONDENSER
GAS TURBINE
STEAM TURBINE
FIN FAN COOLERS
STEAM GENERATOR
HEAT RECOVERYDOOR
ROLL-UP
PR
OT.
PA
NE
L
ST
G
GE
N.
TU
RBIN
E
CO
NT
RO
L
PA
NE
L
STG 480
V
ESS
MC
CS
TG 480
V
MC
C 1
HR
SG 480
V
MC
CB
OP 480
V
MC
C
HR
SG
DC
SR
ELA
Y P
AN
ELS
STG
&
CTG
CTG LC
CTG LC
XFM
R
XFMRHRSG LC
LCHRSG
BO
TT
LES
NIT
RO
GE
N
DO
OR
ROLL-
UP
ST
G
LE
C
DOOR
ROLL-UP
PR
OT.
PA
NE
L
ST
G
GE
N.
TU
RBIN
E
CO
NT
RO
L
PA
NE
L
STG 480
V
ESS
MC
CS
TG 480
V
MC
C 1
HR
SG 480
V
MC
CB
OP 480
V
MC
C
HR
SG
DC
SR
ELA
Y P
AN
ELS
STG
&
CTG
CTG LC
CTG LC
XFM
R
XFMRHRSG LC
LCHRSG
BO
TT
LES
NIT
RO
GE
N
DO
OR
ROLL-
UP
ST
G
LE
C
lime
& so
da ash silos
SU
MP
SU
MP
SU
MP
sump
DCS PANELS
FIN FAN CLR MCC 1
PLC CABINETS
WTP MCC 2
STORAGE TANK
POTABLE WATER
TANK
COLLECTION
DRAIN
SU
MP
SU
MP
SU
MP
SU
MP
SU
MP
DC
S
PA
NE
LS
FIN FAN CLR MCC 2
FIN FAN CLR MCC 1
FIN FAN CLR MCC 3
DC
S
PA
NE
LS
FIN FAN CLR MCC 2
FIN FAN CLR MCC 1
FIN FAN CLR MCC 3
CONTROL ROOM
WATER TRT /
GIS
COMPRESSORS
FUEL GAS
W 11,625.78
N 11,560.24
W 11,575.29
N 11,560.28
LE
VE
LS
123
45
678
90
12
34
56
78
90
12
34
56
78
90
12
34
56
78
90
12
34
567
89
01
23
45
678
90
12
3
11
111
11
11
12
22
22
22
22
233
33
333
33
34
44
44
44
44
45
555
55
55
56
66
6
1 2 3 4 5 6 7 8 9 10 11 12 13 14 15 16 17 18 19 20 21
A
B
C
D
E
F
G
H
J
K
L
M
N
O
P
QJOB NO. DRAWING NO. REV.
A
B
C
D
E
F
G
H
J
K
L
M
P
Q
1 2 3 4 5 6 7 8 9 10 11 12 13 14 15 16 17 18 19 20 21
N
O
841 X 1189 "A0" SIZE
DF
N=
__
_[_
__
__
__
__
__
__
__]_
__
__
__
__._
__
CHIEF
ENGR.SCALE DATE DESIGNED DRAWN
NO. DATE REVISIONS BY CHKDES
SUPV.ENGR.
PROJ
ENGRAPPR
FREDERICK, MARYLAND
DEDICATED TO SAFETY EXCELLENCE - ZERO ACCIDENTS
C
dis
clo
sed,
or reproduced in any form
at by any non-
Bechtel
party
wit
hout
Bechtel's prior
written permissio
n.
All rig
hts reserved.
Bechtel
Corporatio
n 20_
_.
Contain
s confid
ential
and/
or proprietary inform
atio
n to
Bechtel
and its affiliated co
mpanies
whic
h shall not be used,
5
_____ ___ ___ ___
___
___
___
___
___
___
___
___
___
___
___
___
___
___
___
___
___
___
___
___
___
___
___
___
___
___
___
___
___
__
__
__
__
__
__
__
__
__
__
__
__
__
__
__
__
__
__
__
__
__
__
___
N.1
1200
m.
N.1
1300
m.
N.1
1400
m.
N.1
1500
m.
N.1
1600
m.
N.1
1700
m.
N.1
1800
m.
W.11700 m.
W.11600 m.
W.11500 m.
W.11400 m.
0 20 40 60 80 100M
P1-0010-00001 A
A
AREA
FUEL GAS
FEASIBILITY STUDY
LINE 6 & POWER STATION 5
ALBA
25835-023
ISSUED FOR INFORMATION
TP1
TP1 FUEL GAS
TERMINAL POINTS
PLOT PLAN
DOOR
ROLL-UP
PR
OT.
PA
NE
L
ST
G
GE
N.
TU
RBIN
E
CO
NT
RO
L
PA
NE
L
STG 480
V
ESS
MC
CS
TG 480
V
MC
C 1
HR
SG 480
V
MC
CB
OP 480
V
MC
C
HR
SG
DC
SR
ELA
Y P
AN
ELS
STG
&
CTG
CTG LC
CTG LC
XFM
R
XFMRHRSG LC
LCHRSG
BO
TT
LES
NIT
RO
GE
N
DO
OR
ROLL-
UP
ST
G
LE
C
DC
S
PA
NE
LS
FIN FAN CLR MCC 2
FIN FAN CLR MCC 1
FIN FAN CLR MCC 3
FUTURE UNIT
SPACE FOR
DOOR
ROLL-UP
PR
OT.
PA
NE
L
ST
G
GE
N.
TU
RBIN
E
CO
NT
RO
L
PA
NE
L
STG 480
V
ESS
MC
CS
TG 480
V
MC
C 1
HR
SG 480
V
MC
CB
OP 480
V
MC
C
HR
SG
DC
SR
ELA
Y P
AN
ELS
STG
&
CTG
CTG LC
CTG LC
XFM
R
XFMRHRSG LC
LCHRSG
BO
TT
LES
NIT
RO
GE
N
DO
OR
ROLL-
UP
ST
G
LE
C
DC
S
PA
NE
LS
FIN FAN CLR MCC 2
FIN FAN CLR MCC 1
FIN FAN CLR MCC 3
BLR
AUX
BLACKSTART
FUEL OIL STORAGE
1
Tebodin
Tebodin Middle East Ltd.
Ahmed Ghanem Mazroui Building
Hamdan Street
Tourist Club Area
P.O. Box 2652
Abu Dhabi
United Arab Emirates
Author: M. van der Vorst
- Telephone: +971 2 406 6276
- E-mail: [email protected]
September 30, 2014
Order number: 10921.00
Document number: 3311003
Revision: B
Appendix 2 – Air Dispersion Isopleths
Client: Bechtel
Project: Alba Potline (6) and Power Plant (PS 5) Expansion

Tebodin Middle East Ltd.
Appendix 2 – Air Dispersion Isopleths
Order number: 10921.00
Document number: 3311003
Revision: B
September 30, 2014
Page 3 / 14
3
Table of contents
List of Figures 4 1 Iso-contours Air Modelling 5
Tebodin Middle East Ltd.
Appendix 2 – Air Dispersion Isopleths
Order number: 10921.00
Document number: 3311003
Revision: B
September 30, 2014
Page 4 / 14
4
List of Figures
Figure A 1 - Option A- Maximum 1- Hour Concentration – SO2 ......................................................... 6
Figure A 2 - Option A- Maximum 24- Hour Concentration – SO2 ....................................................... 7
Figure A 3 - Option A- Annual Average Concentration – SO2 ............................................................ 8
Figure A 4 - Option A- Maximum 1- Hour Concentration – NO2 ......................................................... 9
Figure A 5 - Option A- Maximum 24- Hour Concentration – NO2 ..................................................... 10
Figure A 6 - Option A- Annual Average Concentration – NO2 .......................................................... 11
Figure A 7 - Option A- 2030 National Land Use Strategy – Max. 1- Hour Concentration – SO2 ....... 12
Figure A 8 - Option A- 2030 National Land Use Strategy – Max. 24- Hour Concentration – SO2 ..... 13
Figure A 9 - Option A- 2030 National Land Use Strategy – Annual Average Concentration – HF .... 14

Tebodin Middle East Ltd.
Appendix 2 – Air Dispersion Isopleths
Order number: 10921.00
Document number: 3311003
Revision: B
September 30, 2014
Page 5 / 14
5
1 Iso-contours Air Modelling
Isopleth contours of the sulphur dioxide (SO2) and nitrogen dioxide (NO2) scenarios and standard average time
(hourly, daily, yearly average values) are presented in Figure A 1 to Figure A 6. In addition, isopleth contours
indicating compliance with the 2030 National Land Use Strategy are presented in Figure A 7 to Figure A 9.
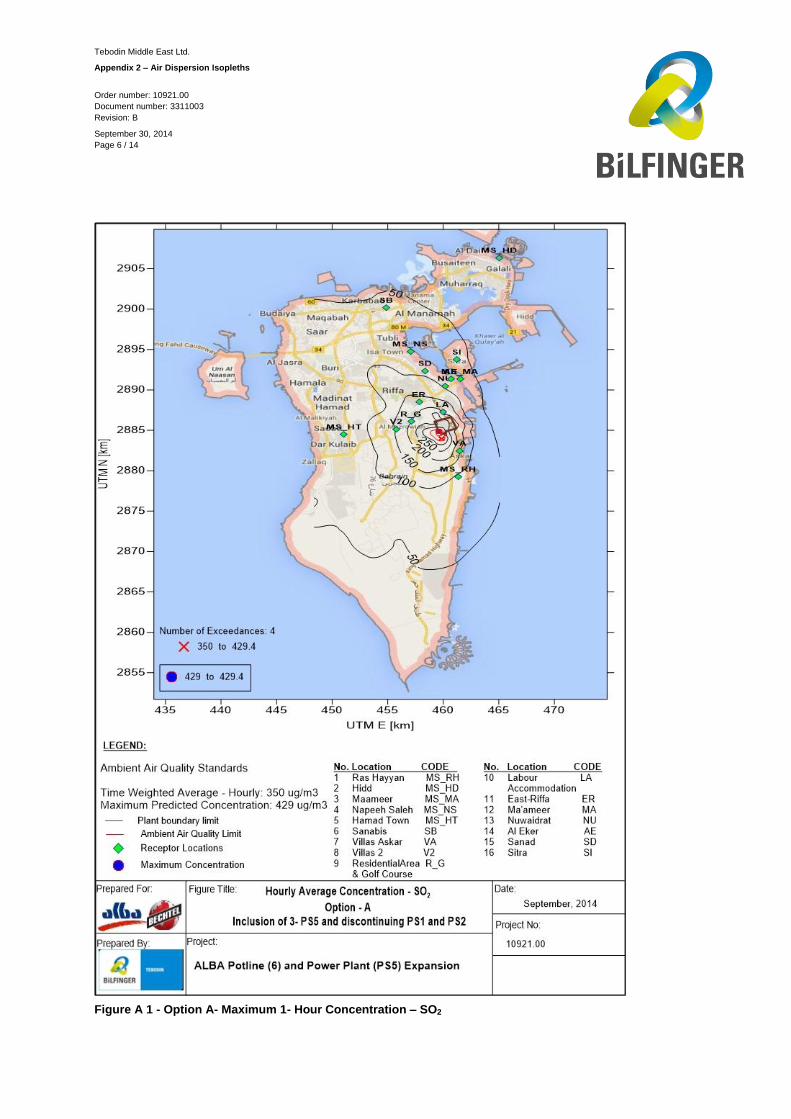
Tebodin Middle East Ltd.
Appendix 2 – Air Dispersion Isopleths
Order number: 10921.00
Document number: 3311003
Revision: B
September 30, 2014
Page 6 / 14
6
Figure A 1 - Option A- Maximum 1- Hour Concentration – SO2
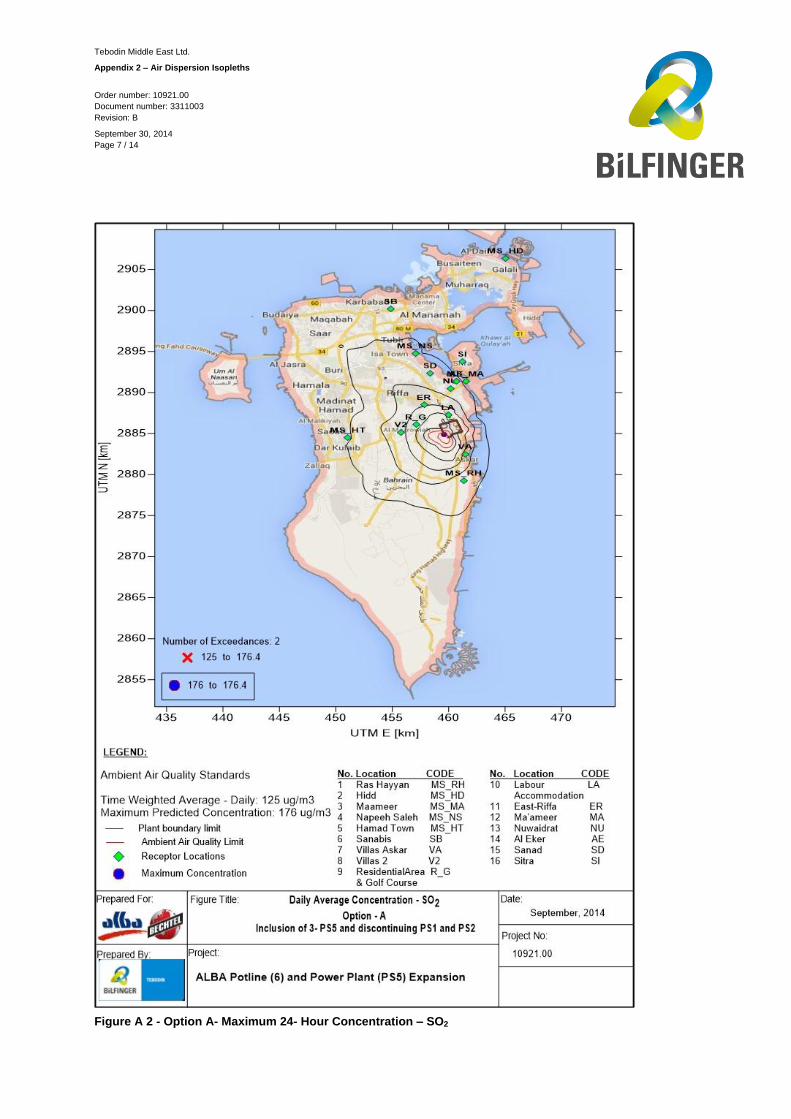
Tebodin Middle East Ltd.
Appendix 2 – Air Dispersion Isopleths
Order number: 10921.00
Document number: 3311003
Revision: B
September 30, 2014
Page 7 / 14
7
Figure A 2 - Option A- Maximum 24- Hour Concentration – SO2

Tebodin Middle East Ltd.
Appendix 2 – Air Dispersion Isopleths
Order number: 10921.00
Document number: 3311003
Revision: B
September 30, 2014
Page 8 / 14
8
Figure A 3 - Option A- Annual Average Concentration – SO2
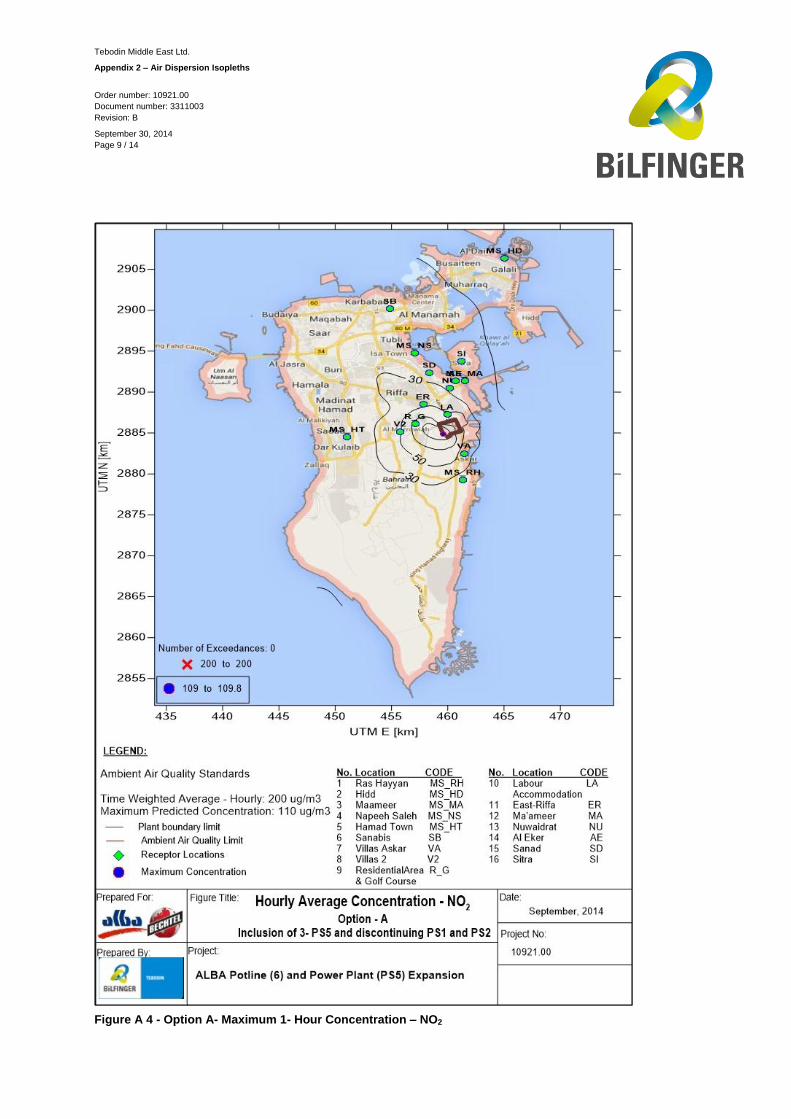
Tebodin Middle East Ltd.
Appendix 2 – Air Dispersion Isopleths
Order number: 10921.00
Document number: 3311003
Revision: B
September 30, 2014
Page 9 / 14
9
Figure A 4 - Option A- Maximum 1- Hour Concentration – NO2

Tebodin Middle East Ltd.
Appendix 2 – Air Dispersion Isopleths
Order number: 10921.00
Document number: 3311003
Revision: B
September 30, 2014
Page 10 / 14
10
Figure A 5 - Option A- Maximum 24- Hour Concentration – NO2

Tebodin Middle East Ltd.
Appendix 2 – Air Dispersion Isopleths
Order number: 10921.00
Document number: 3311003
Revision: B
September 30, 2014
Page 11 / 14
11
Figure A 6 - Option A- Annual Average Concentration – NO2
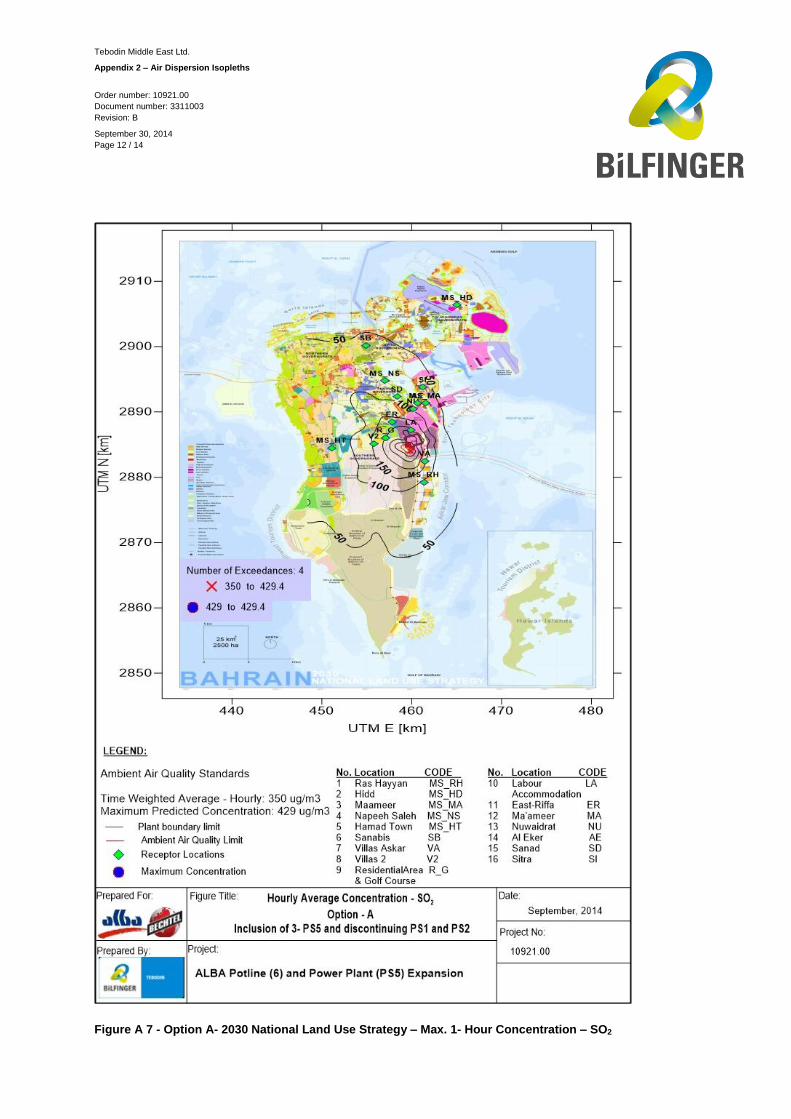
Tebodin Middle East Ltd.
Appendix 2 – Air Dispersion Isopleths
Order number: 10921.00
Document number: 3311003
Revision: B
September 30, 2014
Page 12 / 14
12
Figure A 7 - Option A- 2030 National Land Use Strategy – Max. 1- Hour Concentration – SO2
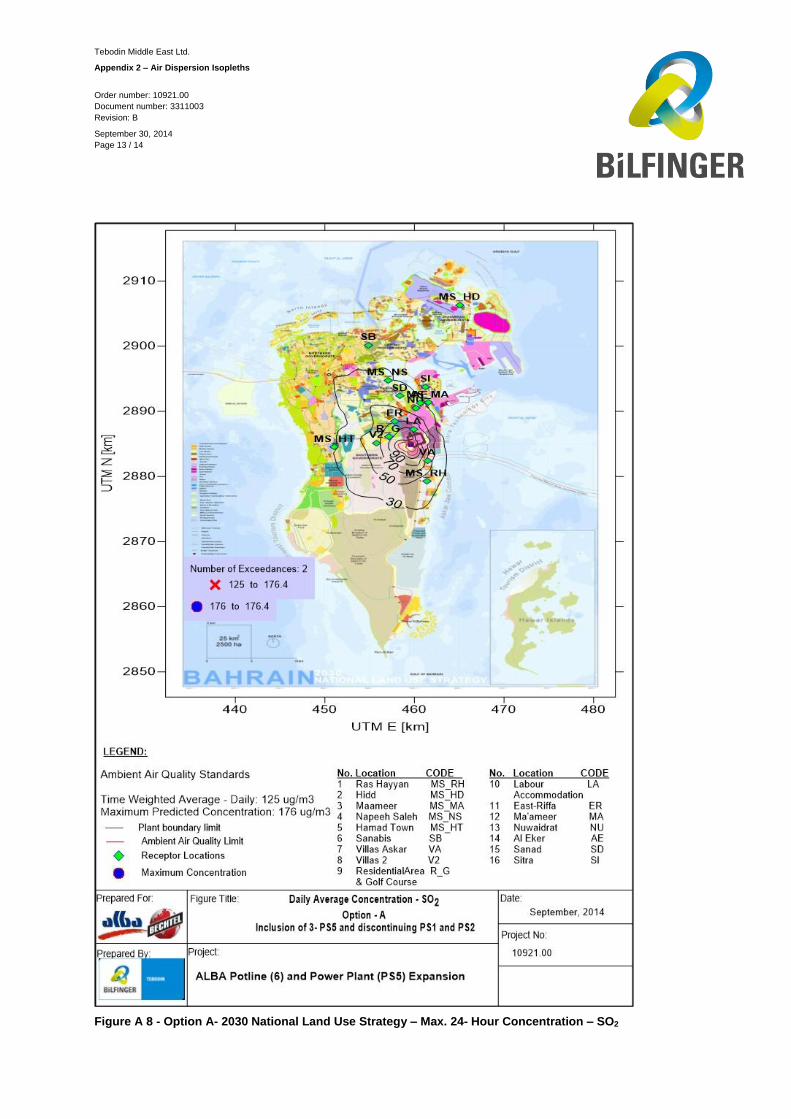
Tebodin Middle East Ltd.
Appendix 2 – Air Dispersion Isopleths
Order number: 10921.00
Document number: 3311003
Revision: B
September 30, 2014
Page 13 / 14
13
Figure A 8 - Option A- 2030 National Land Use Strategy – Max. 24- Hour Concentration – SO2
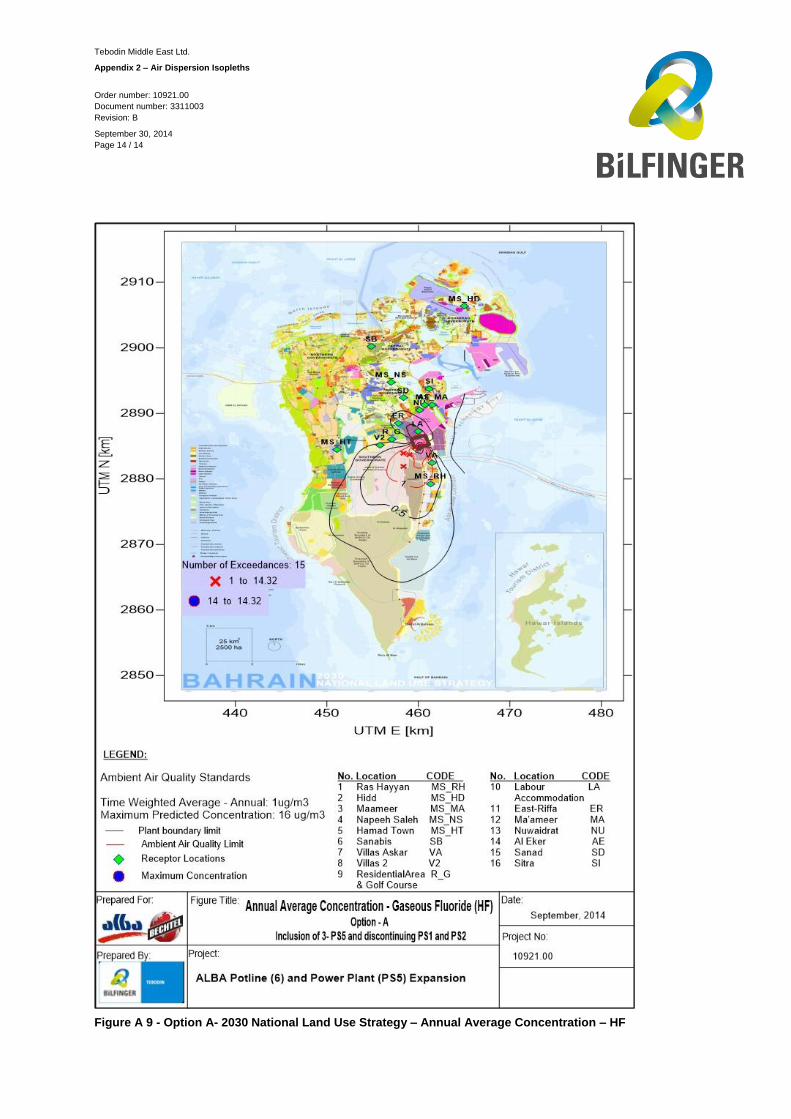
Tebodin Middle East Ltd.
Appendix 2 – Air Dispersion Isopleths
Order number: 10921.00
Document number: 3311003
Revision: B
September 30, 2014
Page 14 / 14
14
Figure A 9 - Option A- 2030 National Land Use Strategy – Annual Average Concentration – HF
Tebodin Middle East Ltd.
Addendum to ESIA report Alba L6 and PS5
Order Number: 10921.00Error! Reference source not found.Document number: 3311003
Revision: A 02 October 2014
Page 1 / 7
Appendix 3 Noise Modelling Methodology
Tebodin Middle East Ltd.
Addendum to ESIA report Alba L6 and PS5
Order Number: 10921.00Error! Reference source not found.Document number: 3311003
Revision: A 02 October 2014
Page 2 / 7
1 Noise Modeling Methodology
1.1 Overview
The noise modelling for evaluation of noise contributions was conducted using SoundPLAN version 7.3
developed by Braunstein & Berndt GmbH, Germany. The model is based on sound pressure wave
divergence. SoundPLAN is a Microsoft Windows based software tool, which can accept multiple
stationary noise sources.
1.2 Software Simulation
The SoundPlan Software implements the acoustics geometric algorithms that can predict the radiation of
sound energy and its propagation in an open or confined space.
The geometric acoustics neglects the wave nature of the acoustic phenomenon, which is treated as an
optical phenomenon in which sources emit energy in the model (acoustic rays) in the surrounding space.
Sound waves in their propagation, gradually lose energy due to different effects: geometric divergence,
uptake of ground, dissipation in the propagation medium, diffraction around obstacles and barriers, etc.
These phenomena are evaluated with the equations and the algorithms of International standard ISO
9613, parts I and II.
1.4 Equations
The standard used for the noise assessment is ISO 9613-II:1996, an engineering method for calculating
the attenuation of sound during the propagation outdoors in order to predict the levels of environmental
noise at a distance from a variety of sources.
The method predicts the equivalent continuous A-weighted Sound Pressure Level SPLA under
meteorological condition favorable to propagation from sources of known sound emission.
The equivalent continuous octave band Sound Pressure Level at a receiver location SPLf is calculated
for each point source and for the nine octave bands with nominal midband frequencies from 31.5 Hz to 8
kHz from equation:
miscbargratmdivCff AAAAADPWLSPL
Where:
PWLf octave band Sound Power Level in decibel, produced by each equipment;
DC directivity correction of source in decibel;
Adiv attenuation due to geometric divergent;
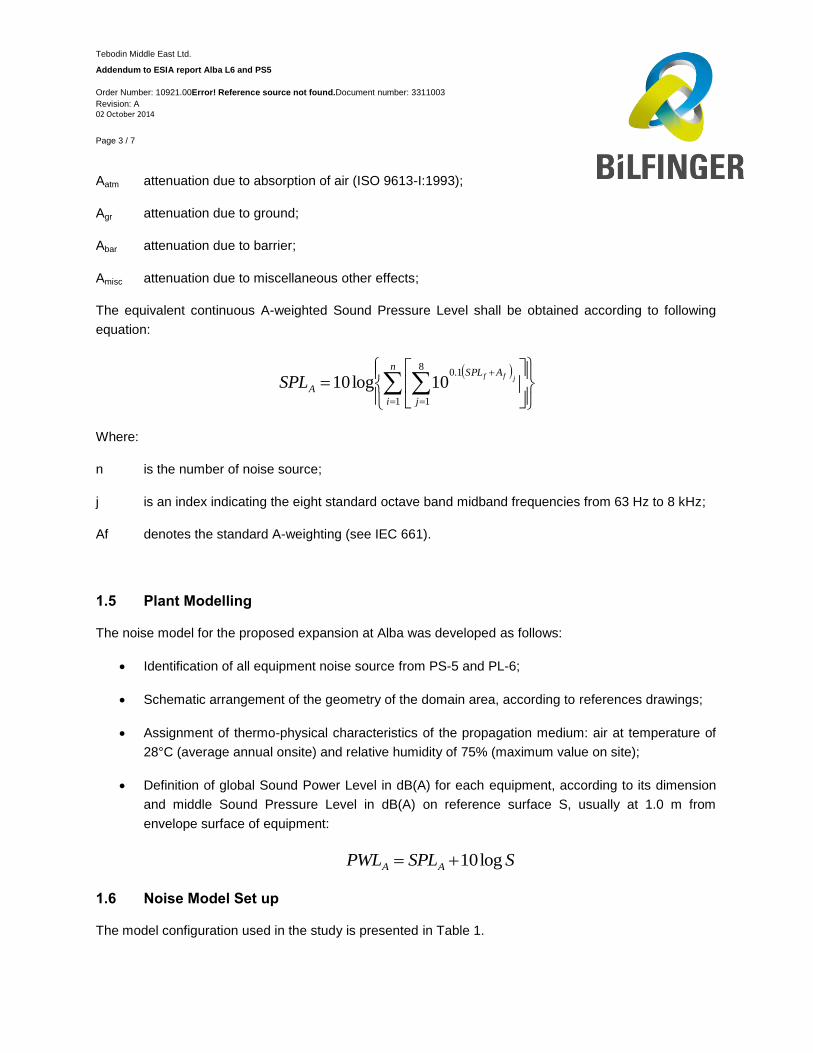
Tebodin Middle East Ltd.
Addendum to ESIA report Alba L6 and PS5
Order Number: 10921.00Error! Reference source not found.Document number: 3311003
Revision: A 02 October 2014
Page 3 / 7
Aatm attenuation due to absorption of air (ISO 9613-I:1993);
Agr attenuation due to ground;
Abar attenuation due to barrier;
Amisc attenuation due to miscellaneous other effects;
The equivalent continuous A-weighted Sound Pressure Level shall be obtained according to following
equation:
n
i j
ASPL
Ajff
SPL1
8
1
1.0
10log10
Where:
n is the number of noise source;
j is an index indicating the eight standard octave band midband frequencies from 63 Hz to 8 kHz;
Af denotes the standard A-weighting (see IEC 661).
1.5 Plant Modelling
The noise model for the proposed expansion at Alba was developed as follows:
Identification of all equipment noise source from PS-5 and PL-6;
Schematic arrangement of the geometry of the domain area, according to references drawings;
Assignment of thermo-physical characteristics of the propagation medium: air at temperature of
28°C (average annual onsite) and relative humidity of 75% (maximum value on site);
Definition of global Sound Power Level in dB(A) for each equipment, according to its dimension
and middle Sound Pressure Level in dB(A) on reference surface S, usually at 1.0 m from
envelope surface of equipment:
SSPLPWL AA log10
1.6 Noise Model Set up
The model configuration used in the study is presented in Table 1.
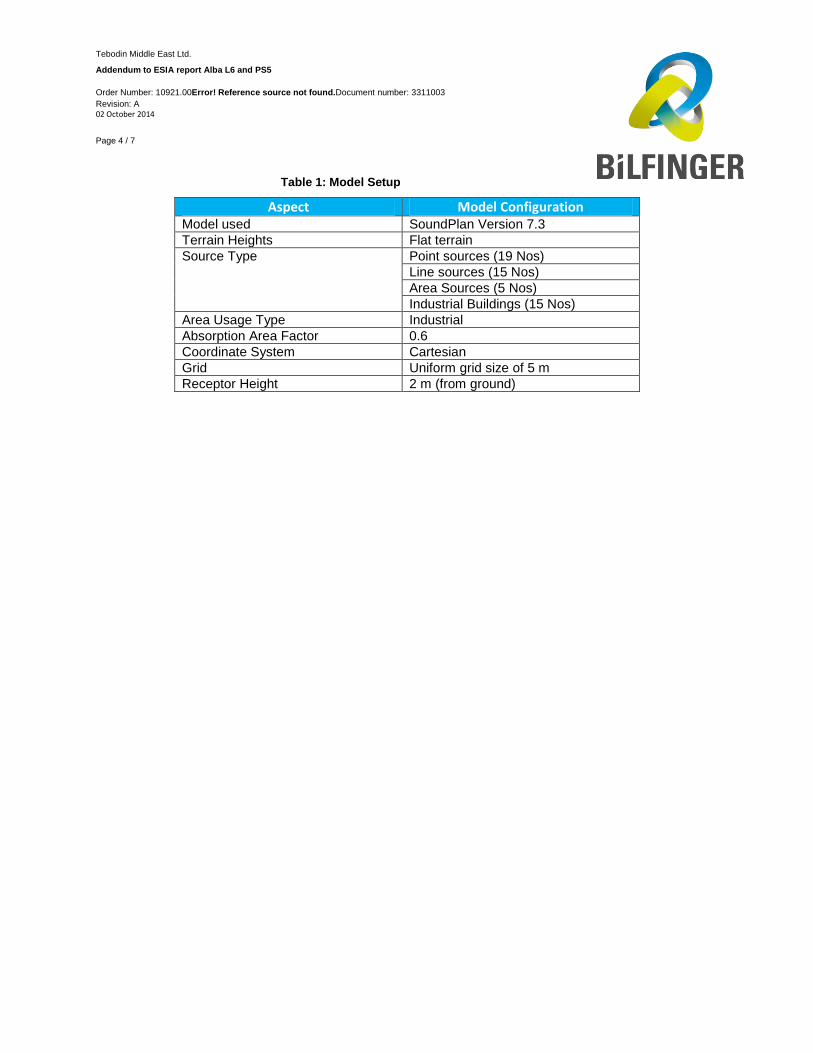
Tebodin Middle East Ltd.
Addendum to ESIA report Alba L6 and PS5
Order Number: 10921.00Error! Reference source not found.Document number: 3311003
Revision: A 02 October 2014
Page 4 / 7
Table 1: Model Setup
Aspect Model Configuration Model used SoundPlan Version 7.3
Terrain Heights Flat terrain
Source Type Point sources (19 Nos)
Line sources (15 Nos)
Area Sources (5 Nos)
Industrial Buildings (15 Nos)
Area Usage Type Industrial
Absorption Area Factor 0.6
Coordinate System Cartesian
Grid Uniform grid size of 5 m
Receptor Height 2 m (from ground)
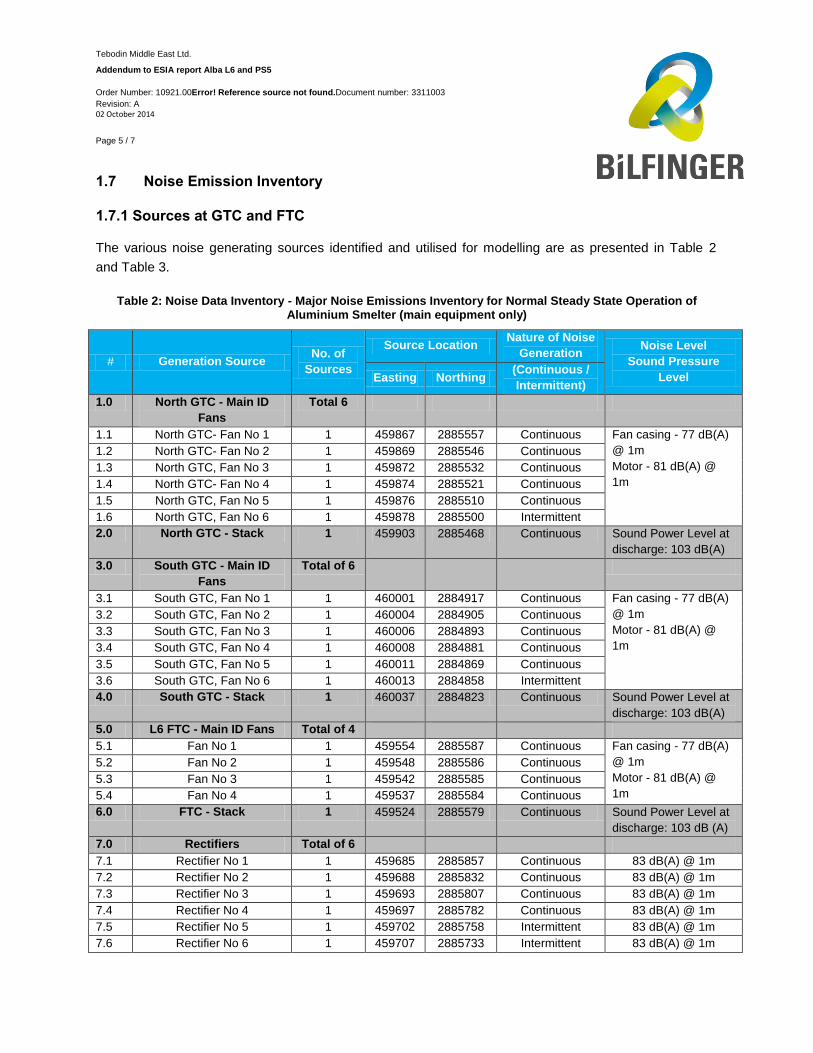
Tebodin Middle East Ltd.
Addendum to ESIA report Alba L6 and PS5
Order Number: 10921.00Error! Reference source not found.Document number: 3311003
Revision: A 02 October 2014
Page 5 / 7
1.7 Noise Emission Inventory
1.7.1 Sources at GTC and FTC
The various noise generating sources identified and utilised for modelling are as presented in Table 2
and Table 3.
Table 2: Noise Data Inventory - Major Noise Emissions Inventory for Normal Steady State Operation of Aluminium Smelter (main equipment only)
# Generation Source No. of
Sources
Source Location Nature of Noise
Generation Noise Level
Sound Pressure
Level Easting Northing (Continuous /
Intermittent)
1.0 North GTC - Main ID
Fans
Total 6
1.1 North GTC- Fan No 1 1 459867 2885557 Continuous Fan casing - 77 dB(A)
@ 1m
Motor - 81 dB(A) @
1m
1.2 North GTC- Fan No 2 1 459869 2885546 Continuous
1.3 North GTC, Fan No 3 1 459872 2885532 Continuous
1.4 North GTC- Fan No 4 1 459874 2885521 Continuous
1.5 North GTC, Fan No 5 1 459876 2885510 Continuous
1.6 North GTC, Fan No 6 1 459878 2885500 Intermittent
2.0 North GTC - Stack 1 459903 2885468 Continuous Sound Power Level at
discharge: 103 dB(A)
3.0 South GTC - Main ID
Fans
Total of 6
3.1 South GTC, Fan No 1 1 460001 2884917 Continuous Fan casing - 77 dB(A)
@ 1m
Motor - 81 dB(A) @
1m
3.2 South GTC, Fan No 2 1 460004 2884905 Continuous
3.3 South GTC, Fan No 3 1 460006 2884893 Continuous
3.4 South GTC, Fan No 4 1 460008 2884881 Continuous
3.5 South GTC, Fan No 5 1 460011 2884869 Continuous
3.6 South GTC, Fan No 6 1 460013 2884858 Intermittent
4.0 South GTC - Stack 1 460037 2884823 Continuous Sound Power Level at
discharge: 103 dB(A)
5.0 L6 FTC - Main ID Fans Total of 4
5.1 Fan No 1 1 459554 2885587 Continuous Fan casing - 77 dB(A)
@ 1m
Motor - 81 dB(A) @
1m
5.2 Fan No 2 1 459548 2885586 Continuous
5.3 Fan No 3 1 459542 2885585 Continuous
5.4 Fan No 4 1 459537 2885584 Continuous
6.0 FTC - Stack 1 459524 2885579 Continuous Sound Power Level at
discharge: 103 dB (A)
7.0 Rectifiers Total of 6
7.1 Rectifier No 1 1 459685 2885857 Continuous 83 dB(A) @ 1m
7.2 Rectifier No 2 1 459688 2885832 Continuous 83 dB(A) @ 1m
7.3 Rectifier No 3 1 459693 2885807 Continuous 83 dB(A) @ 1m
7.4 Rectifier No 4 1 459697 2885782 Continuous 83 dB(A) @ 1m
7.5 Rectifier No 5 1 459702 2885758 Intermittent 83 dB(A) @ 1m
7.6 Rectifier No 6 1 459707 2885733 Intermittent 83 dB(A) @ 1m
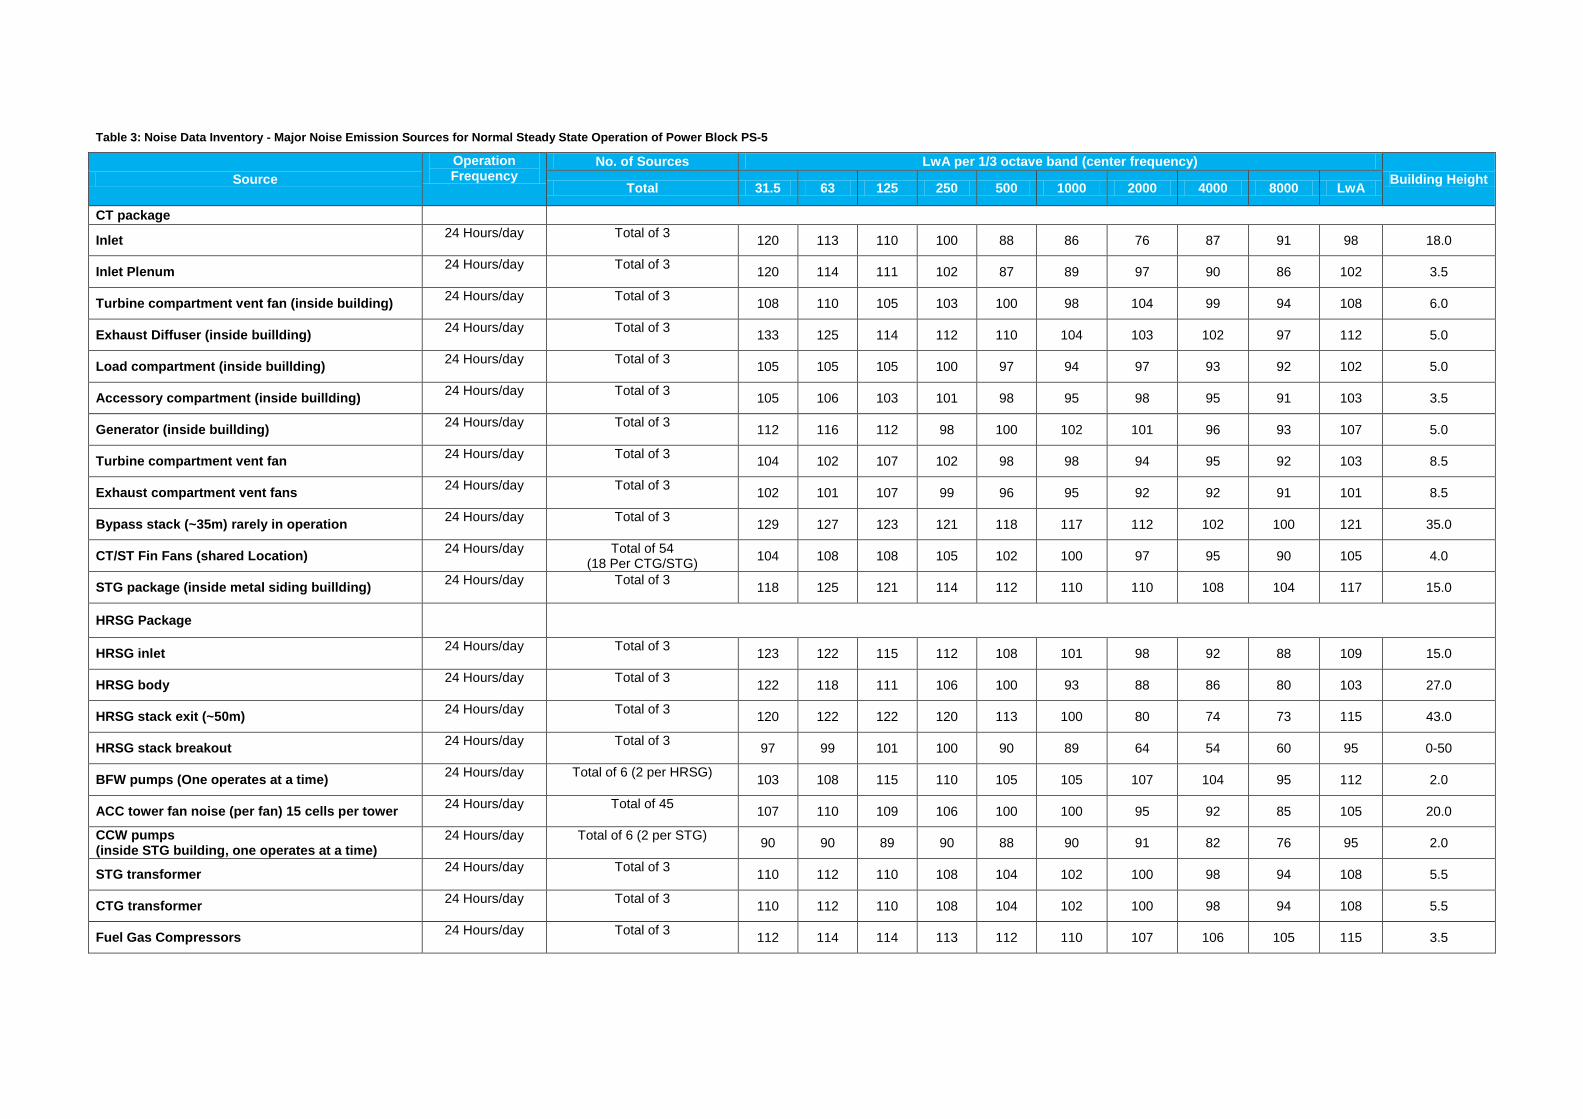
Table 3: Noise Data Inventory - Major Noise Emission Sources for Normal Steady State Operation of Power Block PS-5
Source
Operation Frequency
No. of Sources LwA per 1/3 octave band (center frequency)
Building Height Total 31.5 63 125 250 500 1000 2000 4000 8000 LwA
CT package
Inlet 24 Hours/day Total of 3
120 113 110 100 88 86 76 87 91 98 18.0
Inlet Plenum 24 Hours/day Total of 3
120 114 111 102 87 89 97 90 86 102 3.5
Turbine compartment vent fan (inside building) 24 Hours/day Total of 3
108 110 105 103 100 98 104 99 94 108 6.0
Exhaust Diffuser (inside buillding) 24 Hours/day Total of 3
133 125 114 112 110 104 103 102 97 112 5.0
Load compartment (inside buillding) 24 Hours/day Total of 3
105 105 105 100 97 94 97 93 92 102 5.0
Accessory compartment (inside buillding) 24 Hours/day Total of 3
105 106 103 101 98 95 98 95 91 103 3.5
Generator (inside buillding) 24 Hours/day Total of 3
112 116 112 98 100 102 101 96 93 107 5.0
Turbine compartment vent fan 24 Hours/day Total of 3
104 102 107 102 98 98 94 95 92 103 8.5
Exhaust compartment vent fans 24 Hours/day Total of 3
102 101 107 99 96 95 92 92 91 101 8.5
Bypass stack (~35m) rarely in operation 24 Hours/day Total of 3
129 127 123 121 118 117 112 102 100 121 35.0
CT/ST Fin Fans (shared Location) 24 Hours/day Total of 54
(18 Per CTG/STG) 104 108 108 105 102 100 97 95 90 105 4.0
STG package (inside metal siding buillding) 24 Hours/day Total of 3
118 125 121 114 112 110 110 108 104 117 15.0
HRSG Package
HRSG inlet 24 Hours/day Total of 3
123 122 115 112 108 101 98 92 88 109 15.0
HRSG body 24 Hours/day Total of 3
122 118 111 106 100 93 88 86 80 103 27.0
HRSG stack exit (~50m) 24 Hours/day Total of 3
120 122 122 120 113 100 80 74 73 115 43.0
HRSG stack breakout 24 Hours/day Total of 3
97 99 101 100 90 89 64 54 60 95 0-50
BFW pumps (One operates at a time) 24 Hours/day Total of 6 (2 per HRSG)
103 108 115 110 105 105 107 104 95 112 2.0
ACC tower fan noise (per fan) 15 cells per tower 24 Hours/day Total of 45
107 110 109 106 100 100 95 92 85 105 20.0
CCW pumps (inside STG building, one operates at a time)
24 Hours/day Total of 6 (2 per STG) 90 90 89 90 88 90 91 82 76 95 2.0
STG transformer 24 Hours/day Total of 3
110 112 110 108 104 102 100 98 94 108 5.5
CTG transformer 24 Hours/day Total of 3
110 112 110 108 104 102 100 98 94 108 5.5
Fuel Gas Compressors 24 Hours/day Total of 3
112 114 114 113 112 110 107 106 105 115 3.5
