adb economics working paper series · adb economics working paper series determinants of...
TRANSCRIPT
Determinants of Urbanization
Anett Hofmann and Guanghua Wan No. 355 | July 2013
ADB Economics Working Paper Series
Determinants of UrbanizationIn light of the United Nation’s (UN’s) latest urbanization projections, particularly with respect to the People’s Republic of China and India, a good understanding is needed of what drives aggregate urbanization trends. Taking advantage of the latest UN World Urbanization Prospects, we use an instrumental variables approach to identify and analyze key urbanization determinants. We estimate the impact of gross domestic product growth on urbanization to be large and positive. We also find positive and significant effects of industrialization and education on urbanization, consistent with the existence of localization economies and labor market pooling.
About the Asian Development BankADB’s vision is an Asia and Pacific region free of poverty. Its mission is to help its developing member countries reduce poverty and improve the quality of life of their people. Despite the region’s many successes, it remains home to two-thirds of the world’s poor: 1.7 billion people who live on less than $2 a day, with 828 million struggling on less than $1.25 a day. ADB is committed to reducing poverty through inclusive economic growth, environmentally sustainable growth, and regional integration. Based in Manila, ADB is owned by 67 members, including 48 from the region. Its main instruments for helping its developing member countries are policy dialogue, loans, equity investments, guarantees, grants, and technical assistance.
Asian Development Bank6 ADB Avenue, Mandaluyong City1550 Metro Manila, Philippineswww.adb.org/economics
Printed on recycled paper Printed in the Philippines
ADB Economics Working Paper Series
Determinants of Urbanization Anett Hofmann and Guanghua Wan
No. 355 July 2013
Anett Hofmann is a PhD candidate at the Department of Economics and STICERD, London School of Economics, London. Guanghua Wan is Principal Economist at the Economics and Research Department, Asian Development Bank. The authors would like to thank the ADB for institutional support. We are further indebted to Niny Khor (ADB), Mike Lindfeld (CDIA), Remi Jedwab (George Washington University), Claudia Steinwender (London School of Economics), as well as seminar participants at the Economics and Research Department at ADB for helpful comments and suggestions.
Asian Development Bank 6 ADB Avenue, Mandaluyong City 1550 Metro Manila, Philippines www.adb.org © 2013 by Asian Development Bank July 2013 ISSN 1655-5252 Publication Stock No. WPS135833 The views expressed in this paper are those of the author and do not necessarily reflect the views and policies of the Asian Development Bank (ADB) or its Board of Governors or the governments they represent. ADB does not guarantee the accuracy of the data included in this publication and accepts no responsibility for any consequence of their use. By making any designation of or reference to a particular territory or geographic area, or by using the term “country” in this document, ADB does not intend to make any judgments as to the legal or other status of any territory or area. Note: In this publication, “$” refers to US dollars.
The ADB Economics Working Paper Series is a forum for stimulating discussion and eliciting
feedback on ongoing and recently completed research and policy studies undertaken by the
Asian Development Bank (ADB) staff, consultants, or resource persons. The series deals with
key economic and development problems, particularly those facing the Asia and Pacific region;
as well as conceptual, analytical, or methodological issues relating to project/program
economic analysis, and statistical data and measurement. The series aims to enhance the
knowledge on Asia’s development and policy challenges; strengthen analytical rigor and quality
of ADB’s country partnership strategies, and its subregional and country operations; and
improve the quality and availability of statistical data and development indicators for monitoring
development effectiveness.
The ADB Economics Working Paper Series is a quick-disseminating, informal publication
whose titles could subsequently be revised for publication as articles in professional journals or
chapters in books. The series is maintained by the Economics and Research Department.
Printed on recycled paper
CONTENTS
ABSTRACT 1 I. INTRODUCTION 2 II. RELATED LITERATURE 6 III. ESTIMATION 7 A. Empirical Model 7 B. Data 12 C. Results 13 D. Robustness Checks 20 IV. CONCLUSION 21 V. REFERENCES 23

Determinants of Urbanization
Abstract
In light of the United Nations' (UN) latest urbanization projections, par-ticularly with respect to India and the People's Republic of China, a goodunderstanding is needed of what drives aggregate urbanization trends.Yet, previous literature has largely neglected the issue in favor of studyingurban concentration. Taking advantage of the latest UN World Urban-ization Prospects, we use an instrumental variables approach to identifyand analyze key urbanization determinants. We estimate the impact ofgross domestic product (GDP) growth on urbanization to be large andpositive. In answer to Henderson's (2003) �nding that urbanization doesnot seem to cause growth, we argue that the direction of causality runsfrom growth to urbanization. We also �nd positive and signi�cant e�ectsof industrialization and education on urbanization, consistent with theexistence of localization economies and labor market pooling.
Keywords: urbanization, economic growth, education, industrializationJEL classi�cation: R11, O18
Determinants of Urbanization | 2
I Introduction
The purpose of this paper is to identify and analyze determinants of the urban-ization rate, an issue which has so far received limited attention in the academicliterature. Ongoing and future urbanization, particularly in Asia and Africa,presents both opportunities and challenges for many, and a good understandingof the determinants of urbanization is crucial for development planning, businessstrategy setting, and even allocation of aid �ows.
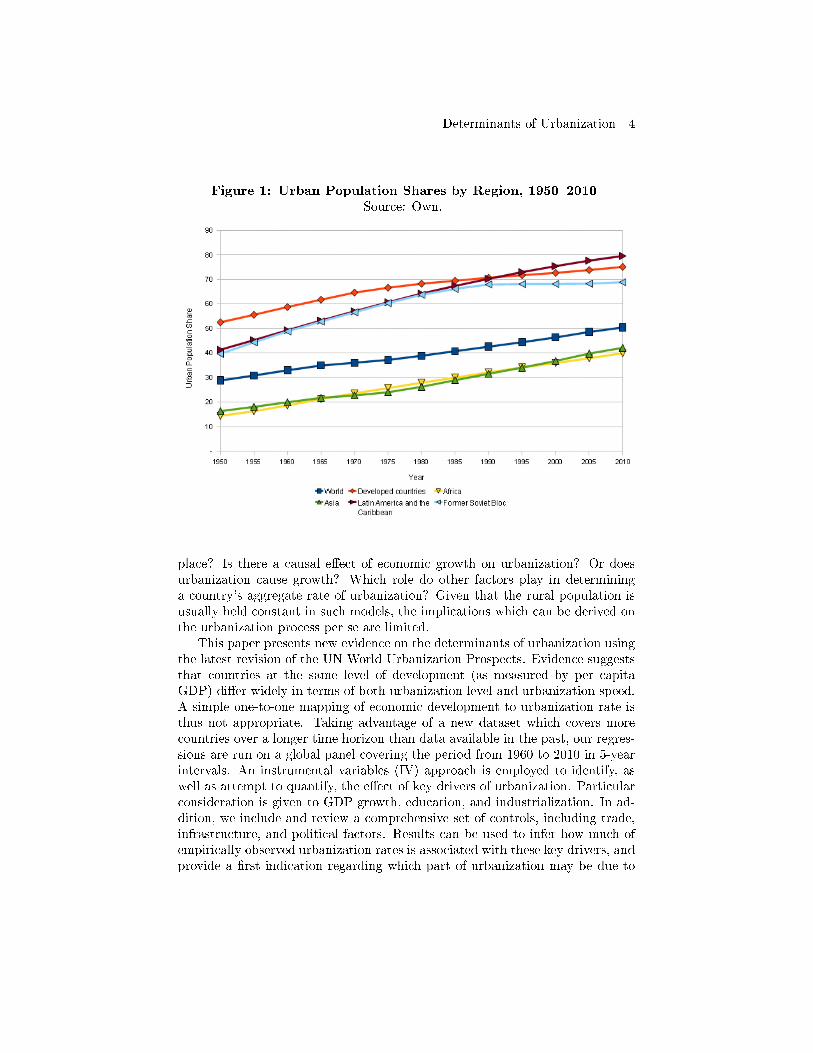
Previous literature has prioritized urban concentration, i.e., the degree towhich a country's urban population is concentrated in one or two major cities(such as in Cambodia, Mongolia, or Japan), rather than spread over manysmaller cities (such as in India and the People's Republic of China (PRC)).Labelling urbanization a �transitory phenomenon,� Henderson (2005) arguesthat the priority given to urban concentration is �arguably appropriate.� Indeed,Figure 1 illustrates that developed countries as well as former Eastern EuropeanSocialist countries seem to have converged to a steady state level of urbanizationaround 1980, with little change over the last 30 years. However, the �gure alsoillustrates a historical gap between the developed world, Latin America, andformer Soviet countries on one side, and Asia and Africa on the other. Asiaand Africa persistently lag behind, but have started to catch up.1 In light ofthe United Nations' (UN's) urbanization projections for the upcoming decades,particularly with respect to the PRC and India, urbanization will continue tobe high up on the policy agenda of developing countries for substantial time tocome. While it may be a transitory phenomenon, it is an ongoing and essentialpart of economic development, and as such an interesting subject for academicresearch.
Looking at the data, the past 50 years have seen a surge in the urban popu-lation of many countries around the world, with little indication of slowing downin the near future. The latest revision of the UN World Urbanization Prospects(2011)2 predicts the world's urban population to increase by 1.4 billion between2010 and 2030, implying that close to 60% of the world's population (currently50%) will live in cities by 2030. The PRC alone (which accounts for 270 millionof the predicted increase) will have 221 cities with a population of one millionor more � compared with 35 such cities in Europe today.3 In addition to thesize of current urbanization trends, the speed with which metropolitan areasattract rural residents is unprecedented: A comparison of the time that it tooklarge cities to grow from 1 million to 8 million inhabitants yields a period of 130years for London, 45 years for Bangkok, 37 years for Dhaka, and 25 years forSeoul.4 This rural�urban migration has wide-ranging implications along manydimensions, most notably economic performance and e�ciency, environment
1Note that there is substantial within-continent heterogeneity, such as between NorthAfrica and Sub-Saharan Africa, or between South Asia and West Asia/the Middle East. Oneimplication is that the large urbanization surges experienced by individual countries (like thePRC or Brazil) may be diluted in the �gure due to continent aggregation.
2United Nations (2011).3McKinsey Global Institute (2009).4Asian Development Bank (2008).
Determinants of Urbanization | 3
and infrastructure, as well as education and health.An immediate question to ask is why cities develop and exist. Why is it such
an �economic law� that countries urbanize as they develop? The standard an-swer suggested by an extensive body of research is that economic developmentinvolves the structural transformation from an agricultural-based economy toan industry service-based economy.5 Industrialization in turn is believed toinvolve urbanization, as externalities of scale in manufacturing and services at-tract �rms and workers into the cities.6 The literature on scale externalities andknowledge spillovers is enormous, and has served as a basis to explaining theforces of agglomeration that are central to the study of urbanization. The idea ofscale externalities goes back to Marshall (1890), who suggested that �rms' pro-duction costs decrease with the size of their own industry, e.g., through betterlocal infrastructure and within-industry knowledge spillovers. The subsequentliterature distinguishes between such �localization economies� (scale externali-ties arising from the local concentration of economic activity within an industry,i.e., from local industry size) and �urbanization economies� � scale economiesarising from the agglomeration (and possibly diversity) of economic activity perse, i.e., from city size. As suggested by Jacobs (1969), the latter may be relevantin particular for industries which rely heavily on R&D and marketing. Attemptsto model the microfoundations of such externalities are numerous and includediscussions on labor market pooling, input sharing, and knowledge spillovers.7
However, few studies focus on the occurrence of urbanization as such, despitea considerable literature on urban concentration, i.e., the geographical disper-sion of a given urban population. Much of the theory literature has focusedon equilibrium city sizes, and endogenized the trade-o� between scale exter-nalities in production versus rising costs of housing and congestion.8 Zipf'sLaw has been promoted as an approximation to the equilibrium distributionof city sizes, whereas Gibrat's Law arguably provides insights into city growthprocesses.9 Finally, an important strand in the literature are the so-termed core-periphery models, following the in�uential work of Krugman (1991) on spatialagglomerations. The core-periphery models examine the conditions under whichmanufacturing and population agglomerations concentrate in one region, ratherthan spreading over several regions.10 However, both endogenous models ofcity sizes and core-periphery models provide few insights into what determinesthe total urban population of a country, independently of its distribution acrosscities. What causes people to relocate from rural areas to the cities in the �rst
5Henderson (2003).6See e.g., Henderson (1974), Quigley (1998), and Duranton and Puga (2001).7See e.g., Rosenthal and Strange (2001) for an examination of the microfoundations of
agglomeration economies for the United States (US) manufacturing industries.8See e.g., Henderson (1974), as well as the core-periphery reversal in Helpman (1998) and
Tabuchi (1998).9Zipf's Law suggests that the equilibrium distribution of city sizes can be approximated
by a pareto distribution, such that city rank multiplied by city size is a constant. Gibrat'sLaw alleges that a city's growth rate is independent of city size. For a study on empiricalvalidation, see Ioannides and Overman (2003) or Black and Henderson (2003).
10For a review of core-periphery models, see Henderson (2003).
Determinants of Urbanization | 4
Figure 1: Urban Population Shares by Region, 1950�2010
Source: Own.
place? Is there a causal e�ect of economic growth on urbanization? Or doesurbanization cause growth? Which role do other factors play in determininga country's aggregate rate of urbanization? Given that the rural population isusually held constant in such models, the implications which can be derived onthe urbanization process per se are limited.
This paper presents new evidence on the determinants of urbanization usingthe latest revision of the UN World Urbanization Prospects. Evidence suggeststhat countries at the same level of development (as measured by per capitaGDP) di�er widely in terms of both urbanization level and urbanization speed.A simple one-to-one mapping of economic development to urbanization rate isthus not appropriate. Taking advantage of a new dataset which covers morecountries over a longer time horizon than data available in the past, our regres-sions are run on a global panel covering the period from 1960 to 2010 in 5-yearintervals. An instrumental variables (IV) approach is employed to identify, aswell as attempt to quantify, the e�ect of key drivers of urbanization. Particularconsideration is given to GDP growth, education, and industrialization. In ad-dition, we include and review a comprehensive set of controls, including trade,infrastructure, and political factors. Results can be used to infer how much ofempirically observed urbanization rates is associated with these key drivers, andprovide a �rst indication regarding which part of urbanization may be due to
Determinants of Urbanization | 5
country-speci�c factors (such as the Hukou system in the PRC).11
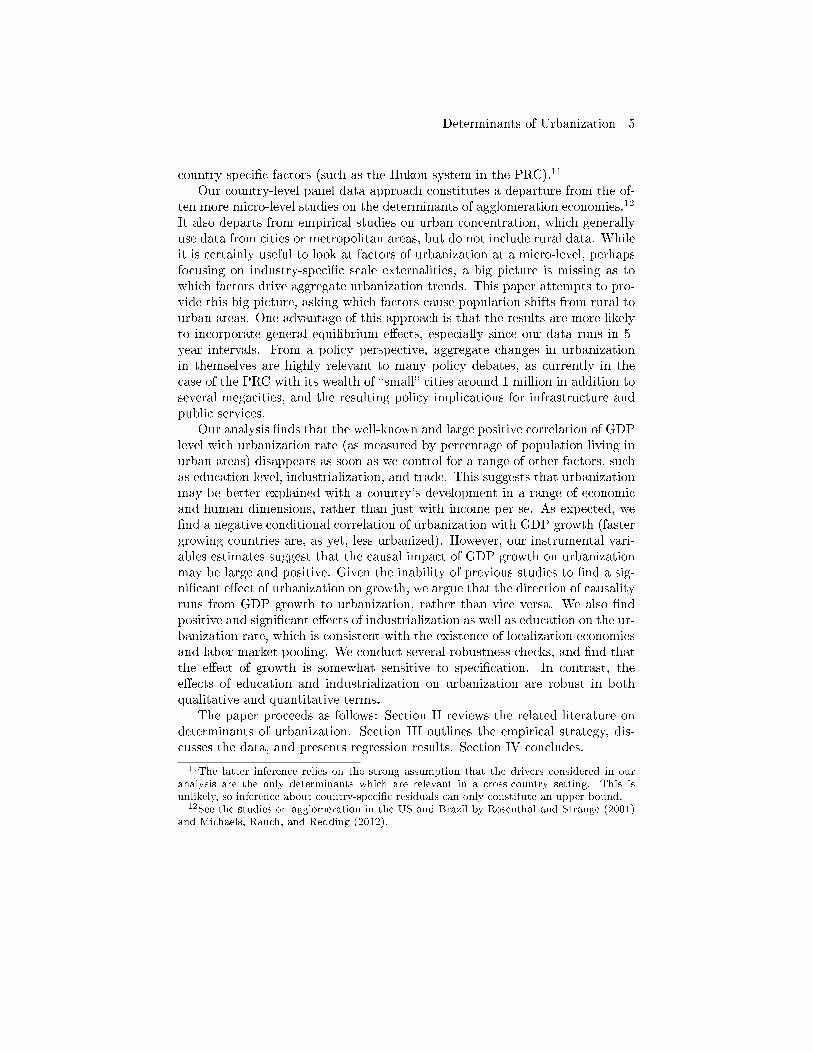
Our country-level panel data approach constitutes a departure from the of-ten more micro-level studies on the determinants of agglomeration economies.12
It also departs from empirical studies on urban concentration, which generallyuse data from cities or metropolitan areas, but do not include rural data. Whileit is certainly useful to look at factors of urbanization at a micro-level, perhapsfocusing on industry-speci�c scale externalities, a big picture is missing as towhich factors drive aggregate urbanization trends. This paper attempts to pro-vide this big picture, asking which factors cause population shifts from rural tourban areas. One advantage of this approach is that the results are more likelyto incorporate general equilibrium e�ects, especially since our data runs in 5-year intervals. From a policy perspective, aggregate changes in urbanizationin themselves are highly relevant to many policy debates, as currently in thecase of the PRC with its wealth of �small� cities around 1 million in addition toseveral megacities, and the resulting policy implications for infrastructure andpublic services.
Our analysis �nds that the well-known and large positive correlation of GDPlevel with urbanization rate (as measured by percentage of population living inurban areas) disappears as soon as we control for a range of other factors, suchas education level, industrialization, and trade. This suggests that urbanizationmay be better explained with a country's development in a range of economicand human dimensions, rather than just with income per se. As expected, we�nd a negative conditional correlation of urbanization with GDP growth (fastergrowing countries are, as yet, less urbanized). However, our instrumental vari-ables estimates suggest that the causal impact of GDP growth on urbanizationmay be large and positive. Given the inability of previous studies to �nd a sig-ni�cant e�ect of urbanization on growth, we argue that the direction of causalityruns from GDP growth to urbanization, rather than vice versa. We also �ndpositive and signi�cant e�ects of industrialization as well as education on the ur-banization rate, which is consistent with the existence of localization economiesand labor market pooling. We conduct several robustness checks, and �nd thatthe e�ect of growth is somewhat sensitive to speci�cation. In contrast, thee�ects of education and industrialization on urbanization are robust in bothqualitative and quantitative terms.
The paper proceeds as follows: Section II reviews the related literature ondeterminants of urbanization. Section III outlines the empirical strategy, dis-cusses the data, and presents regression results. Section IV concludes.
11The latter inference relies on the strong assumption that the drivers considered in ouranalysis are the only determinants which are relevant in a cross-country setting. This isunlikely, so inference about country-speci�c residuals can only constitute an upper bound.
12See the studies on agglomeration in the US and Brazil by Rosenthal and Strange (2001)and Michaels, Rauch, and Redding (2012).
Determinants of Urbanization | 6
II Related Literature
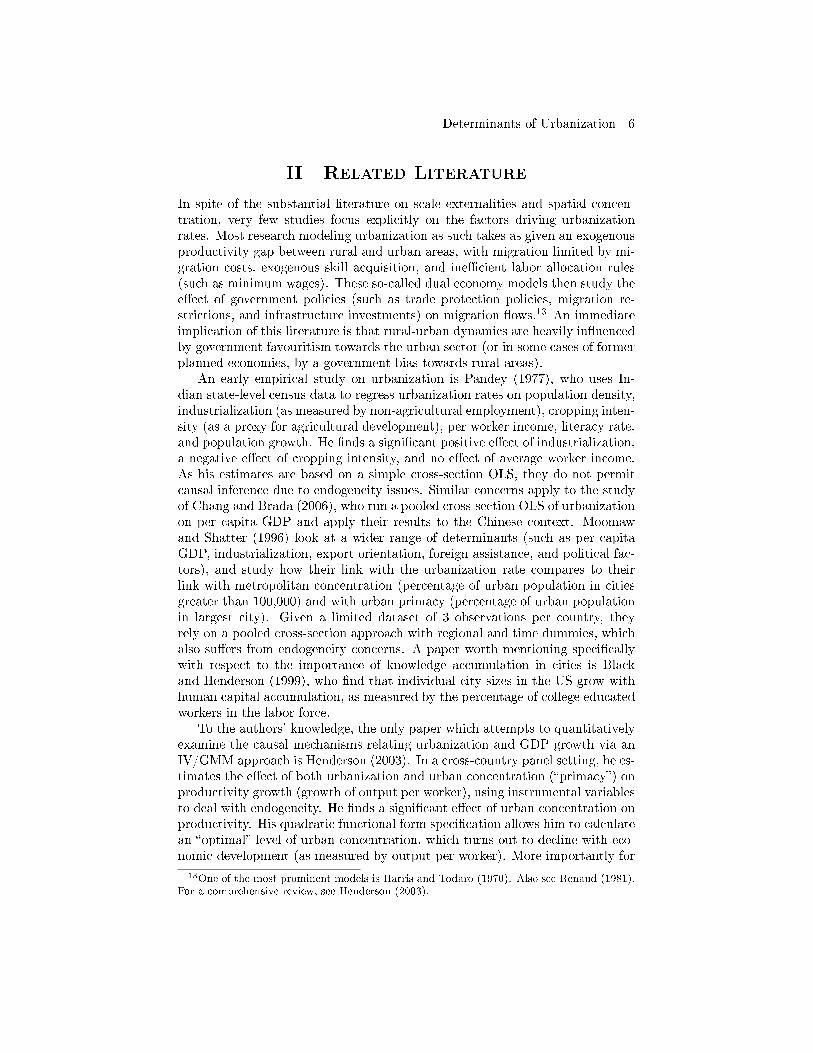
In spite of the substantial literature on scale externalities and spatial concen-tration, very few studies focus explicitly on the factors driving urbanizationrates. Most research modeling urbanization as such takes as given an exogenousproductivity gap between rural and urban areas, with migration limited by mi-gration costs, exogenous skill acquisition, and ine�cient labor allocation rules(such as minimum wages). These so-called dual economy models then study thee�ect of government policies (such as trade protection policies, migration re-strictions, and infrastructure investments) on migration �ows.13 An immediateimplication of this literature is that rural-urban dynamics are heavily in�uencedby government favouritism towards the urban sector (or in some cases of formerplanned economies, by a government bias towards rural areas).
An early empirical study on urbanization is Pandey (1977), who uses In-dian state-level census data to regress urbanization rates on population density,industrialization (as measured by non-agricultural employment), cropping inten-sity (as a proxy for agricultural development), per worker income, literacy rate,and population growth. He �nds a signi�cant positive e�ect of industrialization,a negative e�ect of cropping intensity, and no e�ect of average worker income.As his estimates are based on a simple cross-section OLS, they do not permitcausal inference due to endogeneity issues. Similar concerns apply to the studyof Chang and Brada (2006), who run a pooled cross-section OLS of urbanizationon per capita GDP and apply their results to the Chinese context. Moomawand Shatter (1996) look at a wider range of determinants (such as per capitaGDP, industrialization, export orientation, foreign assistance, and political fac-tors), and study how their link with the urbanization rate compares to theirlink with metropolitan concentration (percentage of urban population in citiesgreater than 100,000) and with urban primacy (percentage of urban populationin largest city). Given a limited dataset of 3 observations per country, theyrely on a pooled cross-section approach with regional and time dummies, whichalso su�ers from endogeneity concerns. A paper worth mentioning speci�callywith respect to the importance of knowledge accumulation in cities is Blackand Henderson (1999), who �nd that individual city sizes in the US grow withhuman capital accumulation, as measured by the percentage of college educatedworkers in the labor force.
To the authors' knowledge, the only paper which attempts to quantitativelyexamine the causal mechanisms relating urbanization and GDP growth via anIV/GMM approach is Henderson (2003). In a cross-country panel setting, he es-timates the e�ect of both urbanization and urban concentration (�primacy�) onproductivity growth (growth of output per worker), using instrumental variablesto deal with endogeneity. He �nds a signi�cant e�ect of urban concentration onproductivity. His quadratic functional form speci�cation allows him to calculatean �optimal� level of urban concentration, which turns out to decline with eco-nomic development (as measured by output per worker). More importantly for
13One of the most prominent models is Harris and Todaro (1970). Also see Renaud (1981).For a comprehensive review, see Henderson (2003).
Determinants of Urbanization | 7
our analysis, his study �nds no signi�cant causal e�ect of urbanization on perworker output. His results suggest that GDP growth is not strongly driven byurbanization rate per se. Considering a raw correlation of 0.85 between urban-ization and GDP in his data, an obvious question to ask is whether the causalityruns in the opposite direction, i.e., whether GDP growth causes urbanization.This is one of the questions that our paper sets out to answer.
III Estimation
III.A Empirical Model
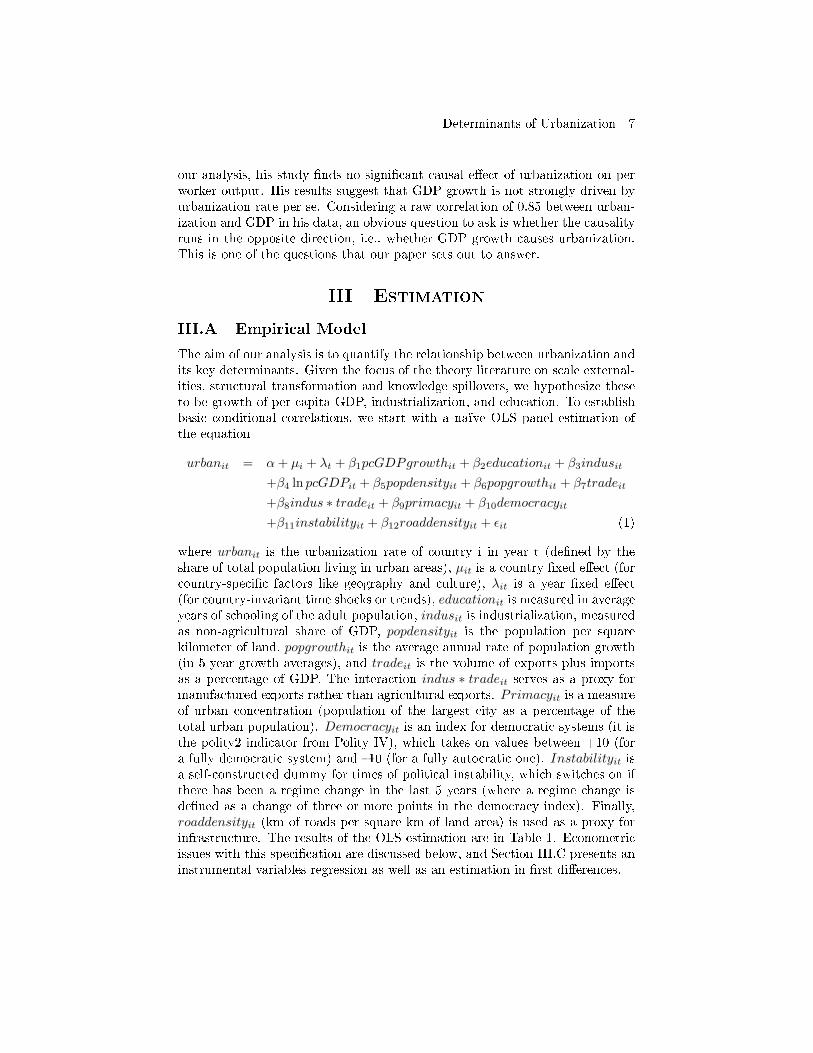
The aim of our analysis is to quantify the relationship between urbanization andits key determinants. Given the focus of the theory literature on scale external-ities, structural transformation and knowledge spillovers, we hypothesize theseto be growth of per capita GDP, industrialization, and education. To establishbasic conditional correlations, we start with a naïve OLS panel estimation ofthe equation
urbanit = α+ µi + λt + β1pcGDPgrowthit + β2educationit + β3indusit
+β4 ln pcGDPit + β5popdensityit + β6popgrowthit + β7tradeit
+β8indus ∗ tradeit + β9primacyit + β10democracyit
+β11instabilityit + β12roaddensityit + εit (1)
where urbanit is the urbanization rate of country i in year t (de�ned by theshare of total population living in urban areas), µit is a country �xed e�ect (forcountry-speci�c factors like geography and culture), λit is a year �xed e�ect(for country-invariant time shocks or trends), educationit is measured in averageyears of schooling of the adult population, indusit is industrialization, measuredas non-agricultural share of GDP, popdensityit is the population per squarekilometer of land, popgrowthit is the average annual rate of population growth(in 5-year growth averages), and tradeit is the volume of exports plus importsas a percentage of GDP. The interaction indus ∗ tradeit serves as a proxy formanufactured exports rather than agricultural exports. Primacyit is a measureof urban concentration (population of the largest city as a percentage of thetotal urban population). Democracyit is an index for democratic systems (it isthe polity2 indicator from Polity IV), which takes on values between +10 (fora fully democratic system) and �10 (for a fully autocratic one). Instabilityit isa self-constructed dummy for times of political instability, which switches on ifthere has been a regime change in the last 5 years (where a regime change isde�ned as a change of three or more points in the democracy index). Finally,roaddensityit (km of roads per square km of land area) is used as a proxy forinfrastructure. The results of the OLS estimation are in Table 1. Econometricissues with this speci�cation are discussed below, and Section III.C presents aninstrumental variables regression as well as an estimation in �rst di�erences.
Determinants of Urbanization | 8
Discussion of Regressors
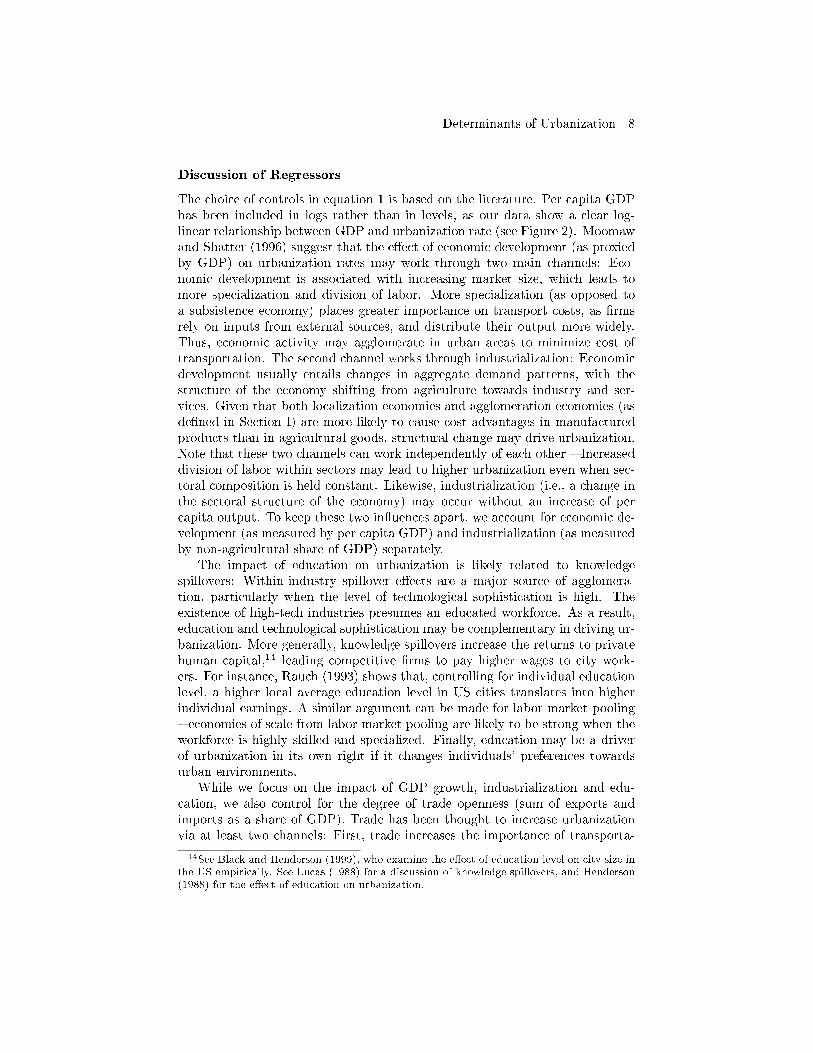
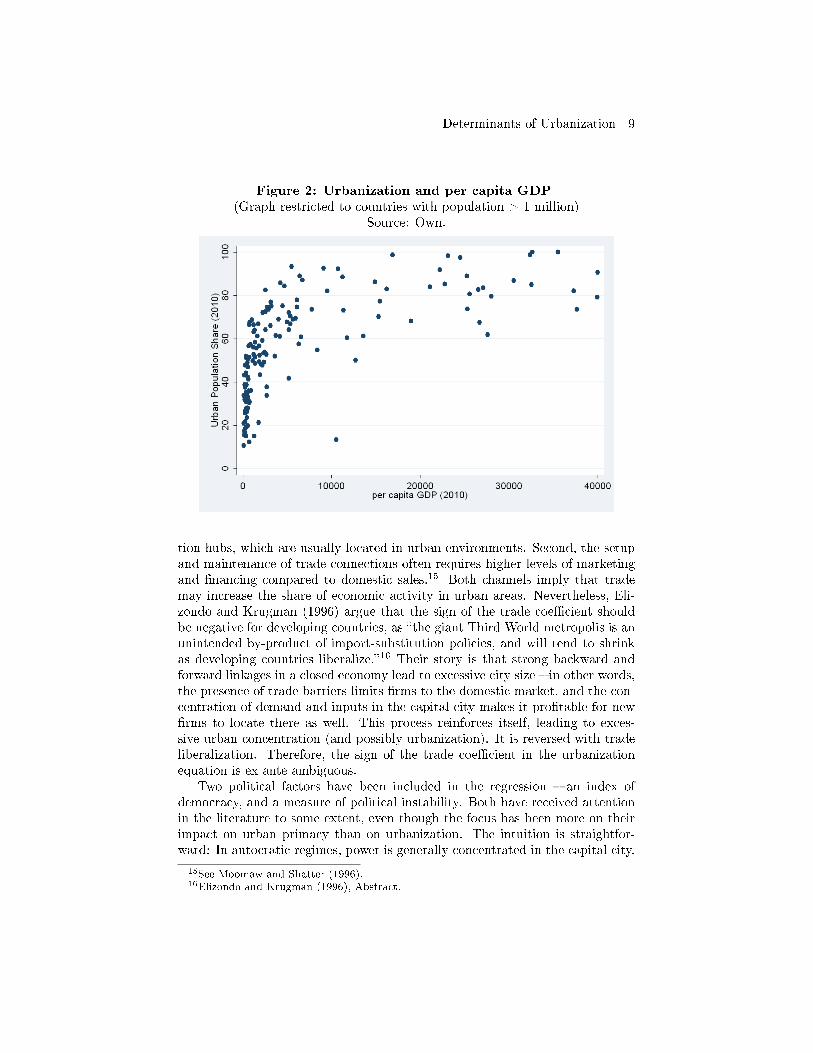
The choice of controls in equation 1 is based on the literature. Per capita GDPhas been included in logs rather than in levels, as our data show a clear log-linear relationship between GDP and urbanization rate (see Figure 2). Moomawand Shatter (1996) suggest that the e�ect of economic development (as proxiedby GDP) on urbanization rates may work through two main channels: Eco-nomic development is associated with increasing market size, which leads tomore specialization and division of labor. More specialization (as opposed toa subsistence economy) places greater importance on transport costs, as �rmsrely on inputs from external sources, and distribute their output more widely.Thus, economic activity may agglomerate in urban areas to minimize cost oftransportation. The second channel works through industrialization: Economicdevelopment usually entails changes in aggregate demand patterns, with thestructure of the economy shifting from agriculture towards industry and ser-vices. Given that both localization economies and agglomeration economies (asde�ned in Section I) are more likely to cause cost advantages in manufacturedproducts than in agricultural goods, structural change may drive urbanization.Note that these two channels can work independently of each other � Increaseddivision of labor within sectors may lead to higher urbanization even when sec-toral composition is held constant. Likewise, industrialization (i.e., a change inthe sectoral structure of the economy) may occur without an increase of percapita output. To keep these two in�uences apart, we account for economic de-velopment (as measured by per capita GDP) and industrialization (as measuredby non-agricultural share of GDP) separately.
The impact of education on urbanization is likely related to knowledgespillovers: Within-industry spillover e�ects are a major source of agglomera-tion, particularly when the level of technological sophistication is high. Theexistence of high-tech industries presumes an educated workforce. As a result,education and technological sophistication may be complementary in driving ur-banization. More generally, knowledge spillovers increase the returns to privatehuman capital,14 leading competitive �rms to pay higher wages to city work-ers. For instance, Rauch (1993) shows that, controlling for individual educationlevel, a higher local average education level in US cities translates into higherindividual earnings. A similar argument can be made for labor market pooling� economies of scale from labor market pooling are likely to be strong when theworkforce is highly skilled and specialized. Finally, education may be a driverof urbanization in its own right if it changes individuals' preferences towardsurban environments.
While we focus on the impact of GDP growth, industrialization and edu-cation, we also control for the degree of trade openness (sum of exports andimports as a share of GDP). Trade has been thought to increase urbanizationvia at least two channels: First, trade increases the importance of transporta-
14See Black and Henderson (1999), who examine the e�ect of education level on city size inthe US empirically. See Lucas (1988) for a discussion of knowledge spillovers, and Henderson(1988) for the e�ect of education on urbanization.
Determinants of Urbanization | 9
Figure 2: Urbanization and per capita GDP
(Graph restricted to countries with population > 1 million)Source: Own.
tion hubs, which are usually located in urban environments. Second, the setupand maintenance of trade connections often requires higher levels of marketingand �nancing compared to domestic sales.15 Both channels imply that trademay increase the share of economic activity in urban areas. Nevertheless, Eli-zondo and Krugman (1996) argue that the sign of the trade coe�cient shouldbe negative for developing countries, as �the giant Third World metropolis is anunintended by-product of import-substitution policies, and will tend to shrinkas developing countries liberalize.�16 Their story is that strong backward andforward linkages in a closed economy lead to excessive city size � in other words,the presence of trade barriers limits �rms to the domestic market, and the con-centration of demand and inputs in the capital city makes it pro�table for new�rms to locate there as well. This process reinforces itself, leading to exces-sive urban concentration (and possibly urbanization). It is reversed with tradeliberalization. Therefore, the sign of the trade coe�cient in the urbanizationequation is ex ante ambiguous.
Two political factors have been included in the regression � an index ofdemocracy, and a measure of political instability. Both have received attentionin the literature to some extent, even though the focus has been more on theirimpact on urban primacy than on urbanization. The intuition is straightfor-ward: In autocratic regimes, power is generally concentrated in the capital city.
15See Moomaw and Shatter (1996).16Elizondo and Krugman (1996), Abstract.

Determinants of Urbanization | 10
Political representation and access to power of the rural population are virtu-ally nonexistent. Autocratic governments are able to make decisions withoutconsideration of a spatially dispersed wider population. Instead, they rely onthe support of small wealthy elites to stay in power. As a consequence, they willtend to strongly favour urban elites in the allocation of public resources. Suchurban favouritism has implications both for consumption of public goods (e.g.,health and education services) as well as for investment and economic growth(rural areas will receive less investment in infrastructure, which further detersprivate capital �ows and impedes economic growth of these regions).17 As aresult, autocratic regimes create strong incentives to migrate to urban areas. Anecessary reservation for autocracies is that the political agenda in former so-cialist economies may have a rural focus rather than an urban one. Given thatthese regimes are just as likely to rely on the support of small elites, however,it is not clear whether this will translate into a de facto rural bias. In contrast,democracy grants higher political representation to dispersed rural majorities,thus reducing migration incentives. While the quantitative impact of democ-racy on urbanization is unknown, Davis and Henderson (2003) �nd the e�ect ofdemocracy on urban concentration to be signi�cant and positive.
Independent of the form of government, political instability in itself cancause urbanization. As a regime struggles to stay in power, organized popularresistance in the cities where the ruling elite is located poses a more seriousthreat than a disorganized and geographically dispersed rural population. As aconsequence, the regime is more likely to give in to the demands of the urbanpopulation, and divert resources to content the urban population through con-sumption subsidies, protection from high taxes and the like.18 Cities may alsoprovide higher safety levels than rural areas in times of political con�ict. All ofthese factors increase the relative attractiveness of living in a city.
The importance of urban concentration, as often measured by primacy (shareof urban population living in the largest city) has been widely recognized in theliterature, as illustrated in Section I.19 We control for it in our regression ofurbanization to allow for the possibility that a higher concentration of popula-tion in a country's largest city is also associated with a higher urbanization rateoverall. A measure of population density is included to account for countrieswith a small area of land relative to their population size, which neccesarilyleads to more urban agglomeration. Population growth can a�ect urbanizationeither directly (via di�erential growth in urban vs. rural areas), or throughan e�ect on migration. For instance, high rural population growth in areas ofsubsistence agriculture may trigger grown-up children to move to the cities asfamily sizes outgrow the economic possibilities of the farm.
Finally, we expect infrastructure to play a signi�cant role in urbanization.Better infrastructure is associated with lower transport costs, which in turnreduces incentives to locate economic activity in overcrowded cities where land
17See e.g., the discussion of political factors by Petrakos and Brada (1989).18Petrakos and Brada (1989) provide a more detailed explanation of urbanization forces
during times of political instability, including possible e�ects on investment levels.19See Henderson (2003) as a main reference for the discussion on urban primacy.
Determinants of Urbanization | 11
prices are high. In contrast, lack of infrastructure gives �rms no choice but to lo-cate close to their input markets and consumers, which fuels agglomeration. Therole of infrastructure has been prominently featured in the core-periphery litera-ture: Core-periphery models following Krugman (1991) examine what happensto urban concentration in core regions and periphery regions in the presence oftechnological progress, where technological progress is often captured as a fallin transport costs.20
Econometric Issues
A number of econometric issues are evident with this speci�cation. First, theregressors are unlikely to be exogenous to the error term due to reverse causality,third factor causation and omitted variable bias, all of which invalidate causalinference. For instance, a correlation between urbanization and education couldbe caused by any of the following: (i) education may cause urbanization, asa more educated population moves to the city to �nd jobs, (ii) urbanizationmay cause education, as education provision is generally higher in cities, so alarger urban population increases average education level, (iii) a third factor(like industrialization) drives both urbanization and education, as a higher levelof industrialization creates high-skill job opportunities which attract workersto the cities and at the same time increases the returns to education. Similararguments can be made for all other regressors. To deal with such endogeneityconcerns, we proceed with an instrumental variables approach in Section III.C.
Second, standard linear regression assumes independently distributed errorsacross countries and time. More plausibly, errors will be clustered at countrylevel. For instance, if a shock hits a country in one period, the impact of thisshock will often last for several periods, leading to serial correlation in the errorstructure. To account for this, we cluster errors at country level, which meansthe estimation is robust to both heteroscedasticity and serial correlation of theerror term. In addition, we allow for country �xed e�ects in order to deal withcountry heterogeneity in urbanization rates.
Third, the regression includes nonstationary variables. We would expect thetime series on GDP, industrialization, trade, education, population density, pri-macy, democracy and infrastructure to be integrated of order 1, i.e., to have unitroots. While this constitutes a possible concern, our analysis uses a panel whichis between 107 and 118 countries wide (depending on speci�cation), and on aver-age six observations (per country) long. This implies the variation which is usedto estimate the coe�cients of interest comes to a large extent from cross-countryvariation, rather than variation over time. Due to the relatively short time se-ries component, for simplicity we stick to the strong assumption of stationarity.Note that clustering errors at country level accounts for strong serial correlationof the error term, which further mitigates nonstationarity concerns. Finally, wealso provide an estimation in �rst di�erences, which estimates the change inurbanization rates as a function of changes in the explanatory variables.
20See Henderson (2005).
Determinants of Urbanization | 12
III.B Data
Our data comes from various sources. Our main source is the 2011 Revision ofthe UNWorld Urbanization Prospects, which provides estimates of urbanizationrates for 229 countries from 1950 to 2010 in 5-year intervals (we exclude futureprojections into 2050 and truncate the data in 2010). Measurements of the urbanpopulation must be taken with care � What classi�es as an �urban area� canvary on country level, with de�nitions corresponding to those used by nationalstatistical o�ces when collecting census data. Such de�nitions may refer tothreshold population levels in a settlement (typically 5,000 or 10,000), but thestatus of a city can also be assigned on administrative, legal or historical reasons.While the UN aims to ensure consistency and adjusts data in particular whencensus de�nitions change over time, we cannot rule out some degree of countryheterogeneity in what constitutes an urban area.
Data on population growth (in 5-year annual growth averages) as well ason population density (population per square km) come from the UN WorldPopulation Prospects (2010 Revision). The data for GDP (in constant 2000 USdollars), agricultural share of GDP, trade (exports plus imports of goods andservices as a share of GDP) and primacy (population in the largest city as apercentage of urban population) come from the World Development Indicators(Revisions of 2011 and 2012). The GDP growth variable is derived from GDPlevel data as a 5-year annual growth average. Industrialization is measuredas non-agricultural share of GDP. Education, as measured by average years oftotal schooling of the adult (25+) population, is provided by Barro and Lee(forthcoming).
Our democracy index is the polity2 indicator from the Polity IV project,21
which measures democratic and autocratic regime characteristics on a scale from+10 (full democracy) to �10 (full autocracy) for 164 countries. Our instabilitydummy is derived from Polity IV's �durable� index, and switches on wheneverthere was a regime change in the last 5 years (where a regime change is de�nedas a change of three or more points in the polity2 index). Lastly, our data onroad density (km of road per square km of land area) is a compilation of theWorld Road Statistics from the International Road Federation.22
We focus our analysis on countries which are still in the process of urbaniz-ing, rather than those who have reached a �steady state� urbanization rate. Todo this, we exclude all country observations with an urbanization rate higherthan 80%. This has the e�ect of excluding present-day observations of many de-veloped countries, but it does include data from the less urbanized past of thesecountries. An additional e�ect is that city states like Singapore and Monacoare excluded from the analysis. We also restrict our dataset to countries witha total population larger than 1 million: Given the large number of tiny states(such as Faeroe Islands or American Samoa), failure to exclude small countrieswould imply that our results will be dominated by the experience of such smallcountries (out of 229 countries in the original UN dataset, 73 have a population
21See Marshall and Jaggers (2010).22See International Road Federation (2010).
Determinants of Urbanization | 13
below 1 million).23
Since the resulting data set is unbalanced, we cannot rule out selection bias:Which data points are missing is not a random process, but in itself a function ofmultiple variables. As a rule, poor countries are more prone to data availabilityproblems, especially in early years. This implies that our coe�cient estimatesmight be driven by rich countries' experience. See Section III.D for robustnesschecks.
III.C Results
Basic OLS Results
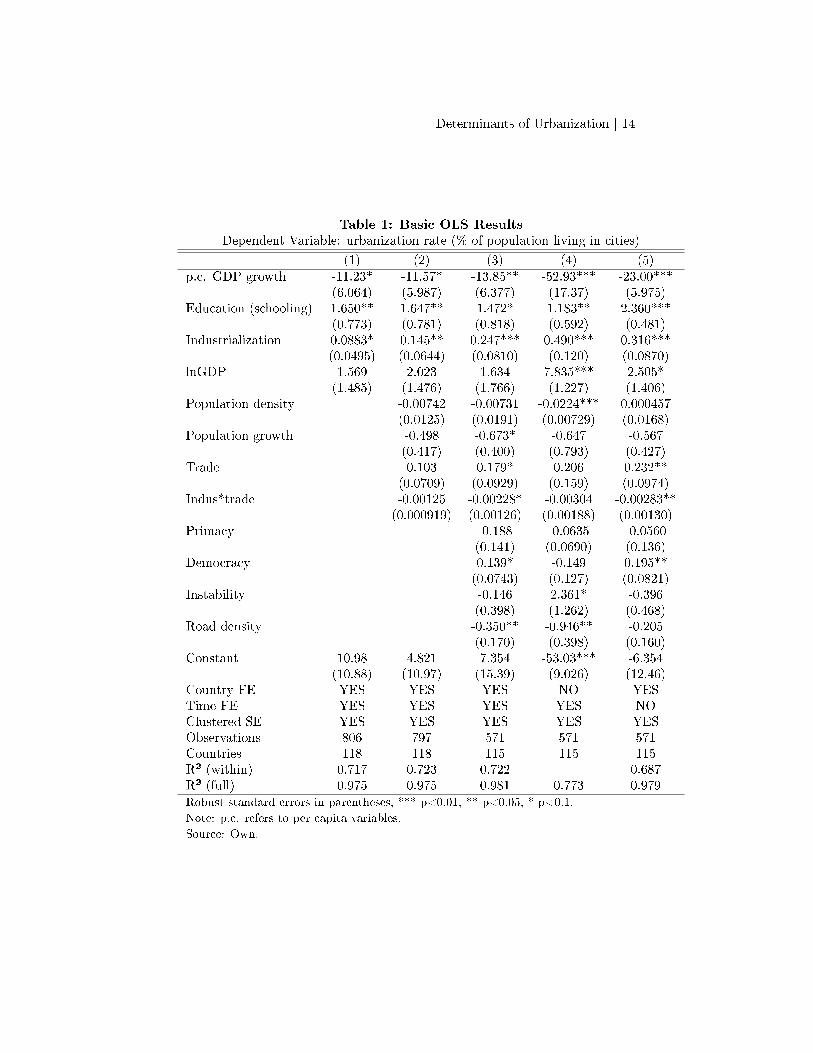
The results of our basic OLS speci�cation are in Table 1. The reported standarderrors are robust to heteroscedasticity and account for country clusters, whichincludes serially correlated errors. Time e�ects λt have been included except incolumn (5). Testing for joint signi�cance of the time dummies yields F (9, 114) =3.84, with p = 0.00 for the null hypothesis of no time e�ects.
Clearly, time e�ects do need to stay in our regression. The case is even moreobvious for country �xed e�ects µi (excluded in column (4)): An F-statisticof 6148 (p = 0.00) suggests that country-speci�c e�ects play a strong role inexplaining a country's urbanization rate. Note that country �xed e�ects willalso soak up the e�ect of factors that have not been included in the regression:If our regression does not include all factors determining urbanization (mostlikely), and the omitted factors are more present in some countries than inothers (on a time average), then this will in�uence country �xed e�ects. Theinterpretation of country �xed e�ects is thus restricted to be the time-averagedpart of a country's urbanization rate that cannot be associated with any of theregressors in our analysis. To mitigate country heterogeneity, we keep country�xed e�ects for the remainder of the analysis, and focus on columns (1) to (3).
Starting from a limited set of regressors and gradually adding in more con-trols, it is reassuring to see that the coe�cients for GDP growth, education andindustrialization stay roughly the same in sign and magnitude, even thoughindusit appears somewhat sensitive to speci�cation. At the same time, they arethe only coe�cients which are consistently signi�cant, no matter which combi-nation of regressors we tried. In contrast, it seems unexpected that the largeunconditional correlation of urbanization with per capita GDP (in our sample,ru,ln y = 0.78 for the log of per capita GDP, and ru,y = 0.56 for the level ofper capita GDP) vanishes completely as soon as we control for either educationor industrialization. We do not �nd any conditional correlation of GDP withurbanization in any speci�cation (the exception being the one without country�xed e�ects). While we cannot draw causal inference, it does suggest that ur-banization may be associated less with income level per se, but more with thestructure of the economy as well as other indicators of human development.
23Four observations are excluded as outliers because of extreme growth experiences: Liberia1990�2000 (GDP declined by 90% between 1985�1995, then rose by 241% by 2000) andTajikistan 1995 (GDP declined by 65% in 5 years).
Determinants of Urbanization | 14
Table 1: Basic OLS Results
Dependent Variable: urbanization rate (% of population living in cities)
(1) (2) (3) (4) (5)p.c. GDP growth -11.23* -11.57* -13.85** -52.93*** -23.00***
(6.064) (5.987) (6.377) (17.37) (5.975)Education (schooling) 1.650** 1.647** 1.472* 1.183** 2.360***
(0.773) (0.781) (0.818) (0.592) (0.481)Industrialization 0.0883* 0.145** 0.247*** 0.490*** 0.316***
(0.0495) (0.0644) (0.0810) (0.120) (0.0870)lnGDP 1.569 2.023 1.634 7.835*** 2.505*
(1.485) (1.476) (1.766) (1.227) (1.406)Population density -0.00742 -0.00731 -0.0224*** 0.000457
(0.0125) (0.0191) (0.00729) (0.0168)Population growth -0.498 -0.673* -0.647 -0.567
(0.417) (0.400) (0.793) (0.427)Trade 0.103 0.179* 0.206 0.232**
(0.0709) (0.0929) (0.159) (0.0974)Indus*trade -0.00125 -0.00228* -0.00304 -0.00283**
(0.000919) (0.00126) (0.00188) (0.00130)Primacy -0.188 -0.0635 -0.0560
(0.141) (0.0690) (0.136)Democracy 0.139* -0.149 0.195**
(0.0743) (0.127) (0.0821)Instability -0.146 2.361* -0.396
(0.398) (1.262) (0.468)Road density -0.350** -0.946** -0.205
(0.170) (0.398) (0.160)Constant 10.98 4.821 7.354 -53.03*** -6.354
(10.88) (10.97) (15.39) (9.026) (12.46)Country FE YES YES YES NO YESTime FE YES YES YES YES NOClustered SE YES YES YES YES YESObservations 806 797 571 571 571Countries 118 118 115 115 115R² (within) 0.717 0.723 0.722 0.687R² (full) 0.975 0.975 0.981 0.773 0.979Robust standard errors in parentheses, *** p<0.01, ** p<0.05, * p<0.1.
Note: p.c. refers to per capita variables.
Source: Own.

Determinants of Urbanization | 15
Looking at the coe�cients for growth, education and industrialization, we�nd a robust negative correlation of urbanization rate (a level variable) with percapita GDP growth. From column (3), a one percent increase in a country's percapita GDP growth rate in our data is associated with a roughly 0.14 percentagepoint lower urbanization rate (note growth is measured as a decimal while urbanis in percentage points). This is not surprising: Countries which experiencedhigh income growth in the past decades tend to be developing or middle-incomecountries. At the same time, developing and middle-income countries are typ-ically at an earlier stage of the urbanization process. This serves as a primeexample for the di�erence between correlation and causation. An IV approachwill provide further insights.
The magnitude of the education coe�cient is robust to the inclusion of con-trol variables, time and country e�ects, and centers around 1.6. This suggeststhat an additional year of schooling in the adult population is associated witha 1.6 percentage point higher urbanization rate. Similarly, our estimates forindustrialization (which generally feature the highest signi�cance levels amongall regressors) indicate that an additional percentage point in the share of non-agricultural GDP is associated with a roughly 0.25 percentage point higherurbanization rate. Both estimates are consistent with the notion that countriesurbanize as a part of their development process, which goes alongside progressin a number of economic, social and human dimensions. We �nd some signi�-cance for other variables, such as population density, trade, democracy and roaddensity. However, these are generally sensitive to speci�cation.
IV Estimation
While the conditional correlations found in the previous section may provideinteresting insights, causal inference is invalid due to possible endogeneity ofthe regressors. In other words, we expect all of the regressors from equation 1to be correlated with the error term. For instance, we might think that factorslike geography or rainfall impact both urbanization rate and GDP growth, bi-asing the GDP coe�cient. An instrumental variables approach will help � butwhich instruments can be used? For GDP growth, we follow Henderson's (2003)approach in instrumenting current changes of variables with past levels of thesevariables, i.e., current growth of per capita GDP is instrumented with GDP(t-2 )(note GDP(t-1 ) cannot be used as it enters GDP growth(t) by construction).Our �rst stages show that past income levels are a strong predictor of currentchanges in income. For education and industrialization, which are both levelvariables, we instrument with education(t-2 ) and industrialization(t-2 ). Onlyone third lag has strong predictive power, and is thus added to our set of in-struments: education(t-3 ), which strongly predicts industrialization. We do notadd third lags of GDP or industrialization, as they have little predictive powerand come in patchy data quality, implying unneccessary loss of observations.
Past levels of these variables predict current levels, which quali�es them asrelevant instruments in our regression. But do they satisfy the orthogonalitycriterion? Orthogonality requires E[Z ′ε] = 0, i.e., instruments must not be cor-
Determinants of Urbanization | 16
related with the error term (where Z is the matrix of instruments). For instance,conditional on the same level of industrialization today, a higher industrializa-tion level in the past should not be able to predict a higher urbanization ratetoday. This may seem counterintuitive, as we may expect past levels of edu-cation and industrialization to belong in the urbanization equation themselves.Two points are worth noting: The �rst is that we are using 5-year data, whichmeans we are instrumenting today's industrialization level with that of 10 yearsago. The second is that adding country �xed e�ects (i.e., using the withinestimator) e�ectively means that our dependent variable is urbanit − urbani,where urbani is the time averaged urbanization of country i. So what we seekto explain are a country's deviations from its own time average. The questionbecomes: Does a shock to industrialization 10 years ago that may have causedurbanization to deviate from its trend at that time still have an e�ect on ur-banization today, holding constant the level of current industrialization?24 Thisquestion is much less obvious, and we look to the data to answer it. As a testof overidentifying restrictions, we regress the IV residuals in the 2SLS case onthe full set of instruments, yielding a Sargan's statistic of 0.539 (p = 0.46),which supports the null hypothesis that our instruments are uncorrelated withthe error term. A possible interpretation of this is that the urbanization processadjusts relatively fast to the current environment, and that the impact of pastshocks diminishes quickly. We thus proceed with an IV estimation of
urbanit = α+µi+λt+β1pcGDPgrowthit+β2educationit+β3indusit+εit (2)
We focus on these key regressors for the sake of parsimonious modeling � withall control variables being potentially endogenous, we would have to instrumentall of them. Note that we also eliminate GDP level as a regressor, and chooseto focus on GDP growth instead.
Our IV �rst stages are strong: GDP growth is strongly predicted by GDP(t-2 )and industrialization(t-2 ), but not by lags of education. Education is predictedby education(t-2 ). Both GDP growth and education have strong time e�ects.Industrialization is predicted by education(t-3 ) (but not by education(t-2 )) andindustrialization(t-2 ). The F-tests for the joint signi�cance of the four instru-ments in the �rst stages for GDP growth, education and industrialization areFg(4, 106) = 12.01, Fe(4, 106) = 49.24, and Fi(4, 106) = 17.58, respectively,with p-values of 0.00 in all cases. Even with strong individual �rst stages, themodel may be underidenti�ed if there is multicollinearity in the common matrixof �rst stages. To account for this, we run an underidenti�cation test, whichtests the relevance condition that the matrix E[Z ′X] has full column rank. We�nd a Kleibergen-Paap LM statistic of 13.13, with a p-value of 0.001, implyingthe matrix has full column rank and the relevance condition is satis�ed.
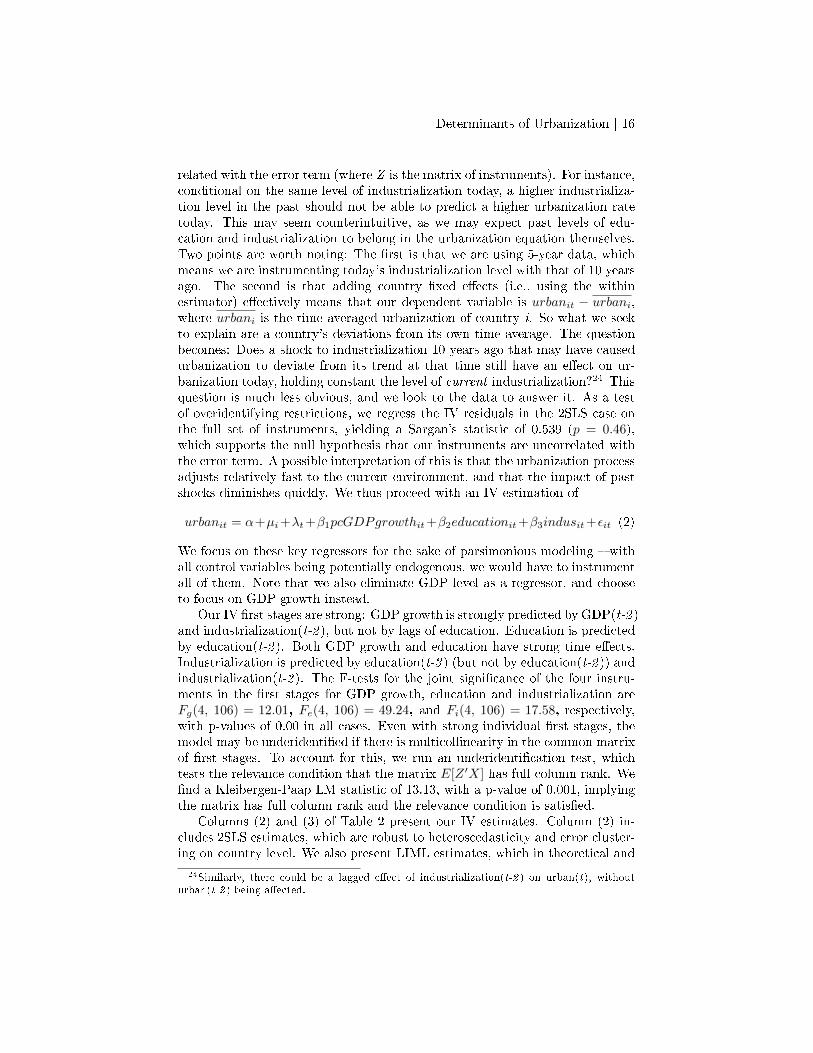
Columns (2) and (3) of Table 2 present our IV estimates. Column (2) in-cludes 2SLS estimates, which are robust to heteroscedasticity and error cluster-ing on country level. We also present LIML estimates, which in theoretical and
24Similarly, there could be a lagged e�ect of industrialization(t-2 ) on urban(t), withouturban(t-2 ) being a�ected.
Determinants of Urbanization | 17
Table 2: Instrumental Variables Estimation
Dependent Variable: urbanization rate (% of population living in cities)
(1) OLS (2) 2SLS (3) LIML (4) GMMp.c. GDP growth -8.184 90.88** 94.31** 80.68*
(5.370) (45.50) (47.20) (43.32)Education (schooling) 1.814** 2.224** 2.233** 1.978*
(0.809) (1.118) (1.125) (1.067)Industrialization 0.121** 0.405*** 0.409*** 0.412***
(0.0540) (0.142) (0.144) (0.142)Country FE YES YES YES YESTime FE YES YES YES YESClustered SE YES YES YES YESObservations 806 607 607 607Countries 118 107 107 107R² (within) 0.715 0.440 0.425 0.471Robust standard errors in parentheses, *** p<0.01, ** p<0.05, * p<0.1.
Instruments used for 2SLS, LIML and GMM are l2GDP, l2education,
l3education and l2indus.
Source: Own.
Monte Carlo exercises have been argued to feature smaller �nite-sample biasesand better con�dence intervals than 2SLS estimates, as well as GMM estimates.
Basing interpretations on the 2SLS estimates, and presuming the validityof our instruments, we estimate positive e�ects of all three factors, i.e., GDPgrowth, education, and industrialization on a country's urbanization rate. Morespeci�cally, we estimate that a one percentage point increase in GDP growthwill cause a 0.9 percentage point higher urbanization rate. This is interesting inparticular with respect to our OLS results, which show a negative conditionalcorrelation of GDP growth with urbanization. In other words, our data areconsistent with the intuition that early stages of development with high ratesof GDP growth are associated with (yet) low levels of urbanization, yet atthe same time GDP growth causes urbanization to increase. For education,the coe�cient is stable around 2 for both OLS and IV estimates, suggestingthat one more year of schooling of the adult population causes urbanizationto increase by 2 percentage points. Note that this coe�cient is similar to theestimates from the full OLS speci�cation in Table 1. Finally, our IV estimateof the e�ect of industrialization is around 0.4, which is about threefold the OLScoe�cient. Thus, the estimated impact of a one percentage point increase inthe non-agricultural share of GDP is to increase urbanization by 0.4 percentagepoints.
Estimation in Contemporary Changes
We complement our analysis of urbanization rates with an estimation that fo-cuses purely on contemporary changes of variables. To do so, we take the �rst
Determinants of Urbanization | 18
di�erence of level variables such as urbanization, education, and industrializa-tion. We keep regressors which already express growth rates, such as growth ofper capita GDP and population growth. We further keep our dummy for po-litical instability, which indicates contemporary changes in the political regimeof a country. For the sake of simplicity, we drop level variables like populationdensity and the democracy index, as the information contained in changes ofthese variables is already considered by including population growth and polit-ical instability.25 In the full speci�cation, the estimating equation becomes
∆urbanit = α+ µi + λt + β1pcGDPgrowthit + β2∆educationit + β3∆indusit
+β4popgrowthit + β5∆tradeit + β6∆indus ∗ tradeit+β7∆primacyit + β8instabilityit + β9∆roaddensityit + εit. (3)
The objective of this complementary analysis is twofold: First, it gives a di�erentangle to the research question. As mentioned in the previous section, the country�xed e�ects imply that we have explained a country's deviations from its timeaveraged urbanization levels using deviations from time averaged regressors,i.e., we have implicitly estimated urbanit − urbani = (xit − x̄i)
′β + vit − v̄i,where country �xed e�ects are µi = urbani − x̄′iβ + v̄i (a bar over a variabledenotes a time average). In contrast, equation 3 explains a country's changein urbanization rate since the last period (5 years ago) using changes in theregressors since the last period.26 The interpretation is slightly di�erent: Whileequation 3 focuses exclusively on contemporary changes, equations 1 and 2 aremore sensitive to changes that have built up over a longer time period (as theyare measured relative to a time average).
The second objective is to provide an alternative perspective given possiblenonstationarity concerns (see the section on econometric issues). All variablesin equation 3 are stationary time series,27 permitting standard linear regressiontechniques. Note that any serial correlation will be accounted for through errorclustering at country level.
We start with a full OLS speci�cation to establish conditional correlationsin column (1) of Table 3, analogous to the level speci�cation in Table 1. Sig-ni�cance levels di�er markedly from the level speci�cation, and growth of percapita GDP is now positively correlated with changes in urbanization. An in-teresting correlation emerges between the change in the urbanization rate andpolitical instability: Periods of political regime changes are frequently associ-
25This is an approximation. Given a constant area of land, and popgrowthit =∆popit/popi,t−1, we have ∆popdensityit = ∆popit/areai = popgrowthit · (popi,t−1/areai).For changes in the democracy index, we lose some information by restricting ourselves to theinstability dummy, which switches on when democracy changes by 3 or more.
26Strictly speaking, since we still include country �xed e�ects, the dependent variable is thechange in urbanization since the last period minus the average change in urbanization overall 5-year periods. The interpretation is very similar.
27We do not conduct unit root tests on our data set as the time series component is tooshort to allow reliable inference. However, it is a common �nding in the empirical literaturethat macroeconomic time series such as GDP and industrialization tend to be integrated oforder 1, implying that their �rst di�erence is stationary.
Determinants of Urbanization | 19
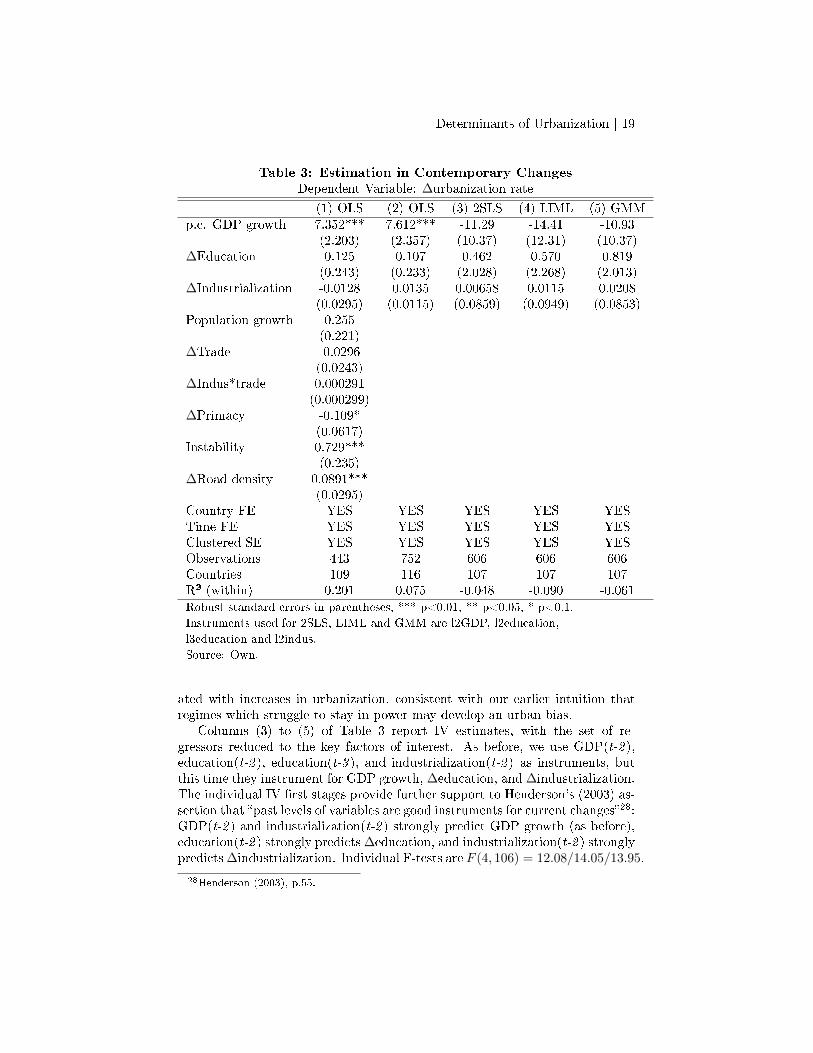
Table 3: Estimation in Contemporary Changes
Dependent Variable: Δurbanization rate
(1) OLS (2) OLS (3) 2SLS (4) LIML (5) GMMp.c. GDP growth 7.352*** 7.612*** -11.29 -14.41 -10.93
(2.203) (2.357) (10.37) (12.31) (10.37)ΔEducation 0.125 0.107 0.462 0.570 0.819
(0.243) (0.233) (2.028) (2.268) (2.013)ΔIndustrialization -0.0128 0.0135 0.00658 0.0115 0.0208
(0.0295) (0.0115) (0.0859) (0.0949) (0.0853)Population growth 0.255
(0.221)ΔTrade -0.0296
(0.0243)ΔIndus*trade 0.000291
(0.000299)ΔPrimacy -0.109*
(0.0617)Instability 0.729***
(0.235)ΔRoad density 0.0891***
(0.0295)Country FE YES YES YES YES YESTime FE YES YES YES YES YESClustered SE YES YES YES YES YESObservations 443 752 606 606 606Countries 109 116 107 107 107R² (within) 0.201 0.075 -0.048 -0.090 -0.061Robust standard errors in parentheses, *** p<0.01, ** p<0.05, * p<0.1.
Instruments used for 2SLS, LIML and GMM are l2GDP, l2education,
l3education and l2indus.
Source: Own.
ated with increases in urbanization, consistent with our earlier intuition thatregimes which struggle to stay in power may develop an urban bias.
Columns (3) to (5) of Table 3 report IV estimates, with the set of re-gressors reduced to the key factors of interest. As before, we use GDP(t-2 ),education(t-2 ), education(t-3 ), and industrialization(t-2 ) as instruments, butthis time they instrument for GDP growth, Δeducation, and Δindustrialization.The individual IV �rst stages provide further support to Henderson's (2003) as-sertion that �past levels of variables are good instruments for current changes�28:GDP(t-2 ) and industrialization(t-2 ) strongly predict GDP growth (as before),education(t-2 ) strongly predictsΔeducation, and industrialization(t-2 ) stronglypredictsΔindustrialization. Individual F-tests are F (4, 106) = 12.08/14.05/13.95,
28Henderson (2003), p.55.
Determinants of Urbanization | 20
respectively. The Kleibergen-Paap LM statistic is 16.01, and Sargan's statisticis 2.04 (p-values are 0.00 and 0.15), which means the model passes tests for bothunderidenti�cation and overidentifying restrictions.
Unfortunately, we are not as lucky with the IV results for equation 3. Ascolumns (3) to (5) show, all signi�cance disappears completely, and the coef-�cient on GDP growth turns negative. A likely cause might be the lack ofvariation in di�erenced covariates. The process of di�erencing eliminates infor-mation, which subsequently cannot be used to estimate coe�cients. Thinkingabout this in terms of the dependent variable, it is intuitive that more varia-tion is contained in a country's deviations from its time averaged urbanizationrate (where this time average covers a period of up to 50 years, namely from1960�2010) than in a country's deviations from last period's urbanization rate.
Equation 3 still allows for country �xed e�ects, in spite of the variablesbeing di�erenced. In other words, we allow countries to be heterogeneous intheir average speed of urbanizing (see footnote 26). Excluding these country�xed e�ects does not a�ect the results � all coe�cients stay insigni�cant. Inaddition, the speci�cation without country �xed e�ects raises some concerns ofunderidenti�cation, and is thus not reported here.
Finally, note that negative measures of R² are possible in an IV framework:Since the model's residuals are computed using the endogenous regressors, whilethe model was �tted using instruments, the �tted 2SLS model does not nest aconstant-only model of the outcome variable. Therefore, the RSS is not con-strained to be smaller than the TSS.
III.D Robustness Checks
Robustness checks will focus on the results of Table 2. All IV estimationspresented include the same set of three key regressors. However, coe�cientsare robust to excluding further regressors. For instance, if we exclude GDPgrowth from column (2) in Table 2 (which contains our preferred estimates), weget coe�cients of 1.99* for education and 0.35*** for industrialization, which isclose to the original estimates.
Furthermore, estimates are robust to relaxing the population restriction: Werun regressions using the full sample of all (including very small) countries to seehow our restriction to countries with a population over one million a�ects ourresults. We �nd coe�cients of 83.50** (GDP growth), 2.50** (education) and0.44*** (industrialization), suggesting that the population restriction has littlee�ect. In contrast, results are moderately sensitive to the urbanization restric-tion: If we include countries with urbanization rates above 80% (i.e., countrieswhich are more likely to have reached a steady state level of urbanization, aswell as city states), the coe�cient on GDP growth is reduced to 41.88 and losesits signi�cance. This does not come as a surprise, given that many rich countrieshave completed their urbanization process but continue to grow economically.Coe�cients on education and industrialization are stable at 2.02** and 0.38***,respectively.
We further test for sample selection e�ects by excluding observations before
Determinants of Urbanization | 21
1970 (which means predicted values will start from 1985), resulting in a dataset that is more balanced between rich and poor countries. Once again, we�nd that the e�ects of education and industrialization are robustly estimated,yielding coe�cients of 2.83* and 0.58** (N = 494). As before, the coe�cienton GDP growth is reduced to 41.69, suggesting that our estimate of the e�ectof GDP growth may be in�uenced disproportionately by the (early) experienceof rich countries.
To test the functional form speci�cation, we conduct a BoxCox transforma-tion of the dependent variable. BoxCox regressions �nd maximum likelihoodestimates using various transformations of the left-hand side variable, and thenselect the transformation which maximises the likelihood of observing the data.Applying the BoxCox transform (yθ− 1)/θ to urbanit in equation 1, and check-ing the most common transformations θ = 0, θ = 1, and θ = −1, BoxCox givesthe highest likelihood for θ = 1, which con�rms our linear speci�cation (the
actual MLE parameter estimate is θ̂ = 0.97, which is not practicable to use ina regression).
IV Conclusion
This paper provides new evidence on the impacts of economic growth, edu-cation, and industrialization on a country's urbanization rate. In contrast tomuch of the previous literature, we do not focus on the distribution of a givenurban population across cities, but aim to provide a big picture as to how keyfactors drive aggregate urbanization trends. Addressing the well-known corre-lation between urbanization and GDP growth, we argue that the direction ofcausality likely runs from growth to urbanization, rather than vice versa. Webase this on our IV estimate of the causal e�ect of growth, in conjunction with(i) a large number of studies which ascertain the empirical correlation betweenurbanization and growth, and (ii) the fact that attempts to identify a causale�ect of urbanization on growth have so far been unsuccessful (see e.g., Hen-derson (2003)). Quantitatively, we estimate a 0.9 percentage point increase inurbanization for each 1% increase in growth. However, we observe some sensi-tivity to speci�cation. We �nd a signi�cant positive causal e�ect of educationon urbanization rate, suggesting that one year of average schooling increases ur-banization by two percentage points. This e�ect is remarkably robust to changesin speci�cation. Consistent with theoretical work on scale externalities, we also�nd signi�cant positive e�ects of industrialization (a 0.4 percentage point in-crease per one percentage point increase in non-agricultural share of GDP).
Several reservations must be made: As with any IV approach, a causal in-terpretation of our estimates is conditional on the validity of our instruments.Unfortunately, there is no single test that guarantees exogeneity of instruments.Further research into the dynamic adjustment process of urbanization is neededto verify whether lagged values of covariates provide sensible instruments. A sec-ond reservation is that the impacts of growth, education, and industrializationon a country's urbanization process are likely to be heterogeneous (depend-
Determinants of Urbanization | 22
ing on a country's level of economic development, institutional framework, andother factors). With our simple linear framework, we are estimating an aver-age e�ect for countries that are presumed to be still urbanizing. Finally, ourresults have to be considered with a view to common data problems, such asthe non-uniformity in national measurements of urbanization.
Determinants of Urbanization | 23
References
Asian Development Bank. 2008. Managing Asian Cities: Sustainable and In-
clusive Urban Solutions. Mandaluyong City, Philippines: Asian DevelopmentBank.
Barro, Robert and Jong-Wha Lee. Forthcoming. �A New Data Set of Educa-tional Attainment in the World, 1950-2010.� Journal of Development Eco-
nomics .
Black, Duncan and J. Vernon Henderson. 1999. �A Theory of Urban Growth.�Journal of Political Economy 107(2):252�284.
���. 2003. �Urban Evolution in the USA.� Journal of Economic Geography
3(4):343�372.
Chang, Gene Hsin and Josef C. Brada. 2006. �The Paradox of [the People's Re-public of] China's Growing Under-Urbanization.� Economic Systems 30:24�40.
Davis, James C. and J. Vernon Henderson. 2003. �Evidence on the Politi-cal Economy of the Urbanization Process.� Journal of Urban Economics
53(1):98�125.
Duranton, Gilles and Diego Puga. 2001. �Nursery Cities: Urban Diversity,Process Innovation, and the Life Cycle of Products.� American Economic
Review 91(5):1454�1477.
Elizondo, Raul Livas and Paul Krugman. 1996. �Trade Policy and the ThirdWorld Metropolis.� Journal of Development Economics 49(1):137�150.
Harris, John R. and Michael P. Todaro. 1970. �Migration, Unemploymentand Development: A Two Sector Analysis.� American Economic Review
60(1):126�142.
Helpman, Elhanan. 1998. �The Size of Regions.� In Topics in Public Economics:
Theoretical and Applied Analysis, edited by D. Pines, E. Sadka, and I. Zilcha.Cambridge University Press, 33�54.
Henderson, J. Vernon. 1974. �The Sizes and Types of Cities.� American Eco-
nomic Review 64(4):640�656.
���. 1988. Urban Development: Theory, Fact and Illusion. Oxford UniversityPress.
���. 2003. �The Urbanization Process and Economic Growth: The So-WhatQuestion.� Journal of Economic Growth 8(1):47�71.
���. 2005. �Urbanization and Growth.� In Handbook of Economic Growth,vol. 1, edited by P. Aghion and S. Durlauf. Elsevier, 1 ed., 1543�1591.
Determinants of Urbanization | 24
International Road Federation. 2010. World Road Statistics. Compilation ofData 1963-2008. Washington: International Road Federation.
Ioannides, Yannis M. and Henry G. Overman. 2003. �Zipf's Law for Cities: AnEmpirical Examination.� Regional Science and Urban Economics 33(2):127�137.
Jacobs, Jane. 1969. The Economy of Cities. New York: Random House.
Krugman, Paul. 1991. �Increasing Returns and Economic Geography.� Journal
of Political Economy 99(3):483�499.
Lucas, Robert E. 1988. �On the Mechanics of Economic Development.� Journalof Monetary Economics 22(1):3�42.
Marshall, Alfred. 1890. Principles of Economics. London: MacMillan.
Marshall, Monty G. and Keith Jaggers. 2010. Polity IV Project: Political Regime
Characteristics and Transitions, 1800-2010. University of Maryland.
McKinsey Global Institute. 2009. Preparing for [the People's Republic of]China's Urban Billion. New York: McKinsey Global Institute.
Michaels, Guy, Ferdinand Rauch, and Stephen J. Redding. 2012. �Urbanizationand Structural Transformation.� Quarterly Journal of Economics 127(2):535�586.
Moomaw, Ronald and Ali M. Shatter. 1996. �Urbanization and Economic Devel-opment: A Bias toward Large Cities?� Journal of Urban Economics 40(1):13�37.
Pandey, S.M. 1977. �Nature and Determinants of Urbanization in a DevelopingEconomy: The Case of India.� Economic Development and Cultural Change
25(2):265�278.
Petrakos, George and Josef C. Brada. 1989. �Metropolitan Concentration inDeveloping Countries.� Kyklos 42(4):557�578.
Quigley, John M. 1998. �Urban Diversity and Economic Growth.� Journal of
Economic Perspectives 12(2):127�138.
Rauch, James E. 1993. �Productivity Gains from Geographic Concentrationof Human Capital: Evidence from the Cities.� Journal of Urban Economics
34(2):380�400.
Renaud, Bertrand. 1981. National Urbanization Policy in Developing Countries.Oxford University Press.
Rosenthal, Stuart S. and William C. Strange. 2001. �The Determinants of Ag-glomeration.� Journal of Urban Economics 50(2):191�229.
Determinants of Urbanization | 25
Tabuchi, Takatoshi. 1998. �Urban Agglomeration and Dispersion: A Synthesisof Alonso and Krugman.� Journal of Urban Economics 44(3):333�351.
United Nations. 2011. World Urbanization Prospects: The 2011 Revision. NewYork: United Nations.
World Bank. 2011. World Development Indicators: WDI Online. Washington:World Bank.
Determinants of Urbanization
Anett Hofmann and Guanghua Wan No. 355 | July 2013
ADB Economics Working Paper Series
Determinants of UrbanizationIn light of the United Nation’s (UN’s) latest urbanization projections, particularly with respect to the People’s Republic of China and India, a good understanding is needed of what drives aggregate urbanization trends. Taking advantage of the latest UN World Urbanization Prospects, we use an instrumental variables approach to identify and analyze key urbanization determinants. We estimate the impact of gross domestic product growth on urbanization to be large and positive. We also find positive and significant effects of industrialization and education on urbanization, consistent with the existence of localization economies and labor market pooling.
About the Asian Development BankADB’s vision is an Asia and Pacific region free of poverty. Its mission is to help its developing member countries reduce poverty and improve the quality of life of their people. Despite the region’s many successes, it remains home to two-thirds of the world’s poor: 1.7 billion people who live on less than $2 a day, with 828 million struggling on less than $1.25 a day. ADB is committed to reducing poverty through inclusive economic growth, environmentally sustainable growth, and regional integration. Based in Manila, ADB is owned by 67 members, including 48 from the region. Its main instruments for helping its developing member countries are policy dialogue, loans, equity investments, guarantees, grants, and technical assistance.
Asian Development Bank6 ADB Avenue, Mandaluyong City1550 Metro Manila, Philippineswww.adb.org/economics
Printed on recycled paper Printed in the Philippines