acp-8-4141-2008 | acp
TRANSCRIPT

Atmos. Chem. Phys., 8, 4141–4496, 2008www.atmos-chem-phys.net/8/4141/2008/© Author(s) 2008. This work is distributed underthe Creative Commons Attribution 3.0 License.
AtmosphericChemistry
and Physics
Evaluated kinetic and photochemical data for atmosphericchemistry: Volume IV – gas phase reactions of organichalogen species
R. Atkinson1, D. L. Baulch2, R. A. Cox3, J. N. Crowley4, R. F. Hampson5, R. G. Hynes6, M. E. Jenkin7, M. J. Rossi8,J. Troe9, and T. J. Wallington10
1Air Pollution Research Center, University of California, Riverside, California 92521, USA2School of Chemistry, University of Leeds, Leeds LS2 9JT, UK3Centre for Atmospheric Science, Dept. of Chemistry, University of Cambridge, Lensfield Road Cambridge CB2 1EP, UK4Max-Planck-Institut fur Chemie, Division of Atmospheric Chemistry, Postfach 3060, 55020 Mainz, Germany5U.S. Dept. of Commerce, National Inst. of Standards and Technology, Bldg. 221, Rm A111, Gaithersburg, MD 20899, USA6CSIRO Energy Technology, Lucas Heights Sci. and Technol. Centre, Building 2, PMB7, Bangor, NSW 2234, Australia7Dept. of Environmental Science and Technology, Imperial College London, Silwood Park, Ascot, Berkshire SL5 7PY, UK8Laboratoire de Pollution Atmospherique et Sol (LPAS/ENAC), Ecole Polytechnique Federale de Lausanne (EPFL), Bat CHH5, Station 6, 1015 Lausanne, Switzerland9Institute of Physical Chemistry, University of Gottingen, Tammannstr. 6, 37077 Gottingen, Germany10Ford Motor Company, Research and Advanced Engineering, Mail Drop RIC-2122, Dearborn, Michigan 48121-2053, USA* The IUPAC Subcommittee on Gas Kinetic Data Evaluation for Atmospheric Chemistry
Received: 12 June 2007 – Published in Atmos. Chem. Phys. Discuss.: 23 November 2007Revised: 6 May 2008 – Accepted: 6 May 2008 – Published: 4 August 2008
Abstract. This article, the fourth in the series, presents ki-netic and photochemical data sheets evaluated by the IUPACSubcommittee on Gas Kinetic Data Evaluation for Atmo-spheric Chemistry. It covers the gas phase and photochem-ical reactions of organic halogen species, which were lastpublished in 1997, and were updated on the IUPAC websitein 2006/07. The article consists of a summary sheet, contain-ing the recommended kinetic parameters for the evaluatedreactions, and four appendices containing the data sheets,which provide information upon which the recommendationsare made.
1 Introduction
In the mid 1970s it was appreciated that there was a needfor the establishment of an international panel to produce aset of critically evaluated rate parameters for reactions of in-terest for atmospheric chemistry. To this end the CODATATask Group on Chemical Kinetics, under the auspices of theInternational Council of Scientific Unions (ICSU), was con-
Correspondence to:R. A. Cox([email protected])
stituted in 1977 and tasked to produce an evaluation of rel-evant, available kinetic and photochemical data. The firstevaluation by this international committee was published inJ. Phys. Chem. Ref. Data in 1980 (Baulch et al., 1980), fol-lowed by Supplements in 1982 (Baulch et al., 1982) and 1984(Baulch et al., 1984). In 1986 the IUPAC Subcommitteeon Data Evaluation superseded the original CODATA TaskGroup for Atmospheric Chemistry, and the Subcommitteehas continued its data evaluation program with Supplementspublished in 1989 (Atkinson et al., 1989), 1992 (Atkinsonet al., 1992), 1997 (Atkinson et al., 1997a), 1997 (Atkin-son et al., 1997b), 1999 (Atkinson et al., 1999) and 2000(Atkinson et al., 2000). Following the last of these reports,Supplement VIII (Atkinson et al., 2000), the evaluation hascontinued to be updated and published on the worldwide web(http://www.iupac-kinetic.ch.cam.ac.uk/). The IUPAC web-site hosts an interactive database with a search facility andimplemented hyperlinks between the summary table and thedata sheets, both of which can be downloaded as individualPDF or Word files. To further enhance the accessibility ofthis updated material to the scientific community, the evalua-tion is being published as a series of articles in AtmosphericChemistry and Physics. This article is the fourth of the series,Volume IV.
Published by Copernicus Publications on behalf of the European Geosciences Union.

4142 R. Atkinson et al.: Evaluated kinetic and photochemical data for atmospheric chemistry
Summary of recommended rate coefficients for organichalogen reactions
The ordering of families in the Summary Table is: FOx (Ap-pendix 1), ClOx (Appendix 2), BrOx (Appendix 3) and IOx(Appendix 4). The reactions are numbered sequentially forthe whole Volume. Within each family, reactions are listed inthe order: O(3P), O(1D), halogen atom, HO radical, NO3 rad-
ical, halogen oxide reactions and photochemical processes.Chemical reactions are listed as first reactant (usually anatom or radical) + second reactant (usually a molecule). Eachdatasheet has a unique identifier: “Volume: Appendix: reac-tion number”. For example, the first reaction in the summarysheet below refers to Datasheet “IV.A1.1”. Photochemicalreactions are listed at the end of each family section.
Table 1. Summary of recommended rate coefficients for organic halogen reactions
Reaction k298 Temp. dependence of Temp.number Reaction cm3 molecule−1 s−1 1log ka
298 k/cm3 molecule−1 s−1 range/K 1(E/R)/Ka
FOx Reactions - based on data sheets in Appendix 1, and on the IUPAC website updated in 2005.
1 O(1D) + COF2→ O(3P) + COF2 5.2× 10⁻¹¹
→ other products 2.2× 10⁻¹¹
overall 7.4× 10⁻¹¹±0.3
2 O(1D) + CH3F→ O(3P) + CH3F 2.7× 10⁻¹¹
→ other products 1.2× 10⁻¹⁰
overall 1.5× 10⁻¹⁰±0.15
3 O(1D) + CH2F2→ O(3P) + CH2F2 3.6× 10⁻¹¹
→ other products 1.5× 10⁻¹¹
overall 5.1× 10⁻¹¹±0.3
4 O(1D) + CHF3→ O(3P) + CHF3 8.2× 10⁻¹²
→ other products 9.1× 10⁻¹³
overall 9.1× 10⁻¹²±0.15
5 O(1D) + CH3CH2F→ O(3P) + CH3CH2F 4.7× 10⁻¹¹
→ other products 2.1× 10⁻¹⁰
overall 2.6× 10⁻¹⁰±0.3
6 O(1D) + CH3CHF2→ O(3P) + CH3CHF2 1.1× 10⁻¹⁰
→ other products 9.2× 10⁻¹¹
overall 2.0× 10⁻¹⁰±0.3
7 O(1D) + CH3CF3→ O(3P) + CH3CF3
→ other products 5.8× 10⁻¹¹±0.5
8 O(1D) + CH2FCF3→ O(3P) + CH2FCF3 4.6× 10⁻¹¹
→ other products 3.0× 10⁻¹²
overall 4.9× 10⁻¹¹±0.3
9 O(1D) + CHF2CF3→ O(3P) + CHF2CF3 1.0× 10⁻¹⁰
→ other products 1.8× 10⁻¹¹
overall 1.2× 10⁻¹⁰±0.3
10 HO + CH3F→ H2O + CH2F 2.1× 10⁻¹⁴± 0.15 1.9× 10⁻¹²exp(-1350/T ) 240-300 ±400
11 HO + CH2F2→ H2O + CHF2 1.1× 10⁻¹⁴± 0.10 2.3× 10⁻¹²exp(-1590/T ) 220-300 ±200
12 HO + CHF3→ H2O + CF3 2.7× 10⁻¹⁶± 0.2 6.9× 10⁻¹³exp(-2340/T ) 250-300 ±300
13 HO + CF4→ HOF + CF3 < 2× 10⁻¹⁸
14 HO + CH3CH2F→ H2O + CH3CHF 1.8× 10⁻¹³
→ H2O + CH2CH2F 3.2× 10⁻¹⁴
overall 2.1× 10⁻¹³± 0.2 2.7× 10⁻¹²exp(-765/T ) 210-300 ±300
15 HO + CH3CHF2→ H2O + CH2CHF2→ H2O + CH3CF2
overall 3.6× 10⁻¹⁴ +0.10−0.20 1.25× 10⁻¹²exp(-1070/T ) 210-300 +200
−40016 HO + CH3CF3→ H2O + CH2CF3 1.2× 10⁻¹⁵
± 0.15 9.2× 10⁻¹³exp(-1970/T ) 220-300 ±30017 HO + CH2FCH2F→ H2O + CH2FCHF 1.0× 10⁻¹³
± 0.3 1.5× 10⁻¹²exp(-800/T ) 210-300 ±20018 HO + CH2FCHF2→ H2O + CH2FCF2
→ H2O + CHFCHF2overall 1.5× 10⁻¹⁴
± 0.2 3.3× 10⁻¹²exp(-1610/T ) 270-330 ±30019 HO + CH2FCF3→ H2O + CHFCF3 4.6× 10⁻¹⁵
± 0.2 4.9× 10⁻¹³exp(-1395/T ) 220-300 ±30020 HO + CHF2CHF2→ H2O + CF2CHF2 6.1× 10⁻¹⁵
± 0.2 1.4× 10⁻¹²exp(-1620/T ) 290-360 ±30021 HO + CHF2CF3→ H2O + CF2CF3 1.9× 10⁻¹⁵
± 0.2 4.4× 10⁻¹³exp(-1630/T ) 220-300 ±30022 HO + CHF2CF2CH2F→ H2O + CHF2CF2CHF
→ H2O + CF2CF2CH2Foverall 7.7× 10⁻¹⁵
± 0.3 2.2× 10⁻¹²exp(-1685/T ) 285-365 ±30023 HO + CF3CF2CH2F→ H2O + CF3CF2CHF 6.5× 10⁻¹⁵
± 0.3 2.6× 10⁻¹³exp(-1100/T ) 250-320 ±400
Atmos. Chem. Phys., 8, 4141–4496, 2008 www.atmos-chem-phys.net/8/4141/2008/

R. Atkinson et al.: Evaluated kinetic and photochemical data for atmospheric chemistry 4143
Reaction k298 Temp. dependence of Temp.number Reaction cm3 molecule−1 s−1 1log ka
298 k/cm3 molecule−1 s−1 range/K 1(E/R)/Ka
24 HO + CF3CHFCHF2→ H2O + CF3CFCHF2→ H2O + CF3CHFCF2
overall 5.0× 10⁻¹⁵± 0.3 1.4× 10⁻¹²exp(-1680/T ) 290-380 ±300
25 HO + CF3CH2CF3→ H2O + CF3CHCF3 3.3× 10⁻¹⁶± 0.3 1.3× 10⁻¹²exp(-2465/T ) 270-340 ±400
26 HO + CF3CHFCF3→ H2O + CF3CFCF3 1.4× 10⁻¹⁵± 0.2 5.3× 10⁻¹³exp(-1770/T ) 250-380 ±300
27 HO + CHF2OCHF2→ H2O + CHF2OCF2 2.2× 10⁻¹⁵± 0.1 1.9× 10⁻¹²exp(-2020/T ) 270-460 ±300
28 HO + HCOF→ H2O + FCO < 1× 10⁻¹⁴
29 HO + CHF2CHO→ H2O + CHF2CO→ H2O + CF2CHO
overall 1.6× 10⁻¹²± 0.2
30 HO + CF3CHO→ H2O + CF3CO 5.8× 10⁻¹³± 0.2
31 HO + CF3COOH→ products 1.3× 10⁻¹³± 0.1 1.3× 10⁻¹³ 280-350 1log k =±0.1
32 HO2 + CH2FO2→ O2 + CH2FO2H See data sheet→ O2 + HCOF + H2O
33 HO2 + CF3O2→ CF3O2H + O2 no recommendation→ C(O)F2 + HOF + O2
34 HO2 + CF3CHFO2→ O2 + CF3CHFO2H 4.3× 10⁻¹²± 0.2
→ O2 + CF3C(O)F + H2Ooverall 4.3× 10⁻¹²
± 0.2 2.0× 10⁻¹³exp(910)/T ) 210-365 ±30035 HO2 + CF3CF2O2→ O2 + CF3CF2O2H
→ O2 + CF3C(O)F + HOFoverall 1.2× 10⁻¹²
± 0.536 FO2 + CO→ products < 6× 10⁻¹⁶
37 FO2 + CH4→ products < 4.1× 10⁻¹⁵
38 CF3 + O2 + M→ CF3O2 + M 2.2× 10⁻²⁹ [N2] (k0) ± 0.1 2.2× 10⁻²⁹(T /300)−4.7[N2] 230-380 1n =±1.54× 10⁻¹² (k∞) ± 0.3 4× 10⁻¹² 200-300 1n =±1.5Fc = 0.39 Fc = 0.39
39 CF3O + O2→ COF2 + FO2 < 1× 10⁻¹⁸ < 1× 10⁻¹⁰exp(-5600/T ) 250-37040 CF3O + O3→ CF3O2 + O2 1.8× 10⁻¹⁴
±1 2× 10⁻¹² exp(-1400/T ) 250-370 ±60041 CF3O + H2O→ CF3OH + HO < 2× 10⁻¹⁷ < 3× 10⁻¹² exp(-3600/T ) 250-38042 CF3O + NO→ COF2 + FNO 5.4× 10⁻¹¹
± 0.1 3.7× 10⁻¹¹ exp(110/T ) 230-390 ±10043 CF3O + CH4→ CF3OH + CH3 2.2× 10⁻¹⁴
± 0.1 2.6× 10⁻¹² exp(-1420/T ) 230-380 ±20044 CF3O + C2H6→ CF3OH + C2H5 1.3× 10⁻¹²
± 0.1 4.9× 10⁻¹² exp(-400/T ) 230-360 ±20045 CH2FO + O2→ HCOF + HO2 See data sheet46 CH2FO + M→ HCOF + H + M See data sheet47 CH3CF2O + O2→ products See data sheet48 CH3CF2O + M→ CH3 + COF2 + M See data sheet49 CH2FCHFO + O2→ CH2FCOF + HO2 See data sheet50 CH2FCHFO + M→ CH2F + HCOF + M See data sheet51 CF3CHFO + O2→ CF3COF + HO2 See data sheet52 CF3CHFO + M→ CF3 + HCOF + M See data sheet53 CF3CF2O + O2→ products See data sheet54 CF3CF2O + M→ CF3 + CF2O + M See data sheet55 CH2FO2 + NO→ CH2FO + NO2 1.3× 10⁻¹¹
± 0.356 CHF2O2 + NO→ CHF2O + NO2 1.3× 10⁻¹¹
± 0.357 CF3O2 + NO→ CF3O + NO2 1.6× 10⁻¹¹
± 0.1 1.6× 10⁻¹¹ exp(T /298)−1.2 230-430 1n=±0.558 CH2FCHFO2 + NO > 9× 10⁻¹²
→ CH2FCHFO + NO2
59 CHF2CF2O2 + NO→ CHF2CF2O + NO2 > 1× 10⁻¹¹
60 CF3CHFO2 + NO→ CF3CHFO + NO2 1.3× 10⁻¹¹±0.2
61 CF3CF2O2 + NO→ CF3CF2O + NO2 > 1× 10⁻¹¹
62 CF3O2 + NO2 + M→ CF3O2NO2 + M 5.6× 10⁻²⁹[N2] (k0) ±0.2 5.6× 10⁻²⁹ (T /298)−9[N2] 260-300 1n=±37.7× 10⁻¹² (k∞) ±0.2 7.7× 10⁻¹²(T /298)−0.67 260-300 1n=±0.5Fc=0.31 Fc=0.31 260-300
63 CF3O2NO2 + M→ CF3O2 + NO2 + M 4.5× 10⁻¹⁹[N2] (k0/s−1) ±0.3 2.5× 10⁻⁵exp(-9430/T )[N2] 260-300 ±2506.0× 10−2 (k∞/s−1) ±0.3 1.5× 10¹⁶ exp(-11940/T ) 260-300 ±250Fc=0.31 Fc=0.31 260-300
64 CH2FO2 + CH2FO2→ CH2FOH + HC(O)F + O2
→ 2CH2FO + O2 2.6× 10⁻¹²±0.3
overall 2.6× 10⁻¹²±0.3 2.5× 10⁻¹³(exp(700/T ) 220-380±300
65 CHF2O2 + CHF2O2→ CHF2OH + C(O)F2 + O2→ 2CH2FO + O2 See data sheet
overall (2.5-5.0)× 10−12
66 CF3O2 + CF3O2→ 2CF3O + O2 1.5× 10⁻¹²±0.3
67 CF3O2 + CF3CHFO2→ CF3OH + CF3COF + O2→ CF3O + CF3CHFO + O2
overall 8× 10⁻¹²±0.5
68 CHF2CF2O2 + CHF2CF2O2→ CHF2CF2O + CHF2CF2O + O2 no recommendation
www.atmos-chem-phys.net/8/4141/2008/ Atmos. Chem. Phys., 8, 4141–4496, 2008

4144 R. Atkinson et al.: Evaluated kinetic and photochemical data for atmospheric chemistry
Reaction k298 Temp. dependence of Temp.number Reaction cm3 molecule−1 s−1 1log ka
298 k/cm3 molecule−1 s−1 range/K 1 (E/R)/Ka
69 CF3CHFO2 + CF3CHFO2
→ CF3CHFOH + CF3COF + O2 3.3× 10⁻¹³
→ 2 CF3CHFO + O2 4.4× 10⁻¹²
overall 4.7× 10⁻¹²±0.3 6.2× 10⁻¹³exp(605/T ) 210-375 ±200
70 CF3CF2O2 + CF3CF2O2 no recommendation→ 2 CF3CF2O + O2
Data for the following Photochemical Reactions is based on data sheets on the IUPAC website updated in 2005
71 HC(O)F + hν→ products72 C(O)F2 + hν→ products73 CF3CHO + hν→ products74 CF3COF + hν→ products
ClOx Reactions - based on data sheets in Appendix 2, and on the IUPAC website updated in 2005
75 O(1D) + CHF2Cl→ O(3P) + CHF2Cl 2.8× 10⁻¹¹
→ ClO + CHF2 5.5× 10⁻¹¹
→ other products 1.7× 10⁻¹¹
overall 1.0× 10⁻¹⁰±0.1 1× 10⁻¹⁰ 170-350 1logk=±0.1
76 O(1D) + CHFCl2→ ClO + CHFCl 1.4× 10⁻¹⁰
→ other products 5.0× 10⁻¹¹
overall 1.9× 10⁻¹⁰±0.3 1.9× 10⁻¹⁰ 180-350 1logk=±0.3
77 O(1D) + CH3CF2Cl→ O(3P) + CH3CF2Cl 5.7× 10⁻¹¹
→ other products 1.6× 10⁻¹⁰
overall 2.2× 10⁻¹⁰±0.3
78 O(1D) + CH3CFCl2→ O(3P) + CH3CFCl2 8.1× 10⁻¹¹
→ other products 1.8× 10⁻¹⁰
overall 2.6× 10⁻¹⁰±0.3
79 O(1D) + CH2ClCF3→ O(3P) + CH2ClCF3 2.4× 10⁻¹¹
→ other products 9.6× 10⁻¹¹
overall 1.2× 10⁻¹⁰±0.3
80 O(1D) + CH2ClCF2Cl→ O(3P) + CH2ClCF2Cl 1.6× 10⁻¹⁰±0.5
→ other products81 O(1D) + CHFClCF3→ O(3P) + CHFClCF3 2.7× 10⁻¹¹
→ other products 5.9× 10⁻¹¹
overall 8.6× 10⁻¹¹±0.3
82 O(1D) + CHCl2CF3→ O(3P) + CHCl2CF3 4.2× 10⁻¹¹
→ other products 1.6× 10⁻¹⁰
overall 2.0× 10⁻¹⁰±0.3
83 O(1D) + CF2Cl2→ ClO + CF2Cl 1.2× 10⁻¹⁰
→ O(3P) + CF2Cl2 2.4× 10⁻¹¹
overall 1.4× 10⁻¹⁰±0.1 1.4× 10⁻¹⁰ 170-350 1logk=±0.1
84 O(1D) + CFCl3→ ClO + CFCl2 2.0× 10⁻¹⁰
→ O(3P) + CFCl3 3.0× 10⁻¹¹
overall 2.3× 10⁻¹⁰±0.1 2.3× 10⁻¹⁰ 170-350 1logk=±0.1
85 O(1D) + CCl4→ ClO + CCl3 2.9× 10⁻¹⁰
→ O(3P) + CCl4 4.0× 10⁻¹¹
overall 3.3× 10⁻¹⁰±0.1 3.3× 10⁻¹⁰ 200-350 1logk=±0.1
86 O(1D) + COFCl→ O(3P) + COFCl 1.9× 10⁻¹⁰±0.3
87 O(1D) + COCl2→ O(3P) + COCl2 See data sheet→ O(3P) + Cl2 + CO See data sheet→ other products 1.8× 10⁻¹⁰
overall 2.2× 10⁻¹⁰±0.1 2.0× 10⁻¹⁰exp(25/T ) 190-430 ±25
88 Cl + HC(O)Cl→ HCl + ClCO 7.5× 10⁻¹³±0.1 8.1× 10⁻¹²exp(-710/T ) 220-330 ±150
89 Cl + CH3OCl→ Cl2 + CH3O 5.2× 10⁻¹¹
→ HCl + CH2OCl 9.15× 10⁻¹²
overall 6.1× 10⁻¹¹±0.1
90 Cl + CH3F→ HCl + CH2F 3.5× 10⁻¹³±0.15 4.0× 10⁻¹²exp(-730/T ) 240-370 ±400
91 Cl + CH3Cl→ HCl + CH2Cl 4.8× 10⁻¹³±0.1 2.3× 10⁻¹¹exp(-1150/T ) 220-360 ±200
92 Cl + CH2F2→ HCl + CHF2 5.0× 10⁻¹⁴±0.5 7.0× 10⁻¹²exp(-1470/T ) 280-370 ±500
93 Cl + CH2FCl→ HCl + CHFCl 1.1× 10⁻¹³±0.3 7.0× 10⁻¹²exp(-1230/T ) 270-370 ±500
94 Cl + CH2Cl2→ HCl + CHCl2 3.4× 10⁻¹³±0.1 5.9× 10⁻¹²exp(-850/T ) 220-400 ±200
95 Cl + CHF2Cl→ HCl + CF2Cl 1.7× 10⁻¹⁵±0.15 5.9× 10⁻¹²exp(-2430/T ) 290-430 ±400
96 Cl + CHFCl2→ HCl + CFCl2 2.0× 10⁻¹⁴±0.2 5.5× 10⁻¹²exp(-1675/T ) 290-430 ±400
97 Cl + CHCl3→ HCl + CCl3 1.1× 10⁻¹³±0.2 2.4× 10⁻¹²exp(-920/T ) 220-500 ±400
98 Cl + CH3CH2F→ HCl + CH3CHF 6.5× 10⁻¹²±0.3 1.0× 10⁻¹¹exp(-130/T ) 280-370 ±500
→ HCl + CH2CH2F 7.4× 10⁻¹³±0.3 8.3× 10⁻¹²exp(-720/T ) 280-370 ±500
99 Cl + CH3CHF2→ HCl + CH3CF2 2.5× 10⁻¹³±0.15 6.3× 10⁻¹²exp(-965/T ) 280-360 ±500
→ HCl + CH2CHF2 2.3× 10⁻¹⁵±0.5 7.0× 10⁻¹²exp(-2400/T ) 280-360 ±500
100 Cl + CH2FCH2F→ HCl + CH2FCHF 7.0× 10⁻¹³±0.2 2.5× 10⁻¹¹exp(-1065/T ) 280-360 ±400
101 Cl + CH3CF3→ HCl + CH2CF3 2.6× 10⁻¹⁷±0.5 6.9× 10⁻¹²exp(-3720/T ) 280-370 ±500
102 Cl + CH2FCHF2→ HCl + CH2FCF2 2.5× 10⁻¹⁴±0.5 3.3× 10⁻¹²exp(-1450/T ) 280-370 ±500
→ HCl + CHFCHF2 2.5× 10⁻¹⁴±0.5 4.6× 10⁻¹²exp(-1560/T ) 280-370 ±500
Atmos. Chem. Phys., 8, 4141–4496, 2008 www.atmos-chem-phys.net/8/4141/2008/

R. Atkinson et al.: Evaluated kinetic and photochemical data for atmospheric chemistry 4145
Reaction k298 Temp. dependence of Temp.number Reaction cm3 molecule−1 s−1 1log ka
298 k/cm3 molecule−1 s−1 range/K 1 (E/R)/Ka
103 Cl + CH3CF2Cl→ HCl + CH2CF2Cl 4.1× 10⁻¹⁶±0.15 1.4× 10⁻¹²exp(-2420/T ) 296-440 ±500
104 Cl + CH3CFCl2→ HCl + CH2CFCl2 2.1× 10⁻¹⁵±0.1 1.7× 10⁻¹²exp(-2000/T ) 290-380 ±300
105 Cl + CH3CCl3→ HCl + CH2CCl3 7× 10⁻¹⁵±0.2 2.8× 10⁻¹²exp(-1790/T ) 290-420 ±400
106 Cl + CH2FCF3→ HCl + CHFCF3 1.5× 10⁻¹⁵±0.1 3.4× 10⁻¹²exp(-2300/T ) 299-430 ±500
107 Cl + CHF2CHF2→ HCl + CF2CHF2 2.2× 10⁻¹⁵±0.2 7.9× 10⁻¹²exp(-2440/T ) 280-360 ±500
108 Cl + CHF2CF3→ HCl + CF2CF3 2.5× 10⁻¹⁶±0.2
109 Cl + CHFClCF3→ HCl + CFClCF3 2.7× 10⁻¹⁵±0.1 1.1× 10⁻¹²exp(-1800/T ) 270-380 ±500
110 Cl + CHCl2CF3→ HCl + CCl2CF3 1.2× 10⁻¹⁴±0.1 4.4× 10⁻¹²exp(-1740/T ) 270-380 ±500
111 HO + CH3Cl→ H2O + CH2Cl 3.6× 10⁻¹⁴±0.10 2.1× 10⁻¹²exp(-1210/T ) 220-300 ±200
112 HO + CH2FCl→ H2O + CHFCl 3.9× 10⁻¹⁴±0.1 1.6× 10⁻¹²exp(-1105/T ) 240-300 ±200
113 HO + CH2Cl2→ H2O + CHCl2 1.0× 10⁻¹³±0.10 1.8× 10⁻¹²exp(-860/T ) 210-400 ±150
114 HO + CHF2Cl→ H2O + CF2Cl 4.7× 10⁻¹⁵±0.08 7.9× 10⁻¹³exp(-1530/T ) 240-300 ±150
115 HO + CHFCl2→ H2O + CFCl2 2.9× 10⁻¹⁴±0.1 1.04× 10⁻¹²exp(-1065/T ) 240-300 ±200
116 HO + CHCl3→ H2O + CCl3 1.05× 10⁻¹³±0.10 1.8× 10⁻¹²exp(-850/T ) 240-300 ±300
117 HO + CF2Cl2→ HOCl + CF2Cl < 7× 10⁻¹⁸ < 1× 10⁻¹²exp(-3540/T ) 250-480118 HO + CFCl3→ HOCl + CFCl2 < 5× 10⁻¹⁸ < 1× 10⁻¹²exp(-3650/T ) 250-480119 HO + CCl4→ HOCl + CCl3 < 5× 10⁻¹⁶ < 1× 10⁻¹²exp(-2260/T ) 250-300120 HO + C2HCl3→ products 2.0× 10⁻¹²
±0.10 3.0× 10⁻¹³exp(565/T ) 230-300 ±200121 HO + C2Cl4→ products 1.6× 10⁻¹³
±0.10 3.5× 10⁻¹²exp(-920/T ) 290-420 ±300122 HO + CH3CF2Cl→ H2O + CH2CF2Cl 3.0× 10⁻¹⁵
±0.10 8.5× 10⁻¹³exp(-1685/T ) 220-300 ±200123 HO + CH3CFCl2→ H2O + CH2CFCl2 5.8× 10⁻¹⁵
±0.10 8.1× 10⁻¹³exp(-1470/T ) 220-300 ±200124 HO + CH3CCl3→ H2O + CH2CCl3 9.5× 10⁻¹⁵
±0.10 1.2× 10⁻¹²exp(-1440/T ) 240-300 ±200125 HO + CH2ClCF3→ H2O + CHClCF3 1.4× 10⁻¹⁴
±0.15 5.6× 10⁻¹³exp(-1100/T ) 260-380 ±200126 HO + CH2ClCF2Cl→ H2O + CHClCF2Cl 1.7× 10⁻¹⁴
±0.15 3.5× 10⁻¹²exp(-1585/T ) 250-350 ±300127 HO + CHFClCF3→ H2O + CFClCF3 8.7× 10⁻¹⁵
±0.20 3.5× 10⁻¹³exp(-1105/T ) 210-300 ±300128 HO + CHCl2CF3→ H2O + CCl2CF3 3.6× 10⁻¹⁴
±0.10 6.6× 10⁻¹³exp(-870/T ) 210-300 ±200129 HO + CHFClCF2Cl→ H2O + CFClCF2Cl 1.2× 10⁻¹⁴
±0.3 8.4× 10⁻¹³exp(-1255/T ) 290-460 ±400130 HO + CHCl2CF2Cl→ H2O + CCl2CF2Cl 5.1× 10⁻¹⁴
±0.2 8.1× 10⁻¹³exp(-825/T ) 270-340 ±200131 HO + CHFClCFCl2→ H2O + CFClCFCl2 1.6× 10⁻¹⁴
±0.3 5.8× 10⁻¹³exp(-1065/T ) 270-340 ±400132 HO + CHCl2CF2CF3→ H2O + CCl2CF2CF3 2.5× 10⁻¹⁴
±0.15 1.1× 10⁻¹²exp(-1130/T ) 270-400 ±300133 HO + CHFClCF2CF2Cl→ H2O + CFClCF2CF2Cl 8.9× 10⁻¹⁵
±0.10 5.5× 10⁻¹³exp(-1230/T ) 290-400 ±300134 HO + CH3CF2CFCl2→ H2O + CH2CF2CFCl2 2.4× 10⁻¹⁵
±0.3 7.0× 10⁻¹³exp(-1690/T ) 290-370 ±300135 HO + HC(O)Cl→ H2O + ClCO < 5× 10⁻¹³
136 HO + CH3OCl→ products 7.2× 10⁻¹³±0.3 2.4× 10⁻¹²exp(-360/T ) 250-350 ±300
137 HO + COCl2→ products < 5× 10⁻¹⁵
138 HO + CH2ClCHO→ H2O + CH2ClCO→ H2O + CHClCHO
overall 3.1× 10⁻¹²±0.15
139 HO + CHFClCHO→ H2O + CHFClCO→ H2O + CFClCHO
overall 2.1× 10⁻¹²±0.15
140 HO + CHCl2CHO→ H2O + CHCl2CO→ H2O + CCl2CHO
overall 2.4× 10⁻¹²±0.15
141 HO + CF2ClCHO→ H2O + CF2ClCO 8.2× 10⁻¹³±0.25
142 HO + CFCl2CHO→ H2O + CFCl2CO 1.2× 10⁻¹²±0.15
143 HO + CCl3CHO→ H2O + CCl3CO 8.0× 10⁻¹³±0.15 1.8× 10⁻¹²exp(-240/T ) 230-420 ±200
144 HO + CH3COCl→ H2O + CH2COCl 6.8× 10⁻¹⁴±0.3
145 HO + CHF2OCHClCF3→ H2O + CHF2OCClCF3→ H2O + CF2OCHClCF3
overall 1.5× 10⁻¹⁴±0.10 1.1× 10⁻¹²exp(-1280/T ) 250-430 ±250
146 HO + CHF2OCF2CHFCl→ H2O + CHF2OCF2CFCl→ H2O + CF2OCF2CHFCl
overall 1.2× 10⁻¹⁴±0.10 7.5× 10⁻¹³exp(-1230/T ) 250-430 ±150
147 HO2 + CF3CCl2O2→ O2 + CF3CCl2O2H 1.9× 10⁻¹²±0.3
148 HO2 + CH2ClO2→ CH2ClO2H + O2→ HC(O)Cl + H2O + O2
overall 5.0× 10⁻¹²±0.3 3.2× 10⁻¹³exp(820/T ) 250-600 ±300
149 HO2 + CHCl2O2→ CHCl2O2H + O2
→ C(O)Cl2 + H2O + O2 4.1× 10⁻¹²
→ HC(O)Cl + HOCl + O2 1.8× 10⁻¹²
overall 5.9× 10⁻¹²±0.3 5.6× 10⁻¹³exp(700/T ) 280-440 ±300
150 HO2 + CF2ClO2→ O2 + CF2ClO2H→ O2 + COF2 + HOCl→ O2 + FCOCl + HOF
overall 3.4× 10⁻¹²±0.5
151 HO2 + CCl3O2→ CCl3O2H + O2
→ C(O)Cl2 + HOCl + O2 5.1× 10⁻¹²
overall 5.1× 10⁻¹²±0.3 4.7× 10⁻¹³exp(710/T ) 280-440 ±300
152 HO2 + CFCl2CH2O2→ O2 + CFCl2CH2O2H→ O2 + CFCl2CHO + H2O
overall 9.2× 10⁻¹²±0.5
153 HO2 + CF2ClCH2O2→ O2 + CF2ClCH2O2H→ O2 + CF2ClCHO + H2O
overall 6.8× 10⁻¹²±0.5
www.atmos-chem-phys.net/8/4141/2008/ Atmos. Chem. Phys., 8, 4141–4496, 2008

4146 R. Atkinson et al.: Evaluated kinetic and photochemical data for atmospheric chemistry
Reaction k298 Temp. dependence of Temp.number Reaction cm3 molecule−1 s−1 1log ka
298 k/cm3 molecule−1 s−1 range/K 1(E/R)/Ka
154 NO3 + C2HCl3→ products 3.5× 10⁻¹⁶±0.2 3.2× 10⁻¹³exp(-2030/T ) 270-370 ±500
155 NO3 + C2Cl4→ products < 1× 10⁻¹⁶
156 ClO + CH3O2→ ClOO + CH3O 1.6× 10⁻¹² See data sheet→ OClO + CH3O→ HCHO + HCl +O2→ CH3Cl + O3
→ CH3OCl + O2 3.3× 10⁻¹³ See data sheetoverall 2.2× 10⁻¹²
±0.15 2.4× 10⁻¹²exp(-20/T ) 220-360 ±200157 CF2Cl + O2 + M→ CF2ClO2 + M 1.4× 10⁻²⁹ [N2] (k0) ±0.5 1.4× 10⁻²⁹(T /300)−5[N2] 200-300 1n=±3
7× 10⁻¹² (k∞) ±0.5 7× 10⁻¹²(T /298)−0.6 200-300 1n=±0.5Fc= 0.4 Fc= 0.4 200-300
158 CFCl2 + O2 + M→ CFCl2O2 + M 6× 10⁻³⁰ [N2] (k0) ±0.3 6× 10⁻³⁰(T /298)−6[N2] 230-380 1n=±39× 10−12 (k∞) ±0.3 9× 10⁻¹² 230-300 1n=±1Fc ≈ 0.4 Fc ≈ 0.4 230-380
159 CCl3 + O2 + M→ CCl3O2 + M 1.1× 10⁻³⁰ [N2] (k0) ±0.2 1.1× 10⁻³⁰(T /300)−6.2[N2] 230-350 1n=±15.2× 10⁻¹² (k∞) ±0.3 5.2× 10⁻¹²(T /300)−1.4 260-350 1n=±1Fc= 0.35 Fc= 0.35 230-350
160 CHFClO + O2→ COFCl + HO2 See data sheet161 CHFClO + M→ HCOF + Cl + M See data sheet162 CF2ClO + O2→ products See data sheet163 CF2ClO + M→ COF2 + Cl + M See data sheet164 CFCl2O + O2→ products See data sheet165 CFCl2O + M→ COFCl + Cl + M See data sheet166 CCl3O + M→ COCl2 + Cl See data sheet167 CF2ClCH2O + O2→ CF2ClCHO + HO2 See data sheet168 CF2ClCH2O + M→ CF2Cl + HCHO + M See data sheet169 CFCl2CH2O + O2→ CFCl2CHO + HO2 See data sheet170 CFCl2CH2O + M→ CFCl2 + HCHO + M See data sheet171 CF3CFClO + O2→ products See data sheet172 CF3CFClO + M→ CF3COF + Cl + M See data sheet173 CF3CCl2O + O2→ products See data sheet174 CF3CCl2O + M→ CF3COCl + Cl + M See data sheet175 CF3CF2CCl2O + O2→ products See data sheet176 CF3CF2CCl2O + M→ CF3CF2COCl + Cl + M See data sheet177 CF2ClCF2CFClO + O2→ products See data sheet178 CF2ClCF2CFClO + M→ CF2ClCF2COF + Cl + M See data sheet179 CH2ClO + O2→ HCOCl + HO2 See data sheet180 CH2ClO + M→ HCO + HCl + M See data sheet181 CH3CHClO + O2→ CH3COCl + HO2 See data sheet182 CH3CHClO + M→ CH3CO + HCl + M See data sheet183 HOCH2CHClO + O2→ HOCH2COCl + HO2 See data sheet184 HOCH2CHClO + M→ CH2OH + HCOCl + M See data sheet185 HOCHClCH2O + O2→ HOCHClCHO + HO2 See data sheet186 HOCHClCH2O + M→ CHClOH + HCHO + M See data sheet187 CH3CCl2O + O2→ products See data sheet188 CH3CCl2O + M→ CH3COCl + Cl + M See data sheet189 CCl3CH2O + O2→ CCl3CHO + HO2 See data sheet190 CCl3CH2O + M→ CCl3 + HCHO + M See data sheet191 CCl3CCl2O + O2→ products See data sheet192 CCl3CCl2O + M→ CCl3COCl + Cl + M See data sheet193 CH2ClO2 + NO→ CH2ClO + NO2 1.9× 10⁻¹¹
±0.3194 CHFClO2 + NO→ CHFClO + NO2 1.3× 10⁻¹¹
±0.3195 CF2ClO2 + NO→ CF2ClO + NO2 1.5× 10⁻¹¹
±0.2 1.5× 10⁻¹¹(T /298)−1.5 230-430 1n=±0.5196 CFCl2O2 + NO→ CFCl2O + NO2 1.5× 10⁻¹¹
±0.2 1.5× 10⁻¹¹(T /298)−1.3 230-430 1n=±0.5197 CCl3O2 + NO→ CCl3O + NO2 1.8× 10⁻¹¹
±0.2 1.8× 10⁻¹¹(T /298)−1.0 230-430 1n=±0.5198 CH3CFClO2 + NO→ CH3CFClO + NO2 2.0× 10⁻¹¹
±0.3 2.0× 10⁻¹¹(T /298)−1.8 260-320 1n=±0.5199 CF2ClCH2O2 + NO→ CF2ClCH2O + NO2 1.2× 10⁻¹¹
±0.3200 CFCl2CH2O2 + NO + M→ CFCl2CH2O + NO2 1.3× 10⁻¹¹
±0.2 1.3× 10⁻¹¹(T /298)−1.5 260-320 1n=±0.5201 CF3CCl2O2 + NO→ CF3CCl2O + NO2 1.8× 10⁻¹¹
±0.3202 CH2ClCH2O2 + NO→ CH2ClCH2O + NO2 9.7× 10⁻¹²
±0.3203 CF2ClO2 + NO2 + M→ CF2ClO2NO2 + M 5.0× 10⁻²⁹ [N2] (k0) ±0.3 5.0× 10⁻²⁹(T /298)−6.2[N2] 250-320 1n=±2
6.3× 10⁻¹² (k∞) ±0.3 6.3× 10⁻¹²(T /298)−0.7 250-320 1n=±0.5Fc=0.30 Fc=0.30 250-320
204 CF2ClO2NO2 + M→ CF2ClO2 + NO2 + M 9.0× 10⁻¹⁹ [N2] (k0/s−1) ±0.3 1.8× 10⁻³exp(-10500/T ) [N2] 270-290 ±2005.4× 10−2 (k∞/s−1) ±0.3 1.6× 10¹⁶exp(-11990/T ) 270-290 ±200Fc=0.30 Fc=0.30 270-290
205 CFCl2O2 + NO2 + M→ CFCl2O2NO2 + M 5.5× 10⁻²⁹ [N2] (k0) ±0.3 5.5× 10⁻²⁹(T /298)−5.5 [N2] 230-380 1n=±28.3× 10⁻¹² (k∞) ±0.2 8.3× 10⁻¹²(T /298)−0.66 230-380 1n=±0.5Fc=0.42 Fc=0.42 230-380
206 CFCl2O2NO2 + M→ CFCl2O2 + NO2 + M 1.5× 10⁻¹⁸ [N2] (k0/s−1) ±0.3 1.0× 10⁻²exp(-10860/T )[N2] 260-300 ±2009.6× 10−2 (k∞/s−1) ±0.3 6.6× 10¹⁶exp(-12240/T ) 260-300 ±500Fc=0.28 Fc=0.28 260-300
207 CCl3O2 + NO2 + M→ CCl3O2NO2 + M 9.2× 10⁻²⁹ [N2] (k0) ±0.3 9.2× 10⁻²⁹(T /298)−6.0 [N2] 230-380 1n=±21.5× 10⁻¹² (k∞) ±0.3 1.5× 10⁻¹²(T /298)−0.7 230-380 1n=±0.5Fc=0.32 Fc=0.32 230-380
Atmos. Chem. Phys., 8, 4141–4496, 2008 www.atmos-chem-phys.net/8/4141/2008/

R. Atkinson et al.: Evaluated kinetic and photochemical data for atmospheric chemistry 4147
Reaction k298 Temp. dependence of Temp.number Reaction cm3 molecule−1 s−1 1log ka
298 k/cm3 molecule−1 s−1 range/K 1(E/R)/Ka
208 CCl3O2NO2 + M→ CCl3O2 + NO2 + M 5.2× 10⁻¹⁸ [N2] (k0/s−1) ±0.3 4.3× 10⁻³exp(-10235/T )[N2] 260-300 ±5000.29 (k∞/s−1) ±0.3 4.8× 10¹⁶exp(-11820/T ) 260-300 ±500Fc=0.32 Fc=0.32 260-300
209 C2H5O2 + CF3CCl2O2
→ CH3CHO + CF3CCl2OH + O2 3.6× 10⁻¹²±0.3
→ C2H5O + CF3CCl2O + O2 9× 10⁻¹³±0.5
210 CF2ClCH2O2 + CF2ClCH2O2→ CF2ClCH2OH + CF2ClCHO + O2
→ CF2ClCH2O + CF2ClCH2O + O2 2.8× 10⁻¹²
overall 2.8× 10⁻¹²±0.4
211 CFCl2CH2O2 + CFCl2CH2O2→ CFCl2CH2OH + CFCl2CHO + O2
→ 2CFCl2CH2O + O2 2.9× 10⁻¹²
overall 2.9× 10⁻¹²±0.4
212 CF3CCl2O2 + CF3CCl2O2 3.5× 10⁻¹²±0.3
→ 2CF3CCl2O + O2213 CH2ClO2 + CH2ClO2
→ CH2ClOH + HC(O)Cl + O2
→ 2CH2ClO + O2 3.5× 10⁻¹²
overall 3.5× 10⁻¹²±0.2 1.9× 10⁻¹³exp(870/T ) 250-600 ±200
214 CHCl2O2 + CHCl2O2 See data sheet→ CHCl2OH + C(O)Cl2 + O2→ CHCl2O + CHCl2O + O2
215 CCl3O2 + CCl3O2→ 2CCl3O + O2 4.0× 10⁻¹²±0.3 3.3× 10⁻¹³exp(740/T ) 270-460 ±300
216 CH3CHClO2 + CH3CHClO2→ CH3CHClOH + CH3COCl + O2
→ 2CH3CHClO + O2 5× 10⁻¹²±0.3
overall See data sheet217 CH2ClCH2O2 + CH2ClCH2O2
→ CH2ClCH2OH + CH2ClCHO + O2 1.2× 10⁻¹²
→ 2CH2ClCH2O + O2 2.1× 10⁻¹²
overall 3.3× 10⁻¹²±0.3 4.2× 10⁻¹⁴exp(1300/T ) 220-380 ±500
218 O3 + C2HCl3→ products < 5× 10⁻²⁰
219 O3 + C2Cl4→ products < 10−21
Data for the following Photochemical Reactions is based on data sheets on the IUPAC website updated in 2005
220 CH3Cl + hν→ products221 CH3OCl + hν→ products222 CHF2Cl + hν→ products223 CF2Cl2 + hν→ products224 CFCl3 + hν→ products225 CCl4 + hν→ products226 CH3CF2Cl + hν→ products227 CH3CFCl2 + hν→ products228 CH3CCl3 + hν→ products229 CF3CHFCl + hν→ products230 CF3CHCl2 + hν→ products231 CF2ClCFCl2 + hν→ products232 CF2ClCF2Cl + hν→ products233 CF3CF2Cl + hν→ products234 CF3CF2CHCl2 + hν→ products235 CF2ClCF2CHFCl + hν→ products236 HCOCl + hν→ products237 COFCl + hν→ products238 COCl2 + hν→ products239 CF2ClCHO + hν→ products240 CFCl2CHO + hν→ products241 CCl3CHO + hν→ products242 CF3COCl + hν→ products
BrOx Reactions - based on data sheets in Appendix 3, and on the IUPAC website updated in 2005
243 HO + CH3Br→ H2O + CH2Br 2.9× 10⁻¹⁴±0.08 1.7× 10⁻¹²exp(-1215/T ) 240-300 ±150
244 HO + CH2Br2→ H2O + CHBr2 1.1× 10⁻¹³±0.15 1.5× 10⁻¹²exp(-775/T ) 240-300 ±200
245 HO + CHF2Br→ H2O + CF2Br 1.0× 10⁻¹⁴±0.10 7.9× 10⁻¹³exp(-1300/T ) 230-360 ±150
246 HO + CF3Br→ products < 6.0× 10⁻¹⁸ < 1× 10⁻¹²exp(-3600/T ) 250-460247 HO + CF2ClBr→ products < 1× 10⁻¹⁷ < 1× 10⁻¹²exp(-3450/T ) 250-380248 HO + CF2Br2→ products < 5.0× 10⁻¹⁶ < 1× 10⁻¹²exp(-2200/T ) 250-460249 HO + CF3CH2Br→ H2O + CF3CHBr 1.6× 10⁻¹⁴
±0.2 1.4× 10⁻¹²exp(-1340/T ) 280-460 ±300250 HO + CF3CHFBr→ H2O + CF3CFBr 1.7× 10⁻¹⁴
±0.2 8.1× 10⁻¹³exp(-1155/T ) 270-460 ±300251 HO + CF3CHClBr→ H2O + CF3CClBr 4.6× 10⁻¹⁴
±0.20 1.2× 10⁻¹²exp(-970/T ) 290-460 ±300252 HO + CF2BrCF2Br→ products < 6× 10⁻¹⁸ < 1× 10⁻¹²exp(-3600/T ) 250-460253 HO2 + CH2BrO2→ O2 + CH2BrO2H 6.7× 10⁻¹²
→ O2 + HC(O)Br + H2O254 CH2BrO2 + NO→ CH2BrO + NO2 1.1× 10⁻¹¹
±0.3255 CHBr2O2 + NO→ CHBr2O + NO2 1.7× 10⁻¹¹
±0.3
www.atmos-chem-phys.net/8/4141/2008/ Atmos. Chem. Phys., 8, 4141–4496, 2008

4148 R. Atkinson et al.: Evaluated kinetic and photochemical data for atmospheric chemistry
Reaction k298 Temp. dependence of Temp.number Reaction cm3 molecule−1 s−1 1log ka
298 k/cm3 molecule−1 s−1 range/K 1(E/R)/Ka
256 CH2BrO2 + CH2BrO2→ HC(O)Br + CH2BrOH + O2 see data sheet→ 2CH2BrO+ O2
257 BrCH2CH2O2 + BrCH2CH2O2
→ BrCH2CH2OH + BrCH2CHO + O2 1.7× 10⁻¹²
→ 2BrCH2CH2O + O2 2.3× 10⁻¹²
overall 4.0× 10⁻¹²±0.2 6.0× 10⁻¹⁴exp(1250/T ) 270-380 ±500
258 BrO + CH3O2→ CH3O + BrOO 1.4× 10⁻¹²
→ HOBr + CH2O2 4.3× 10⁻¹²
overall 5.7× 10⁻¹²± 0.3
Data for the following Photochemical Reactions is based on data sheets on the IUPAC website updated in 2006
259 CH3Br + hν→ products260 CF3Br + hν→ products261 CF2ClBr + hν→ products262 CF2Br2 + hν→ products263 CHBr3 + hν→ products264 CF2BrCF2Br + hν→ products265 CH2Br2 + hν→ products
IOx Reactions – based on data data sheets in Appendix 4, and on the IUPAC website updated in 2005
266 HO + CH3I→ H2O + CH2I 1.0× 10⁻¹³±0.2 4.3× 10⁻¹²exp(-1120/T ) 270-430 ±500
267 HO + CF3I→ products 2.6× 10⁻¹⁴±0.2 2.1× 10⁻¹¹exp(-2000/T ) 270-370 ±500
268 CH2IO2 + CH2IO2→ CH2IOH + HC(O)I + O2 no recommendation→ 2CH2IO + O2
Data for the following Photochemical Reactions is based on data sheets on the IUPAC website updated in 2006
269 CH3I + hν→ products270 CF3I + hν→ products271 CH2CII + hν→ products272 CH2BrI + hν→ products273 CH2I2 + hν→ products
a The cited uncertainty is an expanded uncertainty corresponding approximately to a 95% confidence limit
2 Guide to the data sheets
The data sheets are principally of two types: (i) those forindividual thermal reactions and (ii) those for the individualphotochemical reactions.
2.1 Thermal reactions
The data sheets begin with a statement of the reactions in-cluding all pathways which are considered feasible. This isfollowed by the corresponding enthalpy changes at 298 K,calculated from the enthalpies of formation summarized inthe Thermodynamics Data Summary, which is provided onthe IUPAC website.
The available kinetic data on the reactions are summa-rized under two headings: (i) Absolute Rate Coefficients,and (ii) Relative Rate Coefficients. Under these headings,we include new data which have been published since thelast published IUPAC evaluation as well as the data used inderiving the preferred values. Under both of the headingsabove, the data are presented as absolute rate coefficients. Ifthe temperature coefficient has been measured, the results aregiven in a temperature dependent form over a stated temper-ature range. For bimolecular reactions, the temperature de-pendence is usually expressed in the normal Arrhenius form,k=A exp(−B/T ), whereB=E/R. For a few bimolecular
reactions, we have listed temperature dependences in the al-ternative form,k=A′T −n or CTn exp(−D/T ), where theoriginal authors have found this to give a better fit to the data.For pressure dependent combination and dissociation reac-tions, generally the non-Arrhenius temperature dependenceis used. This is discussed more fully in a subsequent sectionof this Introduction.
Single temperature data are presented as such and wher-ever possible the rate coefficient at, or close to, 298 K isquoted directly as measured by the original authors. Thismeans that the listed rate coefficient at 298 K may differslightly from that calculated from the Arrhenius parametersdetermined by the same authors. Rate coefficients at 298 Kmarked with an asterisk indicate that the value was calculatedby extrapolation of a measured temperature range which didnot include 298 K. The tables of data are supplemented bya series of comments summarizing the experimental details.The following list of abbreviations, relating to experimentaltechniques, is used in the Techniques and Comments sec-tions:
A – absorptionAS – absorption spectroscopyCCD – charge coupled detectorCIMS – chemical ionization mass spectroscopy/spectrometricCL – chemiluminescence
Atmos. Chem. Phys., 8, 4141–4496, 2008 www.atmos-chem-phys.net/8/4141/2008/

R. Atkinson et al.: Evaluated kinetic and photochemical data for atmospheric chemistry 4149
CRDS – cavity ring-down spectroscopy
DF – discharge flow
EPR – electron paramagnetic resonance
F – flow system
FP – flash photolysis
FTIR – Fourier transform infrared
FTS – Fourier transform spectroscopy
GC – gas chromatography/gas chromatographic
HPLC – high-performance liquid chromatography
IR – infrared
LIF – laser induced fluorescence
LMR – laser magnetic resonance
LP – laser photolysis
MM – molecular modulation
MS – mass spectrometry/mass spectrometric
P – steady state photolysis
PLP – pulsed laser photolysis
PR – pulse radiolysis
RA – resonance absorption
REMPI - resonance enhanced multiphoton ionisation
RF – resonance fluorescence
RR – relative rate
S – static system
TDLS – tunable diode laser spectroscopy
UV – ultraviolet
UVA – ultraviolet absorption
VUVA – vacuum ultraviolet absorption
For measurements of relative rate coefficients, wherever pos-sible the comments contain the actual measured ratio of ratecoefficients together with the rate coefficient of the referencereaction used to calculate the absolute rate coefficient listedin the data table. The absolute value of the rate coefficientgiven in the table may be different from that reported by theoriginal author owing to a different choice of rate coefficientof the reference reaction. Whenever possible the referencerate data are those preferred in the present evaluation.
The preferred rate coefficients are presented (i) at a tem-perature of 298 K and (ii) in temperature dependent formover a stated temperature range. This is followed by a state-ment of the uncertainty limits in logk at 298 K and the un-certainty limits either in (E/R) or in n, for the mean tem-perature in the range. Some comments on the assignment ofuncertainties are given later in this Introduction.
The “Comments on Preferred Values” describe how theselection was made and give any other relevant information.The extent of the comments depends upon the present stateof our knowledge of the particular reaction in question. Thedata sheets are concluded with a list of the relevant refer-ences.
2.2 Conventions concerning rate coefficients
All of the reactions in the table are elementary processes.Thus the rate expression is derived from a statement of thereaction, e.g.
A + A → B+ C
−1
2
d[A]
dt=
d[B]
dt=
d[C]
dt= k[A]2.
Note that the stoichiometric coefficient for A, i.e. 2, appearsin the denominator before the rate of change of [A] (which isequal to 2k[A] 2) and as a power on the righthand side.
Representations ofk as a function of temperature charac-terize simple “direct” bimolecular reactions. Sometimes it isfound thatk also depends on the pressure and the nature ofthe bath gas. This may be an indication of complex forma-tion during the course of the bimolecular reaction, which isalways the case in combination reactions. In the followingsections, the representations ofk which are adopted in thesecases are explained.
2.3 Treatment of combination and dissociation reactions
Unlike simple bimolecular reactions such as those consid-ered in Sect. 3.2, combination reactions
A + B+M → AB +M
and the reverse dissociation reactions
AB +M → A + B+M
are composed of sequences of different types of physical andchemical elementary processes. Their rate coefficients reflectthe more complicated sequential mechanism and depend onthe temperature,T , and the nature and concentration of thethird body, [M]. In this evaluation, the combination reactionsare described by a formal second-order rate law:
d[AB]
dt= k[A][B]
while dissociation reactions are described by a formal first-order rate law:−d[AB]
dt= k[AB]
In both cases,k depends on the temperature and on [M].To rationalize the representations of the rate coefficients
used in this evaluation, we first consider the Lindemann-Hinshelwood reaction scheme. The combination reactionsfollow an elementary mechanism of the form,
A + B→ AB∗ (1)
AB∗→ A + B (-1)
AB∗ +M → AB +M (2)
while the dissociation reactions are characterized by:
AB +M → AB∗ +M (-2)
AB∗ +M → AB +M (2)
www.atmos-chem-phys.net/8/4141/2008/ Atmos. Chem. Phys., 8, 4141–4496, 2008

4150 R. Atkinson et al.: Evaluated kinetic and photochemical data for atmospheric chemistry
AB∗→ A + B (-1)
Assuming quasi-stationary concentrations for the highly ex-cited unstable species AB∗ (i.e. that d[AB∗]/dt≈0), it followsthat the rate coefficient for the combination reaction is givenby:
k = k1
(k2[M]
k−1+ k2[M]
)while that for the dissociation reaction is given by:
k = k−2[M]
(k−1
k−1+ k2[M]
)In these equations the expressions before the parentheses rep-resent the rate coefficients of the process initiating the reac-tion, whereas the expressions within the parentheses denotethe fraction of reaction events which, after initiation, com-plete the reaction to products.
In the low pressure limit ([M]→ 0) the rate coefficientsare proportional to [M]; in the high pressure limit ([M]→ ∞) they are independent of [M]. It is useful to expressk in terms of the limiting low pressure and high pressure ratecoefficients,
k0 = lim k([M])
[M] → 0and
k∞ = lim k([M]),
[M] → ∞
respectively. From this convention, the Lindemann-Hinshelwood equation is obtained
k =kok∞
ko + k∞
It follows that for combination reactions,k0=k1k2[M]/ k−1and k∞=k1, while for dissociation reactions,k0=k−2[M]andk∞=k−1k−2/k2. Since detailed balancing applies, the ra-tio of the rate coefficients for combination and dissociationat a fixedT and [M] is given by the equilibrium constantKc=k1k2/k−1k−2.
Starting from the high-pressure limit, the rate coefficientsfall off with decreasing third body concentration [M] andthe corresponding representation ofk as a function of [M]is termed the “falloff curve” of the reaction. In practice,the above Lindemann-Hinshelwood expressions do not suf-fice to characterize the falloff curves completely. Because ofthe multistep character of the collisional deactivation (k2[M])and activation (k−2[M]) processes, and energy- and angularmomentum-dependencies of the association (k1) and disso-ciation (k−1) steps, as well as other phenomena, the falloffexpressions have to be modified. This can be done by includ-ing a broadening factorF to the Lindemann-Hinshelwoodexpression (Troe, 1979):
k =kok∞
ko + k∞F = ko
(1
1+ ko
k∞
)F = k∞
(ko
k∞
1+ ko
k∞
)F
The broadening factorF depends on the ratiok0/k∞, whichis proportional to [M], and can be used as a measure of “re-duced pressure”. The first factors on the right-hand side rep-resent the Lindemann-Hinshelwood expression and the addi-tional broadening factorF , at not too high temperatures, isapproximately given by (Troe, 1979):
logF ∼=logFc
1+ [log(k0/k∞)/N ]2
where log=log10 andN ≈ [0.75−1.27 logFc]. In this waythe three quantitiesk0, k∞, andFc characterise the falloffcurve for the present application.
The given approximate expression for the broadening fac-tor F was obtained from statistical unimolecular rate theoryin its simplest form (Troe, 1979). More rigorous represen-tations require detailed information on the potential energysurfaces and on the collisional energy transfer step of the re-action. If this information is not available, one may assumetypical behaviour and rely on the theoretical analysis givenby Cobos and Troe (2003). ForT=200–300 K and the col-lider M=N2 (with a collision efficiencyβc≈0.3), this treat-ment predictsFc≈0.49, 0.44, 0.39, and 0.35, if the reactantsA and B in total haver=3, 4, 5, or 6 rotational degrees offreedom, respectively (e.g. for the reaction HO+NO2, onewould haver=5 and henceFc≈0.39). It is also predictedthat Fc, for the present applications, should be nearly tem-perature independent. Finally, more rigorous expressions forthe broadening factorsF are given in Cobos and Troe (2003)which, in general do not differ from the above formula bymore than about 10 percent. Since the special properties ofeach reaction system may lead to some deviations from thegiven values ofFc, these should only be used for a first orien-tation. Larger deviations of experimentally fittedFc-valuesfrom the given “standard values”, however, may be an indi-cation for inadequate falloff extrapolations tok0 andk∞. Inthis case, the apparent values forFc, k0, andk∞ obtainedby fitting still can provide a satisfactory representation of theconsidered experimental data, in spite of the fact that inade-quate values ofk0 andk∞ are obtained by extrapolation.
If a given falloff curve is fitted in different ways, changesin Fc require changes in the limitingk0 andk∞ values. Forthe purpose of this evaluation, this is irrelevant if the pre-ferredk0 andk∞ are used consistently together with the pre-ferredFc values. If the selectedFc value is too large, thevalues ofk0 and k∞ obtained by fitting the falloff expres-sion to the experimental data are underestimated. IfFc is toosmall,k0 andk∞ are overestimated. However uncertaintiesin Fc influence the fittedk0 andk∞ in different ways. A sim-pler policy of fitting falloff was chosen by the NASA/JPLpanel (Sander et al., 2003) in puttingF=0.6 and N=1. Thisgenerally leads to different values of the fittedk0 andk∞ andtheir temperature dependencies than derived here, althoughexperimental data over the range of atmospheric interest cangenerally be reproduced equally well. However the derived
Atmos. Chem. Phys., 8, 4141–4496, 2008 www.atmos-chem-phys.net/8/4141/2008/

R. Atkinson et al.: Evaluated kinetic and photochemical data for atmospheric chemistry 4151
k0 andk∞ may differ from the true limiting rate coefficientsand thus should be interpreted by theory only with caution.
In the present evaluation, we generally follow the experi-mentally fitted values forFc, k0, andk∞, providedFc doesnot differ too much from the values given above. If largedeviations are encountered, the experimental data are re-evaluated using the givenFc-values given above.
Besides the energy-transfer mechanism, i.e. Reactions (1),(-1), and (2), a second mechanism appears to be relevant forsome reactions considered here. This is the radical-complex(or chaperon) mechanism
A +M → AM (3)
AM → A +M (-3)
B+ AM → AB +M (4)
which, in the low pressure range, leads to
k0 = (k3/k−3)k4[M].
For some tri- and tetra-atomic adducts AB, e.g. O + O2→
O3 and Cl + O2→ ClOO, this value ofk0 may exceed thatfrom the energy-transfer mechanism and show stronger tem-perature as dependencies (Luther et al., 2005). This mecha-nism may also influence high pressure experiments whenk0from the radical-complex mechanism exceeds k∞ from theenergy-transfer mechanism (Oum et al., 2003). In this casefalloff over wide pressure ranges cannot be represented bycontributions from the energy-transfer mechanism alone, inparticular when measurements at pressures above about 10bar are taken into consideration.
The dependence ofk0 andk∞ on the temperatureT is rep-resented in the formk∝T −n except for cases with an estab-lished energy barrier in the potential. We have used this formof temperature dependence because it usually gives a betterfit to the data over a wider range of temperature than doesthe Arrhenius expression. It should be emphasised that thechosen form of the temperature dependence is often only ad-equate over limited temperature ranges such as 200–300 K.Obviously, the relevant values ofn are different fork0 andk∞. In this evaluation, values ofk0 are given for selectedexamples of third bodies M, and if possible for M=N2, O2 orair.
2.4 Treatment of complex-forming bimolecular reactions
Bimolecular reactions may follow the “direct” pathway
A + B→ C+ D
and/or involve complex formation,
A + B⇔ AB∗→ C+ D↓ MAB
We designate the rate coefficients of the individual steps asin Sect. 3.3, above:
A + B→ AB∗ (1)
AB∗→ A + B (-1)
AB∗ +M → AB +M (2)
AB∗→ C+ D (3)
Assuming quasi-stationary concentrations of AB∗ (i.e.d[AB∗]/dt ≈ 0), a Lindemann-Hinshelwood type of analy-sis leads to,
d[AB]
dt= kS[A][B]
d[C]
dt= kD[A][B]
d[A]
dt= −(kS + kD)[A][B]
where
kS = k1
(k2
k−1+ k2+ k3
)
kD = k1
(k3
k−1+ k2+ k3
)Note that sincek2 is proportional to [M],kS andkD are
dependent on the nature and concentration of the third bodyM, in addition to their temperature dependence. In reality,as for the combination and dissociation reactions, the givenexpressions forkS andkD have to be extended by suitablebroadening factorsF to account for the multistep characterof process (2) and the energy and angular momemtum de-pendencies of processes (1), (-1) and (3). These broadeningfactors, however, differ from those for combination and dis-sociation reactions. For simplicity, they are ignored in thisevaluation such thatkD at high pressure approaches
kD → k1k3/k2
which is inversely proportional to [M].kD may also be ex-pressed by
kD ≈ kD0kS/kS0
wherekD0 andkS0 are the respective limiting low-pressurerate coefficients for the formation of C+D or A+B at the con-sidered [M]. When it is established that complex-formationis involved, this equation is used to characterize the increas-ing suppression of C+D formation with increasing [M]. Oneshould also note that bimolecular reactions may have con-tributions from direct as well as complex-forming pathwaysleading to identical or different products.
www.atmos-chem-phys.net/8/4141/2008/ Atmos. Chem. Phys., 8, 4141–4496, 2008

4152 R. Atkinson et al.: Evaluated kinetic and photochemical data for atmospheric chemistry
2.5 Photochemical reactions
The data sheets begin with a list of feasible primary pho-tochemical transitions for wavelengths usually down to170 nm, along with the corresponding enthalpy changes at0 K where possible or alternatively at 298 K, calculated fromthe data in the Thermodynamic Data summary. Calcu-lated threshold wavelengths corresponding to these enthalpychanges are also listed, bearing in mind that the values calcu-lated from the enthalpy changes at 298 K are not true “thresh-old values”.
This is followed by tables which summarise the availableexperimental data for: (i) absorption cross sections and (ii)quantum yields. These data are supplemented by a series ofcomments.
The next table lists the preferred absorption cross sectiondata and the preferred quantum yields at appropriate wave-length intervals. For absorption cross sections the intervalsare usually 1 nm, 5 nm or 10 nm. Any temperature depen-dence of the absorption cross sections is also given wherepossible. The aim in presenting these preferred data is toprovide a basis for calculating atmospheric photolysis rates.For absorption continua the temperature dependence is oftenrepresented by Sulzer-Wieland type expressions (Astholz etal., 1981). Alternately a simple empirical expression of theform: log10(σT 1/σT 2)=B(T1-T2) is used.
The comments again describe how the preferred data wereselected and include other relevant points. The photochemi-cal data sheets are concluded with a list of references.
2.6 Conventions concerning absorption cross sections
These are presented in the data sheets as “absorption crosssections per molecule, base e.” They are defined according tothe equations:
I/I0= exp(−σ [N]l),
σ = {1/([N]l)} ln(I0/I),
where I0 and I are the incident and transmitted light inten-sities, σ is the absorption cross section per molecule (ex-pressed in this paper in units of cm2), [N] is the number con-centration of absorber (expressed in molecule cm−3), andl
is the path length (expressed in cm). Other definitions andunits are frequently quoted. The closely related quantities“absorption coefficient” and “extinction coefficient” are of-ten used, but care must be taken to avoid confusion in theirdefinition. It is always necessary to know the units of con-centration and of path length and the type of logarithm (basee or base 10) corresponding to the definition. To convert anabsorption cross section to the equivalent Naperian (base e)absorption coefficient (expressed in cm−1) of a gas at a pres-sure of one standard atmosphere and temperature of 273 K,multiply the value ofσ in cm2 by 2.69×1019.
2.7 Assignment of uncertainties
Under the heading “reliability,” estimates have been made ofthe absolute accuracies of the preferred values ofk at 298 Kand of the preferred values ofE/R over the quoted temper-ature range. The accuracy of the preferred rate coefficient at298 K is quoted as the term1log k, where1log k=d andd isdefined by the equation, logk=c±d. This is equivalent to thestatement thatk is uncertain to a factor off , whered=logf .The accuracy of the preferred value ofE/R is quoted as theterm 1(E/R), where1(E/R)=g andg is defined by theequationE/R=h±g. d and g are expanded uncertaintiescorresponding approximately to a 95% confidence limit.
For second-order rate coefficients listed in this evalua-tion, an estimate of the uncertainty at any given temperaturewithin the recommended temperature range may be obtainedfrom the equation:
1 logk(T ) = 1 logk(298 K)+ 0.4343{1E/R(1/T − 1/298)}
The assignment of these absolute uncertainties ink andE/R
is a subjective assessment of the evaluators. They are not de-termined by a rigorous, statistical analysis of the database,which is generally too limited to permit such an analy-sis. Rather, the uncertainties are based on a knowledge ofthe techniques, the difficulties of the experimental measure-ments, the potential for systematic errors, and the number ofstudies conducted and their agreement or lack thereof. Ex-perience shows that for rate measurements of atomic andfree radical reactions in the gas phase, the precision of themeasurement, i.e. the reproducibility, is usually good. Thus,for single studies of a particular reaction involving one tech-nique, standard deviations, or even 95% confidence limits, of±10% or less are frequently reported in the literature. Unfor-tunately, when evaluators compare data for the same reactionstudied by more than one group of investigators and involv-ing different techniques, the rate coefficients often differ bya factor of 2 or even more. This can only mean that oneor more of the studies has involved large systematic uncer-tainty which is difficult to detect. This is hardly surprisingsince, unlike molecular reactions, it is not always possible tostudy atomic and free radical reactions in isolation, and con-sequently mechanistic and other difficulties frequently arise.
On the whole, our assessment of uncertainty limits tendstowards the cautious side. Thus, in the case where a rate co-efficient has been measured by a single investigation usingone particular technique and is unconfirmed by independentwork, we suggest that minimum uncertainty limits of a factorof 2 are appropriate.
In contrast to the usual situation for the rate coefficientsof thermal reactions, where intercomparison of results of anumber of independent studies permits a realistic assessmentof reliability, for many photochemical processes there is ascarcity of reliable data. Thus, we do not feel justified atpresent in assigning uncertainty limits to the parameters re-ported for the photochemical reactions.
Atmos. Chem. Phys., 8, 4141–4496, 2008 www.atmos-chem-phys.net/8/4141/2008/

R. Atkinson et al.: Evaluated kinetic and photochemical data for atmospheric chemistry 4153
Acknowledgements.The Chairman and members of the Commit-tee wish to express their appreciation to I.U.P.A.C. for the financialhelp which facilitated the preparation of this evaluation. We also ac-knowledge financial support from the following organisations: EUFramework Program 6, ACCENT network of excellence; Univer-sity of California Agricultural Experiment Station; the UK NaturalEnvironmental Research Council; the Standard Reference DataProgram (N.I.S.T); the Fonds National Suisse de la Recherche Sci-entifique (F.N.S.R.S.) and the Office Federal de l’Education et dela Science, Ford Motor Company, and the Deutsche Forschungs-gemeinschaft (SFB 357). We also thank B. Cox for her work inpreparing and editing the manuscript.
Edited by: W. T. Sturges
References
Astholz, D. C., Brouwer, L., and Troe, J.: High-TemperatureUltraviolet-Absorption Spectra of Polyatomic Molecules inShock Waves, Ber. Bunsenges. Phys. Chem., 85, 559–564, 1981.
Atkinson, R., Baulch, D. L., Cox, R. A., Hampson, Jr., R. F., Kerr, J.A., and Troe, J.: Evaluated Kinetic and Photochemical Data forAtmospheric Chemistry: Supplement III, IUPAC Subcommitteeon Gas Kinetic Data Evaluation for Atmospheric Chemistry, J.Phys. Chem. Ref. Data, 18, 881–1097, 1989.
Atkinson, R., Baulch, D. L., Cox, R. A., Hampson, Jr., R. F., Kerr, J.A., and Troe, J.: Evaluated Kinetic and Photochemical Data forAtmospheric Chemistry: Supplement IV, IUPAC Subcommitteeon Gas Kinetic Data Evaluation for Atmospheric Chemistry, J.Phys. Chem. Ref. Data, 21, 1125–1568, 1992.
Atkinson, R., Baulch, D. L., Cox, R. A., Hampson, Jr., R. F., Kerr,J. A., Rossi, M., and Troe, J.: Evaluated Kinetic, Photochemical,and Heterogeneous Data for Atmospheric Chemistry: Supple-ment V, IUPAC Subcommittee on Gas Kinetic Data Evaluationfor Atmospheric Chemistry, J. Phys. Chem. Ref. Data, 26, 521–1011, 1997a.
Atkinson, R., Baulch, D. L., Cox, R. A., Hampson, Jr., R. F., Kerr, J.A., Rossi, M. J., and Troe, J.: Evaluated Kinetic and Photochem-ical Data for Atmospheric Chemistry: Supplement VI, IUPACSubcommittee on Gas Kinetic Data Evaluation for AtmosphericChemistry, J. Phys. Chem. Ref. Data, 26, 1329–1499, 1997b.
Atkinson, R., Baulch, D. L., Cox, R. A., Hampson, Jr., R. F., Kerr, J.A., Rossi, M. J., and Troe, J.: Evaluated Kinetic and Photochem-ical Data for Atmospheric Chemistry: Supplement VII, IUPACSubcommittee on Gas Kinetic Data Evaluation for AtmosphericChemistry, J. Phys. Chem. Ref. Data, 28, 191–393, 1999.
Atkinson, R., Baulch, D. L., Cox, R. A., Hampson, Jr., R. F., Kerr, J.A., Rossi, M. J., and Troe, J.: Evaluated Kinetic and Photochem-ical Data for Atmospheric Chemistry, Supplement VIII, IUPACSubcommittee on Gas Kinetic Data Evaluation for AtmosphericChemistry, J. Phys. Chem. Ref. Data, J. Phys. Chem. Ref. Data,29, 167–266, 2000.
Baulch, D. L., Cox, R. A., Hampson, Jr., R. F., Kerr, J. A., Troe, J.,and Watson, R. T.: Evaluated Kinetic and Photochemical Datafor Atmospheric Chemistry, CODATA Task Group on ChemicalKinetics, J. Phys. Chem. Ref. Data, 9, 295–471, 1980.
Baulch, D. L., Cox, R. A., Crutzen, P. J., Hampson, Jr., R. F., Kerr,J. A., Troe, J., and Watson, R. T.: Evaluated Kinetic and Photo-chemical Data for Atmospheric Chemistry: Supplement I, CO-DATA Task Group on Chemical Kinetics, J. Phys. Chem. Ref.Data, 11, 327–496, 1982.
Baulch, D. L., Cox, R. A., Hampson, Jr., R. F., Kerr, J. A., Troe,J., and Watson, R. T.: Evaluated Kinetic and PhotochemicalData for Atmospheric Chemistry: Supplement II, CODATA TaskGroup on Gas Phase Chemical Kinetics, J. Phys. Chem. Ref.Data, 13, 1259–1380, 1984.
Cobos, C. J. and Troe, J.: Prediction of Reduced Falloff Curves forRecombination Reactions at Low Temperatures, Z. Phys. Chem.,217, 1–14, 2003.
Luther, K., Oum, K. and Troe, J.: The Role of the Radical-ComplexMechanism in the Ozone Recombination/Dissociation Reaction,Phys. Chem. Chem. Phys., 7, 2764-2770, 2005.
Sander, S. P., Friedl, R. R., Golden, D. M., Kurylo, M. J., Huie,R. E., Orkin, V. L., Moortgat, G. K., Ravishankara, A. R., Kolb,C. E., Molina, M. J., and Finlayson-Pitts, B. J.: Chemical Ki-netics and Photochemical Data for Use in Atmospheric Studies.NASA Panel for Data Evaluation, Evaluation Number 14., JPLPublication 02-25, 2003.
Oum, K., Sekiguchi, K., Luther, K., and Troe, J.: Observation ofUnique Pressure Effects in the Combination Reaction of BenzylRadicals in the Gas to Liquid Transition Region, Phys. Chem.Chem. Phys., 5, 2931–2933, 2003.
Troe, J.: Predictive Possibilities of Unimolecular Rate Theory, J.Phys. Chem., 83, 114–126, 1979.
www.atmos-chem-phys.net/8/4141/2008/ Atmos. Chem. Phys., 8, 4141–4496, 2008
4154 R. Atkinson et al.: Evaluated kinetic and photochemical data for atmospheric chemistry
DATASHEETS
Appendix 1: FOx Reactions
IV.A1.1
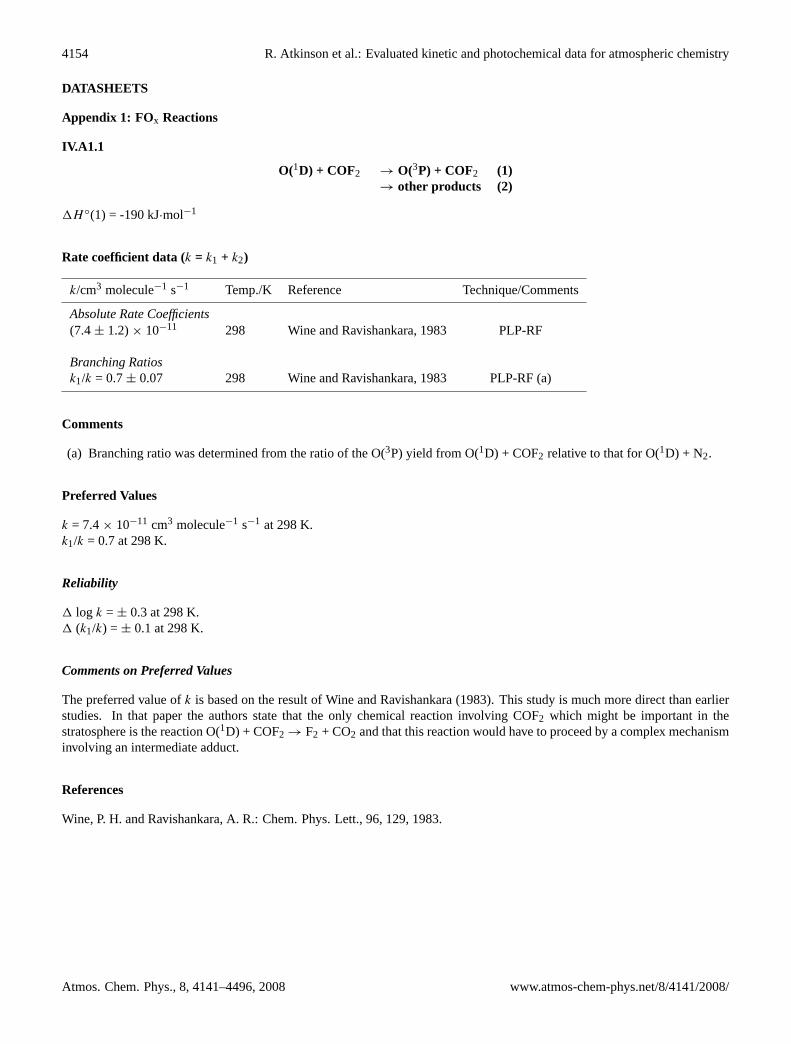
O(1D) + COF2 → O(3P) + COF2 (1)→ other products (2)
1H ◦(1) = -190 kJ·mol−1
Rate coefficient data (k = k1 + k2)
k/cm3 molecule−1 s−1 Temp./K Reference Technique/Comments
Absolute Rate Coefficients(7.4± 1.2)× 10−11 298 Wine and Ravishankara, 1983 PLP-RF
Branching Ratiosk1/k = 0.7± 0.07 298 Wine and Ravishankara, 1983 PLP-RF (a)
Comments
(a) Branching ratio was determined from the ratio of the O(3P) yield from O(1D) + COF2 relative to that for O(1D) + N2.
Preferred Values
k = 7.4× 10⁻¹¹ cm3 molecule−1 s−1 at 298 K.k1/k = 0.7 at 298 K.
Reliability
1 log k =± 0.3 at 298 K.1 (k1/k) =± 0.1 at 298 K.
Comments on Preferred Values
The preferred value ofk is based on the result of Wine and Ravishankara (1983). This study is much more direct than earlierstudies. In that paper the authors state that the only chemical reaction involving COF2 which might be important in thestratosphere is the reaction O(1D) + COF2→ F2 + CO2 and that this reaction would have to proceed by a complex mechanisminvolving an intermediate adduct.
References
Wine, P. H. and Ravishankara, A. R.: Chem. Phys. Lett., 96, 129, 1983.
Atmos. Chem. Phys., 8, 4141–4496, 2008 www.atmos-chem-phys.net/8/4141/2008/

R. Atkinson et al.: Evaluated kinetic and photochemical data for atmospheric chemistry 4155
IV.A1.2
O(1D) + CH3F → O(3P) + CH3F (1)→ other products (2)
1H ◦(1) = -190 kJ·mol−1
Rate coefficient data (k = k1 + k2)
k/cm3 molecule−1 s−1 Temp./K Reference Technique/Comments
Absolute Rate Coefficients(1.38± 0.06)× 10−10 298 Force and Wiesenfeld, 1981 PLP-RA(1.65± 0.15)× 10−10 298 Schmoltner et al., 1993 PLP-RF
Branching Ratiosk1/k = 0.25± 0.03 298 Force and Wiesenfeld, 1981 PLP-RA (a)k1/k = 0.11± 0.05 298 Schmoltner et al., 1993 PLP-RF (b)k1/k = 0.19± 0.05 298 Takahashi et al., 1996 PLP-LIF (b)
Comments
(a) O(1D) atoms were monitored by resonance absorption at 130.4 nm and compared to O(3P) atoms in the presence of ozonein He diluent where the O(3P) atom yield from the O(1D) + O3 reaction is 1.0.
(b) Branching ratio was determined from the ratio of the O(3P) yield from O(1D) + CH3F relative to that for O(1D) + N2.
Preferred Values
k = 1.5× 10⁻¹⁰ cm3 molecule−1 s−1 at 298 K.k1/k = 0.18 at 298 K.
Reliability
1 log k =± 0.15 at 298 K.1 (k1/k) =± 0.1 at 298 K.
Comments on Preferred Values
The preferred value ofk is the average of the values reported by Force and Wiesenfeld (1981) and by Schmoltner et al.(1993). The preferred value of the branching ratiok1/k is the average of the values reported by Force and Wiesenfeld (1981),Schmoltner et al. (1993) and Takahashi et al. (1996). In these experiments, only O(3P) was monitored and therefore no directinformation relating to the products of the chemical reaction of O(1D) + CH3F was obtained. Burks and Lin (1981) haveobserved the appearance of stimulated emissions from vibrationally excited HF. Park and Wiesenfeld (1991) observed someproduction of HO, but they reported that HF elimination dominates over HO production.
References
Burks, T. L. and Lin, M. C.: Int. J. Chem. Kinet., 13, 977, 1981.Force, A. P. and Wiesenfeld, J. R.: J. Phys. Chem., 85, 782, 1981.Park, R. P. and Wiesenfeld, J. R.: Chem. Phys. Lett., 186, 170, 1991.Schmoltner, A. M., Talukdar, R. K., Warren, R. F., Mellouki, A., Goldfarb, L., Gierczak, T., McKeen, S. A. and Ravishankara,A. R.: J. Phys. Chem., 97, 8976, 1993.Takahashi, K., Wada, R., Matsumi, Y. and Kawasaki, M.: J. Phys. Chem., 100, 10145, 1996.
www.atmos-chem-phys.net/8/4141/2008/ Atmos. Chem. Phys., 8, 4141–4496, 2008
4156 R. Atkinson et al.: Evaluated kinetic and photochemical data for atmospheric chemistry
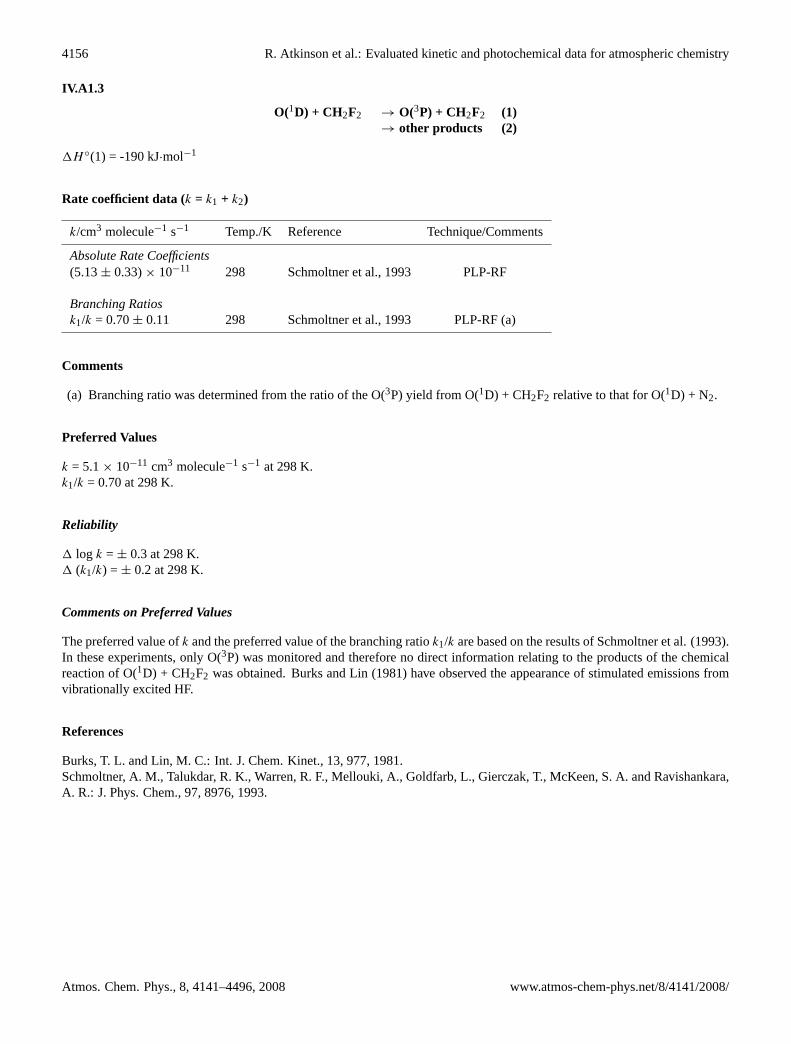
IV.A1.3
O(1D) + CH2F2 → O(3P) + CH2F2 (1)→ other products (2)
1H ◦(1) = -190 kJ·mol−1
Rate coefficient data (k = k1 + k2)
k/cm3 molecule−1 s−1 Temp./K Reference Technique/Comments
Absolute Rate Coefficients(5.13± 0.33)× 10−11 298 Schmoltner et al., 1993 PLP-RF
Branching Ratiosk1/k = 0.70± 0.11 298 Schmoltner et al., 1993 PLP-RF (a)
Comments
(a) Branching ratio was determined from the ratio of the O(3P) yield from O(1D) + CH2F2 relative to that for O(1D) + N2.
Preferred Values
k = 5.1× 10⁻¹¹ cm3 molecule−1 s−1 at 298 K.k1/k = 0.70 at 298 K.
Reliability
1 log k =± 0.3 at 298 K.1 (k1/k) =± 0.2 at 298 K.
Comments on Preferred Values
The preferred value ofk and the preferred value of the branching ratiok1/k are based on the results of Schmoltner et al. (1993).In these experiments, only O(3P) was monitored and therefore no direct information relating to the products of the chemicalreaction of O(1D) + CH2F2 was obtained. Burks and Lin (1981) have observed the appearance of stimulated emissions fromvibrationally excited HF.
References
Burks, T. L. and Lin, M. C.: Int. J. Chem. Kinet., 13, 977, 1981.Schmoltner, A. M., Talukdar, R. K., Warren, R. F., Mellouki, A., Goldfarb, L., Gierczak, T., McKeen, S. A. and Ravishankara,A. R.: J. Phys. Chem., 97, 8976, 1993.
Atmos. Chem. Phys., 8, 4141–4496, 2008 www.atmos-chem-phys.net/8/4141/2008/

R. Atkinson et al.: Evaluated kinetic and photochemical data for atmospheric chemistry 4157
IV.A1.4
O(1D) + CHF3 → O(3P) + CHF3 (1)→ other products (2)
1H ◦(1) = -190 kJ·mol−1
Rate coefficient data (k = k1 + k2)
k/cm3 molecule−1 s−1 Temp./K Reference Technique/Comments
Absolute Rate Coefficients(8.4± 0.8)× 10−12 298 Force and Wiesenfeld, 1981 PLP-RA(9.76± 0.60)× 10−12 298 Schmoltner et al., 1993 PLP-RF
Branching Ratiosk1/k = 0.77± 0.15 298 Force and Wiesenfeld, 1981 PLP-RA (a)k1/k = 1.02± 0.15 298 Schmoltner et al., 1993 PLP-RF (b)
Comments
(a) O(1D) atoms were monitored by resonance absorption at 130.4 nm and compared to O(3P) atoms in the presence of ozonein He diluent where the O(3P) atom yield from the O(1D) + O3 reaction is 1.0.
(b) Branching ratio was determined from the ratio of the O(3P) yield from O(1D) + CHF3 relative to that for O(1D) + N2.
Preferred Values
k = 9.1× 10⁻¹² cm3 molecule−1 s−1 at 298 K.k1/k = 0.9 at 298 K.
Reliability
1 log k =± 0.15 at 298 K.1 (k1/k) =± 0.1 at 298 K.
Comments on Preferred Values
The preferred value ofk is the average of the values reported by Force and Wiesenfeld (1981) and Schmoltner et al. (1993).The preferred value of the branching ratiok1/k is the average of the values reported by Force and Wiesenfeld (1981) andSchmoltner et al. (1993). In these experiments, only O(3P) was monitored and therefore no direct information relating to theproducts of the chemical reaction of O(1D) + CHF3 was obtained. Burks and Lin (1981) and Aker et al. (1987) have observedthe appearance of stimulated emissions from vibrationally excited HF.
References
Aker, P. M., Niefer, B. I., Sloan, J. J. and Heydtmann, H.: J. Chem. Phys., 87, 203, 1987.Burks, T. L. and Lin, M. C.: Int. J. Chem. Kinet., 13, 977, 1981.Force, A. P. and Wiesenfeld, J. R.: J. Phys. Chem., 85, 782, 1981.Schmoltner, A. M., Talukdar, R. K., Warren, R. F., Mellouki, A., Goldfarb, L., Gierczak, T., McKeen, S. A. and Ravishankara,A. R.: J. Phys. Chem., 97, 8976, 1993
www.atmos-chem-phys.net/8/4141/2008/ Atmos. Chem. Phys., 8, 4141–4496, 2008

4158 R. Atkinson et al.: Evaluated kinetic and photochemical data for atmospheric chemistry
IV.A1.5
O(1D) + CH3CH2F → O(3P) + CH3CH2F (1)→ other products (2)
1H ◦(1) = -190 kJ·mol−1
Rate coefficient data (k = k1 + k2)
k/cm3 molecule−1 s−1 Temp./K Reference Technique/Comments
Absolute Rate Coefficients(2.61± 0.40)× 10−10 298 Schmoltner et al., 1993 PLP-RF
Branching Ratiosk1/k = 0.18± 0.05 298 Schmoltner et al., 1993 PLP-RF (a)
Comments
(a) Branching ratio was determined from the ratio of the O(3P) yield from O(1D) + CH3CH2F relative to that for O(1D) + N2.
Preferred Values
k = 2.6× 10⁻¹⁰ cm3 molecule−1 s−1 at 298 K.k1/k = 0.18 at 298 K.
Reliability
1 log k =± 0.3 at 298 K.1 (k1/k) =± 0.1 at 298 K.
Comments on Preferred Values
The preferred value ofk and the branching ratiok1/k are based on the results of Schmoltner et al. (1993), the only publishedstudy of this reaction. In these experiments, only O(3P) was monitored and therefore no direct information relating to theproducts of the chemical reaction of O(1D) + CH3CH2F was obtained.
References
Schmoltner, A. M., Talukdar, R. K., Warren, R. F., Mellouki, A., Goldfarb, L., Gierczak, T., McKeen, S. A. and Ravishankara,A. R.: J. Phys. Chem., 97, 8976, 1993.
Atmos. Chem. Phys., 8, 4141–4496, 2008 www.atmos-chem-phys.net/8/4141/2008/

R. Atkinson et al.: Evaluated kinetic and photochemical data for atmospheric chemistry 4159
IV.A1.6
O(1D) + CH3CHF2 → O(3P) + CH3CHF2 (1)→ other products (2)
1H ◦(1) = -190 kJ·mol−1
Rate coefficient data (k = k1 + k2)
k/cm3 molecule−1 s−1 Temp./K Reference Technique/Comments
Absolute Rate Coefficients(2.02± 0.15)× 10−10 298 Warren et al., 1991 PLP-RF
Branching Ratiosk1/k = 0.54± 0.07 298 Warren et al., 1991 PLP-RF (a)
Comments
(a) Branching ratio was determined from the ratio of the O(3P) yield from O(1D) + CH3CHF2 relative to that for O(1D) + N2.
Preferred Values
k = 2.0× 10⁻¹⁰ cm3 molecule−1 s−1 at 298 K.k1/k = 0.54 at 298 K.
Reliability
1 log k =± 0.3 at 298 K.1 (k1/k) =± 0.1 at 298 K.
Comments on Preferred Values
The preferred value ofk and the preferred value of the branching ratiok1/k are based on the results of Warren et al. (1991),the only published study of this reaction. In these experiments, only O(3P) was monitored and therefore no direct informationrelating to the products of the chemical reaction of O(1D) + CH3CHF2 was obtained.
References
Warren, R., Gierczak, T. and Ravishankara, A. R.: Chem. Phys. Lett., 183, 403, 1991.
www.atmos-chem-phys.net/8/4141/2008/ Atmos. Chem. Phys., 8, 4141–4496, 2008

4160 R. Atkinson et al.: Evaluated kinetic and photochemical data for atmospheric chemistry
IV.A1.7
O(1D) + CH3CF3 → O(3P) + CH3CF3 (1)→ other products (2)
1H ◦(1) = -190 kJ·mol−1
Rate coefficient data (k = k1 + k2)
k/cm3 molecule−1 s−1 Temp./K Reference Technique/Comments
Relative Rate Coefficientsk2 = (5.8± 2.0)× 10−11 297 Green and Wayne, 1976 RR (a)
Comments
(a) O(1D) produced by photolysis of NO2 at 229 nm.1(CH3CF3)/1(N2O) monitored by IR absorption spectroscopy. Mea-sured rate coefficient ratio ofk2/k(O(1D) + N2O) = 0.5± 0.1 is placed on an absolute basis by use ofk(O(1D) + N2O)= 1.16× 10⁻¹⁰ cm3 molecule−1 s−1 (IUPAC, current evaluation). The cited rate coefficient refers to chemical reactiononly and does not include physical quenching.
Preferred Values
k2 = 5.8× 10⁻¹¹ cm3 molecule−1 s−1 at 298 K.
Reliability
1 log k =± 0.5
Comments on Preferred Values
The preferred value ofk2 is derived from the relative rate results reported by Green and Wayne (1976) in the only publishedstudy of this reaction. It should be noted that this rate coefficient refers to chemical reaction only and does not include physicalquenching of O(1D).
References
Green, R. G. and Wayne, R. P.: J. Photochem. 6, 371, 1976.IUPAC, http://www.iupac-kinetic.ch.cam.ac.uk/, 2007.
Atmos. Chem. Phys., 8, 4141–4496, 2008 www.atmos-chem-phys.net/8/4141/2008/

R. Atkinson et al.: Evaluated kinetic and photochemical data for atmospheric chemistry 4161
IV.A1.8
O(1D) + CH2FCF3 → O(3P) + CH2FCF3 (1)→ other products (2)
1H ◦(1) = -190 kJ·mol−1
Rate coefficient data (k = k1 + k2)
k/cm3 molecule−1 s−1 Temp./K Reference Technique/Comments
Absolute Rate Coefficients(4.85± 0.25)× 10−11 298 Warren et al., 1991 PLP-RF
Branching Ratiosk1/k = 0.94+0.06
−0.10 298 Warren et al., 1991 PLP-RF (a)
Comments
(a) Branching ratio was determined from the ratio of the O(3P) yield from O(1D) + CH2FCF3 relative to that for O(1D) + N2.
Preferred Values
k = 4.9× 10⁻¹¹ cm3 molecule−1 s−1 at 298 K.k1/k = 0.94 at 298 K.
Reliability
1 log k =± 0.3 at 298 K.1 (k1/k) = (+0.06
−0.10) at 298 K.
Comments on Preferred Values
The preferred value ofk and the preferred value of the branching ratiok1/k are based on the results of Warren et al. (1991),the only published study of this reaction. In these experiments, only O(3P) was monitored and therefore no direct informationrelating to the products of the chemical reaction of O(1D) + CH2FCF3 was obtained.
References
Warren, R., Gierczak, T. and Ravishankara, A. R.: Chem. Phys. Lett., 183, 403, 1991.
www.atmos-chem-phys.net/8/4141/2008/ Atmos. Chem. Phys., 8, 4141–4496, 2008

4162 R. Atkinson et al.: Evaluated kinetic and photochemical data for atmospheric chemistry
IV.A1.9
O(1D) + CHF2CF3 → O(3P) + CHF2CF3 (1)→ other products (2)
1H ◦(1) = -190 kJ·mol−1
Rate coefficient data (k = k1 + k2)
k/cm3 molecule−1 s−1 Temp./K Reference Technique/Comments
Absolute Rate Coefficients(1.23± 0.06)× 10−10 298 Warren et al., 1991 PLP-RF
Branching Ratiosk1/k = 0.85+0.15
−0.22 298 Warren et al., 1991 PLP-RF (a)
Comments
(a) Branching ratio was determined from the ratio of the O(3P) yield from O(1D) + CHF2CF3 relative to that for O(1D) + N2.
Preferred Values
k = 1.2× 10⁻¹⁰ cm3 molecule−1 s−1 at 298 K.k1/k = 0.85 at 298 K.
Reliability
1 log k =± 0.3 at 298 K.1 (k1/k) = (+0.15
−0.3 ) at 298 K.
Comments on Preferred Values
The preferred value ofk and the preferred value of the branching ratiok1/k are based on the results of Warren et al. (1991).In these experiments, only O(3P) was monitored and therefore no direct information relating to the products of the chemicalreaction of O(1D) + CHF2CF3 was obtained.
References
Warren, R., Gierczak, T. and Ravishankara, A. R.: Chem. Phys. Lett., 183, 403, 1991.
Atmos. Chem. Phys., 8, 4141–4496, 2008 www.atmos-chem-phys.net/8/4141/2008/

R. Atkinson et al.: Evaluated kinetic and photochemical data for atmospheric chemistry 4163
IV.A1.10
HO + CH3F → H2O + CH2F
1H ◦ = -78.2 kJ·mol−1
Rate coefficient data
k/cm3 molecule−1 s−1 Temp./K Reference Technique/Comments
Absolute Rate Coefficients(1.60± 0.35)× 10−14 296 Howard and Evenson, 1976 DF-LMR(2.18± 0.18)× 10−14 297 Nip et al., 1979 FP-RA8.11× 10−12 exp[-(1887± 61)/T ] 292-480 Jeong et al., 1984 DF-RF (a)(1.40± 0.09)× 10−14 292(1.71± 0.24)× 10−14 298 Bera and Hanrahan, 1988 PR-A1.75× 10−12 exp[-(1300± 100)/T ] 243-373 Schmoltner et al., 1993 PLP/FP-LIF(2.09± 0.08)× 10−14 298
Relative Rate Coefficients(1.71± 0.08)× 10−14 296± 2 Wallington and Hurley, 1993 RR (b)(1.41± 0.07)× 10−14 296± 2 Wallington and Hurley, 1993 RR (c)(1.32± 0.12)× 10−14 295 Møgelberg et al., 1994 RR (d)2.77× 10⁻¹⁸ T 2 exp[-(754± 34)/T ] 298-363 Hsu and DeMore, 1995 RR (e)1.96× 10⁻¹⁴ 2984.21× 10−18 T 2 exp[-(856± 82)/T ] 308-393 DeMore, 1996 RR (f)
Comments
(a) The rate expression cited in Jeong et al. (1984) supersedes that reported in Jeong and Kaufman (1982). Jeong et al. (1984)also corrects an erroneously reported rate measurement at 480 K.
(b) HO radicals were generated by photolysis of CH3ONO at 933 mbar total pressure of air. The decay of CH3F was inferredfrom the measured formation of HC(O)F, using a formation yield of HC(O)F of 0.90 as measured in separate Cl2-CH3F-NO-air irradiations. The concentrations of HC(O)F and acetylene were measured by FTIR absorption spectroscopy. Themeasured rate coefficient ratio ofk(HO + CH3F)/k(HO + C2H2) = 0.0201± 0.0009 was placed on an absolute basis byusingk(HO + C2H2) = 8.49× 10⁻¹³ cm3 molecule−1 s−1 at 296 K and 1013 mbar air (Sørensen et al. 2003).
(c) HO radicals generated by the photolysis of O3 at 254 nm in the presence of H2. The concentrations of CH4 and CH3Fwere measured by FTIR absorption spectroscopy. The measured rate coefficient ratio ofk(HO + CH3F)/k(HO + CH4)= 2.30± 0.11 was placed on an absolute basis by usingk(HO + CH4) = 6.14× 10⁻¹⁵ cm3 molecule−1 s−1 at 296 K(IUPAC, current recommendation).
(d) HO radicals generated by the photolysis of O3 at 254 nm in the presence of H2. The decay of CH4 and CH3F concen-trations was monitored by FTIR spectroscopy. The measured rate coefficient ratio ofk(HO + CH3F)/k(HO + CH4) = 2.2± 0.2 was placed on an absolute basis by usingk(HO + CH4) = 6.01× 10⁻¹⁵ cm3 molecule−1 s−1 at 295 K (IUPAC,current recommendation).
(e) HO radicals were generated by the photolysis of H2O at 185 nm or of O3-H2O mixtures in the UV in H2O (or O3-H2O)-CH3F-CH3CHF2-O2-N2 mixtures. The concentrations of CH3F and CH3CHF2 were measured by IR spectroscopy. Themeasured rate coefficient ratio ofk(HO + CH3F)/k(HO + CH3CHF2) = (0.99± 0.10) exp[-(174± 34)/T ] is placed onan absolute basis by using a rate coefficient ofk(HO + CH3CHF2) = 2.80× 10⁻¹⁸ T 2 exp(-580/T ) cm3 molecule−1 s−1
(IUPAC, current recommendation).
(f) HO radicals generated by the photolysis of O3 at 254 nm in the presence of H2O vapour. The decay of CH3Cl and CH3Fconcentrations was monitored by FTIR spectroscopy. The rate coefficient ratio ofk(HO + CH3F)/k(HO + CH3Cl) = (0.97
www.atmos-chem-phys.net/8/4141/2008/ Atmos. Chem. Phys., 8, 4141–4496, 2008

4164 R. Atkinson et al.: Evaluated kinetic and photochemical data for atmospheric chemistry
± 0.23) exp[-(156± 82)/T ] was measured over the temperature range 308-393 K. The rate coefficient ratio was placedon an absolute basis by usingk(HO + CH3Cl) = 4.34× 10⁻¹⁸ T 2 exp(-700/T ) cm3 molecule−1 s−1 (IUPAC, currentrecommendation).
Preferred Values
k = 2.1× 10⁻¹⁴ cm3 molecule−1 s−1 at 298 K.k = 1.9 x 10⁻¹² exp(-1350/T ) cm3 molecule−1 s−1 over the temperature range 240-300 K.
Reliability
1 log k =± 0.15 at 298 K.1 (E/R) =± 400 K.
Comments on Preferred Values
The absolute rate coefficients of Schmoltner et al. (1993) are higher than those reported previously by Jeong and Kaufman(1982) and Jeong et al. (1984), although the discrepancy decreases with increasing temperature. The absolute rate coefficientsof Schmoltner et al. (1993), although exhibiting scatter at temperatures≤ 273 K, are in good agreement with the relative ratecoefficients of Hsu and DeMore (1995) and DeMore (1996) at 298 K and above. The absolute rate coefficient of Nip et al.(1979) is in good agreement with the data of Schmoltner et al. (1993), Hsu and DeMore (1995) and DeMore (1996). Becausesecondary reactions of HO radicals with CH2F radicals and other radical species were expected to have occurred in the study ofBera and Hanrahan (1988), their rate coefficient was consequently not used in the evaluation. The absolute rate coefficients ofHoward and Evenson (1976), Jeong and Kaufman (1982), Wallington and Hurley (1993), and Møgelberg et al. (1994) appearto be systematically lower than other studies, and therefore they were not used in the evaluation.
The data of Nip et al. (1979), Schmoltner et al. (1993), Hsu and DeMore (1995) and DeMore (1996) were fitted to thethree-parameter equationk = CT 2 exp(-D/T ), resulting ink = 3.66× 10⁻¹⁸ T 2 exp(-818/T ) cm3 molecule−1 s−1 over thetemperature range 243-393 K. The preferred Arrhenius expression,k = A exp(-B/T ), is centered on a mid-range temperature,Tm, of 265 K and is derived from the three parameter equation withA = C e2 T 2
m andB = D + 2Tm.
References
Bera, R. K. and Hanrahan, R. J.: Radiat. Phys. Chem. 32, 579, 1988.DeMore, W. B.: J. Phys. Chem. 100, 5813, 1996.Howard, C. J. and Evenson, K. M.: J. Chem. Phys. 64, 197, 1976.Hsu, K.-J. and DeMore, W. B.: J. Phys. Chem. 99, 1235, 1995.IUPAC: http://www.iupac-kinetic.ch.cam.ac.uk/, 2007.Jeong, K.-M. and Kaufman, F.: J. Phys. Chem. 86, 1808, 1982.Jeong, K.-M., Hsu, K.-J., Jeffries, J. B. and Kaufman, F.: J. Phys. Chem. 88, 1222, 1984.Møgelberg, T. E., Nielsen, O. J., Sehested, J., Wallington, T. J. and Hurley, M. D.: Chem. Phys. Lett. 226, 171, 1994.Nip, W. S., Singleton, D. L., Overend, R. and Paraskevopoulos, G.: J. Phys. Chem. 83, 2440, 1979.Schmoltner, A. M., Talukdar, R. K., Warren, R. F., Mellouki, A., Goldfarb, L., Gierczak, T., McKeen, S. A. and Ravishankara,A. R.: J. Phys. Chem. 97, 8976, 1993.Sørensen, M., Kaiser, E. W., Hurley, M. D., Wallington, T. J. and Nielsen, O. J.: Int. J. Chem. Kinet. 35, 191, 2003.Wallington, T. J. and Hurley, M. D.: Environ. Sci. Technol. 27, 1448, 1993.
Atmos. Chem. Phys., 8, 4141–4496, 2008 www.atmos-chem-phys.net/8/4141/2008/

R. Atkinson et al.: Evaluated kinetic and photochemical data for atmospheric chemistry 4165
IV.A1.11
HO + CH2F2 → H2O + CHF2
1H ◦ = -65.0 kJ·mol−1
Rate coefficient data
k/cm3 molecule−1 s−1 Temp./K Reference Technique/Comments
Absolute Rate Coefficients(7.8± 1.2)× 10−15 296 Howard and Evenson, 1976 DF-LMR7.42× 10−12 exp[-(2100± 200)/T ] 293-429 Clyne and Holt, 1979 DF-RF(5.8± 0.3)× 10−15 293(1.17± 0.14)× 10−14 297 Nip et al., 1979 FP-RA4.4× 10−12 exp[-(1766± 50)/T ] 250-492 Jeong et al., 1984 DF-RF (a)(1.12± 0.075)× 10−14 298(8.8± 1.4)× 10−15 298 Bera and Hanrahan, 1988 PR-A1.57× 10−12 exp[-(1470± 100)/T ] 222-381 Talukdar et al., 1991 FP-LIF(1.13± 0.01)× 10−14 298(2.52± 0.25)× 10−15 223 Schmoltner et al., 1993 PLP/FP-LIF(1.09± 0.03)× 10−14 298(1.00± 0.03)× 10−14 298 Szilagyi et al., 2000 DF-RF
Relative Rate Coefficients2.24× 10−18 T 2 exp[-(857± 24)/T ] 297-383 Hsu and DeMore, 1995 RR (b)1.12× 10⁻¹⁴ 297
Comments
(a) The rate expression cited in Jeong et al. (1984) supersedes that reported in Jeong and Kaufman (1982).
(b) Relative rate method. HO radicals were generated from the photolysis of H2O at 185 nm or of O3-H2O mixtures in the UVin H2O (or O3-H2O)-CH2F2-CH3CHF2-O2-N2 mixtures. The concentrations of CH2F2 and CH3CHF2 were measured byFTIR spectroscopy. The measured rate coefficient ratio ofk(HO + CH2F2)/k(HO + CH3CHF2) = (0.80± 0.06) exp[-(277± 24)/T ] is placed on an absolute basis using a rate coefficient ofk(HO + CH3CHF2) = 2.80× 10⁻¹⁸ T 2 exp(-580/T )cm3 molecule−1 s−1 (IUPAC, current recommendation).
Preferred Values
k = 1.1× 10⁻¹⁴ cm3 molecule−1 s−1 at 298 K.k = 2.3× 10⁻¹² exp(-1590/T ) cm3 molecule−1 s−1 over the temperature range 220-300 K.
Reliability
1 log k =± 0.1 at 298 K.1 (E/R) =± 200 K.
Comments on Preferred Values
The absolute rate coefficients of Schmoltner et al. (1993) at 223 K and 298 K are in excellent agreement with the earlier andmuch more extensive rate coefficient data of Talukdar et al. (1991). The room temperature rate coefficients of Nip et al. (1983),Jeong and Kaufman (1982), Jeong et al. (1984), Talukdar et al. (1991) and Schmoltner et al. (1993) are in good agreement, but
www.atmos-chem-phys.net/8/4141/2008/ Atmos. Chem. Phys., 8, 4141–4496, 2008

4166 R. Atkinson et al.: Evaluated kinetic and photochemical data for atmospheric chemistry
are∼ 30% higher than those of Howard and Evenson (1976), Clyne and Holt (1979) and Bera and Hanrahan (1988). The dataof Clyne and Holt (1979) are not considered reliable and that of Bera and Hanrahan (1988) may have been subject to secondaryreactions. The rate coefficients measured by Jeong and Kaufman (1982) (250–492 K) and Talukdar et al. (1991) (222–381 K)are in good agreement over the temperature range where they overlap.
The rate coefficient data of Nip et al. (1983), Jeong and Kaufman (1982), Talukdar et al. (1991), Hsu and DeMore (1995),Schmoltner et al. (1993), and Szilagyi et al. (2000) have been fitted to the three parameter equationk = CT 2 exp(−D/T ),resulting ink = 4.80× 10⁻¹⁸ T 2 exp(-1080/T ) cm3 molecule−1 s−1 over the temperature range 222–492 K. The preferredArrhenius expression,k = A exp(-B/T ), is centered on a mid-range temperature,Tm, of 255 K and is derived from the threeparameter equation withA = C e2 T 2
m andB = D + 2Tm.
References
Bera, R. K. and Hanrahan, R. J.: Radiat. Phys. Chem. 32, 579, 1988.Clyne, M. A. A. and Holt, P. M.: J. Chem. Soc. Faraday Trans. 2, 75, 582, 1979.Howard, C. J. and Evenson, K. M.: J. Chem. Phys. 64, 197, 1976.Hsu, K.-J. and DeMore, W. B.: J. Phys. Chem. 99, 1235, 1995.IUPAC: http://www.iupac-kinetic.ch.cam.ac.uk/, 2007.Jeong, K.-M. and Kaufman, F.: J. Phys. Chem. 86, 1808, 1982.Jeong, K.-M., Hsu, K.-J., Jeffries, J. B. and Kaufman, F.: J. Phys. Chem. 88, 1222, 1984.Nip, W. S., Singleton, D. L., Overend, R. and Paraskevopoulos, G.: J. Phys. Chem. 83, 2440, 1979.Schmoltner, A. M., Talukdar, R. K., Warren, R. F., Mellouki, A., Goldfarb, L., Gierczak, T., McKeen, S. A. and Ravishankara,A. R.: J. Phys. Chem. 97, 8976, 1993.Szilagyi, I., Dobe, S. and Berces, T.: React. Kinet. Catal. Lett. 70, 319, 2000.Talukdar, R., Mellouki, A., Gierczak, T., Burkholder, J. B., McKeen, S. A. and Ravishankara, A. R.: J. Phys. Chem. 95, 5815,1991.
Atmos. Chem. Phys., 8, 4141–4496, 2008 www.atmos-chem-phys.net/8/4141/2008/

R. Atkinson et al.: Evaluated kinetic and photochemical data for atmospheric chemistry 4167
IV.A1.12
HO + CHF3 → H2O + CF3
1H ◦ = -47.5 kJ·mol−1
Rate coefficient data
k/cm3 molecule−1 s−1 Temp./K Reference Technique/Comments
Absolute Rate Coefficients(2.0± 0.2)× 10−16 296 Howard and Evenson, 1976 DF-LMR(1.3± 0.4)× 10−15 296 Clyne and Holt, 1979 DF-RF(1.4± 0.6)× 10−15 430(3.49± 1.66)× 10−16 297 Nip et al., 1979 FP-RA2.98× 10−12 exp[-(2908± 156)/T ] 387-480 Jeong et al., 1984 DF-RF (a)1.71× 10⁻¹⁶ 298 (b)(2.3± 0.4)× 10−15 298 Bera and Hanrahan, 1988 PR-RA6.93× 10−13 exp[-(2300± 100)/T ] 252-374 Schmoltner et al., 1993 FP-LIF(3.08± 0.28)× 10−16 2981.1× 10−12 exp[-(2300± 207)/T ] 298-753 Medhurst et al., 1997 PLP-LIF(1.5± 0.2)× 10−16 298
Relative Rate Coefficients1.05× 10−18 T 2 exp[-(1774± 44)/T ] 298-383 Hsu and DeMore, 1995 RR (c)2.42× 10⁻¹⁶ 2986.19× 10−19 T 2 exp[-(1523± 34)/T ] 253-343 Chen et al., 2003 RR (d,e)3.32× 10⁻¹⁶ 2981.12× 10−18 T 2 exp[-(1706± 44)/T ] 253-343 Chen et al., 2003 RR (d,f)3.25× 10⁻¹⁶ 298
Comments
(a) The rate expression cited in Jeong et al. (1984) supersedes that reported in Jeong and Kaufman (1982). Jeong et al. (1984)also corrects an erroneously reported rate measurement at 465 K.
(b) Extrapolated value.
(c) Relative rate method. HO radicals were generated from the photolysis of H2O at 185 nm or of O3-H2O mixtures in the UVin H2O (or H2O-O3)-CHF3-CHF2CF3-N2-O2 mixtures. The concentrations of CHF3 and CHF2CF3 were measured byFTIR spectroscopy. The measured rate coefficient ratio ofk(HO + CHF3)/k(HO + CHF2CF3) = (1.14± 0.08) exp[-(654± 44)/T ] is placed on an absolute basis by using a rate coefficient ofk(HO + CHF2CF3) = 9.24× 10⁻¹⁹ T 2 exp(-1120/T )cm3 molecule−1 s−1 (IUPAC, current recommendation).
(d) Relative rate method. HO radicals were generated from the photolysis of H2O at 254 nm in the presence of a continuousflow of a 3% O3 in O2 mixture. The concentrations of CHF3 and reference compounds were measured by GC-FID. Totalinitial reactor pressure was 266 mbar (200 Torr) with the pressure rising to 400–666 mbar (300–500 Torr) at the end of anexperiment.
(e) Relative to CHF2CF3. An Arrhenius plot of the Chen et al. (2003) data gives a rate coefficient ratio ofk(HO +CHF3)/k(HO + CHF2CF3) = (0.67± 0.12) exp[-(403± 34)/T ] over the temperature range 253–343 K. The rate co-efficient ratio was placed on an absolute basis by using a rate coefficient ofk(HO + CF3CHF2) = 9.24× 10⁻¹⁹ T 2
exp(-1120/T ) cm3 molecule−1 s−1 (IUPAC, current recommendation).
(f) Relative to CHF2Cl. An Arrhenius plot of the Chen et al. (2003) data gives a rate coefficient ratio ofk(HO + CHF3)/k(HO+ CHF2Cl) = (0.74± 0.17) exp[-(706± 44)/T ] over the temperature range 253–343 K. The rate coefficient ratio was
www.atmos-chem-phys.net/8/4141/2008/ Atmos. Chem. Phys., 8, 4141–4496, 2008

4168 R. Atkinson et al.: Evaluated kinetic and photochemical data for atmospheric chemistry
placed on an absolute basis by using a rate coefficient ofk(HO + CHF2Cl) = 1.52× 10⁻¹⁸ T 2 exp(-1000/T ) cm3
molecule−1 s−1 (IUPAC, current recommendation).
Preferred Values
k = 2.7× 10⁻¹⁶ cm3 molecule−1 s−1 at 298 K.k = 6.9× 10⁻¹³ exp(-2340/T ) cm3 molecule−1 s−1 over the temperature range 250-300 K.
Reliability
1 log k =± 0.2 at 298 K.1 (E/R) =± 300 K.
Comments on Preferred Values
The absolute rate coefficient study of Schmoltner et al. (1993) and the relative rate studies of Chen et al. (2003) are the onlytemperature-dependent studies carried out at temperatures below 298 K. The rate coefficients of Schmoltner et al. (1993) andChen et al. (2003) are in very good agreement over the temperature range 252–343 K. The rate coefficients from the relativerate study of Hsu and DeMore (1995) are∼ 10-20% lower than the absolute rate coefficients of Schmoltner et al. (1993)and the relative rate studies of Chen et al. (2003) over the temperature range common to all studies, with the disagreementincreasing with decreasing temperature. However, the absolute rate coefficients of Jeong and Kaufmann (1982) are in goodagreement with the relative rate coefficients of Hsu and DeMore (1995) at temperatures 383–387 K. The data of Medhurst etal. (1997) were obtained at temperatures predominantly above room temperature. Moreover, the rate coefficients calculatedfrom the Arrhenius fit to their experimental data are substantially higher than any other study. Therefore, the data of Medhurstet al. (1997) were not used in the evaluation. The rate coefficient of Nip et al. (1979) is in good agreement with the data ofSchmoltner et al. (1993) and Chen et al. (2003), but the rate coefficient of Howard and Evenson (1976) is∼ 40% lower. Thedata of Clyne and Holt (1979) and Bera and Hanrahan (1988) were not used due to their inconsistency with the other data.
The absolute rate coefficients of Howard and Evenson (1976), Nip et al. (1979), Jeong and Kaufman (1982), Schmoltneret al. (1993) and the relative rate coefficients of Chen et al. (2003) have been fitted to the three parameter equationk = CT 2
exp(-D/T ), resulting ink = 1.42× 10⁻¹⁸ T 2 exp(-1798/T ) cm3 molecule−1 s−1 over the temperature range 252–480 K. Thepreferred Arrhenius expression,k = A exp(-B/T ), is centered on a mid-range temperature,Tm, of 270 K and is derived fromthe three parameter equation withA = C e2 T 2
m andB = D+2Tm. The relative rate data of Hsu and DeMore (1995) are∼ 10%lower than the preferred values.
References
Bera, R. K. and Hanrahan, R. J.: Radiat. Phys. Chem. 32, 579, 1988.Chen, L., Kutsuna, S., Tokuhashi, K. and Sekiya, A.: Int. J. Chem. Kinet. 35, 317, 2003.Clyne, M. A. A. and Holt, P. M.: J. Chem. Soc. Faraday Trans. 2, 75, 582, 1979.Howard, C. J. and Evenson, K. M.: J. Chem. Phys. 64, 197, 1976.Hsu, K.-J. and DeMore, W. B.: J. Phys. Chem. 99, 1235, 1995.IUPAC: http://www.iupac-kinetic.ch.cam.ac.uk/, 2007.Jeong, K.-M. and Kaufman, F.: J. Phys. Chem. 86, 1808, 1982.Jeong, K.-M., Hsu, K.-J., Jeffries, J. B. and Kaufman, F.: J. Phys. Chem. 88, 1222, 1984.Medhurst, L. J., Fleming, J. and Nelson, H. H.: Chem. Phys. Lett. 266, 607, 1997.Nip, W. S., Singleton, D. L., Overend, R. and Paraskevopoulos, G.: J. Phys. Chem. 83, 2440, 1979.Schmoltner, A. M., Talukdar, R. K., Warren, R. F., Mellouki, A., Goldfarb, L., Gierczak, T., McKeen, S. A. and Ravishankara,A. R.: J. Phys. Chem. 97, 8976, 1993.
Atmos. Chem. Phys., 8, 4141–4496, 2008 www.atmos-chem-phys.net/8/4141/2008/

R. Atkinson et al.: Evaluated kinetic and photochemical data for atmospheric chemistry 4169
IV.A1.13
HO + CF4 → HOF + CF3
1H ◦ = 327.2 kJ·mol−1
Rate coefficient data
k/cm3 molecule−1 s−1 Temp./K Reference Technique/Comments
Absolute Rate Coefficients<4× 10⁻¹⁶ 296± 2 Howard and Evenson, 1976 DF-LMR<1× 10⁻¹⁵ 293 Clyne and Holt, 1979 DF-RF<2× 10⁻¹⁸
∼298 Ravishankara et al., 1993 PLP-LIF (a)
Comments
(a) Not explicitly reported, but expected to be a pulsed photolysis system with LIF detection of HO radicals as carried out bySchmoltner et al. (1993) for HO radical reaction rate coefficient measurements with related hydrofluorocarbons.
Preferred Values
k < 2× 10⁻¹⁸ cm3 molecule−1 s−1 at 298 K.
Comments on Preferred Values
The preferred value is the upper limit to the rate coefficient reported by Ravishankara et al. (1993).
References
Clyne, M. A. A. and Holt, P. M.: J. Chem. Soc. Faraday Trans. 2, 75, 582, 1979.Howard, C. J. and Evenson, K. M.: J. Chem. Phys. 64, 197, 1976.Ravishankara, A. R., Solomon, S., Turnipseed, A. A. and Warren, R. F.: Science 259, 194, 1993.Schmoltner, A. M., Talukdar, R. K., Warren, R. F., Mellouki, A., Goldfarb, L., Gierczak, T., McKeen, S. A. and Ravishankara,A. R.: J. Phys. Chem. 97, 8976, 1993.
www.atmos-chem-phys.net/8/4141/2008/ Atmos. Chem. Phys., 8, 4141–4496, 2008

4170 R. Atkinson et al.: Evaluated kinetic and photochemical data for atmospheric chemistry
IV.A1.14
HO + CH3CH2F → H2O + CH3CHF (1)→ H2O + CH2CH2F (2)
1H ◦(1) = -74.4 kJ·mol−1
1H ◦(2) = -59.6 kJ·mol−1
Rate coefficient data(k =k1 + k2)
k/cm3 molecule−1 s−1 Temp./K Reference Technique/Comments
Absolute Rate Coefficients(2.32± 0.37)× 10−13 297± 2 Nip et al., 1979 FP-RA2.69× 10−12 exp[-(750± 100)/T ] 243-373 Schmoltner et al., 1993 PLP/FP-LIF(2.17± 0.29)× 10−13 2986.78× 10−12 exp[-(1033± 74)/T ] 298-480 Kozlov et al., 2003 FP-RF2.42× 10−12 exp[-(716± 36)/T ] 210-298(2.20± 0.03)× 10−13 298
Relative Rate Coefficients1.73× 10−17 T 2 exp[-(657± 36)/T ] 285-364 Hsu and DeMore, 1995 RR (a)1.69× 10⁻¹³ 298
Comments
(a) HO radicals were generated by the photolysis of H2O at 185 nm or of H2O-O3 mixtures in the UV in H2O (or H2O-O3)-CH3CH2F-C2H6-O2-N2 mixtures. The concentrations of CH3CH2F and C2H6 were measured by FTIR spectroscopy. Themeasured rate coefficient ratio ofk(HO + CH3CH2F)/k(HO + C2H6) = (1.16± 0.13) exp[-(158± 36)/T ] is placed on anabsolute basis using a rate coefficient ofk(HO + C2H6) = 1.49× 10⁻¹⁷ T 2 exp(-499/T ) cm3 molecule−1 s−1 (IUPAC,current recommendation).
Preferred Values
k = 2.1× 10⁻¹³ cm3 molecule−1 s−1 at 298 K.k = 2.7× 10⁻¹² exp(-765/T ) cm3 molecule−1 s−1 over the temperature range 210-300 K.k1/k = 0.85 K.
Reliability
1 log k =± 0.2 at 298 K.1 (E/R) =± 300 K.k1/k =± 0.15 at 298 K.
Comments on Preferred Values
The rate coefficients of Nip et al. (1979), Schmoltner et al. (1993) and Kozlov et al. (2003) are in good agreement overthe temperature range 243-373 K. The relative rate coefficients of Hsu and DeMore (1995) display a higher temperaturedependence compared to that observed by Schmoltner et al. (1993) and Kozlov et al. (2003). At room temperature, the ratecoefficients of Hsu and DeMore (1995) are∼35% lower than those of Nip et al. (1979), Schmoltner et al. (1993) and Kozlovet al. (2003). The source of the disagreement is not known although impurities in the reactant were ruled out in the Kozlov etal. (2003) study. Above 298 K (329–364 K), the agreement between the data of Hsu and DeMore (1995), Schmoltner et al.(1993) and Kozlov et al. (2003) is better.
Atmos. Chem. Phys., 8, 4141–4496, 2008 www.atmos-chem-phys.net/8/4141/2008/
R. Atkinson et al.: Evaluated kinetic and photochemical data for atmospheric chemistry 4171
The study by Kozlov et al. (2003) shows curvature in the Arrhenius plot. Singleton et al. (1980) determined that 85% of theabstraction by HO is from the CH2F group at 298 K. Therefore, at least some of the observed curvature is probably due to theincreasing importance of H atom abstraction from the unsubstituted methyl group (CH3) with increasing temperature.
The absolute rate coefficients of Nip et al. (1979), Schmoltner et al. (1993) and Kozlov et al. (2003) were fitted to thethree-parameter equationk = CT 2 exp(-D/T ), resulting ink = 6.12× 10⁻¹⁸ T 2 exp(-275/T ) cm3 molecule−1 s−1 over thetemperature range 210–480 K. The preferred Arrhenius expressionk = A exp(-B/T ), is centered on a mid-range temperature,Tm, of 245 K and is derived from the three parameter equation withA = C e2 T 2
m andB = D + 2Tm. The relative rate data ofHsu and DeMore (1995) are approximately 20-30% lower than the preferred value at 298 K.
References
Hsu, K.-J. and DeMore, W. B.: J. Phys. Chem. 99, 1235, 1995.IUPAC: http://www.iupac-kinetic.ch.cam.ac.uk/, 2007.Kozlov, S. N., Orkin, V. L. and Kurylo, M. J.: J. Phys. Chem. A. 107, 2239, 2003.Nip, W. S., Singleton, D. L., Overend, R. and Paraskevopoulos, G.: J. Phys. Chem. 83, 2440, 1979.Schmoltner, A. M., Talukdar, R. K., Warren, R. F., Mellouki, A., Goldfarb, L., Gierczak, T., McKeen, S. A. and Ravishankara,A. R.: J. Phys. Chem. 97, 8976, 1993.Singleton, D. L., Paraskevopoulos, G. and Irwin, R. S.: J. Phys. Chem. 84, 2339, 1980.
www.atmos-chem-phys.net/8/4141/2008/ Atmos. Chem. Phys., 8, 4141–4496, 2008

4172 R. Atkinson et al.: Evaluated kinetic and photochemical data for atmospheric chemistry
IV.A1.15
HO + CH3CHF2 → H2O + CH2CHF2 (1)→ H2O + CH3CF2 (2)
1H ◦(1) = -53.8 kJ·mol−1
1H ◦(2) = -69.8 kJ·mol−1
Rate coefficient data(k = k1 + k2)
k/cm3 molecule−1 s−1 Temp./K Reference Technique/Comments
Absolute Rate Coefficients(3.12± 0.70)× 10−14 296 Howard and Evenson, 1976 DF-LMR(3.50± 0.50)× 10−14 293 Handwerk and Zellner, 1978 FP-RA2.92× 10−12 exp[-(1200± 100)/T ] 293-417 Clyne and Holt, 1979 DF-RF(4.66± 0.16)× 10−14 293(3.7± 0.4)× 10−14 297± 2 Nip et al., 1979 FP-RA1.42× 10−12 exp[-(1050)/T ] 220-423 Brown et al. 1990 DF-RF4.2× 10−14 2989.6× 10−13 exp[-(940± 130)/T ] 270-400 Liu et al., 1990 FP-RF(4.22± 0.45)× 10−14 2981.0× 10−12 exp[-(980± 50)/T ] 212-349 Gierczak et al., 1991 DF-LMR/FP-LIF(3.76± 0.6)× 10−14 2933.9× 10−12 exp[-(1370± 260)/T ] 295-388 Nielsen, 1991 PR-RA(4.7± 1.1)× 10−14 2953.24× 10−12 exp[-(1372± 89)/T ] 298-480 Kozlov et al., 2003 FP-RF9.36× 10−13 exp[-(998± 56)/T ] 210-298(3.38± 0.05)× 10−14 298
Relative Rate Coefficients(3.86± 0.67)× 10−14 298± 2 DeMore, 1992 RR (a)(3.45± 0.34)× 10−14 298± 2 DeMore, 1992 RR (b)3.44× 10⁻¹⁸ T 2 exp[-(690± 57)/T ] 298-358 Hsu and DeMore, 1995 RR (c)3.02× 10⁻¹⁴ 2981.18× 10−20 T 2.82 exp[-(388± 67)/T ] 298-358 Hsu and DeMore, 1995 RR (b)3.05× 10⁻¹⁴ 2982.53× 10−18 T 2 exp[-(557± 19)/T ] 286-403 Wilson et al., 2003 RR (d,e)3.47× 10⁻¹⁴ 2981.22× 10−18 T 2 exp[-(329± 42)/T ] 290-391 Wilson et al., 2003 RR (d,f)3.59× 10⁻¹⁴ 298(3.12± 0.58)× 10−14 295± 2 Taketani et al., 2005 RR (g,h)(3.03± 0.53)× 10−14 295± 2 Taketani et al., 2005 RR (g,i)
Comments
(a) HO radicals were generated by the photolysis of H2O at 185 nm in H2O-CH3CHF2-C2H6-N2-O2 mixtures. The concen-trations of CH3CHF2 and C2H6 were measured by FTIR spectroscopy. The measured rate coefficient ratio ofk(HO +CH3CHF2)/k(HO + C2H6) = 0.161± 0.028 is placed on an absolute basis by use of a rate coefficient ofk(HO + C2H6) =2.4× 10⁻¹³ cm3 molecule−1 s−1 (IUPAC, current recommendation).
(b) HO radicals were generated by the photolysis of H2O at 185 nm or of O3-H2O mixtures in H2O (or O3-H2O)-CH3CHF2-CH4-N2-O2 mixtures. The concentrations of CH3CHF2 and CH4 were measured by FTIR spectroscopy. The measuredrate coefficient ratios ofk(HO + CH3CHF2)/k(HO + CH4) = 5.2± 0.5 (DeMore, 1992) andk(HO + CH3CHF2)/k(HO
Atmos. Chem. Phys., 8, 4141–4496, 2008 www.atmos-chem-phys.net/8/4141/2008/

R. Atkinson et al.: Evaluated kinetic and photochemical data for atmospheric chemistry 4173
+ CH4) = (0.64± 0.13) exp[(599± 67)/T ] (Hsu and DeMore, 1995) are placed on an absolute basis by use of a ratecoefficient ofk(HO + CH4) = 1.85× 10⁻²⁰ T 2.82 exp(-987/T ) cm3 molecule−1 s−1 (IUPAC, current recommendation).
(c) HO radicals were generated by the photolysis of H2O at 185 nm or of O3-H2O mixtures in the UV in H2O (or H2O-O3)-CH3CHF2-CH3CCl3-O2-N2 mixtures. The concentrations of CH3CHF2 and CH3CCl3 were measured by FTIRspectroscopy. The measured rate coefficient ratio ofk(HO + CH3CHF2)/k(HO + CH3CCl3) = (1.53± 0.28) exp[(220± 57)/T ] is placed on an absolute basis by use of a rate coefficient ofk(HO + CH3CCl3) = 2.25× 10⁻¹⁸ T 2 exp(-910/T )cm3 molecule−1 s−1 (IUPAC, current recommendation).
(d) Relative rate method. HO radicals were generated by photolyzing H2O vapor at 185 nm. Reactant and reference com-pound concentrations were monitored by GC/MS.
(e) Relative to C2H6. An Arrhenius plot of the data gives the temperature dependence of the measured ratios as (0.17± 0.01)exp[-(58± 19)/T ], which is placed on an absolute basis using a rate coefficient ofk(HO + C2H6) = 1.49× 10⁻¹⁷ T 2
exp(-499/T ) cm3 molecule−1 s−1 (IUPAC, current recommendation).
(f) Relative to cyclopropane. An Arrhenius plot of the data gives the temperature dependence of the measured ratios as (0.29± 0.10) exp[(125± 42)/T ] ], which is placed on an absolute basis using a rate coefficient ofk(HO + cyclo-C3H6) = 4.21× 10⁻¹⁸ T 2 exp(-454/T ) cm3 molecule−1 s−1 (Atkinson, 2003).
(g) Relative rate method. HO radicals were generated by the UV photolysis of CH3ONO in the presence of the reactant in700 Torr total pressure of air diluent. Reference compound concentrations were monitored by FTIR. CH3CHF2 loss wasmeasured indirectly from the observed formation of COF2.
(h) Relative to C2H4. The measured rate coefficient ratio ofk(CH3CHF2 + HO)/k(C2H4 + HO) = (3.59± 0.27)× 10−3
placed on an absolute basis by using a rate coefficient ofk(C2H4 + HO) = 8.7× 10⁻¹² cm3 molecule−1 s−1 at 295 K(Calvert et al., 2000).
(i) Relative to C2H2. The measured rate coefficient ratio ofk(CH3CHF2 + HO)/k(C2H2 + HO) = (3.58± 0.12)× 10−2 isplaced on an absolute basis by using a rate coefficient ofk(C2H2 + HO) = 8.45× 10⁻¹³ cm3 molecule−1 s−1 at 296 K(Sørensen et al., 2003).
Preferred Values
k = 3.6× 10⁻¹⁴ cm3 molecule−1 s−1 at 298 K.k = 1.25× 10⁻¹² exp(-1070/T ) cm3 molecule−1 s−1 over the temperature range 210-300 K.
Reliability
1 log k = +0.10−0.20 at 298 K.
1 (E/R) = +200−400 K.
Comments on Preferred Values
The absolute rate coefficients of Handwerk and Zellner (1978), Nip et al. (1979), Gierczak et al. (1991), and Kozlov et al.(2003) are in good agreement, and the relative rate coefficients of DeMore (1992) and Wilson et al. (2003) agree well withthese absolute rate coefficients. The absolute rate coefficients of Clyne and Holt (1979) and Nielsen (1991) are systematicallyhigher than the other absolute or relative rate coefficients, hence these data were not used in the evaluation. The data ofBrown et al. (1990) are scattered and subject to large uncertainties, and those of Liu et al. (1990) exhibit a lower temperaturedependence than the other absolute or relative rate coefficients - these studies were also not used in the evaluation. It is possiblethat the studies of Clyne and Holt (1979), Brown et al. (1990), Liu et al. (1990) and Nielsen (1991) were affected by reactantimpurities. Of the data of Wilson et al. (2003), the rate data relative to C2H6 agrees very well with the absolute rate coefficientsof Gierczak et al. (1991) and Kozlov et al. (2003). The Wilson et al. (2003) data relative to cyclopropane exhibits a lowertemperature dependence compared with the data of Gierczak et al. (1991), Kozlov et al. (2003) and Wilson et al. (2003)relative to C2H6. This is attributed to uncertainties in the recommended rate constant for the cyclopropane reaction. Hence,
www.atmos-chem-phys.net/8/4141/2008/ Atmos. Chem. Phys., 8, 4141–4496, 2008

4174 R. Atkinson et al.: Evaluated kinetic and photochemical data for atmospheric chemistry
only the Wilson et al. (2003) data relative to C2H6 were used in the evaluation. The relative rate coefficients of DeMore (1992)relative to C2H6 and CH4 are in good agreement with each other, and in good agreement with the absolute rate coefficients ofHoward and Evenson (1976), Handwerk and Zellner (1978), Nip et al. (1979), Gierczak et al. (1991), Kozlov et al. (2003),and the rate coefficients of Wilson et al. (2003) relative to C2H6. The relative rate coefficients of Hsu and DeMore (1995) aresystematically lower and exhibit a slightly higher temperature dependence than the data of Gierczak et al. (1991), Kozlov etal. (2003), and Wilson et al. (2003) relative to C2H6.
The rate coefficient data of Howard and Evenson (1976), Handwerk and Zellner (1978), Nip et al. (1979), Gierczak et al.(1991) (using all data in the temperature range 212–422.5 K), DeMore (1992), Kozlov et al. (2003) and Wilson et al. (2003)(relative to C2H6) were fitted to a three parameter equationk = CT 2 exp(-D/T ) giving k = 2.80× 10⁻¹⁸ T 2 exp(-580/T )over the temperature range 210–480 K. The preferred Arrhenius expression,k = A exp(-B/T ), is centered on a mid-rangetemperature,Tm, of 245 K and is derived from the three parameter equation withA = C e2 T 2
m andB = D + 2Tm. The relativerate data of Hsu and DeMore (1995) are approximately 16-18% lower than the preferred value at 298 K.
References
Atkinson, R.: Atmos. Chem. Phys. 3, 2233, 2003.Brown, A. C., Canosa-Mas, C. E., Parr, A. D. and Wayne, R. P.: Atmos. Environ. 24A, 2499, 1990.Calvert, J. G., Atkinson, R., Kerr, J. A., Madronich, S., Moortgat, G. K., Wallington, T. J., and Yarwood, G.: The Mechanismof Atmospheric Oxidation of the Alkenes, Oxford University Press, New York, 2000.Clyne, M. A. A. and Holt, P. M.: J. Chem. Soc. Faraday Trans. 2, 75, 582, 1979.DeMore, W. B.: Optical Methods in Atmospheric Chemistry, Soc. Photo-Optic. Instrum. Eng. 1715, 72, 1992.Gierczak, T., Talukdar, R., Vaghjiani, G. L., Lovejoy, E. R. and Ravishankara, A. R.: J. Geophys. Res. 96, 5001, 1991.Handwerk V. and Zellner, R.: Ber. Bunsenges. Phys. Chem. 82, 1161, 1978.Howard, C. J. and Evenson, K. M.: J. Chem. Phys. 64, 4303, 1976.Hsu, K.-J. and DeMore, W. B.: J. Phys. Chem. 99, 1235, 1995.IUPAC: http://www.iupac-kinetic.ch.cam.ac.uk/, 2007.Kozlov, S. N., Orkin, V. L. and Kurylo, M. J.: J. Phys. Chem. A. 107, 2239, 2003.Liu, R., Huie, R. E. and Kurylo, M. J.: J. Phys. Chem. 94, 3247, 1990.Nielsen, O. J.: Chem. Phys. Lett. 187, 286, 1991.Nip, W. S., Singleton, D. L., Overend, R. and Paraskevopoulos, G.: J. Phys. Chem. 83, 2440, 1979.Sørensen, M., Kaiser, E. W., Hurley, M. D., Wallington, T. J. and Nielsen, O. J.: Int. J. Chem. Kinet. 35, 191, 2003.Taketani, F., Nakayama, T., Takahashi, K., Matsumi, Y., Hurley, M. D., Wallington, T. J., Toft, A., and Sulbaek Andersen, M.P.: J. Phys. Chem. A. 109, 9061, 2005.Wilson, E. W., Jr., Jacoby, A. M., Kukta, S. J., Gilbert, L. E. and DeMore, W. B.: J. Phys. Chem. A. 107, 9357, 2003.
Atmos. Chem. Phys., 8, 4141–4496, 2008 www.atmos-chem-phys.net/8/4141/2008/

R. Atkinson et al.: Evaluated kinetic and photochemical data for atmospheric chemistry 4175
IV.A1.16
HO + CH3CF3 → H2O + CH2CF3
1H ◦ = -47.4 kJ·mol−1
Rate coefficient data
k/cm3 molecule−1 s−1 Temp./K Reference Technique/Comments
Absolute Rate Coefficients(6.92± 1.20)× 10−11 exp [-(3200± 500)/T ] 333-425 Clyne and Holt, 1979 DF-RF (a)< 1.0× 10⁻¹⁵ 293(1.71± 0.43)× 10−15 298 Martin and Paraskevopoulos, 1983 FP-RA2.12× 10−12 exp[-(2200± 200)/T ] 261-374 Talukdar et al., 1991 DF-LMR/FP-LIF (b)(1.35± 0.25)× 10−15 2989.51× 10−13 exp[-(1979± 65)/T ] 298-370 Orkin et al., 1996 FP-RF(1.24± 0.09)× 10−15 298
Relative Rate Coefficients7.96× 10−21 T 2.82 exp[-(1210± 90)/T ] 298-403 Hsu and DeMore, 1995 RR (c,d)1.30× 10⁻¹⁵ 2982.00× 10−18 T 2 exp[-(1490± 21)/T ] 298-383 Hsu and DeMore, 1995 RR (c,e)1.20× 10⁻¹⁵ 298
Comments
(a) Although experiments were conducted over the temperature range 293–425 K, only an upper limit to the rate coefficientwas obtained at 293 K.
(b) Kinetic data were obtained over the temperature range 223–374 K. Because the Arrhenius plot exhibited curvature below261 K, the Arrhenius expression cited in the table was derived from the rate coefficients between 261–374 K.
(c) HO radicals generated by the photolysis of H2O at 185 nm or of O3-H2O mixtures in the UV in H2O (or O3-H2O)-CH3CF3-CH4 (or CHF2CF3)-O2-N2 mixtures. The concentrations of CH3CF3 and CH4 (or CHF2CF3) were measured byFTIR spectroscopy.
(d) The measured rate coefficient ratiok(HO + CH3CF3)/k(HO + CH4) = (0.43± 0.12) exp[−(223± 90)/T ] was placed onan absolute basis by use of the rate coefficientk(HO + CH4) = 1.85× 10⁻²⁰ T 2.82 exp(-987/T ) cm3 molecule−1 s−1
(IUPAC, current recommendation).
(e) The measured rate coefficient ratiok(HO + CH3CF3)/k(HO + CHF2CF3) = (2.16± 0.14) exp[-(370± 21)/T ] was placedon an absolute basis by use of the rate coefficientk(HO + CHF2CF3) = 9.24× 10⁻¹⁹ T 2 exp(-1120/T ) cm3 molecule−1
s−1 (IUPAC, current recommendation).
Preferred Values
k = 1.2× 10⁻¹⁵ cm3 molecule−1 s−1 at 298 K.k = 9.2× 10⁻¹³ exp(-1970/T ) cm3 molecule−1 s−1 over the temperature range 220-300 K.
Reliability
1 log k =± 0.15 at 298 K.1 (E/R) =± 300 K.
www.atmos-chem-phys.net/8/4141/2008/ Atmos. Chem. Phys., 8, 4141–4496, 2008

4176 R. Atkinson et al.: Evaluated kinetic and photochemical data for atmospheric chemistry
Comments on Preferred Values
The room temperature absolute rate coefficients of Martin and Paraskevopoulos (1983) and Talukdar et al. (1991) agreeto within 20%, and taking into account the respective uncertainties in both studies, the agreement is reasonable. The ratecoefficients of Hsu and DeMore, (1995) relative to the rate coefficients for the reactions of the HO radical with CH4 andCHF2CF3, are in excellent agreement with each other. The rate coefficients of Orkin et al. (1996) are also in quite goodagreement with the rate coefficients of Talukdar et al. (1991) and both sets of relative rate coefficients determined by Hsu andDeMore (1995). The rate coefficients of Clyne and Holt (1979) are not used in the evaluation because their rate coefficients at333 K and 378 K are significantly higher than those of the other studies and have large associated uncertainties.
The rate coefficients of Martin and Paraskevopoulos (1983), Talukdar et al. (1991) (using their entire data set over thetemperature range 223–374 K), Orkin et al. (1996), and Hsu and DeMore (1995) have been fitted to the three parameterequationk = CT 2 exp(-D/T ), resulting ink = 1.91× 10⁻¹⁸ T 2 exp(-1456/T ) cm3 molecule−1 s−1 over the temperature range223–403 K. The preferred Arrhenius expressionk = A exp(-B/T ), is centered on a mid-range temperature,Tm, of 255 K andis derived from the three parameter equation withA = C e2 T 2
m andB = D+ 2Tm. The preferred values are 13% lower and 9%higher than the values of Talukdar et al. (1991) at 223 K and 261 K, respectively.
References
Clyne, M. A. A. and Holt, P. M.: J. Chem. Soc. Faraday Trans. 2, 75, 582, 1979.Hsu, K.-J. and DeMore, W. B.: J. Phys. Chem. 99, 1235, 1995.IUPAC: http://www.iupac-kinetic.ch.cam.ac.uk/, 2007.Martin, J.-P. and Paraskevopoulos, G.: Can. J. Chem. 61, 861, 1983.Orkin, V. L., Huie, R. E. and Kurylo, M. J.: J. Phys. Chem. 100, 8907, 1996.Talukdar, R., Mellouki, A., Gierczak, T., Burkholder, J. B., McKeen, S. A. and Ravishankara, A. R.: J. Phys. Chem. 95, 5815,1991.
Atmos. Chem. Phys., 8, 4141–4496, 2008 www.atmos-chem-phys.net/8/4141/2008/

R. Atkinson et al.: Evaluated kinetic and photochemical data for atmospheric chemistry 4177
IV.A1.17
HO + CH2FCH2F→ H2O + CH2FCHF
1H ◦ = -69.5 kJ·mol−1
Rate coefficient data
k/cm3 molecule−1 s−1 Temp./K Reference Technique/Comments
Absolute Rate Coefficients(1.12± 0.12)× 10−13 298 Martin and Paraskevopoulos, 1983 FP-RA5.11× 10−12 exp[-(1190± 106)/T ] 298-480 Kozlov et al., 2003 FP-RF1.02× 10−12 exp[-(706± 70)/T ] 210-298(9.92± 0.18)× 10−14 298
Relative Rate Coefficients4.77× 10−18 T 2 exp[-(454± 23)/T ] 293-397 Wilson et al., 2003 RR (a,b)9.23× 10⁻¹⁴ 2982.15× 10−18 T 2 exp[-(188± 29)/T ] 287-409 Wilson et al., 2003 RR (a,c)1.20× 10⁻¹³ 2984.68× 10−18 T 2 exp[-(441± 16)/T ] 292-393 Wilson et al., 2003 RR (a,d)9.46× 10⁻¹⁴ 298
Comments
(a) Relative rate method. HO radicals were generated by photolyzing H2O vapor at 185 nm. Reactant and reference com-pound concentrations were monitored by GC/MS.
(b) Relative to C2H6. An Arrhenius plot of the data gives the temperature dependence of the measured ratios as (0.32± 0.02)exp[(45± 23)/T ], which is placed on an absolute basis using a rate coefficient ofk(HO + C2H6) = 1.49× 10⁻¹⁷ T 2
exp(-499/T ) cm3 molecule−1 s−1 (IUPAC, current recommendation).
(c) Relative to cyclopropane. An Arrhenius plot of the data gives the temperature dependence of the measured ratios as (0.51± 0.04) exp[(266± 29)/T ] ], which is placed on an absolute basis using a rate coefficient ofk(HO + cyclopropane) =4.21× 10⁻¹⁸ T 2 exp(-454/T ) cm3 molecule−1 s−1 (Atkinson, 2003).
(d) Relative to CH3CHF2. An Arrhenius plot of the data gives the temperature dependence of the measured ratios as (1.67± 0.08) exp[(139± 16)/T ], which is placed on an absolute basis using a rate coefficient ofk(HO + CH3CHF2) = 2.80×10⁻¹⁸ T 2 exp(-580/T ) cm3 molecule−1 s−1 (IUPAC, current recommendation).
Preferred Values
k = 1.0× 10⁻¹³ cm3 molecule−1 s−1 at 298 K.k = 1.5× 10⁻¹² exp(-800/T ) cm3 molecule−1 s−1 over the temperature range 210-300 K.
Reliability
1 log k =± 0.3 at 298 K.1 (E/R) =± 200 K.
www.atmos-chem-phys.net/8/4141/2008/ Atmos. Chem. Phys., 8, 4141–4496, 2008

4178 R. Atkinson et al.: Evaluated kinetic and photochemical data for atmospheric chemistry
Comments on Preferred Values
The absolute rate coefficients of Kozlov et al. (2003) and the relative rate coefficients of Wilson et al. (2003) (relative toC2H6 and CH2FCH2F) are in good agreement over the temperature range 298–380 K. The absolute rate coefficient of Martinand Paraskevopoulos (1983) at 298 K agrees to within 20% or better to the data of Kozlov et al. (2003) and Wilson et al.(2003) (relative to C2H6 and CH3CHF2). The rate coefficients of Wilson et al. (2003) relative to cyclopropane exhibit a lowertemperature dependence compared with the data of Kozlov et al. (2003) and the two other relative rate studies performed byWilson et al. (2003). This may be due to the literature rate coefficient for HO + cyclopropane being not well established becauseof substantial scatter in the literature data. Therefore, the rate coefficients of Wilson et al. (2003) relative to cyclopropane werenot used in the evaluation.
The absolute rate coefficients of Kozlov et al. (2003) and Martin and Paraskevopoulos (1983), and the relative rate coef-ficients of Wilson et al. (2003) relative to C2H6 and CH3CHF2 have been fitted to the three parameter equationk = CT 2
exp(-D/T ) resulting ink = 3.39× 10⁻¹⁸ T 2 exp(-312/T ) cm3 molecule−1 s−1 over the temperature range 210–480 K. Thepreferred Arrhenius expression,k = A exp(-B/T ), is centered on a mid-range temperature,Tm, of 245 K and is derived fromthe three parameter equation withA = C e2 T 2
m andB = D + 2Tm.
References
Atkinson, R.: Atmos. Chem. Phys. 3, 2233, 2003.Kozlov, S. N., Orkin, V. L. and Kurylo, M. J.: J. Phys. Chem. A. 107, 2239, 2003.Martin, J.-P. and Paraskevopoulos, G.: Can. J. Chem. 61, 861, 1983.Wilson, E. W., Jr., Jacoby, A. M., Kukta, S. J., Gilbert, L. E. and DeMore, W. B.: J. Phys. Chem. A. 107, 9357, 2003.
Atmos. Chem. Phys., 8, 4141–4496, 2008 www.atmos-chem-phys.net/8/4141/2008/

R. Atkinson et al.: Evaluated kinetic and photochemical data for atmospheric chemistry 4179
IV.A1.18
HO + CH2FCHF2 → H2O + CH2FCF2 (1)→ H2O + CHFCHF2 (2)
1H ◦(1) = -78.0 kJ·mol−1
1H ◦(2) = -80.1 kJ·mol−1
Rate coefficient data (k = k1 + k2)
k/cm3 molecule−1 s−1 Temp./K Reference Technique/Comments
Absolute Rate Coefficients1.48× 10−12 exp[-(1000± 100)/T ] 293-425 Clyne and Holt, 1979 DF-RF(4.68± 0.40)× 10−14 294(1.83± 0.18)× 10−14 298 Martin and Paraskevopoulos, 1983 FP-RA
Relative Rate Coefficients4.97× 10−18 T 2 exp(-1012/T ) 278-323 Barry et al., 1995 RR (a)(1.49± 0.05)× 10−14 298± 2
Comments
(a) HO radicals were generated by the photolysis of O3 in the presence of water vapor at∼250 nm at atmospheric pressureof air. Irradiations of O3-H2O-CH2FCHF2-CH3CCl3-air mixtures were carried out and the concentrations of CH2FCHF2and CH3CCl3 measured by GC and FTIR spectroscopy. The measured rate coefficient ratio ofk(HO + CH2FCHF2)/k(HO+ CH3CCl3) = 2.21 exp(-102/T ) is placed on an absolute basis by use of a rate coefficient ofk(HO + CH3CCl3) = 2.25×10⁻¹⁸ T 2 exp(-910/T ) cm3 molecule−1 s−1 (IUPAC, current recommendation).
Preferred Values
k = 1.5× 10⁻¹⁴ cm3 molecule−1 s−1 at 298 K.k = 3.3× 10⁻¹² exp(-1610/T ) cm3 molecule−1 s−1 over the temperature range 270-330 K.
Reliability
1 log k =± 0.2 at 298 K.1 (E/R) =± 300 K.
Comments on Preferred Values
The rate coefficient of Martin and Paraskevopoulos (1983) at 298 K is∼25% higher than the 298 K value Barry et al. (1995).The preferred rate coefficients are therefore derived from the relative rate study of Barry et al. (1995). The preferred Arrheniusexpression,k = A exp(-B/T ), is derived from the three parameter expression cited in the table (k = 4.97× 10⁻¹⁸ T 2 exp(-1012/T ) cm3 molecule−1 s−1 over the temperature range 278–323 K) and is centered on a mid-range temperature,Tm, of 300K with A = C e2 T 2
m andB = D + 2Tm.
References
Barry, J., Sidebottom, H., Treacy, J. and Franklin, J.: Int. J. Chem. Kinet. 27, 27, 1995.Clyne, M. A. A. and Holt, P. M.: J. Chem. Soc. Faraday Trans. 2, 75, 582, 1979.IUPAC: http://www.iupac-kinetic.ch.cam.ac.uk/, 2007.Martin, J.-P. and Paraskevopoulos, G.: Can. J. Chem. 61, 861, 1983.
www.atmos-chem-phys.net/8/4141/2008/ Atmos. Chem. Phys., 8, 4141–4496, 2008

4180 R. Atkinson et al.: Evaluated kinetic and photochemical data for atmospheric chemistry
IV.A1.19
HO + CH2FCF3→ H2O + CHFCF3
1H ◦ = -63.1 kJ·mol−1
Rate coefficient data
k/cm3 molecule−1 s−1 Temp./K Reference Technique/Comments
Absolute Rate Coefficients3.2× 10−12 exp[-(1800± 200)/T ] 294-429 Clyne and Holt, 1979 DF-RF(5.5± 0.7)× 10−15 294(5.2± 0.6)× 10−15 298 Martin and Paraskevopoulos, 1983 FP-RA1.1× 10−12 exp[-(1424± 35)/T ] 249-473 Jeong et al., 1984 DF-RF(8.44± 0.73)× 10−15 2985.8× 10−12 exp[-(1350)/T ] 231-423 Brown et al., 1990 DF-RF6.25× 10−15 2983.7× 10−12 exp[-(1990± 280)/T ] 270-400 Liu et al., 1990 FP-RF(5.18± 0.70)× 10−15 2985.7× 10−13 exp[-(1430± 60)/T ] 223-324 Gierczak et al., 1991 DF-LMR/FP-LIF (a)(4.34± 0.35)× 10−15 298(2.38± 0.22)× 10−15 270 Zhang et al., 1992 DF-RF1.03× 10−12 exp[-(1588± 52)/T ] 298-460 Orkin and Khamaganov, 1993 DF-EPR(5.00± 0.44)× 10−15 2989.9× 10−13 exp[-(1640± 150)/T ] 255-424 Leu and Lee, 1994 DF-RF(3.9± 0.6)× 10−15 298(4.6± 0.5)× 10−15 295 Bednarek et al., 1996 LP-UVA
Relative Rate Coefficients8.26× 10−21 T 2.82 exp [-(905± 115)/T ] 298-358 DeMore, 1993 RR (b,c)3.76× 10⁻¹⁵ 2981.84× 10−18 T 2 exp [-(1129± 44)/T ] 298-358 DeMore, 1993 RR (b,d)3.70× 10⁻¹⁵ 2981.93× 10−18 T 2 exp [-(1132± 79)/T ] 298-358 DeMore, 1993 RR (b,e)3.84× 10⁻¹⁵ 298(3.90± 0.48)× 10−15 298± 2 Barry et al., 1995 RR (f)(4.19± 0.19)× 10−15 298± 2 Barry et al., 1995 RR (g)
Comments
(a) Measurements were performed up to a temperature of 450 K. The Arrhenius expression only covers the temperature range223–324 K to avoid curvature in the Arrhenius plot.
(b) Relative rate method. HO radicals were generated by the irradiation of O3-H2O-O2-Ar mixtures at 254 nm. TheCH2FCF3, CH4, CH3CCl3, and CHF2CF3 concentrations were monitored during the experiments by FTIR absorptionspectroscopy. The measured rate coefficient ratios ofk(HO + CH4)/k(HO + CH2FCF3) = (2.24± 0.78) exp[-(82±115)/T ], k(HO + CH3CCl3)/k(HO + CH2FCF3) = (1.22± 0.17) exp[(219± 44)/T ] and k(HO + CHF2CF3/k(HO +CH2FCF3) = (0.48± 0.12) exp[(12± 79)/T ] are placed on an absolute basis by use of rate coefficientsk(HO + CH4) =1.85× 10⁻²⁰ T 2.82 exp(-987/T ) cm3 molecule−1 s−1 (IUPAC, current recommendation),k(HO + CH3CCl3) = 2.25×10⁻¹⁸ T 2 exp(-910/T ) cm3 molecule−1 s−1 (IUPAC, current recommendation) andk(HO + CHF2CF3) = 9.24× 10⁻¹⁹
T 2 exp(-1120/T ) cm3 molecule−1 s−1 (IUPAC, current recommendation).
(c) Relative tok(HO + CH4).
Atmos. Chem. Phys., 8, 4141–4496, 2008 www.atmos-chem-phys.net/8/4141/2008/

R. Atkinson et al.: Evaluated kinetic and photochemical data for atmospheric chemistry 4181
(d) Relative tok(HO + CH3CCl3).
(e) Relative tok(HO + CHF2CF3).
(f) Relative rate method. HO radicals were generated by the photolysis of O3 at∼250 nm in the presence of water vapor atatmospheric pressure of air. Irradiations of O3-H2O-CH2FCF3-CH3CCl3-air mixtures were carried out at 298± 2 K andthe concentrations of CH2FCF3 and CH3CCl3 measured by GC and FTIR spectroscopy. The measured rate coefficientratio of k(HO + CH2FCF3)/k(HO + CH3CCl3) = 0.41± 0.05 is placed on an absolute basis by using a rate coefficient ofk(HO + CH3CCl3) = 9.5× 10⁻¹⁵ cm3 molecule−1 s−1 at 298 K (IUPAC, current recommendation).
(g) Relative rate method. HO radicals were generated by the photolysis of O3 in the presence of water vapor. Irradiationsof O3-H2O-CH2FCF3-CH2FCHF2-air mixtures were carried out at 298± 2 K and the concentrations of CH2FCF3 andCH2FCHF2 measured by GC and FTIR spectroscopy. The measured rate coefficient ratiok(HO + CH2FCHF2)/k(HO +CH2FCF3) = 3.58± 0.16 is placed on an absolute basis by using a rate coefficient ofk(HO + CH2FCHF2) = 1.5× 10⁻¹⁴
cm3 molecule−1 s−1 at 298 K (IUPAC, current recommendation).
Preferred Values
k = 4.6× 10⁻¹⁵ cm3 molecule−1 s−1 at 298 K.k = 4.9× 10⁻¹³ exp(-1395/T ) cm3 molecule−1 s−1 over the temperature range 220-300 K.
Reliability
1 log k =± 0.2 at 298 K.1 (E/R) =± 300 K.
Comments on Preferred Values
The absolute rate coefficient of Zhang et al. (1992) at 270 K is in good agreement with those of Liu et al. (1990), Gierczak et al.(1991) and Leu and Lee (1994) over the temperature range 270–273 K. The absolute rate coefficients of Orkin and Khamaganov(1993) are in agreement with those of Gierczak et al. (1991) and Leu and Lee (1994). At 298 K, the relative rate coefficientsof DeMore (1993) and Barry et al. (1995) are lower than the absolute rate coefficients of Martin and Paraskevopoulos (1983),Liu et al. (1990), Gierczak et al. (1991) and Orkin and Khamaganov (1993) by up to 30%. On the other hand, the absolute ratecoefficients of Leu and Lee (1994) are in good agreement with the relative rate coefficients of DeMore (1993) and Barry et al.(1995), and are between 10-20% lower than the absolute rate coefficients of Gierczak et al. (1991) and Orkin and Khamaganov(1993). Above 298 K, the absolute rate coefficients of Liu (1990) are up to 30% higher than those of Gierczak et al. (1991).The high rate coefficients of Clyne and Holt (1979), Brown et al. (1990) and Jeong et al. (1984) were not used in the evaluation.
The absolute rate coefficients of Martin and Paraskevopoulos (1983), Liu et al. (1990), Gierczak et al. (1991), Zhang etal. (1992), Orkin and Khamaganov (1993), Leu and Lee (1994), Bednarek et al. (1996), and the relative rate coefficients ofBarry et al. (1995) have been fitted to the three parameter equationk = CT 2 exp(-D/T ), giving k = 1.0× 10⁻¹⁸ T 2 exp(-885/T ) cm3 molecule−1 s−1 over the temperature range 220–460 K. The preferred Arrhenius expression,k = A exp(-B/T ), iscentered on a mid-range temperature,Tm, of 255 K and is derived from the three parameter equation withA = C e2 T 2
m andB = D + 2Tm. This expression yields rate coefficients that are 10-15% higher than those calculated from the rate coefficientexpressions tabulated for DeMore (1993).
References
Barry, J., Sidebottom, H., Treacy, J. and Franklin, J.: Int. J. Chem. Kinet. 27, 27, 1995.Bednarek, G., Breil, M., Hoffmann, A., Kohlmann, J. P., Mors, V. and Zellner, R.: Ber. Bunsenges. Phys. Chem. 100, 528,1996.Brown, A. C., Canosa-Mas, C. E., Parr, A. D. and Wayne, R. P.: Atmos. Environ. 24A, 2499, 1990.Clyne, M. A. A. and Holt, P. M.: J. Chem. Soc. Faraday Trans. 2, 75, 582, 1979.DeMore, W. B.: Geophys. Res. Lett. 20, 1359, 1993.Gierczak, T., Talukdar, R., Vaghjiani, G. L., Lovejoy, E. R. and Ravishankara, A. R.: J. Geophys. Res. 96, 5001, 1991.
www.atmos-chem-phys.net/8/4141/2008/ Atmos. Chem. Phys., 8, 4141–4496, 2008

4182 R. Atkinson et al.: Evaluated kinetic and photochemical data for atmospheric chemistry
IUPAC: http://www.iupac-kinetic.ch.cam.ac.uk/, 2007.Jeong, K.-M., Hsu, K.-J., Jeffries, J. B. and Kaufman, F.: J. Phys. Chem. 88, 1222, 1984.Leu, G.-H. and Lee, Y.-P.: J. Chin. Chem. Soc. 41, 645, 1994.Liu, R., Huie, R. E. and Kurylo, M. J.: J. Phys. Chem. 94, 3247, 1990.Martin, J.-P. and Paraskevopoulos, G.: Can. J. Chem. 61, 861, 1983.Orkin, V. L. and Khamaganov, V. G.: J. Atmos. Chem. 16, 157, 1993.Zhang, Z., Huie, R. E. and Kurylo, M. J.: J. Phys. Chem. 96, 1533, 1992.
Atmos. Chem. Phys., 8, 4141–4496, 2008 www.atmos-chem-phys.net/8/4141/2008/
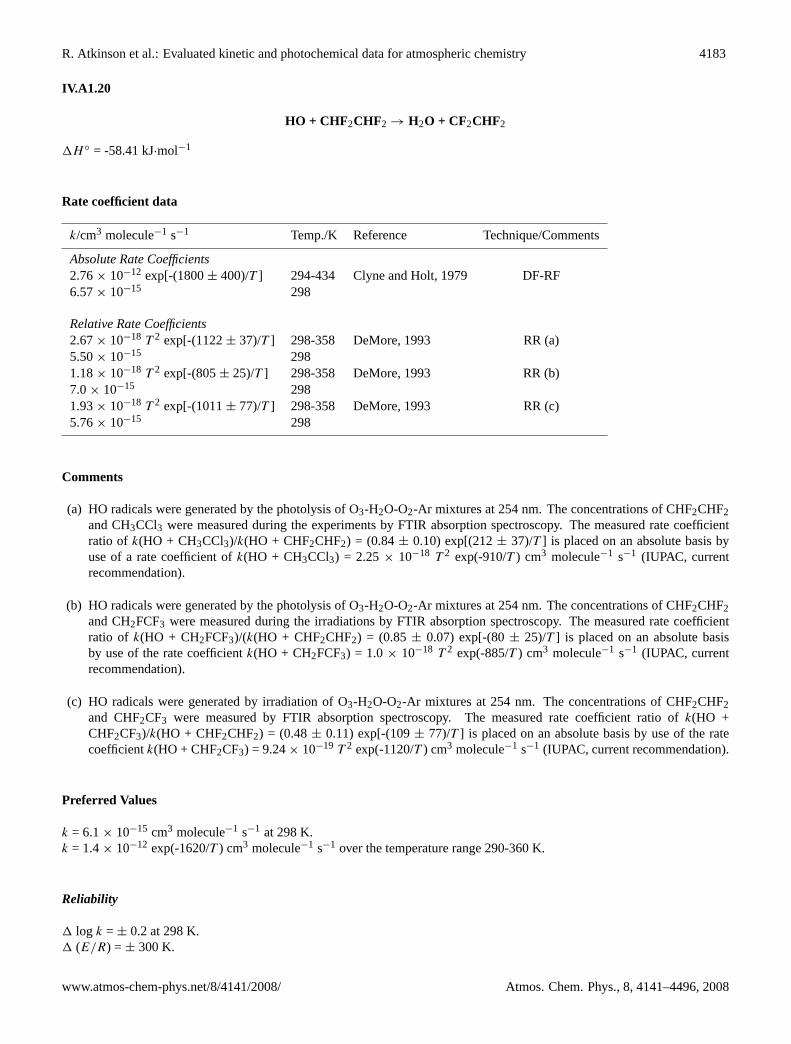
R. Atkinson et al.: Evaluated kinetic and photochemical data for atmospheric chemistry 4183
IV.A1.20
HO + CHF2CHF2→ H2O + CF2CHF2
1H ◦ = -58.41 kJ·mol−1
Rate coefficient data
k/cm3 molecule−1 s−1 Temp./K Reference Technique/Comments
Absolute Rate Coefficients2.76× 10−12 exp[-(1800± 400)/T ] 294-434 Clyne and Holt, 1979 DF-RF6.57× 10−15 298
Relative Rate Coefficients2.67× 10−18 T 2 exp[-(1122± 37)/T ] 298-358 DeMore, 1993 RR (a)5.50× 10⁻¹⁵ 2981.18× 10−18 T 2 exp[-(805± 25)/T ] 298-358 DeMore, 1993 RR (b)7.0× 10⁻¹⁵ 2981.93× 10−18 T 2 exp[-(1011± 77)/T ] 298-358 DeMore, 1993 RR (c)5.76× 10⁻¹⁵ 298
Comments
(a) HO radicals were generated by the photolysis of O3-H2O-O2-Ar mixtures at 254 nm. The concentrations of CHF2CHF2and CH3CCl3 were measured during the experiments by FTIR absorption spectroscopy. The measured rate coefficientratio of k(HO + CH3CCl3)/k(HO + CHF2CHF2) = (0.84± 0.10) exp[(212± 37)/T ] is placed on an absolute basis byuse of a rate coefficient ofk(HO + CH3CCl3) = 2.25× 10⁻¹⁸ T 2 exp(-910/T ) cm3 molecule−1 s−1 (IUPAC, currentrecommendation).
(b) HO radicals were generated by the photolysis of O3-H2O-O2-Ar mixtures at 254 nm. The concentrations of CHF2CHF2and CH2FCF3 were measured during the irradiations by FTIR absorption spectroscopy. The measured rate coefficientratio of k(HO + CH2FCF3)/(k(HO + CHF2CHF2) = (0.85± 0.07) exp[-(80± 25)/T ] is placed on an absolute basisby use of the rate coefficientk(HO + CH2FCF3) = 1.0× 10⁻¹⁸ T 2 exp(-885/T ) cm3 molecule−1 s−1 (IUPAC, currentrecommendation).
(c) HO radicals were generated by irradiation of O3-H2O-O2-Ar mixtures at 254 nm. The concentrations of CHF2CHF2and CHF2CF3 were measured by FTIR absorption spectroscopy. The measured rate coefficient ratio ofk(HO +CHF2CF3)/k(HO + CHF2CHF2) = (0.48± 0.11) exp[-(109± 77)/T ] is placed on an absolute basis by use of the ratecoefficientk(HO + CHF2CF3) = 9.24× 10⁻¹⁹ T 2 exp(-1120/T ) cm3 molecule−1 s−1 (IUPAC, current recommendation).
Preferred Values
k = 6.1× 10⁻¹⁵ cm3 molecule−1 s−1 at 298 K.k = 1.4× 10⁻¹² exp(-1620/T ) cm3 molecule−1 s−1 over the temperature range 290-360 K.
Reliability
1 log k =± 0.2 at 298 K.1 (E/R) =± 300 K.
www.atmos-chem-phys.net/8/4141/2008/ Atmos. Chem. Phys., 8, 4141–4496, 2008

4184 R. Atkinson et al.: Evaluated kinetic and photochemical data for atmospheric chemistry
Comments on Preferred Values
The relative rate coefficients of DeMore (1993) using three reference compounds are in good agreement (within 20% over thetemperature range 298–358 K). While the 298 K rate coefficient of Clyne and Holt (1979) is also in good agreement with therelative rate coefficients of DeMore (1993), the temperature dependence reported by Clyne and Holt (1979) is significantlyhigher than those of DeMore (1993). The data of Clyne and Holt (1979) is also sparse and scattered. Therefore the data ofClyne and Holt (1979) are not used in the evaluation.
The preferred 298 K rate coefficient is an average of the three relative rate measurements of DeMore (1993). The relative ratecoefficients of DeMore (1993) were placed on an absolute basis and fitted to the three parameter equationk = CT 2 exp(-D/T ),resulting ink = 1.80× 10⁻¹⁸ T 2 exp(-974/T ) cm3 molecule−1 s−1 over the temperature range 290–360 K. The preferredArrhenius expression,k = A exp(-B/T ) is centered on a mid-range temperature,Tm, of 320 K and is derived from the threeparameter equation withA = C e2 T 2
m andB = D + 2Tm.
References
Clyne, M. A. A. and Holt, P. M.: J. Chem. Soc. Faraday Trans. 2, 75, 582, 1979.DeMore, W. B.: Geophys. Res. Lett. 20, 1359, 1993.IUPAC: http://www.iupac-kinetic.ch.cam.ac.uk/, 2007.
Atmos. Chem. Phys., 8, 4141–4496, 2008 www.atmos-chem-phys.net/8/4141/2008/

R. Atkinson et al.: Evaluated kinetic and photochemical data for atmospheric chemistry 4185
IV.A1.21
HO + CHF2CF3→ H2O + CF2CF3
1H ◦ = -54.1 kJ·mol−1
Rate coefficient data
k/cm3 molecule−1 s−1 Temp./K Reference Technique/Comments
Absolute Rate Coefficients1.70× 10−13 exp[-(1100± 100)/T ] 294-441 Clyne and Holt, 1979 DF-RF(4.9± 1.4)× 10−15 294(2.49± 0.27)× 10−15 298 Martin and Paraskevopoulos, 1983 FP-RA2.8× 10−13 exp[-(1350± 100)/T ] 257-423 Brown et al., 1990 DF-RF(2.69± 0.93)× 10−15 2985.41× 10−13 exp[-(1700± 100)/T ] 220-364 Talukdar et al., 1991 DF-LMR/PLP-LIF(1.90± 0.27)× 10−15 298
Relative Rate Coefficients(1.64± 0.21)× 10−15 298 DeMore, 1992 RR (a)
Comments
(a) HO radicals were generated by the photolysis of O3 in the presence of water vapor at 254 nm. Irradiations of O3-H2O-CHF2CF3-CH4-O2-N2 (or Ar) mixtures were carried out, and the concentrations of CHF2CF3 and the CH4 were measuredby FTIR absorption spectroscopy. The measured rate coefficient ratiok(HO + CH4)/k(HO + CF3CHF2) = 3.9± 0.50 isplaced on an absolute basis by use of the rate coefficientk(HO + CH4) = 6.4× 10⁻¹⁵ cm3 molecule−1 s−1 at 298 K(IUPAC, current recommendation).
Preferred Values
k = 1.9× 10⁻¹⁵ cm3 molecule−1 s−1 at 298 K.k = 4.4× 10⁻¹³ exp(-1630/T ) cm3 molecule−1 s−1 over the temperature range 220–300 K.
Reliability
1 log k =± 0.2 at 298 K.1 (E/R) =± 300 K.
Comments on Preferred Values
The relatively high results of Clyne and Holt (1979) and Brown et al. (1990) suggest the presence of reactive impurities in theCHF2CF3 samples used in their studies. These data were therefore not used in the evaluation. At 298 K, the rate coefficientsof DeMore (1992) and Talukdar et al. (1991) agree to within 10%; the rate coefficient of Martin and Paraskevopoulos (1983)is 30% higher than the corresponding value of Talukdar et al. (1991). The rate coefficient data of Martin and Paraskevopoulos(1983), Talukdar et al. (1991) and DeMore (1992) were fitted to the three parameter equationk = CT 2 exp(-D/T ), resultingin k = 9.24× 10⁻¹⁹ T 2 exp(-1120/T ) cm3 molecule−1 s−1 over the temperature range 220–360 K. The preferred Arrheniusexpression,k = A exp(-B/T ), is centered on a mid-range temperature,Tm, of 255 K and is derived from the three parameterequation withA = C e2 T 2
m andB = D + 2Tm.
www.atmos-chem-phys.net/8/4141/2008/ Atmos. Chem. Phys., 8, 4141–4496, 2008

4186 R. Atkinson et al.: Evaluated kinetic and photochemical data for atmospheric chemistry
References
Brown, A. C., Canosa-Mas, C. E., Parr, A. D. and Wayne, R. P.: Atmos. Environ. 24A, 2499, 1990.Clyne, M. A. A. and Holt, P. M.: J. Chem. Soc. Faraday Trans. 2, 75, 582, 1979.DeMore, W. B.: Optical Methods in Atmospheric Chemistry, Soc. Photo-Optic Instrum. Eng. 1715, 72, 1992.IUPAC: http://www.iupac-kinetic.ch.cam.ac.uk/, 2007.Martin, J.-P. and Paraskevopoulos, G.: Can. J. Chem. 61, 861, 1983.Talukdar, R., Mellouki, A., Gierczak, T., Burkholder, J. B., McKeen, S. A. and Ravishankara, A. R.: J. Phys. Chem. 95, 5815,1991.
Atmos. Chem. Phys., 8, 4141–4496, 2008 www.atmos-chem-phys.net/8/4141/2008/

R. Atkinson et al.: Evaluated kinetic and photochemical data for atmospheric chemistry 4187
IV.A1.22
HO + CHF2CF2CH2F → H2O + CHF2CF2CHF (1)→ H2O + CF2CF2CH2F (2)
Rate coefficient data(k = k1 + k2)
k/cm3 molecule−1 s−1 Temp./K Reference Technique/Comments
Absolute Rate Coefficients2.87× 10−12 exp[-(1661± 170)/T ] 260-365 Zhang et al., 1994 FP-RF(1.09± 0.03)× 10−14 298
Relative Rate Coefficients1.24× 10−20 T 2.82 exp[-(823± 34)/T ] 286-364 Hsu and DeMore, 1995 RR (a)7.44× 10⁻¹⁵ 298
Comments
(a) Relative rate method. HO radicals were generated by the photolysis of H2O at 185 nm or of O3-H2O mixtures in theUV in H2O (or H2O-O3)-CHF2CF2CH2F-CH4-O2-N2 mixtures. The concentrations of CHF2CF2CH2F and CH4 weremeasured by FTIR absorption spectroscopy. The measured rate coefficient ofk(HO + CHF2CF2CH2F)/k(HO + CH4) =(0.67± 0.07) exp[(164± 34)/T ] is placed on an absolute basis by use of a rate coefficient ofk(HO + CH4) = 1.85×10⁻²⁰ T 2.82 exp(-987/T) cm3 molecule−1 s−1 (IUPAC, current recommendation).
Preferred Values
k = 7.7× 10⁻¹⁵ cm3 molecule−1 s−1 at 298 K.k = 2.2× 10⁻¹² exp(-1685/T ) cm3 molecule−1 s−1 over the temperature range 285-365 K.
Reliability
1 log k =± 0.3 at 298 K.1 (E/R) =± 300 K.
Comments on Preferred Values
The relative rate coefficients of Hsu and DeMore (1995) are uniformly a factor of 1.5 lower than the absolute rate coefficientsof Zhang et al. (1994) over the temperature range common to both studies (286–364 K). This suggests the presence of reactiveimpurities or of secondary reactions in the study of Zhang et al. (1994). The relative rate coefficients of Hsu and DeMore(1995) were used to derive the preferred values. These data were fitted to the three parameter equation,k = CT 2 exp(-D/T ),resulting ink = 2.84× 10⁻¹⁸ T 2 exp(-1045/T ) cm3 molecule−1 s−1 over the temperature range 285–365 K. The preferredArrhenius expression,k = A exp(B/T ), is centered on a mid-range temperature,Tm, of 320 K and is derived from the threeparameter equation withA = C e2 T 2
m andB = D + 2Tm.
References
Hsu, K.-J. and DeMore, W. B.: J. Phys. Chem. 99, 1235, 1995.IUPAC: http://www.iupac-kinetic.ch.cam.ac.uk/, 2007.Zhang, Z., Padmaja, S., Saini, R. D., Huie, R. E. and Kurylo, M. J.: J. Phys. Chem. 98, 4312, 1994.
www.atmos-chem-phys.net/8/4141/2008/ Atmos. Chem. Phys., 8, 4141–4496, 2008

4188 R. Atkinson et al.: Evaluated kinetic and photochemical data for atmospheric chemistry
IV.A1.23
HO + CF3CF2CH2F→ H2O + CF3CF2CHF
Rate coefficient data
k/cm3 molecule−1 s−1 Temp./K Reference Technique/Comments
Absolute Rate Coefficients2.6× 10−13 exp[-(1107± 202)/T ] 256-314 Garland et al., 1993 PLP-LIF(6.4± 0.6)× 10−15 295
Preferred Values
k = 6.5× 10⁻¹⁵ cm3 molecule−1 s−1 at 298 K.k = 2.6× 10⁻¹³ exp(-1100/T ) cm3 molecule−1 s−1 over the temperature range 250-320 K.
Reliability
1 log k =± 0.3 at 298 K.1 (E/R) =± 400 K.
Comments on Preferred Values
The preferred values are derived from the sole study of Garland et al. (1993).
References
Garland, N. L., Medhurst, L. J. and Nelson, H. H.: J. Geophys. Res. 98, 23107, 1993.
Atmos. Chem. Phys., 8, 4141–4496, 2008 www.atmos-chem-phys.net/8/4141/2008/

R. Atkinson et al.: Evaluated kinetic and photochemical data for atmospheric chemistry 4189
IV.A1.24HO + CF3CHFCHF2 → H2O + CF3CFCHF2 (1)
→ H2O + CF3CHFCF2 (2)
Rate coefficient data(k = k1 + k2)
k/cm3 molecule−1 s−1 Temp./K Reference Technique/Comments
Absolute Rate Coefficients2.0× 10−13 exp[-(1007± 151)/T ] 251-311 Garland et al., 1993 PLP-LIF(6.5± 0.5)× 10−15 2941.05× 10−12 exp[-(1434± 161)/T ] 260-365 Zhang et al., 1994 FP-RF(8.51± 0.26)× 10−15 298(4.93± 0.25)× 10−15 294 Nelson et al., 1995 DF-LIF
Relative Rate Coefficients6.7× 10−21 T 2.82 exp[-(756± 12)/T ] 298-380 Hsu and DeMore, 1995 RR (a)5.0× 10⁻¹⁵ 298
Comments
(a) HO radicals were generated by the photolysis of H2O at 185 nm or of O3-H2O mixtures in the UV, in H2O (or O3-H2O)-CF3CHFCHF2-CH4-O2-N2 mixtures. The concentrations of CF3CHFCHF2 and CH4 were measured by FTIR absorptionspectroscopy. The measured rate coefficient ratio ofk(HO + CF3CHFCHF2)/k(HO + CH4) = (0.36± 0.01) exp[(231±12)/T ] is placed on an absolute basis by using a rate coefficient ofk(HO + CH4) = 1.85× 10⁻²⁰ T 2.82 exp(-987/T ) cm3
molecule−1 s−1 (IUPAC, current recommendation).
Preferred Values
k = 5.0× 10⁻¹⁵ cm3 molecule−1 s−1 at 298 K.k = 1.4× 10⁻¹² exp(-1680/T ) cm3 molecule−1 s−1 over the temperature range 290-380 K.
Reliability
1 log k =± 0.3 at 298 K.1 (E/R) =± 300 K.
Comments on Preferred Values
The preferred values are derived from the relative rate coefficients of Hsu and DeMore (1995) and the absolute rate study byNelson et al. (1995). These data were fitted to the three parameter equation,k = CT 2 exp(-D/T ), resulting ink = 1.76×10⁻¹⁸ T 2 exp(-1021/T ) cm3 molecule−1 s−1 over the temperature range 294–380 K. The preferred Arrhenius expression,k =A exp(-B/T ), is centered on a mid-range temperature,Tm, of 330 K and is derived from the three parameter equation,k = A
exp(-B/T ) with A = Ce2 T 2m andB = D + 2Tm. The higher values of Garland et al. (1993) and Zhang et al. (1994) were not
used in this evaluation as their experiments may have been subject to problems arising from the presence of impurities.
References
Garland, N. L., Medhurst, L. J. and Nelson, H. H.: J. Geophys. Res. 98, 23107, 1993.Hsu, K.-J. and DeMore, W. B.: J. Phys. Chem. 99, 1235, 1995.IUPAC: http://www.iupac-kinetic.ch.cam.ac.uk/, 2007.Nelson, D. D., Jr., Zahniser, M. S., Kolb, C. E. and Magid, H.: J. Phys. Chem. 99, 16301, 1995.Zhang, Z., Padmaja, S., Saini, R. D., Huie, R. E. and Kurylo, M. J.: J. Phys. Chem. 98, 4312, 1994.
www.atmos-chem-phys.net/8/4141/2008/ Atmos. Chem. Phys., 8, 4141–4496, 2008

4190 R. Atkinson et al.: Evaluated kinetic and photochemical data for atmospheric chemistry
IV.A1.25
HO + CF3CH2CF3→ H2O + CF3CHCF3
Rate coefficient data
k/cm3 molecule−1 s−1 Temp./K Reference Technique/Comments
Absolute Rate Coefficients2.0× 10−14 exp[-(906± 151)/T ] 257-311 Garland et al., 1993 PLP-LIF9.6× 10−16 298(5.1± 0.7)× 10−16 294 Nelson et al., 1995 DF-LIF(4.15± 0.33)× 10−16 298 Garland and Nelson, 1996 PLP-LIF(1.6± 0.4)× 10−12 exp[-(2540± 150)/T ] 273-413 Gierczak et al., 1996 FP-LIF(3.20± 0.60)× 10−16 298
Relative Rate Coefficients1.16× 10−18 T 2 exp[-(1700± 109)/T ] 298-367 Hsu and DeMore, 1995 RR (a)3.43× 10⁻¹⁶ 298(3.5± 1.5)× 10−16 298 Barry et al., 1997 RR (b)
Comments
(a) Relative rate method. HO radicals were generated from the photolysis of H2O at 185 nm or of O3-H2O mixtures in theUV in H2O (or O3-H2O)-CF3CH2CF3-CHF2CF3-O2-N2 mixtures. The concentrations of CF3CH2CF3 and CHF2CF3were measured by FTIR absorption spectroscopy. The measured rate coefficient ratio ofk(HO + CF3CH2CF3)/k(HO +CHF2CF3) = (1.26± 0.41) exp[-(580± 109)/T ] is placed on an absolute basis by using a rate coefficient ofk(HO +CHF2CF3) = 9.24× 10⁻¹⁹ T 2 exp(-1120/T ) cm3 molecule−1 s−1 (IUPAC, current recommendation).
(b) Relative rate method. HO radicals were generated by UV photolysis of O3 at 254 nm in the presence of H2O vapour.Mixtures of O3/CF3CH2CF3/CF3CH2CF2CH3/H2O were photolysed in air at 298 K,k(HO + CF3CH2CF3)/k(HO +CF3CH2CF2CH3) was found to be 0.06± 0.02. Using the experimentally derived value ofk(HO + CF3CH2CF2CH3)= 2.0× 10⁻¹² exp[-(1750± 400)/T ] cm3 molecule−1 s−1 gives k(HO + CF3CH2CF3) = (3.5± 1.5)× 10−16 cm3
molecule−1 s−1.
Preferred Values
k = 3.3× 10⁻¹⁶ cm3 molecule−1 s−1 at 298 K.k = 1.3× 10⁻¹² exp(-2465/T ) cm3 molecule−1 s−1 over the temperature range 270–340 K.
Reliability
1 log k =± 0.3 at 298 K.1 (E/R) =± 400 K.
Comments on Preferred Values
The preferred values are derived from the relative rate coefficients of Hsu and DeMore (1995) and the absolute rate coefficientsof Gierczak et al. (1996). The agreement between the data of Hsu and DeMore (1995), when placed on an absolute basisas described above, and the data of Gierczak et al. (1996) is very good over the temperature range 298-367 K. The absoluterate coefficients of Garland et al. (1993) over the temperature range 257-311 K are consistently higher than those of Hsu and
Atmos. Chem. Phys., 8, 4141–4496, 2008 www.atmos-chem-phys.net/8/4141/2008/

R. Atkinson et al.: Evaluated kinetic and photochemical data for atmospheric chemistry 4191
DeMore (1995) and Gierczak et al. (1996) and were not used in the evaluation. The absolute rate coefficient of Nelson et al.(1995) is also relatively large and has a large uncertainty; this value was also not used in the evaluation.
The data of Hsu and DeMore (1995) and Gierczak et al. (1996) were fitted to the three parameter equation,k = CT 2
exp(-D/T ), resulting ink = 1.91× 10⁻¹⁸ T 2 exp(-1865/T ) cm3 molecule−1 s−1 over the temperature range 273–413 K. Thepreferred Arrhenius expression,k = A exp(-B/T ), is centered on a mid-range temperature,Tm, of 300 K and is derived fromthe three-parameter equation withA = Ce2 T 2
m andB = D + 2Tm. Note that the preferred Arrhenius expression should not beused outside the specified temperature range (270–340 K); rather, the full three parameter expression should be used.
The relative rate study of Barry et al. (1997) at 298 K is in very good agreement with the recommended value. However, thevery small rate constant ratio would lead to large uncertainties, therefore the rate coefficient derived by Barry et al. (1997) wasnot used in the evaluation. The preferred value at 298 K is 30% lower than the absolute rate coefficient of Garland and Nelson(1996), but taking into account the uncertainty in the Garland and Nelson (1996) value, the agreement is reasonable.
References
Barry, J., Locke, G., Scollard, D., Sidebottom, H., Treacy, J., Clerbaux, C., Colin, R. and Franklin, J.: Int. J. Chem. Kinet. 29,607, 1997.Garland, N. L., Medhurst, L. J. and Nelson, H. H.: J. Geophys. Res. 98, 23107, 1993.Garland, N. L. and Nelson, H. H.: Chem. Phys. Lett. 248, 296, 1996.Gierczak, T., Talukdar, R. K., Burkholder, J. B., Portmann, R. W., Daniel, J. S., Solomon, S. and Ravishankara, A. R.: J.Geophys. Res. 101, 12905, 1996.Hsu, K.-J. and DeMore, W. B.: J. Phys. Chem. 99, 1235, 1995.IUPAC: http://www.iupac-kinetic.ch.cam.ac.uk/, 2007.Nelson, D. D., Jr., Zahniser, M. S., Kolb, C. E. and Magid, H.: J. Phys. Chem. 99, 16301, 1995.
www.atmos-chem-phys.net/8/4141/2008/ Atmos. Chem. Phys., 8, 4141–4496, 2008

4192 R. Atkinson et al.: Evaluated kinetic and photochemical data for atmospheric chemistry
IV.A1.26
HO + CF3CHFCF3→ H2O + CF3CFCF3
Rate coefficient data
k/cm3 molecule−1 s−1 Temp./K Reference Technique/Comments
Absolute Rate Coefficients3.7× 10−13 exp[-(1615± 190)/T ] 294-369 Nelson et al., 1993 DF-LIF(1.64± 0.28)× 10−15 2953.8× 10−13 exp[-(1596± 77)/T ] 298-463 Zellner et al., 1994 PLP-LIF(1.8± 0.2)× 10−15 2983.63× 10−13 exp[-(1613± 135)/T ] 270-365 Zhang et al., 1994 FP-RF(1.62± 0.03)× 10−15 2986.19× 10−13 exp[-(1830± 100)/T ] 250-430 Tokuhashi et al., 2004 FP/PLP-LIF (a)(1.34± 0.08)× 10−15 298
Relative Rate Coefficients3.15× 10−21 T 2.82 exp[-(870± 105)/T ] 296-398 Hsu and DeMore, 1995 RR (b,c)1.55× 10⁻¹⁵ 2967.67× 10−19 T 2 exp[-(1082± 89)/T ] 298-367 Hsu and DeMore, 1995 RR (b,d)1.80× 10⁻¹⁵ 298
Comments
(a) HO radical concentration monitored by laser induced fluorescence.
(b) Relative rate method. HO radicals were generated by the photolysis of H2O at 185 nm or O3 at 254 nm, in H2O (or O3-H2O) - CF3CHFCF3 - CH4 (or CHF2CF3)- O2 - N2 mixtures. The concentrations of CF3CHFCF3 and CH4 (or CHF2CF3)were measured by FTIR absorption spectroscopy. The measured rate coefficient ratios ofk(HO + CF3CHFCF3)/k(HO +CH4) = (0.17± 0.05) exp[(117± 105)/T ] and k(HO + CF3CHFCF3)/ k(HO + CHF2CF3) = (0.83± 0.22) exp[(38±89)/T ] are placed on an absolute basis by use of rate coefficients ofk(HO + CH4) = 1.85× 10⁻²⁰ T 2.82 exp(-987/T )cm3 molecule−1 s−1 (IUPAC, current recommendation) andk(HO + CHF2CF3) = 9.24× 10⁻¹⁹ T 2 exp(-1120/T ) cm3
molecule−1 s−1 (IUPAC, current recommendation).
(c) Relative tok(HO + CH4).
(d) Relative tok(HO + CHF2CF3).
Preferred Values
k = 1.4× 10⁻¹⁵ cm3 molecule−1 s−1 at 298 K.k = 5.3× 10⁻¹³ exp(-1770/T ) cm3 molecule−1 s−1 over the temperature range 250-380 K.
Reliability
1 log k =± 0.2 at 298 K.1 (E/R) =± 300 K.
Atmos. Chem. Phys., 8, 4141–4496, 2008 www.atmos-chem-phys.net/8/4141/2008/

R. Atkinson et al.: Evaluated kinetic and photochemical data for atmospheric chemistry 4193
Comments on Preferred Values
The preferred values are derived from absolute rate coefficients of Zhang et al. (1994) and Tokuhashi et al. (2004). The relativerate coefficients of Hsu and DeMore (1995), and the absolute rate coefficients of Nelson et al. (1993) and Zellner et al. (1994)are 10-30% higher than those of Tokuhashi et al. (2004) over the temperature range 298–380 K, with the agreement beingbetter at the higher temperatures. Tokuhashi et al. (2004) used highly purified reactants in their study, suggesting that theprevious studies may have been affected by reactant impurities.
The data of Zellner et al. (1994), Zhang et al. (1994) and Tokuhashi et al. (2004) were fitted to the three parameter equation,k = CT 2 exp(-D/T ), resulting ink = 8.0× 10⁻¹⁹ T 2 exp(-1170/T ) cm3 molecule−1 s−1 over the temperature range 250–430K. The preferred Arrhenius expression,k = A exp(-B/T ), is centered on a mid-range temperature,Tm, of 300 K and is derivedfrom the three parameter equation withA = Ce2 T 2
m andB = D + 2Tm. Note that the preferred Arrhenius expression shouldnot be used outside the specified temperature range (250–380 K); rather, the full three parameter expression should be used.
References
Hsu, K.-J. and DeMore, W. B.: J. Phys. Chem. 99, 1235, 1995.IUPAC: http://www.iupac-kinetic.ch.cam.ac.uk/, 2007.Nelson Jr., D. D., Zahniser, M. S. and Kolb, C. E.: Geophys. Res. Lett. 20, 197, 1993.Tokuhashi, K., Chen, L., Kutsuna, S., Uchimaru, T., Sugie, M. and Sekiya, A.: J. Fluorine Chemistry 125, 1801, 2004.Zellner, R., Bednarek, G., Hoffmann, A., Kohlmann, J. P., Mors, V. and Saathoff, H.: Ber. Bunsenges. Phys. Chem. 98, 141,1994.Zhang, Z., Padmaja, S., Saini, R. D., Huie, R. E. and Kurylo, M. J.: J. Phys. Chem. 98, 4312, 1994.
www.atmos-chem-phys.net/8/4141/2008/ Atmos. Chem. Phys., 8, 4141–4496, 2008

4194 R. Atkinson et al.: Evaluated kinetic and photochemical data for atmospheric chemistry
IV.A1.27
HO + CHF2OCHF2→ H2O + CHF2OCF2
Rate coefficient data
k/cm3 molecule−1 s−1 Temp./K Reference Technique/Comments
Absolute Rate Coefficients(2.47± 0.2)× 10−14 296 Zhang et al., 1992 FP-RF5.4× 10−13 exp[-(1560± 200)/T ] 269-312 Garland et al., 1993 LP-LIF(3.0± 0.7)× 10−15 2956.3× 10−13 exp[-(1646± 76)/T ] 277-370 Orkin et al., 1999 FP-RF(2.52± 0.17)× 10−15 298
Relative Rate Coefficients2.36× 10−18 T 2 exp[-(1366± 62)/T ] 298-368 Hsu and DeMore, 1995 RR (a)2.1× 10⁻¹⁵ 2982.12× 10−18 T 2 exp[-(1313± 10)/T ] 273-465 Wilson et al., 2001 RR (b)2.29× 10⁻¹⁵ 298
Comments
(a) HO radicals were generated from the photolysis of H2O at 185 nm or O3 at 254 nm in the presence of H2O. The concen-trations of CHF2OCHF2 and CH3CCl3 were measured by FTIR absorption spectroscopy. The measured rate coefficientratio of k(HO + CHF2OCHF2)/k(HO + CH3CCl3) = (1.05± 0.20) exp[-(456± 62)/T ] is placed on an absolute basis byusing the rate coefficient fork(HO + CH3CCl3) = 2.25× 10⁻¹⁸ T 2 exp(-910/T ) cm3 molecule−1 s−1 (IUPAC, currentrecommendation).
(b) HO radicals were generated from the photolysis of H2O vapour in the reaction mixture at 185 nm. The concentrationsof CHF2OCHF2 and CF3CHF2 were monitored by GCMS. An Arrhenius plot of the Wilson et al. (2001) data gives arate coefficient ratio ofk(HO + CHF2OCHF2)/k(HO + CF3CHF2) = (2.29± 0.06) exp[-(193± 10)/T ] over the temper-ature range 273–465 K. The rate coefficient ratio was placed on an absolute basis by using a rate coefficient ofk(HO +CHF2CF3) = 9.24× 10⁻¹⁹ T 2 exp(-1120/T ) cm3 molecule−1 s−1 (IUPAC, current recommendation)
Preferred Values
k = 2.2× 10⁻¹⁵ cm3 molecule−1 s−1 at 298 K.k = 1.9× 10⁻¹² exp(-2020/T ) cm3 molecule−1 s−1 over the temperature range 270-460 K.
Reliability
1 log k =± 0.1 at 298 K.1 (E/R) =± 300 K.
Comments on Preferred Values
The absolute rate coefficients of Orkin et al. (1999) and the relative rate coefficients of Hsu and DeMore (1995) and Wilson etal. (2001) are in good agreement over the temperature range 273–370 K. The 296 K rate coefficient of Zhang et al. (1992) is anorder of magnitude higher than all other values, presumably due to the presence of impurities in their CHF2OCHF2 samples.The measurements of Garland et al. (1993) are scattered. Thus, neither the data of Zhang et al. (1992) nor the data of Garlandet al. (1993) were used in the evaluation.
Atmos. Chem. Phys., 8, 4141–4496, 2008 www.atmos-chem-phys.net/8/4141/2008/

R. Atkinson et al.: Evaluated kinetic and photochemical data for atmospheric chemistry 4195
The preferred values were obtained from the rate coefficient data of Hsu and DeMore (1995), Orkin et al. (1999) and Wilsonet al. (2001). These rate coefficient data were fitted to the three-parameter equationk = CT 2 exp(-D/T ), resulting ink = 2.22× 10⁻¹⁸ T 2 exp(-1338/T ) cm3 molecule−1 s−1 over the temperature range 273–464 K. The preferred Arrhenius expression,k
= A exp(-B/T ), is centered on a mid-range temperature,Tm, of 340 K withA = Ce2 T 2m andB = D + 2Tm.
Good et al. (1999) have performed experiments and ab initio calculations to determine the mechanism of CHF2OCHF2oxidation under atmospheric conditions (no kinetic data was reported). Activation barriers were calculated for various steps,and an oxidation mechanism was described.
References
Garland, N. L., Medhurst, L. J. and Nelson, H. H.: J. Geophys. Res. 98, 23107, 1993.Good, D. A., Kamboures, M., Santiano, R. and Francisco, J. S.: J. Phys. Chem. A. 103, 9230, 1999.Hsu, K.-J. and DeMore, W. B.: J. Phys. Chem. 99, 11141, 1995.IUPAC: http://www.iupac-kinetic.ch.cam.ac.uk/, 2007.Orkin, V. L., Villenave, E., Huie, R. E. and Kurylo, M. J.: J. Phys. Chem. A. 103, 9770, 1999.Wilson, E. W., Jr., Sawyer, A. A. and Sawyer, H. A.: J. Phys. Chem. A. 105, 1445, 2001.Zhang, Z., Saini, R. D., Kurylo, M. J. and Huie, R. E.: J. Phys. Chem. 96, 105, 9301, 1992.
www.atmos-chem-phys.net/8/4141/2008/ Atmos. Chem. Phys., 8, 4141–4496, 2008

4196 R. Atkinson et al.: Evaluated kinetic and photochemical data for atmospheric chemistry
IV.A1.28
HO + HC(O)F → H2O + FCO
1H ◦ = -56.2 kJ·mol−1
Rate coefficient data
k/cm3 molecule−1 s−1 Temp./K Reference Technique/Comments
Relative Rate Coefficients< 5.0× 10⁻¹⁵ 296± 2 Wallington and Hurley, 1993 RR (a)
Comments
(a) HO radicals were generated from the photolysis of O3-H2-O2 mixtures, and HC(O)F was formed in situ from the oxidationof CH3F. No losses of HC(O)F were observed, leading to a rate coefficient ratio ofk(HO + HC(O)F)/k(HO + CH3F) <
0.25. This upper limit to the rate coefficient ratio is placed on an absolute basis by use ofk(HO + CH3F) = 2.0× 10⁻¹⁴
cm3 molecule−1 s−1 (IUPAC, current recommendation).
Preferred Values
k < 1.0× 10⁻¹⁴ cm3 molecule−1 s−1 at 298 K.
Comments on Preferred Values
The preferred value is derived from the sole study of Wallington and Hurley (1993), with the higher upper limit reflectinguncertainties in the reference reaction rate coefficient.
References
IUPAC: http://www.iupac-kinetic.ch.cam.ac.uk/, 2007.Wallington, T. J. and Hurley, M. D.: Environ. Sci. Technol. 27, 1448, 1993.
Atmos. Chem. Phys., 8, 4141–4496, 2008 www.atmos-chem-phys.net/8/4141/2008/

R. Atkinson et al.: Evaluated kinetic and photochemical data for atmospheric chemistry 4197
IV.A1.29
HO + CHF2CHO → H2O + CHF2CO (1)→ H2O + CF2CHO (2)
1H ◦(1) = -110.4 kJ·mol−1
Rate coefficient data (k = k1 + k2)
k/cm3 molecule−1 s−1 Temp./K Reference Technique/Comments
Absolute Rate Coefficients(1.7± 0.2)× 10−12 298± 2 Scollard et al., 1993 PLP-RF
Relative Rate Coefficients(1.3± 0.3)× 10−12 298± 2 Scollard et al., 1993 RR (a)(1.8± 0.4)× 10−12 298± 2 Sellevag et al., 2005 RR (b)
Comments
(a) HO radicals were generated by the photolysis of CH3ONO (or C2H5ONO)-NO-CHF2CHO-toluene-air mixtures at 1 barpressure. The concentrations of CHF2CHO and toluene were measured by GC and FTIR spectroscopy. The measuredrate coefficient ratio ofk(HO + CHF2CHO)/k(HO + toluene) is placed on an absolute basis by using a rate coefficient ofk(HO + toluene) = 5.63× 10⁻¹² cm3 molecule−1 s−1 (Calvert et al., 2002).
(b) HO radicals were generated by the photolysis of O3 in the presence of H2-CHF2CHO-propane-air mixtures at 1 barpressure. The concentrations of CHF2CHO and propane were measured by FTIR spectroscopy. The measured ratecoefficient ratio ofk(HO + CHF2CHO)/k(HO + C3H8) = 1.62± 0.04 is placed on an absolute basis by using a ratecoefficient ofk(HO + C3H8) = 1.1× 10⁻¹² cm3 molecule−1 s−1 (IUPAC, current recommendation)
Preferred Values
k = 1.6× 10⁻¹² cm3 molecule−1 s−1 at 298 K.
Reliability
1 log k =± 0.2 at 298 K.
Comments on Preferred Values
The absolute and relative rate coefficients of Scollard et al. (1993) and Sellevag et al. (2005) are in good agreement, and thepreferred value is the average of these rate coefficients. The reaction is expected to proceed by pathway (1) (Scollard et al.,1993), which is supported by the quantum chemical calculations of Sellevag et al. (2005).
References
Calvert, J. G., Atkinson, R., Becker, K. H., Kamens, R. M., Seinfeld, J. H., Wallington, T. J. and Yarwood, G.: TheMechanisms of Atmospheric Oxidation of Aromatic Hydrocarbons, Oxford University Press, New York, 2002.IUPAC: http://www.iupac-kinetic.ch.cam.ac.uk/, 2007.Scollard, D. J., Treacy, J. J., Sidebottom, H. W., Balestra-Garcia, C., Laverdet, G., Le Bras, G., MacLeod, H. and Teton, S.: J.Phys. Chem. 97, 4683, 1993.Sellevag, S. R., Stenstrøm, Helgaker, T., and Nielsen, C. J.: J. Phys. Chem. A. 109, 3652, 2005.
www.atmos-chem-phys.net/8/4141/2008/ Atmos. Chem. Phys., 8, 4141–4496, 2008

4198 R. Atkinson et al.: Evaluated kinetic and photochemical data for atmospheric chemistry
IV.A1.30
HO + CF3CHO→ H2O + CF3CO
1H ◦ = -107.2 kJ·mol−1
Rate coefficient data
k/cm3 molecule−1 s−1 Temp./K Reference Technique/Comments
Absolute Rate Coefficients(1.1± 0.7)× 10−12 299± 3 Dobe et al., 1989 DF-RF(6.5± 0.5)× 10−13 298± 2 Scollard et al. 1993 PLP-RF
Relative Rate Coefficients(4.4± 1.0)× 10−13 298± 2 Scollard et al. 1993 RR (a)(4.8± 0.3)× 10−13 298± 2 Sellevag et al. 2004 RR (b)(6.15± 0.80)× 10−13 296± 2 Sulbaek Anderson et al., 2004 RR (c,d)(6.93± 0.81)× 10−13 296± 2 Sulbaek Anderson et al., 2004 RR (c,e)
Comments
(a) HO radicals were generated by the photolysis of CH3ONO (or C2H5ONO)-NO-CF3CHO-CH3COCH3-air mixtures at 1bar pressure. The concentrations of CF3CHO and CH3COCH3 were measured by GC and FTIR spectroscopy. The mea-sured rate coefficient ratio ofk(HO + CF3CHO)/k(HO + CH3C(O)CH3) = (2.43± 0.53) is placed on an absolute basis byuse of a rate coefficient ofk(HO + CH3C(O)CH3) = 1.8× 10⁻¹³ cm3 molecule−1 s−1 (IUPAC, current recommendation).
(b) HO radicals were generated by the photolysis of O2 in the presence of H2 at 1 bar pressure. FTIR was used to monitorthe disappearance of reactant and reference compound. The measured rate coefficient ratio ofk(HO + CF3CHO)/k(HO+ C2H6) = (2.00± 0.13) is placed on an absolute basis by use of a rate coefficient ofk(HO + C2H6) = 2.4× 10⁻¹³ cm3
molecule−1 s−1 (IUPAC, current recommendation).
(c) HO radicals were generated by the photolysis of CH3ONO in the presence of NO in air at a pressure of 933 mbar. Theconcentrations of CF3CHO, C2H2, C2H4 and reaction products were measured by FTIR spectroscopy. The measured ratecoefficient ratiosk(HO + CF3CHO)/k(HO + C2H2) andk(HO + CF3CHO)/k(HO + C2H4) were placed on an absolutebasis by usingk(HO + C2H2) = 8.45× 10⁻¹³ cm3 molecule−1 s−1 at 296 K (Sørensen et al. 2003), andk(HO + C2H4) =8.52× 10⁻¹² cm3 molecule−1 s−1 at 296 K (Calvert et al. 2000).
(d) Relative to C2H2.
(e) Relative to C2H4.
Preferred Values
k = 5.7× 10⁻¹³ cm3 molecule−1 s−1 at 298 K.
Reliability
1 log k =± 0.2 at 298 K.
Comments on Preferred Values
The preferred 298 K rate coefficient is the average of the absolute and relative rate coefficients of Sulbaek Andersen et al.,2004, Sellevag et al. (2004) and Scollard et al. (1993). The rate coefficient data of Dobe et al. (1989) was not used due to itslarge uncertainty.
Atmos. Chem. Phys., 8, 4141–4496, 2008 www.atmos-chem-phys.net/8/4141/2008/

R. Atkinson et al.: Evaluated kinetic and photochemical data for atmospheric chemistry 4199
References
Calvert, J. G., Atkinson, R., Kerr, J. A., Madronich, S., Moortgat, G. K., Wallington, T. J., and Yarwood, G.: The Mechanismof Atmospheric Oxidation of the Alkenes, Oxford University Press, New York, 2000.Dobe, S., Khachatryan, L. A. and Berces, T.: Ber. Bunsenges. Phys. Chem. 93, 847, 1989.IUPAC: http://www.iupac-kinetic.ch.cam.ac.uk/, 2007.Scollard, D. J., Treacy, J. J., Sidebottom, H. W., Balestra-Garcia, C., Laverdet, G., Le Bras, G., Mac Leod, H. and Teton, S.: J.Phys. Chem. 97, 4683, 1993.Sellevag, S. R., Kelly, T., Sidebottom, H. and Nielsen, C. J.: Phys. Chem. Chem. Phys. 6, 1243, 2004.Sørensen, M., Kaiser, E. W., Hurley, M. D., Wallington, T. J. and Nielsen, O. J.: Int. J. Chem. Kinet. 35, 191, 2003.Sulbaek Andersen, M. P., Nielsen, O. J., Hurley, M. D., Ball, J. C., Wallington, T. J., Stevens, J. E., Martin, J. W., Ellis, D. A.and Mabury, S. A.: J. Phys. Chem. A., 108, 5189, 2004.
www.atmos-chem-phys.net/8/4141/2008/ Atmos. Chem. Phys., 8, 4141–4496, 2008

4200 R. Atkinson et al.: Evaluated kinetic and photochemical data for atmospheric chemistry
IV.A1.31
HO + CF3C(O)OH→ products
Rate coefficient data
k/cm3 molecule−1 s−1 Temp./K Reference Technique/Comments
Absolute Rate Coefficients(1.6± 0.4)× 10−13 315 Møgelberg et al., 1994 PR-RA(1.5± 0.2)× 10−13 348
Relative Rate Coefficients3.73× 10−19 T 2 exp[(375± 400)/T ] 283-323 Carr et al. 1994 RR (a,b)(1.14± 0.10)× 10−13 298± 2(1.21± 0.22)× 10−13 298± 2 Carr et al., 1994 RR (a,c)(1.75± 0.44)× 10−13 296 Møgelberg et al., 1994 RR (d)(8.70± 1.44)× 10−14 296± 2 Hurley et al., 2004 RR (e,f)(1.00± 0.11)× 10−13 296± 2 Hurley et al., 2004 RR (e,g)
Comments
(a) Relative rate method. HO radicals were generated by the 254 nm photolysis of O3 in the presence of water vapor in O3-H2O-CF3C(O)OH-C2H6 (or C3H8)-O2 mixtures. The concentrations of CF3C(O)OH and C2H6 (or C3H8) were measuredby FTIR spectroscopy. The measured rate coefficient ratios ofk(HO + CF3C(O)OH)/k(HO + C2H6) = 0.025 exp[(874± 400)/T ] (0.47± 0.04 at 298± 2 K) andk(HO + CF3C(O)OH)/k(HO + C3H8) = 0.11± 0.02 at 298 K, are placedon an absolute basis by using rate coefficients ofk(HO + C2H6) = 1.5× 10⁻¹⁷ T 2 exp(-499/T ) cm3 molecule−1 s−1
(IUPAC, current recommendation) andk(HO + C3H8) = 1.10× 10⁻¹² cm3 molecule−1 s−1 at 298 K (IUPAC, currentrecommendation).
(b) Relative tok(OH + ethane).
(c) Relative tok(OH + propane).
(d) Relative rate method. HO radicals were generated by the photolysis of O3 at 254 nm in the presence of H2 in O3-H2-CF3C(O)OH-C2H6-O2 mixtures at 740 Torr total pressure. The concentrations of CF3C(O)OH and ethane were measuredby FTIR spectroscopy. The measured rate coefficient ratio wask(HO + CF3C(O)OH)/k(HO + C2H6) = 0.59± 0.04. If the(CF3C(O)OH)2 dimer is unreactive towards the HO radical, then the rate coefficient ratio corrected for dimer formationis 0.84± 0.06. An average value ofk(HO + CF3C(O)OH)/k(HO + C2H6) = 0.72± 0.18 was preferred and is placed onan absolute basis by using a rate coefficient ofk(HO + C2H6) = 2.43× 10⁻¹³ cm3 molecule−1 s−1 at 296 K (IUPAC,current recommendation).
(e) Relative rate method. HO radicals were generated by the photolysis of CH3ONO in the presence of NO in air. CH3ONO-NO-CF3C(O)OH-reference compound-air mixtures at 700 Torr total pressure were photolysed by UV lamps. Refer-ence compounds were C2H2 and C2H4. The concentrations of CF3C(O)OH, C2H2 and C2H4 were measured by FTIRspectroscopy. The measure rate constant ratios ofk(HO + CF3C(O)OH)/k(HO + C2H2) = 0.103± 0.017 andk(HO +CF3C(O)OH)/k(HO + C2H4) = 0.0116± 0.0012 are placed on an absolute basis by using rate coefficients ofk(HO +C2H2) = 8.45× 10⁻¹³ cm3 molecule−1 s−1 (Sørensen et al., 2003) andk(HO + C2H4) = 8.66× 10⁻¹² cm3 molecule−1
s−1 (Calvert et al. 2000), both at 296 K and 700 Torr of air.
(f) Relative tok(HO + acetylene).
(g) Relative tok(HO + ethene).
Preferred Values
k = 1.3× 10⁻¹³ cm3 molecule−1 s−1, independent of temperature over the range 280-350 K.
Atmos. Chem. Phys., 8, 4141–4496, 2008 www.atmos-chem-phys.net/8/4141/2008/

R. Atkinson et al.: Evaluated kinetic and photochemical data for atmospheric chemistry 4201
Reliability
1 log k =± 0.1 over the temperature range 280-350 K.
Comments on Preferred Values
The preferred 298 K rate coefficient is the average of the relative and absolute rate coefficients of Møgelberg et al. (1994), Carret al. (1994) and Hurley et al. (2004). The reaction is expected to proceed by overall H-atom abstraction from the -OH groupto form H2O + CF3CO2 (see the data sheets on the HO radical reactions with HC(O)OH and CH3C(O)OH).
References
Calvert, J. G., Atkinson, R., Kerr, J. A., Madronich, S., Moortgat, G. K., Wallington, T. J., Yarwood, G.: The Mechanisms ofAtmospheric Oxidation of the Alkenes, Oxford University Press, New York, 2000.Carr, S., Treacy, J. J., Sidebottom, H. W., Connell, R. K., Canosa-Mas, C. E., Wayne, R. P. and Franklin, J.: Chem. Phys. Lett.227, 39, 1994.IUPAC: http://www.iupac-kinetic.ch.cam.ac.uk/, 2007.Hurley, M. D., Sulbaek Andersen, M. P., Wallington, T. J., Ellis, D. A., Martin, J. W., and Mabury, S. A.: J. Phys. Chem. A.615, 108, 2004.Møgelberg, T. E., Nielsen, O. J., Sehested, J., Wallington, T. J. and Hurley, M. D.: Chem. Phys. Lett. 226, 171, 1994.Sørensen, M., Kaiser, E. W., Hurley, M. D., Wallington, T. J., Nielsen, O. J.: Int. J. Chem. Kinet. 191, 35, 2003.
www.atmos-chem-phys.net/8/4141/2008/ Atmos. Chem. Phys., 8, 4141–4496, 2008

4202 R. Atkinson et al.: Evaluated kinetic and photochemical data for atmospheric chemistry
IV.A1.32
HO2 + CH2FO2 → O2 + CH2FO2H (1)→ O2 + HCOF + H2O (2)
Rate coefficient data(k = k1 + k2)
k/cm3 molecule−1 s−1 Temp./K Reference Technique/Comments
Branching Ratiosk1/k = 0.29± 0.08 295 Wallington et al., 1994 UVP-FTIR (a)k2/k = 0.71± 0.11 295
Comments
(a) HO2 and CH2FO2 radicals were generated from the steady-state photolysis of Cl2 in the presence of CH3F-H2-air mixturesat total pressures of 400–933 mbar. The branching ratios were derived from FTIR analysis of CH2FO2H and HCOF, whichaccounted for 100± 13% of the loss of CH3F.
Preferred Values
k1/k = 0.3 at 298 K.k2/k = 0.7 at 298 K.
Reliability
1(k1/k) = 1(k2/k) =± 0.1 at 298 K.
Comments on Preferred Values
The lack of a pressure dependence of the branching ratio determined by Wallington et al. (1994) indicates that there is nothermal decomposition of the products. The observation of two reaction channels for this reaction is in accord with data forother HO2 reactions with substituted peroxy radicals, for example, with HOCH2O2 and CH3OCH2O2 radicals.
References
Wallington, T. J., Hurley, M. D., Schneider, W. F., Sehested, J. and Nielsen, O. J.: Chem. Phys. Lett. 218, 34, 1994.
Atmos. Chem. Phys., 8, 4141–4496, 2008 www.atmos-chem-phys.net/8/4141/2008/

R. Atkinson et al.: Evaluated kinetic and photochemical data for atmospheric chemistry 4203
IV.A1.33
HO2 + CF3O2 → CF3O2H + O2 (1)→ C(O)F2 + HOF + O2 (2)
Rate coefficient data(k = k1 + k2)
k/cm3 molecule−1 s−1 Temp./K Reference Technique/Comments
Branching Ratios≤ 2× 10⁻¹² 296 Hayman and Battin-Leclerc, 1995 FP-UVA (a)(4.0± 2.0)× 10−12 295 Sehested et al., 1997 PR-UVA (b)≤ 3× 10⁻¹² 296 Biggs et al., 1997 DF-LIF (c)
Comments
(a) Flash photolysis of H2O2 in the presence of CF3CH2F-O2-N2 mixtures at a total pressure of 1013 mbar. Primary inves-tigation of CF3CHFO2 radical kinetics, with CF3O2 radicals generated from the decomposition of product CF3CHFOradicals. Decays in transient absorption signals (with contributions from CF3CHFO2, HO2 and CF3O2) were recorded inthe wavelength range 220 nm to 240 nm. Upper limitk derived from simulations of the decay traces using a 15 reactionmechanism. Good fits could not be obtained if the CF3O2 + HO2 was occurring appreciably under the experimentalconditions.
(b) Pulse radiolysis study of CHF3-H2-O2-SF6 mixtures at a total pressure of 1013 mbar. CF3O2 and HO2 radicals weremonitored by UV absorption spectroscopy at 230 nm. Decays in transient absorption signals (with contributions fromHO2 and CF3O2) were recorded at 230 nm. The cited value ofk was derived from simulation of the decay in absorption,using a 13 reaction chemical mechanism.
(c) Experiments performed at 2.7 mbar. CF3O2 and HO2 radicals were produced by the F + CHF3 and F + CH3OH reactions,with subsequent addition of O2. Both CF3O2 and HO2 were monitored by titration to NO2 following reaction with excessNO, with detection of NO2 by LIF. Upper limitk derived from simulations of the decay in radical concentration, using anexplicit reaction mechanism. Actual values obtained varied in the range< (1–3)× 10−12 cm3 molecule−1 s−1.
Preferred Values
No recommendation
Comments
Although the results of Sehested et al. (1997) and Biggs et al. (1997) provide evidence for the occurrence of the reaction ofHO2 with CF3O2, the rate coefficient is not well-determined in any of the reported studies. No recommendation can be madeuntil further kinetics and product studies of this reaction are available.
References
Biggs, P., Canosa-Mas, C.E., Shallcross, D.E., Vipond, A. and Wayne, R.P.: J. Chem. Soc. Farad. Trans. 93, 2701, 1997.Hayman, G. and Battin-Leclerc, F.: J. Chem. Soc. Farad. Trans. 91, 1313, 1995.Sehested, J., Møgelberg, T., Fagerstrom, K., Mahmoud, G. and Wallington, T. J.: Int. J. Chem. Kinet. 29, 673, 1997.
www.atmos-chem-phys.net/8/4141/2008/ Atmos. Chem. Phys., 8, 4141–4496, 2008

4204 R. Atkinson et al.: Evaluated kinetic and photochemical data for atmospheric chemistry
IV.A1.34
HO2 + CF3CHFO2 → O2 + CF3CHFO2H (1)→ O2 + CF3C(O)F + H2O (2)
Rate coefficient data (k = k1 + k2)
k/cm3 molecule−1 s−1 Temp./K Reference Technique/Comments
Absolute Rate Coefficients1.8× 10−13 exp[(910± 220)/T ] 210-363 Maricq et al., 1994 FP-UVA (a)(4.7± 1.7)× 10−12 295(4.0± 2.0)× 10−12 296 Hayman and Battin-Leclerc, 1995 LP-UVA (b)(3.3± 1.5)× 10−12 323(2.4± 1.5)× 10−12 373(5.0± 1.5)× 10−12 295 Sehested et al., 1997 PR-UVA (c)
Branching Ratiosk1/k > 0.95 296 Maricq et al., 1994 UVP-FTIR (d)k2/k < 0.05 296
Comments
(a) Flash photolysis time-resolved UV absorption study of F2-CF3CH2F-H2-O2-N2 mixtures. The rate coefficients wereobtained from a fit of the decay curves for CF3CHFO2, HO2, CF3O2 and ROOH, based on a mechanism of 14 reactions.
(b) Flash photolysis of H2O2 in the presence of CF3CH2F-O2-N2 mixtures at a total pressure of 1013 mbar. Decays intransient absorption signals (with contributions from CF3CHFO2, HO2 and CF3O2) were recorded in the wavelengthrange 220 nm to 240 nm.k derived from simulations of the decay traces using a 15 reaction mechanism.
(c) Pulse radiolysis study of CF3CH2F-H2-O2-SF6 mixtures at a total pressure of 1013 mbar. Decays in transient absorptionsignals (with contributions from CF3CHFO2, HO2 and CF3O2) were recorded at 230 nm and 240 nm. The cited value ofk was derived from simulation of the decay in absorption, using a 22 reaction chemical mechanism.
(d) Steady-state photolysis of Cl2-CF3CH2F-H2-O2-N2 mixtures with FTIR analysis of the products HC(O)F, CF3C(O)F,C(O)F2 and CF3O3CF3. The branching ratio,k2/k, cited above was based on measurements of CF3COF, and the value ofk1/k was inferred.
Preferred Values
k = 4.3× 10⁻¹² cm3 molecule−1 s−1 at 298 K.k = 2.0× 10⁻¹³ exp(910/T ) cm3 molecule−1 s−1 over the temperature range 210-365 K.k1/k = 1.0 at 298.
Reliability
1 log k =± 0.2 at 298 K.1 (E/R) =± 300 K.1 (k1/k) = +0.0
−0.1 at 298 K.
Comments on Preferred Values
The preferred value ofk at 298 K is the average of the results of Maricq et al. (1994) (based on their Arrhenius expression),Hayman and Battin-Leclerc (1995) and Sehested et al. (1997). The results of these studies are in good agreement, even thoughk
Atmos. Chem. Phys., 8, 4141–4496, 2008 www.atmos-chem-phys.net/8/4141/2008/

R. Atkinson et al.: Evaluated kinetic and photochemical data for atmospheric chemistry 4205
was necessarily extracted from simulations of complex systems. The preferred Arrhenius expression fork is based on theE/R
value from the study of Maricq et al. (1994), combined with a pre-exponential factor adjusted to give the preferred value ofk
at 298 K. The results of Hayman and Battin-Leclerc (1995) at 323 K and 373 K are also consistent with this recommendation.The preferred branching ratios are based on those reported by Maricq et al. (1994), which require confirmation.
It is interesting to note thatk is approximately a factor of two smaller than that recommended for the reaction of HO2with C2H5O2. This confirms a deactivating influence ofα-F andα-CF3 groups, observed for the reactions of a number ofhalogenated peroxy radicals with HO2.
References
Hayman, G. and Battin-Leclerc, F.: J. Chem. Soc. Faraday Trans. 91, 1313, 1995.Maricq, M. M., Szente, J. J., Hurley, M. D. and Wallington, T. J.: J. Phys. Chem. 98, 8962, 1994.Sehested, J., Møgelberg, T., Fagerstrom, K., Mahmoud, G. and Wallington, T. J.: Int. J. Chem. Kinet. 29, 673, 1997.
www.atmos-chem-phys.net/8/4141/2008/ Atmos. Chem. Phys., 8, 4141–4496, 2008

4206 R. Atkinson et al.: Evaluated kinetic and photochemical data for atmospheric chemistry
IV.A1.35
HO2 + CF3CF2O2 → O2 + CF3CF2O2H (1)→ O2 + CF3C(O)F + HOF (2)
Rate coefficient data (k = k1 + k2)
k/cm3 molecule−1 s−1 Temp./K Reference Technique/Comments
Absolute Rate Coefficients(1.2± 0.6)× 10−12 296 Hayman and Battin-Leclerc, 1995 LP-UVA (a)
Comments
(a) Flash photolysis of H2O2 in the presence of CF3CHF2-O2-N2 mixtures at a total pressure of 1013 mbar. Decays intransient absorption signals (with contributions from CF3CF2O2, HO2 and CF3O2) were recorded in the wavelengthrange 220 nm and 230 nm.k derived from simulations of the decay traces using a 16 reaction mechanism.
Preferred Values
k = 1.2× 10⁻¹² cm3 molecule−1 s−1 at 298 K.
Reliability
1 log k =± 0.5 at 298 K.
Comments on Preferred Values
While the above value of the rate coefficient seems reasonable, it has been derived from the analysis of a complex chemicalsystem and requires independent verification to reduce the recommended error limits. It is interesting to note thatk is substan-tially smaller than that recommended for the reaction of HO2 with C2H5O2. This confirms a deactivating influence ofα-F andα-CF3 groups, observed for the reactions of a number of halogenated peroxy radicals with HO2.
References
Hayman, G. and Battin-Leclerc, F.: J. Chem. Soc. Faraday Trans. 91, 1313, 1995.
Atmos. Chem. Phys., 8, 4141–4496, 2008 www.atmos-chem-phys.net/8/4141/2008/

R. Atkinson et al.: Evaluated kinetic and photochemical data for atmospheric chemistry 4207
IV.A1.36
FO2 + CO→ products
Rate coefficient data
k/cm3 molecule−1 s−1 Temp./K Reference Technique/Comments
Absolute Rate Coefficients< 5.1× 10⁻¹⁶ 298 Sehested et al., 1994 PR-UVA (a)
Comments
(a) Pulse radiolysis of CO-O2-SF6 mixtures in a high pressure cell at 18 bar SF6. The decay of FO2 radicals was monitoredin absorption at 220 nm.
Preferred Values
k < 6× 10⁻¹⁶ cm3 molecule−1 s−1 at 298 K.
Comments on Preferred Values
The preferred room temperature upper limit is based on results of the pulse radiolysis-UV absorption study of Sehested et al.(1994). This is the sole reported study of this reaction.
References
Sehested, J., Sehested, K., Nielsen, O. J. and Wallington, T. J.: J. Phys. Chem. 98, 6731, 1994.
www.atmos-chem-phys.net/8/4141/2008/ Atmos. Chem. Phys., 8, 4141–4496, 2008

4208 R. Atkinson et al.: Evaluated kinetic and photochemical data for atmospheric chemistry
IV.A1.37
FO2 + CH4→ products
Rate coefficient data
k/cm3 molecule−1 s−1 Temp./K Reference Technique/Comments
Absolute Rate Coefficients< 4× 10⁻¹⁵ 298 Sehested et al., 1994 (a)
Comments
(a) Pulse radiolysis/UV absorption spectroscopy technique. Pulse radiolysis of CH4-O2-SF6 mixtures in a high pressure cellat 18 bar SF6. The decay of FO2 radicals was monitored in absorption at 220 nm.
Preferred Values
k < 4.1× 10⁻¹⁵ cm3 molecule−1 s−1 at 298 K.
Comments on Preferred Values
The preferred room temperature upper limit is based on results of the pulse radiolysis-UV absorption study of Sehested et al.(1994). This is the sole reported study of this reaction rate coefficient.
References
Sehested, J., Sehested, K., Nielsen, O. J. and Wallington, T. J.: J. Phys. Chem. 98, 6731, 1994.
Atmos. Chem. Phys., 8, 4141–4496, 2008 www.atmos-chem-phys.net/8/4141/2008/

R. Atkinson et al.: Evaluated kinetic and photochemical data for atmospheric chemistry 4209
IV.A1.38
CF3 + O2 + M → CF3O2 + M
1H ◦(1) = -148 kJ·mol−1
Low-pressure rate coefficients
Rate coefficient data
k0/cm3 molecule−1 s−1 Temp./K Reference Technique/Comments
Absolute Rate Coefficients(2.0± 0.1)× 10−29 [He] 295 Ryan and Plumb, 1982 DF-MS (a)(1.9± 0.2)× 10−29 (T /300)−4.7 [N2] 233-373 Caralp et al., 1986 PLP-MS (b)(2.5± 0.3)× 10−29 [N2] 295 Breheny et al., 2001 PLP-CL (c)
Comments
(a) Microwave discharge-flow system coupled to quadrupole MS. CF3 radicals monitored by MS. Measurements over therange 0.7–11 mbar, extrapolated withFc ≈ 0.4 andk∞ ≈ 8.0× 10⁻¹² cm3 molecule−1 s−1.
(b) Pulsed laser photolysis-MS study over the range 0.3–16 mbar. Extrapolation withFc ≈ 0.6 andk∞ ≈ 9.0× 10⁻¹² cm3
molecule−1 s−1.
(c) Pulsed laser photolysis-IR chemiluminescence study of CF3I in the presence of NO2 and O2, using IR emission from thereaction CF3 + NO2 for detection. Pressure range 2.7–150 mbar. Extrapolation withFc ≈ 0.6 andk∞ ≈ 2.55× 10⁻¹²
cm3 molecule−1 s−1, using data up to 800 mbar from relative rate measurements by Kaiser et al. (1995).
Preferred Values
k0 = 2.2× 10⁻²⁹ (T /300)−4.7 [N2] cm3 molecule−1 s−1 over the temperature range 230–380 K.
Reliability
1 log k0 =± 0.1 at 298 K.1 n =± 1.5.
Comments on Preferred Values
The preferred values are an average of the low pressure results from Caralp et al. (1986), and Breheny et al. (2001) whichappear well consistent with the measurements in He from Ryan and Plumb (1982). Differences ink∞ andFc, used in theextrapolation, only slightly influence the preferredk0 because all measurements extended to pressures close to the low pressurelimit of k.
High-pressure rate coefficients
Rate coefficient data
k∞/cm3 molecule−1 s−1 Temp./K Reference Technique/Comments
Absolute Rate Coefficients1.0× 10−11 298 Cooper et al., 1980 PR (a)
Relative Rate Coefficients(3.92± 0.25)× 10−12 271-363 Kaiser et al., 1995 PR (b)
www.atmos-chem-phys.net/8/4141/2008/ Atmos. Chem. Phys., 8, 4141–4496, 2008

4210 R. Atkinson et al.: Evaluated kinetic and photochemical data for atmospheric chemistry
Comments
(a) Pulse radiolysis of CF3Cl. CF3O2 detected by UV absorption spectroscopy near 260 nm. Measurements in 920 mbar ofAr.
(b) UV irradiation of CF3I-CH4-Cl2-N2-O2 mixtures and observation of loss of CF3 and CH4. Measurement of the ratiok(CF3 + O2)/k(CF3 + Cl2) as a function of the pressure and calibration of this ratio at low pressures againstk0(CF3 + O2)from Caralp et al. (1986). Inspection of the spectra recorded by Cooper et al. (1980) and comparison with more recentlydetected spectra of CF3O2 indicates that the rate of CF3 + O2 was not observed by Cooper et al. (1980).
Preferred Values
k∞ = 4× 10⁻¹² cm3 molecule−1 s−1 over the temperature range 200-300 K.
Reliability
1 log k∞ =± 0.3 at 298 K.1 n =± 1.5.
Comments on Preferred Values
Since the measurements of Cooper et al. (1980) were shown not to lead tok∞, the results from the relative rate measurementsfrom Kaiser et al. (1995) are preferred. They are similar as values fork∞ for CCl3 + O2 from Luther et al. (2001) for whichn = -1.4 was measured. Using an estimatedFc = 0.39 independent of the temperature, all results (except those from Cooper etal. (1980)) are consistently represented and the remaining uncertainty ofk∞ does not impact onk0.
References
Breheny, C., Hancock, G. and Morrell, C.: Z. Phys. Chem., 215, 305, 2001.Caralp, F., Lesclaux, R. and Dognon, A. M.: Chem. Phys. Lett., 129, 433, 1986.Cooper, R., Cumming, J. B., Gordon, S. and Mulac, W. A.: Rad. Phys. Chem., 16, 169, 1980.Kaiser, E. W., Wallington, T. J. and Hurley, M. D.: Int. J. Chem. Kinet., 27, 205, 1995.Luther, K., Oum, K. and Troe, J.: J. Phys. Chem. A, 105, 5535, 2001.Ryan, K. R. and Plumb, I. C.: J. Phys. Chem., 86, 4678, 1982.
Atmos. Chem. Phys., 8, 4141–4496, 2008 www.atmos-chem-phys.net/8/4141/2008/

R. Atkinson et al.: Evaluated kinetic and photochemical data for atmospheric chemistry 4211
IV.A1.39
CF3O + O2→ COF2 + FO2
1H ◦(1) = 47.0 kJ·mol−1
Rate coefficient data
k/cm3 molecule−1 s−1 Temp./K Reference Technique/Comments
Absolute Rate Coefficients<2× 10⁻¹⁷ 298 Turnipseed et al., 1994 PLP/LIF (a)<4× 10⁻¹⁷ 373
Comments
(a) CF3O radicals were generated by photolysis of CF3OOCF3 at 193 nm.
Preferred Values
k < 1× 10⁻¹⁸ cm3 molecule−1 s−1 at 298 K.k < 1× 10⁻¹⁰ exp(-5600/T ) cm3 molecule−1 s−1 over the temperature range 250-370 K.
Comments on Preferred Values
The preferred values are based on the upper limit at 373 K reported by Turnipseed et al. (1994). Assuming that the activationenergy barrier is at least equal to the reaction endothermicity (5600 K) leads to the preferred limits given for theA-factor andfor k(298 K). This procedure using the high temperature limit yields a room temperature limit an order of magnitude lowerthan the upper limit to the rate coefficient directly determined at 298 K. Chen et al. (1992) in a long path FTIR study of thereaction of CF3O with NO found no evidence for the reaction of CF3O with O2 in 1 bar of air at room temperature.
References
Chen, J., Zhu, T. and Niki, H.: J. Phys. Chem., 96, 6115, 1992.Turnipseed, A. A., Barone, S. B. and Ravishankara, A. R.: J. Phys. Chem., 98, 4594, 1994.
www.atmos-chem-phys.net/8/4141/2008/ Atmos. Chem. Phys., 8, 4141–4496, 2008

4212 R. Atkinson et al.: Evaluated kinetic and photochemical data for atmospheric chemistry
IV.A1.40
CF3O + O3→ CF3O2 + O2
1H ◦(1) = -101.1 kJ·mol−1
Rate coefficient data
k/cm3 molecule−1 s−1 Temp./K Reference Technique/Comments
Absolute Rate Coefficients<1× 10⁻¹³ 295 Nielsen and Sehested, 1993 PR/UVA (a)<5× 10⁻¹⁴ 210-353 Maricq and Szente, 1993 FP/UVA (b)<2× 10⁻¹⁵ 298 Fockenberg et al., 1994 LP/LIF (c)<4× 10⁻¹⁴ 298 Ravishankara et al., 1994 FT/CIMS (d)(2.5± 0.7)× 10−14 298 Turnipseed et al., 1994 PLP/LIF (e)(3.7± 1.5)× 10−14 373(2.8± 0.5)× 10−15 298 Meller and Moortgat, 1995 (f)(1.3± 0.5)× 10−14 298 Bourbon et al., 1996 FT/LIF (g)
Relative Rate Coefficients<3× 10⁻¹⁴ 295 Wallington et al., 1993 RR (h)(1.5± 0.5)× 10−14 296 Wallington and Ball, 1995 (i)
Comments
(a) Radicals generated by pulse radiolysis of CHF3-O2-O3-SF6 mixtures. Upper limit fork derived from simulations of ozoneabsorption transients at 254 nm and 276 nm in the presence of CF3O and CF3O2 radicals.
(b) Radicals generated by 351 nm photolysis of F2 in a flowing F2-CHF3-O3-O2-N2 mixture. O3 and CF3O2 radicals weremonitored by absorption at 255 nm and 210 nm respectively.
(c) CF3O radicals were generated by excimer laser photolysis of CF3OCl at 351 nm.
(d) CF3O radicals were generated by pyrolysis of CF3OOCF3.
(e) CF3O radicals were generated by photolysis of CF3OOCF3 at 193 nm.
(f) Static photolysis of CF3OOCF3 in the presence of O3; Analysis of CF3O and CF3OO3CF3 products by FTIR.k deter-mined by analysis of complex mechanism.
(g) CF3O radicals were generated by pyrolysis of CF3OOCF3.
(h) Radicals generated by visible photolysis of CF3NO/O3 mixtures in 700 torr O2. Analysis was by FTIR spectrometer.Value ofk was derived by authors from the measured ratiok/k(CF3O + NO2) and an estimated value ofk(CF3O + NO2).
(i) Relative rate technique using FTIR.k measured relative tok(CF3O + CH4) = 2.2× 10⁻¹⁴ cm3 molecule−1 s−1 at 298 K(IUPAC, current recommendation).
Preferred Values
k = 1.8× 10⁻¹⁴ cm3 molecule−1 s−1 at 298 K.k = 2× 10⁻¹² exp(-1400/T ) cm3 molecule−1 s−1 over the temperature range 250–370 K.
Atmos. Chem. Phys., 8, 4141–4496, 2008 www.atmos-chem-phys.net/8/4141/2008/

R. Atkinson et al.: Evaluated kinetic and photochemical data for atmospheric chemistry 4213
Reliability
1 log k =± 1 at 298 K.1 (E/R) =± 600 K.
Comments on Preferred Values
The preferred value ofk at 298 K is an average of the room temperature results of Turnipseed et al. (1994), Wallington and Ball(1995) and Bourbon et al (1996). Fockenberg et al. (1994) and Meller and Moortgat (1995) reported room temperature valuesan order of magnitude lower. The reason for this discrepancy is unknown, although both studies appear to have possibilitiesfor interference by secondary chemistry. Upper limits reported in the studies of Nielsen and Sehested (1993), Maricq andSzente (1993), Ravishankara et al. (1994) and Wallington et al. (1993) are all consistent with the recommendation. Because ofthe large uncertainties in the two values of Turnipseed et al. (1994), Arrhenius parameters have not been derived using thesevalues. Rather, the recommendedA factor has been estimated by analogy with other CF3O reactions, and the value ofE/R
fitted to the preferred room temperature value.
References
Bourbon, C., Brioulov, M. and Devolder, P.: C. A. Acad. Sci..Paris, 322, 181, 1996.Fockenberg, C., Saathoff, H. and Zellner, R.: Chem. Phys. Lett., 218, 21, 1994.Maricq, M. M. and Szente, J. J.: Chem. Phys. Lett., 213, 449, 1993.Meller, R. and Moortgat, G. K.: J. Photochem. Photobiol. A: Chem., 86, 15, 1995.Nielsen, O. J. and Sehested, J.: Chem. Phys. Lett., 213, 433, 1993.Ravishankara, A. R., Turnipseed, A. A., Jensen, N. R., Barone, S., Mills, M., Howard, C. J. and Solomon, S.: Science, 263,71, 1994.Turnipseed, A. A., Barone, S. B. and Ravishankara, A. R.: J. Phys. Chem., 98, 4594, 1994.Wallington, T. J. and Ball, J. C.: Chem. Phys. Lett., 234, 187, 1995.Wallington, T. J., Hurley, M. D. and Schneider, W. F.: Chem. Phys. Lett., 213, 442, 1993.
www.atmos-chem-phys.net/8/4141/2008/ Atmos. Chem. Phys., 8, 4141–4496, 2008

4214 R. Atkinson et al.: Evaluated kinetic and photochemical data for atmospheric chemistry
IV.A1.41
CF3O + H2O→ CF3OH + HO
1H ◦(1) = 43.4 kJ·mol−1
Rate coefficient data
k/cm3 molecule−1 s−1 Temp./K Reference Technique/Comments
Absolute Rate Coefficients<1× 10⁻¹⁶ 298 Turnipseed et al., 1995 (a)<2× 10⁻¹⁶ 381
Relative Rate Coefficients>2× 10⁻¹⁸ 296 Wallington et al., 1993 (b)<4× 10⁻¹⁶ 296
Comments
(a) Pulsed laser photolysis/pulsed laser induced fluorescence technique. CF3O radicals were generated by photolysis ofCF3OOCF3 at 193 nm.
(b) Long path FTIR-based study. CF3O radicals generated by chlorine-initiated oxidation of CF3CFH2 (HFC-134a) in pho-tolytic mixture of Cl2-CF3CFH2-H2O in 1 bar air. Reaction rate studied in competition with the rate of CF3O + CF3CFH2.
Preferred Values
k < 2× 10⁻¹⁷ cm3 molecule−1 s−1 at 298 K.k < 3× 10⁻¹² exp(-3600/T ) cm3 molecule−1 s−1 over the temperature range 250-380 K.
Comments on Preferred Values
TheA-factor is estimated by analogy with similar reactions of CF3O and the activation energy is fitted to the upper limit at381 K reported by Turnipseed et al. (1995). Note that this procedure results in a lower limit forE/R (E/R > 3600 K). Thepreferred value ofk(298 K) is calculated from the Arrhenius parameters. The limits reported by Wallington et al. (1993) areconsistent with this preferred value.
References
Turnipseed, A. A., Barone, S. B., Jensen, N. R., Hanson, D. R., Howard, C. J. and Ravishankara, A. R.: J. Phys. Chem., 99,6000 , 1995.Wallington, T. J., Hurley, M. D., Schneider, W. F., Sehested, J. and Nielsen, O. J.: J Phys. Chem., 97, 7606, 1993.
Atmos. Chem. Phys., 8, 4141–4496, 2008 www.atmos-chem-phys.net/8/4141/2008/

R. Atkinson et al.: Evaluated kinetic and photochemical data for atmospheric chemistry 4215
IV.A1.42
CF3O + NO→ COF2 + FNO
1H ◦ = -135 kJ·mol−1
Rate coefficient data
k/cm3 molecule−1 s−1 Temp./K Reference Technique/Comments
Absolute Rate Coefficients(5.2± 2.7)× 10−11 295 Sehested and Nielsen, 1993 PR/UVA (a)3.34× 10⁻¹¹ exp[(160± 45)/T ] 233-360 Turnipseed et al., 1994 PLP/LIF (b)(5.62± 0.74)× 10−11 2984.1× 10−11 exp[(60± 100)/T ] 231-393 Jensen et al., 1994 (c)(5.0± 1.0)× 10−11 298(4.7± 0.9)× 10−11 298 Bourbon et al., 1996 DF/LIF (d)(4.72± 0.30)× 10−11 293 Bhatnagar and Carr, 1994 FP/MS (e)4.1× 10⁻¹¹ exp[(60± 100)/T ] 213-253 Dibble et al., 1995 LP/TDLS (f)
Comments
(a) Radicals generated by pulse radiolysis of CHF3-O2-NO-SF6 mixtures. Value ofk derived from simulations of FNOabsorption transients at 310.5 nm.
(b) CF3O radicals were generated by photolysis of CF3OOCF3 at 193 nm.
(c) Flow tube reactor/chemical ionization mass spectrometer technique. CF3O radicals were generated by pyrolysis ofCF3OOCF3. A low value of k from the same laboratory reported earlier by Bevilacqua et al. (1993) is supersededby these results.
(d) CF3O radicals were generated by DF technique in F/CF3H/O2/NO system.
(e) k obtained by modeling NO time dependence during secondary reactions in CF3O2 + NO reaction.
(f) CF3O radicals were generated by photolysis of CF3OOCF3 at 193 nm. Time resolved formation of COF2 using tunablediode laser absorption near 1950 cm−1. FNO identified as major co-product with COF2.
Preferred Values
k = 5.4× 10⁻¹¹ cm3 molecule−1 s−1 at 298 K.k = 3.7× 10⁻¹¹ exp(110/T ) cm3 molecule−1 s−1 over the temperature range 230-390 K.
Reliability
1 log k =± 0.1 at 298 K.1 (E/R) =± 100 K.
Comments on Preferred Values
The preferred values are based on the 233–360 K values of Turnipseed et al. (1994), the 231–393 K values of Jensen et al.(1994) and the 295 K value of Sehested and Nielsen (1993). These results are in good agreement. The low value ofk reportedby Bevilacqua et al. (1993) has been superseded by the results of Jensen et al. (1994). Room temperature results from Bourbonet al. (1996) and Bhatnagar and Carr (1994) and a temperature dependence study of Dibble et al (1995) are in good agreementwith the recommendation. The reaction products have been reported by Chen et al. (1992), Bevilacqua et al. (1993) and Liand Francisco (1991).
www.atmos-chem-phys.net/8/4141/2008/ Atmos. Chem. Phys., 8, 4141–4496, 2008

4216 R. Atkinson et al.: Evaluated kinetic and photochemical data for atmospheric chemistry
References
Bevilacqua, T. J., Hanson, D. R. and Howard, C. J.: J. Phys. Chem., 97, 3750, 1993.Bhatagar, A. and Carr, R.W.: Chem. Phys. Lett., 231, 454, 1994.Bourbon, C., Briuokov, M., Hanoune, B., Sawersyn, J. P. and Devolder, P.: Chem. Phys. Lett., 254, 203, 1996.Chen, J., Zhu, T. and Niki, H.: J. Phys. Chem. 96, 6115, 1992.Dibble, T. S., Maricq, M. M., Szente, J. J. and Francisco, J. S.: J. Phys. Chem., 99, 17394, 1995.Jensen, N. R., Hanson, D. R. and Howard, C. J.: J. Phys. Chem., 98, 8574, 1994.Li, Z. and Francisco, J. S.: Chem. Phys. Lett., 186, 336 , 1991.Sehested, J. and Nielsen, O. J.: Chem. Phys. Lett., 206, 369, 1993.Turnipseed, A. A., Barone, S. B. and Ravishankara, A. R.: J. Phys. Chem., 98, 4594, 1994.
Atmos. Chem. Phys., 8, 4141–4496, 2008 www.atmos-chem-phys.net/8/4141/2008/

R. Atkinson et al.: Evaluated kinetic and photochemical data for atmospheric chemistry 4217
IV.A1.43
CF3O + CH4→ CF3OH + CH3
1H ◦(1) = -16.9 kJ·mol−1
Rate coefficient data
k/cm3 molecule−1 s−1 Temp./K Reference Technique/Comments
Absolute Rate Coefficients(2.2± 0.2)× 10−14 298 Saathoff and Zellner, 1993 LP/LIF (a)1.92× 10⁻¹² exp[-(1370± 85)/T ] 247-360 Barone et al., 1994 PLP/LIF (b)(1.93± 0.11)× 10−14 2983.1× 10−12 exp[-(1470± 250)/T ] 231-385 Jensen et al., 1994 DF/CIMS (c)(2.2± 0.4)× 10−14 2984.49× 10−12 exp[-(1606± 84)/T ] 296-573 Bourbon et al., 1995 DF/LIF (d)(2.05± 0.20)× 10−12 2983.3× 10−12 exp[-(1430± 150)/T ] 235-401 Bednarek et al., 1995 LP/LIF (e)2.5× 10⁻¹⁴ 298
Relative Rate Coefficients<5× 10⁻¹⁵ 297 Chen et al., 1992 (f)(1.2± 0.1)× 10−14 298 Kelly et al., 1993 (g)
Comments
(a) CF3O radicals were generated by photolysis of CF3OF at 248 nm.
(b) CF3O radicals were generated by photolysis of CF3OOCF3 at 193 nm.
(c) CF3O radicals were generated by pyrolysis of CF3OOCF3.
(d) CF3O radicals were generated by the pyrolysis of CF3OOCF3.
(e) CF3O radicals were generated by photolysis of CF3OF at 248 nm.
(f) Long path FTIR-based product study of visible photolysis of CF3NO-NO-CH4 mixtures in 700 torr air. Searched forCH2O product from oxidation of CH4 initiated by reaction of CF3O radicals with CH4. Upper limit ofk given in table isderived from the measured ratiok/k(CF3O+NO)<10−4 and the value ofk(CF3O+NO) given in this evaluation.
(g) Long-path FTIR-based study. CF3O radicals were generated by photolysis of CF3OOCF3. The decay of the reactanthydrocarbon was compared with the decay of the reference hydrocarbon. The value ofk given in table is derived from themeasured ratiok/k(CF3O + C2H6) = 0.010± 0.001 and the value ofk(CF3O+C2H6) (IUPAC, current evaluation).
Preferred Values
k = 2.2× 10⁻¹⁴ cm3 molecule−1 s−1 at 298 K.k = 2.6× 10⁻¹² exp(-1420/T ) cm3 molecule−1 s−1 over the temperature range 230-380 K.
Reliability
1 log k =± 0.1 at 298 K.1 (E/R) =± 200 K.
www.atmos-chem-phys.net/8/4141/2008/ Atmos. Chem. Phys., 8, 4141–4496, 2008

4218 R. Atkinson et al.: Evaluated kinetic and photochemical data for atmospheric chemistry
Comments on Preferred Values
The preferred value at room temperature is the average of the values reported by Saathoff and Zellner (1993), Barone et al.(1994), Jensen et al. (1994), Bourbon et al. (1995) and Bednarek et al. (1994). Results of these direct studies are in excellentagreement at room temperature. The temperature dependence is based on the 247–360 K data of Barone et al. (1994), the231–385 K data of Jensen et al. (1994) and the 235–401 K data of Bednarek et al. (1994). The temperature dependenceof Bourbon et al. (1995) is thought to be high due to possible influence of wall reaction at high temperature. The relativerate measurements of Chen et al. (1992) and Kelly et al. (1993) are factors of 4 and 2, respectively, lower than the preferredvalue. Wallington and Ball (1995) reportedk/k(CF3O + C2H6) = 0.0152± 0.0023 at 296 K in good agreement with therecommended rate coefficients. Jensen et al. (1994) detected the product CF3OH by chemical ionization mass spectrometer(CIMS) and observed its formation to correlate with the loss of the CF3O reactant. The CF3OH product of this reaction wasalso observed by Bevilacqua et al. (1993) and also by Bednareck et al. (1994), who used FTIR spectroscopy to show thatCF3OH is converted slowly to C(O)F2.
References
Barone, S. B., Turnipseed, A. A. and Ravishankara, A. R.: J. Phys. Chem., 98, 4602, 1994.Bednarek, G., Kohlmann, J. P., Saathoff, H. and Zellner, R.: Z. Phys. Chem., 188, 1, 1995.Bevilacqua, T. J., Hanson, D. R. and Howard, C. J.: J. Phys. Chem. 97, 3750, 1993.Bourbon, C., Fittschen, C., Sawersyn, J. P. and Devolder, P.: J. Phys. Chem., 99, 15102, 1995.Chen, J., Zhu, T., Niki, H. and Mains, G. J.: Geophys. Res. Lett., 19, 2215, 1992.IUPAC: http://www.iupac-kinetic.ch.cam.ac.uk/, 2007.Jensen, N. R., Hanson, D. R. and Howard, C. J.: J. Phys. Chem., 98, 8574, 1994.Kelly, C., Treacy, J., Sidebottom, H. W. and Nielsen, O. J.: Chem. Phys. Lett., 207, 498, 1993.Saathoff, H. and Zellner, R.: Chem. Phys. Lett., 206, 349, 1993.Wallington, T. J. and Ball, J. C.: J. Phys. Chem., 99, 3201, 1995.
Atmos. Chem. Phys., 8, 4141–4496, 2008 www.atmos-chem-phys.net/8/4141/2008/

R. Atkinson et al.: Evaluated kinetic and photochemical data for atmospheric chemistry 4219
IV.A1.44
CF3O + C2H6→ CF3OH + C2H5
1H ◦(1) = -32.2 kJ·mol−1
Rate coefficient data
k/cm3 molecule−1 s−1 Temp./K Reference Technique/Comments
Absolute Rate Coefficients(1.2± 0.2)× 10−12 298 Saathoff and Zellner, 1993 (a)4.84× 10⁻¹² exp[-(400± 70)/T ] 233-360 Barone et al., 1994 (b)(1.30± 0.11)× 10−12 2981.13× 10−11 exp[-(642± 113)/T ] 295-573 Bourbon et al., 1995 (c)(1.31± 0.13)× 10−12 298
Relative Rate Coefficients(1.1± 0.6)× 10−12 297 Chen et al., 1992 (d)
Comments
(a) Laser photolysis/laser induced fluorescence technique. CF3O radicals were generated by the photolysis of CF3OF at 248nm.
(b) Pulsed laser photolysis/pulsed laser induced fluorescence technique. CF3O radicals were generated by the photolysis ofCF3OOCF3 at 193 nm.
(c) Fast flow tube (∼1.3 mb pressure)/laser induced fluorescence. CF3O radicals were generated by the pyrolysis ofCF3OOCF3 at 193 nm.
(d) Long path FTIR-based product study of visible photolysis of CF3NO-NO-C2H6 mixtures in 700 Torr air. The upper limitof k given in table is derived from measured ratiok/k(CF3O+NO) = 0.02± 0.006 and the value ofk(CF3O+NO) (IUPAC,current recommendation).
Preferred Values
k = 1.3× 10⁻¹² cm3 molecule−1 s−1 at 298 K.k = 4.9× 10⁻¹² exp(-400/T ) cm3 molecule−1 s−1 over the temperature range 230-360 K.
Reliability
1 log k =± 0.1 at 298 K.1 (E/R) =± 200 K.
Comments on Preferred Values
The preferred value at room temperature is the average of the values reported by Saathoff and Zellner (1993), Barone et al.(1994) and Bourbon et al. (1995). Results of these direct studies are in excellent agreement. The temperature dependence isbased on the 233–360 K data of Barone et al. (1994). The temperature dependence of Bourbon et al. (1995) is thought to behigh due to possible influence of wall reaction at high temperature. The relative rate measurement of Chen et al. (1992) is ingood agreement with the preferred value. Kelly et al. (1993) used a relative rate method with FTIR detection to determine therate of CF3O reaction with a number of hydrocarbons relative to the rate of the reaction of CF3O with C2H6. They reportedk(CF3O + CH4)/k = 0.010± 0.001 at 298 K and 1 bar pressure (Kelly et al., 1993). This is nearly a factor of 2 lower than the
www.atmos-chem-phys.net/8/4141/2008/ Atmos. Chem. Phys., 8, 4141–4496, 2008

4220 R. Atkinson et al.: Evaluated kinetic and photochemical data for atmospheric chemistry
ratio of the preferred values given in this evaluation (0.017). Wallington and Ball (1995) reportedk(CF3O + CH4)/k = 0.0152± 0.0023 at 296 K in good agreement with the recommended rate coefficients.
References
Barone, S. B., Turnipseed, A. A. and Ravishankara, A. R.: J. Phys. Chem., 98, 4602, 1994.Bourbon, C., Fittschen, C., Sawersyn, J. P. and Devolder, P.: J.Phys.Chem., 99, 15102, 1995.Chen, J., Zhu, T., Niki, H. and Mains, G. J.: Geophys. Res. Lett., 19, 2215, 1992.IUPAC: http://www.iupac-kinetic.ch.cam.ac.uk/, 2007.Kelly, C., Treacy, J., Sidebottom, H. W. and Nielsen, O. J.: Chem. Phys. Lett., 207, 498, 1993.Saathoff, H. and Zellner, R.: Chem. Phys. Lett., 206, 349, 1993.Wallington, T. J. and Ball, J. C.: J. Phys.Chem., 99, 3201, 1995.
Atmos. Chem. Phys., 8, 4141–4496, 2008 www.atmos-chem-phys.net/8/4141/2008/

R. Atkinson et al.: Evaluated kinetic and photochemical data for atmospheric chemistry 4221
IV.A1.45-54
R1(R2)CHO + O2→ R1COR2 + HO2 (or→ products) (1)
R1(R2)CHO (+ M) → products (2)
R = alkyl, halogenated alkyl, H or halogen atom
Rate coefficient data
Reaction Reactions k1/k2 cm3 molecule−1 Temp./K Reference CommentsNumber
IV.A1.45 CH2FO + O2→ HCOF + HO2 (1) k1[O2] � k2 (933 mbar, air) 298 Edney and Driscoll, 1992 (a)IV.A1.46 CH2FO + M→ HCOF + H + M (2) k1[O2] � k2 (986 mbar, air) 298 Tuazon and Atkinson, 1993a (a)IV.A1.47 CH3CF2O + O2→ products (1) k1[O2] � k2 (933 mbar, air) 298 Edney and Driscoll, 1992 (b)IV.A1.48 CH3CF2O + M→ CH3 + COF2 + M (2) k1[O2] � k2 (986 mbar, air) 298 Tuazon and Atkinson, 1993a (c)IV.A1.49 CH2FCHFO + O2→ CH2FCOF + HO2 (1) k1[O2] � k2 (933 mbar, air) 296 Wallington et al., 1994 (d)IV.A1.50 CH2FCHFO + M→ CH2F+ HCOF + M (2)IV.A1.51 CF3CHFO + O2→ CF3COF + HO2 (1) 1.58× 10⁻²⁵ exp(3600/T ) 296 Wallington et al., 1992 (e)IV.A1.52 CF3CHFO + M→ CF3 + HCOF (2) 2.8× 10⁻²⁰ (2 bar) 298
3.2× 10⁻²⁵ exp(3510/T ) 273-320 Tuazon and Atkinson, 1993b (f)4.5× 10⁻²⁰ (986 mbar) 298k2= 3.7× 10⁷ exp(-2200/T )s−1 211-372 Maricq and Szente, 1992 (g)k2= 2.3× 10⁴ s−1 (307 mbar) 2981.18× 10−24 exp(2860/T ) 235-318 Rattigan et al., 1994 (h)1.7× 10⁻²⁰ (1 bar) 2981.5× 10−19 (50 mbar) 295 Bednarek et al, 1996 (i)k1= 2.7× 10⁻¹⁵ 2958.7× 10−25 exp(3240/T ) (1 bar) 244-2952.1× 10−25 exp(3625/T ) (1 bar) 238-295 Wallington et al, 1996 (j)3.8× 10⁻²⁴ exp(2400/T ) (1 bar) 298-357 Hasson et al, 1998 (k)
IV.A1.53 CF3CF2O + O2→ products (1) k1[O2] � k2 (933 mbar, air) 298 Edney and Driscoll, 1992 (l)IV.A1.54 CF3CF2O + M→ CF3 + CF2O + M (2) k1[O2] � k2 (986 mbar, air) 298 Tuazon and Atkinson, 1993a (m)
Comments
(a) Steady-state photolysis of Cl2 in the presence of CH3F-air mixtures (1 atm) with FTIR absorption spectroscopic analysis:a 100% yield of HCOF was observed, consistent withk1[O2] � k2.
(b) Steady-state photolysis of Cl2 in the presence of CH3CHF2-air mixtures (1 atm) with FTIR absorption spectroscopicanalysis: a 100± 5% yield of COF2 was observed, consistent withk1[O2] � k2.
(c) Similar experiments to those of Comment (b); a 92.2± 1.2 % yield of COF2, plus other unidentified products, wasobserved, consistent withk1[O2] � k2.
(d) Steady-state photolysis of Cl2 in the presence of CH2FCH2F-air mixtures (933 mbar) with FTIR analysis: a 91± 10%yield of HCOF was observed, consistent withk1[O2] � k2.
(e) Steady-state photolysis of Cl2 in the presence of CF3CFH2-O2-N2 mixtures at total pressures of 2 atm with FTIR analysisof products CF3COF and HCOF. The ratiok1/k2 was found to be pressure dependent over the range 27–732 mbar butapproximately independent of pressure above 933 mbar.
(f) Similar experiments to those of Comment (e) at a total pressure of 986 mbar.
(g) Flash-photolysis time-resolved UV absorption spectroscopic study of CF3CHFO2 radicals from F2-CF3CH2F-O2-N2mixtures,k1 obtained from a fit of CF3O2 formation profiles, produced from reaction (1) followed by CF3 + O2 + M.Experiments were carried out at a total pressure of 306 mbar, well below the high-pressure limit.
(h) Cl2- initiated photooxidation of CF3CH2F at 1atm pressure, with dual-beam diode-array UV spectroscopic determinationof CF3COF and HCOF products.
www.atmos-chem-phys.net/8/4141/2008/ Atmos. Chem. Phys., 8, 4141–4496, 2008

4222 R. Atkinson et al.: Evaluated kinetic and photochemical data for atmospheric chemistry
(i) Direct time-resolved experiment using laser pulsed photolysis-laser long path absorption; CF3CFHO produced byCF3CFHO2 + NO reaction and kinetics of thermal decomposition reaction determined at p = 50 mbar and 295 K. Therelatve rate ratio cited fork1/k2 was determined in a second experiment carried out over the temperature range 244–295K and p = 1 bar, using UV photolysis and FTIR analysis of products.
(j) Steady-state photolysis of Cl2 in the presence of CF3CFH2-O2-N2 mixtures at total pressures of 55–800 mbar with FTIRanalysis of products CF3COF and HCOF. Experiments also carried out with NO present so that CF3CFHO was producedby CF3CFHO2 + NO reaction, as opposed to the self reaction of CF3CFHO2. The ratiok1/k2 was found to increasewith pressure over the range given but approximately independent of pressure above 1500 mbar. The ratiok1/k2 wassignificantly lower in the NO experiments. This was ascribed to the production of vibrationally hot CF3CFHO radicalswhich decompose promptly to CF3 + HCFO, in the more exothermic source reaction.
(k) Steady-state photolysis of F2 in the presence of CF3CFH2-O2-N2 mixtures (p = 910 mbar) with FTIR absorption spectro-scopic analysis.
(l) Steady-state photolysis of Cl2 in the presence of CF3CHF2-air mixtures (1 atm) with FTIR absorption spectroscopicanalysis; a 109± 5% yield of C(O)F2 was observed, consistent withk1[O2] � k2.
(m) Similar experiments to those in Comment (l) at a total pressure of 986 mbar; a∼ 100% yield of C(O)F2 was observedconsistent withk1[O2] � k2.
Preferred Values
R1(R2)CHO = CF3CHFOk1/k2 = 4.0× 10⁻²⁰ cm3 molecule−1 at 298 K and 1 bar pressure.k1/k2 = 2.1× 10⁻²⁵ exp(3625/T ) (1bar) cm3 molecule−1 over the temperature range 260-355 K.1 (E/R) =± 500 K.
Comments on Preferred Values
R1(R2)CHO = CF3CHFOThe recommended temperature dependence rate coefficient ratio is that evaluated by Wallington et al. (1996) from their owndata together with those of Wallington et al. (1992), Tuazon and Atkinson (1993b), Meller et al. (1994) and Benarek et al.(1996). The data were corrected for a small pressure dependence measured by Wallington at al. (1996) at 298 K and theexpression refers to reactions of the thermalised CF3CHFO radicals. This study also revealed that energy rich CF3CHFOradicals were formed when the radical was produced from the CF3CHFO2 + NO reaction, leading to formation of HC(O)F byprompt decomposition at atmospheric temperatures, reducing the relative rate of O2 reaction by a factor of 1.8–4.0. Severaltheoretical studies have investigated the decomposition of CF3CHFO radicals and have confirmed that this interpretation isrealistic. (Schneider et al., 1998; Somnitz and Zellner, 2001).
R1(R2)CHO = other radicals in the above table.For the purpose of atmospheric modeling studies it is recommended that the above qualitative information on the ratiosk1/k2 beused to decide if one or other of the alkoxy radical reaction pathways predominates or if both pathways should be considered.
References
Bednarek, G., Breil, M., Hoffmann, A., Kohlmann, J. P., Mrs, V., and Zellner, R.: Ber. Bunsenges. Phys. Chem. 100, 528,1996.Edney, E. O. and Driscoll, D. J.: Int . J. Chem. Kinet. 24, 1067, 1992.Hasson, A. S., Moore, C. M. and Smith I. W. M.: Int. J. Chem. Kinet. 30, 541, 1998.Maricq, M. M., Shi, J., Szente, J. J., Rimai, L. and Kaiser, E. W.: J. Phys. Chem. 97, 9686, 1993.Meller, R., Boghu, D. and Moortgat, G. K.: EUR 16171 EN, Becker, K. H. (ed), Tropospheric Oxidation Mechanisms, JointEC/EuroTrac/GDCU Workshop, LACTOZ-HALIPP, Leipzig, September 20-22, 1994.Rattigan , O. V., Rowley, D. M., Wild, O., Jones, R. L. and Cox, R. A.: J. Chem. Soc. Faraday Trans. 90, 1819, 1994.
Atmos. Chem. Phys., 8, 4141–4496, 2008 www.atmos-chem-phys.net/8/4141/2008/

R. Atkinson et al.: Evaluated kinetic and photochemical data for atmospheric chemistry 4223
Schneider, W. F., Wallington, T. J., Barker, J. R. and Stahlberg, E. A.: Ber. Bunsenges. Phys. Chem. 102, 1850, 1998.Somnitz, H. and Zellner, R.: Phys. Chem. Chem. Phys. 3, 2352, 2001.Tuazon, E. C. and Atkinson, R.: J. Atmos. Chem. 16, 301, 1993b.Tuazon, E. C. and Atkinson, R.: J. Atmos. Chem. 17, 179, 1993a.Wallington, T. J., Hurley, M. D., Ball, J. C. and Kaiser, E. W.: Environ.Sci. Technol. 26, 1318, 1992.Wallington, T. J., Hurley, M. D., Ball, J. C., Ellermann, T., Nielsen, O. J. and Sehested, J.: J. Phys. Chem. 98, 5435, 1994.Wallington, T. J., Hurley, M. D., Fracheboud, J. M., Orlando, J. J., Tyndall, G. S., Møgelburg, T. E., Sehested, J. and Nielsen,O. J.: J. Phys. Chem. 100, 18116, 1996.
www.atmos-chem-phys.net/8/4141/2008/ Atmos. Chem. Phys., 8, 4141–4496, 2008

4224 R. Atkinson et al.: Evaluated kinetic and photochemical data for atmospheric chemistry
IV.A1.55-61
RO2 + NO→ RO + NO2 (1)
RO2 + NO + M → RONO2 + M (2)
(R = CH2F, CHF2, CF3, CH2FCHF, CHF2CF2, CF3CHF, CF3CF2)
Rate coefficient data (k = k1 + k2)
Reaction k/cm3 molecule−1 s−1 Temp./K Reference Technique/CommentsNumber
Absolute Rate CoefficientsIV.A1.55 R=CH2F
(1.25± 0.13)× 10−11 295 Sehested et al., 1993 PR-AS (a)IV.A1.56 R=CHF2
(1.26± 0.16)× 10−11 295 Sehested et al., 1993 PR-AS (a)IV.A1.57 R=CF3
(1.78± 0.36)× 10−11 295 Plumb and Ryan, 1982 DF-MS (b)1.45× 10⁻¹¹ (T /298)−(1.2±0.2) 230-430 Dognon et al., 1985 PLP-MS (c)(1.45± 0.20)× 10−11 298(1.53± 0.30)× 10−11 290 Peeters et al., 1992 DF-MS (d)(1.68± 0.26)× 10−11 295 Sehested and Nielsen, 1993 PR-AS (a)(1.53± 0.20)× 10−11 297 Bevilacqua et al., 1993 F-CIMS (e)(1.57± 0.38)× 10−11 298 Turnipseed et al., 1994 PLP-LIF (f)(1.57± 0.31)× 10−11 293 Bhatnagar and Carr, 1994 FP-MS (g)(1.76± 0.35)× 10−11 298 Bourbon et al., 1996 DF-LIF (h)(1.6± 0.3)× 10−11 298 Louis et al., 1999 DF-MS (i)
IV.A1.58 R=CH2FCHF> 8.7× 10⁻¹² 296 Wallington et al., 1994 PR-AS (a)
IV.A1.59 R=CHF2CF2
> (9.7± 1.3)× 10−12 295 Sehested et al., 1993 PR-AS (a)IV.A1.60 R=CF3CHF
(1.28± 0.36)× 10−11 298 Wallington and Nielsen, 1991 PR-AS (a)(1.31± 0.30)× 10−11 324 Bhatnagar and Carr, 1995 FP-MS (j)
IV.A1.61 R=CF3CF2
> (1.07± 0.15)× 10−11 295 Sehested et al., 1993 PR-AS (a)
Branching RatiosIV.A1.57 R=CF3
k2/k= (0.0167± 0.0027) 295 Nishida et al., 2004 P-FTIR (k)
Comments
(a) k determined from +d[NO2]/dt at a total pressure of 1 bar.
(b) k was independent of pressure over the range 2.5–6.8 mbar.
(c) No significant pressure dependence ink over the range 1.3–13 mbar was observed.
(d) Fast-flow system with molecular beam sampling MS at a total pressure of 2.7 mbar.k was derived from decay of CF3O2and appearance of NO2.
(e) k determined from decay of CF3O2 in the presence of NO; pressure range 1.1–2.7 mbar.
(f) Photolysis of CF3Br in the presence of O2 and NO at 93 mbar total pressure.k was obtained by fitting the measured CF3Oradical temporal profile, with formation through CF3O2 + NO and loss through CF3O + NO.
Atmos. Chem. Phys., 8, 4141–4496, 2008 www.atmos-chem-phys.net/8/4141/2008/

R. Atkinson et al.: Evaluated kinetic and photochemical data for atmospheric chemistry 4225
(g) Photolysis of (CF3CO)2O in the presence of O2, N2 and NO at 2.7–40 mbar total pressure.k obtained from the kineticsof CF3O2 removal and CF3O formation.k was independent of pressure in the studied range.
(h) CF3O2 generated from F + CHF3 reaction, withk determined from the formation kinetics of CF3O when NO added;pressure range 1.1–4.0 mbar.
(i) CF3O2 generated from F + CHF3 reaction, withk determined from the removal kinetics of CF3O2 when NO added;pressure range 0.9–4.0 mbar.
(j) Photolysis of Cl2 in the presence of CF3CH2F, O2, N2 and NO at 16–33 mbar total pressure.k was obtained from theformation kinetics of NO2. k was independent of pressure in the studied range.
(k) CF3O2 generated from the UV photolysis of CF3N2CF3 in excess NO, N2 and O2 at 930 mbar. Branching ratio determinedfrom the relative yields of CF3ONO2 and COF2.
Preferred Values
R = CH2Fk = 1.3× 10⁻¹¹ cm3 molecule−1 s−1 at 298 K.1log k =±0.3 at 298 K.
R = CHF2k = 1.3× 10⁻¹¹ cm3 molecule−1 s−1 at 298 K.1log k =±0.3 at 298 K.
R = CF3k = 1.6× 10⁻¹¹ (T /298)−1.2 cm3 molecule−1 s−1 over the temperature range 230–430 K.1log k =±0.1 at 298 K.1n =±0.5.
R = CH2FCHFk > 9× 10⁻¹² cm3 molecule−1 s−1 at 298 K.
R = CHF2CF2k > 1× 10⁻¹¹ cm3 molecule−1 s−1 at 298 K.
R = CF3CHFk = 1.3× 10⁻¹¹ cm3 molecule−1 s−1 at 298 K.1log k =±0.2 at 298 K.
R = CF3CF2k > 1× 10⁻¹¹ cm3 molecule−1 s−1 at 298 K.
Comments on Preferred Values
R = CH2F, CHF2, CHF2CF2, CF3CF2The preferred values are the rounded-off rate coefficients determined by Sehested et al. (1993).
R = CF3The preferred values are based on the temperature dependent data of Dognon et al. (1985), adjusted to fit ak298 value basedon the determinations of Plumb and Ryan (1982), Dognon et al. (1985), Peeters et al. (1992), Sehested and Nielsen (1993),Bevilacqua et al. (1993), Turnipseed et al. (1994), Bhatnagar and Carr (1994), Bourbon et al. (1996) and Louis et al. (1999).
www.atmos-chem-phys.net/8/4141/2008/ Atmos. Chem. Phys., 8, 4141–4496, 2008

4226 R. Atkinson et al.: Evaluated kinetic and photochemical data for atmospheric chemistry
R = CH2FCHFThe preferred value is the rounded-off lower limit of Wallington et al. (1994).
R = CF3CHFThe preferred value is the rounded-off rate coefficient determined by Wallington and Nielsen (1991).
The temperature dependence expressions are given in the form favoured by Dognon et al. (1985), and subsequently adoptedby others, which best describe the measured data. Comparison of the reported rate coefficients with those for the correspondingalkyl peroxy radicals, CH3O2 and C2H5O2, indicates that the presence of aα-halogen substituent typically enhancesk298by a factor of about 1.5–2, with the reactions also possessing a similar dependence on temperature where comparison ispossible. Although not so marked, it appears that additionalα-halogen substituents result in further slight enhancements tok298. Similarly to small alkyl peroxy radicals, the observations indicate that the reactions are dominated by the RO-formingchannel (1). Dognon et al. (1985) measured quantum yields for NO2 greater than unity for all the RO2 radicals studied;suggesting that the RO2 + NO reactions mainly form RO and NO2, with additional NO2 being produced from secondarychemistry. Nishida et al. (2004) have observed formation of a small yield 1.7± 0.3% of CF3ONO2 from the reaction ofCF3O2 with NO, confirming the existence of channel (2) at 930 mbar pressure. This suggests that the reactions of the C1and C2 halogenated RO2 radicals will generally have minor channels forming RONO2, but additional studies are required toconfirm this.
References
Bhatnagar, A. and Carr, R.W.: Chem. Phys. Lett. 231, 454, 1994.Bhatnagar, A. and Carr, R.W.: Chem. Phys. Lett. 238, 9, 1995.Bevilacqua, T. J., Hanson, D. R. and Howard, C. J.: J. Phys. Chem. 97, 3750, 1993.Bourbon, C., Brioukov, M., Hanoune, B., Sawerysyn, J. P. and Devolder, P.: Chem. Phys. Lett. 254, 203, 1996.Dognon, A. M., Caralp, F. and Lesclaux, R.: J. Chim. Phys. 82, 349, 1985.Louis, F., Burgess, D. R., Rayez, M. T. and Sawerysyn, J. P.: Phys. Chem. Chem. Phys. 1, 5087, 1999.Nishida, S., Takahashi, K., Matsumi, Y., Chiappero, M., Arguello, G., Wallington, T. J., Hurley, M. D. and Ball J. C.: Chem.Phys. Lett. 388, 242, 2004.Peeters, J., Vertommen, J. and Langhans, I.: Ber. Bunsenges. Phys. Chem. 96, 431, 1992.Plumb, I. C. and Ryan, K. R.: Chem. Phys. Lett. 92, 236, 1982.Ryan, K. R. and Plumb, I. C.: Int. J. Chem. Kinet. 16, 591, 1984.Sehested, J. and Nielsen, O. J.: Chem. Phys. Lett. 206, 369, 1993.Sehested, J., Nielsen, O. J. and Wallington, T. J.: Chem. Phys. Lett. 213, 457, 1993.Turnipseed, A. A., Barone, S. B. and Ravishankara, A. R.: J. Phys. Chem. 98, 4594, 1994.Wallington, T. J. and Nielsen, O. J.: Chem. Phys. Lett. 187, 33, 1991.Wallington, T. J., Hurley, M. D., Ball, J. C., Ellermann, T., Nielsen, O. J. and Sehested, J.: J. Phys. Chem. 98, 5435, 1994.
Atmos. Chem. Phys., 8, 4141–4496, 2008 www.atmos-chem-phys.net/8/4141/2008/

R. Atkinson et al.: Evaluated kinetic and photochemical data for atmospheric chemistry 4227
IV.A1.62
CF3O2 + NO2 + M → CF3O2NO2 + M
1H ◦ = -105 kJ·mol−1
Low-pressure rate coefficients
Rate coefficient data
k0/cm3 molecule−1 s−1 Temp./K Reference Technique/Comments
Absolute Rate Coefficients(2.7± 0.8)× 10−29 (T /298)−4.7 [O2] 233-373 Caralp et al., 1988 PLP-MS (a)6.3× 10⁻³³ exp(2710/T ) [N2] 264-297 Mayer-Figge et al., 1996 (b)5.6× 10⁻²⁹ (T /298)−9.1 [N2]
Comments
(a) Pulsed laser photolysis-MS study in 1-10 Torr O2. Extrapolation withFc = exp(-T /416), i.e.,Fc = 0.49 at 298 K, andk∞= 8.9× 10⁻¹² (T /298)−0.72 cm3 molecule−1 s−1 from RRKM model.
(b) From measurements of the reverse dissociation of CF3O2NO2. Equilibrium constantsKc = 3.80× 1027 exp(-12140/T )cm3 molecule−1 s−1 derived by combining the dissociation data with the recombination data from Caralp et al. (1988)over the falloff curve, assuming equal results for the bath gases N2 and O2. Extrapolation withFc = 0.31 andk∞ = 7.7×10⁻¹² cm3 molecule−1 s−1 .
Preferred Values
k0 = 5.6× 10⁻²⁹ (T /298)−9 [N2] cm3 molecule−1 s−1 over the temperature range 200-300 K.
Reliability
1 log k0 =± 0.2 at 298 K.1 n =± 3.
Comments on Preferred Values
The data by Mayer-Figge et al. (1996) are preferred because they cover a much broader part of the falloff curve and employa more reasonable value ofFc = 0.31, thus allowing for a better extrapolation to the low pressure limit. Nevertheless, the ratedata from Caralp et al. (1988) and Mayer-Figge et al. (1996) are identical over the range 1.3–13 mbar because both sets ofdata have been used for the conversion from dissociation to recombination rate coefficients.
High-pressure rate coefficients
Rate coefficient data
k∞/cm3 molecule−1 s−1 Temp./K Reference Technique/Comments
Absolute Rate Coefficients8.9× 10−12 (T /298)−0.72 233-373 Caralp et al., 1988 PLP-MS (a)7.7× 10⁻¹² (T /298)−0.67 264-297 Mayer-Figge et al., 1996 (b)
www.atmos-chem-phys.net/8/4141/2008/ Atmos. Chem. Phys., 8, 4141–4496, 2008

4228 R. Atkinson et al.: Evaluated kinetic and photochemical data for atmospheric chemistry
Comments
(a) See comment (a) fork0.
(b) See comment (b) fork0.
Preferred Values
k∞ = 7.7× 10⁻¹² (T /298)−0.67 cm3 molecule−1 s−1 over the temperature range 260-300 K.
Reliability
1 log k∞ =± 0.2 at 298 K.1 n =± 0.5.
Comments on Preferred Values
See Comments on Preferred Values fork0.
References
Caralp, F., Lesclaux, R., Rayez, M.-T., Rayez, J.-C. and Forst, W.: J. Chem. Soc. Faraday Trans 2, 84, 569, 1988.Mayer-Figge, A., Zabel, F. and Becker, K.H.: J. Phys. Chem., 100, 6587, 1996.
Atmos. Chem. Phys., 8, 4141–4496, 2008 www.atmos-chem-phys.net/8/4141/2008/

R. Atkinson et al.: Evaluated kinetic and photochemical data for atmospheric chemistry 4229
IV.A1.63
CF3O2NO2 + M → CF3O2 + NO2 + M
1H ◦ = 105 kJ·mol−1
Low-pressure rate coefficients
Rate coefficient data
k0/s−1 Temp./K Reference Technique/Comments
Absolute Rate Coefficients2.4× 10−5 exp(-9430/T ) [N2] 264-297 Mayer-Figge et al., 1996 (a)
Comments
(a) Preparation of CF3O2NO2 by in situ photolysis of CF3I/O2/NO2/N2 mixtures in a 420 l reactor. Time dependence ofCF3O2NO2 decay monitored by IR absorption. Measurements in 3.7–1013 mbar of N2 evaluated withFc = 0.31,Nc =1.19, andk∞ = 1.49× 10¹⁶ exp(-11940/T ) s−1. Similar results in O2. Analysis of equilibrium constant gives1H ◦ =102.7 (± 2.0) kJ mol−1.
Preferred Values
k0 = 2.5× 10⁻⁵ exp(-9430/T ) [N2] s−1 over the temperature range 260-300 K.k0 = 4.5× 10⁻¹⁹ [N2] s−1 at 298 K.
Reliability
1 log k0 =± 0.3 at 298 K.1 (E/R) =± 250 K.
Comments on Preferred Values
The single measurement falls in line with data for related reactions. In addition, it could be evaluated theoretically leading torealistic molecular parameters. Because no unusual complications were observed, the data appear reliable. The observed partof the falloff curve could well be represented withFc andk∞ such as given in comment (a) fork0.
High-pressure rate coefficients
Rate coefficient data
k∞/s−1 Temp./K Reference Technique/Comments
Absolute Rate Coefficients1.49× 1016 exp(-11940/T ) 264-297 Mayer-Figge et al., 1996 (a)
Comments
(a) See comment (a) fork0.
www.atmos-chem-phys.net/8/4141/2008/ Atmos. Chem. Phys., 8, 4141–4496, 2008

4230 R. Atkinson et al.: Evaluated kinetic and photochemical data for atmospheric chemistry
Preferred Values
k∞ = 1.5× 10¹⁶ exp(-11940/T ) s−1 over the temperature range 260-300 K.k∞ = 6.0× 10⁻² s−1 at 298 K.
Reliability
1 log k∞ =± 0.3 at 298 K.1 (E/R) =± 250 K.
Comments on Preferred Values
See Comments on Preferred Values fork0. The theoretical analysis by Mayer-Figge et al. (1996) supersedes the more specu-lative earlier analysis by Destriau and Troe (1990). The falloff curve is constructed with the fittedFc = 0.31 andNc = 1.19 ingood agreement with the recommendation given in the Introduction.
References
Destriau, M. and Troe, J.: Int. J. Chem. Kinet., 22, 915, 1990.Mayer-Figge, A., Zabel, F. and Becker, K. H.: J. Phys. Chem., 100, 6587, 1996.
Atmos. Chem. Phys., 8, 4141–4496, 2008 www.atmos-chem-phys.net/8/4141/2008/

R. Atkinson et al.: Evaluated kinetic and photochemical data for atmospheric chemistry 4231
IV.A1.64
CH2FO2 + CH2FO2 → CH2FOH + HC(O)F + O2 (1)→ CH2FO + CH2FO + O2 (2)
Rate coefficient data (k = k1 + k2)
k/cm3 molecule−1 s−1 Temp./K Reference Technique/Comments
Absolute Rate Coefficientskobs = 3.3× 10⁻¹³ exp[(700± 100)/T ] 228-380 Dagaut et al., 1988 FP-UVA (a,b)kobs = (3.07± 0.65)× 10−12 298kobs = (4.01± 0.52)× 10−12 298 Wallington et al., 1992 PR-UVA (a,c)
Branching Ratiosk2/k > 0.77 298 Wallington et al., 1992 UVP-FTIR (d)
Comments
(a) kobs is based on the measured overall second-order decay of CH2FO2, defined by -d[CH2FO2]/dt = 2kobs [CH2FO2]2. Asdescribed in detail by Lesclaux (1997), HO2 radicals formed from the subsequent chemistry of CH2FO (formed fromchannel (2)) are expected to lead to secondary removal of CH2FO2. The true value ofk is expected to fall in the rangekobs/(1 + α) < k < kobs, whereα = k2/k.
(b) Flash photolysis of Cl2 in the presence of CH3F-O2-N2 mixtures at total pressures of 33–533 mbar. CH2FO2 radicalswere monitored by UV absorption withσ240nm = (3.72± 0.45)× 10−18 cm2 molecule−1.
(c) Pulse radiolysis study of CH3F-O2-SF6 mixtures at a total pressure of 1000 mbar. CH2FO2 radicals were monitored byUV absorption withσ240nm = (4.11± 0.67)× 10−18 cm2 molecule−1.
(d) CH2FO2 radicals were generated from the steady-state photolysis of Cl2-CH3F mixtures at 933 mbar pressure of air. Thedecay of CH3F and the formation of products was monitored by FTIR spectroscopy. No CH2FOH was observed withinthe detection limits of the apparatus. Significant amounts of HC(O)F were observed (86± 5%) and, in experiments withhigh conversions, CH2FOOH was observed (11± 4%).
Preferred Values
k = 2.6× 10⁻¹² cm3 molecule−1 s−1 at 298 K.k = 2.5× 10⁻¹³ exp(700/T ) cm3 molecule−1 s−1 over the temperature range 220-380 K.k2/k = 1.0 at 298 K.
Reliability
1 log k =± 0.3 at 298 K.1 (E/R) =± 300 K.1 (k2/k) = +0.0
−0.2 at 298 K.
Comments on Preferred Values
In the product study of Wallington et al. (1992) no formation of CH2FOH was observed, showing that channel (1) is not ofmajor importance at 298 K. The high yields of HC(O)F are also consistent with the dominance of channel (2), followed byreaction of CH2FO with O2 to form HC(O)F and HO2. A product study of the CH2FO2 + HO2 reaction (Wallington et al.,1994) has shown that only ca. 30% of that reaction produces CH2FO2H and O2, with the remainder forming HC(O)F, H2O
www.atmos-chem-phys.net/8/4141/2008/ Atmos. Chem. Phys., 8, 4141–4496, 2008
4232 R. Atkinson et al.: Evaluated kinetic and photochemical data for atmospheric chemistry
and O2. The low yields of CH2FO2H observed by Wallington et al. (1992) are thus partially explained by this, but also suggestthat HO2 is probably removed by its self reaction in competition with reaction with CH2FO2.
The preferred value ofk at 298 K is derived from thekobs values reported by Dagaut et al. (1988) and Wallington et al.(1992), adjusted to be consistent with the re-evaluation ofσ240nm (CH2FO2) = 4.03× 10⁻¹⁸ cm2 molecule−1 by Nielsenand Wallington (1997). Similar to a procedure adopted by Lesclaux (1997) for peroxy radicals for which the self reactionrate coefficients are≥ ca. 2× 10⁻¹² cm3 molecule−1 s−1, k is estimated to bekobs/(1 + 0.5(k2/k)), with this approximationassuming that the secondary reaction of HO2 with CH2FO2 competes equally with its removal via HO2 + HO2. The reliabilityrange reflects thatk has been derived by this approximate procedure. The preferred value ofE/R is based on thekobsexpressionof Dagaut et al. (1988). This assumes that the above competition remains valid over the entire temperature range, consistentwith the CH2FO2 and HO2 self reactions, and reaction of CH2FO2 with HO2 possessing similar temperature dependences.
References
Dagaut, P., Wallington, T. J. and Kurylo, M. J.: Int. J. Chem. Kinet. 20, 815, 1988.Lesclaux, R.: Combination of peroxyl radicals in the gas phase. In ’Peroxyl Radicals’, edited by Alfassi, Z. B., John Wileyand Sons, 1997.Nielsen, O. J. and Wallington, T. J.: Ultraviolet absorption spectra of peroxy radicals in the gas phase. In ’Peroxyl Radicals’,edited by Alfassi, Z. B., John Wiley and Sons, 1997.Wallington, T. J., Ball, J. C., Nielsen, O. J. and Bartkiewicz, E.: J. Phys. Chem. 96, 1241, 1992.Wallington, T. J., Hurley, M. D., Schneider, W. F., Sehested, J. and Nielsen, O. J.: Chem. Phys. Lett. 218, 34, 1994.
Atmos. Chem. Phys., 8, 4141–4496, 2008 www.atmos-chem-phys.net/8/4141/2008/

R. Atkinson et al.: Evaluated kinetic and photochemical data for atmospheric chemistry 4233
IV.A1.65
CHF2O2 + CHF2O2 → CHF2OH + C(O)F2 + O2 (1)→ CHF2O + CHF2O + O2 (2)
Rate coefficient data (k = k1 + k2)
k/cm3 molecule−1 s−1 Temp./K Reference Technique/Comments
Absolute Rate Coefficientskobs = (5.0± 0.7)× 10−12 298 Nielsen et al., 1992 PR-UVA (a,b)
Branching Ratiosk2/k ≈ 1.0 298 Nielsen et al., 1992 UVP-FTIR (c)
Comments
(a) kobs is based on the measured overall second-order decay of CHF2O2, defined by -d[CHF2O2]/dt = 2kobs [CHF2O2]2. Asdescribed in detail by Lesclaux (1997), HO2 radicals formed from the subsequent chemistry of CHF2O (formed fromchannel (2)) are expected to lead to secondary removal of CHF2O2. The true value ofk is expected to fall in the rangekobs/(1 + α) < k < kobs, whereα = k2/k.
(b) Pulse radiolysis study of CH2F2-O2-SF6 mixtures at a total pressure of 1000 mbar. CHF2O2 radicals were monitored byUV absorption withσ240nm = (2.66± 0.46)× 10−18 cm2 molecule−1.
(c) CHF2O2 radicals were generated from the steady-state photolysis of Cl2-CH2F2 mixtures in the presence of air at a totalpressure of 933 mbar. The decay of CH2F2 and the formation of C(O)F2 were monitored by FTIR spectroscopy. Theyield of C(O)F2 was 104± 2% of the removal of CH2F2.
Preferred Values
k = (2.5–5)× 10−12 cm3 molecule−1 s−1 at 298 K.k2/k ≈ 1.0 at 298 K.
Comments on Preferred Values
We have recommended a range of values for the rate coefficient at 298 K, based on the determination by Nielsen et al. (1992).The upper limit is the measured value ofkobs with no correction for possible secondary CHF2O2 removal by HO2 radicals, andthe lower limit is a factor of two less than the upper limit, corresponding to a maximum correction for the HO2 radical reaction.
The product study in the same paper (Nielsen et al., 1992) showed that the only carbon-containing product was C(O)F2,formed by the reaction CHF2O + O2→ C(O)F2 + HO2, indicating that channel (2) is the predominant pathway. The absenceof the product CHF2O2H expected from the reaction CHF2O2 + HO2→ CHF2O2H + O2, raises several possibilities, includinga slow reaction between CHF2O2 and HO2 radicals or an alternative reaction pathway, such as CHF2O2 + HO2→ C(O)F2 +H2O + O2. More information is needed on the kinetics and mechanism of the CHF2O2 + HO2 reaction to definek andk2/kmore accurately.
References
Lesclaux, R.: Combination of peroxyl radicals in the gas phase. In ’Peroxyl Radicals’, edited by Alfassi, Z. B., John Wileyand Sons, 1997.Nielsen, O. J., Ellermann, T., Bartkiewicz, E., Wallington, T. J. and Hurley, M. D.: Chem. Phys. Lett. 192, 82, 1992.
www.atmos-chem-phys.net/8/4141/2008/ Atmos. Chem. Phys., 8, 4141–4496, 2008

4234 R. Atkinson et al.: Evaluated kinetic and photochemical data for atmospheric chemistry
IV.A1.66
CF3O2 + CF3O2→ CF3O + CF3O + O2
1H ◦ = -83.2 kJ·mol−1
Rate coefficient data
k/cm3 molecule−1s−1 Temp./K Reference Technique/Comments
Absolute Rate Coefficients(1.8± 0.5)× 10−12 295 Nielsen et al., 1992 PR-UVA (a)1.8× 10⁻¹² 298 Maricq and Szente, 1992a FP-UVA (b)(1.8± 0.5)× 10−12 297 Maricq and Szente, 1992b FP-UVA (c)(1.2± 0.3)× 10−12 298 Biggs et al., 1997 DF-LIF/MS (d)(2.25± 0.3)× 10−12 295 Sehested et al., 1997 PR-UVA (e)
Comments
(a) Pulse radiolysis study of CHF3-O2-SF6 mixtures at a total pressure of 1000 mbar. CF3O2 radicals were monitored byUV absorption withσ230nm = (2.06± 0.40)× 10−18 cm2 molecule−1, and an observed rate coefficient,kobs = (3.6±0.9)× 10−12 cm3 molecule−1 s−1, was derived from the decay in absorption. Associated FTIR product studies using thephotolysis of F2-CHF3-O2-N2 mixtures demonstrated quantitative formation of CF3OOOCF3, which was explained bythe secondary reaction of CF3O with CF3O2. The cited value ofk is thus 0.5kobs, to take account of this secondary lossof CF3O2.
(b) Flash photolysis of CHF3-F2-O2 mixtures with time-resolved absorption spectroscopy for the detection of CF3O2 radicals,with σ210nm = (4.3± 0.3)× 10−18 cm2 molecule−1. A value of kobs = (3.1± 0.25)× 10−12 cm3 molecule−1 s−1
was determined from the time-dependence of the CF3O2 radical absorbance. The cited value ofk was obtained from asimulation in which secondary removal of CF3O2 was explicitly represented.
(c) Flash photolysis of F2 in the presence of N2, O2, He, and CF3CFH2. Secondary generation of CF3O2 in the systemoccurred by the reaction CF3CHFO→ CF3 + HCOF, followed by CF3+ O2 + M→ CF3O2 + M. CF3O2 radicals weremonitored by UV absorption, and the 298 K value ofkobs = 3.1× 10⁻¹² cm3 molecule−1 s−1, derived in the authors’previous study (Maricq and Szente, 1992a), was shown to provide a good description of the time dependence of theformation and removal of CF3O2. The previous value (Maricq and Szente, 1992a) of the rate coefficient for the elementaryreaction,k, was therefore confirmed and assigned the cited error limits. Additional measurements suggested thatkobs
decreases with increasing temperature.
(d) Experiments performed at pressures in the range 1.3 to 4 mbar. CF3O2 radicals were produced by the F + CHF3 reactionor the F + CF3I reaction, with subsequent addition of O2. CF3O2 radicals were monitored by titration to NO2 followingreaction with excess NO, with detection of NO2 by either LIF or MS. An observed rate coefficient,kobs = (2.0± 1.0)×10−12 cm3 molecule−1 s−1, was derived from the decay in CF3O2. The cited value ofk was obtained from a simulationin which secondary removal of CF3O2 was explicitly considered.
(e) Pulse radiolysis study of CHF3-O2-SF6 mixtures at a total pressure of 1000 mbar. CF3O2 radicals were monitored by UVabsorption withσ230nm = 3.43× 10⁻¹⁸ cm2 molecule−1. The cited value ofk was derived from simulation of the decayin absorption, using a chemical mechanism in which secondary removal of CF3O2 was explicitly represented.
Preferred Values
k = 1.5× 10⁻¹² cm3 molecule−1 s−1 at 298 K.
Reliability
1 log k =± 0.3 at 298 K.
Atmos. Chem. Phys., 8, 4141–4496, 2008 www.atmos-chem-phys.net/8/4141/2008/

R. Atkinson et al.: Evaluated kinetic and photochemical data for atmospheric chemistry 4235
Comments on Preferred Values
The reported quantitative formation of CF3OOOCF3 from CHF3 oxidation, in the product study of Nielsen et al. (1992) isconsistent with the self-reaction of CF3O2 proceeding via formation of CF3O radicals, which react with CF3O2.
The five reported values ofk are in reasonable accord, covering a range of approximately two. The discharge-flow determi-nation of Biggs et al. (1997) lies at the low end of the range, and this may be indicative a pressure dependence of the reaction.Biggs et al. (1997) performed QRRK calculations, based on the reaction proceeding via a [CF3O4CF3]∗ intermediate andestimated that the high pressure limitingk (achieved at ca. 35–70 mbar) is ca. 15% greater than their measured value, i.e. (1.4± 0.4)× 10−12 cm3 molecule−1 s−1. The observed range in reportedk values may also be reduced by re-evaluating the resultsof the UV absorption studies (Nielsen et al., 1992; Maricq and Szente, 1992a, b; Sehested et al., 1997) using the recommendedCF3O2 absorption cross sections reported by Nielsen and Wallington (1997), which are somewhat lower than those appliedby Maricq and Szente (1992a, b) and Sehested et al. (1997). This leads to respective revised values ofk of 1.5× 10⁻¹² and1.4× 10−12 cm3 molecule−1 s−1 in those studies, and a much improved general agreement among the reported studies. Thepreferred value ofk is therefore based on the re-evaluations of the UV absorption studies and the estimated high pressure valueof Biggs et al. (1997). Maricq and Szente (1992b) obtained limited evidence thatkobs possesses a weak negative temperaturecoefficient, but further temperature dependence studies are required to quantify this.
References
Biggs, P., Canosa-Mas, C. E., Frachebound, J. M., Percival, C. J., Wayne, R. P. and Shallcross, D. E.: J. Chem. Soc. FaradayTrans., 93, 379, 1997.Maricq, M. M. and Szente, J. J.: J. Phys. Chem., 96, 4925, 1992a.Maricq, M. M. and Szente, J. J.: J. Phys. Chem., 96, 10862, 1992b.Nielsen, O. J. and Wallington, T. J.: Ultraviolet absorption spectra of peroxy radicals in the gas phase. In ’Peroxyl Radicals’,edited by Alfassi, Z. B., John Wiley and Sons, 1997. Nielsen, O. J., Ellermann, T., Sehested, J., Bartkiewiecz, E., Wallington,T. J. and Hurley, M. D.: Int. J. Chem. Kinet., 24, 1009, 1992.Sehested, J., Møgelberg, T., Fagerstrom, K., Mahmoud, G. and Wallington, T. J.: Int. J. Chem. Kinet., 29, 673, 1997.
www.atmos-chem-phys.net/8/4141/2008/ Atmos. Chem. Phys., 8, 4141–4496, 2008

4236 R. Atkinson et al.: Evaluated kinetic and photochemical data for atmospheric chemistry
IV.A1.67
CF3O2 + CF3CHFO2 → CF3OH + CF3COF + O2 (1)→ CF3O + CF3CHFO + O2 (2)
Rate coefficient data (k = k1 + k2)
k/cm3 molecule−1 s−1 Temp./K Reference Technique/Comments
Absolute Rate Coefficients(8± 3)× 10−12 297 Maricq and Szente, 1992 (a)
Comments
(a) Flash photolysis of F2 in the presence of CF3CH2F-O2-N2-He mixtures. CF3CHFO2 radicals were monitored by UVabsorption withσ213nm = (5.2± 0.3)× 10−18 cm2 molecule−1. The derived value ofk listed above was obtained bymodeling the decay of CF3CFHO2 radicals and the formation and decay of CF3O2 radicals.
Preferred Values
k = 8× 10⁻¹² cm3 molecule−1 s−1 at 298 K.
Reliability
1 log k =± 0.5 at 298 K.
Comments on Preferred Values
The preferred value of the rate coefficient at 298 K seems reasonable, but requires independent confirmation. Maricq andSzente (1992) assumed that the reaction proceeds entirely by channel (2) on the basis of studies of the self-reactions of CF3O2and CF3CHFO2 radicals.
References
Maricq, M. M. and Szente, J. J.: J. Phys. Chem., 96, 10862, 1992.
Atmos. Chem. Phys., 8, 4141–4496, 2008 www.atmos-chem-phys.net/8/4141/2008/

R. Atkinson et al.: Evaluated kinetic and photochemical data for atmospheric chemistry 4237
IV.A1.68
CHF2CF2O2 + CHF2CF2O2 → CHF2CF2O + CHF2CF2O + O2
Rate coefficient data
k/ cm3 molecule−1 s−1 Temp./K Reference Technique/Comments
Absolute Rate Coefficientskobs = (2.7± 0.6)× 10−12 298 Nielsen et al., 1992a PR-UVA (a)
Comments
(a) Pulse radiolysis study of CHF2CHF2-O2-SF6 mixtures at a total pressure of 1000 mbar. CHF2CF2O2 radicals weremonitored by UV absorption withσ230 = (3.2± 0.5)× 10−18 cm2 molecule−1. kobs is based on the measured overallsecond-order decay in absorption at 230 nm, which was defined as -d[CHF2CF2O2]/dt = 2kobs[CHF2CF2O2]2. Productstudies were also performed on the steady-state photolysis of Cl2 in the presence of CHF2CHF2-air mixtures at 933 mbartotal pressure. The decay of CHF2CHF2 and the formation of COF2, the only carbon-containing product observed, weremonitored by FTIR spectroscopy. The yield of COF2 was 98± 2% relative to the decay of CHF2CHF2.
Preferred Values
No recommendation
Comments on Preferred Values
Although the value ofkobs reported by Nielsen et al. (1992a) is likely to be indicative of the magnitude of the self-reaction ratecoefficient for CHF2CF2O2, the probable formation of CHF2O2 and HO2 radicals from the subsequent chemistry (see below)is expected to lead to secondary removal of CHF2CF2O2, but also interferences in the absorption traces at 230 nm, because thespectra for all three peroxy radicals are similar. These two factors have opposing influences onkobs, and it is not possible toderivek without a detailed understanding of the rates and mechanisms of the secondary processes and appropriate simulationsof the system. No firm recommendation fork can currently be made.
The product study of Nielsen et al. (1992a) demonstrated approximately 100% formation of COF2 from the oxidation ofCHF2CHF2, consistent with exclusive formation of CHF2CF2O from the self-reaction of CHF2CF2O2, followed by decompo-sition to form COF2 and CHF2. The CHF2 radicals form CHF2O2 radicals, which are known (Nielsen et al., 1992b) to interactvia their self-reaction, resulting in the formation of COF2 and HO2 from the subsequent reaction of CHF2O with O2. However,it is probable that CHF2O2 is also converted to CHF2O via reaction with CHF2CF2O2 in the system. HO2 radicals, generatedfrom CHF2O + O2, potentially also react with both CHF2CF2O2 and CHF2O2, in competition with their self-reaction. Theabsence of the products CHF2CF2O2H and CHF2O2H, which might be formed in these reactions, raises several possibilities:the reactions of HO2 with CHF2CF2O2 and CHF2O2 may be too slow to compete with the self-reaction, or they may proceedby alternative pathways leading to COF2 formation. More information is therefore needed on the kinetics and mechanism ofthe secondary reactions, in addition to further kinetics studies of the title reaction, to allowk to be defined more accurately.
References
Nielsen, O. J., Ellermann, T., Sehested, J. and Wallington, T. J.: J. Phys. Chem. 96, 10875, 1992a.Nielsen, O. J., Ellermann, T., Bartkiewicz, E., Wallington, T. J. and Hurley, M. D.: Chem. Phys. Lett. 192, 82, 1992b.
www.atmos-chem-phys.net/8/4141/2008/ Atmos. Chem. Phys., 8, 4141–4496, 2008

4238 R. Atkinson et al.: Evaluated kinetic and photochemical data for atmospheric chemistry
IV.A1.69
CF3CHFO2 + CF3CHFO2 → CF3COF + CF3CHFOH + O2 (1)→ CF3CHFO + CF3CHFO + O2 (2)
Rate coefficient data (k = k1 + k2)
k/cm3 molecule−1 s−1 Temp./K Reference Technique/Comments
Absolute Rate Coefficients7.8× 10−13 exp[(605± 40)/T ] 211-372 Maricq and Szente, 1992 FP-UVA (a,b)(7± 1.0)× 10−12 297(3.5± 0.8)× 10−12 295 Sehested et al., 1997 PR-UVA (a,c)
Branching Ratiosk1/k = 0.28 273 Wallington et al., 1992 UVP-FTIR (d)k1/k = 0.16 298k1/k = 0.05 353k1/k = 0.055 273 Tuazon and Atkinson, 1993 UVP-FTIR (e)k1/k = 0.049 298k1/k = 0.046 320
Comments
(a) k is defined by -d[CF3CHFO2]/dt = 2k[CF3CHFO2]2.
(b) Flash photolysis of F2 in the presence of N2, O2, He and CF3CH2F. CF3CHFO2 radicals were monitored by UV absorptionwith σ240nm = (5.2± 0.3)× 10−13 cm2 molecule−1. The derived value ofk listed above was obtained by modelling thedecay curves for CF3CFHO2 radicals with a mechanism of 9 reactions.
(c) Pulse radiolysis study of CF3CH2F-O2-SF6 mixtures at a total pressure of 1000 mbar. CF3O2 radicals were monitored byUV absorption at 220 nm (σ = 5.34× 10⁻¹⁸ cm2 molecule−1), 230 nm (σ = 4.50× 10⁻¹⁸ cm2 molecule−1) and 240 nm(σ = 3.06× 10⁻¹⁸ cm2 molecule−1). The cited value ofk was derived from simulation of the decay in absorption, usinga chemical mechanism in which secondary removal of CF3CHFO2 was explicitly represented.
(d) Steady-state photolysis of Cl2 in the presence of CF3CFH2-O2 mixtures at a total pressure of 933 mbar with FTIR analysisof the products HC(O)F and CF3C(O)F. The branching ratio was determined from the yields of CF3C(O)F as a functionof added O2, extrapolated to zero O2 partial pressure.
(e) Similar experiments to those of Comment (d). The branching ratios were derived from the yields of CF3C(O)F in thepresence of 787 mbar N2 and 1.3 mbar O2.
Preferred Values
k = 4.7× 10⁻¹² cm3 molecule−1 s−1 at 298 K.k = 6.2× 10⁻¹³ exp(605/T ) cm3 molecule−1 s−1 over the temperature range 210-375 K.k2/k = 0.90, independent of temperature over the range 270-350 K.k1/k = 0.10, independent of temperature over the range 270-350 K.
Reliability
1 log k =± 0.3 at 298 K.1 (E/R) =± 200 K.1 (k1/k) = 1 (k2/k) =± 0.05 over the temperature range 270-350 K.
Atmos. Chem. Phys., 8, 4141–4496, 2008 www.atmos-chem-phys.net/8/4141/2008/

R. Atkinson et al.: Evaluated kinetic and photochemical data for atmospheric chemistry 4239
Comments on Preferred Values
The preferred value ofk at 298 K is the average of the results of Maricq and Szente (1992) (based on their Arrhenius expression)and Sehested et al. (1997). The preferred Arrhenius expression fork is based on theE/R value from the study of Maricq andSzente (1992), combined with a pre-exponential factor adjusted to give the preferred value ofk at 298 K. The temperaturedependence reported by Maricq and Szente (1992), is based on temperature-independent branching ratiosk1/k andk2/k overthe range 273–363 K. This is consistent with our recommendation of a temperature-independent branching ratio,k1/k, whichis the average of the experimental results of Wallington et al. (1992) and Tuazon and Atkinson (1993) over the range 273–353K. The recommended value ofk2/k is inferred from that ofk1/k. It should be noted, however, that the results of Maricq andSzente (1992) fork at 216 K are not consistent with temperature-independent branching ratios.
The kinetics studies (Maricq and Szente, 1992; Sehested et al., 1997) report values ofk at 298 K which differ by a factor of1.7, and this is reflected in the assigned reliability range. Confirmation of both the overall rate coefficient and the branchingratios is required.
References
Maricq, M. M. and Szente, J. J.: J. Phys. Chem., 96, 10862, 1992.Sehested, J., Møgelberg, T., Fagerstrom, K., Mahmoud, G. and Wallington, T. J.: Int. J. Chem. Kinet., 29, 673, 1997.Tuazon, E. C. and Atkinson, R.: J. Atmos. Chem., 16, 301, 1993.Wallington, T. J., Hurley, M. D., Ball, J. C. and Kaiser, E. W.: Environ. Sci. Technol., 26, 1318, 1992.
www.atmos-chem-phys.net/8/4141/2008/ Atmos. Chem. Phys., 8, 4141–4496, 2008

4240 R. Atkinson et al.: Evaluated kinetic and photochemical data for atmospheric chemistry
IV.A1.70
CF3CF2O2 + CF3CF2O2→ CF3CF2O + CF3CF2O + O2
Rate coefficient data
k/cm3 molecule−1 s−1 Temp./K Reference Technique/Comments
Absolute Rate Coefficientskobs = (2.10± 0.38)× 10−12 295 Sehested et al., 1993 PR-UVA (a)
Comments
(a) Pulse radiolysis study of CF3CHF2-O2-SF6 mixtures at a total pressure of 1000 mbar. CF3CF2O2 radicals were monitoredby UV absorption withσ230nm = (2.74± 0.46)× 10−18 cm2 molecule−1. kobs is based on the measured overall second-order decay in absorption at 230 nm, which was defined as -d[CF3CF2O2]/dt = 2kobs[CF3CF2O2]2. Products studies werealso performed on the steady-state photolysis of Cl2 in the presence of CF3CHF2-air mixtures at 933 mbar total pressure.The decay of CF3CHF2 and the formation of products were monitored by FTIR spectroscopy. The observed productswere C(O)F2, CF3O3CF3 and CF3O3C2F5, and accounted for 100% of the CF3CF2H loss.
Preferred Values
No recommendation
Comments on Preferred Values
Although the value ofkobs reported by Sehested et al. (1993) is likely to be indicative of the magnitude of the self-reactionrate coefficient for CF3CF2O2, the formation of CF3O2 and CF3O radicals from the subsequent chemistry (see below) leads tosecondary removal of CF3CF2O2, but also interferences in the absorption traces at 230 nm, because the spectra for CF3CF2O2and CF3O2 are almost identical. These two factors have opposing influences onkobs, and it is not possible to derivek without adetailed understanding of the rates and mechanisms of the secondary processes and appropriate simulations of the system. Nofirm recommendation fork can currently be made.
The quantitative formation of C(O)F2 observed in the product study of Sehested et al. (1993) is consistent with exclusiveformation of CF3CF2O from the self-reaction of CF3CF2O2, followed by decomposition to form C(O)F2 and CF3. TheCF3 radicals form CF3O2 radicals, which are known (Nielsen et al., 1992) to interact via their self-reaction, resulting in theformation of CF3O. However, it is probable that CF3O2 is also converted to CF3O via reaction with CF3CF2O2 in the system.Further removal of both CF3CF2O2 and CF3O2 occurs via their reactions with CF3O, which lead to the observed productsCF3O3C2F5 and CF3O3CF3 (Sehested et al., 1993). More information is therefore needed on the kinetics and mechanism ofthe secondary reactions, in addition to further kinetics studies of the title reaction, to allowk to be defined more accurately.
References
Nielsen, O. J., Ellermann, T., Sehested, J., Bartkiewiecz, E., Wallington, T. J. and Hurley, M. D.: Int. J. Chem. Kinet., 24,1009, 1992.Sehested, J., Ellermann, T., Nielsen, O. J., Wallington, T. J. and Hurley, M. D.: Int. J. Chem. Kinet. 25, 701, 1993.
Atmos. Chem. Phys., 8, 4141–4496, 2008 www.atmos-chem-phys.net/8/4141/2008/

R. Atkinson et al.: Evaluated kinetic and photochemical data for atmospheric chemistry 4241
IV.A1.71
HC(O)F + hν→ products
Primary photochemical transitions
Reaction 1H◦/kJ.mol−1 λthreshold /nm
HC(O)F + hν → HF + CO (1) 8.7 13,730→ H + FCO (2) 458 261→ F + HCO (3) 515 232
Absorption cross-section data
Wavelength range/nm References Comments
200-340 Rattigan et al., 1994 (a)200–370 Meller and Moortgat, 1992 (b)
Comments
(a) The absorption spectrum of HC(O)F was studied using a purified sample of HC(O)F and recorded by diode array spec-troscopy with a resolution of 1.2 nm. The characteristic banded structure was recorded and the absolute cross-section at230 nm wasσ = 6.65× 10⁻²⁰ cm2 molecule−1 using this resolution. The cross-section was independent of temperaturein the range 233–318 K, in agreement with the earlier work of Giddings and Innes (1961).
(b) Measurements of the spectrum of HC(O)F at a resolution of 0.02 nm. The spectrum consists of a vibrational progressionof many sharp bands, with an origin of structured absorption at 268 nm and a maximum of intensity near 210 nm. Themaximum value ofσ = 1.5× 10⁻¹⁹ cm2 molecule−1 was observed at this resolution, which is in reasonable agreementwith the earlier work of Giddings and Innes (1961) who reported an absorption coefficient of approximately 501 mol−1
cm−1 (σ = 1.9× 10⁻¹⁹ cm2 molecule−1) at the maximum.
Quantum Yield Data
There are no reported quantum yield data. Klimeck and Berry (1973) have observed infrared laser emission from HF∗ followingflash photolysis of HC(O)F (λ >165 nm), indicating the occurrence of reactions (1) and/or (3). Reed et al. (1997) and Maul etal., (1999) have used H-atom photofragment translational spectroscopy in a pulsed molecular beam to study H atoms formedby channel (2) at∼ 243-247 nm.
www.atmos-chem-phys.net/8/4141/2008/ Atmos. Chem. Phys., 8, 4141–4496, 2008

4242 R. Atkinson et al.: Evaluated kinetic and photochemical data for atmospheric chemistry
Preferred Values
Absorption cross-sections for HC(O)F at 298 K
λnm 1020 σ /cm2 λ/nm 1020 σ /cm2 λ/nm 1020 σ /cm2
200 8.28 223 6.58 245 0.67201 9.75 224 4.94 246 0.72202 8.3 225 5.33 247 0.41203 7.55 226 4.00 248 0.48204 8.52 227 4.65 249 0.28205 10.15 228 4.43 250 0.21206 8.28 229 4.61 251 0.15207 7.41 230 3.57 252 0.24208 8.44 231 2.55 253 0.21209 9.55 232 3.16 254 0.07210 7.76 233 3.09 255 0.12211 7.36 234 2.98 256 0.07212 7.92 235 2.04 257 0.05213 8.56 236 2.28 258 0.04214 9.22 237 1.24 259 0.04215 7.67 238 1.71 260 0.04216 6.51 239 1.75 261 0.02217 7.38 240 1.55 262 0.02218 7.97 241 0.97 263 0.02219 6.28 242 1.19 264 0.02220 6.85 243 0.57 265 0.01221 5.7 244 0.76 266 0.01222 6.07
Quantum Yields for HC(O)F
No recommendation.
Comments on Preferred Values
The preferred values for the cross-sections are based on the data for the absolute absorption cross-sections reported by Mellerand Moortgat (1992). The listed values are averaged over 1 nm. The cross-sections of Rattigan et al. (1994) are higher thanthose of Meller and Moortgat (1992) by approximately a factor of 2 at 230 nm. Although the two studies are nominally atcomparable resolution, the Rattigan et al. (1994) spectrum does not appear to contain all the features reported by Meller andMoortgat (1992), indicating possible errors.
References
Giddings, L. K. and Innes, K. K.: J. Molecular Spectr. 6, 528, 1961.Klimeck, E. and Berry, M. J.: Chem. Phys. Lett. 20, 141, 1973.Maul, C., Dietrich, C., Haas, T., Gericke, K. -H., Tachikawa, H., Langford, S. R., Kono, M., Reed, D. L., Dixon, R. N. andAshfold, M. N. R. : Phys. Chem. Chem. Phys., 1, 767, 1999.Meller, R. and Moortgat, G.: ”Kinetics and Mechanisms for the Reactions of Halogenated Organic Compounds in theTroposphere,” Final Report to STEP-0004-C(EDB), 1992.Rattigan, O. V., Rowley, D. M., Wild, O., Jones, R. L. and Cox, R. A.: J. Chem. Soc. Faraday Trans., 90, 1818, 1994.Reed, C. K., Kono, M., Langford, S. R., Hancock, T. W. R., Dixon, R. N. and Ashfold, M. N. R.: J. Chem. Phys., 106, 6198,1997.
Atmos. Chem. Phys., 8, 4141–4496, 2008 www.atmos-chem-phys.net/8/4141/2008/

R. Atkinson et al.: Evaluated kinetic and photochemical data for atmospheric chemistry 4243
IV.A1.72
C(O)F2 + hν→ products
Primary photochemical transitions
Reaction 1H◦/kJ.mol−1 λthreshold /nm
C(O)F2 + hν → FCO + F (1) 562 213→ CO + 2F (2) 683 175→ CF2 + O(3P) (3) 700 171
Quantum yield data
Measurement Wavelength range/nm References Comments
81 = 0.94± 0.06 193 Nolle et al., 1992, 1999 (a)81 = 0.58± 0.05 210 Nolle et al., 1999 (b)81 = 0.57± 0.05 210 (b,c)81 = 0.07± 0.03 220 (b)81 = 0.11± 0.02 220 (b,c)
Comments
(a) Laser photolysis at 296-298 K with initial C(O)F2 pressures of 10-30 mbar. Because of the high concentrations of FCOradicals in the laser photolysis experiments, formation of C(O)F2 was assumed to occur via the reaction FCO + FCO→C(O)F2 + CO as observed in analogous experiments with C(O)FCl (Nolle et al., 1999). Therefore, the cited quantumyield is the measured value (0.47± 0.03) corrected for reformation of C(O)F2 from the FCO radical self-reaction.
(b) Photolysis at 298K using a medium pressure mercury lamp-monochromator combination, with initial C(O)F2 pressuresof 2.1–6.3 mbar. Because of the low concentrations of FCO radicals in these experiments, reformation of C(O)F2 from thereaction FCO + FCO→ C(O)F2 + CO was not anticipated to be significant, as confirmed by observations in analogousexperiments with C(O)FCl (Nolle et al., 1999). Therefore, the cited quantum yield is the measured value.
(c) With added N2 diluent gas at pressures of 600–1000 mbar.
Preferred Values
Absorption cross-sections for C(O)F2 photolysis at 298 K
λ/nm 1020 σ /cm2 λ/nm 1020 σ /cm2
186.0 5.5 205.1 0.74187.8 4.8 207.3 0.52189.6 4.2 209.4 0.40191.4 3.7 211.6 0.28193.2 3.1 213.9 0.20195.1 2.6 216.2 0.12197.0 2.1 218.6 0.081199.0 1.6 221.0 0.049201.0 1.3 223.5 0.035203.0 0.95 226.0 0.024
228.6 0.018
www.atmos-chem-phys.net/8/4141/2008/ Atmos. Chem. Phys., 8, 4141–4496, 2008

4244 R. Atkinson et al.: Evaluated kinetic and photochemical data for atmospheric chemistry
Quantum Yields for C(O)F2 Photolysis at 298 K
81 = 0.94 at 193 nm81 = 0.57 at 210 nm81 = 0.09 at 220 nm
Comments on Preferred Values
The preferred values of the absorption cross sections are those reported by Molina and Molina (1982) over the wavelength range184–199 nm and by Nolle et al. (1992) at longer wavelengths. The results of these two studies are in excellent agreement overthe range 200–208 nm; from 208–225 nm the results of Molina and Molina (1982) are 15–25% smaller than those of Nolleet al. (1992). The spectrum shows considerable structure; the values listed are averages over 500 cm−1 intervals. Nolle et al.(1992; 1999) photolyzed C(O)F2 at three wavelengths in the range 193–220 nm. The overall quantum yield for loss of C(O)F2,which must be through channel (1), decreases monotonically with increasing wavelength. In the absence of confirmatory data,the quantum yields measurd by Nolle et al. (1992; 1999) are recommended.
References
Molina, L. T. and Molina, M. J.: Results presented at the 182nd American Chemical Society National Meeting, New York,August 1982.Nolle, A., Heydtmann, H., Meller, R., Schneider, W. and Moortgat, G. K.: Geophys. Res. Lett. 19, 281, 1992.Nolle, A., Krumscheid, C. and Heydtmann, H.: Chem. Phys. Lett. 299, 561, 1999.
Atmos. Chem. Phys., 8, 4141–4496, 2008 www.atmos-chem-phys.net/8/4141/2008/

R. Atkinson et al.: Evaluated kinetic and photochemical data for atmospheric chemistry 4245
IV.A1.73
CF3CHO + hν→ products
Primary photochemical transitions
Reaction 1H◦/kJ.mol−1 λthreshold /nm
CF3CHO + hν → CF3 + HCO (1)→ CF3CO + H (2)→ CHF3 + CO (3)
Absorption cross-section data
Wavelength range/nm References Comments
230-360 Meller et al., 1993 (a)200–400 Sellevag et al., 2004 (b)
Quantum yield data
Measurement Wavelength range/nm References Comments
81 < 0.02 290-400 Sellevag et al., 2004 (c)
Comments
(a) Absolute absorption cross-sections were measured using a diode-array spectrometer over the temperature range 240–300K. The UV spectrum of trifluoroacetaldehyde shows a broad band, centered at 305 nm and extending out to 355 nm.Values ofσ were given at 5 nm intervals at 298 K.
(b) Absolute absorption cross-sections were measured using a diode-array spectrometer over the temperature range 298±2K, at a spectral resolution of 2 nm. The UV spectrum of trifluoroacetaldehyde shows a broad band, centered at∼300 nmand extending out to≥355 nm. Values ofσ were given at 5 nm intervals at 298 K.
(c) Photolysis of CF3CHO in pure air in the presence of an HO radical tracer (di-n-butyl ether) in the∼200 m3 EUPHOREchamber facility under natural sunlight conditions. The measured first-order loss rate of CF3CHO during a∼3 hr periodaround solar noon was 7.74× 10⁻⁶ s−1, essentially identical to the leak obtained from monitoring the decay of SF6. Aftercorrection for the leak rate and reaction with HO radicals, the calculated first-order loss rate of CF3CHO due to photolysisduring this∼3 hr period was<8.5× 10⁻⁷ s−1, compared to the calculated photolysis rate of 5.5× 10⁻⁵ s−1 using a unitquantum yield for photodissociation.
www.atmos-chem-phys.net/8/4141/2008/ Atmos. Chem. Phys., 8, 4141–4496, 2008
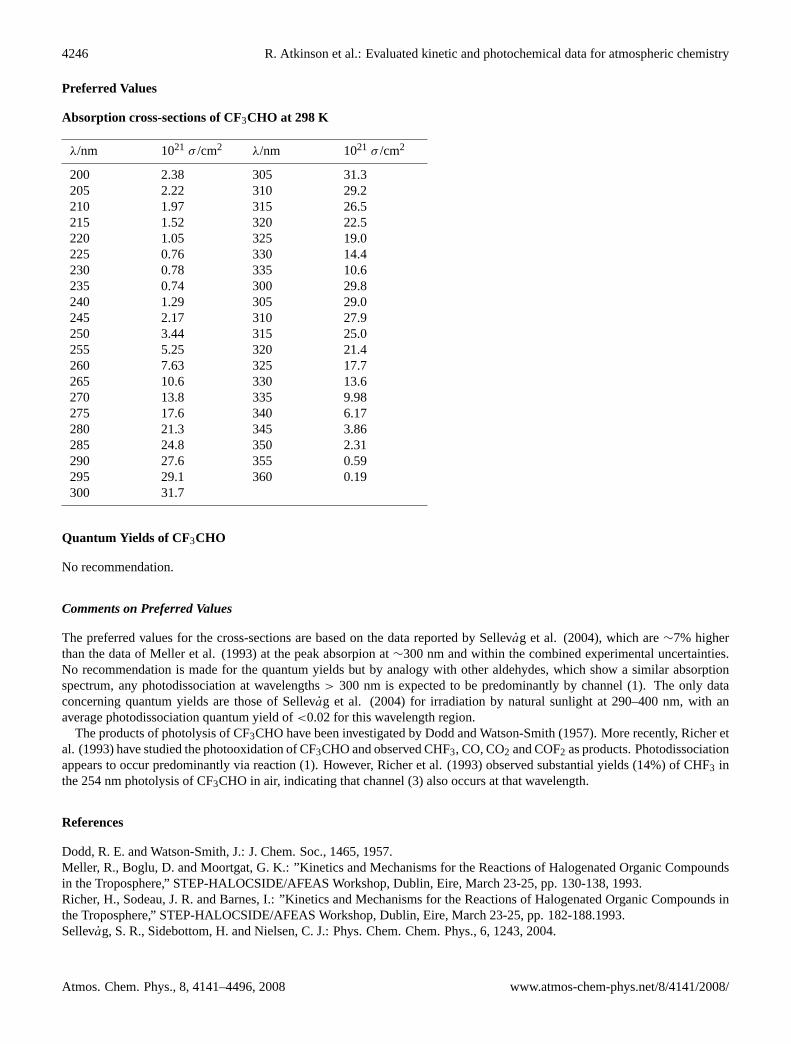
4246 R. Atkinson et al.: Evaluated kinetic and photochemical data for atmospheric chemistry
Preferred Values
Absorption cross-sections of CF3CHO at 298 K
λ/nm 1021 σ /cm2 λ/nm 1021 σ /cm2
200 2.38 305 31.3205 2.22 310 29.2210 1.97 315 26.5215 1.52 320 22.5220 1.05 325 19.0225 0.76 330 14.4230 0.78 335 10.6235 0.74 300 29.8240 1.29 305 29.0245 2.17 310 27.9250 3.44 315 25.0255 5.25 320 21.4260 7.63 325 17.7265 10.6 330 13.6270 13.8 335 9.98275 17.6 340 6.17280 21.3 345 3.86285 24.8 350 2.31290 27.6 355 0.59295 29.1 360 0.19300 31.7
Quantum Yields of CF3CHO
No recommendation.
Comments on Preferred Values
The preferred values for the cross-sections are based on the data reported by Sellevag et al. (2004), which are∼7% higherthan the data of Meller et al. (1993) at the peak absorpion at∼300 nm and within the combined experimental uncertainties.No recommendation is made for the quantum yields but by analogy with other aldehydes, which show a similar absorptionspectrum, any photodissociation at wavelengths> 300 nm is expected to be predominantly by channel (1). The only dataconcerning quantum yields are those of Sellevag et al. (2004) for irradiation by natural sunlight at 290–400 nm, with anaverage photodissociation quantum yield of<0.02 for this wavelength region.
The products of photolysis of CF3CHO have been investigated by Dodd and Watson-Smith (1957). More recently, Richer etal. (1993) have studied the photooxidation of CF3CHO and observed CHF3, CO, CO2 and COF2 as products. Photodissociationappears to occur predominantly via reaction (1). However, Richer et al. (1993) observed substantial yields (14%) of CHF3 inthe 254 nm photolysis of CF3CHO in air, indicating that channel (3) also occurs at that wavelength.
References
Dodd, R. E. and Watson-Smith, J.: J. Chem. Soc., 1465, 1957.Meller, R., Boglu, D. and Moortgat, G. K.: ”Kinetics and Mechanisms for the Reactions of Halogenated Organic Compoundsin the Troposphere,” STEP-HALOCSIDE/AFEAS Workshop, Dublin, Eire, March 23-25, pp. 130-138, 1993.Richer, H., Sodeau, J. R. and Barnes, I.: ”Kinetics and Mechanisms for the Reactions of Halogenated Organic Compounds inthe Troposphere,” STEP-HALOCSIDE/AFEAS Workshop, Dublin, Eire, March 23-25, pp. 182-188.1993.Sellevag, S. R., Sidebottom, H. and Nielsen, C. J.: Phys. Chem. Chem. Phys., 6, 1243, 2004.
Atmos. Chem. Phys., 8, 4141–4496, 2008 www.atmos-chem-phys.net/8/4141/2008/

R. Atkinson et al.: Evaluated kinetic and photochemical data for atmospheric chemistry 4247
IV.A1.74
CF3C(O)F + hν→ products
Primary photochemical transitions
Reaction 1H◦/kJ.mol−1 λthreshold /nm
CF3C(O)F + hν → CF3 + CFO (1)→ CF3CO + F (2)
Absorption cross-section data
Wavelength range/nm References Comments
200–300 Rattigan et al., 1993 (a)210–265 Meller et al., 1993 (b)
Quantum yield data
Measurement Wavelength range/nm References Comments
81 + 82 = 1.05± 0.05 254 Meller et al., 1993 (c)81 + 82 = 1.02± 0.05 240 Bierbrauer et al., 1999 (d)
Comments
(a) Absolute absorption cross sections were measured using a dual-beam diode array spectrometer over the temperaturerange 240-300 K. The UV spectrum of trifluoroacetyl fluoride shows a single band extending out to 300 nm, where thereis significant temperature dependance, Values ofσ were given at 5 nm intervals at 293 K and 238 K as well as temperaturecoefficients in the long wavelength tail atλ > 270nm.
(b) Absolute absorption cross sections were measured using a dual-beam diode array spectrometer at 298K. Cross sectionswere averaged over 1, 2 and 5 nm wavelength intervals.
(c) Average of 10 measurements of the overall loss of CF3C(O)F by photolysis in 1 atm air at 298 K, relative to the loss ofC(O)Cl2, for which8 = 1.
(d) Measurement of the overall loss of CF3C(O)F in the presence of O2 (0.67-6.7 mbar) at 298 K.
www.atmos-chem-phys.net/8/4141/2008/ Atmos. Chem. Phys., 8, 4141–4496, 2008

4248 R. Atkinson et al.: Evaluated kinetic and photochemical data for atmospheric chemistry
Preferred Values
Absorption cross-sections of CF3C(O)F at 293K and 238 K
λ/nm 1020 σ /cm2 1020 σ /cm2 103 B/K−1a
293K 238K
200 9.35 9.46 -0.21205 11.50 11.60 -0.16210 12.88 13.10 -0.31215 13.72 13.70 0.03220 13.39 13.10 0.40225 11.93 11.40 0.83230 9.75 9.11 1.23235 7.26 6.55 1.87240 4.93 4.18 2.99245 3.01 2.30 4.91250 1.67 1.16 6.60255 0.82 0.49 9.36260 0.35 0.18 12.40265 0.13 0.05 18.77270 0.04 0.01 26.36275 0.012 0.003 24.73280 0.004 0.001 23.32285 0.0016 0.0004 25.21290 0.0008 0.00295 0.0003 0.00
a ln σ (T ) = ln σ (293 K) + B(T -293).
Quantum Yields of CF3C(O)F at 298 K
81 + 82 = 1.0 over the wavelength range 200–300 nm.
Comments on Preferred Values
The preferred values for the cross-sections at 293 K are a simple average of the data reported by Rattigan et al. (1993) andMeller et al. (1993). The temperature dependence is based on the 238 K data of Rattigan et al. (1993). The quantum yield ofunity is based on the data of Meller et al. (1993) and of Bierbrauer et al. (1999), and is assumed to apply over the wavelengthregion 200–300 nm.
References
Bierbrauer, K. L., Chiappero, M. S., Malanca, F. E. and Argullo, G. A.: J. Photobiol. A: Chem., 122, 73, 1999.Meller, R., Boglu, D. and Moortgat, G. K.: ”Kinetics and Mechanisms for the Reactions of Halogenated Organic Compoundsin the Troposphere,” STEP-HALOCSIDE/AFEAS Workshop, Dublin, Eire, March 23-25, pp. 130-138, 1993.Rattigan, O. V., Wild, O., Jones, R. L. and Cox, R. A.: J. Photochem. Photobiol. A: Chem. 73, 1, 1993.
Atmos. Chem. Phys., 8, 4141–4496, 2008 www.atmos-chem-phys.net/8/4141/2008/

R. Atkinson et al.: Evaluated kinetic and photochemical data for atmospheric chemistry 4249
Appendix 2: ClOx Reactions
IV.A2.75
O(1D) + CHF2Cl → O(3P) + CHF2Cl (1)→ ClO + CHF2 (2)→ other products (3)
1H ◦(1) = -190 kJ·mol−1
1H ◦(2) = -92 kJ·mol−1
Rate coefficient data (k = k1 + k2 + k3)
k/cm3 molecule−1 s−1 Temp./K Reference Technique/Comments
Absolute Rate Coefficients(0.95± 0.3)× 10−10 173-343 Davidson et al., 1978 PLP (a)(1.08± 0.20)× 10−10 298 Warren et al., 1991 PLP-RF
Branching Ratiosk1/k= 0.28± 0.06 298 Warren et al., 1991 PLP-RF (b)k2/k= 0.55± 0.10 298 Addison et al., 1979 PLP-UVA (c)
Comments
(a) Pulsed laser photolysis of O3 at 266 nm. O(1D) atoms were monitored by time-resolved emission at 630 nm.
(b) Branching ratio was determined from the ratio of the O(3P) yield from O(1D) + CHF2Cl relative to that for O(1D) + N2.
(c) Quantitative yields of ClO were determined via the (5,0) band of the A2π ← X2π system.
Preferred Values
k = 1.0× 10⁻¹⁰ cm3 molecule−1 s−1 independent of temperature over the range 170-350 K.k1/k = 0.28 at 298 K.k2/k = 0.55 at 298 K.
Reliability
1 log k =± 0.1 over the temperature range 170-350 K.1 (k1/k) =± 0.1 at 298 K.1 (k2/k) =± 0.2 at 298 K.
Comments on Preferred Values
The preferred value ofk is based on the results of Davidson et al. (1978) and the room temperature value of Warren et al.(1991). The preferred value of the branching ratiok1/k is the value reported by Warren et al. (1991). The preferred value ofthe branching ratiok2/k is the value reported by Addison et al. (1979).
References
Addison, M. C., Donovan, R. J. and Garraway, J.: J. Chem. Soc. Faraday Discuss., 67, 286, 1979.Davidson, J. A., Schiff, H. I., Brown, T. J. and Howard, C. J.: J. Chem. Phys., 69, 4277, 1978.Warren, R., Gierczak, T. and Ravishankara, A. R.: Chem. Phys. Lett., 183, 403, 1991.
www.atmos-chem-phys.net/8/4141/2008/ Atmos. Chem. Phys., 8, 4141–4496, 2008

4250 R. Atkinson et al.: Evaluated kinetic and photochemical data for atmospheric chemistry
IV.A2.76
O(1D) + CHFCl2 → ClO + CHFCl (1)→ other products (2)
1H ◦(1) = -113 kJ·mol−1
Rate coefficient data (k = k1 + k2)
k/cm3 molecule−1 s−1 Temp./K Reference Technique/Comments
Absolute Rate Coefficients(1.9± 0.6)× 10−10 188-343 Davidson et al., 1978 PLP (a)
Branching Ratiosk1/k= 0.74± 0.15 298 Takahashi et al., 1996 PLP-LIF (b)
Comments
(a) Pulsed laser photolysis of O3 at 266 nm. O(1D) atoms were monitored by time-resolved emission at 630 nm.
(b) Branching ratio for ClO formation was determined by measurement of the LIF signal intensity of ClO normalized to thatfrom O(1D) + HCl.
Preferred Values
k = 1.9× 10⁻¹⁰ cm3 molecule−1 s−1 independent of temperature over the range 180-350 K.k1/k = 0.74 at 298 K.
Reliability
1 log k =± 0.3 over the temperature range 180–350 K.1 (k1/k) =± 0.2 at 298 K.
Comments on Preferred Values
The preferred value ofk is based on the results of Davidson et al. (1978). The preferred value of the branching ratiok1/k isbased on the results of Takahashi et al. (1996).
References
Davidson, J. A., Schiff, H. I., Brown, T. J. and Howard, C. J.: J. Chem. Phys., 69, 4277, 1978.Takahashi, K., Wada, R., Matsumi, Y. and Kawasaki, M.: J. Phys. Chem., 100, 10145, 1996.
Atmos. Chem. Phys., 8, 4141–4496, 2008 www.atmos-chem-phys.net/8/4141/2008/

R. Atkinson et al.: Evaluated kinetic and photochemical data for atmospheric chemistry 4251
IV.A2.77
O(1D) + CH3CF2Cl → O(3P) + CH3CF2Cl (1)→ other products (2)
1H ◦(1) = -190 kJ·mol−1
Rate coefficient data (k = k1 + k2)
k/cm3 molecule−1 s−1 Temp./K Reference Technique/Comments
Absolute Rate Coefficients(2.15± 0.20)× 10−10 298 Warren et al., 1991 PLP-RF
Branching Ratiosk1/k= 0.26± 0.05 298 Warren et al., 1991 PLP-RF (a)
Comments
(a) Branching ratio was determined from the ratio of the O(3P) yield from O(1D) + CH3CF2Cl relative to that for O(1D) +N2.
Preferred Values
k = 2.2× 10⁻¹⁰ cm3 molecule−1 s−1 at 298 K.k1/k = 0.26 at 298 K.
Reliability
1 log k =± 0.3 at 298 K.1 (k1/k) =± 0.1 at 298 K.
Comments on Preferred Values
The preferred value ofk and the preferred value of the branching ratiok1/k are based on the results of Warren etal. (1991).In these experiments, only O(3P) was monitored and therefore no direct information relating to the products of the chemicalreaction of O(1D) + CH3CF2Cl was obtained.
References
Warren, R., Gierczak, T. and Ravishankara, A. R.: Chem. Phys. Lett., 183, 403, 1991.
www.atmos-chem-phys.net/8/4141/2008/ Atmos. Chem. Phys., 8, 4141–4496, 2008

4252 R. Atkinson et al.: Evaluated kinetic and photochemical data for atmospheric chemistry
IV.A2.78
O(1D) + CH3CFCl2 → O(3P) + CH3CFCl2 (1)→ other products (2)
1H ◦(1) = -190 kJ·mol−1
Rate coefficient data (k = k1 + k2)
k/cm3 molecule−1 s−1 Temp./K Reference Technique/Comments
Absolute Rate Coefficients(2.58± 0.20)× 10−10 298 Warren et al., 1991 PLP-RF
Branching Ratiosk1/k= 0.31± 0.05 298 Warren et al., 1991 PLP-RF (a)
Comments
(a) Branching ratio was determined from the ratio of the O(3P) yield from O(1D) + CH3CFCl2 relative to that for O(1D) +N2.
Preferred Values
k = 2.6× 10⁻¹¹ cm3 molecule−1 s−1 at 298 K.k1/k = 0.31 at 298 K.
Reliability
1 log k =± 0.3 at 298 K.1 (k1/k) =± 0.1 at 298 K.
Comments on Preferred Values
The preferred value ofk and the preferred value of the branching ratiok1/k are based on the results of Warren et al. (1991),the only published study of this reaction. In these experiments, only O(3P) was monitored and therefore no direct informationrelating to the products of the chemical reaction of O(1D) + CH3CFCl2 was obtained.
References
Warren, R., Gierczak, T. and Ravishankara, A. R.: Chem. Phys. Lett., 183, 403, 1991.
Atmos. Chem. Phys., 8, 4141–4496, 2008 www.atmos-chem-phys.net/8/4141/2008/

R. Atkinson et al.: Evaluated kinetic and photochemical data for atmospheric chemistry 4253
IV.A2.79
O(1D) + CH2ClCF3 → O(3P) + CH2ClCF3 (1)→ other products (2)
1H ◦(1) = -190 kJ·mol−1
Rate coefficient data (k = k1 + k2)
k/cm3 molecule−1 s−1 Temp./K Reference Technique/Comments
Absolute Rate Coefficients(1.20± 0.06)× 10−10 298 Warren et al., 1991 PLP-RF
Branching Ratiosk1/k= 0.20± 0.05 298 Warren et al., 1991 PLP-RF (a)
Comments
(a) Branching ratio was determined from the ratio of the O(3P) yield from O(1D) + CH2ClCF3 relative to that for O(1D) +N2.
Preferred Values
k = 1.2× 10⁻¹⁰ cm3 molecule−1 s−1 at 298 K.k1/k = 0.20 at 298 K.
Reliability
1 log k =± 0.3 at 298 K.1 (k1/k) =± 0.1 at 298 K.
Comments on Preferred Values
The preferred value ofk and the preferred value of the branching ratiok1/k are based on the results of Warren et al. (1991).In these experiments, only O(3P) was monitored and therefore no direct information relating to the products of the chemicalreaction of O(1D) + CH2ClCF3 was obtained.
References
Warren, R., Gierczak, T. and Ravishankara, A. R.: Chem. Phys. Lett., 183, 403, 1991.
www.atmos-chem-phys.net/8/4141/2008/ Atmos. Chem. Phys., 8, 4141–4496, 2008

4254 R. Atkinson et al.: Evaluated kinetic and photochemical data for atmospheric chemistry
IV.A2.80
O(1D) + CH2ClCF2Cl → O(3P) + CH2ClCF2Cl (1)→ other products (2)
1H ◦(1) = -190 kJ·mol−1
Rate coefficient data (k = k1 + k2)
k/cm3 molecule−1 s−1 Temp./K Reference Technique/Comments
Absolute Rate Coefficientsk2 = (1.6± 0.6)× 10−10 297 Green and Wayne, 1976 RR (a)
Comments
(a) O(1D) produced by photolysis of NO2 at 229 nm.1(CH2ClCF2Cl)/1(N2O) monitored by IR absorption spectroscopy.Measured rate coefficient ratio ofk2/k(O(1D) + N2O) = 1.4± 0.3 is placed on an absolute basis by use ofk(O(1D) + N2O)= 1.16× 10⁻¹⁰ cm3 molecule−1 s−1 (IUPAC, current evaluation). The cited rate coefficient refers to chemical reactiononly and does not include physical quenching.
Preferred Values
k2 = 1.6× 10⁻¹⁰ cm3 molecule−1 s−1 at 298 K.
Reliability
1 log k =± 0.5 at 298 K.
Comments on Preferred Values
The preferred value ofk2 is derived from the relative rate results reported by Green and Wayne (1976) in the only publishedstudy of this reaction. It should be noted that this rate coefficient refers to chemical reaction only and does not include physicalquenching of O(1D).
References
Green, R. G. and Wayne, R. P.: J. Photochem., 6, 371, 1976.IUPAC: http://www.iupac-kinetic.ch.cam.ac.uk/, 2007.
Atmos. Chem. Phys., 8, 4141–4496, 2008 www.atmos-chem-phys.net/8/4141/2008/

R. Atkinson et al.: Evaluated kinetic and photochemical data for atmospheric chemistry 4255
IV.A2.81
O(1D) + CHFClCF3 → O(3P) + CHFClCF3 (1)→ other products (2)
1H ◦(1) = -190 kJ·mol−1
Rate coefficient data (k = k1 + k2)
k/cm3 molecule−1 s−1 Temp./K Reference Technique/Comments
Absolute Rate Coefficients(8.6± 0.4)× 10−11 298 Warren et al., 1991 PLP-RF
Branching Ratiosk1/k = 0.31± 0.10 298 Warren et al., 1991 PLP-RF (a)
Comments
(a) Branching ratio was determined from the ratio of the O(3P) yield from O(1D) + CHFClCF3 relative to that for O(1D) +N2.
Preferred Values
k = 8.6× 10⁻¹¹ cm3 molecule−1 s−1 at 298 K.k1/k = 0.31 at 298 K.
Reliability
1 log k =± 0.3 at 298 K.1 (k1/k) =± 0.2 at 298 K.
Comments on Preferred Values
The preferred value ofk and the preferred value of the branching ratiok1/k are based on the results of Warren et al. (1991),the only published study of this reaction. In these experiments, only O(3P) was monitored and therefore no direct informationrelating to the products of the chemical reaction of O(1D) + CHFClCF3 was obtained.
References
Warren, R., Gierczak, T. and Ravishankara, A. R.: Chem. Phys. Lett., 183, 403, 1991.
www.atmos-chem-phys.net/8/4141/2008/ Atmos. Chem. Phys., 8, 4141–4496, 2008

4256 R. Atkinson et al.: Evaluated kinetic and photochemical data for atmospheric chemistry
IV.A2.82
O(1D) + CHCl2CF3 → O(3P) + CHCl2CF3 (1)→ other products (2)
1H ◦(1) = -190 kJ·mol−1
Rate coefficient data (k = k1 + k2)
k/cm3 molecule−1 s−1 Temp./K Reference Technique/Comments
Absolute Rate Coefficients(1.98± 0.15)× 10−10 298 Warren et al., 1991 PLP-RF
Branching Ratiosk1/k = 0.21± 0.08 298 Warren et al., 1991 PLP-RF (a)
Comments
(a) Branching ratio was determined from the ratio of the O(3P) yield from O(1D) + CHCl2CF3 relative to that for O(1D) +N2.
Preferred Values
k = 2.0× 10⁻¹⁰ cm3 molecule−1 s−1 at 298 K.k1/k = 0.21 at 298 K.
Reliability
1 log k =± 0.3 at 298 K.1 (k1/k) =± 0.2 at 298 K.
Comments on Preferred Values
The preferred value ofk and the preferred value of the branching ratiok1/k are based on the results of Warren et al. (1991).In these experiments, only O(3P) was monitored and therefore no direct information relating to the products of the chemicalreaction of O(1D) + CHCl2CF3 was obtained.
References
Warren, R., Gierczak, T. and Ravishankara, A. R.: Chem. Phys. Lett.,183, 403, 1991.
Atmos. Chem. Phys., 8, 4141–4496, 2008 www.atmos-chem-phys.net/8/4141/2008/

R. Atkinson et al.: Evaluated kinetic and photochemical data for atmospheric chemistry 4257
IV.A2.83
O(1D) + CF2Cl2 → ClO + CF2Cl (1)→ O(3P) + CF2Cl2 (2)
1H ◦(1) = -123 kJ·mol−1
1H ◦(2) = -190 kJ·mol−1
Rate coefficient data (k = k1 + k2)
k/cm3 molecule−1 s−1 Temp./K Reference Technique/Comments
Absolute Rate Coefficients(1.45± 0.5)× 10−10 173-343 Davidson et al., 1978 PLP (a)(1.4± 0.2)× 10−10 298 Force and Wiesenfeld, 1981 PLP-RA
Branching Ratiosk2/k = 0.14± 0.07 298 Force and Wiesenfeld, 1981 PLP-RA (b)k1/k = 0.87± 0.18 298 Takahashi et al., 1996 PLP-LIF (c)k2/k = 0.19± 0.05 298 Takahashi et al., 1996 PLP-LIF (d)
Comments
(a) Pulsed laser photolysis of O3 at 266 nm. O(1D) atoms were monitored by time-resolved emission at 630 nm.
(b) O(1D) atoms were monitored by resonance absorption at 130.4 nm and compared to O(3P) atoms in the presence of ozonein He diluent where the O(3P) atom yield from the O(1D) + O3 reaction is 1.0.
(c) Branching ratio for ClO formation was determined by measurement of the LIF signal intensity of ClO normalized to thatfrom O(1D) + HCl.
(d) Branching ratio for quenching of O(1D) to O(3P) was determined by comparison of the VUV-LIF signal intensity forCF2Cl2 with that of N2.
Preferred Values
k = 1.4× 10⁻¹⁰ cm3 molecule−1 s−1 independent of temperature over the range 170–350 K.k1/k = 0.83 at 298 K.k2/k = 0.17 at 298 K.
Reliability
1 log k =± 0.1 over the temperature range 170–350 K.1 (k1/k) =± 0.17 at 298 K.1 (k2/k) =± 0.17 at 298 K.
Comments on Preferred Values
The preferred value ofk is based on the results of Davidson et al. (1978) and the room temperature result of Force andWiesenfeld (1981). The preferred value of the branching ratiok2/k is the average of the values reported by Force and Wiesenfeld(1981) and by Takahashi et al. (1996). The preferred value of the branching ratiok1/k was derived from the value reported byTakahashi et al. (1996), adjusted to make the sum of the two preferred branching ratios equal to unity.
www.atmos-chem-phys.net/8/4141/2008/ Atmos. Chem. Phys., 8, 4141–4496, 2008

4258 R. Atkinson et al.: Evaluated kinetic and photochemical data for atmospheric chemistry
References
Davidson, J. A., Schiff, H. I., Brown, T. J. and Howard, C. J.: J. Chem. Phys., 69, 4277, 1978.Force, A. P. and Wiesenfeld, J. R.: J. Phys. Chem., 85, 782, 1981.Takahashi, K., Wada, R., Matsumi, Y. and Kawasaki, M.: J. Phys. Chem., 100, 10145, 1996.
Atmos. Chem. Phys., 8, 4141–4496, 2008 www.atmos-chem-phys.net/8/4141/2008/

R. Atkinson et al.: Evaluated kinetic and photochemical data for atmospheric chemistry 4259
IV.A2.84
O(1D) + CFCl3 → ClO + CFCl2 (1)→ O(3P) + CFCl3 (2)
1H ◦(1) = -142 kJ·mol−1
1H ◦(2) = -190 kJ·mol−1
Rate coefficient data (k = k1 + k2)
k/cm3 molecule−1 s−1 Temp./K Reference Technique/Comments
Absolute Rate Coefficients(2.2± 0.7)× 10−10 173-343 Davidson et al., 1978 PLP (a)(2.4± 0.2)× 10−10 298 Force and Wiesenfeld, 1981 PLP-RA
Branching Ratiosk2/k = 0.13± 0.05 298 Force and Wiesenfeld, 1981 PLP-RA (b)k1/k = 0.88± 0.18 298 Takahashi et al., 1996 PLP-LIF (c)
Comments
(a) Pulsed laser photolysis of O3 at 266 nm. O(1D) atoms were monitored by time-resolved emission at 630 nm.
(b) O(1D) atoms were monitored by resonance absorption at 130.4 nm and compared to O(3P) atoms in the presence of ozonein He diluent where the O(3P) atom yield from the O(1D) + O3 reaction is 1.0.
(c) Branching ratio for ClO formation was determined by measurement of the LIF signal intensity of ClO normalized to thatfrom O(1D) + HCl.
Preferred Values
k = 2.3× 10⁻¹⁰ cm3 molecule−1 s−1 independent of temperature over the range 170–350 K.k1/k = 0.87 at 298 K.k2/k = 0.13 at 298 K.
Reliability
1 log k =± 0.1 over the temperature range 170–350 K.1 (k1/k) =± 0.13 at 298 K.1 (k2/k) =± 0.13 at 298 K.
Comments on Preferred Values
The preferred value ofk is based on the results of Davidson et al. (1978) and the room temperature result of Force andWiesenfeld (1981). The preferred value of the branching ratiok2/k is the value reported by Force and Wiesenfeld (1981). Thepreferred value of the branching ratiok1/k was derived from the value reported by Takahashi et al. (1996), adjusted to makethe sum of the two preferred branching ratios equal to unity.
www.atmos-chem-phys.net/8/4141/2008/ Atmos. Chem. Phys., 8, 4141–4496, 2008

4260 R. Atkinson et al.: Evaluated kinetic and photochemical data for atmospheric chemistry
References
Davidson, J. A., Schiff, H. I., Brown, T. J. and Howard, C. J.: J. Chem. Phys., 69, 4277, 1978.Force, A. P. and Wiesenfeld, J. R.: J. Phys. Chem., 85, 782, 1981.Takahashi, K., Wada, R., Matsumi, Y. and Kawasaki, M.: J. Phys. Chem., 100, 10145, 1996.
Atmos. Chem. Phys., 8, 4141–4496, 2008 www.atmos-chem-phys.net/8/4141/2008/

R. Atkinson et al.: Evaluated kinetic and photochemical data for atmospheric chemistry 4261
IV.A2.85
O(1D) + CCl4 → ClO + CCl3 (1)→ O(3P) + CCl4 (2)
1H ◦(1) = -170 kJ·mol−1
1H ◦(2) = -190 kJ·mol−1
Rate coefficient data (k = k1 + k2)
k/cm3 molecule−1 s−1 Temp./K Reference Technique/Comments
Absolute Rate Coefficients(3.1± 0.9)× 10−10 203-343 Davidson et al., 1978 PLP (a)(3.5± 0.3)× 10−10 298 Force and Wiesenfeld, 1981 PLP-RA
Branching Ratiosk2/k = 0.14± 0.06 298 Force and Wiesenfeld, 1981 PLP-RA (b)k1/k = 0.90± 0.19 298 Takahashi et al., 1996 PLP-LIF (c)
Comments
(a) Pulsed laser photolysis of O3 at 266 nm. O(1D) atoms were monitored by time-resolved emission at 630 nm.
(b) O(1D) atoms were monitored by resonance absorption at 130.4 nm and compared to O(3P) atoms in the presence of ozonein He diluent where the O(3P) atom yield from the O(1D) + O3 reaction is 1.0.
(c) Branching ratio for ClO formation was determined by measurement of the LIF signal intensity of ClO normalized to thatfrom O(1D) + HCl.
Preferred Values
k = 3.3× 10⁻¹⁰ cm3 molecule−1 s−1 independent of temperature over the range 200–350 K.k1/k = 0.88 at 298 K.k2/k = 0.12 at 298 K.
Reliability
1 log k =± 0.1 over the temperature range 200–350 K.1 (k1/k) =± 0.12 at 298 K.1 (k2/k) =± 0.12 at 298 K.
Comments on Preferred Values
The preferred value ofk is based on the results of Davidson et al. (1978) and the room temperature result of Force andWiesenfeld (1981). The preferred values of the branching ratios were derived from the values reported by Force and Wiesenfeld(1981) (k2/k) and by Takahashi et al. (1996) (k1/k), with both reported values being reduced slightly to make the sum of thetwo preferred branching ratios equal to unity.
www.atmos-chem-phys.net/8/4141/2008/ Atmos. Chem. Phys., 8, 4141–4496, 2008

4262 R. Atkinson et al.: Evaluated kinetic and photochemical data for atmospheric chemistry
References
Davidson, J. A., Schiff, H. I., Brown, T. J. and Howard, C. J.: J. Chem. Phys., 69, 4277, 1978.Force, A. P. and Wiesenfeld, J. R.: J. Phys. Chem., 85, 782, 1981.Takahashi, K., Wada, R., Matsumi, Y. and Kawasaki, M.: J. Phys. Chem., 100, 10145, 1996.
Atmos. Chem. Phys., 8, 4141–4496, 2008 www.atmos-chem-phys.net/8/4141/2008/

R. Atkinson et al.: Evaluated kinetic and photochemical data for atmospheric chemistry 4263
IV.A2.86
O(1D) + COFCl→ O(3P) + COFCl
1H ◦ (1) = -190 kJ·mol−1
Rate coefficient data
k/cm3 molecule−1 s−1 Temp./K Reference Technique/Comments
Absolute Rate Coefficients(3.7± 0.4)× 10−10 298 Fletcher and Husain, 1978 FP-RA (a)
Comments
(a) Flow system used, with O(1D) atoms being monitored by time-resolved resonance absorption at 115 nm. The data analysisused a modified Beer-Lambert law.
Preferred Values
k = 1.9× 10⁻¹⁰ cm3 molecule−1 s−1 at 298 K.
Reliability
1 log k =± 0.3 at 298 K.
Comments on Preferred Values
The preferred value is derived from the data of Fletcher and Husain (1978) by use of a scaling factor of 0.5. The weight ofevidence from many O(1D) rate studies suggests that O(1D) rates reported by Husain and co-workers contain a systematic error,and that these results can be made consistent with other O(1D) recommended values in this evaluation by use of this scalingfactor, as has been done in previous evaluations by the IUPAC Subcommittee on Gas Kinetic Data Evaluation for AtmosphericChemistry and by the NASA Panel for Data Evaluation. See also the discussion of this topic in Davidson et al. (1978).
References
Davidson, J. A., Schiff, H. I., Brown, T. J. and Howard, C. J.: J. Chem. Phys., 69, 4277, 1978.Fletcher, I. S. and Husain, D.: J. Photochem. 8, 355, 1978.
www.atmos-chem-phys.net/8/4141/2008/ Atmos. Chem. Phys., 8, 4141–4496, 2008
4264 R. Atkinson et al.: Evaluated kinetic and photochemical data for atmospheric chemistry
IV.A2.87
O(1D) + COCl2 → O(3P) + COCl2 (1)→ O(3P) + Cl2 + CO (2)→ other products (3)
1H ◦(1) = -190 kJ·mol−1
1H ◦(2) = -80 kJ·mol−1
Rate coefficient data (k = k1 + k2 + k3)
k/cm3 molecule−1 s−1 Temp./K Reference Technique/Comments
Absolute Rate Coefficients(2.6± 0.5)× 10−10 298 Chichinin, 1997 PLP-LMR2.04× 10−10 exp[(27± 10)/T ] 194-429 Strekowski et al., 2000 PLP-RF(2.22± 0.33)× 10−10 298
Branching Ratios(k1 + k2)/k = 0.20± 0.04 194-429 Strekowski et al., 2000 PLP-RF (a)
Comments
(a) Branching ratio for conversion of O(1D) to O(3P), i.e. (k1 + k2)/k was determined by comparison of the O(3P) yield fromO(1D) + COCl2 relative to that for O(1D) + N2.
Preferred Values
k = 2.2× 10⁻¹⁰ cm3 molecule−1 s−1 at 298 K.k = 2.0× 10⁻¹⁰ exp(25/T ) cm3 molecule−1 s−1 over the temperature range 190-430 K.(k1 + k2)/k = 0.20.
Reliability
1 log k =± 0.1 at 298 K.1 (E/R) =± 25 K.1 (k1 + k2)/k =± 0.10
Comments on Preferred Values
The preferred values ofk are based on the results reported by Strekowski et al. (2000). The room temperature value reportedby Chichinin et al. (1997) is 17% higher than the preferred value. The branching ratio (k1 + k2)/k is taken from Strekowskiet al. (2000). Jayanty et al. (1976) present evidence, based on high yields of CO, that the reaction channel to produce ClO +ClCO is very important.
References
Chichinin, A. I.: J. Chem. Phys. 106, 1057, 1997.Jayanty, R. K. M., Simonaitis, R. and Heicklen, J.: J. Photochem., 5, 217, 1976.Strekowski, R. S., Nicovich, J. M. and Wine, P. H.: Chem. Phys. Lett. 330, 354, 2000.
Atmos. Chem. Phys., 8, 4141–4496, 2008 www.atmos-chem-phys.net/8/4141/2008/

R. Atkinson et al.: Evaluated kinetic and photochemical data for atmospheric chemistry 4265
IV.A2.88
Cl + HC(O)Cl → HCl + ClCO
Rate coefficient data
k/cm3 molecule−1 s−1 Temp./K Reference Technique/Comments
Relative Rate Coefficients7.9× 10−13 305 Sanhueza and Heicklen, 1975 RR (a)(7.7± 1.0)× 10−13 298± 2 Niki et al., 1980 RR (b)8.3× 10⁻¹² exp(-705/T ) 266-321 Libuda et al., 1990 RR (c)7.8× 10⁻¹³ 2987.8× 10−12 exp(-720/T ) 222-296 Orlando, 1999 RR (d)7.0× 10⁻¹³ 298
Comments
(a) Rate coefficient ratios ofk(Cl + HC(O)Cl)/k(Cl + CH3Cl) = 1.85± 0.43 andk(Cl + HC(O)Cl)/k(Cl + CH2Cl2) = 1.66± 0.15 derived from the kinetic analysis of HC(O)Cl in Cl atom-sensitized oxidation of CH2Cl2 and CH3Cl. This wasplaced on an absolute basis by use ofk(Cl + CH3Cl) = 5.3× 10⁻¹³ cm3 molecule−1 s−1 andk(Cl + CH2Cl2) = 3.6×10⁻¹³ cm3 molecule−1 s−1 (IUPAC, current recommendation). The rate coefficient cited in the table is the average of thetwo values obtained, which however differ significantly.
(b) Rate coefficient ratio ofk(Cl + HC(O)Cl)/k(Cl + CH3Cl) = 1.6± 0.2 determined using FTIR absorption spectroscopyin irradiated Cl2-CH3Cl-O2-N2 mixtures at 933 mbar total pressure. The rate coefficient ratio was placed on an absolutebasis by use ofk(Cl + CH3Cl) = 4.8× 10⁻¹³ cm3 molecule−1 s−1 (IUPAC, current recommendation).
(c) Relative rate study. Cl atoms generated by the photolysis of Cl2 in Cl2-HC(O)Cl-CH4-N2 mixtures at 1000 mbar totalpressure. The concentrations of HC(O)Cl) and CH4 were measured by FTIR absorption spectroscopy (HC(O)Cl) and/orgas chromatography (CH4). Rate coefficient ratios were determined over the temperature range 265.8–321.3 K, andplaced on an absolute basis by use ofk(Cl + CH4) = 6.6× 10⁻¹² exp(-1240/T ) cm3 molecule−1 s−1 (IUPAC, currentrecommendation).
(d) Temperature dependent rate coefficient ratios ofk(Cl + HC(O)Cl)/k(Cl + CH2Cl2) were derived from the kinetic analysisof HC(O)Cl in Cl atom-sensitized oxidation of CH2Cl2. Placed on an absolute basis by use ofk(Cl + CH2Cl2) = 5.9×10⁻¹² exp(-850/T ) cm3 molecule−1 s−1 (IUPAC, current recommendation). The value ofk at 298 K was taken from theArrhenius expression presented.
Preferred Values
k = 7.5× 10⁻¹³ cm3 molecule−1 s−1 at 298 K.k = 8.1× 10⁻¹² exp(-710/T ) cm3 molecule−1 s−1 over the temperature range 220-330 K.
Reliability
1 log k =± 0.1 at 298 K.1 (E/R) =± 150 K.
Comments on Preferred Values
At 298 K, the rate coefficients of Niki et al. (1980), Libuda et al. (1990), and Orlando (1999) are in good agreement, and formthe basis of the recommendation at this temperature. The results of Sanhueza and Heicklen (1975) are also consistent with this
www.atmos-chem-phys.net/8/4141/2008/ Atmos. Chem. Phys., 8, 4141–4496, 2008

4266 R. Atkinson et al.: Evaluated kinetic and photochemical data for atmospheric chemistry
value. The recommended temperature dependence is based on the studies of Libuda et al. (1990) and Orlando (1999), whichare in excellent agreement. TheA-factor has been adjusted to reproduce the recommended value ofk at 298 K.
References
IUPAC: http://www.iupac-kinetic.ch.cam.ac.uk/, 2007.Libuda, H. G., Zabel, F., Fink, E. H. and Becker, K. H.: J. Phys. Chem., 94, 5860, 1990.Niki, H., Maker, P. D., Savage, C. M. and Breitenbach, L. P.: Int. J. Chem. Kinet., 12, 915, 1980.Orlando, J. J.: Int. J. Chem. Kinet., 31, 515, 1999.Sanhueza, E. and Heicklen, J.: J. Phys. Chem., 79, 7, 1975.
Atmos. Chem. Phys., 8, 4141–4496, 2008 www.atmos-chem-phys.net/8/4141/2008/

R. Atkinson et al.: Evaluated kinetic and photochemical data for atmospheric chemistry 4267
IV.A2.89
Cl + CH3OCl → Cl2 + CH3O (1)→ HCl + CH 2OCl (2)
1H ◦(1) = -39.7 kJ·mol−1
1H ◦(2) = -14.2 kJ·mol−1
Rate coefficient data (k = k1 + k2)
k/cm3 molecule−1 s−1 Temp./K Reference Technique/Comments
Absolute Rate Coefficients(6.0± 0.2)× 10−11 300 Kukui et al., 1997 DF-MS/LIF (a)
Relative Rate Coefficients(6.3± 0.1)× 10−11 295 Carl et al., 1996 RR (b)
Branching Ratiosk1/k = 0.8± 0.2 295 Carl et al., 1996 (c)k2/k = 0.2± 0.1 295k1/k = 0.85± 0.06 300 Kukui et al., 1997 DF-MS/LIF (a)
Comments
(a) Flow tube operated at 2.5 – 3.5 mbar of He. Cl and Cl2 monitored as their parent ions, CH3O was monitored by LIF, butnot quantified. The relative sensitivity of the MS to Cl and Cl2 was determined by titration of Cl to Cl2 via reaction withNOCl. Rate coefficients were obtained from the Cl decay in excess CH3OCl, and the branching ratio,k1/k, was derivedby numerical modeling of Cl loss and Cl2 production processes both in the desired reaction and secondary processes.
(b) Relative rates of removal of CH3OCl and C2H6 (reference reactant) monitored by FTIR in air and N2 bath gas at total pres-sure of 133 to 988 mbar. The valuek/k(Cl + C2H6) = 1.07± 0.02 was combined with the IUPAC (2007) recommendationfor k(Cl + C2H6) to yield the value fork listed in the table.
(c) Branching ratios determined by quantitative analysis of CH3OCl loss combined with HCl formation (FTIR experiments)and also by CH3OCl loss combined with Cl2 formation (UV experiments). The chemistry was initiated by photolysis ofCl2 or CH3OCl itself. The HCl formation was modeled to assess the effects of secondary reactions such as Cl + HCHO.
Preferred Values
k = 6.1× 10⁻¹¹ cm3 molecule−1 s−1 at 298 K.k1/k = 0.85 at 298 K.k2/k = 0.15 at 298 K.
Reliability
1 log k =± 0.1 at 298 K.1 (k1/k) =± 0.1 at 298 K.1 (k2/k) =± 0.1 at 298 K.
Comments on Preferred Values
The preferred values ofk(298 K) is an average of the absolute and relative rate experiments, which are in excellent agreement.A consistent result for the branching ratios also emerges from these studies, and the value obtained by Kukui et al. (1997) for
www.atmos-chem-phys.net/8/4141/2008/ Atmos. Chem. Phys., 8, 4141–4496, 2008

4268 R. Atkinson et al.: Evaluated kinetic and photochemical data for atmospheric chemistry
k1/k is adopted. The product analysis of Carl et al. (1996) provides confirmation of this result, and that channel (2) provides therest of the product formation. Theoretical work confirms the existence of these two reaction channels, and suggests comparableeffciencies at room temperature and dominance of hydrogen abstraction at higher temperatures (He et al., 2005).
References
Carl, S. A., Roehl, C. M., Muller, R., Moortgat, G. K. and Crowley, J. N.: J. Phys. Chem., 100, 17191, 1996.He, H.-Q., Liu, J.-Y., Li, Z.-S. and Sun, C.-C.: J. Comput. Chem., 26, 642, 2005.IUPAC: http://www.iupac-kinetic.ch.cam.ac.uk/, 2007.Kukui, A., Roggenbuck, J. and Schindler, R. N.: Ber. Bunsenges. Phys. Chem., 101, 281, 1997.
Atmos. Chem. Phys., 8, 4141–4496, 2008 www.atmos-chem-phys.net/8/4141/2008/

R. Atkinson et al.: Evaluated kinetic and photochemical data for atmospheric chemistry 4269
IV.A2.90
Cl + CH3F→ HCl + CH 2F
1H ◦ = -12.8 kJ·mol−1
Rate coefficient data
k/cm3 molecule−1 s−1 Temp./K Reference Technique/Comments
Absolute Rate Coefficients5.1× 10−12 exp[-(790± 45)/T ] 216-296 Manning and Kurylo, 1977 FP-RF (a)3.6× 10⁻¹³ 298(2.7± 0.2)× 10−13 298 Hitsuda et al., 2001 PLP-LIF (b)
Relative Rate Coefficients1.3× 10−11 exp(-1050/T ) 273-368 Tschuikow-Roux et al., 1988 RR (c)3.8× 10⁻¹³ 298(3.4± 0.7)× 10−13 298 Tuazon et al., 1992 RR (d)(3.24± 0.51)× 10−13 298 Wallington et al., 1992 RR (e)
Comments
(a) Cl atoms were formed by the photolysis of CCl4. The Arrhenius expression was derived by least squares fitting to tabulateddata, excluding those in which CH3F was excited by CO2 laser.
(b) Laser photolysis of HCl at 193 nm as Cl atom source. Both Cl(2P3/2) and Cl(2P1/2) were detected by VUV-LIF.
(c) Cl atoms were generated by the photolysis of Cl2. Product yield ratios were measured by GC. Derived values ofA/ACH4= (2.02± 0.01) and (E-ECH4)/R = (-190± 6) K are placed on an absolute basis usingk(Cl + CH4) = 6.6× 10⁻¹²
exp(-1240/T ) cm3 molecule−1 s−1 (IUPAC, current recommendation).
(d) Cl atoms were generated by the photolysis of Cl2. The decays of the reactant and reference organic were measured byFT-IR spectroscopy. The measured rate coefficient was placed on absolute basis by use ofk(Cl + CH4) = 1.0× 10⁻¹³
cm3 molecule−1 s−1 (IUPAC, current recommendation).
(e) Cl atoms were generated by the photolysis of Cl2. The decays of the reactant and reference organic were measured by IRabsorption. The measured rate coefficient was placed on an absolute basis by use of a rate coefficient ofk(Cl + CH4) =1.0× 10⁻¹³ cm3 molecule−1 s−1 (IUPAC, current recommendation).
Preferred Values
k = 3.5× 10⁻¹³ cm3 molecule−1 s−1 at 298 K.k = 4.0× 10⁻¹² exp(-730/T ) cm3 molecule−1 s−1 over the temperature range 240-370 K.
Reliability
1 log k =± 0.15 at 298 K.1 (E/R) =± 400 K.
www.atmos-chem-phys.net/8/4141/2008/ Atmos. Chem. Phys., 8, 4141–4496, 2008

4270 R. Atkinson et al.: Evaluated kinetic and photochemical data for atmospheric chemistry
Comments on Preferred Values
The recommended value at 298 K is based on an average of all the data at this temperature excepting that of Hitsuda et al.(2001) which is lower than the others. The recommended expression fork is derived by least squares fitting to the temperaturedependent data set of Manning and Kurylo (1977), which covers the atmospherically most relevant temperature range, andthe room temperature data of Tuazon et al. (1992) and Wallington et al. (1992). The rate coefficients of Tschuikow-Roux etal. (1988) show good agreement in the common temperature range but a slightly greater temperature dependence. A steepertemperature dependence at high temperatures has also been observed in an unpublished experimental study covering 200 to700 K, which was reported in the theoretical study of Rosenman and McKee (1997).
References
Hitsuda, K., Takahashi, K., Matsumi, Y. and Wallington, T. J.: J. Phys. Chem. A, 105, 5131, 2001.IUPAC: http://www.iupac-kinetic.ch.cam.ac.uk/, 2007.Manning, R. G. and Kurylo, M. J.: J. Phys. Chem., 81, 291, 1977.Rosenman, E. and McKee, M. L.: J. Am. Chem. Soc., 119, 9033, 1997.Tschuikow-Roux, E., Faraji, F., Paddison, S., Niedzielski, J. and Miyokawa, K.: J. Phys. Chem., 92, 1488, 1988.Tuazon, E. C., Atkinson, R. and Corchnoy, S. B.: Int. J. Chem. Kinet., 24, 639, 1992.Wallington, T. J., Ball, J. C., Nielsen, O. J. and Bartkiewicz, E.: J. Phys. Chem,. 96, 1241, 1992.
Atmos. Chem. Phys., 8, 4141–4496, 2008 www.atmos-chem-phys.net/8/4141/2008/

R. Atkinson et al.: Evaluated kinetic and photochemical data for atmospheric chemistry 4271
IV.A2.91
Cl + CH3Cl→ HCl + CH 2Cl
1H ◦ = -14.3 kJ·mol−1
Rate coefficient data
k/cm3 molecule−1 s−1 Temp./K Reference Technique/Comments
Absolute Rate Coefficients2.1× 10−10 exp[(-1790± 70)/T ] 300-604 Clyne and Walker, 1973 DF-MS5.4× 10−13 3003.4× 10−11 exp[(-1250± 60)/T ] 233-322 Manning and Kurylo, 1977 FP-RF(5.10± 0.14)× 10−13 296(4.4± 0.6)× 10−13 298 Beichert et al., 1995 DF-RF4.0× 10−14 T 0.92 exp(-795/T ) 300-843 Bryukov et al., 2002 DF-MS(5.2± 0.3)× 10−13 300
Relative Rate Coefficients(4.8± 0.4)× 10−13 295± 2 Wallington et al., 1990 RR (a)(4.7± 0.6)× 10−13 298 Beichert et al., 1995 RR (b)1.0× 10⁻¹¹ exp[-(915± 120)/T ] 222-298 Orlando, 1999 RR (c)4.7× 10⁻¹³ 298
Comments
(a) Cl atoms were generated from the photolysis of Cl2 in Cl2-CH3Cl-CH4 air mixtures at 930 mbar total pressure. Theconcentrations of CH3Cl and CH4 were monitored by FTIR absorption spectroscopy and a rate coefficient ratiok(Cl +CH3Cl)/k(Cl+CH4) = 4.79± 0.39 determined. This was placed on an absolute basis by use ofk(Cl + CH4) = 1.0× 10⁻¹³
cm3 molecule−1 s−1 (IUPAC, current recommendation).
(b) Cl atoms were generated from the photolysis of Cl2 in Cl2-CH3Cl-CH4 mixtures at atmospheric pressure of N2, air or Ar.The concentrations of CH3Cl and CH4 were monitored by GC and a rate coefficient ratiok(Cl + CH3Cl)/k(Cl+CH4) =4.65± 0.57 was determined. This was placed on an absolute basis by use ofk(Cl + CH4) = 1.0× 10⁻¹³ cm3 molecule−1
s−1 (IUPAC, current recommendation).
(c) Cl atoms were generated from the photolysis of Cl2 in Cl2-CH3Cl-CH4 mixtures at 930 mbar total pressure of O2-N2.The concentrations of CH3Cl and CH4 were monitored by FTIR absorption spectroscopy and a temperature dependentrate coefficient ratiok(Cl + CH3Cl)/k(Cl+CH4) determined. This was placed on an absolute basis by use ofk(Cl + CH4)= 6.6× 10⁻¹² exp(-1240/T ) cm3 molecule−1 s−1 (IUPAC, current recommendation). The results were consistent withthose obtained using CH3Br as reference reactant.
Preferred Values
k = 4.8× 10⁻¹³ cm3 molecule−1 s−1 at 298 K.k = 2.3× 10⁻¹¹ exp(-1150/T ) cm3 molecule−1 s−1 over the temperature range 220-360 K.
Reliability
1 log k =± 0.1 at 298 K.1 (E/R) =± 200 K.
www.atmos-chem-phys.net/8/4141/2008/ Atmos. Chem. Phys., 8, 4141–4496, 2008

4272 R. Atkinson et al.: Evaluated kinetic and photochemical data for atmospheric chemistry
Comments on Preferred Values
The results of all studies are in reasonable agreement at room temperature and below, though the data sets of Clyne andWalker (1973) and Bryukov et al. (2002) diverge significantly at higher temperatures. The preferred 298 K rate coefficientis the average of all studies at room temperature, excepting that of Clyne and Walker (1973). The temperature dependencewas derived by least squares fitting to the data of Manning and Kurylo (1977), Orlando (1999) and Bryukov et al. (2002) attemperatures below 360 K where these data sets are in very good agreement.
References
Beichert, P., Wingen, L., Lee, J., Vogt, R., Ezell, M. J., Ragains, M., Neavyn, R. and Finlayson-Pitts, B. J.: J. Phys. Chem., 99,13156, 1995.Bryukov, M. G., Slagle, I. R. and Knyazev, D.: J. Phys. Chem., A, 106, 10532, 2002.Clyne, M. A. A. and Walker, R. F.: J. Chem. Soc. Faraday Trans., 1, 69, 1547, 1973.IUPAC: http://www.iupac-kinetic.ch.cam.ac.uk/, 2007.Manning, R. G. and Kurylo, M. J.: J. Phys. Chem., 81, 291, 1977.Orlando, J. J.: Int. J. Chem. Kinet,. 31, 515, 1999.Wallington, T. J., Andino, J. M., Ball, J. C. and Japar, S. M.: J. Atmos. Chem., 10, 301, 1990.
Atmos. Chem. Phys., 8, 4141–4496, 2008 www.atmos-chem-phys.net/8/4141/2008/

R. Atkinson et al.: Evaluated kinetic and photochemical data for atmospheric chemistry 4273
IV.A2.92
Cl + CH2F2→ HCl + CHF 2
1H ◦ = 0.5 kJ·mol−1
Rate coefficient data
k/cm3 molecule−1 s−1 Temp./K Reference Technique/Comments
Relative Rate Coefficients1.0× 10−11 exp(-1470/T ) 281-368 Tschuikow-Roux et al., 1985 RR (a)7.3× 10⁻¹⁴ 298(3.2± 0.2)× 10−14 295 Nielsen et al., 1992 RR (b)
Comments
(a) Cl atoms were generated by the photolysis of Cl2. Product yield ratios were measured by GC. Derived values ofA/ACH4=(1.51± 0.06) and (E-ECH4)/R = (228± 12) K were placed on an absolute basis usingk(Cl + CH4) = 6.6× 10⁻¹²
exp(-1240/T ) cm3 molecule−1 s−1 (IUPAC, current recommendation).
(b) Photolysis of Cl2 in presence of CH2F2 and CH4 in 920 mbar air or N2 bath gas. The value obtained,k/CH2F2)/k(CH4)= 0.32± 0.02 was placed on an absolute value usingk(Cl + CH4) = 1.0× 10⁻¹³ cm3 molecule−1 s−1 (IUPAC, currentrecommendation).
Preferred Values
k = 5.0× 10⁻¹⁴ cm3 molecule−1 s−1 at 298 K.k = 7.0× 10⁻¹² exp(-1470/T ) cm3 molecule−1 s−1 over the temperature range 280-370 K.
Reliability
1 log k =± 0.5 at 298 K.1 (E/R) =± 500 K.
Comments on Preferred Values
The recommended value at 298 K is an average of the two studies reported above. The temperature dependence is based onthe study of Tschuikow-Roux et al. (1985), with theA-factor adjusted to reproduce the recommended value ofk at 298 K. Thelarge error limits ink andE/R reflect the poor agreement between these studies.
References
IUPAC: http://www.iupac-kinetic.ch.cam.ac.uk/, 2007.Nielsen, O. J., Ellermann, T., Bartkiewicz, E., Wallington, T. J. and Hurley, M. D.: Chem Phys. Lett., 192, 82, 1992.Tschuikow-Roux, E., Yano, T. and Niedzielski, J.: J. Chem. Phys., 82, 65, 1985.
www.atmos-chem-phys.net/8/4141/2008/ Atmos. Chem. Phys., 8, 4141–4496, 2008

4274 R. Atkinson et al.: Evaluated kinetic and photochemical data for atmospheric chemistry
IV.A2.93
Cl + CH2FCl→ HCl + CHFCl
Rate coefficient data
k/cm3 molecule−1 s−1 Temp./K Reference Technique/Comments
Relative Rate Coefficients1.2× 10−11 exp(-1230/T ) 273-368 Tschuikow-Roux et al., 1988 RR (a)1.9× 10⁻¹³ 298(1.10± 0.25)× 10−13 298 Tuazon et al., 1992 RR (b)
Comments
(a) Cl atoms were generated by the photolysis of Cl2. Product yield ratios were measured by GC, and the measured ratecoefficient ratio was placed on an absolute basis by use of a rate coefficient ofk(Cl + CH4) = 9.6× 10⁻¹² exp(-1240/T )cm3 molecule−1 s−1 (IUPAC, current recommendation).
(b) Cl atoms were generated by photolysis of Cl2. The decays of the reactant and reference organic were measured by FTIRspectroscopy. The measured rate coefficient is placed on absolute basis by use of a rate coefficient ofk(Cl + CH4) = 1.0× 10⁻¹³ cm3 molecule−1 s−1 (IUPAC, current recommendation).
Preferred Values
k = 1.1× 10⁻¹³ cm3 molecule−1 s−1 at 298 K.k = 7.0× 10⁻¹² exp(-1230/T ) cm3 molecule−1 s−1 over the temperature range 270-370 K.
Reliability
1 log k =± 0.3 at 298 K.1 (E/R) =± 500 K.
Comments on Preferred Values
The recommended value is based on the room temperature results of Tuazon et al. (1992) and the temperature dependencereported by Tschuikow-Roux et al. (1988).
References
IUPAC: http://www.iupac-kinetic.ch.cam.ac.uk/, 2007.Tschuikow-Roux, E., Faraji, F., Paddison, S., Niedzielski, J. and Miyokawa, K.: J. Phys. Chem., 92, 1488, 1988.Tuazon, E. C., Atkinson, R. and Corchnoy, S. B.: Int. J. Chem. Kinet., 24, 639, 1992.
Atmos. Chem. Phys., 8, 4141–4496, 2008 www.atmos-chem-phys.net/8/4141/2008/

R. Atkinson et al.: Evaluated kinetic and photochemical data for atmospheric chemistry 4275
IV.A2.94
Cl + CH2Cl2→ HCl + CHCl 2
1H ◦ = -19.9 kJ·mol−1
Rate coefficient data
k/cm3 molecule−1 s−1 Temp./K Reference Technique/Comments
Absolute Rate Coefficients(5.5± 0.5)× 10−13 298 Davis et al., 1970 FP-RF8.6× 10−11 exp[-(1450± 60)/T ] 298-621 Clyne and Walker, 1973 DF-MS6.4× 10−13 298(3.2± 0.2)× 10−13 298 Beichert et al., 1995 DF-RF1.48× 10−16 T 1.58 exp(-360)/T ) 296-790 Bryukov et al., 2002 DF-RF(3.5± 0.2)× 10−13 297
Relative Rate Coefficients(3.65± 0.39)× 10−13 298 Niki et al., 1980 RR (a)1.9× 10⁻¹¹ exp(-1190)/T ) 273-368 Tschuikow-Roux et al., 1988 RR (b)3.5× 10⁻¹³ 298(3.45± 0.18)× 10−13 298 Beichert et al., 1995 RR (c)(3.51± 0.14)× 10−13 298 Catoire et al., 1996 RR (d)4.4× 10⁻¹² exp(-770)/T ) 222-298 Orlando, 1999 RR (e)3.2× 10⁻¹³
Comments
(a) Relative to Cl + CH3Cl. Cl atoms were generated by the photolysis of Cl2 in the presence of CH2Cl2 and CH3Cl in airat 930 mbar and the concentrations of CH2Cl2 and CH4 measured by FTIR. The measured rate coefficient ratio ofk(Cl+ CH2Cl2)/k(Cl + CH3Cl) = (0.76± 0.08) was placed on an absolute basis usingk(Cl + CH3Cl) = 4.8× 10⁻¹³ cm3
molecule−1 s−1 (IUPAC, current recommendation).
(b) Cl atoms were generated by the photolysis of Cl2 at 424 nm, and the concentrations of CH2Cl2 and CH3Cl measured byGC. The measured rate coefficient ratio ofk(Cl + CH2Cl2)/k(Cl + CH4) = (2.81± 0.02) exp[-(49± 2)/T ] is placed onan absolute basis by using the rate coefficient ofk(Cl + CH4) = 6.6× 10⁻¹² exp(-1240/T ) cm3 molecule−1 s−1 (IUPAC,current recommendation).
(c) Cl atoms were generated from the photolysis of Cl2 in Cl2-CH2Cl2-CH4 mixtures at atmospheric pressure of N2, air or Ar.The concentrations of CH3Cl and CH4 were monitored by GC and a rate coefficient ratiok(Cl + CH2Cl2)/k(Cl+CH4) =3.45± 0.18 was determined. This was placed on an absolute basis by use ofk(Cl + CH4) = 1.0× 10⁻¹³ cm3 molecule−1
s−1 (IUPAC, current recommendation).
(d) Cl atoms were generated from the photolysis of Cl2 in Cl2-CH2Cl2-CH4 in air at 930 mbar total pressure. The relativeremoval rates of CH2Cl2 and CH4 were measured by FTIR. A rate coefficient ratiok(Cl + CH2Cl2)/k(Cl+CH4) = 3.51±0.14 was obtained and placed on an absolute basis by use ofk(Cl + CH4) = 1.0× 10⁻¹³ cm3 molecule−1 s−1 (IUPAC,current recommendation).
(e) Cl atoms were generated from the photolysis of Cl2 in Cl2-CH3Cl-CH4 mixtures at 930 mbar total pressure of O2-N2.The concentrations of CH3Cl and CH4 were monitored by FTIR absorption spectroscopy and a temperature dependentrate coefficient ratiok(Cl + CH2Cl2)/k(Cl+CH4) determined. This was placed on an absolute basis by use ofk(Cl + CH4)= 6.6× 10⁻¹² exp(-1240/T ) cm3 molecule−1 s−1 (IUPAC, current recommendation). The results were consistent withthose obtained using CH3Br as reference reactant.
www.atmos-chem-phys.net/8/4141/2008/ Atmos. Chem. Phys., 8, 4141–4496, 2008

4276 R. Atkinson et al.: Evaluated kinetic and photochemical data for atmospheric chemistry
Preferred Values
k = 3.4× 10⁻¹³ cm3 molecule−1 s−1 at 298 K.k = 5.9× 10⁻¹² exp(-850/T ) cm3 molecule−1 s−1 over the temperature range 220-400 K.
Reliability
1 log k =± 0.1 at 298 K.1 (E/R) =± 200 K.
Comments on Preferred Values
With the exception of the results of Davis et al. (1970) and Clyne and Walker (1973), the remaining 7 studies at roomtemperature are consistent with a value of (3.4± 0.3)× 10−13 cm3 molecule−1 s−1. Note, that for reaction with CH4, boththe room temperature rate coefficients of Davis et al. (1970) and Clyne and Walker (1973) and the temperature dependenceof Clyne and Walker (1973) are higher than recommended values, indicating possible systematic errors in these studies. Thetemperature dependent rate coefficients of Orlando (1999) and Bryukov et al. (2002) are in good agreement at temperaturesless than≈ 400 K. The preferred temperature dependence is taken from a least squares fit to these two data sets between 400and 220 K, and has been adjusted to reproduce the recommended value ofk at 298 K. Curvature in the Arrhenius plot makesextrapolation beyond this temperature range problematic, hence use of the 3-parameter fit of Bryukov et al. (2002) to covertemperatures up to 800 K.
References
Beichert, P., Wingen, L., Lee, J., Vogt, R., Ezell, M. J., Ragains, M., Neavyn, R. and Finlayson-Pitts, B. J.: J. Phys. Chem., 99,13156, 1995.Bryukov, M. G., Slagle, I. R. and Knyazev, D.: J. Phys. Chem. A, 106, 10532, 2002.Catoire, V., Lesclaux, R., Schneider, W. F. and Wallington, T. J.: J. Phys. Chem., 100, 14356, 1996.Clyne, M. A. A. and Walker, R. F.: J. Chem. Soc. Faraday Trans., 1, 69, 1547, 1973.Davis, D. D., Braun, W. and Bass, A. M.: Int. J. Chem. Kinet., 2, 101, 1970.IUPAC: http://www.iupac-kinetic.ch.cam.ac.uk/, 2007.Niki, H., Maker, P. D., Savage, C. M. and Breitenbach, L. P.: Int. J. Chem. Kinet., 12, 1001, 1980.Orlando, J. J.: Int. J. Chem. Kinet., 31, 515, 1999.Tschuikow-Roux, E., Faraji, F., Paddison, S., Niedzielski, J. and Miyokawa, K.: J. Phys. Chem., 92, 1488, 1988.
Atmos. Chem. Phys., 8, 4141–4496, 2008 www.atmos-chem-phys.net/8/4141/2008/

R. Atkinson et al.: Evaluated kinetic and photochemical data for atmospheric chemistry 4277
IV.A2.95
Cl + CHF2Cl→ HCl + CF2Cl
1H ◦ = -9.0 kJ·mol−1
Rate coefficient data
k/cm3 molecule−1 s−1 Temp./K Reference Technique/Comments
Absolute Rate Coefficients(1.7± 0.2)× 10−15 297 Sawerysyn et al., 1992 DF-MS5.3× 10−12 exp[-(2430± 90)/T ] 298-430 Talhaoui et al., 1996 DF-MS(1.4± 0.3)× 10−15 296
Relative Rate Coefficients(2.0± 0.4)× 10−15 298 Tuazon, et al., 1992 RR (a)
Comments
(a) Cl atoms were generated by photolysis of Cl2. The decays of the reactant and reference organic were measured by FTIRspectroscopy. The measured rate coefficient was placed on an absolute basis by use of a rate coefficient ofk(Cl + CH4) =1.0× 10⁻¹³ cm3 molecule−1 s−1 (IUPAC, current recommendation).
Preferred Values
k = 1.7× 10⁻¹⁵ cm3 molecule−1 s−1 at 298 K.k = 5.9× 10⁻¹² exp(-2430/T ) cm3 molecule−1 s−1 over the temperature range 290-430 K.
Reliability
1 log k =± 0.15 at 298 K.1 (E/R) =± 400 K.
Comments on Preferred Values
The preferred value at 298 K is based on the absolute study of Talhaoui et al. (1996) and the relative rate measurement ofTuazon et al. (1992), which are in reasonable agreement. The work of Talhaoui et al. (1996) is assumed to supersede that ofSawerysyn et al. (1992). The recommended temperature dependence is based on the results of Talhaoui et al. (1996), withexpanded error limits to reflect the fact that this is the only study ofk(T). TheA-factor has been adjusted to reproduce the valueof k at 298 K.
References
IUPAC: http://www.iupac-kinetic.ch.cam.ac.uk/, 2007.Sawerysyn, J. P., Talhaoui, A., Meriaux, B. and Devolder, P.: Chem. Phys. Lett., 198, 197, 1992.Talhaoui, A., Louis, F., Meriaux, B., Devolder, P. and Sawerysyn, J. P.: J. Phys. Chem., 100, 2107, 1996.Tuazon, E. C., Atkinson, R. and Corchnoy, S. B.: Int. J. Chem. Kinet., 24, 639, 1992.
www.atmos-chem-phys.net/8/4141/2008/ Atmos. Chem. Phys., 8, 4141–4496, 2008

4278 R. Atkinson et al.: Evaluated kinetic and photochemical data for atmospheric chemistry
IV.A2.96
Cl + CHFCl 2→ HCl + CFCl 2
1H ◦ = -17.8 kJ·mol−1
Rate coefficient data
k/cm3 molecule−1 s−1 Temp./K Reference Technique/Comments
Absolute Rate Coefficients5.2× 10−12 exp[-(1675± 60)/T ] 298-430 Talhaoui et al., 1996 DF-MS(1.9± 0.3)× 10−14 296
Relative Rate Coefficients(1.0± 0.2)× 10−14 294 Glavas and Heicklen, 1985 RR (a)(2.1± 0.4)× 10−14 298 Tuazon et al., 1992 RR (b)
Comments
(a) Steady-state photolysis of Cl2-CHFCl2-O2-NO-NO2-N2 mixtures. The measured rate coefficient ratio is placed on abso-lute basis by use of a rate coefficient ofk(Cl + NO + M) = 1.0× 10⁻³¹ cm6 molecule−2 s−1.
(a) Cl atoms were generated by the photolysis of Cl2. The decays of the reactant and reference organic were measured byFTIR spectroscopy. The measured rate coefficient was placed on absolute basis by use of a rate coefficient ofk(Cl + CH4)= 1.0× 10⁻¹³ cm3 molecule−1 s−1 (IUPAC, current recommendation).
Preferred Values
k = 2.0× 10⁻¹⁴ cm3 molecule−1 s−1 at 298 K.k = 5.5× 10⁻¹² exp(-1675/T ) cm3 molecule−1 s−1 over the temperature range 290-430 K.
Reliability
1 log k =± 0.2 at 298 K.1 (E/R) =± 400 K.
Comments on Preferred Values
The preferred value at 298 K is based on the absolute study of Talhaoui et al. (1996) and the relative rate study of Tuazon etal. (1992). These results are preferred over the earlier, less direct results of Glavas and Heicklen (1985). The recommendedtemperature dependence is based on the results of Talhaoui et al. (1996), with expanded error limits to reflect the fact that thisis the only study ofk(T). TheA-factor has been adjusted to reproduce the recommended value ofk at 298 K.
References
Glavas, S. and Heicklen, J.: J. Photochem., 31, 21, 1985.IUPAC: http://www.iupac-kinetic.ch.cam.ac.uk/, 2007.Talhaoui, A., Louis, F., Meriaux, B., Devolder, P. and Sawerysyn, J. P.: J. Phys. Chem., 100, 2107, 1996.Tuazon, E. C., Atkinson, R. and Corchnoy, S. B.: Int. J. Chem. Kinet., 24, 639, 1992.
Atmos. Chem. Phys., 8, 4141–4496, 2008 www.atmos-chem-phys.net/8/4141/2008/

R. Atkinson et al.: Evaluated kinetic and photochemical data for atmospheric chemistry 4279
IV.A2.97
Cl + CHCl 3→ HCl + CCl 3
1H ◦ = -39.2 kJ·mol−1
Rate coefficient data
k/cm3 molecule−1 s−1 Temp./K Reference Technique/Comments
Absolute Rate Coefficients1.45× 10−11 exp[-(1379± 44)/T ] 297-652 Clyne and Walker, 1973 DF-MS(1.47± 0.35)× 10−13 297(3.7± 1.0)× 10−13 298 Jeoung et al., 1991 (a)(1.1± 0.1)× 10−13 298 Beichert et al., 1995 DF-RF8.0× 10−12 exp[-(1390± 80)/T ] 298-430 Talhaoui et al., 1996 DF-MS(7.6± 1.3)× 10−14 2981.19× 10−16 T 1.51 exp(-571/T ) 297-854 Bryukov et al., 2002 DF-RF(8.9± 0.9)× 10−14 297
Relative Rate Coefficients1.9× 10−12 exp(-980/T ) 286-593 Knox, 1962 RR (b,c)6.9× 10⁻¹⁴ 2986.0× 10−12 exp(-1283/T ) 240-593 Knox, 1962 RR (b,d)8.1× 10⁻¹⁴ 298(1.13± 0.07)× 10−13 298 Beichert et al., 1995 RR (e)(1.19± 0.13)× 10−13 298 Brahan et al., 1996 RR (f)(1.1± 0.1)× 10−13 298 Catoire et al., 1996 RR (g)2.5× 10⁻¹² exp(-915/T ) 222-298 Orlando, 1999 RR (h)1.15× 10⁻¹³ 298
Comments
(a) Very low pressure reactor with chemiluminescence and mass spectrometric detection. The reaction of Cl with CHCl3 wasstudied as part of a complex chemical system.
(b) Cl atoms were generated by photolysis of Cl2 in Cl2-CHCl3-CH4 or Cl2-CHCl3-CH3Cl mixtures. Organic reactants andproducts monitored by GC.
(c) Rate coefficient ratio ofk(Cl + CHCl3)/k(Cl + CH4) = 0.286 exp(259/T ) was obtained and placed on an absolute basis byuse ofk(Cl + CH4) = 6.6× 10⁻¹² exp(-1240/T ) cm3 molecule−1 s−1 (IUPAC, current recommendation).
(d) Rate coefficient ratio ofk(Cl + CHCl3)/k(Cl + CH3Cl) = 0.26 exp(-133/T ) obtained, and placed on an absolute basis byuse ofk(Cl + CH3Cl) = 2.3× 10⁻¹¹ exp(-1150/T ) cm3 molecule−1 s−1 (IUPAC, current recommendation).
(e) Cl atoms were generated from the photolysis of Cl2 in Cl2-CHCl3-CH4 mixtures at atmospheric pressure of N2, air or Ar.The concentrations of CHCl3 and CH4 were monitored by GC and a rate coefficient ratiok(Cl + CHCl3)/k(Cl+CH4) =1.13± 0.07 was determined. This was placed on an absolute basis by use ofk(Cl + CH4) = 1.0× 10⁻¹³ cm3 molecule−1
s−1 (IUPAC, current recommendation).
(f) Cl atoms were generated by photolysis of Cl2 in Cl2-CHCl3-CH4 or Cl2-CHCl3-CH3Cl mixtures in an air or N2 bath gasat 1023 mbar total pressure and 298 K. Rate coefficient ratiosk(Cl + CHCl3)/k(Cl+CH4) andk(Cl + CHCl3)/k(Cl+CH3Cl)were placed on an absolute basis by use ofk(Cl + CH4) = 1.0× 10⁻¹³ cm3 molecule−1 s−1 andk(Cl + CH4) = 4.8× 10⁻¹³
cm3 molecule−1 s−1(IUPAC, current recommendation). The value presented in the table is the average of experimentsusing both CH4 and CH3Cl as reference reactants.
www.atmos-chem-phys.net/8/4141/2008/ Atmos. Chem. Phys., 8, 4141–4496, 2008

4280 R. Atkinson et al.: Evaluated kinetic and photochemical data for atmospheric chemistry
(g) Cl atoms were generated from the photolysis of Cl2 in Cl2-CHCl3-CH4 mixtures at 930 mbar total pressure of air. Therelative removal rates of CH2Cl2 and CH4 were measured by FTIR. A rate coefficient ratiok(Cl + CHCl3)/k(Cl+CH4)= 1.1± 0.1 was obtained and placed on an absolute basis by use ofk(Cl + CH4) = 1.0× 10⁻¹³ cm3 molecule−1 s−1
(IUPAC, current recommendation).
(h) Cl atoms were generated from the photolysis of Cl2 in Cl2-CHCl3-CH4 mixtures at 930 mbar total pressure of O2-N2.The concentrations of CHCl3 and CH4 were monitored by FTIR absorption spectroscopy and a temperature dependentrate coefficient ratiok(Cl + CHCl3)/k(Cl+CH4) determined. This was placed on an absolute basis by use ofk(Cl + CH4)= 6.6× 10⁻¹² exp(-1240/T ) cm3 molecule−1 s−1 (IUPAC, current recommendation). The results were consistent withthose obtained using CH3Br as reference reactant
Preferred Values
k = 1.1× 10⁻¹³ cm3 molecule−1 s−1 at 298 K.k = 2.4× 10⁻¹² exp(-920/T ) cm3 molecule−1 s−1 over the temperature range 220-500 K.
Reliability
1 log k =± 0.2 at 298 K.1 (E/R) =± 400 K.
Comments on Preferred Values
The absolute rate constants of Beichert et al. (1995) and Bryukov et al. (2002), and the relative rate constants of Beichert et al.(1995), Brahan et al. (1996), Catoire et al. (1996) and Orlando (1999) are in good agreement. The 298 K recommendation is anaverage result from these studies. The temperature dependent data of Orlando (1999) and Bryukov et al. (2002) are reasonablywell described by the expression for 220 K< T < 500 K given above, which has been adjusted to give the recommended valueof k at 298 K. For extrapolation to higher temperatures, an expression of the formk = AT n exp (E/RT ) as given by Bryukovet al (2002) is suitable.
References
Beichert, P., Wingen, L., Lee, J., Vogt, R., Ezell, M. J., Ragains, M., Neavyn, R. and Finlayson-Pitts, B. J.: J. Phys. Chem., 99,13156, 1995.Brahan, K. M., Hewitt, A. D., Boone, G. D. and Hewitt, S. A: Int. J. Chem. Kinet., 28, 397, 1996.Bryukov, M. G., Slagle, I. R. and Knyazev, D.: J. Phys. Chem. A, 106, 10532, 2002.Catoire, V., Lesclaux, R., Schneider, W. F. and Wallington, T. J.: J. Phys. Chem., 100, 14356, 1996.Clyne, M. A. A. and Walker, R. F.: J. Chem. Soc. Faraday Trans., 1, 69, 1547, 1973.Davis, D. D., Braun, W. and Bass, A. M.: Int. J. Chem. Kinet., 2, 101, 1970.IUPAC: http://www.iupac-kinetic.ch.cam.ac.uk/, 2007.Jeoung, S. C., Choo, K.Y. and Benson, S. W.: J. Phys. Chem., 95, 7282, 1991.Knox, J. H.: Trans. Faraday Soc., 58, 275, 1962.Niki, H., Maker, P. D., Savage, C. M. and Breitenbach, L. P., Int. J. Chem. Kinet., 12, 1001, 1980.Orlando, J. J.: Int. J. Chem. Kinet., 31, 515, 1999.Talhaoui, A., Louis, F., Meriaux, B., Devolder, P. and Sawerysyn, J. P.: J. Phys. Chem., 100, 2107, 1996.
Atmos. Chem. Phys., 8, 4141–4496, 2008 www.atmos-chem-phys.net/8/4141/2008/

R. Atkinson et al.: Evaluated kinetic and photochemical data for atmospheric chemistry 4281
IV.A2.98
Cl + CH3CH2F → HCl + CH 3CHF (1)→ HCl + CH 2CH2F (2)
1H ◦(1) = -9.6 kJ·mol−1
1H ◦(2) = -5.3 kJ·mol−1
Rate coefficient data (k = k1 + k2)
k/cm3 molecule−1 s−1 Temp./K Reference Technique/Comments
Absolute Rate Coefficients(6.8± 0.5)× 10−12 298 Hitsuda et al., 2001 PLP-LIF (a)
Relative Rate Coefficientsk1 = 1.0× 10⁻¹¹ exp(-130/T ) 281-368 Tschuikow-Roux et al., 1985 RR (b)k1 = 6.5× 10⁻¹² 298k2 = 8.3× 10⁻¹² exp(-720/T ) 281-368k2 = 7.4× 10⁻¹³ 298
Comments
(a) Laser photolysis of HCl at 193 nm as Cl atom source. Both Cl(2P3/2) and Cl(2P3/2) detected by VUV-LIF.
(b) Cl atoms were generated by the photolysis of Cl2. Product yield ratios were measured by GC and the measured ratecoefficient ratios were placed on an absolute basis by use of a rate coefficient ofk(Cl + CH4) = 6.6× 10⁻¹² exp(-1240/T )cm3 molecule−1 s−1 (IUPAC, current recommendation).
Preferred Values
k1 = 6.5× 10⁻¹² cm3 molecule−1 s−1 at 298 K.k1 = 1.0× 10⁻¹¹ exp(-130/T ) cm3 molecule−1 s−1 over the temperature range 280-370 K.k2 = 7.4× 10⁻¹³ cm3 molecule−1 s−1 at 298 K.k2 = 8.3× 10⁻¹² exp(-720/T ) cm3 molecule−1 s−1 over the temperature range 280-370 K.
Reliability
1 log k1 = 1 log k2 =± 0.3 at 298 K.1 (E1/R) = 1 (E2/R) =± 500 K.
Comments on Preferred Values
The recommended values are based on the results of the relative rate study of Tschuikow-Roux et al. (1985). The overall rateconstantk at room temperature, (k = k1 + k2), of Hitsuda et al. (2001) is consistent with this recommendation.
References
Hitsuda, K., Takahashi, K., Matsumi, Y. and Wallington, T. J.: J. Phys. Chem. A, 105, 5131, 2001.IUPAC: http://www.iupac-kinetic.ch.cam.ac.uk/, 2007.Tschuikow-Roux, E, Yano, T. and Niedzielski, J.: J. Chem. Phys., 82, 65, 1985.
www.atmos-chem-phys.net/8/4141/2008/ Atmos. Chem. Phys., 8, 4141–4496, 2008

4282 R. Atkinson et al.: Evaluated kinetic and photochemical data for atmospheric chemistry
IV.A2.99
Cl + CH3CHF2 → HCl + CH 3CF2 (1)→ HCl + CH 2CHF2 (2)
1H ◦(1) = -4.9 kJ·mol−1
1H ◦(2) = 11.1 kJ·mol−1
Rate coefficient data (k = k1 + k2)
k/cm3 molecule−1 s−1 Temp./K Reference Technique/Comments
Relative Rate Coefficientsk1 = 7.0× 10⁻¹² exp(-965/T ) 280-360 Yano and Tschuikow-Roux, 1986 RR (a)k1 = 2.7× 10⁻¹³ 298k2 = 7.8× 10⁻¹² exp(-2399/T ) 280-360k2 = 2.5× 10⁻¹⁵ 298(2.4± 0.7)× 10−13 295 Wallington and Hurley, 1992 RR (b)(2.4± 0.5)× 10−13 298 Tuazon et al., 1992 RR (b)
Comments
(a) Cl atoms were generated by the photolysis of Cl2. Product yield ratios were measured by GC and the measured ratecoefficient ratios were placed on an absolute basis by use of a rate coefficient ofk(Cl + C2H6) = 8.3× 10⁻¹¹ exp(-100/T )cm3 molecule−1 s−1 (IUPAC, current recommendation).
(b) Cl atoms were generated by the photolysis of Cl2. The decays of the reactant and reference organic measured by FTIRspectroscopy. The measured rate coefficient ratio is placed on an absolute basis by use of a rate coefficient ofk(Cl + CH4)= 1.0× 10⁻¹³ cm3 molecule−1 s−1 (IUPAC, current recommendation).
Preferred Values
k1 = 2.5× 10⁻¹³ cm3 molecule−1 s−1 at 298 K.k1 = 6.3× 10⁻¹² exp(-965/T ) cm3 molecule−1 s−1 over the temperature range 280-360 K.k2 = 2.3× 10⁻¹⁵ cm3 molecule−1 s−1 at 298 K.k2 = 7.0× 10⁻¹² exp(-2400/T ) cm3 molecule−1 s−1 over the temperature range 280-360 K.
Reliability
1 log k1 =± 0.15 at 298 K.1 log k2 =± 0.5 at 298 K.1 (E1/R) = 1 (E2/R) =± 500 K.
Comments on Preferred Values
The recommended value of the overall rate constant at room temperature is an average of all three relative rate studies, whichshow good agreement. The temperature dependence ofk, k1 andk2 are taken from work of Yano and Tschuikow-Roux, (1986),which supersedes their previous data (Tschuikow-Roux et al., 1985).
References
IUPAC: http://www.iupac-kinetic.ch.cam.ac.uk/, 2007.Tschuikow-Roux, E., Yano, T. and Niedzielski, J.: J. Chem. Phys., 82, 65, 1985.Tuazon, E. C., Atkinson, R. and Corchnoy, S. B: Int. J. Chem. Kinet.,24, 639, 1992.Wallington, T. J. and Hurley, M. D.: Chem. Phys. Lett., 189, 437, 1992.Yano, T. and Tschuikow-Roux, E.: J. Photochem., 32, 25, 1986.
Atmos. Chem. Phys., 8, 4141–4496, 2008 www.atmos-chem-phys.net/8/4141/2008/

R. Atkinson et al.: Evaluated kinetic and photochemical data for atmospheric chemistry 4283
IV.A2.100
Cl + CH2FCH2F→ HCl + CHFCH 2F
1H ◦ = -4.6 kJ·mol−1
Rate coefficient data
k/cm3 molecule−1 s−1 Temp./K Reference Technique/Comments
Relative Rate Coefficients2.8× 10−11 exp[-(1065)/T ] 280-360 Yano and Tschuikow-Roux, 1986 RR (a)7.8× 10⁻¹³ 298(6.60± 0.16)× 10−13 298 Wallington et al., 1994 RR (b)(6.53± 0.34)× 10−13 298 RR (c)
Comments
(a) Cl atoms were generated by the photolysis of Cl2. Product yield ratios were measured by GC and the measured ratecoefficient ratios were placed on an absolute basis by use of a rate coefficient ofk(Cl + C2H6) = 8.1× 10⁻¹¹ exp(-100/T )cm3 molecule−1 s−1 (IUPAC, current recommendation).
(b) Cl atoms were generated by the photolysis of Cl2 in presence of CH2FCH2F-CH4 in air at 930 mbar total pressure. Lossof reactants was monitored by FTIR. The measured rate coefficient ratiok(Cl + CH2FCH2F)/k(Cl + CH4) = (6.60± 0.16)was placed on an absolute basis by use of a rate coefficient ofk(Cl + CH4) = 1.0× 10⁻¹³ cm3 molecule−1 s−1 (IUPAC,current recommendation).
(c) Cl atoms were generated by the photolysis of Cl2 in presence of CH2FCH2F-CH3Cl mixtures in air at 930 mbar totalpressure. Loss of reactants was monitored by FTIR. The measured rate coefficient ratiok(Cl + CH2FCH2F)/k(Cl +CH3Cl) = (1.36± 0.07) was placed on an absolute basis by use of a rate coefficient ofk(Cl + CH3Cl) = 4.8× 10⁻¹³ cm3
molecule−1 s−1 (IUPAC, current recommendation).
Preferred Values
k = 7.0× 10⁻¹³ cm3 molecule−1 s−1 at 298 K.k = 2.5× 10⁻¹¹ exp(-1065/T ) cm3 molecule−1 s−1 over the temperature range 280-360 K.
Reliability
1 log k =± 0.2 at 298 K.1 (E/R) =± 400 K.
Comments on Preferred Values
The recommended value at 298 K is an average of the rate constants obtained by the relative rate studies of Yano andTschuikow-Roux (1986) and Wallington et al. (1994). The expression for the temperature dependence is taken from Yanoand Tschuikow-Roux (1986), modified to reproduce the recommended value at 298 K.
References
IUPAC: http://www.iupac-kinetic.ch.cam.ac.uk/, 2007.Wallington, T. J., Hurley, M. D., Ball, J. C., Ellermann, T., Nielsen, O. J. and Sehested, J.: J. Phys. Chem., 98, 5435, 1994.Yano, T. and Tschuikow-Roux, E.: J. Photochem., 32, 25, 1986.
www.atmos-chem-phys.net/8/4141/2008/ Atmos. Chem. Phys., 8, 4141–4496, 2008

4284 R. Atkinson et al.: Evaluated kinetic and photochemical data for atmospheric chemistry
IV.A2.101
Cl + CH3CF3→ HCl + CH 2CF3
1H ◦ = 18.0 kJ·mol−1
Rate coefficient data
k/cm3 molecule−1 s−1 Temp./K Reference Technique/Comments
Absolute Rate Coefficients< 1× 10⁻¹⁴ 298 Hitsuda et al., 2001 PLP-LIF (a)
Relative Rate Coefficients6.9× 10−12 exp(-3720/T ) 281-368 Tschuikow-Roux et al., 1985 RR (b)2.6× 10⁻¹⁷ 298
Comments
(a) Laser photolysis of HCl at 193 nm as Cl atom source. Both Cl(2P3/2) and Cl(2P1/2) detected by VUV-LIF.
(b) Cl atoms were generated by the photolysis of Cl2. Product yield ratios were measured by GC and the measured ratecoefficient ratio is placed on an absolute basis by use of a rate coefficient ofk(Cl + CH4) = 6.6× 10⁻¹² exp(-1240/T )cm3 molecule−1 s−1 (IUPAC, current recommendation).
Preferred Values
k = 2.6× 10⁻¹⁷ cm3 molecule−1 s−1 at 298 K.k = 6.9× 10⁻¹² exp(-3720/T ) cm3 molecule−1 s−1 over the temperature range 280-370 K.
Reliability
1 log k =± 0.5 at 298 K.1 (E/R) =± 500 K.
Comments on Preferred Values
The recommended value is based on the results of the relative rate study of Tschuikow-Roux et al., (1985). The room temper-ature upper limit tok of Hitsuda et al. (2001) is consistent with this.
References
Hitsuda, K., Takahashi, K., Matsumi, Y. and Wallington, T. J.: J. Phys. Chem. A, 105, 5131, 2001.IUPAC: http://www.iupac-kinetic.ch.cam.ac.uk/, 2007.Tschuikow-Roux, E., Yano, T. and Niedzielski, J.: J. Chem. Phys., 82, 65, 1985.
Atmos. Chem. Phys., 8, 4141–4496, 2008 www.atmos-chem-phys.net/8/4141/2008/
R. Atkinson et al.: Evaluated kinetic and photochemical data for atmospheric chemistry 4285
IV.A2.102
Cl + CH2FCHF2 → HCl + CH 2FCF2 (1)→ HCl + CHFCHF 2 (2)
1H ◦(1) = 2.2 kJ·mol−1
1H ◦(2) = 0.0 kJ·mol−1
Rate coefficient data (k = k1 + k2)
k/cm3 molecule−1 s−1 Temp./K Reference Technique/Comments
Relative Rate Coefficientsk1 = 3.3× 10⁻¹² exp(-1450/T ) 281-368 Tschuikow-Roux et al., 1985 RR (a)k1 = 2.5× 10⁻¹⁴ 298k2 = 4.6× 10⁻¹² exp(-1560/T ) 281-368k2 = 2.5× 10⁻¹⁴ 298
Comments
(a) Cl atoms were generated by the photolysis of Cl2. Product yield ratios were measured by GC and the measured ratecoefficient ratios were placed on an absolute basis by use of a rate coefficient ofk(Cl + CH4) = 6.6× 10⁻¹² exp(-1240/T )cm3 molecule−1 s−1 (IUPAC, current recommendation).
Preferred Values
k1 = 2.5× 10⁻¹⁴ cm3 molecule−1 s−1 at 298 K.k1 = 3.3× 10⁻¹² exp(-1450/T ) cm3 molecule−1 s−1 over the temperature range 280-370 K.k2 = 2.5× 10⁻¹⁴ cm3 molecule−1 s−1 at 298 K.k2 = 4.6× 10⁻¹² exp(-1560/T ) cm3 molecule−1 s−1 over the temperature range 280-370 K.
Reliability
1 log k1 = 1 log k2 =± 0.5 at 298 K.1 (E/R)1 = 1 (E/R)2 =± 500 K.
Comments on Preferred Values
The recommended values are based on the results of the single determination of this rate constant by Tschuikow-Roux et al.(1985).
References
IUPAC: http://www.iupac-kinetic.ch.cam.ac.uk/, 2007.Tschuikow-Roux, E., Yano, T. and Niedzielski, J.: J. Chem. Phys., 82, 65, 1985.
www.atmos-chem-phys.net/8/4141/2008/ Atmos. Chem. Phys., 8, 4141–4496, 2008

4286 R. Atkinson et al.: Evaluated kinetic and photochemical data for atmospheric chemistry
IV.A2.103
Cl + CH3CF2Cl→ HCl + CH 2CF2Cl
Rate coefficient data
k/cm3 molecule−1 s−1 Temp./K Reference Technique/Comments
Absolute Rate Coefficients(5.6± 2.0)× 10−16 297 Sawerysyn et al., 1992 DF-MS<4.4× 10⁻¹⁵ 298 Warren and Ravishankara, 1993 PLP-RF1.5× 10−12 exp[-(2420± 400)/T ] 296-438 Talhaoui et al., 1996 DF-MS(4.7± 1.3)× 10−16 296
Relative Rate Coefficients(3.90± 0.52)× 10−16 295 Wallington and Hurley, 1992 RR (a)(3.7± 0.8)× 10−16 298 Tuazon et al., 1992 RR (a)
Comments
(a) Cl atoms were generated by the photolysis of Cl2. The decays of the reactant and reference organic were measured byFTIR spectroscopy. The measured rate coefficient ratio is placed on an absolute basis by use of a rate coefficient ofk(Cl+ CH4) = 1.0× 10⁻¹³ cm3 molecule−1 s−1 (IUPAC, current recommendation).
Preferred Values
k = 4.1× 10⁻¹⁶ cm3 molecule−1 s−1 at 298 K.k = 1.4× 10⁻¹² exp(-2420/T ) cm3 molecule−1 s−1 over the temperature range 296-440 K.
Reliability
1 log k =± 0.15 at 298 K.1 (E/R) =± 500 K.
Comments on Preferred Values
The preferred value of the rate constant at 298 K is based on the results reported by Wallington and Hurley (1992), Tuazon etal. (1992) and Talhaoui et al. (1996). The latter study supersedes the work of Sawerysyn et al. (1992). The single temperaturedependent study of Talhaoui et al. (1996) forms the basis for the recommendation ofk(T), with the A-factor adjusted toreproduce the recommended value ofk at 298 K.
References
IUPAC: http://www.iupac-kinetic.ch.cam.ac.uk/, 2007.Sawerysyn, J. P., Talhaoui, A., Meriaux, B. and Devolder, P.: Chem. Phys. Lett., 198, 197, 1992.Talhaoui, A., Devolder, L. P., Meriaux, B., Sawerysyn, J.-P., Rayez, M.-T. and Rayez, J.-C.: J. Phys. Chem., 100, 13531, 1996.Tuazon, E. C., Atkinson, R. and Corchnoy, S. B.: Int. J. Chem. Kinet., 24, 639, 1992.Wallington, T. J. and Hurley, M. D.: Chem. Phys. Lett., 189, 437, 1992.Warren, R. F. and Ravishankara, A. R.: Int. J. Chem. Kinet., 25, 833, 1993.
Atmos. Chem. Phys., 8, 4141–4496, 2008 www.atmos-chem-phys.net/8/4141/2008/

R. Atkinson et al.: Evaluated kinetic and photochemical data for atmospheric chemistry 4287
IV.A2.104
Cl + CH3CFCl2→ HCl + CH 2CFCl2
Rate coefficient data
k/cm3 molecule−1 s−1 Temp./K Reference Technique/Comments
Absolute Rate Coefficients(2.1± 0.2)× 10−15 297 Sawerysyn et al., 1992 DF-MS1.0× 10−12exp[-(1800± 500)/T ] 298-376 Warren and Ravishankara, 1993 PLP-RF(2.4± 0.4)× 10−15 2983.0× 10−12 exp[-(2220± 150)/T ] 299-429 Talhaoui et al., 1996 DF-MS(1.7± 0.2)× 10−15 299
Relative Rate Coefficients(2.0± 0.2)× 10−15 295 Wallington and Hurley, 1992 RR (a)(2.4± 0.5)× 10−15 298 Tuazon et al., 1992 RR (a)
Comments
(a) Cl atoms were generated by the photolysis of Cl2. The decays of the reactant and reference organic were measured byFTIR spectroscopy. The measured rate coefficient ratio was placed on an absolute basis by use of a rate coefficient ofk(Cl+ CH4) = 1.0× 10⁻¹³ cm3 molecule−1 s−1 (IUPAC, current recommendation).
Preferred Values
k = 2.1× 10⁻¹⁵ cm3 molecule−1 s−1 at 298 K.k = 1.7× 10⁻¹² exp(-2000/T ) cm3 molecule−1 s−1 over the temperature range 290-380 K.
Reliability
1 log k =± 0.1 at 298 K.1 (E/R) =± 300 K.
Comments on Preferred Values
The preferred value at 298 K is an average of the results reported by Wallington and Hurley (1992), Tuazon et al. (1992),Warren and Ravishankara (1993) and Talhaoui et al. (1996). The expression for the temperature dependence is an averageof the values ofE/R obtained by Warren and Ravishankara (1992) and Talhaoui et al. (1996). The data in Sawerysyn et al.(1992) are superseded by those in Talhaoui et al. (1996).
References
IUPAC: http://www.iupac-kinetic.ch.cam.ac.uk/, 2007.Sawerysyn, J. P., Talhaoui, A., Meriaux, B. and Devolder, P.: Chem. Phys. Lett., 198, 197, 1992.Talhaoui, A., Devolder, L. P., Meriaux, B., Sawerysyn, J.-P., Rayez, M.-T. and Rayez, J.-C.: J. Phys. Chem., 100, 13531, 1996.Tuazon, E. C., Atkinson, R. and Corchnoy, S. B: Int. J. Chem. Kinet., 24, 639, 1992.Wallington, T.J. and Hurley, M. D.: Chem. Phys. Lett., 189, 437, 1992.Warren, R. F. and Ravishankara, A. R.: Int. J. Chem. Kinet., 25, 833, 1993.
www.atmos-chem-phys.net/8/4141/2008/ Atmos. Chem. Phys., 8, 4141–4496, 2008

4288 R. Atkinson et al.: Evaluated kinetic and photochemical data for atmospheric chemistry
IV.A2.105
Cl + CH3CCl3→ HCl + CH 2CCl3
Rate coefficient data
k/cm3 molecule−1 s−1 Temp./K Reference Technique/Comments
Absolute Rate Coefficients< 2.40× 10⁻¹⁴ 259 Wine et al., 1982 PLP-RF< 3.68× 10⁻¹⁴ 298< 7.74× 10⁻¹⁴ 3562.8× 10−12 exp[-(1790± 320)/T ] 298-418 Talhaoui et al., 1996 DF-MS(7.1± 1.1)× 10−15 298
Relative Rate Coefficients(9.9± 2.0)× 10−15 296 Platz et al., 1995 RR (a)
Comments
(a) Photolysis of Cl2-CH3CCl3-CD4 mixtures in air or N2 at 930 mbar total pressure, with the loss of reactants monitored byFTIR. A value ofk(Cl + CH3CCl3)/k(Cl + CD4) = (1.62± 0.05) was obtained and placed on an absolute basis usingk(Cl+ CD4) = 6.1× 10⁻¹⁵ cm3 molecule−1 s−1 (Wallington and Hurley, 1992).
Preferred Values
k = 7× 10⁻¹⁵ cm3 molecule−1 s−1 at 298 K.k = 2.8× 10⁻¹² exp(-1790/T ) cm3 molecule−1 s−1 over the temperature range 290-420 K.
Reliability
1 log k =± 0.2 at 298 K.1 (E/R) =± 400 K.
Comments on Preferred Values
The preferred values ofk are based on the direct study of Talhaoui et al. (1996), which is consistent with the upper limits ofWine et al. (1982) and with the room temperature relative rate study of Platz et al. (1995).
References
Platz, J., Nielsen, O. J., Sehested, J. and Wallington, T. J.: J. Phys. Chem., 99, 6570, 1995.Talhaoui, A., Devolder, L. P., Meriaux, B., Sawerysyn, J.-P., Rayez, M.-T. and Rayez, J.-C.: J. Phys. Chem., 100, 13531, 1996.Wallington, T. J. and Hurley, M. D.: Chem. Phys. Lett., 189, 437, 1992.Wine, P. H., Semmes, D. H. and Ravishankara, A. R.: Chem. Phys. Lett., 90, 128, 1982.
Atmos. Chem. Phys., 8, 4141–4496, 2008 www.atmos-chem-phys.net/8/4141/2008/

R. Atkinson et al.: Evaluated kinetic and photochemical data for atmospheric chemistry 4289
IV.A2.106
Cl + CH2FCF3→ HCl + CHFCF 3
1H ◦ = 1.8 kJ·mol−1
Rate coefficient data
k/cm3 molecule−1 s−1 Temp./K Reference Technique/Comments
Absolute Rate Coefficients(1.6± 0.3)× 10−15 297 Sawerysyn et al., 1992 DF-MS3.2× 10−12 exp[-(2300± 70)/T ] 298-423 Louis et al., 1997 DF-MS(1.4± 0.3)× 10−15 298
Relative Rate Coefficients(1.38± 0.18)× 10−15 295 Wallington and Hurley, 1992 RR (a)(1.6± 0.3)× 10−15 298 Tuazon et al., 1992 RR (a)
Comments
(a) Cl atoms were generated by the photolysis of Cl2. The decays of the reactant and reference organic were measured byFTIR spectroscopy. The measured rate coefficient ratio was placed on an absolute basis by use of a rate coefficient ofk(Cl+ CH4) = 1.0× 10⁻¹³ cm3 molecule−1 s−1 (IUPAC, current recommendation).
Preferred Values
k = 1.5× 10⁻¹⁵ cm3 molecule−1 s−1 at 298 K.k = 3.4× 10⁻¹² exp(-2300/T ) cm3 molecule−1 s−1 over the temperature range 298-430 K.
Reliability
1 log k =± 0.1 at 298 K.1 (E/R) =± 500 K.
Comments on Preferred Values
The preferred value at 298 K is based on the results reported by Louis et al. (1997), Wallington and Hurley (1992) and Tuazonet al. (1992) which are in good agreement. The room temperature rate constant of Sawerysyn et al. (1992) is considered to besuperseded by that measured in the same group by Louis et al. (1997). The temperature dependence ofk is taken from Louiset al. (1997) with theA-factor adjusted to reproduce the recommended value ofk at 298 K.
References
IUPAC: http://www.iupac-kinetic.ch.cam.ac.uk/, 2007.Louis, J., Talhaoui, A., Sawerysyn, J. P., Rayez, M.-T. and Rayez, J.-C.: J. Phys. Chem. A,. 101, 8503, 1997.Sawerysyn, J. P., Talhaoui, A., Meriaux, B. and Devolder, P.: Chem. Phys. Lett., 198, 197, 1992.Tuazon, E. C., Atkinson, R. and Corchnoy, S. B.: Int. J. Chem. Kinet., 24, 639, 1992.Wallington, T. J. and Hurley, M. D.: Chem. Phys. Lett., 189, 437, 1992.
www.atmos-chem-phys.net/8/4141/2008/ Atmos. Chem. Phys., 8, 4141–4496, 2008
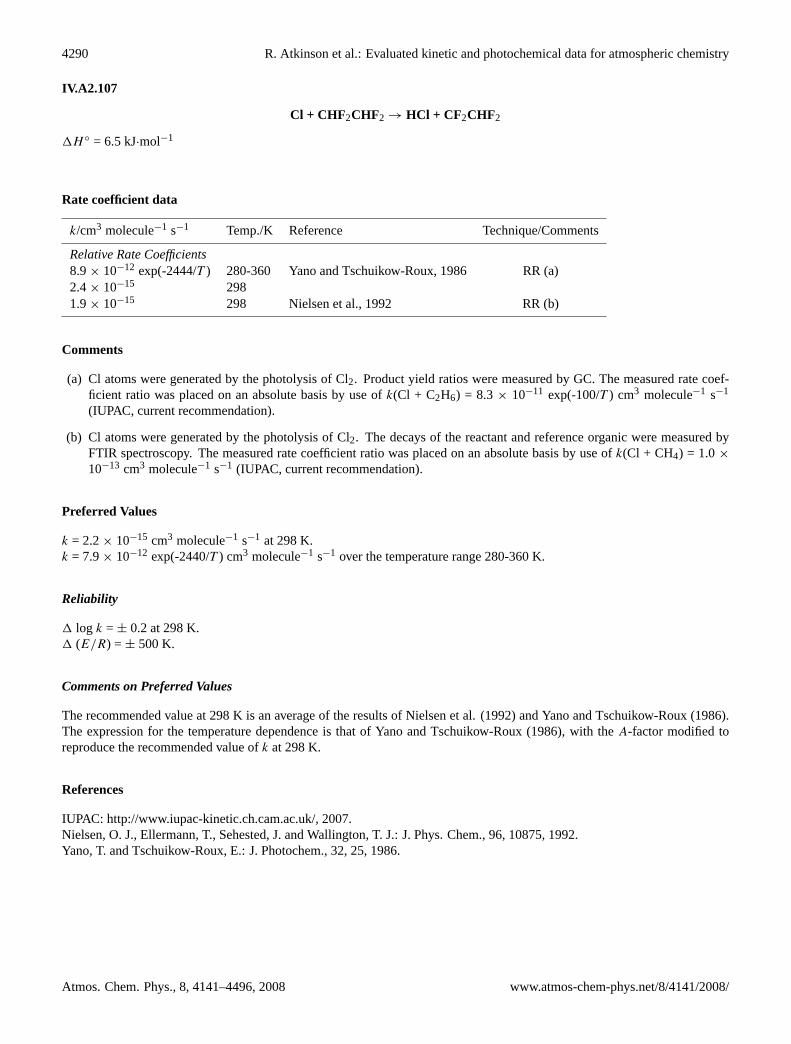
4290 R. Atkinson et al.: Evaluated kinetic and photochemical data for atmospheric chemistry
IV.A2.107
Cl + CHF2CHF2→ HCl + CF2CHF2
1H ◦ = 6.5 kJ·mol−1
Rate coefficient data
k/cm3 molecule−1 s−1 Temp./K Reference Technique/Comments
Relative Rate Coefficients8.9× 10−12 exp(-2444/T ) 280-360 Yano and Tschuikow-Roux, 1986 RR (a)2.4× 10⁻¹⁵ 2981.9× 10−15 298 Nielsen et al., 1992 RR (b)
Comments
(a) Cl atoms were generated by the photolysis of Cl2. Product yield ratios were measured by GC. The measured rate coef-ficient ratio was placed on an absolute basis by use ofk(Cl + C2H6) = 8.3× 10⁻¹¹ exp(-100/T ) cm3 molecule−1 s−1
(IUPAC, current recommendation).
(b) Cl atoms were generated by the photolysis of Cl2. The decays of the reactant and reference organic were measured byFTIR spectroscopy. The measured rate coefficient ratio was placed on an absolute basis by use ofk(Cl + CH4) = 1.0×10⁻¹³ cm3 molecule−1 s−1 (IUPAC, current recommendation).
Preferred Values
k = 2.2× 10⁻¹⁵ cm3 molecule−1 s−1 at 298 K.k = 7.9× 10⁻¹² exp(-2440/T ) cm3 molecule−1 s−1 over the temperature range 280-360 K.
Reliability
1 log k =± 0.2 at 298 K.1 (E/R) =± 500 K.
Comments on Preferred Values
The recommended value at 298 K is an average of the results of Nielsen et al. (1992) and Yano and Tschuikow-Roux (1986).The expression for the temperature dependence is that of Yano and Tschuikow-Roux (1986), with theA-factor modified toreproduce the recommended value ofk at 298 K.
References
IUPAC: http://www.iupac-kinetic.ch.cam.ac.uk/, 2007.Nielsen, O. J., Ellermann, T., Sehested, J. and Wallington, T. J.: J. Phys. Chem., 96, 10875, 1992.Yano, T. and Tschuikow-Roux, E.: J. Photochem., 32, 25, 1986.
Atmos. Chem. Phys., 8, 4141–4496, 2008 www.atmos-chem-phys.net/8/4141/2008/

R. Atkinson et al.: Evaluated kinetic and photochemical data for atmospheric chemistry 4291
IV.A2.108
Cl + CHF2CF3→ HCl + CF2CF3
1H ◦ = 10.7 kJ·mol−1
Rate coefficient data
k/cm3 molecule−1 s−1 Temp./K Reference Technique/Comments
Relative Rate Coefficients(2.4± 0.5)× 10−16 298 Tuazon et al., 1992 RR (a)(2.6± 0.6)× 10−16 295 Sehested et al., 1993 RR (b)
Comments
(a) Cl atoms were generated by the photolysis of Cl2. The decays of the reactant and reference organic were measured byFTIR spectroscopy. The measured rate coefficient was placed on an absolute basis by use of a rate coefficient ofk(Cl +CH4) = 1.0× 10⁻¹³ cm3 molecule−1 s−1 (IUPAC, current recommendation).
(b) Cl atoms were generated by the photolysis of Cl2. The decays of the reactant and reference organic were measured byFTIR spectroscopy. The measured rate coefficient was ratio placed on an absolute basis by use of a rate coefficient ofk(Cl+ CH3CF2Cl) = 4.1× 10⁻¹⁶ cm3 molecule−1 s−1 (IUPAC, current recommendation).
Preferred Values
k = 2.5× 10⁻¹⁶ cm3 molecule−1 s−1 at 298 K.
Reliability
1 log k =± 0.2 at 298 K.
Comments on Preferred Values
The preferred value at 298 K is based on the results of the relative rate studies of Tuazon et al. (1992) and Sehested et al. (1993),which are in good agreement. Since studies have only been carried out at room temperature, no temperature dependence isrecommended.
References
IUPAC: http://www.iupac-kinetic.ch.cam.ac.uk/, 2007.Sehested, J., Ellermann, T., Nielsen, O. J., Wallington, T. J. and Hurley, M. D.: Int. J. Chem. Kinet., 25, 701, 1993.Tuazon, E. C., Atkinson, R. and Corchnoy, S. B.: Int. J. Chem. Kinet., 24, 639, 1992.
www.atmos-chem-phys.net/8/4141/2008/ Atmos. Chem. Phys., 8, 4141–4496, 2008

4292 R. Atkinson et al.: Evaluated kinetic and photochemical data for atmospheric chemistry
IV.A2.109
Cl + CHFClCF 3→ HCl + CFClCF 3
Rate coefficient data
k/cm3 molecule−1 s−1 Temp./K Reference Technique/Comments
Absolute Rate Coefficients1.16× 10−12 exp[-(1800± 150)/T ] 276-376 Warren and Ravishankara, 1993 PLP-RF(2.62± 0.50)× 10−15 298
Relative Rate Coefficients(2.7± 0.6)× 10−15 298 Tuazon et al. 1992 RR (a)
Comments
(a) Cl atoms were generated by the photolysis of Cl2. The decays of the reactant and reference organic were measured byFTIR spectroscopy. The measured rate coefficient ratio was placed on an absolute basis by use of a rate coefficient ofk(Cl+ CH4) = 1.0× 10⁻¹³ cm3 molecule−1 s−1 (IUPAC, current recommendation).
Preferred Values
k = 2.7× 10⁻¹⁵ cm3 molecule−1 s−1 at 298 K.k = 1.1× 10⁻¹² exp(-1800/T ) cm3 molecule−1 s−1 over the temperature range 270-380 K.
Reliability
1 log k =± 0.1 at 298 K.1 (E/R) =± 500 K.
Comments on Preferred Values
The preferred value at 298 K is based on the results reported by Warren and Ravishankara (1993) and Tuazon et al. (1992),which are in good agreement. The recommended temperature dependence is that reported by Warren and Ravishankara (1993),the only study carried out over a range of temperatures.
References
IUPAC: http://www.iupac-kinetic.ch.cam.ac.uk/, 2007.Tuazon, E. C., Atkinson, R. and Corchnoy, S. B.: Int. J. Chem. Kinet., 24, 639, 1992.Warren, R. F. and Ravishankara, A. R.: Int. J. Chem. Kinet., 25, 833, 1993.
Atmos. Chem. Phys., 8, 4141–4496, 2008 www.atmos-chem-phys.net/8/4141/2008/

R. Atkinson et al.: Evaluated kinetic and photochemical data for atmospheric chemistry 4293
IV.A2.110
Cl + CHCl 2CF3→ HCl + CCl 2CF3
Rate coefficient data
k/cm3 molecule−1 s−1 Temp./K Reference Technique/Comments
Absolute Rate Coefficients3.94× 10−12 exp[-(1740± 100)/T ] 276-382 Warren and Ravishankara, 1993 PLP-RF(1.15± 0.30)× 10−14 298
Relative Rate Coefficients(1.22± 0.18)× 10−14 295 Wallington and Hurley, 1992 RR (a)(1.4± 0.3)× 10−14 298 Tuazon et al. 1992 RR (a)
Comments
(a) Cl atoms were generated by the photolysis of Cl2. The decays of the reactant and reference organic were measured byFTIR spectroscopy. The measured rate coefficient ratio was placed on an absolute basis by use of a rate coefficient ofk(Cl+ CH4) = 1.0× 10⁻¹³ cm3 molecule−1 s−1 (IUPAC, current recommendation).
Preferred Values
k = 1.2× 10⁻¹⁴ cm3 molecule−1 s−1 at 298 K.k = 4.4× 10⁻¹² exp(-1740/T ) cm3 molecule−1 s−1 over the temperature range 270-380 K.
Reliability
1 log k =± 0.1 at 298 K.1 (E/R) =± 500 K.
Comments on Preferred Values
The preferred value at 298 K is based on the results reported by Warren and Ravishankara (1993), Wallington and Hurley(1992), and Tuazon et al. (1992), which are in good agreement. The recommended temperature dependence is that reported byWarren and Ravishankara, (1993) the only study carried out over a range of temperatures.
References
IUPAC: http://www.iupac-kinetic.ch.cam.ac.uk/, 2007.Tuazon, E. C., Atkinson, R. and Corchnoy, S. B.: Int. J. Chem. Kinet., 24, 639, 1992.Wallington, T. J. and Hurley, M. D.: Chem. Phys. Lett., 189, 437, 1992.Warren, R. F. and Ravishankara, A. R.: Int. J. Chem. Kinet., 25, 833, 1993.
www.atmos-chem-phys.net/8/4141/2008/ Atmos. Chem. Phys., 8, 4141–4496, 2008

4294 R. Atkinson et al.: Evaluated kinetic and photochemical data for atmospheric chemistry
IV.A2.111
HO + CH3Cl→ H2O + CH2Cl
1H ◦ = -79.8 kJ·mol−1
Rate coefficient data
k/cm3 molecule−1 s−1 Temp./K Reference Technique/Comments
Absolute Rate Coefficients(3.6± 0.8)× 10−14 296± 2 Howard and Evenson, 1976 DF-LMR4.1× 10−12 exp[-(1359± 151)/T ] 298-423 Perry et al., 1976 FP-RF(4.4± 0.5)× 10−14 2981.84× 10−12 exp[-(1098± 36)/T ] 250-350 Davis et al., 1976 FP-RF(4.29± 0.21)× 10−14 298(4.10± 0.69)× 10−14 297 Paraskevopoulos et al., 1981 FP-RA2.21× 10−21 T 3.08 exp[-(232± 423)/T ] 247-483 Jeong and Kaufman, 1982; DF-RF(3.95± 0.26)× 10−14 293 Jeong et al., 1984(5.3± 0.8)× 10−14 298 Brown et al., 1990 DF-RF2.90× 10−14 T 0.89 exp[-(1447± 75)/T ] 295-955 Taylor et al., 1993 PLP-LIF (a)(4.9± 0.6)× 10−14 2951.24× 10−13 T 0.5 exp[-(1210± 52)/T ] 224-398 Herndon et al., 2001 PLP-LIF(3.32± 0.10)× 10−14 298
Relative Rate Coefficients7.8× 10−14 298 Cox et al., 1976 RR (b)5.35× 10⁻¹⁸ T 2 exp[-(775± 74)/T ] 293-358 Hsu and DeMore, 1994 RR (c)3.53× 10⁻¹⁴ 298
Comments
(a) These data supersede the earlier data from this group (Taylor et al., 1989).
(b) HO radicals were generated by the photolysis of HONO-air mixtures at one atmosphere total pressure. Relative ratecoefficients were obtained from measurements of the rates of NO formation as a function of the HONO and organicconcentrations. Based on the effect of CH3Cl on NO formation and a rate coefficient for the reaction of HO radicals withCH4 of 6.4× 10⁻¹⁵ cm3 molecule−1 s−1 at 298 K (IUPAC, current recommendation), the rate coefficient cited in thetable is obtained.
(c) HO radicals were generated by the UV photolysis of O3 in the presence of water vapor. The concentrations of CH3Cland CH3CHF2 were measured by FTIR spectroscopy. The measured rate coefficient ratio ofk(HO + CH3Cl)/k(HO +CH3CHF2) = (1.91± 0.45) exp[-(195± 74)/T ] is placed on an absolute base by using a rate coefficient ofk(HO +CH3CHF2) = 2.80× 10⁻¹⁸ T 2 exp(-580/T ) cm3 molecule−1 s−1 (IUPAC, current recommendation).
Preferred Values
k = 3.6× 10⁻¹⁴ cm3 molecule−1 s−1 at 298 K.k = 2.1× 10⁻¹² exp(-1210/T ) cm3 molecule−1 s−1 over the temperature range 220-300 K.
Reliability
1 log k =± 0.10 at 298 K.1 (E/R) =± 200 K.
Atmos. Chem. Phys., 8, 4141–4496, 2008 www.atmos-chem-phys.net/8/4141/2008/

R. Atkinson et al.: Evaluated kinetic and photochemical data for atmospheric chemistry 4295
Comments on Preferred Values
At room temperature, the absolute rate coefficients of Herndon et al. (2001) are significantly lower than those from the earlierstudies of Perry et al (1976), Davis et al. (1976), Cox et al. (1976), Paraskevopoulos et al. (1981), Jeong and Kaufman (1982),Brown et al. (1990) and Taylor et al. (1993), but are in good agreement with the absolute rate coefficient of Howard andEvenson (1976) and the relative rate coefficients of Hsu and DeMore (1994). Furthermore, the relative rate coefficients of Hsuand DeMore (1994) are in excellent agreement with the absolute rate coefficients of Herndon et al. (2001) over the temperaturerange common to both studies (293–358 K), and at 363 and 401 K the rate coefficients of Jeong and Kaufman (1982) are ingood agreement with the data of Herndon et al. (2001). The absolute rate coefficients of Herndon et al. (2001) have beenfitted to the three parameter equationk = CT 2 exp(-D/T ), resulting ink = 4.34× 10⁻¹⁸ T 2 exp(-700/T ) cm3 molecule−1
s−1 over the temperature range 224–398 K. The preferred Arrhenius expression,k = A exp(-B/T ), is centered on a mid-rangetemperature,Tm, of 255 K and is obtained from the three parameter equation withA = C e2 T 2
m andB = D + 2Tm. As notedabove, the rate coefficients obtained from the relative rate study of Hsu and DeMore (1994) are in excellent agreement with thepreferred values.
Gola et al. (2005) have measured a rate coefficient ratio ofk(HO + 12CH3Cl)/k(HO + 13CH3Cl) = 1.059± 0.008 at 298±2 K, and the deuterium isotope effect for the reaction of HO radicals with CD3Cl, of k(HO + CH3Cl)/k(HO + CD3Cl) = 3.9±0.4 at 298± 2 K.
References
Brown, A. C., Canosa-Mas, C. E. and Wayne, R. P.: Atmos. Environ., 24A, 361, 1990.Cox, R. A., Derwent, R. G., Eggleton, A. E. J. and Lovelock, J. E.: Atmos. Environ., 10, 305, 1976.Davis, D. D., Machado, G., Conaway, B., Oh, Y. and Watson, R. T.: J. Chem. Phys., 65, 1268, 1976.Gola, A. A., D’Anna, B., Feilberg, F. L., Sellevag, S. R., Bache-Andreassen, L. and Nielsen, C. J.: Atmos. Chem. Phys., 5,2395, 2005.Herndon, S. C., Gierczak, T., Talukdar, R. K. and Ravishankara, A. R.: Phys. Chem. Chem. Phys., 3, 4529, 2001.Howard, C. J. and Evenson, K. M.: J. Chem. Phys., 64, 197, 1976.Hsu, K.-J. and DeMore, W. B.: Geophys. Res. Lett., 21, 805, 1994.IUPAC: http://www,iupac-kinetic.ch.cam.ac.uk/, 2007.Jeong, K.-M. and Kaufman, F.: J. Phys. Chem., 86, 1808, 1982.Jeong, K.-M., Hsu, K.-J., Jeffries, J. B. and Kaufman, F.: J. Phys. Chem., 88, 1222, 1984.Paraskevopoulos, G., Singleton, D. L. and Irwin, R. S.: J. Phys. Chem., 85, 561, 1981.Perry, R. A., Atkinson, R. and Pitts, J. N. Jr.: J. Chem. Phys., 64, 1618, 1976.Taylor, P. H., Jiang, Z. and Dellinger, B.: Int. J. Chem. Kinet., 25, 9, 1993.Taylor, P. H., D’Angelo, J. A., Martin, M. C., Kasner, J. H. and Dellinger, B.: Int. J. Chem. Kinet., 21, 829, 1989.
www.atmos-chem-phys.net/8/4141/2008/ Atmos. Chem. Phys., 8, 4141–4496, 2008

4296 R. Atkinson et al.: Evaluated kinetic and photochemical data for atmospheric chemistry
IV.A2.112
HO + CH2FCl→ H2O + CHFCl
Rate coefficient data
k/cm3 molecule−1 s−1 Temp./K Reference Technique/Comments
Absolute Rate Coefficients(3.7± 0.6)× 10−14 296± 2 Howard and Evenson, 1976 DF-LMR2.84× 10−12 exp[-(1259± 50)/T ] 245-375 Watson et al., 1977 FP-RF(4.21± 0.41)× 10−14 2983.1× 10−12 exp[-(1320± 100)/T ] 273-373 Handwerk and Zellner, 1978 FP-RA(3.5± 0.7)× 10−14 293(4.45± 0.67)× 10−14 297 Paraskevopoulos et al., 1981 FP-RA1.57× 10−19 T 2.41 exp[-(307± 382)/T ] 250-486 Jeong and Kaufman, 1982; DF-RF(4.94± 0.30)× 10−14 295 Jeong et al., 1984
Relative Rate Coefficients1.46× 10−12 exp[-(1076± 24)/T ] 293-371 DeMore, 1996 RR (a)3.95× 10⁻¹⁴ 298
Comments
(a) HO radicals were generated by the photolysis of O3 at 254 nm in the presence of H2O, and CH2Cl2 was used as thereference compound. CH2FCl and CH2Cl2 were monitored by FTIR spectroscopy, and a rate coefficient ratio ofk(HO +CH2FCl)/k(HO + CH2Cl2) = 0.81 exp[-(216± 24)/T ] was determined. This rate coefficient ratio is placed on an absolutebasis by use of a rate coefficient ofk(HO + CH2Cl2) = 1.8× 10⁻¹² exp(-860/T ) cm3 molecule−1 s−1 (IUPAC, currentrecommendation).
Preferred Values
k = 3.9× 10⁻¹⁴ cm3 molecule−1 s−1 at 298 K.k = 1.6× 10⁻¹² exp(-1105/T ) cm3 molecule−1 s−1 over the temperature range 240-300 K.
Reliability
1 log k =± 0.1 at 298 K.1 (E/R) =± 200 K.
Comments on Preferred Values
The absolute rate coefficients of Jeong and Kaufman (1982) are significantly higher than the absolute and relative rate dataof Howard and Evenson (1976), Watson et al. (1977), Handwerk and Zellner, 1978), Paraskevopoulos et al. (1981) andDeMore (1996), with the discrepancies being more marked at the lowest temperatures studied by Jeong and Kaufman (250and 295 K). The rate coefficients measured by Howard and Evenson (1976), Watson et al. (1977), Handwerk and Zellner(1978), Paraskevopoulos et al. (1981) and DeMore (1996) are in reasonably good agreement, and the rate coefficients fromthese studies have been fitted to the three parameter expressionk = CT 2 exp(-D/T ), resulting ink = 3.03× 10⁻¹⁸ T 2 exp(-574/T ) cm3 molecule−1 s−1 over the temperature range 245–375 K. The preferred Arrhenius expression,k = A exp(-B/T ), iscentered on a mid-range temperature,Tm, of 265 K and is obtained from the three parameter equation withA = Ce2 T 2
m andB
= D + 2Tm.
Atmos. Chem. Phys., 8, 4141–4496, 2008 www.atmos-chem-phys.net/8/4141/2008/

R. Atkinson et al.: Evaluated kinetic and photochemical data for atmospheric chemistry 4297
References
DeMore, W. B.: J. Phys. Chem., 100, 5813, 1996.Handwerk, V. and Zellner, R.: Ber. Bunsenges. Phys. Chem., 82, 1161, 1978.Howard, C. J. and Evenson, K. M.: J. Chem. Phys., 64, 197, 1976.IUPAC: http://www.iupac-kinetic.ch.cam.ac.uk/, 2007.Jeong, K.-M. and Kaufman, F.: J. Phys. Chem., 86, 1808, 1982.Jeong, K.-M., Hsu, K.-J., Jeffries, J. B. and Kaufman, F.: J. Phys. Chem., 88, 1222, 1984.Paraskevopoulos, G., Singleton, D. L. and Irwin, R. S.: J. Phys. Chem., 85, 561, 1981.Watson, R. T., Machado, G., Conaway, B., Wagner, S. and Davis, D. D.: J. Phys. Chem., 81, 256, 1977.
www.atmos-chem-phys.net/8/4141/2008/ Atmos. Chem. Phys., 8, 4141–4496, 2008

4298 R. Atkinson et al.: Evaluated kinetic and photochemical data for atmospheric chemistry
IV.A2.113
HO + CH2Cl2→ H2O + CHCl2
1H ◦ = -94.6 kJ·mol−1
Rate coefficient data
k/cm3 molecule−1 s−1 Temp./K Reference Technique/Comments
Absolute Rate Coefficients(1.55± 0.34)× 10−13 296± 2 Howard and Evenson, 1976 DF-LMR(1.45± 0.20)× 10−13 298.5 Perry et al., 1976 FP-RF4.27× 10−12 exp[-(1094± 82)/T ] 245-375 Davis et al., 1976 FP-RF(1.16± 0.05)× 10−13 2981.61× 10−19 T 2.54 exp[-(186± 493)/T ] 251-455 Jeong and Kaufman, 1982; DF-RF(1.53± 0.095)× 10−13 292 Jeong et al., 19844.01× 10−15 T 1.09 exp[-(771± 48)/T ] 295-955 Taylor et al., 1993 PLP-LIF (a)(1.47± 0.18)× 10−13 2952.61× 10−12 exp[-(944± 29)/T ] 277-370 Villenave et al., 1997 FP-RF(1.10± 0.05)× 10−13 2986.6× 10−13 T 0.5 exp[-(721± 32)/T ] 219-394 Herndon et al., 2001 PLP-LIF(1.00± 0.14)× 10−13 298
Relative Rate Coefficients9.5× 10−14 298 Cox et al., 1976 RR (b)2.72× 10⁻¹⁸ T 2 exp[-(286± 29)/T ] 293-360 Hsu and DeMore, 1994 RR (c,d)9.25× 10⁻¹⁴ 2981.96× 10−18 T 2 exp[-(104± 20)/T ] 298-368 Hsu and DeMore, 1994 RR (c,e)1.22× 10⁻¹³ 298
Comments
(a) These data supersede the earlier data from this group (Taylor et al., 1989).
(b) HO radicals were generated by the photolysis of HONO-air mixtures at 1.013 bar pressure. Relative rate coefficients wereobtained from measurements of the rates of NO formation as a function of the HONO and organic concentrations. Basedon the effect of CH2Cl2 on NO formation and a rate coefficient for the reaction of HO radicals with CH4 of 6.4× 10⁻¹⁵
cm3 molecule−1 s−1 at 298 K (IUPAC, current recommendation), the rate coefficient cited in the table is obtained.
(c) HO radicals were generated by the UV photolysis of O3 in the presence of water vapor. CH2Cl2 and CH3CHF2(or CH3CH2F) concentrations were measured by FTIR spectroscopy. The measured rate coefficient ratios ofk(HO +CH2Cl2)/k(HO + CH3CHF2) = (0.97± 0.09) exp[(294± 29)/T ] and k(HO + CH2Cl2)/k(HO + CH3CH2F) = (0.32±0.02) exp[(171± 20)/T ] are placed on an absolute basis by using rate coefficients ofk(HO + CH3CHF2) = 2.80× 10⁻¹⁸
T 2 exp(-580/T ) cm3 molecule−1 s−1 (IUPAC, current recommendation) andk(HO + CH3CH2F) = 6.12× 10⁻¹⁸ T 2
exp(-275/T ) cm3 molecule−1 s−1 (IUPAC, current recommendation).
(d) Relative to HO + CH3CHF2.
(e) Relative to HO + CH3CH2F.
Preferred Values
k = 1.0× 10⁻¹³ cm3 molecule−1 s−1 at 298 K.k = 1.8× 10⁻¹² exp(-860/T ) cm3 molecule−1 s−1 over the temperature range 210-400 K.
Atmos. Chem. Phys., 8, 4141–4496, 2008 www.atmos-chem-phys.net/8/4141/2008/

R. Atkinson et al.: Evaluated kinetic and photochemical data for atmospheric chemistry 4299
Reliability
1 log k =± 0.10 at 298 K.1 (E/R) =± 150 K.
Comments on Preferred Values
The absolute room temperature rate coefficients of Howard and Evenson (1976), Perry et al. (1976), Jeong and Kaufman(1982) and Taylor et al. (1993) are significantly higher than those of Davis et al. (1976), Villenave et al. (1997) and Herndon etal. (2001), possibly because of the presence of reactive impurities (including stabilizers) present in the CH2Cl2 samples used(Villenave et al., 1997; Herndon et al., 2001). The relative rate data of Cox et al. (1976) and Hsu and DeMore (1994) are inreasonable agreement with the absolute rate coefficients of Villenave et al. (1997) and Herndon et al. (2001). An Arrheniusplot of the absolute rate data of Villenave et al. (1997) and Herndon et al. (2001) shows little or no evidence for curvatureover the temperature range studied (219–394 K). Accordingly, the preferred Arrhenius expression is obtained from a unit-weighted least-squares analysis of the absolute rate coefficients of Villenave et al. (1997) and Herndon et al. (2001). The roomtemperature relative rate constant of Cox et al. (1976) agrees well with the preferred 298 K value, while the rate coefficients ofHsu and DeMore (1994) relative to HO + CH3CHF2 are∼5-10% lower than the preferred values and those relative to HO +CH3CH2F are∼15-20% higher than the preferred values over the temperature ranges 298–360 K and 298–368 K, respectively.
References
Cox, R. A., Derwent, R. G., Eggleton, A. E. J. and Lovelock, J. E.: Atmos. Environ., 10, 305, 1976.Davis, D. D., Machado, G., Conaway, B., Oh, Y. and Watson, R. T.: J. Chem. Phys., 65, 1268, 1976.Herndon, S. C., Gierczak, T., Talukdar, R. K. and Ravisahankara, A. R.: Phys. Chem. Chem. Phys., 3, 4529, 2001.Howard, C. J. and Evenson, K. M.: J. Chem. Phys., 64, 197, 1976.Hsu, K.-J. and DeMore, W. B.: Geophys. Res. Lett., 21, 805, 1994.IUPAC: http://www.iupac-kinetic.ch.cam.ac.uk/, 2007.Jeong, K.-M. and Kaufman, F.: J. Phys. Chem., 86, 1808, 1982.Jeong, K.-M., Hsu, K.-J., Jeffries, J. B. and Kaufman, F.: J. Phys. Chem., 88, 1222, 1984.Perry, R. A., Atkinson, R. and Pitts, J. N. Jr.: J. Chem. Phys., 64, 1618, 1976.Taylor, P. H., Jiang, Z. and Dellinger, B.: Int. J. Chem. Kinet., 25, 9, 1993.Taylor, P. H., D’Angelo, J. A., Martin, M. C., Kasner, J. H. and Dellinger, B.: Int. J. Chem. Kinet., 21, 829, 1989.Villenave, E., Orkin, V. L., Huie, R. E. and Kurylo, M. J. J.: Phys. Chem. A, 101, 8513, 1997.
www.atmos-chem-phys.net/8/4141/2008/ Atmos. Chem. Phys., 8, 4141–4496, 2008

4300 R. Atkinson et al.: Evaluated kinetic and photochemical data for atmospheric chemistry
IV.A2.114
HO + CHF2Cl→ H2O + CF2Cl
1H ◦ = -74.4 kJ·mol−1
Rate coefficient data
k/cm3 molecule−1 s−1 Temp./K Reference Technique/Comments
Absolute Rate Coefficients1.21× 10−12 exp[-(1636± 151)/T ] 297-434 Atkinson et al., 1976 FP-RF(4.75± 0.48)× 10−15 296.9(3.4± 0.7)× 10−15 296± 2 Howard and Evenson, 1976 DF-LMR9.25× 10−13 exp[-(1575± 71)/T ] 250-350 Watson et al., 1977 FP-RF(4.8± 0.46)× 10−15 2981.20× 10−12 exp[-(1657± 39)/T ] 253-427 Chang and Kaufman, 1977 DF-RF(4.25± 0.28)× 10−15 2962.1× 10−12 exp[-(1780± 150)/T ] 263-373 Handwerk and Zellner, 1978 FP-RA(4.6± 0.8)× 10−15 2939.5× 10−12 exp[-(2300± 200)/T ] 294-426 Clyne and Holt, 1979 DF-RF(3.3± 0.7)× 10−15 294(4.58± 0.59)× 10−15 297 Paraskevopoulos et al., 1981 FP-RA5.03× 10−28 T 5.11 exp[-(252± 780)/T ] 293-492 Jeong and Kaufman, 1982; DF-RF(4.83± 0.32)× 10−15 293 Jeong et al., 19848.1× 10−13 exp[-(1516± 53)/T ] 298-460 Orkin and Khamaganov, 1993 DF-EPR(4.9± 0.45)× 10−15 2981.74× 10−12 exp[-(1701± 39)/T ] 302-382 Yujing et al., 1993 DF-RF5.99× 10−15 302
Absolute Rate Coefficients1.31× 10−22 T 3.28 exp[-(361± 564)/T ] 294-807 Fang et al., 1996 PLP-LIF(4.65± 0.66)× 10−15 294
Relative Rate Coefficients4.44× 10−21 T 2.82 exp[-(645± 45)/T ] 298-366 Hsu and DeMore, 1995 RR (a)4.83× 10⁻¹⁵ 298
Comments
(a) HO radicals were generated by the UV photolysis of O3 in the presence of water vapor. The concentrations of CHF2Cland CH4 were measured by FTIR spectroscopy. The measured rate coefficient ratio ofk(HO + CHF2Cl)/k(HO + CH4)= (0.24± 0.03) exp[(342± 45)/T ] is placed on an absolute basis by using a rate coefficient ofk(HO + CH4) = 1.85×10⁻²⁰ T 2.82 exp(-987/T ) cm3 molecule−1 s−1 (IUPAC, current recommendation).
Preferred Values
k = 4.7× 10⁻¹⁵ cm3 molecule−1 s−1 at 298 K.k = 7.9× 10⁻¹³ exp(-1530/T ) cm3 molecule−1 s−1 over the temperature range 240-300 K.
Atmos. Chem. Phys., 8, 4141–4496, 2008 www.atmos-chem-phys.net/8/4141/2008/

R. Atkinson et al.: Evaluated kinetic and photochemical data for atmospheric chemistry 4301
Reliability
1 log k =± 0.08 at 298 K.1 (E/R) =± 150 K.
Comments on Preferred Values
The absolute rate coefficients of Atkinson et al. (1975), Howard and Evenson (1976), Watson et al. (1977), Chang and Kaufman(1977), Handwerk and Zellner (1978), Paraskevopoulos et al. (1981), Jeong and Kaufman (1982), Orkin and Khamaganov(1993) and Fang et al. (1996) are in good agreement, and the relative rate coefficients of Hsu and DeMore (1995) agree wellwith these absolute rate coefficients. The absolute rate coefficients of Clyne and Holt (1979) exhibit a significantly highertemperature dependence than those determined in the other absolute rate studies, and the rate coefficients of Yujing et al.(1993) are significantly higher those of Atkinson et al. (1975), Howard and Evenson (1976), Watson et al. (1977), Changand Kaufman (1977), Handwerk and Zellner (1978), Paraskevopoulos et al. (1981), Jeong and Kaufman (1982), Orkin andKhamaganov (1993) and Fang et al. (1996). Accordingly, the studies of Clyne and Holt (1979) and Yujing et al. (1993) are notused in the evaluation of the rate coefficient for this reaction. The absolute rate coefficients of Atkinson et al. (1975), Howardand Evenson (1976), Watson et al. (1977), Chang and Kaufman (1977), Handwerk and Zellner (1978), Paraskevopouloset al. (1981), Jeong and Kaufman (1982), Orkin and Khamaganov (1993) and Fang et al. (1996) have been fitted to thethree parameter equationk = CT 2 exp(-D/T ), resulting ink = 1.52× 10⁻¹⁸ T 2 exp(-1000/T ) cm3 molecule−1 s−1 over thetemperature range 250–807 K. The preferred Arrhenius expression,k = A exp(-B/T ), is centered on a mid-range temperature,Tm, of 265 K and is obtained from the three parameter equation withA = Ce2 T 2
m andB = D + 2Tm. The relative rate data ofHsu and DeMore (1995) agree to within 3% with the preferred values.
References
Atkinson, R., Hansen, D. A. and Pitts, J. N. Jr.: J. Chem. Phys., 63, 1703, 1975.Chang, J. S. and Kaufman, F.: J. Chem. Phys., 66, 4989, 1977.Clyne, M. A. A. and Holt, P. M.: J. Chem. Soc. Faraday Trans. 2, 75, 582, 1979.Fang, T. D., Taylor, P. H. and Dellinger, B.: J. Phys. Chem., 100, 4048, 1996.Handwerk, V. and Zellner, R.: Ber. Bunsenges. Phys. Chem., 82, 1161, 1978.Howard, C. J. and Evenson, K. M.: J. Chem. Phys., 64, 197, 1976.Hsu, K.-J. and DeMore, W. B.: J. Phys. Chem., 99, 1235, 1995.IUPAC: http://www.iupac-kinetic.ch.cam.ac.uk/, 2007.Jeong, K.-M. and Kaufman, F.: J. Phys. Chem., 86, 1808, 1982.Jeong, K.-M., Hsu, K.-J., Jeffries, J. B. and Kaufman, F.: J. Phys. Chem., 88, 1222, 1984.Orkin, V. L. and Khamaganov, V. G.: J. Atmos. Chem., 16, 157, 1993.Paraskevopoulos, G., Singleton, D. L. and Irwin, R. S.: J. Phys. Chem., 85, 561, 1981.Watson, R. T., Machado, G., Conaway, B., Wagner, S. and Davis, D. D.: J. Phys. Chem., 81, 256, 1977.Yujing, M., Wenxiang, Y., Yuexiang, P. and Lianxiong, Q.: J. Environ. Sci., 5, 481, 1993.
www.atmos-chem-phys.net/8/4141/2008/ Atmos. Chem. Phys., 8, 4141–4496, 2008

4302 R. Atkinson et al.: Evaluated kinetic and photochemical data for atmospheric chemistry
IV.A2.115
HO + CHFCl 2→ H2O + CFCl2
1H ◦ = -83.2 kJ·mol−1
Rate coefficient data
k/cm3 molecule−1 s−1 Temp./K Reference Technique/Comments
Absolute Rate Coefficients(2.6± 0.4)× 10−14 296± 2 Howard and Evenson, 1976 DF-LMR1.75× 10−12 exp[-(1253± 151)/T ] 298-422 Perry et al., 1976 FP-RF(2.7± 0.3)× 10−14 298.41.87× 10−12 exp[-(1245± 26)/T ] 245-375 Watson et al., 1977 FP-RF(2.88± 0.24)× 10−14 2981.16× 10−12 exp[-(1073± 40)/T ] 241-396 Chang and Kaufman, 1977 DF-RF(3.04± 0.11)× 10−14 2964.8× 10−12 exp[-(1400± 100)/T ] 293-413 Clyne and Holt, 1979 DF-RF(3.54± 0.26)× 10−14 293(3.39± 0.87)× 10−14 297 Paraskevopoulos et al., 1981 FP-RA1.97× 10−18 T 1.94 exp[-(382± 413)/T ] 250-483 Jeong and Kaufman, 1982 DF-RF(3.37± 0.22)× 10−14 295 Jeong et al., 19841.53× 10−15 T 1.11 exp[-(1078± 262)/T ] 295-810 Fang et al., 1996 PLP-LIF(2.48± 0.67)× 10−14 295
Preferred Values
k = 2.9× 10⁻¹⁴ cm3 molecule−1 s−1 at 298 K.k = 1.04× 10⁻¹² exp(-1065/T ) cm3 molecule−1 s−1 over the temperature range 240-300 K.
Reliability
1 log k =± 0.1 at 298 K.1 (E/R) =± 200 K.
Comments on Preferred Values
The absolute rate coefficients of Clyne and Holt (1979) are significantly higher than those of Howard and Evenson (1976),Perry et al. (1976), Watson et al. (1977), Chang and Kaufman (1977), Paraskevopoulos et al. (1981), Jeong and Kaufman(1982) and Fang et al. (1996), and are therefore not used in the evaluation. The absolute rate coefficients of Howard andEvenson (1976), Perry et al. (1976), Watson et al. (1977), Chang and Kaufman (1977), Paraskevopoulos et al. (1981), Jeongand Kaufman (1982) and Fang et al. (1996) have been fitted to the three parameter equationk = CT 2 exp(-D/T ), resultingin k = 2.00× 10⁻¹⁸ T 2 exp(-535/T ) cm3 molecule−1 s−1 over the temperature range 241–810 K. The preferred Arrheniusexpression,k = A exp(-B/T ), is centered on a mid-range temperature,Tm, of 265 K and is obtained from the three parameterequation withA = Ce2 T 2
m andB = D + 2Tm.
References
Chang, J. S. and Kaufman, F.: J. Chem. Phys., 66, 4989, 1977.Clyne, M. A. A. and Holt, P. M.: J. Chem. Soc. Faraday Trans. 2, 75, 582, 1979.Fang, T. D., Taylor, P. H. and Dellinger, B.: J. Phys. Chem., 100, 4048, 1996.
Atmos. Chem. Phys., 8, 4141–4496, 2008 www.atmos-chem-phys.net/8/4141/2008/

R. Atkinson et al.: Evaluated kinetic and photochemical data for atmospheric chemistry 4303
Howard, C. J. and Evenson, K. M.: J. Chem. Phys., 64, 197, 1976.Jeong, K.-M. and Kaufman, F.: J. Phys. Chem., 86, 1808, 1982.Jeong, K.-M., Hsu, K.-J., Jeffries, J. B. and Kaufman, F.: J. Phys. Chem., 88, 1222, 1984.Paraskevopoulos, G., Singleton, D. L. and Irwin, R. S.: J. Phys. Chem., 85, 561, 1981.Perry, R. A., Atkinson, R. and Pitts, J. N. Jr.: J. Chem. Phys., 64, 1618, 1976.Watson, R. T., Machado, G., Conaway, B., Wagner, S. and Davis, D. D.: J. Phys. Chem., 81, 256, 1977.
www.atmos-chem-phys.net/8/4141/2008/ Atmos. Chem. Phys., 8, 4141–4496, 2008

4304 R. Atkinson et al.: Evaluated kinetic and photochemical data for atmospheric chemistry
IV.A2.116
HO + CHCl 3→ H2O + CCl3
1H ◦ = -104.6 kJ·mol−1
Rate coefficient data
k/cm3 molecule−1 s−1 Temp./K Reference Technique/Comments
Absolute Rate Coefficients(1.01± 0.15)× 10−13 296± 2 Howard and Evenson, 1976 DF-LMR4.69× 10−12 exp[-(1134± 108)/T ] 245-375 Davis et al., 1976 FP-RF(1.14± 0.07)× 10−13 2986.91× 10−20 T 2.65 exp[-(262± 398)/T ] 249-487 Jeong and Kaufman, 1982; DF-RF(1.01± 0.065)× 10−13 298 Jeong et al., 19844.65× 10−17 T 1.52 exp[-(261± 42)/T ] 295-775 Taylor et al., 1993 PLP-LIF (a)(1.12± 0.10)× 10−13 295
Relative Rate Coefficients1.53× 10−13 298 Cox et al., 1976 RR (b)1.46× 10⁻¹⁸ T 2 exp[-(85± 64)/T ] 288-357 Hsu and DeMore, 1994 RR (c)9.75× 10⁻¹⁴ 298
Comments
(a) These data supersede the earlier data from this group (Taylor et al., 1989).
(b) HO radicals were generated by the photolysis of HONO-air mixtures at 1.013 bar pressure. Relative rate coefficients wereobtained from measurements of the rates of NO formation as a function of the HONO and organic concentrations. Basedon the effect of CHCl3 on NO formation and a rate coefficient for the reaction of HO radicals with CH4 of 6.4× 10⁻¹⁵
cm3 molecule−1 s−1 at 298 K (IUPAC, current recommendation), the rate coefficient cited in the table is obtained.
(c) HO radicals were generated by the UV photolysis of O3 in the presence of water vapor. The concentrations of CHCl3and CH3CHF2 were measured by FTIR spectroscopy. The measured rate coefficient ratio ofk(HO + CHCl3)/k(HO +CH3CHF2) = (0.52± 0.11) exp[(495± 64)/T ] is placed on an absolute base by using a rate coefficient ofk(HO +CH3CHF2) = 2.80× 10⁻¹⁸ T 2 exp(-580/T ) cm3 molecule−1 s−1 (IUPAC, current recommendation).
Preferred Values
k = 1.05× 10⁻¹³ cm3 molecule−1 s−1 at 298 K.k = 1.8× 10⁻¹² exp(-850/T ) cm3 molecule−1 s−1 over the temperature range 240–300 K.
Reliability
1 log k =± 0.10 at 298 K.1 (E/R) =± 300 K.
Comments on Preferred Values
The measured rate data for this reaction exhibit a large amount of scatter, with the room temperature rate coefficients ofHoward and Evenson (1976), Davis et al. (1976), Jeong and Kaufman (1982), Taylor et al. (1993) and Hsu and DeMore
Atmos. Chem. Phys., 8, 4141–4496, 2008 www.atmos-chem-phys.net/8/4141/2008/

R. Atkinson et al.: Evaluated kinetic and photochemical data for atmospheric chemistry 4305
(1994) ranging from 9.75× 10⁻¹⁴ cm3 molecule−1 s−1 to 1.14× 10⁻¹³ cm3 molecule−1 s−1. Furthermore, the temperaturedependencies obtained by Davis et al. (1976), Jeong and Kaufman (1982), Taylor et al. (1993) and Hsu and DeMore (1994)differ significantly, with Davis et al. (1976) and Jeong and Kaufman (1982) determining larger temperature dependencies thanobtained by Taylor et al. (1992) and Hsu and DeMore (1994). Note that only two rate coefficients have been measured attemperatures<288 K, one by Davis et al. (1976) at 245 K and the other by Jeong and Kaufman (1982) at 249 K.
The 298 K preferred value is an average of the room temperature rate coefficients of Howard and Evenson (1976), Davis etal. (1976), Jeong and Kaufman (1982), Taylor et al. (1993) and Hsu and DeMore (1994). The temperature dependence for thetemperature range 240–300 K is obtained by averaging the Arrhenius activation energies centered on a mid-range temperature,Tm, of 265 K, with those of Jeong and Kaufman (1982), Taylor et al. (1993) and Hsu and DeMore (1994) being derived fromthe three parameter expressions cited in the table withB = D + 2Tm (the Arrhenius activation energies being 1134 K for theDavis et al. (1976) study, 964 K for the Jeong and Kaufman (1982) study, 664 K for the Taylor et al. (1993) study and 615K for the Hsu and DeMore (1994) study, all centered at 265 K). The preferred Arrhenius expression, which should not beused outside of the temperature range 240–300 K, leads to rate coefficients at 245 K and 249 K which are 28% and 8% higherthan those measured by Davis et al. (1976) and Jeong and Kaufman et al. (1982), respectively (note that the recommendedArrhenius expression for the temperature range 240–300 K is equivalent to the three parameter equationk = 3.47× 10⁻¹⁸ T 2
exp(-320/T ) cm3 molecule−1 s−1). Clearly, additional studies of this reaction covering the temperature range∼200–400 K areneeded.
References
Cox, R. A., Derwent, R. G., Eggleton, A. E. J. and Lovelock, J. E.: Atmos. Environ., 10, 305, 1976.Davis, D. D., Machado, G., Conaway, B., Oh, Y. and Watson, R. T.: J. Chem. Phys., 65, 1268, 1976.Howard, C. J. and Evenson, K. M.: J. Chem. Phys., 64, 197, 1976.Hsu, K.-J. and DeMore, W. B.: Geophys. Res. Lett., 21, 805, 1994.IUPAC: http://www,iupac-kinetic.ch.cam.ac.uk/, 2007.Jeong, K.-M. and Kaufman, F.: J. Phys. Chem., 86, 1808, 1982.Jeong, K.-M., Hsu, K.-J., Jeffries, J. B. and Kaufman, F.: J. Phys. Chem., 88, 1222, 1984.Taylor, P. H., Jiang, Z. and Dellinger, B.: Int. J. Chem. Kinet., 25, 9, 1993.Taylor, P. H., D’Angelo, J. A., Martin, M. C., Kasner, J. H. and Dellinger, B.: Int. J. Chem. Kinet., 21, 829, 1989.
www.atmos-chem-phys.net/8/4141/2008/ Atmos. Chem. Phys., 8, 4141–4496, 2008

4306 R. Atkinson et al.: Evaluated kinetic and photochemical data for atmospheric chemistry
IV.A2.117
HO + CF2Cl2→ HOCl + CF2Cl
1H ◦ = 99.0 kJ·mol−1
Rate coefficient data
k/cm3 molecule−1 s−1 Temp./K Reference Technique/Comments
Absolute Rate Coefficients<1× 10⁻¹⁵ 296-424 Atkinson et al., 1975 FP-RF<4× 10⁻¹⁶ 296± 2 Howard and Evenson, 1976 DF-LMR<6× 10⁻¹⁶ 478 Chang and Kaufman, 1977 DF-RF<1× 10⁻¹⁵ 293 Clyne and Holt, 1979 DF-RF
Relative Rate Coefficients<9× 10⁻¹⁷ 298 Cox et al., 1976 RR (a)
Comments
(a) HO radicals were generated by the photolysis of HONO-air mixtures at 1.013 bar pressure. Relative rate coefficients wereobtained from measurements of the rates of NO formation as a function of the HONO and organic concentrations. Basedon the lack of effect of CF2Cl2 on NO formation and a rate coefficient for the reaction of HO radicals with CH4 of 6.4×10⁻¹⁵ cm3 molecule−1 s−1 at 298 K (IUPAC, current recommendation), the upper limit to the rate coefficient cited in thetable is obtained.
Preferred Values
k <7× 10⁻¹⁸ cm3 molecule−1 s−1 at 298 K.k <1× 10⁻¹² exp(-3540/T ) cm3 molecule−1 s−1 over the temperature range 250-480 K.
Comments on Preferred Values
The studies of Atkinson et al. (1975), Cox et al. (1976), Howard and Evenson (1976), Chang and Kaufman (1977) andClyne and Holt (1979) all observed no reaction of HO radicals with CF2Cl2. The preferred upper limit Arrhenius expressionis obtained from an assumed Arrhenius pre-exponential factor of 1× 10⁻¹² cm3 molecule−1 s−1 and the upper limit ratecoefficient at 478 K measured by Chang and Kaufman (1977). The resulting upper limit Arrhenius expression yields a 298 Kupper limit rate coefficient which is consistent with the room temperature data of Atkinson et al. (1975), Cox et al. (1976),Howard and Evenson (1976) and Clyne and Holt (1979).
References
Atkinson, R., Hansen, D. A. and Pitts, J. N. Jr.: J. Chem. Phys., 63, 1703, 1975.Chang, J. S. and Kaufman, F.: Geophys. Res. Lett., 4, 192, 1977.Clyne, M. A. A. and Holt, P. M.: J. Chem. Soc. Faraday Trans. 2, 75, 569, 1979.Cox, R. A., Derwent, R. G., Eggleton, A. E. J. and Lovelock, J. E.: Atmos. Environ., 10, 305, 1976.Howard, C. J. and Evenson, K. M.: J. Chem. Phys., 64, 197, 1976.IUPAC: http://www.iupac-kinetic.ch.cam.ac.uk/, 2007.
Atmos. Chem. Phys., 8, 4141–4496, 2008 www.atmos-chem-phys.net/8/4141/2008/

R. Atkinson et al.: Evaluated kinetic and photochemical data for atmospheric chemistry 4307
IV.A2.118
HO + CFCl3→ HOCl + CFCl 2
1H ◦ = 80.6 kJ·mol−1
Rate coefficient data
k/cm3 molecule−1 s−1 Temp./K Reference Technique/Comments
Absolute Rate Coefficients<1× 10⁻¹⁵ 296-424 Atkinson et al., 1975 FP-RF<5× 10⁻¹⁶ 296± 2 Howard and Evenson, 1976 DF-LMR<5× 10⁻¹⁶ 480 Chang and Kaufman, 1977 DF-RF<1× 10⁻¹⁵ 293 Clyne and Holt, 1979 DF-RF
Relative Rate Coefficients<4× 10⁻¹⁷ 298 Cox et al., 1976 RR (a)
Comments
(a) HO radicals were generated by the photolysis of HONO-air mixtures at 1013 mbar pressure. Relative rate coefficientswere obtained from measurements of the rates of NO formation as a function of the HONO and organic concentrations.Based on the lack of effect of CFCl3 on NO formation and a rate coefficient for the reaction of HO radicals with CH4 of6.4× 10−15 cm3 molecule−1 s−1 at 298 K (IUPAC, current recommendation), the upper limit to the rate coefficient citedin the table is obtained.
Preferred Values
k <5× 10⁻¹⁸ cm3 molecule−1 s−1 at 298 K.k <1× 10⁻¹² exp(-3650/T ) cm3 molecule−1 s−1 over the temperature range 250-480 K.
Comments on Preferred Values
The studies of Atkinson et al. (1975), Cox et al. (1976), Howard and Evenson (1976), Chang and Kaufman (1977) and Clyneand Holt (1979) all observed no reaction of HO radicals with CFCl3. The preferred upper limit Arrhenius expression is obtainedfrom an assumed Arrhenius pre-exponential factor of 1× 10⁻¹² cm3 molecule−1 s−1 and the upper limit at 480 K measuredby Chang and Kaufman (1977). The resulting upper limit Arrhenius expression yields a 298 K upper limit rate coefficientwhich is consistent with the room temperature data of Atkinson et al. (1975), Cox et al. (1976), Howard and Evenson (1976)and Clyne and Holt (1979).
References
Atkinson, R., Hansen, D. A. and Pitts, J. N., Jr.: J. Chem. Phys., 63, 1703, 1975.Chang, J. S. and Kaufman, F.: Geophys. Res. Lett., 4, 192, 1977.Clyne, M. A. A. and Holt, P. M.: J. Chem. Soc. Faraday Trans. 2, 75, 569, 1979.Cox, R. A., Derwent, R. G., Eggleton, A. E. J. and Lovelock, J. E.: Atmos. Environ., 10, 305, 1976.Howard, C. J. and Evenson, K. M.: J. Chem. Phys., 64, 197, 1976.IUPAC: http://www.iupac-kinetic.ch.cam.ac.uk/, 2007.
www.atmos-chem-phys.net/8/4141/2008/ Atmos. Chem. Phys., 8, 4141–4496, 2008

4308 R. Atkinson et al.: Evaluated kinetic and photochemical data for atmospheric chemistry
IV.A2.119
HO + CCl4→ HOCl + CCl 3
1H ◦ = 51.7 kJ·mol−1
Rate coefficient data
k/cm3 molecule−1 s−1 Temp./K Reference Technique/Comments
Absolute Rate Coefficients<4× 10⁻¹⁵ 296± 2 Howard and Evenson, 1976 DF-LMR<1× 10⁻¹⁵ 293 Clyne and Holt, 1979 DF-RF
Relative Rate Coefficients<9× 10⁻¹⁷ 298 Cox et al., 1976 RR (a)
Comments
(a) HO radicals were generated by the photolysis of HONO-air mixtures at 1013 mbar pressure. Relative rate coefficientswere obtained from measurements of the rates of NO formation as a function of the HONO and organic concentrations.Based on the lack of effect of CCl4 on NO formation and a rate coefficient for the reaction of HO radicals with CH4 of6.4× 10−15 cm3 molecule−1 s−1 at 298 K (IUPAC, current recommendation), the upper limit to the rate coefficient citedin the table is obtained.
Preferred Values
k <5× 10⁻¹⁶ cm3 molecule−1 s−1 at 298 K.k <1× 10⁻¹² exp(-2260/T ) cm3 molecule−1 s−1 over the temperature range∼250–300 K.
Comments on Preferred Values
The studies of Cox et al. (1976), Howard and Evenson (1976) and Clyne and Holt (1979) all observed no reaction of HOradicals with CCl4. The preferred upper limit to the 298 K rate coefficient is based on the data of Cox et al. (1976), increasedby a factor of 5 to take into account uncertainties in the number of NO molecules reacted per CCl4 reacted, and the upper limitArrhenius expression combines the preferred upper limit rate coefficient at 298 K with an assumed Arrhenius pre-exponentialfactor of 1× 10⁻¹² cm3 molecule−1 s−1.
References
Clyne, M. A. A. and Holt, P. M.: J. Chem. Soc. Faraday Trans. 2, 75, 569, 1979.Cox, R. A., Derwent, R. G., Eggleton, A. E. J. and Lovelock, J. E.: Atmos. Environ., 10, 305, 1976.Howard, C. J. and Evenson, K. M.: J. Chem. Phys., 64, 197, 1976.IUPAC: http://www.iupac-kinetic.ch.cam.ac.uk/, 2007.
Atmos. Chem. Phys., 8, 4141–4496, 2008 www.atmos-chem-phys.net/8/4141/2008/

R. Atkinson et al.: Evaluated kinetic and photochemical data for atmospheric chemistry 4309
IV.A2.120
HO + C2HCl3→ products
Rate coefficient data
k/cm3 molecule−1 s−1 Temp./K Reference Technique/Comments
Absolute Rate Coefficients(2.0± 0.4)× 10−12 296 Howard, 1976 DF-LMR5.32× 10−13 exp[(445± 41)/T ] 234-420 Chang and Kaufman, 1977 DF-RF(2.37± 0.10)× 10−12 2962.11× 10−12 305 Kirchner, 1983 DF-MS7.80× 10−13 exp[(241± 61)/T ] 300-459 Kirchner et al., 1990 DF-MS(1.76± 0.17)× 10−12 3009.73× 10−13 exp[(158.7± 44.0)/T ] 291-650 Tichenor et al., 2000; 2001 PLP-LIF (a)1.66× 10⁻¹² 298
Relative Rate Coefficients(4.3± 1.3)× 10−12 305± 2 Winer et al., 1976 RR (b)(2.64± 0.37)× 10−12 296 Edney et al., 1986 RR (c)2.65× 10⁻¹² 300 Klopffer et al., 1986 RR (d)
Comments
(a) This study was stated to supersede the earlier study of Jiang et al. (1993). Tichenor et al. (2000) fit their data, obtainedover the temperature range 291–750 K, by the three parameter expressionk = 3.76× 10⁻²¹ T 2.76 exp[-(1266.3± 41.2)/T ]cm3 molecule−1 s−1.
(b) HO radicals were generated by the photolysis of NOx-organic-air mixtures at∼1 bar of air. Trichloroethene and2-methylpropene (the reference compound) were monitored by GC. The measured rate coefficient ratiok(HO +trichloroethene)/k(HO + 2-methylpropene) = 0.088 (±30%) is placed on an absolute basis by use of a rate coefficientof k(HO + 2-methylpropene) = 4.94× 10⁻¹¹ cm3 molecule−1 s−1 at 305 K (Atkinson, 1997).
(c) HO radicals were generated by the photolysis of CH3ONO-NO-air mixtures at∼1 bar of air. Trichloroethene and n-butane(the reference compound) were monitored by GC. The measured rate coefficient ratiok(HO + trichloroethene)/k(HO +n-butane) is placed on an absolute basis by use of a rate coefficient ofk(HO + n-butane) = 2.33× 10⁻¹² cm3 molecule−1
s−1 at 296 K (Atkinson, 2003).
(d) HO radicals were generated by the photolysis of NOx-organic-air mixtures at∼1 bar of air. Trichloroethene and toluene(the reference compound) were monitored by GC. The measured rate coefficient ratiok(HO + trichloroethene)/k(HO +toluene) is placed on an absolute basis by use of a rate coefficient ofk(HO + toluene) = 5.58× 10⁻¹² cm3 molecule−1
s−1 at 300 K (Calvert et al., 2002).
Preferred Values
k = 2.0× 10⁻¹² cm3 molecule−1 s−1 at 298 K.k = 3.0× 10⁻¹³ exp(565/T ) cm3 molecule−1 s−1 over the temperature range 230-300 K.
Reliability
1 log k =± 0.10 at 298 K.1 (E/R) =± 200 K.
www.atmos-chem-phys.net/8/4141/2008/ Atmos. Chem. Phys., 8, 4141–4496, 2008

4310 R. Atkinson et al.: Evaluated kinetic and photochemical data for atmospheric chemistry
Comments on Preferred Values
There is a significant degree of scatter in both the measured room temperature rate coefficients and the temperature dependenceof the rate coefficient, with the room temperature relative rate coefficient from the Winer et al. (1976) study being much higherthan those measured in the other studies (possibly because of the disparity between the reactivities of trichloroethene andthe reference compound used). An Arrhenius plot of the rate coefficients of Howard (1976), Chang and Kaufman (1977)and Tichenor et al. (2001) suggests curvature [as also concluded by Tichenor et al. (2000)]. Accordingly, the absolute ratecoefficients at≤650 K from the studies of Howard (1976), Chang and Kaufman (1977) and Tichenor et al. (2001) were fittedto the three parameter expressionk = CT 2 exp(-D/T ), resulting ink = 6.06× 10⁻¹⁹ T 2 exp(1084/T ) cm3 molecule−1 s−1
over the temperature range 234–650 K. The preferred Arrhenius expression,k = A exp(-B/T ), is centered on a mid-rangetemperature,Tm, of 260 K and is obtained from the three parameter equation withA = C e2 T 2
m andB = D + 2Tm. The roomtemperature rate coefficients measured by Kirchner (1983), Edney et al. (1986), Klopffer et al. (1986) and Kirchner et al.(1990), which are not used in the derivation of the preferred values, are in general agreement with the preferred values, and thetemperature dependence reported by Kirchner et al. (1990) over the temperature range 300–459 K ofB = -241± 61 K is inreasonable agreement with the value ofB = -364 K derived from the preferred three parameter expression centered on aTm of360 K.
The reaction proceeds by initial HO radical addition to form the HOCHClCCl2 and HOCCl2CHCl radicals, which underatmospheric conditions lead to the formation of Cl atoms, HC(O)Cl, C(O)Cl2 and other, as yet unidentified, products (Tuazonet al., 1988; Kleindienst et al., 1989).
References
Atkinson, R.: J. Phys. Chem. Ref. Data, 26, 215, 1997.Atkinson, R.: Atmos. Chem. Phys., 3, 2233, 2003.Calvert, J. G., Atkinson, R., Becker, K. H., Kamens, R. M., Seinfeld, J. H., Wallington, T. J. and Yarwood, G.: TheMechanisms of Atmospheric Oxidation of Aromatic Hydrocarbons, Oxford University Press, New York, NY, 2002.Chang, J. S. and Kaufman, F.: J. Chem. Phys., 66, 4989, 1977.Edney, E. O., Kleindienst, T. E. and Corse, E. W.: Int. J. Chem. Kinet., 18, 1355, 1986.Howard, C. J.: J. Chem. Phys., 65, 4771, 1976.Jiang, Z., Taylor, P. H. and Dellinger, B.: J. Phys. Chem., 97, 5050, 1993.Kirchner, K.: Chimia, 37, 1, 1983.Kirchner, K., Helf, D., Ott, P. and Vogt, S.: Ber. Bunsenges. Phys. Chem., 94, 77, 1990.Kleindienst, T. E., Shepson, P. B., Nero, C. and Bufalini, J. J.: Int. J. Chem. Kinet., 21, 863, 1989.Kl opffer, W., Frank, R., Kohl, E.-G. and Haag, F.: Chemiker-Zeitung, 110, 57, 1986.Tichenor, L. A. B., Lozada-Ruiz, A. J., Yamada, T., El-Sinawi, A., Taylor, P. H., Peng, J., Hu, X. and Marshall, P.: Proc.Combustion Institute, 28, 1495, 2000.Tichenor, L. B., El-Sinawi, A., Yamada, T., Taylor, P. H., Peng, J., Hu, X. and Marshall, P.: Chemosphere, 42, 571, 2001.Tuazon, E. C., Atkinson, R., Aschmann, S. M., Goodman, M. A. and Winer, A. M.: Int. J. Chem. Kinet., 20, 241, 1988.Winer, A. M., Lloyd, A. C., Darnall, K. R. and Pitts, J. N. Jr.: J. Phys. Chem., 80, 1635, 1976.
Atmos. Chem. Phys., 8, 4141–4496, 2008 www.atmos-chem-phys.net/8/4141/2008/

R. Atkinson et al.: Evaluated kinetic and photochemical data for atmospheric chemistry 4311
IV.A2.121
HO + C2Cl4→ products
Rate coefficient data
k/cm3 molecule−1 s−1 Temp./K Reference Technique/Comments
Absolute Rate Coefficients(1.70± 0.34)× 10−13 296 Howard, 1976 DF-LMR9.44× 10−12 exp[-(1199± 55)/T ] 297-420 Chang and Kaufman, 1977 DF-RF(1.69± 0.07)× 10−13 2975.53× 10−12 exp[-(1034± 13)/T ] 301-433 Kirchner, 1983; DF-MS(1.73± 0.17)× 10−13 301 Kirchner et al., 19901.93× 10−22 T 3.2 exp[(660.8± 54.6)/T ] 296.5-714 Tichenor et al., 2000 PLP-LIF (a)(1.45± 0.16)× 10−13 296.51.53× 10−12 exp[-(688.2± 67.5)/T ] 293-720 Tichenor et al., 2001 PLP-LIF(1.52± 0.17)× 10−13 293
Relative Rate Coefficients(2.2± 0.7)× 10−12 305± 2 Winer et al., 1976 RR (b)
Comments
(a) Tichenor et al. (2000) also fit their data to an Arrhenius expression, obtainingk = 1.68× 10⁻¹² exp[-(764.2± 79.1)/T ]cm3 molecule−1 s−1 over the same temperature range of 296.5–714 K.
(b) HO radicals were generated by the photolysis of NOx-organic-air mixtures at∼1 bar of air. Tetrachloroetheneand 2-methylpropene (the reference compound) were monitored by GC. The measured rate coefficient ratiok(HO +tetrachloroethene)/k(HO + 2-methylpropene) = 0.044 (±30%) is placed on an absolute basis by use of a rate coefficientof k(HO + 2-methylpropene) = 4.94× 10⁻¹¹ cm3 molecule−1 s−1 at 305 K (Atkinson, 1997).
Preferred Values
k = 1.6× 10⁻¹³ cm3 molecule−1 s−1 at 298 K.k = 3.5× 10⁻¹² exp(-920/T ) cm3 molecule−1 s−1 over the temperature range 290-420 K.
Reliability
1 log k =± 0.10 at 298 K.1 (E/R) =± 300 K.
Comments on Preferred Values
The room temperature absolute rate coefficients of Howard (1976), Chang and Kaufman (1977), Kirchner (1983), Kirchner etal. (1990) and Tichenor et al. (2000; 2001) are in good agreement. The relative rate coefficient of Winer et al. (1976) at 305 Kis an order of magnitude higher, presumably in part because of the large difference in reactivities of tetrachloroethene and the2-methylpropene reference compound. The preferred 298 K value is derived from the mean of the values of Howard (1976),Chang and Kaufman (1977), Kirchner et al. (1990), Tichenor et al. (2000) and Tichenor et al. (2001). The temperature depen-dence of the rate coefficient is the average of the Arrhenius activation energies reported by Chang and Kaufman, Kirchener etal. (1990), Tichenor et al. (2000) and Tichenor et al. (2001), with the pre-exponential factor being adjusted to fit the 298 Kpreferred value. No rate coefficients are available below 290 K, and additional studies involving measurements down to≤ 220K are clearly needed.
www.atmos-chem-phys.net/8/4141/2008/ Atmos. Chem. Phys., 8, 4141–4496, 2008

4312 R. Atkinson et al.: Evaluated kinetic and photochemical data for atmospheric chemistry
The reaction proceeds by initial HO radical addition to form the HOCCl2CCl2 radical, which under atmospheric conditionsleads to the formation of Cl atoms, C(O)Cl2 and other, as yet unidentified, products (Tuazon et al., 1988). The molar formationyield of C(O)Cl2 was measured by Tuazon et al. (1988) to be∼0.5 in both the presence and absence of a Cl atom scavenger.
References
Atkinson, R.: J. Phys. Chem. Ref. Data, 26, 215, 1997.Chang, J. S. and Kaufman, F.: J. Chem. Phys., 66, 4989, 1977.Howard, C. J.: J. Chem. Phys., 65, 4771, 1976.Kirchner, K.: Chimia, 37, 1, 1983.Kirchner, K., Helf, D., Ott, P. and Vogt, S.: Ber. Bunsenges. Phys. Chem., 94, 77, 1990.Tichenor, L. B., Graham, J. L., Yamada, T., Taylor, P. H., Peng, J., Hu, X. and Marshall, P.: J. Phys. Chem. A, 104, 1700,2000.Tichenor, L. B., El-Sinawi, A., Yamada, T., Taylor, P. H., Peng, J., Hu, X. and Marshall, P.: Chemosphere, 42, 571, 2001.Tuazon, E. C., Atkinson, R., Aschmann, S. M., Goodman, M. A. and Winer, A. M.: Int. J. Chem. Kinet., 20, 241, 1988.Winer, A. M., Lloyd, A. C., Darnall, K. R. and Pitts, J. N., Jr.: J. Phys. Chem., 80, 1635, 1976.
Atmos. Chem. Phys., 8, 4141–4496, 2008 www.atmos-chem-phys.net/8/4141/2008/

R. Atkinson et al.: Evaluated kinetic and photochemical data for atmospheric chemistry 4313
IV.A2.122
HO + CH3CF2Cl→ H2O + CH2CF2Cl
Rate coefficient data
k/cm3 molecule−1 s−1 Temp./K Reference Technique/Comments
Absolute Rate Coefficients(2.83± 0.42)× 10−15 296 Howard and Evenson, 1976 DF-LMR1.15× 10−12 exp[-(1748± 30)/T ] 273-375 Watson et al., 1977 FP-RF(3.22± 0.48)× 10−15 2981.8× 10−12 exp[-(1790± 150)/T ] 293-373 Handwerk and Zellner, 1978 FP-RA(3.7± 0.7)× 10−15 2933.3× 10−12 exp[-(1800± 300)/T ] 293-417 Clyne and Holt, 1979 DF-RF(6.7± 1.3)× 10−15 298(4.63± 1.73)× 10−15 297 Paraskevopoulos et al., 1981 FP-RA9.8× 10−13 exp[-(1660± 200)/T ] 270-400 Liu et al., 1990 FP-RF(4.02± 1.0)× 10−15 2982.6× 10−13 exp[-(1230± 250)/T ] 231-423 Brown et al., 1990 DF-RF(3.7± 1.4)× 10−15 3031.14× 10−12 exp[-(1750± 75)/T ] 223-374 Gierczak et al., 1991 DF-LMR/FP-LIF (a)(2.95± 0.25)× 10−15 298(2.45± 0.31)× 10−15 270 Zhang et al., 1992 FP-RF(2.6± 0.4)× 10−15 293 Mors et al., 1996 PLP-A2.05× 10−30 T 6.01 exp[(308± 522)/T ] 295-808 Fang et al., 1997 PLP-LIF(3.77± 0.43)× 10−15 295
Relative Rate Coefficients3.5× 10−15 298 Cox et al., 1976 RR (b)
Comments
(a) Experiments were carried out over the temperature range 223–427 K.
(b) HO radicals were generated by the photolysis of HONO-air mixtures at 1.013 bar pressure. Relative rate coefficients wereobtained from measurements of the rates of NO formation as a function of the HONO and organic concentrations. Basedon the effect of CH3CF2Cl on NO formation and a rate coefficient for the reaction of HO radicals with CH4 of 6.4×10⁻¹⁵ cm3 molecule−1 s−1 at 298 K (IUPAC, current recommendation), the rate coefficient cited in the table is obtained.
Preferred Values
k = 3.0× 10⁻¹⁵ cm3 molecule−1 s−1 at 298 K.k = 8.5× 10⁻¹³ exp(-1685/T ) cm3 molecule−1 s−1 over the temperature range 220-300 K.
Reliability
1 log k =± 0.10 at 298 K.1 (E/R) =± 200 K.
www.atmos-chem-phys.net/8/4141/2008/ Atmos. Chem. Phys., 8, 4141–4496, 2008

4314 R. Atkinson et al.: Evaluated kinetic and photochemical data for atmospheric chemistry
Comments on Preferred Values
The rate coefficients obtained exhibit a large degree of scatter, especially at temperatures≤305 K. In particular, the ratecoefficients of Clyne and Holt (1979) and Brown et al. (1990) and, to a lesser extent, those of Handwerk and Zellner (1978),Paraskevopoulos et al. (1981), Liu et al. (1990), Zhang et al. (1992) and Fang et al. (1997) at room temperature and beloware higher than those of Howard and Evenson (1976), Watson et al. (1977), Gierczak et al. (1991) and Mors et al. (1996).Accordingly, the absolute rate coefficients of Howard and Evenson (1976), Watson et al. (1977), Gierczak et al. (1991) andMors et al. (1996) have been fitted to the three parameter equationk = CT 2 exp(-D/T ), resulting ink = 1.77× 10⁻¹⁸ T 2
exp(-1174/T ) cm3 molecule−1 s−1 over the temperature range 223–427 K. The preferred Arrhenius expression,k = A exp(-B/T ), is centered on a mid-range temperature,Tm, of 255 K and is obtained from the three parameter equation withA = C e2
T 2m andB = D + 2Tm.
References
Brown, A. C., Canosa-Mas, C. E., Parr, A. D. and Wayne, R. P.: Atmos. Environ., 24A, 2499, 1990.Clyne, M. A. A. and Holt, P. M.: J. Chem. Soc. Faraday Trans. 2, 75, 582, 1979.Cox, R. A., Derwent, R. G., Eggleton, A. E. J. and Lovelock, J. E.: Atmos. Environ., 10, 305, 1976.Fang, T. D., Taylor, P. H., Dellinger, B., Ehlers, C. J. and Berry, R. J.: J. Phys. Chem. A, 101, 5758, 1997.Gierczak, T., Talukdar, R., Vaghjiani, G. L., Lovejoy, E. R. and Ravishankara, A. R.: J. Geophys. Res., 96, 5001, 1991.Handwerk, V. and Zellner, R.: Ber. Bunsenges. Phys. Chem., 82, 1161, 1978.Howard, C. J. and Evenson, K. M.: J. Chem. Phys., 64, 4303, 1976.IUPAC: http://www.iupac-kinetic.ch.cam.ac.uk/, 2007.Liu, R., Huie, R. E. and Kurylo, M. J.: J. Phys. Chem., 94, 3247, 1990.Mors, V., Hoffmann, A., Malms, W. and Zellner, R.: Ber. Bunsenges. Phys. Chem., 100, 540, 1996.Paraskevopoulos, G., Singleton, D. L. and Irwin, R. S.: J. Phys. Chem., 85, 561, 1981.Watson, R. T., Machado, G., Conaway, B., Wagner, S. and Davis, D. D.: J. Phys. Chem., 81, 256, 1977.Zhang, Z., Huie, R. E. and Kurylo, M. J.: J. Phys. Chem., 96, 1533, 1992.
Atmos. Chem. Phys., 8, 4141–4496, 2008 www.atmos-chem-phys.net/8/4141/2008/

R. Atkinson et al.: Evaluated kinetic and photochemical data for atmospheric chemistry 4315
IV.A2.123
HO + CH3CFCl2→ H2O + CH2CFCl2
Rate coefficient data
k/cm3 molecule−1 s−1 Temp./K Reference Technique/Comments
Absolute Rate Coefficients3.6× 10−13 exp[-(1140± 210)/T ] 243-400 Liu et al., 1990 FP-RF(7.01± 1.2)× 10−15 2985.8× 10−13 exp[-(1100± 250)/T ] 238-426 Brown et al., 1990 DF-RF(1.61± 0.55)× 10−14 2971.47× 10−12 exp[-(1640± 100)/T ] 253-393 Talukdar et al., 1991 PLP-LIF/DF-LMR (a)(5.92± 0.54)× 10−15 298(1.82± 0.65)× 10−15 250 Zhang et al., 1992 FP-RF (b)(2.01± 0.90)× 10−15 250(3.39± 0.82)× 10−15 270(4.80± 1.46)× 10−15 2972.4× 10−12 exp[-(1790± 100)/T ] 298-479 Lancar et al., 1993 DF-EPR(5.7± 1.5)× 10−15 298(4.6± 0.8)× 10−15 293 Mors et al., 1996 FP-A
Relative Rate Coefficients9.07× 10−21 T 2.82 exp[-(798± 105)/T ] 298-358 Huder and DeMore, 1993 RR (c,d)5.91× 10⁻¹⁵ 2981.78× 10−18 T 2 exp[-(984± 28)/T ] 298-358 Huder and DeMore, 1993 RR (c,e)5.85× 10⁻¹⁵ 298
Comments
(a) Experiments were carried out down to 233 K, using highly purified samples. In the pulsed laser photolysis experiments,photolysis of HONO was used as the HO radical source to avoid photolysis of CH3CFCl2. An Arrhenius plot of the entiredataset showed curvature at the two lowest temperatures studied (233 and 249 K), and the cited Arrhenius expression wasderived using only the rate coefficients measured at≥253 K.
(b) HO radicals were generated by the pulsed photolysis of H2O. Experiments carried out with reduced flash energies or watervapor concentrations (resulting in lower initial HO radical concentrations) led to the lower measured rate coefficients citedin the table. These data supersede those of Liu et al. (1990) at 243–298 K.
(c) HO radicals were generated by the photolysis of H2O-O3 mixtures at 254 nm in H2O-O3-CH3CFCl2-CH4 (or CH3CCl3)-Ar-O2 mixtures. The concentrations of CH3CFCl2 and CH4 (or CH3CCl3) were measured by FTIR spectroscopy. Themeasured rate coefficient ratios ofk(HO + CH3CFCl2)/k(HO + CH4) = (0.49± 0.16) exp[(189± 105)/T ] andk(HO +CH3CFCl2/k(HO + CH3CCl3) = (0.79± 0.07) exp[-(74± 28)/T ] are placed on an absolute basis by use of rate coefficientsof k(HO + CH4) = 1.85× 10⁻²⁰ T 2.82 exp(-987/T ) cm3 molecule−1 s−1 (IUPAC, current recommendation) andk(HO +CH3CCl3) = 2.25× 10⁻¹⁸ T 2 exp(-910/T ) cm3 molecule−1 s−1 (IUPAC, current recommendation).
(d) Relative tok(HO + CH4).
(e) Relative tok(HO + CH3CCl3).
Preferred Values
k = 5.8× 10⁻¹⁵ cm3 molecule−1 s−1 at 298 K.k = 8.1× 10⁻¹³ exp(-1470/T ) cm3 molecule−1 s−1 over the temperature range 220-300 K.
www.atmos-chem-phys.net/8/4141/2008/ Atmos. Chem. Phys., 8, 4141–4496, 2008

4316 R. Atkinson et al.: Evaluated kinetic and photochemical data for atmospheric chemistry
Reliability
1 log k =± 0.1 at 298 K.1 (E/R) =± 200 K.
Comments on Preferred Values
The absolute rate coefficients of Brown et al. (1990) are higher than those from the absolute rate studies of Liu et al. (1990),Talukdar et al. (1991), Zhang et al. (1992), Lancar et al. (1993) and Mors et al. (1996) at all temperatures studied, and the ratecoefficients of Liu et al. (1990) at temperatures≤ 298 K are significantly higher than those of Talukdar et al. (1991), Zhang etal. (1992), Lancar et al. (1993) and Mors et al. (1996). The measurements of Zhang et al. (1992) show that the earlier lowertemperature (≤298 K) data of Liu et al. (1990) were in error due to the occurrence of secondary reactions of HO radicals withreaction products. The rate coefficients of Talukdar et al. (1991), Zhang et al. (1992) [obtained at low flash energies and/orlow water vapor concentrations and with high associated uncertainties], Lancar et al. (1993), Mors et al. (1996) and Huder andDeMore (1993) are in good agreement, as are those of Talukdar et al. (1991) and Liu et al. (1990) at temperatures≥ 330 K.
The rate coefficients of Talukdar et al. (1991), Zhang et al. (1992), Lancar et al. (1993) and Mors et al. (1996) have beenfitted to the three parameter equationk = CT 2 exp(-D/T ), resulting ink = 1.68× 10⁻¹⁸ T 2 exp(-962/T ) cm3 molecule−1
s−1 over the temperature range 233–479 K. The preferred Arrhenius expression,k = A exp(-B/T ), is centered on a mid-rangetemperature,Tm, of 255 K and is obtained from the three parameter equation withA = C e2 T 2
m andB = D + 2Tm. Therate coefficients of Huder and DeMore (1993) over the temperature range 298–358 K, obtained relative to the reactions of HOradicals with CH4 and CH3CCl3, agree to within 6% with those calculated from the preferred three parameter expression.
References
Brown, A. C., Canosa-Mas, C. E., Parr, A. D. and Wayne, R. P.: Atmos. Environ., 24A, 2499, 1990.Huder, K. and DeMore, W. B.: Geophys. Res. Lett., 20, 1575, 1993.IUPAC: http://www.iupac-kinetic.ch.cam.ac.uk/, 2007.Lancar, I., Le Bras, G. and Poulet, G.: J. Chim. Phys., 90, 1897, 1993.Liu, R., Huie, R. E. and Kurylo, M. J.: J. Phys. Chem., 94, 3247, 1990.Mors, V., Hoffmann, A., Malms, W. and Zellner, R.: Ber. Bunsenges. Phys. Chem., 100, 540, 1996.Talukdar, R., Mellouki, A., Gierczak, T., Burkholder, J. B., McKeen, S. A. and Ravishankara, A. R.: J. Phys. Chem., 95, 5815,1991.Zhang, Z., Huie, R. E. and Kurylo, M. J.: J. Phys. Chem., 96, 1533, 1992.
Atmos. Chem. Phys., 8, 4141–4496, 2008 www.atmos-chem-phys.net/8/4141/2008/

R. Atkinson et al.: Evaluated kinetic and photochemical data for atmospheric chemistry 4317
IV.A2.124
HO + CH3CCl3→ H2O + CH2CCl3
Rate coefficient data
k/cm3 molecule−1 s−1 Temp./K Reference Technique/Comments
Absolute Rate Coefficients(1.5± 0.3)× 10−14 296 Howard and Evenson, 1976 DF-LMR3.72× 10−12 exp[-(1627± 50)/T ] 260-375 Watson et al., 1977 FP-RF(1.59± 0.16)× 10−14 2981.95× 10−12 exp[-(1331± 37)/T ] 275-406 Chang and Kaufman, 1977 DF-RF(2.19± 0.26)× 10−14 2982.4× 10−12 exp[-(1394± 113)/T ] 293-430 Clyne and Holt, 1979 DF-RF(1.81± 0.16)× 10−14 2935.04× 10−12 exp[-(1797± 65)/T ] 278-457 Jeong and Kaufman, 1979; DF-RF (a)(1.06± 0.11)× 10−14 293 Jeong et al., 19845.4× 10−12 exp[-(1810± 100)/T ] 253-363 Kurylo et al., 1979 FP-RF(1.08± 0.20)× 10−14 2965.4× 10−12 exp[-(1810± 448)/T ] 359-402 Nelson et al., 1990 PR-RA1.3× 10−14 2989.1× 10−13 exp[-(1337± 150)/T ] 278-378 Finlayson-Pitts et al., 1992 DF-RF(1.0± 0.1)× 10−14 2981.75× 10−12 exp[-(1550± 100)/T ] 233-379 Talukdar et al., 1992 PLP-LIF/FP-LIF(9.5± 0.8)× 10−15 2982.78× 10−18 T 2.08 exp[-(1068± 108)/T ] 298-761 Jiang et al., 1992 PLP-LIF(1.1± 0.1)× 10−14 298(1.2± 0.2)× 10−14 298 Lancar et al., 1993 DF-EPR
Relative Rate Coefficients2.57× 10−14 298 Cox et al., 1976 RR (b)(9.0± 0.29)× 10−15 298± 3 Nelson et al., 1990 RR (c)1.15× 10⁻²⁰ T 2.82 exp(-696/T ) 277-356 DeMore, 1992 RR (d)(1.06± 0.05)× 10−14 298
Comments
(a) The data were also fitted to a three parameter expression, resulting ink = 5.95× 10⁻²⁰ T 2.65 exp[-(858± 866)/T ] cm3
molecule−1 s−1.
(b) HO radicals were generated by the photolysis of CH3ONO-NO-air mixtures at 1.013 bar pressure. Relative rate coeffi-cients were obtained from measurements of the rates of NO formation as a function of the HONO and organic concentra-tions. Based on the effect of CH3CCl3 on NO formation and a rate coefficient for the reaction of HO radicals with CH4of 6.4× 10⁻¹⁵ cm3 molecule−1 s−1 at 298 K (IUPAC, current recommendation), the rate coefficient cited in the table isobtained.
(c) HO radicals were generated by the photolysis of HONO-air mixtures at 987 mbar pressure. CH3CCl3 and CH3Cl(the reference compound) were monitored during the experiments by GC. The measured rate coefficient ratiok(HO +CH3CCl3)/k(HO + CH3Cl) is placed on an absolute basis by use of a rate coefficient ofk(HO + CH3Cl) = 3.6× 10⁻¹⁴
cm3 molecule−1 s−1 at 298 K (IUPAC, current recommendation).
(d) HO radicals were generated by the photolysis of O3 at 254 nm in H2O-O3-CH3CCl3-CH4-Ar-O2 mixtures. The con-centrations of CH3CCl3 and CH4 were measured by FTIR spectroscopy. The measured rate coefficient ratios ofk(HO +
www.atmos-chem-phys.net/8/4141/2008/ Atmos. Chem. Phys., 8, 4141–4496, 2008

4318 R. Atkinson et al.: Evaluated kinetic and photochemical data for atmospheric chemistry
CH3CCl3)/k(HO + CH4) = 0.62 exp(291/T ) is placed on an absolute basis by use of a rate coefficient ofk(HO + CH4) =1.85× 10⁻²⁰ T 2.82 exp(-987/T ) cm3 molecule−1 s−1 (IUPAC, current recommendation).
Preferred Values
k = 9.5× 10⁻¹⁵ cm3 molecule−1 s−1 at 298 K.k = 1.2× 10⁻¹² exp(-1440/T ) cm3 molecule−1 s−1 over the temperature range 240–300 K.
Reliability
1 log k =± 0.10 at 298 K.1 (E/R) =± 200 K.
Comments on Preferred Values
The absolute rate coefficients of Finlayson-Pitts et al. (1992) and Talukdar et al. (1992) are lower than the data from the studiesof Howard and Evenson (1976), Watson et al. (1977), Chang and Kaufman (1977), Clyne and Holt (1979), Jeong and Kaufman(1979), Kurylo et al. (1979), Nelson et al. (1990), Jiang et al. (1992) and Lancar et al. (1993), in part due to the presenceof reactive CH2=CCl2 impurities in the CH3CCl3 samples used (Jeongand Kaufman, 1979; Kurylo et al., 1979) and/or theformation of CH2=CCl2 from thermal decomposition of CH3CCl3 on surfaces (Finlayson-Pitts et al., 1992; Talukdar et al.,1992). A unit-weighted least-squares analysis of the absolute rate coefficients of Finlayson-Pitts et al. (1992) and Talukdar etal. (1992), using the expressionk = CT 2 exp(-D/T ), leads tok = 2.25× 10⁻¹⁸ T 2 exp(-910/T ) cm3 molecule−1 s−1 over thetemperature range 243–379 K. The preferred Arrhenius expression,k = A exp(-B/T), is centered on a mid-range temperature,Tm, of 265 K and is obtained from the three parameter equation withA = C e2 T 2
m andB = D + 2Tm.The relative rate coefficients of DeMore (1992) are slightly higher than the recommendation over the temperature range
studied (277–356 K), by 11–15%.
References
Chang, J. S. and Kaufman, F.: J. Chem. Phys., 66, 4989, 1977.Clyne, M. A. A. and Holt, P. M.: J. Chem. Soc. Faraday Trans. 2, 75, 569, 1979.Cox, R. A., Derwent, R. G., Eggleton, A. E. J. and Lovelock, J. E.: Atmos. Environ., 10, 305, 1976.DeMore, W. B.: Geophys. Res. Lett., 19, 1367, 1992.Finlayson-Pitts, B. J., Ezell, M. J., Jayaweera, T. M., Berko, H. N. and Lai, C. C.: Geophys. Res. Lett., 19, 1371, 1992.Howard, C. J. and Evenson, K. M.: J. Chem. Phys., 64, 4303, 1976.IUPAC: http://www.iupac-kinetic.ch.cam.ac.uk/, 2007.Jeong, K.-M. and Kaufman, F.: Geophys. Res. Lett., 6, 757, 1979.Jeong, K.-M., Hsu, K.-J., Jeffries, J. B. and Kaufman, F.: J. Phys. Chem., 88, 1222, 1984.Jiang, Z., Taylor, P. H. and Dellinger, B.: J. Phys. Chem., 96, 8961, 1992.Kurylo, M. J., Anderson, P. C. and Klais, O.: Geophys. Res. Lett., 6, 760, 1979.Lancar, I., Le Bras, G. and Poulet, G.: J. Chim. Phys., 90, 1897, 1993.Nelson, L., Shanahan, I., Sidebottom, H. W., Treacy, J. and Nielsen, O. J.: Int. J. Chem. Kinet., 22, 577, 1990.Talukdar, R. K., Mellouki, A., Schmoltner, A.-M., Watson, T., Montzka, S. and Ravishankara, A. R.: Science, 257, 227, 1992.Watson, R. T., Machado, G., Conaway, B., Wagner, S. and Davis, D. D.: J. Phys. Chem., 81, 256, 1977.
Atmos. Chem. Phys., 8, 4141–4496, 2008 www.atmos-chem-phys.net/8/4141/2008/

R. Atkinson et al.: Evaluated kinetic and photochemical data for atmospheric chemistry 4319
IV.A2.125
HO + CH2ClCF3→ H2O + CHClCF3
Rate coefficient data
k/cm3 molecule−1 s−1 Temp./K Reference Technique/Comments
Absolute Rate Coefficients(1.05± 0.23)× 10−14 296 Howard and Evenson, 1976 DF-LMR1.1× 10−12 exp[-(1260± 60)/T ] 263-373 Handwerk and Zellner, 1978 FP-RA(1.5± 0.3)× 10−14 2933.3× 10−11 exp[-(2300± 300)/T ] 294-427 Clyne and Holt, 1979 DF-RF(1.03± 0.30)× 10−14 2943.06× 10−18 T 1.91 exp[-(644± 313)/T ] 295-866 Fang et al., 1999 PLP-LIF(1.76± 0.25)× 10−14 295
Preferred Values
k = 1.4× 10⁻¹⁴ cm3 molecule−1 s−1 at 298 K.k = 5.6× 10⁻¹³ exp(-1100/T ) cm3 molecule−1 s−1 over the temperature range 260-380 K.
Reliability
1 log k =± 0.15 at 298 K.1 (E/R) =± 200 K.
Comments on Preferred Values
The temperature dependence of the rate coefficients obtained by Clyne and Holt (1979) is significantly higher than thosemeasured by Handwerk and Zellner (1978) and Fang et al. (1999), and, as is the case for other haloalkanes, the data ofClyne and Holt (1979) are therefore not used in the evaluation. The rate coefficients of Fang et al. (1999) are consistentlyhigher, by 10-20%, than those of Handwerk and Zellner over the temperature range common to both studies (295–373 K). Thepreferred temperature dependence is that obtained from a unit-weighted least-squares analysis of the data of Handwerk andZellner (1978), and the preferred 298 K rate coefficient is the average of those of Howard and Evenson (1976) and Handwerkand Zellner (1978) corrected to 298 K. The pre-exponential factor is adjusted to fit the 298 K preferred rate coefficient. Thetemperature dependence of the rate data of Fang et al. (1999) corresponds to a value ofB in the Arrhenius expression, centeredon a mid-range temperature,Tm, of 300 K, ofB = 1217 K, in good agreement with the recommendation.
References
Clyne, M. A. A. and Holt, P. M.: J. Chem. Soc. Faraday Trans. 2, 75, 582, 1979.Fang, T. D., Taylor, P. H. and Berry, R. J.: J. Phys. Chem. A, 103, 2700, 1999.Handwerk, V. and Zellner, R.: Ber. Bunsenges. Phys. Chem., 82, 1161, 1978.Howard, C. J. and Evenson, K. M.: J. Chem. Phys., 64, 4303, 1976.
www.atmos-chem-phys.net/8/4141/2008/ Atmos. Chem. Phys., 8, 4141–4496, 2008
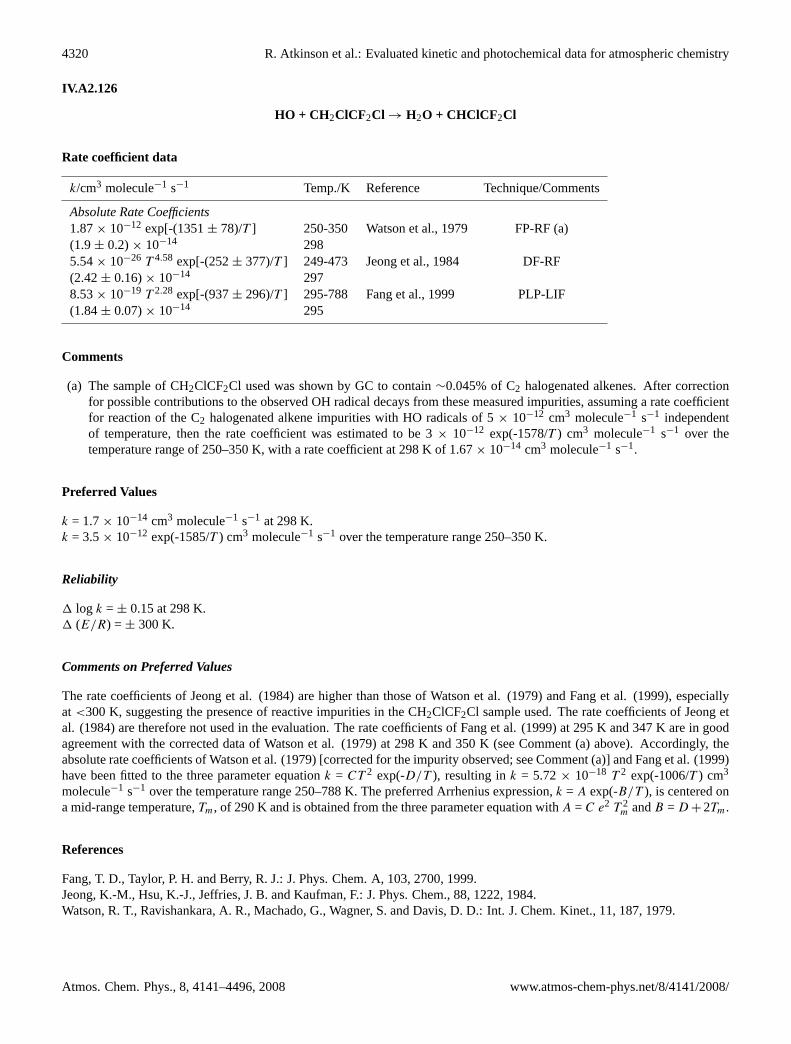
4320 R. Atkinson et al.: Evaluated kinetic and photochemical data for atmospheric chemistry
IV.A2.126
HO + CH2ClCF2Cl→ H2O + CHClCF2Cl
Rate coefficient data
k/cm3 molecule−1 s−1 Temp./K Reference Technique/Comments
Absolute Rate Coefficients1.87× 10−12 exp[-(1351± 78)/T ] 250-350 Watson et al., 1979 FP-RF (a)(1.9± 0.2)× 10−14 2985.54× 10−26 T 4.58 exp[-(252± 377)/T ] 249-473 Jeong et al., 1984 DF-RF(2.42± 0.16)× 10−14 2978.53× 10−19 T 2.28 exp[-(937± 296)/T ] 295-788 Fang et al., 1999 PLP-LIF(1.84± 0.07)× 10−14 295
Comments
(a) The sample of CH2ClCF2Cl used was shown by GC to contain∼0.045% of C2 halogenated alkenes. After correctionfor possible contributions to the observed OH radical decays from these measured impurities, assuming a rate coefficientfor reaction of the C2 halogenated alkene impurities with HO radicals of 5× 10⁻¹² cm3 molecule−1 s−1 independentof temperature, then the rate coefficient was estimated to be 3× 10⁻¹² exp(-1578/T ) cm3 molecule−1 s−1 over thetemperature range of 250–350 K, with a rate coefficient at 298 K of 1.67× 10⁻¹⁴ cm3 molecule−1 s−1.
Preferred Values
k = 1.7× 10⁻¹⁴ cm3 molecule−1 s−1 at 298 K.k = 3.5× 10⁻¹² exp(-1585/T ) cm3 molecule−1 s−1 over the temperature range 250–350 K.
Reliability
1 log k =± 0.15 at 298 K.1 (E/R) =± 300 K.
Comments on Preferred Values
The rate coefficients of Jeong et al. (1984) are higher than those of Watson et al. (1979) and Fang et al. (1999), especiallyat <300 K, suggesting the presence of reactive impurities in the CH2ClCF2Cl sample used. The rate coefficients of Jeong etal. (1984) are therefore not used in the evaluation. The rate coefficients of Fang et al. (1999) at 295 K and 347 K are in goodagreement with the corrected data of Watson et al. (1979) at 298 K and 350 K (see Comment (a) above). Accordingly, theabsolute rate coefficients of Watson et al. (1979) [corrected for the impurity observed; see Comment (a)] and Fang et al. (1999)have been fitted to the three parameter equationk = CT 2 exp(-D/T ), resulting ink = 5.72× 10⁻¹⁸ T 2 exp(-1006/T ) cm3
molecule−1 s−1 over the temperature range 250–788 K. The preferred Arrhenius expression,k = A exp(-B/T ), is centered ona mid-range temperature,Tm, of 290 K and is obtained from the three parameter equation withA = C e2 T 2
m andB = D+2Tm.
References
Fang, T. D., Taylor, P. H. and Berry, R. J.: J. Phys. Chem. A, 103, 2700, 1999.Jeong, K.-M., Hsu, K.-J., Jeffries, J. B. and Kaufman, F.: J. Phys. Chem., 88, 1222, 1984.Watson, R. T., Ravishankara, A. R., Machado, G., Wagner, S. and Davis, D. D.: Int. J. Chem. Kinet., 11, 187, 1979.
Atmos. Chem. Phys., 8, 4141–4496, 2008 www.atmos-chem-phys.net/8/4141/2008/

R. Atkinson et al.: Evaluated kinetic and photochemical data for atmospheric chemistry 4321
IV.A2.127
HO + CHFClCF 3→ H2O + CFClCF3
Rate coefficient data
k/cm3 molecule−1 s−1 Temp./K Reference Technique/Comments
Absolute Rate Coefficients(1.24± 0.19)× 10−14 296 Howard and Evenson, 1976 DF-LMR6.13× 10−13 exp[-(1244± 90)/T ] 250-375 Watson et al., 1979 FP-RF(9.4± 0.3)× 10−15 3014.45× 10−13 exp[-(1150± 60)/T ] 210-349 Gierczak et al., 1991 DF-LMR/FP-RF(9.44± 0.75)× 10−15 298 (a)7.72× 10⁻²⁰ T 2.35 exp[-(458± 30)/T ] 297-867 Yamada et al., 2000 PLP-LIF(1.08± 0.16)× 10−14 297
Relative Rate Coefficients6.48× 10−21 T 2.82 exp[-(620± 40)/T ] 298-366 Hsu and DeMore, 1995 RR (b,c)7.68× 10⁻¹⁵ 2988.28× 10−19 T 2exp[-(674± 52)/T ] 298-356 Hsu and DeMore, 1995 RR (b,d)7.66× 10⁻¹⁵ 298
Comments
(a) Rate coefficients were measured over the temperature range 210–425 K. Those at the highest temperatures (400 K and425 K) are higher than extrapolation of the linear Arrhenius plot obtained from the 210–349 K data.
(b) HO radicals were generated by the photolysis of H2O at 185 nm or from O3-H2O mixtures in the UV, in H2O (or H2O-O3)-CHFClCF3-CH4 (or CHF2CHF2)-O2-N2 mixtures. The concentrations of CHFClCF3 and CH4 (or CHF2CHF2) weremeasured by FTIR spectroscopy. The measured rate coefficient ratios ofk(HO + CHFClCF3)/k(HO + CH4) = (0.35±0.04) exp[(367± 40)/T] andk(HO + CHFClCF3)/k(HO + CHF2CHF2) = (0.46± 0.07) exp[(300± 52)/T ] are placedon an absolute basis by using rate coefficients ofk(HO + CH4) = 1.85× 10⁻²⁰ T 2.82 exp(-987/T ) cm3 molecule−1
s−1 (IUPAC, current recommendation) andk(HO + CHF2CHF2) = 1.80× 10⁻¹⁸ T 2 exp(-974/T ) cm3 molecule−1 s−1
(IUPAC, current recommendation).
(c) Relative tok(HO + CH4).
(d) Relative tok(HO + CHF2CHF2).
Preferred Values
k = 8.7× 10⁻¹⁵ cm3 molecule−1 s−1 at 298 K.k = 3.5× 10⁻¹³ exp(-1105/T ) cm3 molecule−1 s−1 over the temperature range 210–300 K.
Reliability
1 log k =± 0.20 at 298 K.1 (E/R) =± 300 K.
www.atmos-chem-phys.net/8/4141/2008/ Atmos. Chem. Phys., 8, 4141–4496, 2008

4322 R. Atkinson et al.: Evaluated kinetic and photochemical data for atmospheric chemistry
Comments on Preferred Values
At room temperature, the absolute and relative rate coefficients of Howard and Evenson (1976), Watson et al. (1979), Gierczaket al. (1991), Hsu and DeMore (1995) and Yamada et al. 2000) range over a factor of∼1.6, with the absolute rate coefficientof Howard and Evenson (1976) being the highest, possibly due to the presence of reactive impurities. The absolute ratecoefficients of Yamada et al. (2000) are slightly higher than those of Watson et al. (1979) and Gierczak et al. (1991) over thetemperature ranges common to these studies (295–375 K and 295–425 K, respectively), with the differences decreasing as thetemperature increases [and with the 425 K rate coefficient of Gierczak et al. (1991) being very consistent with the 415 K and438 K rate coefficients of Yamada et al. (2000)]. The relative rate coefficients of Hsu and DeMore (1995), using both CH4and CHF2CHF2 as reference compounds, are consistently lower than the absolute rate coefficients of Watson et al. (1979) andGierczak et al. (1991), by∼15-20% at 298 K. The rate coefficients of Watson et al. (1979), Gierczak et al. (1991) and Hsu andDeMore (1995) have been fitted to the three parameter equationk = CT 2 exp(-D/T ), resulting ink = 7.47× 10⁻¹⁹ T 2 exp(-606/T ) cm3 molecule−1 s−1 over the temperature range 210–425 K. The preferred Arrhenius expression,k = A exp(-B/T ), iscentered on a mid-range temperature,Tm, of 250 K and is derived from the three parameter equation withA = C e2 T 2
m andB
= D + 2Tm. The temperature dependence obtained by Yamada et al. (2000) is in good agreement with the recommendation,corresponding to a value ofB in an Arrhenius expression centered at 250 K ofB = 1046 K.
References
Gierczak, T., Talukdar, R., Vaghjiani, G. L., Lovejoy, E. R. and Ravishankara, A. R.: J. Geophys. Res., 96, 5001, 1991.Howard, C. J. and Evenson, K. M.: J. Chem. Phys., 64, 4303, 1976.Hsu, K.-J. and DeMore, W. B.: J. Phys. Chem., 99, 1235, 1995.IUPAC: http://www.iupac-kinetic.ch.cam.ac.uk/, 2007.Watson, R. T., Ravishankara, A. R., Machado, G., Wagner, S. and Davis, D. D.: Int. J. Chem. Kinet, 11, 187, 1979.Yamada, T., Fang, T. D., Taylor, P. H. and Berry, R. J.: J. Phys. Chem. A, 104, 5013, 2000.
Atmos. Chem. Phys., 8, 4141–4496, 2008 www.atmos-chem-phys.net/8/4141/2008/

R. Atkinson et al.: Evaluated kinetic and photochemical data for atmospheric chemistry 4323
IV.A2.128
HO + CHCl 2CF3→ H2O + CCl2CF3
Rate coefficient data
k/cm3 molecule−1 s−1 Temp./K Reference Technique/Comments
Absolute Rate Coefficients(2.84± 0.43)× 10−14 296 Howard and Evenson, 1976 DF-LMR1.24× 10−12 exp[-(1056± 70)/T ] 245-375 Watson et al., 1979 FP-RF (a)(3.6± 0.4)× 10−14 2981.12× 10−12 exp[-(1000± 100)/T ] 293-429 Clyne and Holt, 1979 DF-RF(3.86± 0.19)× 10−14 2931.1× 10−12 exp[-(1040± 140)/T ] 270-400 Liu et al., 1990 FP-RF(3.52± 0.28)× 10−14 2981.18× 10−12 exp[-(900± 150)/T ] 232-426 Brown et al., 1990 DF-RF(5.9± 0.6)× 10−14 3036.5× 10−13 exp[-(840± 40)/T ] 213-322 Gierczak et al., 1991 DF-LMR/FP-RF (b)(3.69± 0.37)× 10−14 2981.1× 10−12 exp[-(940± 200)/T ] 295-385 Nielsen, 1991 PR-RA(4.3± 1.0)× 10−14 2952.20× 10−19 T 2.88 exp[-(226± 51)/T ] 296-866 Yamada et al., 2000 PLP-LIF(3.67± 0.24)× 10−14 296.3
Relative Rate Coefficients7.84× 10−19 T 2 exp[-(215± 36)/T ] 298-359 Hsu and DeMore, 1995 RR (c)3.38× 10⁻¹⁴ 298
Comments
(a) The sample of CHCl2CF3 used was shown by GC to contain 0.0227% of C4F5HCl2 and 0.0021% of C4F6HCl. Aftercorrection for possible contributions to the observed OH radical decays from these measured impurities, assuming arate coefficient for reaction of the halogenated alkene impurities with HO radicals of 5× 10⁻¹² cm3 molecule−1 s−1
independent of temperature, then the rate coefficient was estimated to be 1.4× 10⁻¹² exp(-1102/T ) cm3 molecule−1 s−1
over the temperature range of 245–375 K, with a rate coefficient at 298 K of 3.49× 10⁻¹⁴ cm3 molecule−1 s−1.
(b) Rate coefficients were measured over the temperature range 213–380 K.
(c) HO radicals were generated by the photolysis of H2O at 185 nm or O3 at 254 nm in the presence of H2O, in H2O (or H2O-O3)-CHCl2CF3-CH3CHF2-O2-N2 mixtures. The concentrations of CHCl2CF3 and CH3CHF2 were measured by FTIRspectroscopy. The measured rate coefficient ratio ofk(HO + CHCl2CF3)/k(HO + CH3CHF2) = (0.28± 0.03) exp[(365±36)/T ] is placed on an absolute basis by using a rate coefficient ofk(HO + CH3CHF2) = 2.80× 10⁻¹⁸ T 2 exp(-580/T )cm3 molecule−1 s−1 (IUPAC, current recommendation).
Preferred Values
k = 3.6× 10⁻¹⁴ cm3 molecule−1 s−1 at 298 K.k = 6.6× 10⁻¹³ exp(-870/T ) cm3 molecule−1 s−1 over the temperature range 210-300 K.
Reliability
1 log k =± 0.10 at 298 K.1 (E/R) =± 200 K.
www.atmos-chem-phys.net/8/4141/2008/ Atmos. Chem. Phys., 8, 4141–4496, 2008

4324 R. Atkinson et al.: Evaluated kinetic and photochemical data for atmospheric chemistry
Comments on Preferred Values
The absolute rate coefficients of Howard and Evenson (1976), Watson et al. (1979) [corrected for impurities; see Comment(a)], Clyne and Holt (1979), Liu et al. (1990), Gierczak et al. (1991) and Yamada et al. (2000) and the relative rate coefficientsof Hsu and DeMore (1995) are in reasonable agreement, but are significantly lower than the absolute rate coefficients of Brownet al. (1990) and Nielsen (1991). The absolute rate coefficients of Yamada et al. (2000) tend to be slightly higher than those ofWatson et al. (1979) [corrected for impurities], Liu et al. (1990) and Gierczak et al. (1991), while the relative rate coefficientsof Hsu and DeMore (1995) tend to be slightly lower. Although in this case the data of Clyne and Holt (1979) are in goodagreement with the studies of Howard and Evenson (1976), Watson et al. (1979), Liu et al. (1990), Gierczak et al. (1991) andYamada et al. (2000), because of discrepancies between their data and those of other investigators for most other haloalkanesstudied, the data of Clyne and Holt (1979) have not been used in the evaluation. The rate coefficients of Howard and Evenson(1976), Watson et al. (1979) [corrected for impurities; see Comment (a)], Liu et al. (1990), Gierczak et al. (1991), Yamadaet al. (2000) and Hsu and DeMore (1995) have been fitted to the three parameter equationk = CT 2 exp(-D/T ), resultingin k = 1.42× 10⁻¹⁸ T 2 exp(-370/T ) cm3 molecule−1 s−1 over the temperature range 213–866 K. The preferred Arrheniusexpression,k = A exp(-B/T ), is centered on a mid-range temperature,Tm, of 250 K and is obtained from the three parameterequation withA = C e2 T 2
m andB = D + 2Tm.
References
Brown, A. C., Canosa-Mas, C. E., Parr, A. D. and Wayne, R. P.: Atmos. Environ., 24A, 2499, 1990.Clyne, M. A. A. and Holt, P. M.: J. Chem. Soc. Faraday Trans. 2, 75, 582, 1979.Gierczak, T., Talukdar, R., Vaghjiani, G. L., Lovejoy, E. R. and Ravishankara, A. R.: J. Geophys. Res., 96, 5001, 1991.Howard, C. J. and Evenson, K. M.: J. Chem. Phys., 64, 4303, 1976.Hsu, K.-J. and DeMore, W. B.: J. Phys. Chem., 99, 1235, 1995.IUPAC: http://www.iupac-kinet.ch.cam.ac.uk/, 2007.Liu, R., Huie, R. E. and Kurylo, M. J.: J. Phys. Chem., 94, 3247, 1990.Nielsen, O. J.: Chem. Phys. Lett., 187, 286, 1991.Watson, R. T., Ravishankara, A. R., Machado, G., Wagner, S. and Davis, D. D.: Int. J. Chem. Kinet., 11, 187, 1979.Yamada, T., Fang, T. D., Taylor, P. H. and Berry, R. J.: J. Phys. Chem. A, 104, 5013, 2000.
Atmos. Chem. Phys., 8, 4141–4496, 2008 www.atmos-chem-phys.net/8/4141/2008/
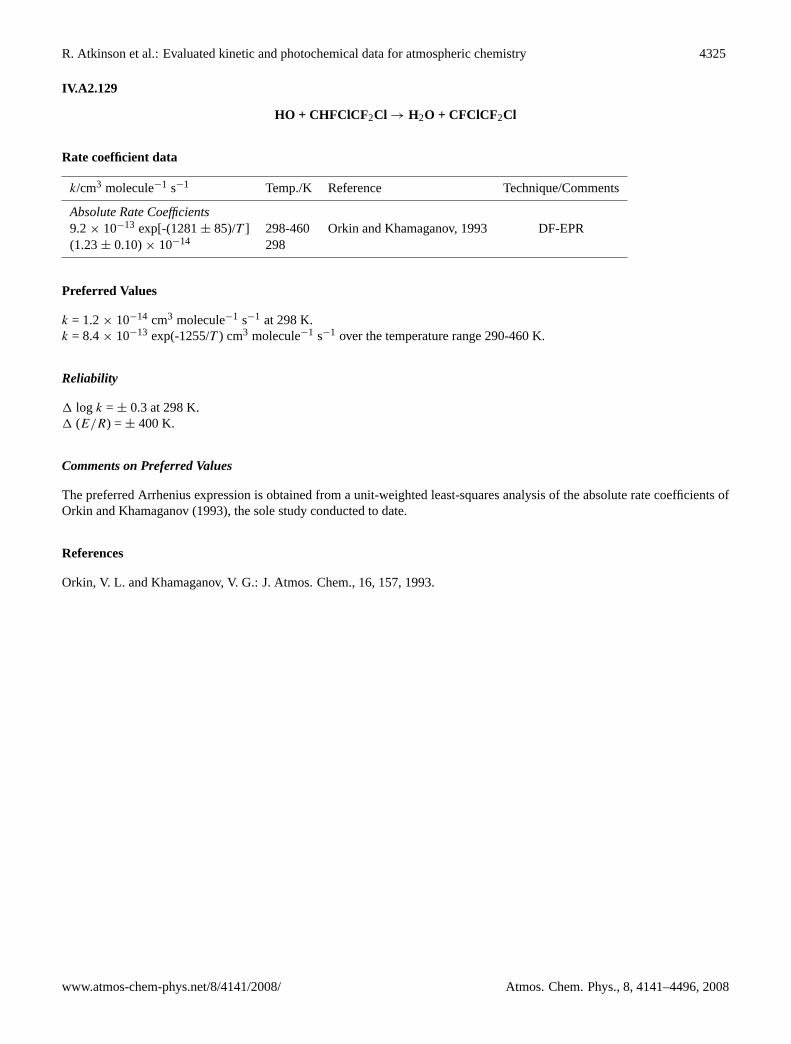
R. Atkinson et al.: Evaluated kinetic and photochemical data for atmospheric chemistry 4325
IV.A2.129
HO + CHFClCF 2Cl→ H2O + CFClCF2Cl
Rate coefficient data
k/cm3 molecule−1 s−1 Temp./K Reference Technique/Comments
Absolute Rate Coefficients9.2× 10−13 exp[-(1281± 85)/T ] 298-460 Orkin and Khamaganov, 1993 DF-EPR(1.23± 0.10)× 10−14 298
Preferred Values
k = 1.2× 10⁻¹⁴ cm3 molecule−1 s−1 at 298 K.k = 8.4× 10⁻¹³ exp(-1255/T ) cm3 molecule−1 s−1 over the temperature range 290-460 K.
Reliability
1 log k =± 0.3 at 298 K.1 (E/R) =± 400 K.
Comments on Preferred Values
The preferred Arrhenius expression is obtained from a unit-weighted least-squares analysis of the absolute rate coefficients ofOrkin and Khamaganov (1993), the sole study conducted to date.
References
Orkin, V. L. and Khamaganov, V. G.: J. Atmos. Chem., 16, 157, 1993.
www.atmos-chem-phys.net/8/4141/2008/ Atmos. Chem. Phys., 8, 4141–4496, 2008

4326 R. Atkinson et al.: Evaluated kinetic and photochemical data for atmospheric chemistry
IV.A2.130
HO + CHCl 2CF2Cl→ H2O + CCl2CF2Cl
Rate coefficient data
k/cm3 molecule−1 s−1 Temp./K Reference Technique/Comments
Absolute Rate Coefficients1.13× 10−12 exp[-(918± 52)/T ] 298-460 Orkin and Khamaganov, 1993 DF-EPR(5.30± 0.41)× 10−14 298
Relative Rate Coefficients9.0× 10−13 exp[-(868± 32)/T ] 303-363 DeMore, 1996 RR (a,b)4.87× 10⁻¹⁴ 298∗
1.36× 10−18 T 2 exp[-(256± 98)/T ] 313-371 DeMore, 1996 RR (a,c)5.12× 10⁻¹⁴ 298∗
Comments
(a) HO radicals were generated by the photolysis of H2O at 185 nm or O3 at 254 nm in the presence of H2O, in H2O (orH2O-O3)-CHCl2CF2Cl-CH2Cl2 (or CHCl2CF3)-O2-N2 mixtures. The concentrations of CHCl2CF2Cl and CH2Cl2 (orCHCl2CF3) were measured by FTIR spectroscopy. The measured rate coefficient ratios ofk(HO + CHCl2CF2Cl)/k(HO+ CH2Cl2) = (0.50± 0.05) exp[-(8± 32)/T ] andk(HO + CHCl2CF2Cl)/k(HO + CHCl2CF3) = (0.96± 0.28) exp[(114± 98)/T ] are placed on an absolute basis by using rate coefficients ofk(HO + CH2Cl2) = 1.8× 10⁻¹² exp(-860/T )cm3 molecule−1 s−1 (IUPAC, current recommendation) andk(HO + CHCl2CF3) = 1.42× 10⁻¹⁸ T 2 exp(-370/T ) cm3
molecule−1 s−1 (IUPAC, current recommendation).
(b) Relative tok(HO + CH2Cl2).
(c) Relative tok(HO + CHCl2CF3).
Preferred Values
k = 5.1× 10⁻¹⁴ cm3 molecule−1 s−1 at 298 K.k = 8.1× 10⁻¹³ exp(-825/T ) cm3 molecule−1 s−1 over the temperature range 270-340 K.
Reliability
1 log k =± 0.2 at 298 K.1 (E/R) =± 200 K.
Comments on Preferred Values
Over the temperature range 298–371 K, the absolute rate coefficients of Orkin and Khamaganov (1993) and the relative ratecoefficients of DeMore (1996), using both CH2Cl2 and CHCl2CF3 as reference compounds, are in good agreement. Accord-ingly, the three parameter equationk = CT 2 exp(-D/T ) was fitted to the rate coefficients of Orkin and Khamaganov (1993)and DeMore (1996), resulting ink = 1.23× 10⁻¹⁸ T 2 exp(-227/T ) cm3 molecule−1 s−1 over the temperature range 298–460K. The preferred Arrhenius expression,k = A exp(-B/T ), is centered on a mid-range temperature,Tm, of 300 K and is obtainedfrom the three parameter equation withA = C e2 T 2
m andB = D + 2Tm.
References
DeMore, W. B.: J. Phys. Chem., 100, 5813, 1996.IUPAC: http://www.iupac-kinetic.ch.cam.ac.uk/, 2007.Orkin, V. L. and Khamaganov, V. G.: J. Atmos. Chem., 16, 157, 1993.
Atmos. Chem. Phys., 8, 4141–4496, 2008 www.atmos-chem-phys.net/8/4141/2008/

R. Atkinson et al.: Evaluated kinetic and photochemical data for atmospheric chemistry 4327
IV.A2.131
HO + CHFClCFCl 2→ H2O + CFClCFCl2
Rate coefficient data
k/cm3 molecule−1 s−1 Temp./K Reference Technique/Comments
Relative Rate Coefficients8.68× 10−19 T 2 exp[-(463± 42)/T ] 294-362 Hsu and DeMore, 1995 RR (a)1.63× 10⁻¹⁴ 298
Comments
(a) HO radicals were generated by the photolysis of H2O at 185 nm or O3 at 254 nm in the presence of H2O, in H2O (orH2O-O3)-CHFClCFCl2-CH3CHF2-O2-N2 mixtures. The concentrations of CHFClCFCl2 and CH3CHF2 were measuredby FTIR spectroscopy. The measured rate coefficient ratio ofk(HO + CHFClCFCl2/k(HO + CH3CHF2) = (0.31± 0.04)exp[(117± 42)/T ] is placed on an absolute basis by using a rate coefficient ofk(HO + CH3CHF2) = 2.80× 10⁻¹⁸ T 2
exp(-580/T ) cm3 molecule−1 s−1 (IUPAC, current recommendation).
Preferred Values
k = 1.6× 10⁻¹⁴ cm3 molecule−1 s−1 at 298 K.k = 5.8× 10⁻¹³ exp(-1065/T ) cm3 molecule−1 s−1 over the temperature range 270-340 K.
Reliability
1 log k =± 0.3 at 298 K.1 (E/R) =± 400 K.
Comments on Preferred Values
The preferred values are based on the relative rate coefficients of Hsu and DeMore (1995), the sole study conducted to date.The preferred Arrhenius expressionk = A exp(-B/T ) is centered on a mid-range temperature,Tm, of 300 K and is derivedfrom the cited three parameter expression,k = CT 2 exp(-D/T ), with A = C e2 T 2
m andB = D + 2Tm.
References
Hsu, K.-J. and DeMore, W. B.: J. Phys. Chem., 99, 1235, 1995.IUPAC: http://www.iupac-kinetic.ch.cam.ac.uk/, 2007.
www.atmos-chem-phys.net/8/4141/2008/ Atmos. Chem. Phys., 8, 4141–4496, 2008
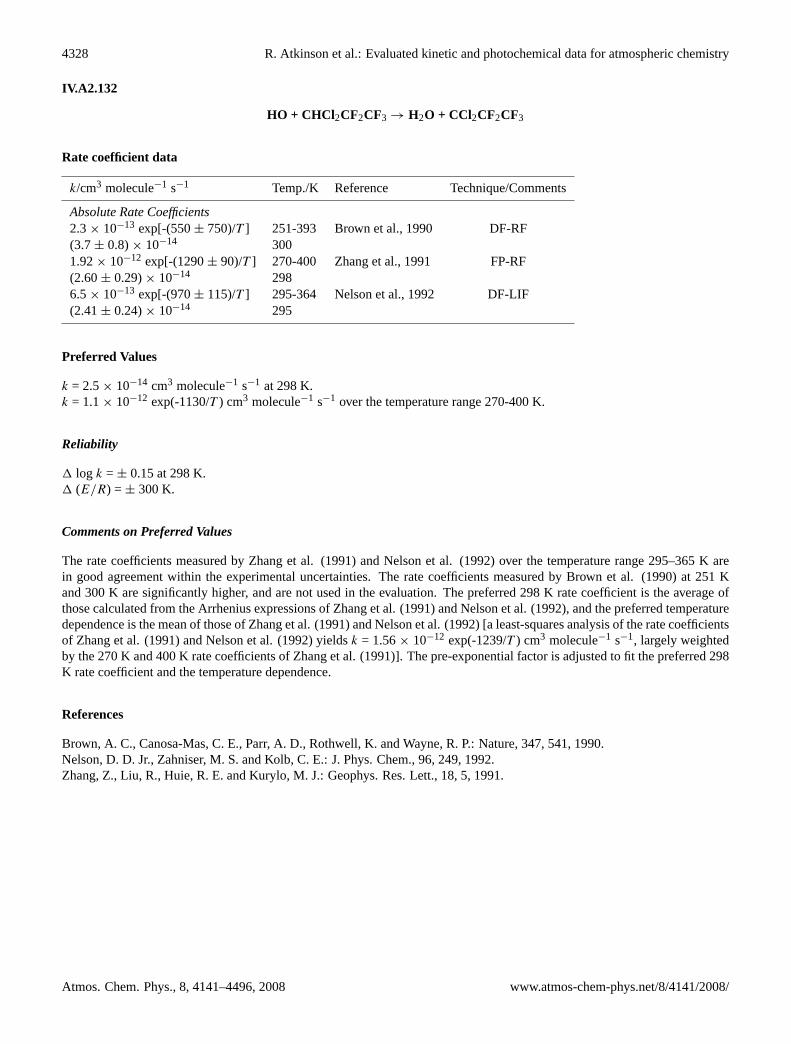
4328 R. Atkinson et al.: Evaluated kinetic and photochemical data for atmospheric chemistry
IV.A2.132
HO + CHCl 2CF2CF3→ H2O + CCl2CF2CF3
Rate coefficient data
k/cm3 molecule−1 s−1 Temp./K Reference Technique/Comments
Absolute Rate Coefficients2.3× 10−13 exp[-(550± 750)/T ] 251-393 Brown et al., 1990 DF-RF(3.7± 0.8)× 10−14 3001.92× 10−12 exp[-(1290± 90)/T ] 270-400 Zhang et al., 1991 FP-RF(2.60± 0.29)× 10−14 2986.5× 10−13 exp[-(970± 115)/T ] 295-364 Nelson et al., 1992 DF-LIF(2.41± 0.24)× 10−14 295
Preferred Values
k = 2.5× 10⁻¹⁴ cm3 molecule−1 s−1 at 298 K.k = 1.1× 10⁻¹² exp(-1130/T ) cm3 molecule−1 s−1 over the temperature range 270-400 K.
Reliability
1 log k =± 0.15 at 298 K.1 (E/R) =± 300 K.
Comments on Preferred Values
The rate coefficients measured by Zhang et al. (1991) and Nelson et al. (1992) over the temperature range 295–365 K arein good agreement within the experimental uncertainties. The rate coefficients measured by Brown et al. (1990) at 251 Kand 300 K are significantly higher, and are not used in the evaluation. The preferred 298 K rate coefficient is the average ofthose calculated from the Arrhenius expressions of Zhang et al. (1991) and Nelson et al. (1992), and the preferred temperaturedependence is the mean of those of Zhang et al. (1991) and Nelson et al. (1992) [a least-squares analysis of the rate coefficientsof Zhang et al. (1991) and Nelson et al. (1992) yieldsk = 1.56× 10⁻¹² exp(-1239/T ) cm3 molecule−1 s−1, largely weightedby the 270 K and 400 K rate coefficients of Zhang et al. (1991)]. The pre-exponential factor is adjusted to fit the preferred 298K rate coefficient and the temperature dependence.
References
Brown, A. C., Canosa-Mas, C. E., Parr, A. D., Rothwell, K. and Wayne, R. P.: Nature, 347, 541, 1990.Nelson, D. D. Jr., Zahniser, M. S. and Kolb, C. E.: J. Phys. Chem., 96, 249, 1992.Zhang, Z., Liu, R., Huie, R. E. and Kurylo, M. J.: Geophys. Res. Lett., 18, 5, 1991.
Atmos. Chem. Phys., 8, 4141–4496, 2008 www.atmos-chem-phys.net/8/4141/2008/

R. Atkinson et al.: Evaluated kinetic and photochemical data for atmospheric chemistry 4329
IV.A2.133
HO + CHFClCF 2CF2Cl→ H2O + CFClCF2CF2Cl
Rate coefficient data
k/cm3 molecule−1 s−1 Temp./K Reference Technique/Comments
Absolute Rate Coefficients6.75× 10−13 exp[-(1300± 180)/T ] 298-400 Zhang et al., 1991 FP-RF(8.6± 1.1)× 10−15 2983.9× 10−13 exp[-(1120± 125)/T ] 295-374 Nelson et al., 1992 DF-LIF(9.0± 1.1)× 10−15 295
Preferred Values
k = 8.9× 10⁻¹⁵ cm3 molecule−1 s−1 at 298 K.k = 5.5× 10⁻¹³ exp(-1230/T ) cm3 molecule−1 s−1 over the temperature range 290-400 K.
Reliability
1 log k =± 0.10 at 298 K.1 (E/R) =± 300 K.
Comments on Preferred Values
The preferred values are derived from a least-squares analysis of the rate coefficients of Zhang et al. (1991) and Nelson et al.(1992), which are in excellent agreement.
References
Nelson, D. D. Jr., Zahniser, M. S. and Kolb, C. E.: J. Phys. Chem., 96, 249, 1992.Zhang, Z., Liu, R., Huie, R. E. and Kurylo, M. J.: Geophys. Res. Lett., 18, 5, 1991.
www.atmos-chem-phys.net/8/4141/2008/ Atmos. Chem. Phys., 8, 4141–4496, 2008

4330 R. Atkinson et al.: Evaluated kinetic and photochemical data for atmospheric chemistry
IV.A2.134
HO + CH3CF2CFCl2→ H2O + CH2CF2CFCl2
Rate coefficient data
k/cm3 molecule−1 s−1 Temp./K Reference Technique/Comments
Absolute Rate Coefficients7.1× 10−13 exp[-(1690± 230)/T ] 295-367 Nelson et al., 1992 DF-LIF(2.1± 0.2)× 10−15 295
Preferred Values
k = 2.4× 10⁻¹⁵ cm3 molecule−1 s−1 at 298 K.k = 7.0× 10⁻¹³ exp(-1690/T ) cm3 molecule−1 s−1 over the temperature range 290-370 K.
Reliability
1 log k =± 0.3 at 298 K.1 (E/R) =± 300 K.
Comments on Preferred Values
The preferred values are based on the sole study of Nelson et al. (1992).
References
Nelson, D. D. Jr., Zahniser, M. S. and Kolb, C. E.: J. Phys. Chem., 96, 249, 1992.
Atmos. Chem. Phys., 8, 4141–4496, 2008 www.atmos-chem-phys.net/8/4141/2008/

R. Atkinson et al.: Evaluated kinetic and photochemical data for atmospheric chemistry 4331
IV.A2.135
HO + HC(O)Cl → H2O + ClCO
Rate coefficient data
k/cm3 molecule−1 s−1 Temp./K Reference Technique/Comments
Relative Rate Coefficients≤3.2× 10⁻¹³ 299.2 Libuda et al., 1990 RR (a)
Comments
(a) HO radicals were generated by the thermal decomposition of HO2NO2 after addition of NO to HC(O)Cl-n-butane-HO2NO2-O2-N2 mixtures at 800 mbar pressure. The concentrations of HC(O)Cl andn-butane were monitored by FTIRspectroscopy and GC, respectively. No decay of HC(O)Cl was observed, leading to the upper limit to the rate coefficientcited in the table.
Preferred Values
k <5× 10⁻¹³ cm3 molecule−1 s−1 at 298 K.
Comments on Preferred Values
The preferred value is based on the upper limit to the rate coefficient reported by Libuda et al. (1990).
References
Libuda, H. G., Zabel, F., Fink, E. H. and Becker, K. H.: J. Phys. Chem., 94, 5860, 1990.
www.atmos-chem-phys.net/8/4141/2008/ Atmos. Chem. Phys., 8, 4141–4496, 2008

4332 R. Atkinson et al.: Evaluated kinetic and photochemical data for atmospheric chemistry
IV.A2.136
HO + CH3OCl→ products
Rate coefficient data
k/cm3 molecule−1 s−1 Temp./K Reference Technique/Comments
Absolute Rate Coefficients2.4× 10−12 exp[-(360± 100)/T ] 250-341 Crowley et al., 1996 PLP-RF (a)(7.06± 0.22)× 10−13 294
Comments
(a) HO radicals were generated from the pulsed laser photolysis of HNO3 at 248 nm. CH3OCl-Ar samples were shown to bestable with respect to decomposition over long time periods (up to 3 months). Each CH3OCl-Ar sample used was analyzedfor Cl2 impurities by UV absorption before entering the reaction cell. At 294 K, no effect of total pressure of argon diluent(40–400 mbar) on the measured rate coefficient was observed, and the weighted average 294 K rate coefficient is given inthe table.
Preferred Values
k = 7.2× 10⁻¹³ cm3 molecule−1 s−1 at 298 K.k = 2.4× 10⁻¹² exp(-360/T ) cm3 molecule−1 s−1 over the temperature range 250-350 K.
Reliability
1 log k =± 0.3 at 298 K.1 (E/R) =± 300 K.
Comments on Preferred Values
The preferred values are based on the sole study of this reaction by Crowley et al. (1996). The products have not been measuredto date, but formation of H2O + CH2OCl and HOCl + CH3O are possible.
References
Crowley, J. N., Campuzano-Jost, P. and Moortgat, G. K.: J. Phys. Chem. 100, 3601, (1996).
Atmos. Chem. Phys., 8, 4141–4496, 2008 www.atmos-chem-phys.net/8/4141/2008/

R. Atkinson et al.: Evaluated kinetic and photochemical data for atmospheric chemistry 4333
IV.A2.137
HO + C(O)Cl2→ products
Rate coefficient data
k/cm3 molecule−1 s−1 Temp./K Reference Technique/Comments
Relative Rate Coefficients<1× 10⁻¹⁵ 298± 3 Nelson et al., 1990 RR (a)
Comments
(a) HO radicals were generated by the photolysis of CH3ONO in CH3ONO-NO-C(O)Cl2-reference compound-air mixtures at∼1 bar pressure. The concentrations of C(O)Cl2 and the reference compound were monitored during the experiments byGC. No reaction of C(O)Cl2 was observed. However, no details concerning the reference compound used or the amountof reference compound reacted were given.
Preferred Values
k <5× 10⁻¹⁵ cm3 molecule−1 s−1 at 298 K.
Comments on Preferred Values
The preferred upper limit to the 298 K rate coefficient is based on the sole reported study of Nelson et al. (1990), with thepreferred upper limit being increased by a factor of 5 over that cited by Nelson et al. (1990).
References
Nelson, L., Shanahan, I., Sidebottom, H. W., Treacy, J. and Nielsen, O. J.: Int. J. Chem. Kinet., 22, 577, 1990.
www.atmos-chem-phys.net/8/4141/2008/ Atmos. Chem. Phys., 8, 4141–4496, 2008

4334 R. Atkinson et al.: Evaluated kinetic and photochemical data for atmospheric chemistry
IV.A2.138
HO + CH2ClCHO → H2O + CH2ClCO (1)→ H2O + CHClCHO (2)
Rate coefficient data (k = k1 + k2)
k/cm3 molecule−1 s−1 Temp./K Reference Technique/Comments
Absolute Rate Coefficients(3.0± 0.6)× 10−12 298 Balestra-Garcia et al., 1992 PLP-RF
Relative Rate Coefficients(3.2± 0.2)× 10−12 298± 2 Scollard et al., 1993 RR (a)
Comments
(a) HO radicals were generated by the photolysis of CH3ONO or C2H5ONO in CH3ONO (or C2H5ONO)-NO-CH2ClCHO-CH3C(O)CH2CH3-air mixtures at 987± 13 mbar pressure. The concentrations of CH2ClCHO and 2-butanone weremeasured by GC and/or FTIR spectroscopy. The measured rate coefficient ratio ofk(HO + CH2ClCHO)/k(HO + 2-butanone) is placed on an absolute basis by use of a rate coefficient ofk(HO + 2-butanone) = 1.2× 10⁻¹² cm3 molecule−1
s−1 at 298 K (IUPAC, current recommendation).
Preferred Values
k = 3.1× 10⁻¹² cm3 molecule−1 s−1 at 298 K.
Reliability
1 log k =± 0.15 at 298 K.
Comments on Preferred Values
The preferred 298 K rate coefficient is the average of those of Balestra-Garcia et al. (1992) and Scollard et al. (1993), whichare in excellent agreement. The reaction is expected to proceed essentially totally by channel (1) at 298 K.
References
Balestra-Garcia, C., Le Bras, G. and Mac Leod, H.: J. Phys. Chem., 96, 3312, 1992.IUPAC: http://www.iupac-kinetic.ch.cam.ac.uk/, 2007.Scollard, D. J., Treacy, J. J., Sidebottom, H. W., Balestra-Garcia, C., Laverdet, G., LeBras, G., MacLeod, H. and Teton, S.: J.Phys. Chem., 97, 4683, 1993.
Atmos. Chem. Phys., 8, 4141–4496, 2008 www.atmos-chem-phys.net/8/4141/2008/

R. Atkinson et al.: Evaluated kinetic and photochemical data for atmospheric chemistry 4335
IV.A2.139
HO + CHFClCHO → H2O + CHFClCO (1)→ H2O + CFClCHO (2)
Rate coefficient data (k = k1 + k2)
k/cm3 molecule−1 s−1 Temp./K Reference Technique/Comments
Absolute Rate Coefficients(2.2± 0.2)× 10−12 298± 2 Scollard et al., 1993 PLP-RF
Relative Rate Coefficients(1.9± 0.3)× 10−12 298± 2 Scollard et al., 1993 RR (a)
Comments
(a) HO radicals were generated by the photolysis of CH3ONO or C2H5ONO in CH3ONO (or C2H5ONO)-CHFClCHO-toluene-air mixtures at 987± 13 mbar pressure. The concentrations of CHFClCHO and toluene were measured by GCand/or FTIR spectroscopy. The measured rate coefficient ratio ofk(HO + CHFClCHO)/k(HO + toluene) is placed on anabsolute basis by using a rate coefficient ofk(HO + toluene) = 5.63× 10⁻¹² cm3 molecule−1 s−1 at 298 K (Calvert et al.,2002).
Preferred Values
k = 2.1× 10⁻¹² cm3 molecule−1 s−1 at 298 K.
Reliability
1 log k =± 0.15 at 298 K.
Comments on Preferred Values
The preferred value is an average of the absolute and relative rate coefficients of Scollard et al. (1993), which are in goodagreement. The reaction is expected to proceed by channel (1) at room temperature (Scollard et al., 1993).
References
Calvert, J. G., Atkinson, R., Becker, K. H., Kamens, R. M., Seinfeld, J. H., Wallington, T. J. and Yarwood, G.: The Mechanismof Atmospheric Oxidation of Aromatic Hydrocarbons, Oxford University Press, New York, NY, 2002.Scollard, D. J., Treacy, J. J., Sidebottom, H. W., Balestra-Garcia, C., Laverdet, G., LeBras, G., MacLeod, H. and Teton, S.: J.Phys. Chem., 97, 4683, 1993.
www.atmos-chem-phys.net/8/4141/2008/ Atmos. Chem. Phys., 8, 4141–4496, 2008

4336 R. Atkinson et al.: Evaluated kinetic and photochemical data for atmospheric chemistry
IV.A2.140
HO + CHCl 2CHO → H2O + CHCl2CO (1)→ H2O + CCl2CHO (2)
Rate coefficient data (k = k1 + k2)
k/cm3 molecule−1 s−1 Temp./K Reference Technique/Comments
Absolute Rate Coefficients(2.4± 0.5)× 10−12 298 Balestra-Garcia et al., 1992 PLP-RF
Relative Rate Coefficients(2.4± 0.1)× 10−12 298± 2 Scollard et al., 1993 RR (a)
Comments
(a) HO radicals were generated by the photolysis of CH3ONO or C2H5ONO in CH3ONO (or C2H5ONO)-NO-CHCl2CHO-CH3C(O)CH2CH3-air mixtures at 987± 13 mbar pressure. The concentrations of CHCl2CHO and 2-butanone weremeasured by GC and/or FTIR spectroscopy. The measured rate coefficient ratio ofk(HO + CHCl2CHO)/k(HO + 2-butanone) is placed on an absolute basis by use of a rate coefficient ofk(HO + 2-butanone) = 1.2× 10⁻¹² cm3 molecule−1
s−1 at 298 K (IUPAC, current recommendation).
Preferred Values
k = 2.4× 10⁻¹² cm3 molecule−1 s−1 at 298 K.
Reliability
1 log k =± 0.15 at 298 K.
Comments on Preferred Values
The preferred 298 K rate coefficient is the average of those of Balestra-Garcia et al. (1992) and Scollard et al. (1993), whichare in excellent agreement. The reaction is expected to proceed essentially totally by channel (1) at 298 K (Scollard et al.,1993).
References
Balestra-Garcia, C., Le Bras, G. and Mac Leod, H. : J. Phys. Chem., 96, 3312, 1992.IUPAC: http://www.iupac-kinetic.ch.cam.ac.uk/, 2007.Scollard, D. J., Treacy, J. J., Sidebottom, H. W., Balestra-Garcia, C., Laverdet, G., LeBras, G., MacLeod, H. and Teton, S.: J.Phys. Chem., 97, 4683, 1993.
Atmos. Chem. Phys., 8, 4141–4496, 2008 www.atmos-chem-phys.net/8/4141/2008/

R. Atkinson et al.: Evaluated kinetic and photochemical data for atmospheric chemistry 4337
IV.A2.141
HO + CF2ClCHO → H2O + CF2ClCO
Rate coefficient data
k/cm3 molecule−1 s−1 Temp./K Reference Technique/Comments
Absolute Rate Coefficients(9.5± 0.5)× 10−13 298± 2 Scollard et al., 1993 PLP-RF
Relative Rate Coefficients(6.9± 0.5)× 10−13 298± 2 Scollard et al., 1993 RR (a)
Comments
(a) HO radicals were generated by the photolysis of CH3ONO or C2H5ONO in CH3ONO (or C2H5ONO)-CF2ClCHO-ethanol-air mixtures at 987± 13 mbar pressure. The concentrations of CF2ClCHO and ethanol were measured by GCand/or FTIR spectroscopy. The measured rate coefficient ratio ofk(HO + CF2ClCHO)/k(HO + ethanol) is placed on anabsolute basis by using a rate coefficient ofk(HO + ethanol) = 3.2× 10⁻¹² cm3 molecule−1 s−1 at 298 K (IUPAC, currentrecommendation).
Preferred Values
k = 8.2× 10⁻¹³ cm3 molecule−1 s−1 at 298 K.
Reliability
1 log k =± 0.25 at 298 K.
Comments on Preferred Values
The preferred value is an average of the absolute and relative rate coefficients of Scollard et al. (1993), which are in reasonableagreement.
References
IUPAC: http://www.iupac-kinetic.ch.cam.ac.uk/, 2007.Scollard, D. J., Treacy, J. J., Sidebottom, H. W., Balestra-Garcia, C., Laverdet, G., LeBras, G., MacLeod, H. and Teton, S.: J.Phys. Chem., 97, 4683, 1993.
www.atmos-chem-phys.net/8/4141/2008/ Atmos. Chem. Phys., 8, 4141–4496, 2008

4338 R. Atkinson et al.: Evaluated kinetic and photochemical data for atmospheric chemistry
IV.A2.142
HO + CFCl2CHO→ H2O + CFCl2CO
Rate coefficient data
k/cm3 molecule−1 s−1 Temp./K Reference Technique/Comments
Absolute Rate Coefficients(1.3± 0.1)× 10−12 298± 2 Scollard et al., 1993 PLP-RF
Relative Rate Coefficients(1.0± 0.2)× 10−12 298± 2 Scollard et al., 1993 RR (a)
Comments
(a) HO radicals were generated by the photolysis of CH3ONO or C2H5ONO in CH3ONO (or C2H5ONO)-CFCl2CHO-toluene-air mixtures at 987± 13 mbar pressure. The concentrations of CFCl2CHO and toluene were measured by GCand/or FTIR spectroscopy. The measured rate coefficient ratio ofk(HO + CFCl2CHO)/k(HO + toluene) is placed on anabsolute basis by using a rate coefficient ofk(HO + toluene) = 5.63× 10⁻¹² cm3 molecule−1 s−1 at 298 K (Calvert et al.,2002).
Preferred Values
k = 1.2× 10⁻¹² cm3 molecule−1 s−1 at 298 K.
Reliability
1 log k =± 0.15 at 298 K.
Comments on Preferred Values
The preferred value is an average of the absolute and relative rate coefficients of Scollard et al. (1993), which are in goodagreement.
References
Calvert, J. G., Atkinson, R., Becker, K. H., Kamens, R. M., Seinfeld, J. H., Wallington, T. J. and Yarwood, G.: The Mechanismof Atmospheric Oxidation of Aromatic Hydrocarbons, Oxford University Press, New York, NY, 2002.Scollard, D. J., Treacy, J. J., Sidebottom, H. W., Balestra-Garcia, C., Laverdet, G., LeBras, G., MacLeod, H. and Teton, S.: J.Phys. Chem., 97, 4683, 1993.
Atmos. Chem. Phys., 8, 4141–4496, 2008 www.atmos-chem-phys.net/8/4141/2008/

R. Atkinson et al.: Evaluated kinetic and photochemical data for atmospheric chemistry 4339
IV.A2.143
HO + CCl3CHO→ H2O + CCl3CO
Rate coefficient data
k/cm3 molecule−1 s−1 Temp./K Reference Technique/Comments
Absolute Rate Coefficients1.25× 10−11 exp[-(600± 90)/T ] 298-520 Dobe et al., 1989 DF-RF/LIF(1.56± 0.34)× 10−12 298(8.7± 1.7)× 10−13 298 Balestra-Garcia et al., 1992 PLP-RF(1.28± 0.25)× 10−12 298± 2 Barry et al., 1994 DF-RF(8.9± 1.5)× 10−13 298± 2 Barry et al., 1994 DF-EPR1.79× 10−12 exp[-(240± 60)/T ] 233-415 Talukdar et al., 2001 PLP-LIF(8.3± 0.8)× 10−13 298
Relative Rate Coefficients(1.63± 0.29)× 10−12 298± 3 Nelson et al., 1990 RR (a)(1.5± 0.2)× 10−12 298± 2 Scollard et al., 1993 RR (b)(9.5± 0.3)× 10−13 298± 2 Barry et al., 1994 RR (c)
Comments
(a) HO radicals were generated by the photolysis of CH3ONO in CH3ONO-CCl3CHO-ethyl acetate (the referencecompound)-air mixtures at 987 mbar pressure, and NO and ethene were added to the reactant mixtures to scavengeCl atoms formed from the photolysis of CCl3CHO. The concentrations of CCl3CHO and ethyl acetate were measured byGC and/or FTIR spectroscopy. The measured rate coefficient ratio ofk(HO + CCl3CHO)/k(HO + ethyl acetate) is placedon an absolute basis by using a rate coefficient ofk(HO + ethyl acetate) = 1.6× 10⁻¹² cm3 molecule−1 s−1 (Atkinson,1989).
(b) HO radicals were generated by the photolysis of CH3ONO or C2H5ONO in CH3ONO (or C2H5ONO)-CCl3CHO-toluene-air mixtures at 987± 13 mbar pressure. The concentrations of CCl3CHO and toluene were measured by GC and/or FTIRspectroscopy. The measured rate coefficient ratio ofk(HO + CCl3CHO)/k(HO + toluene) is placed on an absolute basisby using a rate coefficient ofk(HO + toluene) = 5.63× 10⁻¹² cm3 molecule−1 s−1 at 298 K (Calvert et al., 2002).
(c) HO radicals were generated by the photolysis of O3 in the presence of water vapor in O3-H2O-CCl3CHO-2-methylpropane-air mixtures at∼1 bar pressure. The concentrations of CCl3CHO and 2-methylpropane were measuredby GC. The measured rate coefficient ratiok(HO + CCl3CHO)/k(HO + 2-methylpropane) = 0.45± 0.01 is placed on anabsolute basis by using a rate coefficient ofk(HO + 2-methylpropane) = 2.12× 10⁻¹² cm3 molecule−1 s−1 at 298 K(Atkinson, 2003).
Preferred Values
k = 8.0× 10⁻¹³ cm3 molecule−1 s−1 at 298 K.k = 1.8× 10⁻¹² exp(-240/T ) cm3 molecule−1 s−1 over the temperature range 230-420 K.
Reliability
1 log k =± 0.15 at 298 K.1 (E/R) =± 200 K.
www.atmos-chem-phys.net/8/4141/2008/ Atmos. Chem. Phys., 8, 4141–4496, 2008

4340 R. Atkinson et al.: Evaluated kinetic and photochemical data for atmospheric chemistry
Comments on Preferred Values
The absolute and relative rate study of Barry et al. (1994) supersedes the earlier studies of Nelson et al. (1990), Balestra-Garciaet al. (1992) and Scollard et al. (1993). The three independent determinations of the rate coefficient by Barry et al. (1994)are all lower than the absolute 298 K rate coefficient of Dobe et al. (1989), as is the most recent absolute room temperaturerate coefficient of Talukdar et al. (2001). The most recent and extensive study of Talukdar et al. (2001) obtains a roomtemperature rate coefficient which agrees with the lowest of the previously reported 298 K rate coefficients, these being thePLP-RF rate coefficient of Balestra-Garcia et al. (1992) and the DF-EPR rate coefficient of Barry et al. (1994). The temperaturedependence of the rate coefficient measured by Talukdar et al. (2001) is also significantly smaller than that reported by Dobeet al. (1989). The potential exists for erroneously high measured rate coefficients because of secondary reactions involving Clatoms generated from the photolysis of CCl3CHO, as well as for erroneously low measured rate coefficients because of walladsorption losses of CCl3CHO. The concentrations of CCl3CHO were measured by UV absorption at 213.9 nm before andafter the reaction cell in the Talukdar et al. (2001) study, and losses were shown to be of no importance (<2%). The preferredvalues are therefore based on the absolute rate coefficients of Talukdar et al. (2001).
References
Atkinson, R.: J. Phys. Chem. Ref. Data, Monograph 1, 1, 1989.Atkinson, R.: Atmos. Chem. Phys., 3, 2233, 2003.Balestra-Garcia, C., Le Bras, G. and Mac Leod, H.: J. Phys. Chem., 96, 3312, 1992.Barry, J., Scollard, D. J., Treacy, J. J., Sidebottom, H. W., Le Bras, G., Poulet, G., Teton, S., Chichinin, A., Canosa-Mas, C.E., Kinnison, D. J., Wayne, R. P. and Nielsen, O. J.: Chem. Phys. Lett., 221, 353, 1994.Calvert, J. G., Atkinson, R., Becker, K. H., Kamens, R. M., Seinfeld, J. H., Wallington, T. J. and Yarwood, G.: TheMechanisms of Atmospheric Oxidation of Aromatic Hydrocarbons, Oxford University Press, New York, NY, 2002.Dobe, S., Khachatryan, L. A. and Berces, T.: Ber. Bunsenges. Phys. Chem., 93, 847, 1989.Nelson, L., Shanahan, I., Sidebottom, H. W., Treacy, J. and Nielsen, O. J.: Int. J. Chem. Kinet., 22, 577, 1990.Scollard, D. J., Treacy, J. J., Sidebottom, H. W., Balestra-Garcia, C., Laverdet, G., LeBras, G., MacLeod, H. and Teton, S.: J.Phys. Chem., 97, 4683, 1993.Talukdar, R. K., Mellouki, A., Burkholder, J. B., Gilles, M. K., Le Bras, G. and Ravishankara, A. R.: J. Phys. Chem. A, 105,5188, 2001.
Atmos. Chem. Phys., 8, 4141–4496, 2008 www.atmos-chem-phys.net/8/4141/2008/

R. Atkinson et al.: Evaluated kinetic and photochemical data for atmospheric chemistry 4341
IV.A2.144
HO + CH3C(O)Cl→ H2O + CH2COCl
Rate coefficient data
k/cm3 molecule−1 s−1 Temp./K Reference Technique/Comments
Relative Rate Coefficients6.8× 10−14 298± 3 Nelson et al., 1984; 1990 RR (a)
Comments
(a) HO radicals were generated by the photolysis of CH3ONO in CH3ONO-NO-CH3C(O)Cl-CHCl3 (the referencecompound)-air mixtures at 987 mbar pressure. The concentrations of CH3C(O)Cl and CHCl3 were monitored duringthe experiments by GC. The measured rate coefficient ratio ofk(HO + CH3C(O)Cl)/k(HO + CHCl3) ∼0.65 is placed onan absolute basis by use of a rate coefficient ofk(HO + CHCl3) = 1.05× 10⁻¹³ cm3 molecule−1 s−1 at 298 K (IUPAC,current recommendation).
Preferred Values
k = 6.8× 10⁻¹⁴ cm3 molecule−1 s−1 at 298 K.
Reliability
1 log k =± 0.3 at 298 K.
Comments on Preferred Values
The preferred 298 K rate coefficient is based on the relative rate coefficient studies of Nelson et al. (1984) and Nelson et al.(1990), using the data presented in Table I and Figure 2 of Nelson et al. (1984) and in Figure 5 of Nelson et al. (1990), whichare the same data-set. Note that Table I of Nelson et al. (1990) cites a rate coefficient a factor of 7 lower [(9.1± 3.2)× 10−15
cm3 molecule−1 s−1 at 298± 3 K], inconsistent with the data presented in their Figure 5 and with the data presented in Nelsonet al. (1984).
References
IUPAC: http://www.iupac-kinetic.ch.cam.ac.uk/, 2007.Nelson, L., Treacy, J. J. and Sidebottom, H. W.: Proceedings of the 3rd European Symposium on the Physico-ChemicalBehavior of Atmospheric Pollutants, 1984; D. Riedel Pub. Co., Dordrecht, Holland, pp. 258-263, 1984.Nelson, L., Shanahan, I., Sidebottom, H. W., Treacy, J. and Nielsen, O. J.: Int. J. Chem. Kinet., 22, 577, 1990.
www.atmos-chem-phys.net/8/4141/2008/ Atmos. Chem. Phys., 8, 4141–4496, 2008

4342 R. Atkinson et al.: Evaluated kinetic and photochemical data for atmospheric chemistry
IV.A2.145
HO + CHF2OCHClCF3 → H2O + CHF2OCClCF3 (1)→ H2O + CF2OCHClCF3 (2)
Rate coefficient data (k = k1 + k2)
k/cm3 molecule−1 s−1 Temp./K Reference Technique/Comments
Absolute Rate Coefficients(2.1± 0.7)× 10−14 298 Brown et al., 1989; 1990 DF-RF1.12× 10−12 exp[-(1280± 50)/T ] 250-430 Tokuhashi et al., 1999 PLP/FP/DF-LIF(1.51± 0.05)× 10−14 298(1.7± 0.3)× 10−14 298 Langbein et al., 1999 PLP-UVA4.5× 10−13 exp[-(940± 100)/T ] 293-393 Beach et al., 2001 DF-RF(1.9± 0.2)× 10−14 293
Relative Rate Coefficients<3× 10⁻¹³ 300± 3 McLoughlin et al., 1993 RR (a)
Comments
(a) HO radicals were generated by the photolysis of CH3ONO-NO-CHF2OCHClCF3-diethyl ether air mixtures at∼1 barpressure. The concentrations of CHF2OCHClCF3 and diethyl ether were measured by GC. The measured upper limit tothe rate coefficient ratiok(HO + CHF2OCHClCF3)/k(HO + diethyl ether) is placed on an absolute basis by using a ratecoefficient ofk(HO + diethyl ether) = 1.31× 10⁻¹¹ cm3 molecule−1 s−1 at 300 K (Atkinson, 1994).
Preferred Values
k = 1.5× 10⁻¹⁴ cm3 molecule−1 s−1 at 298 K.k = 1.1× 10⁻¹² exp(-1280/T ) cm3 molecule−1 s−1 over the temperature range 250-430 K.
Reliability
1 log k =± 0.10 at 298 K.1 (E/R) =± 250 K.
Comments on Preferred Values
The study of Tokuhashi et al. (1999) used samples of CHF2OCHClCF3 purified by GC (99.999% purity as analyzed by GC),and the 298 K rate coefficients obtained using three independent techniques (PLP-LIF, FP-LIF and DF-LIF) were identicalwithin the experimental errors. The room temperature rate coefficients of Brown et al. (1989; 1990) are higher than the ratecoefficient of Tokuhashi et al. (1999), possibly in part because of the presence of reactive impurities in the CHF2OCF2CHFClsample used by Brown et al. (1989, 1990) [see Tokuhashi et al. (1999)]. The rate coefficients of Beach et al. (2001) at 360 Kand 393 K are in excellent agreement with the data of Tokuhashi et al. (1999). However, the 293 K rate coefficient of Beachet al. (2001) is 25% higher than the 298 K rate coefficient of Tokuhashi et al. (1999), which is in agreement with the absoluterate coefficient of Langbein et al. (1999). The preferred values are those of Tokuhashi et al. (1999), with the uncertainty in thevalue ofE/R being sufficient to encompass the temperature dependence reported by Beach et al. (2001). The upper limit tothe rate coefficient measured by McLoughlin et al. (1993) is consistent with the preferred values.
Atmos. Chem. Phys., 8, 4141–4496, 2008 www.atmos-chem-phys.net/8/4141/2008/

R. Atkinson et al.: Evaluated kinetic and photochemical data for atmospheric chemistry 4343
References
Atkinson, R.: J. Phys. Chem. Ref. Data, Monograph 2, 1, 1994.Beach, S. D., Hickson, K. M., Smith, I. W. M. and Tuckett, R. P.: Phys. Chem. Chem. Phys., 3, 3064, 2001.Brown, A. C., Canosa-Mas, C. E., Parr, A. D., Pierce, J. M. T. and Wayne, R. P.: Nature, 341, 635, 1989.Brown, A. C., Canosa-Mas, C. E., Parr, A. D. and Wayne, R. P.: Atmos. Environ., 24A, 2499, 1990.Langbein, T., Sonntag, H., Trapp, D., Hoffmann, A., Malms, W., Roth, E.-P., Mors, V. and Zellner, R.: Br. J. Anaesthesia, 82,66, 1999.McLoughlin, P., Kane, R. and Shanahan, I.: Int. J. Chem. Kinet., 25, 137, 1993.Tokuhashi, K., Takahashi, A., Kaise, M. and Kondo, S.: J. Geophys. Res., 104, 18681, 1999.
www.atmos-chem-phys.net/8/4141/2008/ Atmos. Chem. Phys., 8, 4141–4496, 2008

4344 R. Atkinson et al.: Evaluated kinetic and photochemical data for atmospheric chemistry
IV.A2.146HO + CHF2OCF2CHFCl → H2O + CHF2OCF2CFCl (1)
→ H2O + CF2OCF2CHFCl (2)
Rate coefficient data (k = k1 + k2)
k/cm3 molecule−1 s−1 Temp./K Reference Technique/Comments
Absolute Rate Coefficients(1.7± 0.5)× 10−14 302 Brown et al., 1989; 1990 DF-RF(4.7± 0.7)× 10−14 4227.46× 10−13 exp[-(1230± 80)/T ] 250-430 Tokuhashi et al., 1999 PLP/FP/DF-LIF(1.19± 0.06)× 10−14 298(1.2± 0.2)× 10−14 298 Langbein et al., 1999 PLP-UVA
Relative Rate Coefficients<3× 10⁻¹³ 300± 3 McLoughlin et al., 1993 RR (a)
Comments
(a) HO radicals were generated by the photolysis of CH3ONO-NO-CHF2OCF2CHFCl-diethyl ether air mixtures at∼1 barpressure. The concentrations of CHF2OCF2CHFCl and diethyl ether were measured by GC. The measured upper limit tothe rate coefficient ratiok(HO + CHF2OCF2CHFCl)/k(HO + diethyl ether) is placed on an absolute basis by using a ratecoefficient ofk(HO + diethyl ether) = 1.31× 10⁻¹¹ cm3 molecule−1 s−1 at 300 K (Atkinson, 1994).
Preferred Values
k = 1.2× 10⁻¹⁴ cm3 molecule−1 s−1 at 298 K.k = 7.5× 10⁻¹³ exp(-1230/T ) cm3 molecule−1 s−1 over the temperature range 250-430 K.
Reliability
1 log k =± 0.10 at 298 K.1 (E/R) =± 150 K.
Comments on Preferred Values
The study of Tokuhashi et al. (1999) used samples of CHF2OCF2CHFCl purified by GC (99.999% purity as analyzed by GC),and the 298 K rate coefficients obtained using three independent techniques (PLP-LIF, FP-LIF and DF-LIF) were identicalwithin the experimental errors. The earlier measurements of Brown et al. (1989; 1990) at 302 K and 422 K are higher thanthe data of Tokuhashi et al. (1999), probably in part because of the presence of reactive impurities in the CHF2OCF2CHFClsample used by Brown et al. (1989; 1990) [see Tokuhashi et al. (1999)]. The 298 K rate coefficients from the absolute ratestudies of Tokuhashi et al. (1999) and Langbein et al. (1999) are in excellent agreement, and the preferred values are based onthese two studies. The upper limit to the rate coefficient measured by McLoughlin et al. (1993) is consistent with the preferredvalues.
References
Atkinson, R.: J. Phys. Chem. Ref. Data, Monograph 2, 1, 1994.Brown, A. C., Canosa-Mas, C. E., Parr, A. D., Pierce, J. M. T. and Wayne, R. P.: Nature, 341, 635, 1989.Brown, A. C., Canosa-Mas, C. E., Parr, A. D. and Wayne, R. P.: Atmos. Environ., 24A, 2499, 1990.Langbein, T., Sonntag, H., Trapp, D., Hoffmann, A., Malms, W., Roth, E.-P., Mors, V. and Zellner, R.: Br. J. Anaesthesia, 82,66, 1999.McLoughlin, P., Kane, R. and Shanahan, I.: Int. J. Chem. Kinet., 25, 137, 1993.Tokuhashi, K., Takahashi, A., Kaise, M. and Kondo, S.: J. Geophys. Res., 104, 18681, 1999.
Atmos. Chem. Phys., 8, 4141–4496, 2008 www.atmos-chem-phys.net/8/4141/2008/

R. Atkinson et al.: Evaluated kinetic and photochemical data for atmospheric chemistry 4345
IV.A2.147
HO2 + CF3CCl2O2→ O2 + CF3CCl2O2H
Rate coefficient data
k/cm3 molecule−1 s−1 Temp./K Reference Technique/Comments
Relative Rate Coefficients(1.9± 0.7)× 10−12 298 Hayman et al., 1994 LP-UVA (a)
Comments
(a) Laser flash photolysis-UV absorption study of CF3CCl3-CH3OH-O2-N2 mixtures. The kinetic data were obtained byanalyzing two sets of transient decays for CF3CCl2O2 and HO2 radicals on the basis of a mechanism consisting of 10reactions.
Preferred Values
k = 1.9× 10⁻¹² cm3 molecule−1 s−1 at 298 K.
Reliability
1 log k =± 0.3 at 298 K.
Comments on Preferred Values
While the above value of the rate coefficient seems reasonable, it has been derived from the analysis of a complex chemicalsystem and requires independent verification to reduce the recommended error limits. It is interesting to note, by comparisonwith data for analogous halogenated RO2 radicals, that while theα-substitution of Cl appears to reduce the rate coefficientslightly, the presence of the CF3 group causes a much larger reduction in the value ofk.
References
Hayman, G. D., Jenkin, M. E., Murrells, T. P. and Johnson, C. E.: Atmos. Environ. 28A, 421, 1994.
www.atmos-chem-phys.net/8/4141/2008/ Atmos. Chem. Phys., 8, 4141–4496, 2008

4346 R. Atkinson et al.: Evaluated kinetic and photochemical data for atmospheric chemistry
IV.A2.148
HO2 + CH2ClO2 → CH2ClO2H + O2 (1)→ HC(O)Cl + H 2O + O2 (2)
Rate coefficient data (k = k1 + k2)
k/cm3 molecule−1 s−1 Temp./K Reference Technique/Comments
Absolute Rate Coefficients3.26× 10−13 exp[(822± 63)/T ] 251-600 Catoire et al., 1994 FP-UVA (a)(4.9± 0.6)× 10−12 298
Branching Ratiosk1/k = 0.27± 0.05 295 Wallington et al., 1996 UVP-FTIR (b)k2/k = 0.73± 0.12
Comments
(a) Flash photolysis-UV absorption study of Cl2-CH3Cl-CH3OH-O2-N2 mixtures at a total pressure of 1013 mbar. Kineticdata were obtained by analyzing pairs of decay curves recorded at two monitoring wavelengths, with differing contribu-tions to the total absorption made by CH2ClO2 and HO2 radicals.
(b) Steady-state photolysis of Cl2-CH3Cl-H2-O2-N2 mixtures at total pressures of 933 mbar with FTIR spectroscopic moni-toring of the removal of CH3Cl and formation of CH2ClO2H and HCOCl as a function of the initial concentration ratio[H2]/[CH3Cl].
Preferred Values
k = 5.0× 10⁻¹² cm3 molecule−1 s−1 at 298 K.k = 3.2× 10⁻¹³ exp(820/T ) cm3 molecule−1 s−1 over the temperature range 250-600 K.k1/k = 0.3k2/k = 0.7
Reliability
1 log k =± 0.3 at 298 K.1 (E/R) =± 300 K.1 (k1/k) =± 0.1 at 298 K.1 (k2/k) =± 0.15 at 298 K.
Comments on Preferred Values
The preferred branching ratios are based on the results of the product study of Wallington et al. (1996), which demonstrate theparticipation of both reaction channels, with channel (2) dominating at 298 K. This is fully consistent with previous studiesof the oxidation of CH3Cl (Sanhueza and Heicklen, 1975; Niki et al., 1980), in which near-quantitative formation of HCOClwas observed, even though CH2ClO2 was believed to be partially removed by reaction with HO2. Tentative observation ofCH2ClO2H at yields up to ca. 10% in these earlier studies is also consistent with the branching ratios reported by Wallingtonet al. (1996).
The preferred rate coefficient values are based on the sole kinetics study of Catoire et al. (1994). These results indicate thatthe rate coefficients of the reactions of CH2ClO2 and CH3O2 radicals with the HO2 radical at 298 K are similar, as are theirtemperature dependences. This is in marked contrast to the self reactions of CH2ClO2 and CH3O2 radicals where chlorinesubstitution greatly enhances the rate coefficient. Confirmation of the above data is required.
Atmos. Chem. Phys., 8, 4141–4496, 2008 www.atmos-chem-phys.net/8/4141/2008/

R. Atkinson et al.: Evaluated kinetic and photochemical data for atmospheric chemistry 4347
References
Catoire, V., Lesclaux, R., Lightfoot, P. D. and Rayez, M.-T.: J. Phys. Chem. 98, 2889, 1994.Niki, H., Maker, P. D., Savage, C. M. and Breitenbach, L. P.: Int. J. Chem. Kinet. 12, 1001, 1980.Sanhueza, E. and Heicklen, J.: J. Phys. Chem. 79, 7, 1975.Wallington, T. J., Hurley, M.D. and Schneider, W.F.: Chem. Phys. Lett. 251, 164, 1996.
www.atmos-chem-phys.net/8/4141/2008/ Atmos. Chem. Phys., 8, 4141–4496, 2008

4348 R. Atkinson et al.: Evaluated kinetic and photochemical data for atmospheric chemistry
IV.A2.149
HO2 + CHCl2O2 → CHCl2O2H + O2 (1)→ C(O)Cl2 + H2O + O2 (2)→ HC(O)Cl + HOCl + O 2 (3)
Rate coefficient data (k = k1 + k2 + k3)
k/cm3 molecule−1 s−1 Temp./K Reference Technique/Comments
Absolute Rate Coefficients5.6× 10−13 exp[(700± 64)/T ] 286-440 Catoire et al., 1996 FP-UVA (a)(5.46± 0.77)× 10−12 300
Branching Ratiosk2/k = 0.71 295 Catoire et al., 1996 UVP-FTIR (b)k3/k = 0.29
Comments
(a) Flash photolysis of CHCl3 in the presence of CH3OH-O2-N2 mixtures at a total pressure of 1013 mbar. Decays in transientabsorption signals (with contributions from CHCl2O2 and HO2) were recorded in the wavelength range 220 nm to 250nm. k derived in conjunction with optimization of the rate coefficient for the self-reaction of CHCl2O2, using a fivereaction mechanism.
(b) Steady-state photolysis of Cl2 or F2 in the presence of CH2Cl2-H2-O2-N2 mixtures at a total pressure of 933 mbar withFTIR spectroscopic monitoring of the removal of CH2Cl2 and formation of HCOCl and COCl2 as a function of the initialconcentration ratio [H2]/[CH2Cl2].
Preferred Values
k = 5.9× 10⁻¹² cm3 molecule−1 s−1 at 298 K.k = 5.6× 10⁻¹³ exp(700/T ) cm3 molecule−1 s−1 over the temperature range 280-440 K.k2/k = 0.7 at 298 K.k3/k = 0.3 at 298 K.
Reliability
1 log k =± 0.3 at 298 K.1 (E/R) =± 300 K.1 (k1/k) =± 0.2 at 298 K.1 (k2/k) =± 0.1 at 298 K.
Comments on Preferred Values
The preferred branching ratios are based on the results of the product study of Catoire et al. (1996), which provide evidencefor the participation of reaction channels (2) and (3), through observation of C(O)Cl2 and HC(O)Cl formation, respectively.No evidence for formation of the hydroperoxide, CHCl2OOH, by channel (1) was obtained. The existence of an alternativechannel forming O2, OH and CHCl2O (and therefore HC(O)Cl from CHCl2O decomposition) could not be ruled out on thebasis of the product studies alone; but no evidence for a radical-forming channel was apparent from the kinetics measurementsin the same study.
The preferred rate coefficient values are based on the sole kinetics study of Catoire et al. (1996). These results indicate thatthe rate coefficients of the reactions of CH3O2, CH2ClO2, CHCl2O2 and CCl3O2 radicals with the HO2 radical at 298 K are
Atmos. Chem. Phys., 8, 4141–4496, 2008 www.atmos-chem-phys.net/8/4141/2008/

R. Atkinson et al.: Evaluated kinetic and photochemical data for atmospheric chemistry 4349
similar, as are their temperature dependences. This is in marked contrast to the self-reactions, for which chlorine substitutiongreatly enhances the rate coefficient. Confirmation of the above sole determination is required.
References
Catoire, V., Lesclaux, R., Schneider, W. F. and Wallington, T. J.: J. Phys. Chem. 100, 14356, 1996.
www.atmos-chem-phys.net/8/4141/2008/ Atmos. Chem. Phys., 8, 4141–4496, 2008

4350 R. Atkinson et al.: Evaluated kinetic and photochemical data for atmospheric chemistry
IV.A2.150
HO2 + CF2ClO2 → O2 + CF2ClO2H (1)→ O2 + COF2 + HOCl (2)→ O2 + FCOCl + HOF (3)
Rate coefficient data (k = k1 + k2 + k3)
k/cm3 molecule−1 s−1 Temp./K Reference Technique/Comments
Absolute Rate Coefficients(3.4± 1.7)× 10−12 296 Hayman and Battin-Leclerc, 1995 LP-UVA (a)
Comments
(a) Flash photolysis of H2O2 in the presence of CHF2Cl-O2-N2 mixtures at a total pressure of 1013 mbar. Decays in transientabsorption signals (with contributions from CF2ClO2 and HO2) were recorded in the wavelength range 220 nm to 240nm. k derived from simulations of the decay traces using a 10 reaction mechanism.
Preferred Values
k = 3.4× 10⁻¹² cm3 molecule−1 s−1 at 298 K.
Reliability
1 log k =± 0.5 at 298 K.
Comments on Preferred Values
While the above value of the rate coefficient seems reasonable, it has been derived from the analysis of a complex chemicalsystem and requires independent verification to reduce the recommended error limits.
The rate coefficients for the reactions of HO2 with a number of halogenated peroxy radicals suggest that the presence of anα-F atom has a deactivating influence. Consistent with this,k is apparently somewhat lower than those for the correspondingreactions of CH3O2, CH2ClO2, CHCl2O2 and CCl3O2, which all lie in the range (5-6)× 10−12 cm3 molecule−1 s−1.
References
Hayman, G. and Battin-Leclerc, F.: J. Chem. Soc. Faraday Trans. 91, 1313, 1995.
Atmos. Chem. Phys., 8, 4141–4496, 2008 www.atmos-chem-phys.net/8/4141/2008/

R. Atkinson et al.: Evaluated kinetic and photochemical data for atmospheric chemistry 4351
IV.A2.151
HO2 + CCl3O2 → CCl3O2H + O2 (1)→ C(O)Cl2 + HOCl + O2 (2)
Rate coefficient data (k = k1 + k2)
k/cm3 molecule−1 s−1 Temp./K Reference Technique/Comments
Absolute Rate Coefficients4.8× 10−13 exp[(706± 31)/T ] 298-374 Catoire et al., 1996 FP-UVA (a)(4.9± 0.6)× 10−12 300
Branching Ratiosk2/k = 1.0 295 Catoire et al., 1996 UVP-FTIR (b)
Comments
(a) Flash photolysis of CCl4 in the presence of CH3OH-O2-N2 mixtures at a total pressure of 1013 mbar. Decays in transientabsorption signals (with contributions from CCl3O2 and HO2) were recorded in the wavelength range 220 nm to 250 nm.k derived from simulations of the decay traces using a six reaction mechanism.
(b) Steady-state photolysis of Cl2 or F2 in the presence of CHCl3-H2-O2-N2 mixtures at a total pressure of 933 mbar withFTIR spectroscopic monitoring of the removal of CHCl3 and formation of C(O)Cl2 as a function of the initial concen-tration ratio [H2]/[CH2Cl2]. C(O)Cl2 was the only carbon-containing product observed, with a yield of 100% (withinexperimental error) under all conditions.
Preferred Values
k = 5.1× 10⁻¹² cm3 molecule−1 s−1 at 298 K.k = 4.7× 10⁻¹³ exp(710/T ) cm3 molecule−1 s−1 over the temperature range 280-440 K.k2/k = 1.0 at 298 K.
Reliability
1 log k =± 0.3 at 298 K.1 (E/R) =± 300 K.1 (k2/k) = +0.0
−0.1 at 298 K.
Comments on Preferred Values
The results of the product study of Catoire et al. (1996) are consistent with the reaction proceeding exclusively via channel (2).The preferred rate coefficient values are based on the results of the same study, which is the only study of this reaction. Theseresults indicate that the rate coefficients of the reactions of CH3O2, CH2ClO2, CHCl2O2 and CCl3O2 radicals with the HO2radical at 298 K are similar, as are their temperature dependences. This is in marked contrast to the self-reactions, for whichchlorine substitution greatly enhances the rate coefficient. Confirmation of the above sole determination is required.
References
Catoire, V., Lesclaux, R., Schneider, W. F. and Wallington, T. J.: J. Phys. Chem. 100, 14356, 1996.
www.atmos-chem-phys.net/8/4141/2008/ Atmos. Chem. Phys., 8, 4141–4496, 2008

4352 R. Atkinson et al.: Evaluated kinetic and photochemical data for atmospheric chemistry
IV.A2.152
HO2 + CFCl2CH2O2 → O2 + CFCl2CH2O2H (1)→ O2 + CFCl2CHO + H2O (2)
Rate coefficient data (k = k1 + k2)
k/cm3 molecule−1 s−1 Temp./K Reference Technique/Comments
Absolute Rate Coefficients(9.2± 4.6)× 10−12 296 Hayman and Battin-Leclerc, 1995 LP-UVA (a)
Comments
(a) Flash photolysis of H2O2 in the presence of CFCl2CH3-O2-N2 mixtures at a total pressure of 1013 mbar. Decays intransient absorption signals (with contributions from CFCl2CH2O2 and HO2) were recorded in the wavelength range 220nm to 240 nm.k derived from simulations of the decay traces using a 10 reaction mechanism.
Preferred Values
k = 9.2× 10⁻¹² cm3 molecule−1 s−1 at 298 K.
Reliability
1 log k =± 0.5 at 298 K.
Comments on Preferred Values
While the above value of the rate coefficient seems reasonable, it has been derived from the analysis of a complex chemicalsystem and requires independent verification to reduce the recommended error limits. Within the uncertainty of the determina-tion, k is indistinguishable from that recommended for the reaction of HO2 with C2H5O2, suggesting that the presence of theCFCl2 group has only a minor influence on the reaction.
References
Hayman, G. and Battin-Leclerc, F.: J. Chem. Soc. Faraday Trans. 91, 1313, 1995.
Atmos. Chem. Phys., 8, 4141–4496, 2008 www.atmos-chem-phys.net/8/4141/2008/

R. Atkinson et al.: Evaluated kinetic and photochemical data for atmospheric chemistry 4353
IV.A2.153
HO2 + CF2ClCH2O2 → O2 + CF2ClCH2O2H (1)→ O2 + CF2ClCHO + H 2O (2)
Rate coefficient data (k = k1 + k2)
k/cm3 molecule−1 s−1 Temp./K Reference Technique/Comments
Absolute Rate Coefficients(6.8± 3.4)× 10−12 296 Hayman and Battin-Leclerc, 1995 LP-UVA (a)
Comments
(a) Flash photolysis of H2O2 in the presence of CF2ClCH3-O2-N2 mixtures at a total pressure of 1013 mbar. Decays intransient absorption signals (with contributions from CF2ClCH2O2 and HO2) were recorded in the wavelength range 220nm to 240 nm.k derived from simulations of the decay traces using a 10 reaction mechanism.
Preferred Values
k = 6.8× 10⁻¹² cm3 molecule−1 s−1 at 298 K.
Reliability
1 log k =± 0.5 at 298 K.
Comments on Preferred Values
While the above value of the rate coefficient seems reasonable, it has been derived from the analysis of a complex chemicalsystem and requires independent verification to reduce the recommended error limits. Within the uncertainty of the determina-tion, k is indistinguishable from that recommended for the reaction of HO2 with C2H5O2, suggesting that the presence of theCF2Cl group has only a minor influence on the reaction.
References
Hayman, G. and Battin-Leclerc, F.: J. Chem. Soc. Faraday Trans. 91, 1313, 1995.
www.atmos-chem-phys.net/8/4141/2008/ Atmos. Chem. Phys., 8, 4141–4496, 2008

4354 R. Atkinson et al.: Evaluated kinetic and photochemical data for atmospheric chemistry
IV.A2.154
NO3 + C2HCl3→ products
Rate coefficient data
k/cm3 molecule−1 s−1 Temp./K Reference Technique/Comments
Absolute Rate Coefficients4.0× 10−13 exp(-2030/T ) 278-368 Noremsaune et al., 1997 DF-Vis (a)(4.43± 0.32)× 10−16 295
Relative Rate Coefficients(2.9± 0.2)× 10−16 298 Atkinson et al., 1987 RR (b)(3.8± 0.4)× 10−16 298 Noremsaune et al., 1997 RR (c)(4.7± 1.1)× 10−16 298 Noremsaune et al., 1997 RR (d)(3.6± 0.9)× 10−16 298 Chew et al., 1998 RR (e)
Comments
(a) NO3 was generated by F + HNO3 and detected by optical absorption in a multi-pass cell. Experiments conducted underpseudo-first order conditions.
(b) The relative decay rates of C2HCl3 and C2H4 were monitored in N2O5-NO2-organic-air mixtures at one atmosphere totalpressure of air to obtain:k(NO3 + C2HCl3)/k(NO3 + C2H4) = (1.37± 0.08). This rate coefficient ratio was placed on anabsolute basis usingk(NO3 + C2H4) = 2.1× 10⁻¹⁶ cm3 molecule−1 s−1 (IUPAC, current recommendation).
(c) NO3 was formed in the thermal decomposition of N2O5 in mixtures containing C2HCl3 and ethene as reference reactantat total pressures of 1013 mbar N2. The addition of ethane as a Cl atom scavenger had no effect.k(NO3 + C2HCl3)/k(NO3+ C2H4) was measured to be (1.79± 0.18). This was placed on an absolute basis usingk(NO3 + C2H4) = 2.1× 10⁻¹⁶
cm3 molecule−1 s−1 (IUPAC, current recommendation).
(d) NO3 was formed in the thermal decomposition of N2O5 in mixtures containing C2HCl3 and C2H3Cl as reference reactantat total pressures of 1013 mbar N2. Addition of ethane as a Cl atom scavenger had no effect.k(NO3 + C2HCl3)/k(NO3 +C2H3Cl) was measured to be (1.3± 0.04). This was placed on an absolute basis usingk(NO3 + C2H3Cl) = (3.7± 0.8)×10−16 cm3 molecule−1 s−1 (Noremsaune et al., 1997).
(e) NO3 was formed in the thermal decomposition of N2O5 in mixtures containing C2HCl3 and 2,3-dimethylbutane as ref-erence reactant at total pressures of 990 mbar air. Depletion of reactants was monitored by GC-FID. Addition of ethaneas Cl and OH atom scavenger.k(NO3 + C2HCl3)/k(NO3 + 2,3-dimethylbutane) was measured to be (0.82± 0.21). Thiswas placed on an absolute basis usingk(NO3 + 2,3-dimethylbutane) = 4.39× 10⁻¹⁶ cm3 molecule−1 s−1.
Preferred Values
k = 3.5× 10⁻¹⁶ cm3 molecule−1 s−1 at 298 K.k = 3.2× 10⁻¹³ exp(-2030/T ) cm3 molecule−1 s−1 over the temperature range 270-370 K.
Reliability
1 log k =± 0.2 at 298 K.1 (E/R) =± 500 K.
Atmos. Chem. Phys., 8, 4141–4496, 2008 www.atmos-chem-phys.net/8/4141/2008/

R. Atkinson et al.: Evaluated kinetic and photochemical data for atmospheric chemistry 4355
Comments on Preferred Values
The preferred value is derived from the relative rate coefficients measured by Atkinson et al. (1987) and Noremsaune et al.(1997) determined relative to ethene, and Chew et al. (1998) relative to 2,3-dimethybutane. The temperature dependence isbased on the result of Noremsaune et al. (1997), the only measurement over a range of temperatures. TheirA-factor has beenmodified to reproduce the recommended rate constant at 298 K. There are several product channels open, resulting in formationof trichloroepoxyethane, dichloracetylchloride, chloroformyl and carbonylchloride (Noremsaune et al., 1995; Perez-Casany etal., 2000).
References
Atkinson, R., Aschmann, S. M. and Goodman, M. A.: Int. J. Chem. Kinet., 19, 299, 1987.Chew, A. A., Atkinson, R. and Aschmann, S. M.: J. Chem. Soc. Faraday Trans., 94, 1083, 1998.IUPAC: http://www.iupac-kinetic.ch.cam.ac.uk/, 2007.Noremsaune, I. M. W., Hjorth, J. and Nielsen, C. J.: J. Atmos. Chem., 21, 223, 1995.Noremsaune, I. M. W., Langer, S., Ljungstrom, E. and Nielsen, C. J.: J. Chem. Soc., Faraday Trans. 93, 525, 1997.Perez-Casany, M. P., Nebot-Gil, I. and Sanchez-Martin, J.: J. Phys. Chem. A, 104, 11340, 2000.
www.atmos-chem-phys.net/8/4141/2008/ Atmos. Chem. Phys., 8, 4141–4496, 2008

4356 R. Atkinson et al.: Evaluated kinetic and photochemical data for atmospheric chemistry
IV.A2.155
NO3 + C2Cl4→ products
Rate coefficient data
k/cm3 molecule−1 s−1 Temp./K Reference Technique/Comments
Absolute Rate Coefficients(9.6± 8.1)× 10−17 295 Noremsaune et al., 1997 DF-Vis (a)
Relative Rate Coefficients<5× 10⁻¹⁷ 298 Atkinson et al., 1987 RR (b)(8± 3)× 10−17 299 Noremsaune et al., 1997 RR (c)4× 10⁻¹⁷ 299 Noremsaune et al., 1997 RR (d)<1.8× 10⁻¹⁶ 298 Chew et al., 1998 RR (e)
Comments
(a) NO3 generated by F + HNO3 and detected by optical absorption in a multi-pass cell. Experiments conducted underpseudo-first order conditions.
(b) Derived by monitoring the relative decay rates of C2Cl4 and C2H4 in N2O5-NO2-organic-air mixtures at one atmospheretotal pressure of air. The observations yieldedk(NO3 + C2Cl4)/k(NO3 + C2H4) = < 0.25. This upper limit to the ratecoefficient ratio was placed on an absolute basis by use ofk(NO3 + C2H4) = 2.1× 10⁻¹⁶ cm3 molecule−1 s−1 (IUPAC,current recommendation).
(c) NO3 formed in the thermal decomposition of N2O5 in mixtures containing C2HCl3 and ethene as reference reactant attotal pressures of 1013 mbar N2. Addition of ethane as Cl atom scavenger had no effect.k(NO3 + C2Cl4)/k(NO3 +C2H4) was measured to be (0.39± 0.11). This was placed on an absolute basis usingk(NO3 + C2H4) = 2.1× 10⁻¹⁶ cm3
molecule−1 s−1 (IUPAC, current recommendation).
(d) NO3 formed in the thermal decomposition of N2O5 in mixtures containing C2Cl4 and C2H3Cl as reference reactant attotal pressures of 1013 mbar N2. Addition of ethane as Cl atom scavenger had no effect.k(NO3 + C2Cl4)/k(NO3 +C2H3Cl) was measured to be 0.1. This was placed on an absolute basis usingk(NO3 + C2H3Cl) = (3.7± 0.8)× 10−16
cm3 molecule−1 s−1 (Noremsaune et al. 1997).
(e) NO3 formed in the thermal decomposition of N2O5 in mixtures containing C2Cl4 and 2,3-dimethylbutane as referencereactant at total pressures of 990 mbar air. Depletion of reactants was monitored by GC-FID. Addition of ethane as Cl andOH atom scavenger.k(NO3 + C2Cl4)/k(NO3 + 2,3-dimethylbutane) was measured to be (0.21± 0.18). This was placedon an absolute basis usingk(NO3 + 2,3-dimethylbutane) = 4.39× 10⁻¹⁶ cm3 molecule−1 s−1.
Preferred Values
k < 1× 10⁻¹⁶ cm3 molecule−1 s−1 at 298 K.
Comments on Preferred Values
The preferred value is derived from the relative rate coefficients measured by Atkinson et al. (1987). The upper limit to therate coefficient has been increased to take into account the spread in the data.
References
Atkinson, R., Aschmann, S. M., and Goodman, M. A.: Int. J. Chem. Kinet., 19, 299, 1987.Chew, A. A., Atkinson, R. and Aschmann, S. M.: J. Chem. Soc. Faraday Trans., 94, 1083, 1998.IUPAC: http://www.iupac-kinetic.ch.cam.ac.uk/, 2007.Noremsaune, I. M. W., Langer, S., Ljungstrom, E. and Nielsen, C. J.: J. Chem. Soc., Faraday Trans. 93, 525, 1997.
Atmos. Chem. Phys., 8, 4141–4496, 2008 www.atmos-chem-phys.net/8/4141/2008/

R. Atkinson et al.: Evaluated kinetic and photochemical data for atmospheric chemistry 4357
IV.A2.156
ClO + CH3O2 → ClOO + CH3O (1)→ OClO + CH3O (2)→ HCHO + HCl + O 2 (3)→ CH3Cl + O3 (4)→ CH3OCl + O2 (5)
1H ◦(1) = 4.1 kJ·mol−1
1H ◦(2) = 1.2 kJ·mol−1
1H ◦(3) = -311.5 kJ·mol−1
1H ◦(4) = -49.9 kJ·mol−1
1H ◦(5) = -174.6 kJ·mol−1
Rate coefficient data (k = k1 + k2 + k3 + k4 + k5)
k/cm3 molecule−1 s−1 Temp./K Reference Technique/Comments
Absolute Rate Coefficients(3.1± 1.7)× 10−12 300 Simon et al., 1989 MM-UVA (a)3.25× 10⁻¹² exp[-(114± 38)/T ] 225-355 Helleis et al., 1993 DF-MS (b)2.22× 10⁻¹² 295(1.9± 0.4)× 10−12 293 Kenner et al., 1993 DF-MS (c)2.0× 10⁻¹² exp[(80± 50)/T ] 233-300 Kukui et al., 1994 DF-MS (d)(2.5± 0.3)× 10−12 300
Branching Ratiosk1/k > 0.70 300 Simon et al., 1989 IR, UV (e)k2/k < 0.05k3/k < 0.02k1/k = 1.51 exp[-(218± 93)/T ] 225-295 Helleis et al., 1993 DF-MS (f)k3/k < 0.02k5/k = 0.08 exp[(377± 178)/T ]k1/k = 0.50± 0.2 300 Kukui et al., 1994 DF-MS (g)k1/k = 0.63± 0.2 273k1/k = 0.38± 0.2 253k1/k = 0.26± 0.1 233k5/k = 0.011 exp[(836± 140)/T ] 233-300k5/k = (T /300)−1.65 - 0.223 exp(411/T ) 215-295 Helleis et al., 1994 DF-MS (h)k1/k = 0.21 - 0.51 298 Biggs et al., 1995 DF-LIF (i)k1/k = 0.3± 0.1 298 Daele and Poulet, 1996 DF-LIF (j)
Comments
(a) Broad band photolysis of slowly flowing Cl2-Cl2O-CH4-O2 mixtures at 312± 7 mbar. CH3O2 and ClO were detected byabsorption at 240 nm and 292.2 nm, respectively. The rate constant was derived by fitting time dependent optical densitymeasurements at 240 nm and 292.2 nm to a chemical model.
(b) Flow tube at 2.3-4 mbar He. CH3O2 formed in F + CH4 in the presence of O2, ClO formed from Cl + Cl2O, or Cl + OClOor Cl + O3. Both reactants were monitored at their parent ions by mass spectrometry, and the pseudo first order decay ofCH3O2 in excess concentration of ClO used to derivek directly.
(c) Flow tube at 2.5 mbar He. CH3O2 formed in F + CH4 in presence of O2, ClO formed from Cl + O3. Both reactants weremonitored at their parent ions by mass spectrometry, and the pseudo first order decay of CH3O2 in excess concentrationof ClO used to derivek directly.
www.atmos-chem-phys.net/8/4141/2008/ Atmos. Chem. Phys., 8, 4141–4496, 2008

4358 R. Atkinson et al.: Evaluated kinetic and photochemical data for atmospheric chemistry
(d) Flow tube at 5–6 mbar He. CH3O2 formed in F + CH4 in presence of O2, ClO formed from Cl + O3. Both reactants weremonitored at their parent ions by mass spectrometry, and the pseudo first order decay of CH3O2 in excess concentrationof ClO used to derivek directly.
(e) FTIR and UV analysis of flowing gas-mixture (as described in comment (a)). No evidence for OClO formation enabledthe upper limit ofk2/k < 0.05 to be derived. Also, no evidence for O3 formation from channel (4). Observed productsby FTIR were HCHO, CH3OH, HCl and HC(O)OH. HC(O)OH profiles were analysed with the assumption that it wasformed in reactions of HCHO with HO2 which allows some differentiation between channels (1) and (3), both of whichgenerate HCHO if O is present, but only one of which generates HO2. The yield of HC(O)OH was compatible withk2/k> 0.7 andk3/k < 0.3.
(f) (see also comment b). Mass spectrometric detection of products. No evidence was found for formation of OClO, O3or CH3Cl, suggesting that channels 2 and 4 are unimportant. Use of CD3O2 enabled sensitive measurement of DClformation, and an upper limit of 2% for channel 3. HCHO, HOCl and CH3OCl were positively identified as products.Branching ratios were derived by assuming that CH3OCl is formed directly in channel (5), whereas HCHO and HOClarise from channel (1) followed by rapid reaction of CH3O with ClO, and by calibrating the CH3O2 and HCHO signals.The branching ratio to channel (5) was derived by assuming that only channels (1) and (5) are significant (i.e. sum tounity), though the predicted negative temperature dependence of the CH3OCl yield was observed.
(g) (see also comment d). CH3O2 formed in F + CH4 in presence of O2, ClO formed from Cl + O3. No evidence found forformation of OClO or CH3Cl. Observed products were CH3OCl, HOCl and HCHO. Branching ratios for CH3OCl andHCHO derived by quantitative mass spectrometric detection of both CH3O2 loss and CH3OCl or HCHO formation. Theparameterisation of the branching ratiok5/k was derived by fitting to the authors tabulated data. HOCl signals were alsoconverted to temperature dependent values ofk1/k by normalising to (k1 + k5)/k = 1 at 300 K.
(h) Flow tube at 2.3 mbar He. CH3O2 formed in F + CH4 in presence of O2, ClO formed from Cl + Cl2O. Branching ratiosderived by quantitative mass spectrometric detection of both CH3O2 loss and CH3OCl formation.
(i) Flow tube at 2.7 mbar He. CH3O2 (not detected) formed in F + CH4 in presence of O2, ClO (detected by MS) formedfrom Cl + O3. CH3O detected by LIF at 292.8 nm. Derivation of the branching ratio for channel (1) involved modellingCH3O profiles that were influenced by the presence of CH3O impurity in the CH3O2 source, and reactions of both CH3O2and CH3O with Cl atoms, and loss of CH3O by reaction with ClO and at the wall.
(j) Flow tube at 1.3 mbar He. CH3O2 formed in F + CH4 in presence of O2, ClO (detected by MS) formed from Cl + O3.CH3O was detected quantitatively by LIF at 298.3 nm, and CH3OCl was observed but not quantified. As in comment (i),derivation of the branching ratio required numerical simulation of several processes.
Preferred Values
k = 2.2× 10⁻¹² cm3 molecule−1 s−1 at 298 K.k = 2.4× 10⁻¹² exp(-20/T ) cm3 molecule−1 s−1 over the temperature range 220-360 K.
k1/k = 0.73 at 298 K.k1/k = 1.51 exp(-218/T ) from 220 to 300 K.k5/k = 0.15 at 298 K.k5/k = 0.018 exp(630/T ) from 220 to 300 K.
Reliability
1 log k =± 0.15 at 298 K.1 (E/R) =± 200 K.1 (k1/k)=± 0.2 at 298 K.1 (E/R) =± 150 K.1 (k5/k) = 0.1 at 298 K.1 (E/R) =± 300 K.
Atmos. Chem. Phys., 8, 4141–4496, 2008 www.atmos-chem-phys.net/8/4141/2008/

R. Atkinson et al.: Evaluated kinetic and photochemical data for atmospheric chemistry 4359
Comments on Preferred Values
The preferred value ofk at 298 K is the unweighted averagek from the direct studies of Helleis et al. (1993), Kenner et al.(1993) and Kukui et al. (1994) who all measured the CH3O2 radical directly by MS, under pseudo first-order conditions. Therecommended value also encompasses the result of Simon et al. (1989), which was obtained indirectly, and is consistent withthe upper limit ofk(200 K) < 4.0× 10⁻¹² cm3 molecule−1 s−1 set by DeMore (1991). The temperature dependence ofk
was derived by averaging the values ofE/R presented by Helleis et al. (1993) and Kukui et al. (1994) and adjusting thepre-exponential factor to obtain the recommended value ofk(298 K).
Although there is consensus that formation of CH3Cl, O3, OClO and HCl are insignificant, (Simon et al., 1989; Helleis et al.,1993; Kenner et al., 1993; DeMore, 1991) ruling out channels (2-4), there is disagreement in the branching ratio to channels(1) and (5). The most reliable branching ratio is that to CH3OCl formation (5), as CH3OCl is easiest to calibrate, and is anon-reactive product. The preferred branching ratio at 298 K for channel (5) is the averaged result of Helleis et al. (1993)and Kukui et al. (1994). The data of Helleis et al. (1993) are reproduced by the expression:k5/k = 0.034 exp (430/T ), whichwas combined withk5/k = 0.011 exp (836/T ) from Kukui et al. (1994) to obtain the preferred expression for the temperaturedependence of branching to channel (5).
There are two direct measurements (Biggs et al., 1995; Daele et al., 1996) of CH3O formation in channel (1), which requiredextensive modelling of its further reactions, and which had to take its presence as impurity in the CH3O2 source into account(see comments i and j). There are also indirect measurements, which assume rapid conversion of CH3O to HCHO and HOClvia reaction with the excess ClO, which is borne out in separate studies of the kinetics of this reaction (Daele et al. 1996,Biggs et al. 1995). Helleis et al. (1993) and Kukui et al. (1994) observed formation of both HCHO and HOCl, with kineticsconsistent with formation in channel (1) as rate limiting step. Although only HCHO could be accurately calibrated, HOClsignals were consistent with expected ionization efficiencies compared to ClO. The data of Kukui et al. (1994) suffered from alarge background under the HCHO peak, which introduced severe uncertainty into their measurement ofk1/k, and the preferredbranching ratio for channel 1 at 298 K, and its temperature dependence is therefore taken from Helleis et al. (1993). This datais in excellent agreement with the values ofk1/k which Kukui et al. (1994) derived from HOCl signals and assuming that onlychannels (1) and (5) contribute at 300 K.
When summed together, channels (1) and (5) are seen to represent 85–90 % of the overall reaction, although these measure-ments are associated with large errors that do not preclude a significant, so far unconsidered reaction channel, which wouldpotentially also explain the low branching ratios for CH3O formation obtained. The error limits onk1/k are expanded to ac-commodate this. Theoretical work (Drougas et al., 2003) has shown that the reaction proceeds via formation of a CH3OOOClassociation complex on both a singlet surface (decomposing to CH3O + ClOO, (1)) or a triplet surface (rearranging to formCH3OCl + O2 (2)), which is consistent with experimental findings.
References
Biggs, P., Canosa-Mas, C. E., Fracheboud, J.-M., Shallcross, D. E. and Wayne, R. P.: Geophys. Res. Lett. 22, 1221, 1995.Biggs, P., Canosa-Mas, C. E., Fracheboud, J.-M., Marston, G., Shallcross, D. E. and Wayne, R. P.: J. Chem. Soc. FaradayTrans. 91, 3045, 1995.Daele, V. and Poulet, G.: J. Chim. Phys. 93, 1081, 1996.Daele, V., Laverdet, G. and Poulet, G.: Int. J. Chem. Kinet. 28, 589, 1996.DeMore, W. B.: J. Geophys. Res. 96, 4995, 1991.Drougas, E., Jalbout, A. F. and Kosmas, A. M.: J. Phys. Chem. A 107, 11386, 2003.Helleis, F., Crowley, J. N. and Moortgat, G. K.: J. Phys. Chem. 97, 11464, 1993.Helleis, F., Crowley, J. and Moortgat, G.: Geophys. Res. Lett. 21, 1795, 1994.Kenner, R. D., Ryan, K. R. and Plumb, I. C.: Geophys. Res. Lett. 20, 1571, 1993.Kukui, A. S., Jungkamp, T. P. W. and Schindler, R. N.: Ber. Bunsenges. Phys. Chem. 98, 1298, 1994.Simon, F. G., Burrows, J. P., Schneider, W., Moortgat, G. K. and Crutzen, P. J.: J. Phys. Chem. 93, 7807, 1989.
www.atmos-chem-phys.net/8/4141/2008/ Atmos. Chem. Phys., 8, 4141–4496, 2008

4360 R. Atkinson et al.: Evaluated kinetic and photochemical data for atmospheric chemistry
IV.A2.157
CF2Cl + O2 + M → CF2ClO2 + M
1H ◦ = -127.4 kJ·mol−1
Low-pressure rate coefficients
Rate coefficient data
k0/cm3 molecule−1 s−1 Temp./K Reference Technique/Comments
Absolute Rate Coefficients1.4× 10−29 (T /298)−5.2[N2] 200-300 Forst and Caralp, 1991 (a)
Comments
(a) Microcanonical variational theory with inversion of partition functions, used for interpolation between experimental dataof the reactions O2 + (CCl3, CCl2F and CF3).
Preferred Values
k0 = 1.4× 10⁻²⁹ (T /300)−5[N2] cm3 molecule−1 s−1 over the temperature range 200-300 K.
Reliability
1 log k0 =± 0.5 at 298 K.1 n =± 3.
Comments on Preferred Values
There are no measurements for this reaction. However, the analysis by Forst and Caralp (1991), as well as a simple interpolationof k0-values for CF3 + O2 and CFCl2 + O2 lead to the given preferred values. Unlike Forst and Caralp (1991), who preferFc
= 0.6 we recommendFc= 0.4.
High-pressure rate coefficients
Rate coefficient data
k∞/cm3 molecule−1 s−1 Temp./K Reference Technique/Comments
Absolute Rate Coefficients7.1× 10−12 (T /298)−0.56 200-300 Forst and Caralp, 1991 (a)
Comments
(a) See comment (a) fork0.
Atmos. Chem. Phys., 8, 4141–4496, 2008 www.atmos-chem-phys.net/8/4141/2008/

R. Atkinson et al.: Evaluated kinetic and photochemical data for atmospheric chemistry 4361
Preferred Values
k∞ = 7× 10⁻¹² (T /298)−0.6 cm3 molecule−1 s−1 over the temperature range 200-300 K.
Reliability
1 log k∞ =± 0.5 at 298 K.1 n =± 0.5.
Comments on Preferred Values
See Comments on Preferred Values fork0.
References
Forst, W. and Caralp, F.: J. Chem. Soc. Faraday Trans.. 87, 2307, 1991.
www.atmos-chem-phys.net/8/4141/2008/ Atmos. Chem. Phys., 8, 4141–4496, 2008

4362 R. Atkinson et al.: Evaluated kinetic and photochemical data for atmospheric chemistry
IV.A2.158
CFCl2 + O2 + M → CFCl2O2 + M
1H ◦ = -124.6 kJ·mol−1
Low-pressure rate coefficients
Rate coefficient data
k0/cm3 molecule−1 s−1 Temp./K Reference Technique/Comments
Absolute Rate Coefficients(5.0± 0.8)× 10−30 [N2] 298 Caralp and Lesclaux, 1983 PP-MS (a)5.5× 10⁻³⁰ (T /298)−6[N2] 233-373 Danis, 1991 PLP-MS (b)
Comments
(a) Pulsed laser photolysis-MS study. Falloff curve measure over the range 0.3–16 mbar, extrapolated withFc= 0.6 andk∞=6× 10⁻¹² cm3 molecule−1 s−1.
(b) As comment (a). Results cited and evaluated by Forst and Caralp (1991).
Preferred Values
k0 = 6× 10⁻³⁰ (T /298)−6[N2] cm3 molecule−1 s−1 over the temperature range 230-380 K.
Reliability
1 log k0 =± 0.3 at 298 K.1 n =± 3.
Comments on Preferred Values
There are only measurements from a single laboratory which were made close to the low pressure limit of the falloff curve.UsingFc values of 0.35–0.4 such as observed for CCl3 + O2 and CF3 + O2 would only slightly modify the extrapolated valuesof k0 but be of larger influence onk∞.
High-pressure rate coefficients
Rate coefficient data
k∞/cm3 molecule−1 s−1 Temp./K Reference Technique/Comments
Absolute Rate Coefficients(6± 1)× 10−12 298 Caralp and Lesclaux, 1983 PLP-MS (a)(9± 3)× 10−12 233-273 Danis, 1991 PLP-MS (b)
Atmos. Chem. Phys., 8, 4141–4496, 2008 www.atmos-chem-phys.net/8/4141/2008/

R. Atkinson et al.: Evaluated kinetic and photochemical data for atmospheric chemistry 4363
Comments
(a) See comment (a) fork0
(b) See comment (b) fork0
Preferred Values
k∞ = 9× 10⁻¹² cm3 molecule−1 s−1 over the temperature range 230-300 K.
Reliability
1 log k∞ =± 0.3 at 298 K.1 n =± 1.
Comments on Preferred Values
See Comments on Preferred Values fork0. UsingFc = 0.4 instead of 0.6 in the present case would increasek∞ by a factor of1.5. The present choice, therefore, is based on the data from Caralp and Lesclaux (1983) andFc ≈ 0.4.
References
Caralp, F. and Lesclaux, R.: Chem. Phys. Lett., 102, 54, 1983.Danis, F.: Ph. Thesis, Bordeaux 1990, cited by Forst and Caralp, 1991.Forst, W. and Caralp, F.: J. Chem. Soc. Faraday Trans., 87, 2307, 1991.
www.atmos-chem-phys.net/8/4141/2008/ Atmos. Chem. Phys., 8, 4141–4496, 2008

4364 R. Atkinson et al.: Evaluated kinetic and photochemical data for atmospheric chemistry
IV.A2.159
CCl3 + O2 + M → CCl3O2 + M
1H ◦ = -92 kJ·mol−1
Low-pressure rate coefficients
Rate coefficient data
k0/cm3 molecule−1 s−1 Temp./K Reference Technique/Comments
Absolute Rate Coefficients(5.8± 0.6)× 10−31 [He] 295 Ryan and Plumb, 1984 DF-MS (a)(1.6± 0.3)× 10−30 (T /298)−6.3[N2] 233-333 Danis et al., 1991 PLP-MS/UVA (b)(6.5± 0.2)× 10−31 (T /300)−6.1[N2] 298-333 Fenter et al., 1993 PLP-MS/UVA (c)(2.7± 0.2)× 10−31 (T /300)−8.7[He] 286-332 Nottingham et al., 1994 F-MS (d)(1.1± 0.3)× 10−30 (T /300)−6.3[N2] 260-346 Luther et al., 2001 PLP-UVA (e)(4.2± 0.7)× 10−31 (T /298)−6.9[He]
Comments
(a) Microwave discharge flow-quadrupole MS study. CCl3 radicals generated by the reaction F + CHCl3 → CCl3 + HF.Falloff curve studied between 2.3 and 7 mbar of He and extrapolated withFc = 0.25.
(b) Laser photolysis of CCl4 with MS detection at lower and UV absorption detection at higher pressures. Measurementsbetween 1 and 16 mbar as well as at 930 mbar of N2. Evaluation withFc = exp(-T /255), i.e.,Fc = 0.31 at 300 K, andk∞= 3.2× 10⁻¹² cm3 molecule−1 s−1 at 298 K.
(c) Photolysis of CCl3Br at 248 nm with detection of CCl3 by MS or UV absorption at 215 nm. Measurements at 1.3–16mbar (MS detection) and 27–930 mbar (UV absorption detection). Falloff curve represented withFc = 0.6 andk∞ = 2.6× 10⁻¹² exp(T /300)−1.1 cm3 molecule−1 s−1.
(d) Flow tube using dissociative electron attachment for radical production and MS for radical detection. Pressures of Hebelow 4 mbar. Measurements evaluated withFc = 0.33 andk∞ = 2.74× 10⁻¹² cm3 molecule−1 s−1 at 286 K.
(e) Photolysis of CCl3Br at 248 nm and detection of CCl3 at 223.5 nm. Measurements at 200, 300, and 346 K over thepressure range 2–900 bar in He and N2. Data represented withFc(N2) = 0.35 (T /300)−0.35 and k∞ = 5.2× 10⁻¹²
(T /300)−1.4 cm3 molecule−1 s−1.
Preferred Values
k0 = 1.1× 10⁻³⁰ (T /300)−6.2[N2] cm3 molecule−1 s−1 over the temperature range 230-350 K.
Reliability
1 log k0 =± 0.2 at 298 K.1 n =± 1.
Comments on Preferred Values
The preferred values are the average of the data from Danis et al. (1991) and Fenter et al. (1993) which are consistent with thefalloff extrapolation from Luther et al. (2001). As the experiments were conducted to sufficiently low pressures, the differentFc-values used are of no relevance for the determination ofk0.
Atmos. Chem. Phys., 8, 4141–4496, 2008 www.atmos-chem-phys.net/8/4141/2008/

R. Atkinson et al.: Evaluated kinetic and photochemical data for atmospheric chemistry 4365
High-pressure rate coefficients
Rate coefficient data
k∞/cm3 molecule−1 s−1 Temp./K Reference Technique/Comments
Absolute Rate Coefficients5.1× 10−12 300 Cooper et al., 1980 PR-UVA (a)2.5× 10⁻¹² 295 Ryan and Plumb, 1984 DF-MS (b)(3.2± 0.7)× 10−12 (T /298)−1.2 233-333 Danis et al., 1991 PLP-MS/UVA (c)(2.5± 0.2)× 10−12 (T /298)−1.1 298-333 Fenter et al., 1993 PLP-MS/UVA (d)(5.2± 0.2)× 10−12 (T /300)−1.4 260-346 Luther et al., 2001 PLP-UVA (e)
Comments
(a) Pulse radiolysis of CCl4 at 930 mbar of He. CCl3O2 radicals detected by UV absorption.
(b) See comment (a) fork0.
(c) See comment (b) fork0.
(d) See comment (c) fork0.
(e) See comment (d) fork0.
Preferred Values
k∞ = 5.2× 10⁻¹² (T /300)−1.4 cm3 molecule−1 s−1 over the temperature range 260-350 K.
Reliability
1 log k∞ =± 0.3 at 298 K.1 n =± 1.5.
Comments on Preferred Values
The combined data by Danis et al. (1991), Fenter et al. (1993) and Luther et al. (2001) at 300 K are well represented bya falloff curve withFc = 0.35. Since the falloff curve has been measured up to very high pressures, the derived values fromLuther et al. (2001) fork∞ are preferred. The small temperature dependence ofFc employed by Luther et al. (2001) may beneglected.
References
Cooper, R., Cumming, J. B., Gordon, S. and Mulac, W. A.: Rad. Phys. Chem., 16, 169, 1980.Danis, F., Caralp, F., Rayez, M. T. and Lesclaux, R.: J. Phys. Chem., 95, 7300, 1991.Fenter, F. F., Lightfoot, P. D., Niiranen, J. T. and Gutman, D.: J. Phys. Chem., 97, 5313, 1993.Luther, K., Oum, K. and Troe, J.: J. Phys. Chem. A, 105, 5535, 2001.Nottingham, W. C., Rudolph, R. N., Andrews, K. P., Moore, J. H. and Tossell, J. A.: Int. J. Chem. Kinet., 26, 749, 1994.Ryan, K. R. and Plumb, I. C.: Int. J. Chem. Kinet., 16, 59, 1984.
www.atmos-chem-phys.net/8/4141/2008/ Atmos. Chem. Phys., 8, 4141–4496, 2008
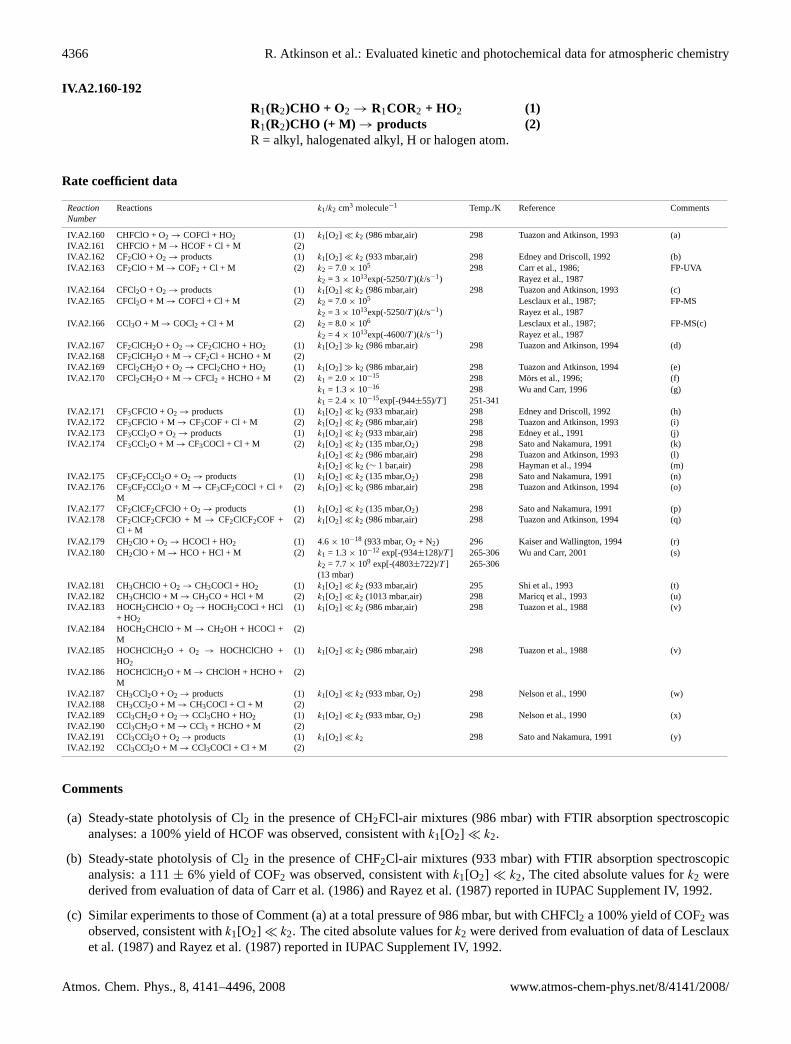
4366 R. Atkinson et al.: Evaluated kinetic and photochemical data for atmospheric chemistry
IV.A2.160-192
R1(R2)CHO + O2→ R1COR2 + HO2 (1)R1(R2)CHO (+ M) → products (2)R = alkyl, halogenated alkyl, H or halogen atom.
Rate coefficient data
Reaction Reactions k1/k2 cm3 molecule−1 Temp./K Reference CommentsNumber
IV.A2.160 CHFClO + O2→ COFCl + HO2 (1) k1[O2] � k2 (986 mbar,air) 298 Tuazon and Atkinson, 1993 (a)IV.A2.161 CHFClO + M→ HCOF + Cl + M (2)IV.A2.162 CF2ClO + O2→ products (1) k1[O2] � k2 (933 mbar,air) 298 Edney and Driscoll, 1992 (b)IV.A2.163 CF2ClO + M→ COF2 + Cl + M (2) k2 = 7.0× 10⁵ 298 Carr et al., 1986; FP-UVA
k2 = 3× 10¹³exp(-5250/T )(k/s−1) Rayez et al., 1987IV.A2.164 CFCl2O + O2→ products (1) k1[O2] � k2 (986 mbar,air) 298 Tuazon and Atkinson, 1993 (c)IV.A2.165 CFCl2O + M→ COFCl + Cl + M (2) k2 = 7.0× 10⁵ Lesclaux et al., 1987; FP-MS
k2 = 3× 10¹³exp(-5250/T )(k/s−1) Rayez et al., 1987IV.A2.166 CCl3O + M→ COCl2 + Cl + M (2) k2 = 8.0× 10⁶ Lesclaux et al., 1987; FP-MS(c)
k2 = 4× 10¹³exp(-4600/T )(k/s−1) Rayez et al., 1987IV.A2.167 CF2ClCH2O + O2→ CF2ClCHO + HO2 (1) k1[O2] � k2 (986 mbar,air) 298 Tuazon and Atkinson, 1994 (d)IV.A2.168 CF2ClCH2O + M→ CF2Cl + HCHO + M (2)IV.A2.169 CFCl2CH2O + O2→ CFCl2CHO + HO2 (1) k1[O2] � k2 (986 mbar,air) 298 Tuazon and Atkinson, 1994 (e)IV.A2.170 CFCl2CH2O + M→ CFCl2 + HCHO + M (2) k1 = 2.0× 10⁻¹⁵ 298 Mors et al., 1996; (f)
k1 = 1.3× 10⁻¹⁶ 298 Wu and Carr, 1996 (g)k1 = 2.4× 10⁻¹⁵exp[-(944±55)/T ] 251-341
IV.A2.171 CF3CFClO + O2→ products (1) k1[O2] � k2 (933 mbar,air) 298 Edney and Driscoll, 1992 (h)IV.A2.172 CF3CFClO + M→ CF3COF + Cl + M (2) k1[O2] � k2 (986 mbar,air) 298 Tuazon and Atkinson, 1993 (i)IV.A2.173 CF3CCl2O + O2→ products (1) k1[O2] � k2 (933 mbar,air) 298 Edney et al., 1991 (j)IV.A2.174 CF3CCl2O + M→ CF3COCl + Cl + M (2) k1[O2] � k2 (135 mbar,O2) 298 Sato and Nakamura, 1991 (k)
k1[O2] � k2 (986 mbar,air) 298 Tuazon and Atkinson, 1993 (l)k1[O2] � k2 (∼ 1 bar,air) 298 Hayman et al., 1994 (m)
IV.A2.175 CF3CF2CCl2O + O2→ products (1) k1[O2] � k2 (135 mbar,O2) 298 Sato and Nakamura, 1991 (n)IV.A2.176 CF3CF2CCl2O + M→ CF3CF2COCl + Cl +
M(2) k1[O2] � k2 (986 mbar,air) 298 Tuazon and Atkinson, 1994 (o)
IV.A2.177 CF2ClCF2CFClO + O2→ products (1) k1[O2] � k2 (135 mbar,O2) 298 Sato and Nakamura, 1991 (p)IV.A2.178 CF2ClCF2CFClO + M→ CF2ClCF2COF +
Cl + M(2) k1[O2] � k2 (986 mbar,air) 298 Tuazon and Atkinson, 1994 (q)
IV.A2.179 CH2ClO + O2→ HCOCl + HO2 (1) 4.6× 10⁻¹⁸ (933 mbar, O2 + N2) 296 Kaiser and Wallington, 1994 (r)IV.A2.180 CH2ClO + M→ HCO + HCl + M (2) k1 = 1.3× 10⁻¹² exp[-(934±128)/T ] 265-306 Wu and Carr, 2001 (s)
k2 = 7.7× 10⁹ exp[-(4803±722)/T ] 265-306(13 mbar)
IV.A2.181 CH3CHClO + O2→ CH3COCl + HO2 (1) k1[O2] � k2 (933 mbar,air) 295 Shi et al., 1993 (t)IV.A2.182 CH3CHClO + M→ CH3CO + HCl + M (2) k1[O2] � k2 (1013 mbar,air) 298 Maricq et al., 1993 (u)IV.A2.183 HOCH2CHClO + O2→ HOCH2COCl + HCl
+ HO2
(1) k1[O2] � k2 (986 mbar,air) 298 Tuazon et al., 1988 (v)
IV.A2.184 HOCH2CHClO + M→ CH2OH + HCOCl +M
(2)
IV.A2.185 HOCHClCH2O + O2 → HOCHClCHO +HO2
(1) k1[O2] � k2 (986 mbar,air) 298 Tuazon et al., 1988 (v)
IV.A2.186 HOCHClCH2O + M→ CHClOH + HCHO +M
(2)
IV.A2.187 CH3CCl2O + O2→ products (1) k1[O2] � k2 (933 mbar, O2) 298 Nelson et al., 1990 (w)IV.A2.188 CH3CCl2O + M→ CH3COCl + Cl + M (2)IV.A2.189 CCl3CH2O + O2→ CCl3CHO + HO2 (1) k1[O2] � k2 (933 mbar, O2) 298 Nelson et al., 1990 (x)IV.A2.190 CCl3CH2O + M→ CCl3 + HCHO + M (2)IV.A2.191 CCl3CCl2O + O2→ products (1) k1[O2] � k2 298 Sato and Nakamura, 1991 (y)IV.A2.192 CCl3CCl2O + M→ CCl3COCl + Cl + M (2)
Comments
(a) Steady-state photolysis of Cl2 in the presence of CH2FCl-air mixtures (986 mbar) with FTIR absorption spectroscopicanalyses: a 100% yield of HCOF was observed, consistent withk1[O2] � k2.
(b) Steady-state photolysis of Cl2 in the presence of CHF2Cl-air mixtures (933 mbar) with FTIR absorption spectroscopicanalysis: a 111± 6% yield of COF2 was observed, consistent withk1[O2] � k2, The cited absolute values fork2 werederived from evaluation of data of Carr et al. (1986) and Rayez et al. (1987) reported in IUPAC Supplement IV, 1992.
(c) Similar experiments to those of Comment (a) at a total pressure of 986 mbar, but with CHFCl2 a 100% yield of COF2 wasobserved, consistent withk1[O2]� k2. The cited absolute values fork2 were derived from evaluation of data of Lesclauxet al. (1987) and Rayez et al. (1987) reported in IUPAC Supplement IV, 1992.
Atmos. Chem. Phys., 8, 4141–4496, 2008 www.atmos-chem-phys.net/8/4141/2008/

R. Atkinson et al.: Evaluated kinetic and photochemical data for atmospheric chemistry 4367
(d) Steady-state photolysis of Cl2 in the presence of CH3CF2Cl-air mixtures (986 mbar) with FTIR absorption spectroscopicanalyses: an∼ 100% yield of CF2ClCHO was observed, consistent withk1[O2] � k2.
(e) Steady-state photolysis of Cl2 in the presence of CH3CFCl2-air mixtures (986 mbar) with FTIR absorption spectroscopicanalysis: an∼ 100% yield of CFCl2CHO was observed, consistent withk1[O2] � k2. Experiments on this reaction werealso carried out by Edney and Driscoll (1992) and Tuazon and Atkinson (1993).
(f) Direct time-resolved experiment using laser pulsed photolysis-laser long path absorption; CFCl2CH2O produced byCFCl2CH2O2 + NO reaction.
(g) UV flash photolysis of CFCl2CH3/N2/O2 mixtures (13–50 mbar); growth and decay of CFCl2CH2O radicals in excess O2measured by time resolved MS.
(h) Steady-state photolysis of Cl2 in the presence of CF3CHFCl-air mixtures (1 atm) with FTIR absorption spectroscopicanalyses: a 100± 4% yield of CF3C(O)F was observed, consistent withk1[O2] � k2.
(i) Steady-state photolysis of Cl2 in the presence of CF3CHFCl-air mixtures at 986 mbar total pressure with FTIR absorptionspectroscopic analyses: a 101± 1% yield of CF3C(O)F was observed, consistent withk1[O2] � k2.
(j) Steady-state photolysis of Cl2 in the presence of CF3CHCl2-air mixtures (933 mbar) with FTIR absorption spectroscopicanalyses: a∼ 100% yield of CF3C(O)Cl was observed, consistent withk1[O2] � k2.
(k) Similar experiments to those of Comment (j) at a total pressure of 133 mbar. The observed formation of CF3C(O)Cl isconsistent withk1[O2] � k2.
(l) Similar experiments to those of Comment (i) at a total pressure of 986 mbar, but with CF3CHCl2: a 98% yield ofCF3C(O)Cl was observed, consistent withk1[O2] � k2.
(m) Steady-state photolysis of Cl2 in the presence of CF3CHCl2-air mixtures (∼ 1 atm) with broad-band UV absorptionanalyses: a∼ 100% yield of CF3C(O)Cl was observed, consistent withk1[O2] � k2.
(n) Similar experiments to those of Comment (k) at a total pressure of 133 mbar. The observed formation of CF3CF2C(O)Clis consistent withk1[O2] � k2.
(o) Steady-state photolysis of Cl2 in the presence of CF3CF2CHCl2-air mixtures at 986 mbar with FTIR spectroscopic anal-yses: a 100% yield of CF3CF2C(O)Cl was observed, consistent withk1[O2] � k2.
(p) Steady-state photolysis of Cl2 in the presence of CHFClCF2CF2Cl-O2 mixtures (133 mbar) with FTIR spectroscopicanalyses: observed formation of CF2ClCF2C(O)F is consistent withk1[O2] � k2.
(q) Steady-state photolysis of Cl2 in the presence of CF2ClCF2CHFCl-air mixtures (986 mbar) with FTIR spectroscopicanalysis: a 99% yield of CF2ClCF2C(O)F was observed, consistent withk1[O2] � k2.
(r) Steady-state photolysis of Cl2 in the presence of CH3Cl-O2-N2 mixtures with FTIR absorption spectroscopic analysis ofHC(O)Cl, CO, HCl and CH2ClOOH products.k1/k2 based on yields of CO and HC(O)Cl, the latter being corrected forsecondary formation and removal. The ratiok1/k2 was found to be markedly pressure dependent over the range 12 to 933mbar, and the cited value refers to 700 Torr (933 mbar) total pressure.
(s) UV flash photolysis - time resolved MS. Pressure = 7–50 mbar; growth of HCOCl and HCl products used to determinekinetics.
(t) Steady-state photolysis of Cl2 in the presence of C2H5Cl-O2-N2 mixture with FTIR spectroscopic analysis of products:the observed high yields of HCl (157%) and CO2 (53%) were explained by reaction (2).
(u) Laser flash photolysis of Cl2 in the presence of C2H5Cl-air mixtures with infrared absorption detection of HCl. Theobserved secondary formation of HCl was explained by reaction (2).
(v) Steady-state photolysis of CH3ONO or C2H5ONO in the presence of chloroethene -NO-air mixtures, with and withoutC2H6 as an added Cl atom scavenger. FTIR spectroscopic analysis of HCHO and HCOCl products, with close to unityields of each. These products and their formation yields are consistent with the qualitative relative values ofk1[O2] andk2 shown above.
www.atmos-chem-phys.net/8/4141/2008/ Atmos. Chem. Phys., 8, 4141–4496, 2008

4368 R. Atkinson et al.: Evaluated kinetic and photochemical data for atmospheric chemistry
(w) Steady-state photolysis of CH3CCl3-O2 mixtures in the presence of Br2 or NO (to scavenge Cl atoms), with GC and IRanalyses of products. CH3COCl was the major product observed, consistent with the relative values ofk1[O2] and k2shown above.
(x) Steady-state photolysis of Cl2 in the presence of CH3CCl3-O2 mixtures with GC and IR analyses of CCl3CHO and COCl2,which are consistent with the relative values ofk1[O2] andk2 shown above.
(y) Steady-state photolysis of Cl2 in the presence of CHCl2CCl3-O2 mixtures (133 mbar) with FTIR spectroscopic analysis.The observed formation yields of CCl3COCl and COCl2 are consistent withk1[O2] � k2 .
Preferred Values
R1(R2)CHO = CH2ClO
k1/k2 = 4.6× 10⁻¹⁸ cm3 molecule−1 at 298 K.
Comments on Preferred Values
R1(R2)CHO = CH2ClO, CH3CHClO
The elimination of HCl occurs from the CH3CHClO radical (Shi et al., 1993, Maricq et al., 1993) as well as from the CH2ClOradical (Kaiser and Wallington, 1994; Wu and Carr, 2001).
R1(R2)CHO = other radicals in the above table.
For the purpose of atmospheric modeling studies it is recommended that the above qualitative information on the ratiosk1/k2 beused to decide if one or other of the alkoxy radical reaction pathways predominates or if both pathways should be considered.
References
Carr, R. W. Jr., Peterson, D. G. and Smith, F. K.: J. Phys. Chem., 90, 607, 1986.Edney, E. O. and Driscoll, D. J.: Int . J. Chem. Kinet., 24, 1067, 1992.Edney, E. O., Gay, B. W. and Driscoll, D. J.: J. Atmos., Chem., 12, 105, 1991.Hayman, G. D., Jenkin, M. E., Murrells, T. P. and Johnson, C. E.: Atmos. Environ., 28A, 421, 1994.Kaiser, E. W. and Wallington, T. J.: J. Phys. Chem., 98, 5679, 1994.Lescaux, R., Dognon, A. M. and Caralp, F.: J. Photochem. Photobiol. A: Chem., 41, 1, 1987.Maricq, M. M., Shi, J., Szente, J. J., Rimai, L. and Kaiser, E. W.: J. Phys. Chem., 97, 9686, 1993.Mors, V., Hoffmann, A., Malms, W. and Zellner, R.: Ber. Bunsenges. Phys. Chem., 100, 540, 1996.Nelson, L., Shanahan, I., Sidebottom, H. W., Treacy, J. and Nielsen, O. J.: Int. J. Chem. Kinet., 22, 577, 1990.Rayez, J. C., Rayez, M. T., Halvick, P., Duguay, B. and Lesclaux, R.: Chem. Phys., 116, 203, 1987.Sato, H. and Nakamura, T.: Nippon Kagaku Kaishi, 548, 1991.Shi, J., Wallington, T. J. and Kaiser, E. W.: J. Phys. Chem., 97, 6184, 1993.Tuazon, E. C. and Atkinson, R.: J. Atmos. Chem., 17, 179, 1993.Tuazon, E. C. and Atkinson, R.: Environ. Sci. Technol., 28, 2306, 1994.Tuazon, E. C., Atkinson, R., Aschmann, S. M., Goodman, M. A. and Winer, A. M.: Int. J. Chem. Kinet., 20, 241, 1988.Wu, F and Carr, R. W.: J. Phys. Chem. A 100, 9352, 1996.Wu, F and Carr, R. W.: J. Phys. Chem. A 105, 1423, 2001.
Atmos. Chem. Phys., 8, 4141–4496, 2008 www.atmos-chem-phys.net/8/4141/2008/

R. Atkinson et al.: Evaluated kinetic and photochemical data for atmospheric chemistry 4369
IV.A2.193-202
RO2 + NO → RO + NO2 (1)RO2 + NO + M → RONO2 + M (2)
(R= CH2Cl, CHFCl, CF2Cl, CFCl2, CCl3, CH3CFCl, CF2ClCH2, CFCl2CH2, CF3CCl2,CH2ClCH2)
Rate coefficient data (k = k1 + k2)
Reaction k/cm3 molecule−1 s−1 Temp./K Reference Technique/CommentsNumber
Absolute Rate CoefficientsIV.A2.193 R=CH2Cl
(1.87± 0.20)× 10−11 295 Sehested et al., 1993 PR-AS (a)IV.A2.194 R = CHFCl
(1.31± 0.20)× 10−11 299 Bhatnagar and Carr, 1996 FP-MS (b)IV.A2.195 R=CF2Cl
1.6× 10⁻¹¹ (T /298)−(1.5±0.4) 230-430 Dognon et al., 1985 PLP-MS (c)(1.6± 0.3)× 10−11 298(1.31± 0.12)× 10−11 295 Sehested et al., 1993 PR-AS (a)
IV.A2.196 R=CFCl2(1.6± 0.2)× 10−11 298 Lesclaux and Caralp, 1984 PLP-MS (d)1.45× 10⁻¹¹ (T /298)−(1.3±0.2) 230-430 Dognon et al., 1985 PLP-MS (c)(1.45± 0.2)× 10−11 298
IV.A2.197 R=CCl3(1.86± 0.28)× 10−11 295 Ryan and Plumb, 1984 DF-MS (e)1.7× 10⁻¹¹ (T /298)−(1.0±0.2) 230-430 Dognon et al., 1985 PLP-MS (c)(1.7± 0.2)× 10−11 298
IV.A2.198 R=CH3CFCl2.0× 10−11 (T /300)−(1.8±0.3) 263-321 Wu and Carr, 1996 FP-MS (f)1.9× 10⁻¹¹ 298
IV.A2.199 R=CF2ClCH2
(1.18± 0.10)× 10−11 295 Sehested et al., 1993 PR-AS (a)IV.A2.200 R=CFCl2CH2
(1.28± 0.11)× 10−11 295 Sehested et al., 1993 PR-AS (a)1.3× 10⁻¹¹ (T /300)−(1.5±0.2) 263-321 Wu and Carr, 1996 FP-MS (f)1.25× 10⁻¹¹ 298
IV.A2.201 R=CF3CCl2(1.5–2.0)× 10−11 298 Hayman et al., 1994 PLP-AS (g)
IV.A2.202 R=CH2ClCH2
(9.7± 1.2)× 10−12 298 Patchen et al., 2005 DF-CIMS (h)
Comments
(a) k determined from +d[NO2]/dt at a total pressure of 1 bar.
(b) Photolysis of Cl2 in the presence of CH2FCl, O2, N2 and NO at 8–33 mbar total pressure.k was obtained from theformation kinetics of NO2. k was independent of pressure in the studied range.
(c) No significant pressure dependence ink over the range 1.3–13 mbar was observed.
(d) Measurements were made at 2.7 mbar total pressure.
(e) k independent of pressure over the range 2.3–7.2 mbar.
(f) Photolysis of CH3CFCl2 in the presence of O2, N2 and NO at 11–27 mbar total pressure.k for both CH3CFClO2 andCFCl2CH2O2 were extracted simultaneously from the removal kinetics of NO and formation kinetics of CFCl2CH2O. kwas independent of pressure in the studied range.
www.atmos-chem-phys.net/8/4141/2008/ Atmos. Chem. Phys., 8, 4141–4496, 2008

4370 R. Atkinson et al.: Evaluated kinetic and photochemical data for atmospheric chemistry
(g) k derived from computer fit of transient absorption traces based on a mechanism of 9 reactions. Experiments performedat 1 bar pressure.
(h) CH2ClCH2O2 generated from the C2H4 + Cl reaction, withk determined from pseudo-first order decay CH2ClCH2O2 inthe presence of NO. Measurements made at 130 mbar pressure.
Preferred Values
R = CH2Clk = 1.9× 10⁻¹¹ cm3 molecule−1 s−1 at 298 K.1 log k =± 0.3 at 298 K.
R = CHFClk = 1.3× 10⁻¹¹ cm3 molecule−1 s−1 at 298 K.1 log k =± 0.3 at 298 K.
R = CF2Clk = 1.5× 10⁻¹¹ (T /298)−1.5 cm3 molecule−1 s−1 over the temperature range 230-430 K.1 log k =± 0.2 at 298 K.1n =±0.5.
R = CFCl2k = 1.5× 10⁻¹¹ (T /298)−1.3 cm3 molecule−1 s−1 over the temperature range 230-430 K.1 log k =± 0.2 at 298 K.1n =±0.5.
R = CCl3k = 1.8× 10⁻¹¹ (T /298)−1.0 cm3 molecule−1 s−1 over the temperature range 230-430 K.1 log k =± 0.2 at 298 K.1n =±0.5.
R = CH3CFClk = 2.0× 10⁻¹¹ (T /298)−1.8 cm3 molecule−1 s−1 over the temperature range 260-320 K.1 log k =± 0.3 at 298 K.1n =±0.5.
R = CF2ClCH2k = 1.2× 10⁻¹¹ cm3 molecule−1 s−1 at 298 K.1 log k =± 0.3 at 298 K.
R = CFCl2CH2k = 1.3× 10⁻¹¹ (T /298)−1.5 cm3 molecule−1 s−1 over the temperature range 260-320 K.1 log k =± 0.2 at 298 K.1n =±0.5.
R = CF3CCl2k = 1.8× 10⁻¹¹ cm3 molecule−1 s−1 at 298 K.1 log k =± 0.3 at 298 K.
R = CH2ClCH2k = 9.7× 10⁻¹² cm3 molecule−1 s−1 at 298 K.1 log k =± 0.3 at 298 K.
Atmos. Chem. Phys., 8, 4141–4496, 2008 www.atmos-chem-phys.net/8/4141/2008/

R. Atkinson et al.: Evaluated kinetic and photochemical data for atmospheric chemistry 4371
Comments on Preferred Values
R = CF2ClCH2, CH2ClThe preferred values are the rounded-off rate coefficients determined by Sehested et al. (1993).
R = CHFClThe preferred value is the rounded-off rate coefficient determined by Bhatnagar and Carr (1996).
R = CF2ClThe preferred values are based on the temperature dependent data of Dognon et al. (1985), adjusted to fit the average value ofk298 from the data of Sehested et al.(1993) and Dognon et al. (1985).
R = CFCl2The preferred values are based on the temperature dependent data of Dognon et al. (1985), adjusted to fit the average value ofk298 from the data of Lesclaux and Caralp (1984), and Dognon et al. (1985).
R = CH3CFClThe preferred values are based on the temperature dependent data of Wu and Carr (1996).
R = CFCl2CH2The preferred value is the rounded-off average of the rate coefficients determined by Sehested et al. (1993) and Wu and Carr(1996).
R = CF3CCl2The preferred value is the mid-point of the range of values determined by Hayman et al. (1994).
R = CH2ClCH2The preferred value is the rate coefficient determined by Patchen et al. (2005).
R = CCl3 The preferred values are based on the temperature dependent data of Dognon et al. (1985), adjusted to fit the averagevalue ofk298 from the data of Ryan and Plumb (1984) and Dognon et al. (1985).
The temperature dependence expressions are given in the form favoured by Dognon et al. (1985), and subsequently adoptedby others, which best describe the measured data. Comparison of the reported rate coefficients with those for the correspondingalkyl peroxy radicals, CH3O2 and C2H5O2, indicates that the presence of aα-halogen substituent typically enhancesk298by a factor of about 1.5–2, with the reactions also possessing a similar dependence on temperature where comparison ispossible. Although not so marked, it appears that additionalα-halogen substituents result in further slight enhancements tok298. Similarly to small alkyl peroxy radicals, the observations indicate that the reactions are dominated by the RO-formingchannel (1). Dognon et al. (1985) measured quantum yields for NO2 greater than unity for all the RO2 radicals studied;suggesting that the RO2 + NO reactions mainly form RO and NO2, with additional NO2 being produced from secondarychemistry. Nishida et al. (2004) have observed formation of a small yield 1.7± 0.3% of CF3ONO2 from the reaction ofCF3O2 with NO, confirming the existence of channel (2) at 930 mbar pressure. This suggests that the reactions of the C1and C2 halogenated RO2 radicals will generally have minor channels forming RONO2, but additional studies are required toconfirm this.
References
Bhatnagar, A. and Carr, R.W.: Chem. Phys. Lett. 258, 651, 1996.Dognon, A. M., Caralp, F. and Lesclaux, R.: J. Chim. Phys. 82, 349, 1985.Hayman, G. D., Jenkin, M. E., Murrells, T. P. and Johnson, C. E.: Atmos. Environ. 28A, 421, 1994.Lesclaux, R. and Caralp, F.: Int. J. Chem. Kinet. 16, 1117, 1984.Patchen, A. K., Pennino, M. J. and Elrod, M. J.: J. Phys. Chem. A 109, 5865, 2005.Ryan, K. R. and Plumb, I. C.: Int. J. Chem. Kinet. 16, 591, 1984.Sehested, J., Nielsen, O. J., and Wallington, T. J.: Chem. Phys. Lett. 213, 457, 1993.
www.atmos-chem-phys.net/8/4141/2008/ Atmos. Chem. Phys., 8, 4141–4496, 2008

4372 R. Atkinson et al.: Evaluated kinetic and photochemical data for atmospheric chemistry
IV.A2.203
CF2ClO2 + NO2 + M → CF2ClO2NO2 + M
1H ◦ = -107 kJ·mol−1
Low-pressure rate coefficients
Rate coefficient data
k0/cm3 molecule−1 s−1 Temp./K Reference Technique/Comments
Absolute Rate Coefficients(3.8± 1.8)× 10−29 [O2] 298 Moore and Carr, 1990 FP-MS (a)(5.0± 1.0)× 10−29 (T /298)−6.2[O2] 248-324 Wu and Carr, 1991 FP-MS (b)
Comments
(a) CF2ClO2 radicals generated by flash photolysis of CF2ClBr in the presence of O2 and detected by MS. Measurementsover the pressure range 1.3–13 mbar, extrapolated withFc = 0.6 andk∞ = 5.2× 10⁻¹² cm3 molecule−1 s−1 at 298 K.
(b) As comment (a).Fc = 0.78 exp(-T /569), i. e.,Fc (298) = 0.46, andk∞ = 4.5× 10⁻¹² (T /298)−2.5 cm3 molecule−1 s−1
used for extrapolation.
Preferred Values
k0 = 5× 10⁻²⁹ (T /298)−6.2[N2] cm3 molecule−1 s−1cm3 over the temperature range 250–320 K.
Reliability
1 log k0 =± 0.3 at 298 K.1 n =± 2.
Comments on Preferred Values
The pressure dependence in the investigated pressure range fits well to that observed at higher pressures for the reverse disso-ciation by Koppenkastrop and Zabel (1991) and the theoretical modellings by Destriau and Troe (1990) and by Caralp et al.(1988). Uncertainties of the usedFc = 0.46 at 298 K do not much influence the values of the derivedk0. Therefore the valuesfrom Wu and Carr (1991) are our preferred values, assuming equal values ofk0 for the bath gases O2 and N2.
High-pressure rate coefficients
Rate coefficient data
k∞/cm3 molecule−1 s−1 Temp./K Reference Technique/Comments
Absolute Rate Coefficients5.2× 10−12 298 Moore and Carr, 1990 (a)4.5× 10⁻¹² (T /298)−2.5 248-324 Wu and Carr, 1991 (b)
Atmos. Chem. Phys., 8, 4141–4496, 2008 www.atmos-chem-phys.net/8/4141/2008/

R. Atkinson et al.: Evaluated kinetic and photochemical data for atmospheric chemistry 4373
Comments
(a) See comment (a) fork0.
(b) See comment (b) fork0. The measurements were performed so far from the high pressure range that extrapolations wereuncertain.
Preferred Values
k∞ = 6.3× 10⁻¹² (T /298)−0.7 cm3 molecule−1 s−1 over the temperature range 250-320 K.
Reliability
1 log k∞ =± 0.3 at 298 K.1 n =± 0.5.
Comments on Preferred Values
The unusually large negative temperature coefficient ofk∞ derived by Wu and Carr (1991) signals problems with the falloffextrapolations. For this reason it appears safer to employ the falloff curves for CF2ClO2NO2 dissociation from Koppenkastropand Zabel (1991), which were studied over a ten times larger pressure range extending up to higher pressures. Doing this, thepreferred value is derived which is consistent with our preferred data for CF3O2 + NO2. As for the reverse reaction,Fc= 0.30is recommended.
References
Caralp, F., Lesclaux, R., Rayez, M.-T., Rayez, J.-C. and Forst, W.: J. Chem. Soc. Faraday Trans. 2, 84, 569, 1988.Destriau, M. and Troe, J.: Int. J. Chem. Kinet., 22, 915, 1990.Koppenkastrop, D. and Zabel, F.: Int. J. Chem. Kinet., 23, 1, 1991.Moore, S. M. and Carr, R. W.: J. Phys. Chem., 94, 1393, 1990.Wu, F. and Carr, R. W.: Int. J. Chem. Kinet., 23, 701, 1991.
www.atmos-chem-phys.net/8/4141/2008/ Atmos. Chem. Phys., 8, 4141–4496, 2008

4374 R. Atkinson et al.: Evaluated kinetic and photochemical data for atmospheric chemistry
IV.A2.204
CF2ClO2NO2 + M → CF2ClO2 + NO2 + M
1H ◦ = 107 kJ·mol−1
Low-pressure rate coefficients
Rate coefficient data
k0/s−1 Temp./K Reference Technique/Comments
Absolute Rate Coefficients1.8× 10−3 exp(-10500/T ) [N2] 273–288 Koppenkastrop and Zabel, 1991 (a)1.1× 10⁻³ exp(-10762/T ) [N2] 276-289 Xiong and Carr, 1994 (b)
Comments
(a) Thermal decomposition of CF2ClO2NO2 in a temperature-controlled (± 0.1◦C) 420 liter reaction chamber. The reac-tant was monitored in situ by long-path IR absorption. N2 pressures of 11, 82, and 800 mbar were employed. Falloffextrapolations withFc= 0.30 andk∞ = 1.6× 10¹⁶ exp(-11990/T ) s−1.
(b) Continuous-flow temperature-controlled (± 1◦C) photoreactor coupled to MS. N2 pressures of 4–53 mbar were employed.Falloff extrapolations made withFc = 0.45 andk∞ = 6.7× 10¹⁶ exp(-11871/T ) s−1.
Preferred Values
k0 = 1.8× 10⁻³ exp(-10500/T ) [N2] s−1 over the temperature range 270–290 K.
Reliability
1 log k0 =± 0.3 at 298 K.1 (E/R) =± 200 K.
Comments on Preferred Values
The measurements of Koppenkastrop and Zabel (1991) and of Xiong and Carr (1994) differ markedly in their pressure de-pendences which is reflected by large differences of the extrapolatedk∞. As the pressure dependence observed by Xiong andCarr (1994) is much larger than given by theoretical falloff curves from Destriau and Troe (1990) and Caralp et al. (1988), themeasurements by Xiong and Carr (1994) have to be in error for some unknown reason and are not considered here. Instead, theresults from Koppenkastrop and Zabel (1991), which were obtained over a ten times larger pressure range, here are preferredwith Fc = 0.30 andk∞ such as given below.
High-pressure rate coefficients
Rate coefficient data
k∞/s−1 Temp./K Reference Technique/Comments
Absolute Rate Coefficients1.6× 1016 exp(-11990/T ) 273-288 Koppenkastrop and Zabel, 1991 (a)6.7× 10¹⁶ exp(-11871/T ) 276-289 Xiong and Carr, 1994 (b)
Atmos. Chem. Phys., 8, 4141–4496, 2008 www.atmos-chem-phys.net/8/4141/2008/

R. Atkinson et al.: Evaluated kinetic and photochemical data for atmospheric chemistry 4375
Comments
(a) See comment (a) fork0.
(b) See comment (b) fork0. The given value fork∞ actually stems from a combination of recombination data, equilibriumconstants and theoretical modelling. It is consistent with the observed pressure dependence.
Preferred Values
k∞ = 1.6× 10¹⁶ exp(-11990/T ) s−1 over the temperature range 270-290 K.
Reliability
1 log k∞ =± 0.3 at 298 K.1 (E/R) =± 200 K.
Comments on Preferred Values
See Comments on Preferred Values ofk0.
References
Caralp, F., Lesclaux, R., Rayez, M.-T., Rayez, J.-C. and Forst, W.: J. Chem. Soc. Faraday Trans. 2, 84, 569, 1988.Destriau, M. and Troe, J.: Int. J. Chem. Kinet., 22, 915, 1990.Koppenkastrop, D. and Zabel, F.: Int. J. Chem. Kinet., 23, 1, 1991.Xiong, J. Q. and Carr, R. W.: J. Phys. Chem., 98, 9811, 1994.
www.atmos-chem-phys.net/8/4141/2008/ Atmos. Chem. Phys., 8, 4141–4496, 2008

4376 R. Atkinson et al.: Evaluated kinetic and photochemical data for atmospheric chemistry
IV.A2.205
CFCl2O2 + NO2 + M → CFCl2O2NO2 + M
1H ◦ = -107 kJ·mol−1
Low-pressure rate coefficients
Rate coefficient data
k0/cm3 molecule−1 s−1 Temp./K Reference Technique/Comments
Absolute Rate Coefficients(3.5± 0.5)× 10−29 [O2] 298 Lesclaux and Caralp, 1984 PLP-MS (a)(3.5± 0.5)× 10−29 (T /298)−4.1 [O2] 233-373 Lesclaux et al., 1986 PLP-MS (b)(5.5± 1.6)× 10−29 (T /298)−5.5 [O2] 233-373 Caralp et al., 1988 PLP-MS (c)
Comments
(a) Pulsed laser photolysis with MS detection of CFCl2O2. Pressure range 1.3–13 mbar. Falloff extrapolation withFc = 0.6andk∞ = 6.0× 10⁻¹² cm3 molecule−1 s−1.
(b) As comment (a). Falloff extrapolation withFc = 0.6 andk∞ = 5.9× 10⁻¹² (T /298)−0.72 cm3 molecule−1 s−1.
(c) As comment (a). Falloff extrapolation usingFc = exp(-T /342), i.e.Fc = 0.42 at 298 K, andk∞ = 8.3× 10⁻¹² (T /298)−0.66
cm3 molecule−1 s−1.
Preferred Values
k0 = 5.5× 10⁻²⁹ (T /298)−5.5 [N2] cm3 molecule−1 s−1 over the temperature range 230–380 K.
Reliability
1 log k0 =± 0.3 at 298 K.1 n =± 2.
Comments on Preferred Values
The data from Caralp et al. (1988) are preferred because they employ a value ofFc = 0.42. However, this value should be usedindependent of the temperature. Equal values ofk0 for the bath gases O2 and N2 are assumed.
High-pressure rate coefficients
Rate coefficient data
k∞/ cm3 molecule−1 s−1 Temp./K Reference Technique/Comments
Absolute Rate Coefficients(6.0± 1.0)× 10−12 298 Lesclaux and Caralp, 1984 (a)(5.9± 1.0)× 10−12 (T /298)−0.72 233-373 Lesclaux et al., 1986 (b)(8.3± 1.0)× 10−12 (T /298)−0.66 233-373 Caralp et al., 1988 (c)
Atmos. Chem. Phys., 8, 4141–4496, 2008 www.atmos-chem-phys.net/8/4141/2008/
R. Atkinson et al.: Evaluated kinetic and photochemical data for atmospheric chemistry 4377
Comments
(a) See comment (a) fork0.
(b) See comment (b) fork0.
(c) See comment (c) fork0.
Preferred Values
k∞ = 8.3× 10⁻¹² (T /298)−0.66 cm3 molecule−1 s−1 over the temperature range 230-380 K.
Reliability
1 log k∞ =± 0.2 at 298 K.1 n =± 0.5.
Comments on Preferred Values
See Comments on Preferred Values fork0.
References
Caralp, F., Lesclaux, R., Rayez, M.-T., Rayez, J.-C. and Forst, W.: J. Chem. Soc. Faraday Trans. 2, 84, 569, 1988.Lesclaux, R. and Caralp, F.: Int. J. Chem. Kinet., 16, 1117, 1984.Lesclaux, R., Caralp, F. and Dognon, A. M.: Geophys. Res. Lett., 13, 933, 1986.
www.atmos-chem-phys.net/8/4141/2008/ Atmos. Chem. Phys., 8, 4141–4496, 2008

4378 R. Atkinson et al.: Evaluated kinetic and photochemical data for atmospheric chemistry
IV.A2.206
CFCl2O2NO2 + M → CFCl2O2 + NO2 + M
1H ◦ = 107 kJ·mol−1
Low-pressure rate coefficients
Rate coefficient data
k0/s−1 Temp./K Reference Technique/Comments
Absolute Rate Coefficients1.0× 10−2 exp(-10860/T ) [N2] 260-300 Koppenkastrop and Zabel, 1991 (a)
Comments
(a) Reaction studied in a temperature-controlled 420 liter reaction chamber, monitoring the reactant by long-path IR absorp-tion. Measurements at 11, 82, and 800 mbar pressure. Falloff extrapolations usingFc = 0.28 andk∞ = 6.6× 10¹⁶
exp(-12240/T ) s−1.
Preferred Values
k0 = 1.0× 10⁻² exp(-10860/T ) [N2] s−1 over the temperature range 260–300 K.
Reliability
1 log k0 =± 0.3 at 298 K.1 (E/R) =± 200 K.
Comments on Preferred Values
The only available measurements are preferred with the employedFc = 0.28. The data are consistent with related reactions.
High-pressure rate coefficients
Rate coefficient data
k∞/s−1 Temp./K Reference Technique/Comments
Absolute Rate Coefficients4.0× 1016 exp(-12300/T ) 274-305 Simonaitis et al., 1979 (a)6.0× 10¹⁶ exp(-12240/T ) 260-300 Koppenkastrop and Zabel, 1991 (b)
Comments
(a) Steady-state photolysis of Cl2-CHFCl2-O2-NO-NO2 mixtures at 1 bar. Simulation of the mechanism depending on theextent of various Cl-consuming reactions.k was assumed to be close tok∞.
(b) See comment (a) fork0.
Atmos. Chem. Phys., 8, 4141–4496, 2008 www.atmos-chem-phys.net/8/4141/2008/

R. Atkinson et al.: Evaluated kinetic and photochemical data for atmospheric chemistry 4379
Preferred Values
k∞ = 6.6× 10¹⁶ exp(-12240/T ) s−1 over the temperature range 260-300 K.
Reliability
1 log k∞ =± 0.3 at 298 K.1 (E/R) =± 500 K.
Comments on Preferred Values
The agreement between the results from Simonatis et al. (1979) and Koppenkastrop and Zabel (1991) at 298 K and 1 barwithin a factor of 1.5 appears satisfactory. The data from Koppenkastrop and Zabel (1991) are preferred.
References
Koppenkastrop, D. and Zabel, F.: Int. J. Chem. Kinet., 23, 1, 1991.Simonaitis, R., Glavas, S. and Heicklen, J.: Geophys. Res. Lett., 6, 385, 1979.
www.atmos-chem-phys.net/8/4141/2008/ Atmos. Chem. Phys., 8, 4141–4496, 2008

4380 R. Atkinson et al.: Evaluated kinetic and photochemical data for atmospheric chemistry
IV.A2.207
CCl3O2 + NO2 + M → CCl3O2NO2 + M
1H ◦ = -105.6 kJ·mol−1
Low-pressure rate coefficients
Rate coefficient data
k0/ cm3 molecule−1 s−1 Temp./K Reference Technique/Comments
Absolute Rate Coefficients(9.2± 3)× 10−29 (T /298)−6.0 [O2] 233-373 Caralp et al., 1988 PLP-MS (a)
Comments
(a) Pulsed laser photolysis-MS study at pressures of 1.3–13 mbar. Falloff extrapolation withFc = exp(-T /260), i.e.Fc = 0.32at 298 K andk∞ = 1.49× 10⁻¹² (T /298)−0.3 cm3 molecule−1 s−1.
Preferred Values
k0 = 9.2× 10⁻²⁹ (T /298)−6.0 [N2] cm3 molecule−1 s−1 over the temperature range 230–380 K.
Reliability
1 log k0 =± 0.3 at 298 K.1 n =± 2.
Comments on Preferred Values
There is a single experimental study only. However, according to the analysis by Destriau and Troe (1990) it falls in line withrelated reactions. Equal values fork0 are assumed for the bath gases O2 and N2. TheFc value should be used independent ofthe temperature.
High-pressure rate coefficients
Rate coefficient data
k∞/ cm3 molecule−1 s−1 Temp./K Reference Technique/Comments
Absolute Rate Coefficients(1.49± 0.8)× 10−12 (T /298)−0.3 233-373 Caralp et al., 1988 PLP-MS (a)
Comments
(a) See comment (a) fork0.
Preferred Values
k∞ = 1.5× 10⁻¹² (T /298)−0.7 cm3 molecule−1 s−1 over the temperature range 230-380 K.
Atmos. Chem. Phys., 8, 4141–4496, 2008 www.atmos-chem-phys.net/8/4141/2008/

R. Atkinson et al.: Evaluated kinetic and photochemical data for atmospheric chemistry 4381
Reliability
1 log k∞ =± 0.3 at 298 K.1 n =± 0.5
Comments on Preferred Values
See Comments on Preferred Values fork0. Recommending a temperature-independentFc = 0.32 is consistent with changingnfrom−0.3 to−0.7 such as preferred for related reactions.
References
Caralp, F., Lesclaux, R., Rayez, M.-T., Rayez, J.-C. and Forst, W.: J. Chem. Soc. Faraday Trans. 2, 84, 569, 1988.Destriau, M. and Troe, J.: Int. J. Chem. Kinet., 22, 915, 1990.
www.atmos-chem-phys.net/8/4141/2008/ Atmos. Chem. Phys., 8, 4141–4496, 2008

4382 R. Atkinson et al.: Evaluated kinetic and photochemical data for atmospheric chemistry
IV.A2.208
CCl3O2NO2 + M → CCl3O2 + NO2 + M
1H ◦ = 105.6 kJ·mol−1
Low-pressure rate coefficients
Rate coefficient data
k0/s−1 Temp./K Reference Technique/Comments
Absolute Rate Coefficients6.3× 10−3 exp(-10235/T ) [N2] 260-300 Koppenkastrop and Zabel, 1991 (a)
Comments
(a) Thermal decomposition of CCl3O2NO2 studied in a temperature-controlled 410 liter reaction chamber. The reactant wasmonitored by in situ long-path IR absorption. Pressures of N2 of 11, 82, and 800 mbar were employed. The data wereextrapolated withFc = 0.22 andk∞ = 4.8× 10¹⁶ exp(-11820/T ) s−1.
Preferred Values
k0 = 4.3× 10⁻³ exp(-10235/T ) [N2] s−1 over the temperature range 260–300 K.
Reliability
1 log k0 =± 0.3 at 298 K.1 (E/R) =± 500 K.
Comments on Preferred Values
There is a single study of the falloff curve only. However, it is consistent with data for the reverse reaction from Caralp et al.(1988). Some readjustment will be necessary to makeFc identical for the forward and reverse reaction, for whichFc = 0.32was chosen. IfFc = 0.32 replacesFc = 0.22,k0 for the dissociation decreases by about a factor of 0.7 such as preferred here.
High-pressure rate coefficients
Rate coefficient data
k∞/s−1 Temp./K Reference Technique/Comments
Absolute Rate Coefficients1.42× 1016 exp(-11500/T ) 274-305 Simonaitis et al., 1979 (a)0.24 2986.6× 1016 exp(-12240/T ) 260-300 Koppenkastrop and Zabel, 1991 (b)0.29 298
Atmos. Chem. Phys., 8, 4141–4496, 2008 www.atmos-chem-phys.net/8/4141/2008/

R. Atkinson et al.: Evaluated kinetic and photochemical data for atmospheric chemistry 4383
Comments
(a) Steady-state photolysis of Cl2-CHCl3-O2-N2-NO-NO2 mixtures at 1 bar. Product formation monitored by IR spec-troscopy. Some assumption about the mechanism had to be made. The reaction was assumed to be at the high pressurelimit.
(b) See comment (a) fork0.
Preferred Values
k∞ = 4.8× 10¹⁶ exp(-11820/T ) s−1 over the temperature range 260-300 K.
Reliability
1 log k∞ =± 0.3 at 298 K.1 (E/R) =± 500 K.
Comments on Preferred Values
The two available measurements are in close agreement such thatk∞ appears well established. For the falloff curve seeComments on Preferred Values fork0.
References
Koppenkastrop, D. and Zabel, F.: Int. J. Chem. Kinet., 23, 1, 1991.Simonaitis, R., Glavas, S. and Heicklen, J.: Geophys. Res. Lett., 6, 385, 1979.
www.atmos-chem-phys.net/8/4141/2008/ Atmos. Chem. Phys., 8, 4141–4496, 2008

4384 R. Atkinson et al.: Evaluated kinetic and photochemical data for atmospheric chemistry
IV.A2.209
C2H5O2 + CF3CCl2O2 → CH3CHO + CF3CCl2OH + O2 (1)→ C2H5O + CF3CCl2O + O2 (2)
Rate coefficient data (k= k1 + k2)
k/cm3 molecule−1 s−1 Temp./K Reference Technique/Comments
Absolute Rate Coefficientsk1 = (3.6± 0.5)× 10−12 298 Hayman et al., 1994 PLP-UVA (a)k2 = (9+9
−5) × 10−13 298
Comments
(a) Laser flash photolysis-UV absorption study of CF3CCl3-C2H6-O2-N2 mixtures. Kinetic data were obtained by analyzingtwo sets of transient decays on the basis of a mechanism consisting of 13 reactions.
Preferred Values
k1 = 3.6× 10⁻¹² cm3 molecule−1 s−1 at 298 K.k2 = 9× 10⁻¹³ cm3 molecule−1 s−1 at 298 K.
Reliability
1 log k1 =± 0.3 at 298 K.1 log k2 =± 0.5 at 298 K.
Comments on Preferred Values
While the above values of the rate coefficients appear reasonable, they have been derived from the analysis of a complexchemical system and require independent verification to reduce the recommended error limits.
References
Hayman, G. D., Jenkin, M. E., Murrells, T. P. and Johnson, C. E.: Atmos. Environ., 28A, 421, 1994.
Atmos. Chem. Phys., 8, 4141–4496, 2008 www.atmos-chem-phys.net/8/4141/2008/

R. Atkinson et al.: Evaluated kinetic and photochemical data for atmospheric chemistry 4385
IV.A2.210
CF2ClCH2O2 + CF2ClCH2O2 → CF2ClCH2OH + CF2ClCHO + O2 (1)→ CF2ClCH2O + CF2ClCH2O + O2 (2)
Rate coefficient data (k= k1 + k2)
k/cm3 molecule−1 s−1 Temp./K Reference Technique/Comments
Absolute Rate Coefficientskobs = (4.13± 0.58)× 10−12 298 Wallington and Nielsen, 1991 FP-UVA (a,b)
Branching Ratiosk2/k ≈ 1.0 298 Tuazon and Atkinson, 1994 UV-P-FTIR (c)
Comments
(a) kobs is based on the measured overall second-order decay of CF2ClCH2O2, defined by -d[CF2ClCH2O2]/dt = 2kobs
[CF2ClCH2O2]2. As described in detail by Lesclaux (1997), HO2 radicals formed from the subsequent chemistry ofCF2ClCH2O (formed from channel (2)) are expected to lead to secondary removal of CF2ClCH2O2. The true value ofkis expected to fall in the rangekobs/(1+ α) < k < kobs whereα = k2/k.
(b) Pulse radiolysis study of CF2ClCH3-O2-SF6 mixtures over the pressure range 150–1000 mbar. CF2ClCH2O2 radicalswere monitored by UV absorption withσ250nm = (3.38± 0.68)× 10−18 cm2 molecule−1 .
(c) Photolysis of Cl2 in the presence of CF2ClCH3-air mixtures at 987 mbar pressure. In situ monitoring of reactants andproducts by FTIR spectroscopy was consistent with formation of CF2ClCHO with a yield ca. 100%, once correctionswere made for secondary removal.
Preferred Values
k1 = 2.8× 10⁻¹² cm3 molecule−1 s−1 at 298 K.k2/k = 1.0 at 298 K.
Reliability
1 log k1 =± 0.4 at 298 K.1 (k2/k) = +0.0
−0.2 at 298 K.
Comments on Preferred Values
The observed formation of CF2ClCHO in ca. 100% yield from CF2ClCH3 oxidation in the product study of Tuazon andAtkinson (1994) is consistent with the reaction proceeding predominantly via the radical forming channel (2), followed byreaction of CF2ClCH2O with O2 to form CF2ClCHO and HO2. This also indicates that secondary removal of CF2ClCH2O2by reaction with HO2 must generate CF2ClCHO as the major carbon-containing product, in a similar fashion to the observeddominant formation of HC(O)Cl from the reaction of HO2 with CH2ClO2 (Wallington et al., 1996).
The preferred value ofk at 298 K is derived from thekobs value reported by Wallington and Nielsen (1991). Similar to aprocedure adopted by Lesclaux (1997) for peroxy radicals for which the self reaction rate coefficients are≥ ca. 2× 10⁻¹² cm3
molecule−1 s−1, k is estimated to bekobs/(1 + 0.5(k2/k)), with this approximation assuming that the secondary reaction of HO2with CF2ClCH2O2 competes equally with its removal via HO2 + HO2. The reliability range reflects thatk has been derived bythis approximate procedure. Confirmatory kinetics and product studies are required.
www.atmos-chem-phys.net/8/4141/2008/ Atmos. Chem. Phys., 8, 4141–4496, 2008

4386 R. Atkinson et al.: Evaluated kinetic and photochemical data for atmospheric chemistry
References
Lesclaux, R.: Combination of peroxyl radicals in the gas phase. In ’Peroxyl Radicals’, edited by Alfassi, Z. B.. John Wileyand Sons, 1997.Tuazon, E. C. and Atkinson, R.: Environ. Sci. Technol., 28, 2306, 1994.Wallington, T. J. and Nielsen, O. J.: Int. J. Chem. Kinet., 23, 785, 1991.Wallington, T. J., Hurley, M. D. and Schneider, W. F.: Chem. Phys. Lett., 251, 164, 1996.
Atmos. Chem. Phys., 8, 4141–4496, 2008 www.atmos-chem-phys.net/8/4141/2008/

R. Atkinson et al.: Evaluated kinetic and photochemical data for atmospheric chemistry 4387
IV.A2.211
CFCl2CH2O2 + CFCl2CH2O2 → CFCl2CH2OH + CFCl2CHO + O2 (1)→ CFCl2CH2O + CFCl2CH2O + O2 (2)
Rate coefficient data (k= k1 + k2)
k/cm3 molecule−1 s−1 Temp./K Reference Technique/Comments
Absolute Rate Coefficientskobs = (4.36± 0.64)× 10−12 298 Wallington and Nielsen, 1991 PR-UVA (a,b)
Branching Ratiosk2/k ≈ 1.0 298 Tuazon and Atkinson, 1994 UV-P-FTIR (c)
Comments
(a) kobs is based on the measured overall second-order decay of CFCl2CH2O2, defined by -d[CFCl2CH2O2]/dt = 2kobs
[CFCl2CH2O2]2. As described in detail by Lesclaux (1997), HO2 radicals formed from the subsequent chemistry ofCFCl2CH2O (formed from channel (2)) are expected to lead to secondary removal of CFCl2CH2O2. The true value ofkis expected to fall in the rangekobs/(1+ α) < k < kobs whereα = k2/k.
(b) Pulse radiolysis study of CFCl2CH3-O2-SF6 mixtures over the pressure range 152–1013 mbar. CFCl2CH2O2 radicalswere monitored by UV absorption withσ250nm = (3.38± 0.68)× 10−18 cm2 molecule−1 .
(c) Photolysis of Cl2 in the presence of CFCl2CH3-air mixtures at 987 mbar pressure. In situ monitoring of reactants andproducts by FTIR spectroscopy was consistent with formation of CFCl2CHO with a yield ca. 100%, once correctionswere made for secondary removal.
Preferred Values
k1 = 2.9× 10⁻¹² cm3 molecule−1 s−1 at 298 K.k2/k = 1.0 at 298 K.
Reliability
1 log k1 =± 0.4 at 298 K.1 (k2/k) = +0.0
−0.2 at 298 K.
Comments on Preferred Values
The observed formation of CFCl2CHO in ca. 100% yield from CFCl2CH3 oxidation in the product study of Tuazon andAtkinson (1994) is consistent with the reaction proceeding predominantly via the radical forming channel (2), followed byreaction of CFCl2CH2O with O2 to form CFCl2CHO and HO2. This also indicates that secondary removal of CFCl2CH2O2by reaction with HO2 must generate CFCl2CHO as the major carbon-containing product, in a similar fashion to the observeddominant formation of HCOCl from the reaction of HO2 with CH2ClO2 (Wallington et al., 1996).
The preferred value ofk at 298 K is derived from thekobs value reported by Wallington and Nielsen (1991). Similar to aprocedure adopted by Lesclaux (1997) for peroxy radicals for which the self reaction rate coefficients are≥ ca. 2× 10⁻¹² cm3
molecule−1 s−1, k is estimated to bekobs/(1 + 0.5(k2/k)), with this approximation assuming that the secondary reaction of HO2with CFCl2CH2O2 competes equally with its removal via HO2 + HO2. The reliability range reflects thatk has been derived bythis approximate procedure. Confirmatory kinetics and product studies are required.
www.atmos-chem-phys.net/8/4141/2008/ Atmos. Chem. Phys., 8, 4141–4496, 2008

4388 R. Atkinson et al.: Evaluated kinetic and photochemical data for atmospheric chemistry
References
Lesclaux, R.: Combination of peroxyl radicals in the gas phase. In ’Peroxyl Radicals’, edited by Alfassi, Z. B., John Wileyand Sons, 1997.Tuazon, E. C. and Atkinson, R.: Environ. Sci. Technol., 28, 2306, 1994.Wallington, T. J. and Nielsen, O. J.: Int. J. Chem. Kinet., 23, 785, 1991.Wallington, T. J., Hurley, M. D. and Schneider, W. F.: Chem. Phys. Lett., 251, 164, 1996.
Atmos. Chem. Phys., 8, 4141–4496, 2008 www.atmos-chem-phys.net/8/4141/2008/

R. Atkinson et al.: Evaluated kinetic and photochemical data for atmospheric chemistry 4389
IV.A2.212
CF3CCl2O2 + CF3CCl2O2→ CF3CCl2O + CF3CCl2O + O2
Rate coefficient data
k/cm3 molecule−1 s−1 Temp./K Reference Technique/Comments
Absolute Rate Coefficientskobs = (3.33± 0.53)× 10−12 295 Wallington et al., 1994 PR-UVA (a,b)(3.6± 0.5)× 10−12 298 Hayman et al., 1994 LP-UVA (c)
Comments
(a) kobs is based on the measured overall second-order decay of CF3CCl2O2, defined by -d[CF3CCl2O2]/dt =2kobs[CF3CCl2O2]2.
(b) Pulse radiolysis study of CF3CHCl2-O2-SF6 mixtures over the pressure range of 1013 mbar. CF3CCl2O2 radicals weremonitored by UV absorption withσ250nm = (1.70± 0.26)× 10−18 cm2 molecule−1. The derived value ofk was deter-mined from the measured overall second-order decay of CF3CCl2O2 radicals.
(c) CF3CCl2O2 radicals were generated by 193 nm laser flash photolysis of CF3CCl3-CH3OH-O2-N2 mixtures and CF3CCl3-C2H6-O2-N2 mixtures at a total pressure of 1013 mbar. CF3CCl2O2 radicals were monitored by UV absorption in therange 230–270nm, withσ250nm = (1.79± 0.18)× 10−18 cm3 molecule−1. k determined from global simulation of twosets of transient decays observed at 230, 240, 250, 260 and 270 nm using a 15 reaction mechanism. Rate coefficients forthe reactions CF3CCl2O2 with HO2 and C2H5O2 were determined simultaneously.
Preferred Values
k = 3.5× 10⁻¹² cm3 molecule−1 s−1 at 298 K.
Reliability
1 log k =± 0.3 at 298 K.
Comments on Preferred Values
The reported formation of CF3C(O)Cl with approximately 100% yield from CF3CHCl2 oxidation in a number of product stud-ies (Edney et al., 1991; Tuazon and Atkinson, 1993; Hayman et al., 1994) has established that the self-reaction of CF3CCl2O2proceeds essentially exclusively via formation of CF3CCl2O radicals, which decompose by elimination of Cl. This is alsosupported by the UV spectral study of CF3CCl2O2 by Jemi-Alade et al. (1991), involving flash photolysis-UV absorption ofCl2 in the presence of CF3CHCl2 and O2. In that study, no decay in the absorption due to CF2CCl2O2 was observed over a 40ms time scale, demonstrating near-quantitative regeneration of Cl atoms, and therefore CF3CCl2O2, in the system.
The kinetics studies of Wallington et al. (1994) and Hayman et al. (1994) reported UV absorption spectra for CF3CCl2O2which are in excellent agreement in both shape and magnitude with that reported by Jemi-Alade et al. (1991). The values ofk
reported by Wallington et al. (1994) and Hayman et al. (1994) are also in close agreement, even though only the methodologyof Hayman et al. (1994) was designed to preclude the regeneration of CF3CCl2O2, and to extract the true value ofk. It is notedthat Wallington et al. (1994) made use of concentrations of CF3CCl2O2 radicals which were an order of magnitude higherthan those in the experiments of Hayman et al. (1994) (and Jemi-Alade et al. (1991)), such that other secondary reactions ofCF3CCl2O and/or Cl might partially preclude regeneration of CF3CCl2O2, or lead to secondary removal of CF3CCl2O2. Theagreement with the study of Hayman et al. (1994) is therefore likely to be fortuitous. The preferred value at 298 K is basedon the rate coefficient reported by Hayman et al. (1994), with the reliability range reflecting the requirement to simulate acomparatively complex system to extractk. Further kinetics studies are required to allowk to be defined more accurately.
www.atmos-chem-phys.net/8/4141/2008/ Atmos. Chem. Phys., 8, 4141–4496, 2008

4390 R. Atkinson et al.: Evaluated kinetic and photochemical data for atmospheric chemistry
References
Edney, E. O., Gay, Jr., B. W. and Driscoll, D. J.: J. Atmos. Chem., 12, 105, 1991.Hayman, G. D., Jenkin, M. E., Murrells, T. P. and Johnson, C. E.: Atmos. Environ., 28A, 421, 1994.Jemi-Alade, A. A., Lightfoot, P. D. and Lesclaux, R.: Chem. Phys. Lett., 179, 119, 1991.Tuazon, E. C. and Atkinson, R.: J. Atmos. Chem., 17, 179, 1993.Wallington, T. J., Ellermann, T. and Nielsen, O. J.: Res. Chem. Intermed., 20, 265, 1994.
Atmos. Chem. Phys., 8, 4141–4496, 2008 www.atmos-chem-phys.net/8/4141/2008/

R. Atkinson et al.: Evaluated kinetic and photochemical data for atmospheric chemistry 4391
IV.A2.213
CH2ClO2 + CH2ClO2 → CH2ClOH + HC(O)Cl + O 2 (1)→ 2CH2ClO + O2 (2)
Rate coefficient data (k= k1 + k2)
k/cm3 molecule−1 s−1 Temp./K Reference Technique/Comments
Absolute Rate Coefficientskobs = 3.1× 10⁻¹³ exp[(735± 95)/T ] 228-380 Dagaut et al., 1988 FP-UVA (a,b)kobs = (3.78± 0.45)× 10−12 2891.95× 10−13 exp[(874± 26)/T ] 251-600 Catoire et al., 1994 FP-UVA (c)(4.2± 0.4)× 10−12 298(3.3± 0.7)× 10−12 298 Biggs et al., 1999 DF-LIF/RF (d)
Branching Ratiosk2/k ≈ 1.0 305 Sanhueza and Heicklen, 1975 UVP-IR (e)k2/k ≈ 1.0 298 Niki et al., 1980 UVP-FTIR (f)
Comments
(a) kobs is based on the measured overall second-order decay of CH2ClO2, defined by -d[CH2ClO2]/dt = 2kobs[CH2ClO2]2.As described in detail by Lesclaux (1997), HO2 radicals formed from the subsequent chemistry of CH2ClO (formed fromchannel (2)) are expected to lead to secondary removal of CH2ClO2. The true value ofk is expected to fall in the rangekobs/(1 + α) < k < kobs, whereα = k2/k.
(b) Flash photolysis of Cl2 in the presence of CH3Cl-O2-N2 mixtures at total pressures of 33–533 mbar at 298 K and of 133mbar (N2) from 228–380 K. Peroxy radical concentrations were monitored by UV absorption withσ250nm = (3.14± 0.45)× 10−18 cm2 molecule−1.
(c) Flash photolysis of Cl2 in the presence of CH3Cl-O2-N2 mixtures at a total pressure of 1000 mbar. Peroxy radicalconcentrations were monitored by UV absorption in the wavelength range 205 to 290 nm, withσ250nm = (3.40± 0.20)×10−18 cm2 molecule−1 in the temperature range 251 to 393 K (decreasing at higher temperatures). Values ofkobs/σ250nm
are in excellent agreement with those of Dagaut et al. (1988) over the common temperature range. Observed decays intransient absorption were found to be distorted from second order kinetics at wavelengths< 250 nm where HO2 absorbssignificantly, allowingk and the rate coefficient for the reaction of HO2 with CH2ClO2 to be extracted via an iterativeprocedure.
(d) Experiments performed at pressures in the range 1.3 to 4 mbar. CH2ClO2 radicals were produced by the F + CH3Clreaction, with subsequent addition of O2. CH2ClO2 radicals were monitored by titration to NO2 following reaction withexcess NO, with LIF detection of NO2. HO2 radicals generated from the subsequent chemistry of CH2ClO (formedfrom channel (2)) were also titrated to NO2 under the experimental conditions, but were independently measured throughdetection of simultaneously formed HO, by RF.k values were extracted by numerical simulation of the results, using an8 reaction scheme.
(e) Photolysis of Cl2 in the presence of CH3Cl-O2 mixtures. In situ monitoring of products by IR showed exclusive formationof HCl and HC(O)Cl as the initial products.
(f) Photolysis of Cl2 in the presence of CH3Cl-air mixtures. In situ monitoring of reactants and products by FTIR spec-troscopy showed 90-95% conversion of CH3Cl to HC(O)Cl. Tentative observation of CH2ClOOH at yields up to ca.10%, and H2O2, is indicative of the occurrence of partial reaction of HO2 with CH2ClO2 in competition with the HO2self reaction.
www.atmos-chem-phys.net/8/4141/2008/ Atmos. Chem. Phys., 8, 4141–4496, 2008

4392 R. Atkinson et al.: Evaluated kinetic and photochemical data for atmospheric chemistry
Preferred Values
k = 3.5× 10⁻¹² cm3 molecule−1 s−1 at 298 K.k = 1.9× 10⁻¹³ exp(870/T ) cm3 molecule−1 s−1 over the temperature range 250-600 K.k2/k = 1.0 at 298 K.
Reliability
1 log k =± 0.2 at 298 K.1 (E/R) =± 200 K.1 (k2/k) = +0.0
−0.1 at 298 K.
Comments on Preferred Values
The results of the product studies (Sanhueza and Heicklen, 1975; Niki et al., 1980) are consistent with the radical-formingchannel (2) being essentially exclusive for the self-reaction of CH2ClO2 radicals.
The preferred value ofk at 298 K is the average of the results of Catoire et al. (1994) (based on their Arrhenius expression)and Biggs et al. (1999), which allowed extraction ofk from full appraisal of the reaction mechanism. The preferred Arrheniusexpression fork is based on theE/R value from the comprehensive temperature dependence study of Catoire et al. (1994),combined with a pre-exponential factor adjusted to give the preferred value ofk at 298 K. As noted above, the earlierkobs
data of Dagaut et al. (1988) are also in excellent agreement with those of Catoire et al. (1994) when both sets of data areanalyzed by a simple second-order treatment from results derived atλ= 250 nm, and are therefore also consistent with thisrecommendation.
References
Biggs, P., Canosa-Mas, C. E., Percival, C. J., Shallcross, D. E. and Wayne, R. P.: Int. J. Chem. Kinet. 31, 433, 1999.Catoire, V., Lesclaux, R., Lightfoot, P. D. and Rayez, M.-T.: J. Phys. Chem. 98, 2889, 1994.Dagaut, P., Wallington, T. J. and Kurylo, M. J.: Int. J. Chem. Kinet. 20, 815, 1988.Lesclaux, R.: Combination of peroxyl radicals in the gas phase. In ’Peroxyl Radicals’, edited by Alfassi, Z. B., John Wileyand Sons, 1997.Niki, H., Maker, P. D., Savage, C. M. and Breitenbach, L. P.: Int. J. Chem. Kinet. 12, 1001, 1980.Sanhueza, E. and Heicklen, J.: J. Phys. Chem. 79, 7, 1975.
Atmos. Chem. Phys., 8, 4141–4496, 2008 www.atmos-chem-phys.net/8/4141/2008/

R. Atkinson et al.: Evaluated kinetic and photochemical data for atmospheric chemistry 4393
IV.A2.214
CHCl2O2 + CHCl2O2 → CHCl2OH + C(O)Cl2 + O2 (1)→ CHCl2O + CHCl2O + O2 (2)
Rate coefficient data (k = k1 + k2)
k/cm3 molecule−1 s−1 Temp./K Reference Technique/Comments
Absolute Rate Coefficients(1-10)× 10−12 300 Catoire et al., 1996 FP-UVA (a)(7.0± 1.8)× 10−12 298 Biggs et al., 1999 DF-LIF (b)
Branching Ratiosk2/k ≥ 0.85 305 Sanhueza and Heicklen, 1975 UVP-IR (c)k2/k ≥ 0.88 298 Niki et al., 1980 UVP-FTIR (d)k2/k ≥ 0.85 298 Catoire et al., 1996 UVP-FTIR (e)k2/k ≥ 0.9 250-325 Catoire et al., 1996 FP-UVA (f)
Comments
(a) Flash photolysis of CHCl3 in the presence of CH3OH-O2-N2 mixtures at a total pressure of 1000 mbar. Decays in transientabsorption signals (with contributions from CHCl2O2 and HO2) were recorded in the wavelength range 220 nm to 250nm. Approximate value ofk derived in conjunction with determination of the rate coefficient for the reaction of CHCl2O2with HO2, using a five reaction mechanism. Authors indicate that best fits were obtained using values ofk close to thosemeasured for the self reactions of CH2ClO2 and CCl3O2 (which are almost identical) in the same laboratory (Catoireet al., 1994; 1996), and recommend thatk is the average these determinations: 2.6× 10⁻¹³ exp[(800± 60)/T ] cm3
molecule−1 s−1 over the temperature range 273 K to 460 K, withk= (3.8± 1.4)× 10−12 cm3 molecule−1 s−1 at 298 K.
(b) Experiments performed at pressures in the range 1.3 to 4 mbar. CHCl2O2 radicals were produced by the F + CH2Cl2reaction, with subsequent addition of O2. CHCl2O2 radicals were monitored indirectly by titration to NO2 followingreaction with excess NO, with LIF detection of NO2. ClO radicals generated by the secondary chemistry were alsotitrated to NO2 under the experimental conditions.k values were extracted by numerical simulation of the results, usingan 11 reaction scheme to take account possible of secondary reactions.
(c) Photolysis of Cl2 in the presence of CH2Cl2-O2-N2 mixtures. In situ monitoring of products by IR showed formation ofHC(O)Cl as the dominant product as part of an efficient chain mechanism. C(O)Cl2 was observed as a minor product.Listed quantum yield based on the reported quantum yield of 5.9 for HC(O)Cl formation.
(d) Photolysis of Cl2 in the presence of CH2Cl2-O2-N2 mixtures. In situ monitoring of products by FTIR spectroscopyshowed formation of HC(O)Cl as the dominant product as part of an efficient chain mechanism. C(O)Cl2 was observedas a minor product. Listed quantum yield based on the reported quantum yield of 7.5 for HC(O)Cl formation.
(e) Photolysis of Cl2 or F2 in the presence of CH2Cl2-O2-N2 mixtures. In situ monitoring of products by FTIR spectroscopyshowed formation of HC(O)Cl and C(O)Cl2 with yields of ca. 85% and 5% respectively. No other primary products weredetected.
(f) Flash photolysis of Cl2 in the presence of CH2Cl2-O2-N2 mixtures over the temperature range 250 K to 325 K demon-strated efficient chain regeneration of CHCl2O2 in the system.
Preferred Values
k2/k = 1.0 at 298 K.
www.atmos-chem-phys.net/8/4141/2008/ Atmos. Chem. Phys., 8, 4141–4496, 2008

4394 R. Atkinson et al.: Evaluated kinetic and photochemical data for atmospheric chemistry
Reliability
1 (k2/k) = +0.0−0.15 at 298 K.
Comments on Preferred Values
The reported dominant chain formation of HC(O)Cl from CH2Cl2 oxidation in a number of product studies (Sanhueza andHeicklen, 1975; Niki et al., 1980; Catoire et al., 1996) has established that the self-reaction of CHCl2O2 proceeds almostexclusively via formation of CHCl2O radicals (channel (2)), which decompose by elimination of Cl. This is also supportedby the failure to detect CHCl2OH in all the product studies, which would otherwise provide evidence for channel (1). Theefficient chain regeneration of CHCl2O2 radicals observed in the Cl2-CH2Cl2-O2-N2 flash photolysis experiments of Catoireet al. (1996) is also consistent with the dominance of channel (2) over a wide temperature range.
The reported determinations ofk (Catoire et al., 1996; Biggs et al., 1999) are subject to substantial uncertainties, owing tothe complexity of the secondary chemistry. Catoire et al. (1996) report only a broad range fork at 300K, based on simulationsof a complex system in which competitive removal of CHCl2O2 by reaction with HO2 was occurring (see note (a) above).The discharge flow determination of Biggs et al. (1999) was complicated by indirect detection of CHCl2O2 (which also hadcontributions from ClO), and possible secondary chain removal of CHCl2O2 via reactions with Cl and ClO. Consequently, nofirm recommendation fork is currently possible, and further kinetics studies are required.
References
Biggs, P., Canosa-Mas, C. E., Percival, C. J., Shallcross, D. E. and Wayne, R. P.: Int. J. Chem. Kinet. 31, 433, 1999.Catoire, V., Lesclaux, R., Lightfoot, P. D. and Rayez, M.-T.: J. Phys. Chem. 98, 2889, 1994.Catoire, V., Lesclaux, R., Schneider, W. F. and Wallington, T. J.: J. Phys. Chem. 100, 14356 1996.Niki, H., Maker, P. D., Savage, C. M. and Breitenbach, L. P.: Int. J. Chem. Kinet. 12, 1001, 1980.Sanhueza, E. and Heicklen, J.: J. Phys. Chem. 79, 7, 1975.
Atmos. Chem. Phys., 8, 4141–4496, 2008 www.atmos-chem-phys.net/8/4141/2008/
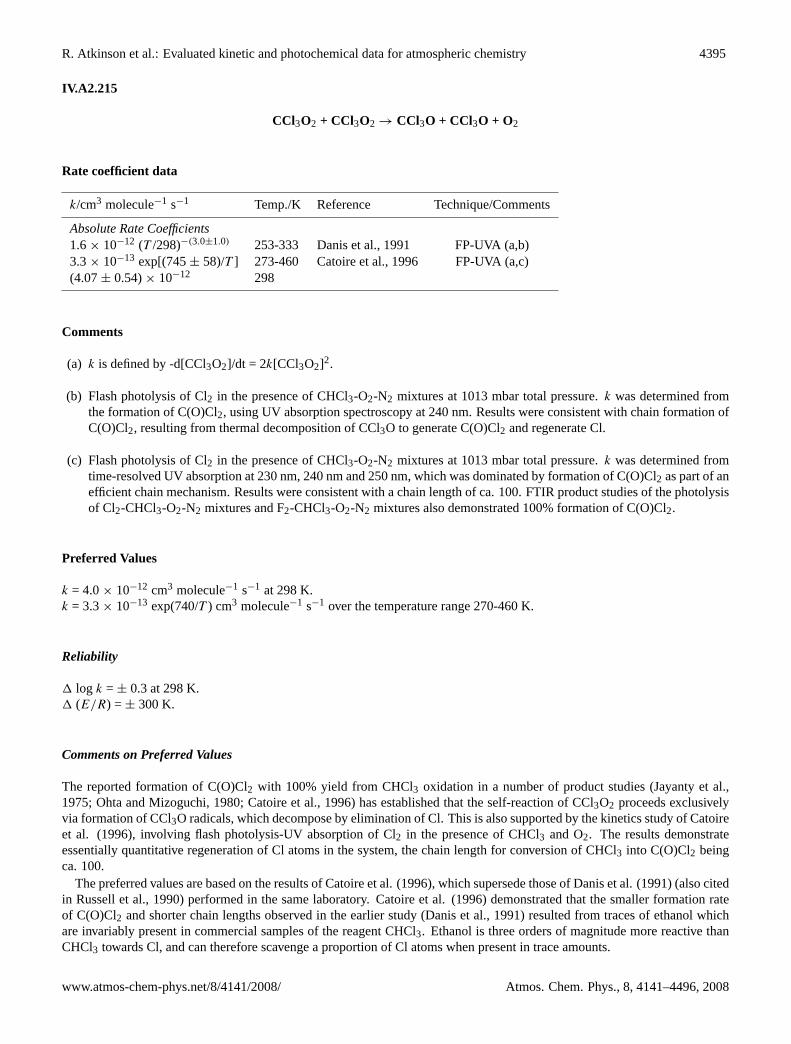
R. Atkinson et al.: Evaluated kinetic and photochemical data for atmospheric chemistry 4395
IV.A2.215
CCl3O2 + CCl3O2→ CCl3O + CCl3O + O2
Rate coefficient data
k/cm3 molecule−1 s−1 Temp./K Reference Technique/Comments
Absolute Rate Coefficients1.6× 10−12 (T /298)−(3.0±1.0) 253-333 Danis et al., 1991 FP-UVA (a,b)3.3× 10⁻¹³ exp[(745± 58)/T ] 273-460 Catoire et al., 1996 FP-UVA (a,c)(4.07± 0.54)× 10−12 298
Comments
(a) k is defined by -d[CCl3O2]/dt = 2k[CCl3O2]2.
(b) Flash photolysis of Cl2 in the presence of CHCl3-O2-N2 mixtures at 1013 mbar total pressure.k was determined fromthe formation of C(O)Cl2, using UV absorption spectroscopy at 240 nm. Results were consistent with chain formation ofC(O)Cl2, resulting from thermal decomposition of CCl3O to generate C(O)Cl2 and regenerate Cl.
(c) Flash photolysis of Cl2 in the presence of CHCl3-O2-N2 mixtures at 1013 mbar total pressure.k was determined fromtime-resolved UV absorption at 230 nm, 240 nm and 250 nm, which was dominated by formation of C(O)Cl2 as part of anefficient chain mechanism. Results were consistent with a chain length of ca. 100. FTIR product studies of the photolysisof Cl2-CHCl3-O2-N2 mixtures and F2-CHCl3-O2-N2 mixtures also demonstrated 100% formation of C(O)Cl2.
Preferred Values
k = 4.0× 10⁻¹² cm3 molecule−1 s−1 at 298 K.k = 3.3× 10⁻¹³ exp(740/T ) cm3 molecule−1 s−1 over the temperature range 270-460 K.
Reliability
1 log k =± 0.3 at 298 K.1 (E/R) =± 300 K.
Comments on Preferred Values
The reported formation of C(O)Cl2 with 100% yield from CHCl3 oxidation in a number of product studies (Jayanty et al.,1975; Ohta and Mizoguchi, 1980; Catoire et al., 1996) has established that the self-reaction of CCl3O2 proceeds exclusivelyvia formation of CCl3O radicals, which decompose by elimination of Cl. This is also supported by the kinetics study of Catoireet al. (1996), involving flash photolysis-UV absorption of Cl2 in the presence of CHCl3 and O2. The results demonstrateessentially quantitative regeneration of Cl atoms in the system, the chain length for conversion of CHCl3 into C(O)Cl2 beingca. 100.
The preferred values are based on the results of Catoire et al. (1996), which supersede those of Danis et al. (1991) (also citedin Russell et al., 1990) performed in the same laboratory. Catoire et al. (1996) demonstrated that the smaller formation rateof C(O)Cl2 and shorter chain lengths observed in the earlier study (Danis et al., 1991) resulted from traces of ethanol whichare invariably present in commercial samples of the reagent CHCl3. Ethanol is three orders of magnitude more reactive thanCHCl3 towards Cl, and can therefore scavenge a proportion of Cl atoms when present in trace amounts.
www.atmos-chem-phys.net/8/4141/2008/ Atmos. Chem. Phys., 8, 4141–4496, 2008

4396 R. Atkinson et al.: Evaluated kinetic and photochemical data for atmospheric chemistry
References
Catoire, V., Lesclaux, R., Schneider, W. F. and Wallington, T. J.: J. Phys. Chem., 100, 14356, 1996.Danis, F., Caralp, F., Rayez, M.-T. and Lesclaux, R.: J. Phys. Chem., 97, 7300, 1991.Jayanty, R. K. M., Simonaitis, R. and Heicklen, J.: J. Photochem., 4, 203, 1975.Ohta, T. and Mizoguchi, I.: Int. J. Chem. Kinet., 12, 717, 1980.Russell, J. J., Seetula, J. A., Gutman, D., Danis, F., Caralp, F., Lightfoot, P. D., Lesclaux, R., Melius, C. F. and Senkan, S. M.:J. Phys. Chem., 94, 3277, 1990.
Atmos. Chem. Phys., 8, 4141–4496, 2008 www.atmos-chem-phys.net/8/4141/2008/

R. Atkinson et al.: Evaluated kinetic and photochemical data for atmospheric chemistry 4397
IV.A2.216
CH3CHClO2 + CH3CHClO2 → CH3CHClOH + CH 3COCl + O2 (1)→ 2CH3CHClO + O2 (2)
Rate coefficient data (k= k1 + k2)
k/cm3 molecule−1 s−1 Temp./K Reference Technique/Comments
Absolute Rate Coefficients(5.2± 1.3)× 10−12 295 Maricq et al., 1993 (a,b)
Branching Ratiosk2/k = 0.95± 0.05 295 Maricq et al., 1993 (b)
Comments
(a) k is defined by -d[CH3CHClO2]/dt = 2k[CH3CHClO2]2.
(b) Pulsed photolysis of Cl2 in the presence of C2H5Cl-O2-N2 mixtures with time-resolved IR spectral photography andtransient diode laser absorption measurements. The above rate coefficient and branching ratio were obtained from thetime-dependence and magnitude of the secondary HCl rise, by computer simulations involving a mechanism of 24 reac-tions.
Preferred Values
k2 = 5× 10⁻¹² cm3 molecule−1 s−1 at 298 K.k2/k = 0.95 at 298 K.
Reliability
1 log k2 =± 0.3 at 298 K.1 (k2/k) =± 0.05 at 298 K.
Comments on Preferred Values
While the data of Maricq et al. (1993) for the room temperature rate coefficient seem reasonable in relation to the values ofother related halogen-containing peroxy radicals, they have been obtained from very indirect measurements. Confirmation byindependent measurements is required to lower the recommended error limits.
References
Maricq, M. M., Shi, J., Szente, J. J., Rimai, L. and Kaiser, E. W.: J. Phys. Chem. 97, 9686, 1993.
www.atmos-chem-phys.net/8/4141/2008/ Atmos. Chem. Phys., 8, 4141–4496, 2008

4398 R. Atkinson et al.: Evaluated kinetic and photochemical data for atmospheric chemistry
IV.A2.217
CH2ClCH2O2 + CH2ClCH2O2 → CH2ClCH2OH + CH2ClCHO + O2 (1)→ CH2ClCH2O + CH2ClCH2O + O2 (2)
Rate coefficient data (k= k1 + k2)
k/cm3 molecule−1 s−1 Temp./K Reference Technique/Comments
Absolute Rate Coefficientskobs = 1.1× 10⁻¹³ exp[(1020± 170)/T ] 228-380 Dagaut et al., 1988 FP-UVA (a,b)kobs = (3.57± 0.57)× 10−12 298kobs = (6.0± 0.8)× 10−12 295 Maricq et al., 1993 FP-UVA (a,c)kobs = 4.0× 10⁻¹⁴ exp[(1376± 60)/T ] 253-345 Chakir et al., 2003 MM-UVA (a,d)kobs = (4.5± 0.4)× 10−14
Branching Ratiosk1/k = 0.31 295 Wallington et al., 1990 UV-P-FTIR (e)k2/k = 0.69k1/k = 0.43 296 Yarwood et al., 1992 UV-P-FTIR (e)k2/k = 0.57
Comments
(a) kobs is based on the measured overall second-order decay of CH2ClCH2O2, defined by -d[CH2ClCH2O2]/dt =2kobs[CH2ClCH2O2]2. As described in detail by Lesclaux (1997), HO2 radicals formed from the subsequent chemistry ofCH2ClCH2O (formed from channel (2)) are expected to lead to secondary removal of CH2ClCH2O2. The true value ofkis expected to fall in the rangekobs/(1 + α) < k < kobs, whereα = k2/k.
(b) Flash photolysis of Cl2 in the presence of C2H4-O2-N2 mixtures over the pressure range 33–533 mbar. CH2ClCH2O2concentrations measured by UV absorption spectroscopy usingσ250nm = (3.64± 0.39)× 10−18 cm2 molecule−1.
(c) Pulsed photolysis of Cl2 in the presence of C2H4-O2-N2 mixtures at 1013 mbar pressure. Kinetics determined from time-resolved UV absorption spectra of CH2ClCH2O2 and HO2. The values ofσ (CH2ClCH2O2) obtained are ca. 13% greaterthan those reported by Dagaut et al. (1988).
(d) Modulated photolysis of Cl2 in the presence of C2H4-O2-N2 mixtures over the pressure range 67–267 mbar.kobs de-termined from analysis of modulated absorption waveforms in the wavelength range 215–270nm. The UV absorptionspectrum of CH2ClCH2O2 characterized simultaneously, agrees well with that of Dagaut et al. (1988) atλ ≥ 240 nm,with σ250nm = (3.56± 0.20)× 10−18 cm2 molecule−1. At shorter wavelengths, cross sections are up to 20% greater.
(e) Steady-state photolysis of Cl2-C2H4-O2-N2 mixtures at total pressures of 933 mbar with FTIR spectroscopic monitoringof the removal of C2H4 and the formation of CH2ClCHO, CH2ClCH2OOH, and CH2ClCH2OH. The listed branchingratios were derived from the yields of CH2ClCH2OH and CH2ClCHO relative to the decay of C2H4.
Preferred Values
k = 3.3× 10⁻¹² cm3 molecule−1 s−1 at 298 K.k = 4.2× 10⁻¹⁴ exp(1300/T ) cm3 molecule−1 s−1 over the temperature range 220-380 K.k1/k = 0.37 at 298 K.k2/k = 0.63 at 298 K.
Atmos. Chem. Phys., 8, 4141–4496, 2008 www.atmos-chem-phys.net/8/4141/2008/

R. Atkinson et al.: Evaluated kinetic and photochemical data for atmospheric chemistry 4399
Reliability
1 log k =± 0.3 at 298 K.1 (E/R) =± 500 K.1 (k1/k) = 1 (k2/k) =± 0.1 at 298 K.
Comments on Preferred Values
The studies of Wallington et al. (1990) and Yarwood et al. (1992) provide reasonably consistent determinations ofk2/k and thepreferred value at 298 K is the average of these determinations. Chakir et al. (2003) also used steady state concentrations ofHO2 and CH2ClCH2O2, inferred from their modulated photolysis study, to draw conclusions about the temperature dependenceof the branching ratio for HO2 formation,k2/k. Using the 298 K values of Wallington et al. (1990) and Yarwood et al. (1992)as a reference, they estimated thatk2/k varies from ca. 0.3 at 253 K to ca. 0.7–0.9 at 345 K.k2/k is expected to tend to unity asT increases.
The preferred values ofk were calculated from the reported values ofkobs andk2/k using a methodology similar to thatemployed by Lesclaux (1997) for peroxy radicals with self reaction rate coefficients≥ ca. 2× 10⁻¹² cm3 molecule−1 s−1 atroom temperature.k is estimated to bekobs/(1 + 0.5(k2/k)), with this approximation assuming that the secondary reaction ofHO2 with CH2ClCH2O2 competes equally with its removal via HO2 + HO2. The preferred values are based on the temperaturedependence kinetics results of Dagaut et al. (1988) and Chakir et al. (2003), and the preferred value ofk2/k at 298 K, with theassumption thatk2/k increases to≈ 1 at the high end of the studied temperature range, 380 K. The 298 K value ofkobs reportedby Maricq et al. (1993) is ca. 50% greater than the average of the values of Dagaut et al. (1988) and Chakir et al. (2003), butis encompassed by the uncertainty range in the preferred value. The discrepancy is not fully resolved, but is partially explainedby the greater absorption cross-sections for CH2ClCH2O2 reported by Maricq et al. (1993).
References
Chakir, A., Brion, J., Ganne, J. P. and Daumont, D.: Phys. Chem. Chem. Phys. 5, 2573, 2003.Dagaut, P., Wallington, T. J. and Kurylo, M. J.: Chem. Phys. Lett. 146, 589, 1988.Lesclaux, R.: Combination of peroxyl radicals in the gas phase. In ’Peroxyl Radicals’, edited by Alfassi, Z.B., John Wiley andSons, 1997.Maricq, M. M., Shi, J., Szente, J. J., Rimai, L. and Kaiser, E. W.: J. Phys. Chem. 97, 9686, 1993.Wallington, T. J., Andino, J. M. and Japar, S. M.: Chem. Phys. Lett. 165, 189, 1990.Yarwood, G., Peng, N. and Niki, H.: Int. J. Chem. Kinet. 24, 369, 1992.
www.atmos-chem-phys.net/8/4141/2008/ Atmos. Chem. Phys., 8, 4141–4496, 2008

4400 R. Atkinson et al.: Evaluated kinetic and photochemical data for atmospheric chemistry
IV.A2.218
O3 + C2HCl3→ products
Rate coefficient data
k/cm3 molecule−1 s−1 Temp./K Reference Technique/Comments
Absolute Rate Coefficients< 3× 10⁻²⁰ 296 Atkinson et al., 1982 S-CL
Preferred Values
k < 5× 10⁻²⁰ cm3 molecule−1 s−1 at 298 K.
Comments on Preferred Values
The upper limit to the preferred value is taken from the data of Atkinson et al. (1982), with the upper limit being increased bya factor of∼2 to take into account additional uncertainties in the study of Atkinson et al. (1982). This upper limit is consistentwith the reported data for the reactions of O3 with the chloroethenes (Atkinson and Carter, 1984), which show that Cl atomsubstitution markedly decreases the rate coefficients at room temperature, relative to that for ethene.
References
Atkinson, R. and Carter, W. P. L.: Chem. Rev., 84, 437, 1984.Atkinson, R., Aschmann, S. M., Fitz, D. R., Winer, A. M. and Pitts, J. N. Jr.: Int. J. Chem. Kinet., 14, 13, 1982.
Atmos. Chem. Phys., 8, 4141–4496, 2008 www.atmos-chem-phys.net/8/4141/2008/

R. Atkinson et al.: Evaluated kinetic and photochemical data for atmospheric chemistry 4401
IV.A2.219
O3 + C2Cl4→ products
Rate coefficient data
k/cm3 molecule−1 s−1 Temp./K Reference Technique/Comments
Absolute Rate Coefficients< 2× 10⁻²³ 297 Mathias et al., 1974 (a)
(a) From experiments carried out at initial O3 and tetrachloroethene concentrations of≥ 1017 molecule cm−3 in the presenceof excess O2, using an assumed mechanism and monitoring the formation rate of C(O)Cl2. From the data given in Mathiaset al. (1974), a more conservative upper limit ofk < 8 × 10⁻²³ cm3 molecule−1 s−1 can be derived by assuming thatonly one C(O)Cl2 molecule is formed per tetrachloroethene reacted.
Preferred Values
k < 10−21 cm3 molecule−1 s−1 at 298 K.
Comments on Preferred Values
The upper limit to the preferred value is derived from the very limited amount of data reported by Mathias et al. (1974), withthe upper limit to the rate coefficient being increased by a factor of 50 over that reported. This upper limit to the rate coefficientfor tetrachloroethene is consistent with the kinetic data for the other chloroethenes (Atkinson and Carter, 1984), which showthat Cl atom substitution markedly decreases the reactivity of the chloroethenes towards O3, compared to that for ethene.
References
Atkinson, R. and Carter, W. P. L.: Chem. Rev., 84, 437, 1984.Mathias, E., Sanhueza, E., Hisatsune, I. C. and Heicklen, J.: Can. J. Chem., 52, 3852, 1974.
www.atmos-chem-phys.net/8/4141/2008/ Atmos. Chem. Phys., 8, 4141–4496, 2008

4402 R. Atkinson et al.: Evaluated kinetic and photochemical data for atmospheric chemistry
IV.A2.220
CH3Cl + hν→ products
Primary photochemical processes
Reaction 1H ◦/kJ.mol−1 λ threshold/nm
CH3Cl + hν→ CH3 + Cl 349 343
Preferred Values
Absorption cross-sections for CH3Cl at 295 K and 210 K
λ/nm 1020 σ /cm2 λ/nm 1020σ /cm2 1020σ /cm2
295 Ka 295 K 210 K
174 111 198 2.66 2.43176 93.8 200 1.76 1.51178 76.6 202 1.13 0.93180 60.7 204 0.750 0.573182 46.7 206 0.483 0.345184 35.0 208 0.318 0.212186 25.5 210 0.206 0.130188 18.2 212 0.132 0.080190 12.7 214 0.086 0.047192 8.72 216 0.055 0.027194 5.88196 4.01
a No temperature dependence atλ <198 nm.
Comments on Preferred Values
The preferred values of the absorption cross-sections at 295 K and at 210 K are those reported by Simon et al. (1988). Thislatter publication reports the results of the most comprehensive study of the temperature dependence. These values are in verygood agreement with the room temperature values reported by Robbins (1976) and are in reasonable agreement with the resultsof Hubrich et al. (1977) who also made low temperature measurements. In the wavelength region 180–216 nm, photolysisoccurs with unit quantum efficiency by breaking of the C-Cl bond to yield CH3 + Cl. Photochemistry at shorter wavelengths isdiscussed by Shold and Rebbert (1978). A H-atom product channel has now been observed using product translational energystudies (Amaral et al., 2001).
References
Amaral, G., Xu, K. and Zhang, J.: J. Phys. Chem. A 105, 1115, 2001.Hubrich, C., Zetzsch, C. and Stuhl, F.: Ber. Bunsenges. Phys. Chem. 81, 437, 1977.Robbins, D. E.: Geophys. Res. Lett. 3, 213, 1976; erratum op. cit. 3, 757, 1976.Shold, D. M. and Rebbert, R. E.: J. Photochem. 9, 499, 1978.Simon, P. C., Gillotay, D., Vanlaethem-Meuree, N. and Wisemberg, J.: J. Atmos. Chem. 7, 107, 1988.
Atmos. Chem. Phys., 8, 4141–4496, 2008 www.atmos-chem-phys.net/8/4141/2008/

R. Atkinson et al.: Evaluated kinetic and photochemical data for atmospheric chemistry 4403
IV.A2.221
CH3OCl + hν→ products
Primary photochemical processes
Reaction 1H ◦/kJ.mol−1 λ threshold/nm
CH3OCl + hν → CH3O + Cl (1) 202.9 589→ CH3 + ClO (2) 312.4 383→ CH2OCl + H (3) 417.4 287
Absorption cross-sections for CH3Cl at 295 K and 210 K
Wavelength/nm Reference Comments
200-460 Crowley et al., 1994 (a)230-394 Jungkamp et al., 1995 (b)
Quantum yield data (φ = φ1 + φ2)
Measurement Wavelength region/nm Reference Comments
φ1 = 0.95± 0.05 308 Schindler et al., 1997 (c)φ1 =1 248 Krisch et al., 2004 (d)
Comments
(a) Monochromator/diode array set up with spectral resolution of 0.4 nm. The spectrum measured at 295 K showed nodependence on resolution between 0.3 and 1.2 nm. Correction applied for small Cl2 impurities which were quantified byMS.
(b) Monochromator/double diode array set up (temperature and resolution not quoted). Impurities (CH3OH and Cl2) quanti-fied by MS.
(c) Pulsed laser photolysis (excimer at 308 nm, dye laser at 235 nm) with REMPI-TOF mass spectrometric detection of Clphotofragments in both2P1/2 and2P3/2 states. The overall quantum yield of Cl atom generation at 308 nm was measuredrelative to Cl2. The ratio of Cl (2P1/2) / Cl (2P3/2) was found to be 0.31± 0.02 at 308 nm and 1.45± 0.05 at 235 nm.
(d) Crossed laser-molecular beam scattering experiment with detection of photofragments by VUV photoionisation-TOFMS(Cl detected as Cl+ and CH3O as CHO+). No other photofragments were observed.
www.atmos-chem-phys.net/8/4141/2008/ Atmos. Chem. Phys., 8, 4141–4496, 2008

4404 R. Atkinson et al.: Evaluated kinetic and photochemical data for atmospheric chemistry
Preferred Values
Absorption cross-sections for CH3OCl at 295 K
λ/nm 1020 σ /cm2 λ/nm 1020σ /cm2
200 6.61 340 0.908210 5.41 350 0.649220 10.0 360 0.441230 16.1 370 0.296240 16.6 380 0.203250 11.5 390 0.144260 6.00 400 0.108270 2.75 410 0.082280 1.56 420 0.064290 1.35 430 0.048300 1.44 440 0.037310 1.49 450 0.027320 1.39 460 0.020330 1.18
Quantum yields
φ1 = 1.0 throughout the absorption spectrum
Comments on Preferred Values
There is very good agreement between the cross sections presented in both studies forλ > 260 nm, (Crowley et al., 1994;Jungkamp et al., 1995) though some differences are observed at the short wavelength end of the spectra. The data of Crowleyet al. (1994), which cover a larger wavelength range and extend further into the actinic region are preferred. The preferredoverall quantum yield of 1.0 is based on the work of Schindler et al. (1997), which is consistent with the observations of Krischet al. (2004) and with quantum yields measured for other hypohalites such as HOCl.
References
Crowley, J. N., Helleis, F., Muller, R., Moortgat, G. K. and Crutzen, P. J.: J. Geophys. Res. 99, 20683, 1994.Jungkamp, T. P. W., Kirchner, U., Schmidt, M. and Schindler, R. N.: J. Photochem. Photobiol. A 91, 1, 1995.Krisch, M. J., McCunn, L. R., Takematsu, K., Butler, L. J., Blas, F. R. and Shu, J.: J. Phys. Chem. A 108, 1650, 2004.Schindler, R. N., Liesner, M., Schmidt, S., Kirchner, U. and Benter, Th.: J. Photochem. Photobiol. A 107, 9, 1997.
Atmos. Chem. Phys., 8, 4141–4496, 2008 www.atmos-chem-phys.net/8/4141/2008/

R. Atkinson et al.: Evaluated kinetic and photochemical data for atmospheric chemistry 4405
IV.A2.222
CHF2Cl + hν→ products
Primary photochemical processes
Reaction 1H ◦/kJ.mol−1 λ threshold/nm
CHF2Cl + hν → CHF2 + Cl (1) 327 327→ CClF2 + H (2) 423 283→ CF2 + HCl (3) 207 287
Absorption cross-sections for CHF2Cl at 298 K and 210 K
λ/nm 1020 σ /cm2 λ/nm 1020σ /cm2 1020 σ /cm2
298 Ka 298 K 210 K
174 5.72 188 0.372 0.372176 4.04 190 0.245 0.242178 2.76 192 0.156 0.148180 1.91 194 0.103 0.093182 1.28 196 0.072 0.062184 0.842 198 0.048 0.039186 0.576 200 0.032 0.0159
202 0.022 0.0159204 0.014 0.0096
a No temperature dependence atλ < 188 nm.
Quantum yields for CHF2Cl photolysis
φ(1) = 0.84;φ(2) = 0.16 at 193 nm.
Comments on Preferred Values
The preferred values of the absorption cross-sections at 298 K are those reported by Simon et al. (1988). In the same study(Simon et al., 1988) the temperature dependence down to 210 K has been reported, with the values at the shorter wavelengthsbeing temperature-independent within the precision of the measurements. The values at longer wavelengths show a decreaseas the temperature is lowered (Simon et al., 1988). These results are in reasonable agreement with those of earlier studies citedin NASA, 1997. Melchior et al. (1996) studied the photodissociation of CHF2Cl at 193 nm using TOF-MS combined with2+1 REMPI to detect products. Photolysis by 2 channels, C-Cl and C-H bond rupture, was observed; HCl elimination was notfound. C-Cl rupture is the main channel. The minor channel yield wasφH/φtotal= 0.16± 0.05. This work forms the basis ofthe recommended values at 193 nm. The quantum yields are likely to be wavelength dependent withφ(1) increasing towards1.0 at the absorption threshold near 205 nm.
References
Melchior, A., Knupfer, P., Bar, I., Rosenwaks, S., Laurent, T., Volpp, H.-R. and Wolfrum, J.: J. Phys. Chem. 100, 13375,1996.NASA Evaluation: No. 12, 1997 (see references in Introduction).Simon, P. C., Gillotay, D., Vanlaethem-Meuree, N. and Wisemberg, J.: J. Atmos. Chem. 7, 107, 1988.
www.atmos-chem-phys.net/8/4141/2008/ Atmos. Chem. Phys., 8, 4141–4496, 2008

4406 R. Atkinson et al.: Evaluated kinetic and photochemical data for atmospheric chemistry
IV.A2.223
CF2Cl2 + hν→ products
Primary photochemical processes
Reaction 1H ◦/kJ.mol−1 λ threshold/nm
CF2Cl2 + hν → CF2Cl + Cl (1) 346 346→ CF2 + 2Cl (2) 542 221
Absorption cross-sections for CF2Cl2 at 295 K and 210 K
λ/nm 1020 σ /cm2 1020 σ /cm2 λ/nm 1020σ /cm2 1020 σ /cm2
295 K 210 Ka 295 K 210 K
174 162 200 8.89 5.11176 181 202 5.51 2.97178 187 204 3.44 1.69180 179 206 2.09 0.99182 160 208 1.27 0.56184 134 210 0.76 0.32186 107 212 0.45 0.18188 82.8 79.3 214 0.27 0.10190 63.2 52.9 216 0.16 0.058192 45.5 35.8 218 0.10 0.033194 31.5 22.8 220 0.060 0.018196 21.1 14.4 222 0.036 0.010198 13.9 8.8 224 0.022 0.006
226 0.013 0.003
a No temperature dependence atλ ≤ 186 nm.
Quantum yields for CF2Cl2 photolysis at 298K
φ(1) = 1 over the range 190–225 nm.
Comments on Preferred Values
The preferred values of the absorption cross-sections at 295 K and at 210 K are those reported by Simon et al. (1988).This publication reports the results of the most comprehensive study of the temperature dependence (Simon et al., 1988). Thevalues at room temperature are in good agreement with those recommended in our previous evaluation, CODATA, 1980, wherea detailed discussion of earlier work can be found. They also agree with the recommendations of NASA (1997) which includean expression for the temperature dependent cross-sections applicable over the range 190–210 nm:
σT = σ (218)exp{4.1×10⁻⁴ (λ - 184.9)(T -298)} [λ in nm;T in K].
More recently the absorption cross-sections of CF2Cl2 at 298 K have been measured over the range 225< λ <110 nm usingsynchrotron radiation (Limao Vieira et al., 2002). The results agree well with those recommended by IUPAC in the overlappingwavelength range.
Baum and Huber (1993) studied laser photodissociation of CF2Cl2 at 193 nm, with photoproducts investigated by TOF-MS. Results show exclusive dissociation to CF2Cl + Cl, with the CF2Cl fragment containing insufficient energy for promptdissociation to produce a second Cl atom. This is contrary to the earlier suggestion by Rebbert and Ausloos (1975) thatformation of 2 Cl atoms occurred with increasing tendency at wavelengths< 230 nm. For the purposes of atmosphericphotolysis a value ofφ(1) = 1 is recommended.
Atmos. Chem. Phys., 8, 4141–4496, 2008 www.atmos-chem-phys.net/8/4141/2008/

R. Atkinson et al.: Evaluated kinetic and photochemical data for atmospheric chemistry 4407
References
Baum, G. and Huber, R. J.: Chem. Phys. Lett. 203, 261, 1993.CODATA, 1980 (see references in Introduction).Limao Vieira, P., Eden, S., Kendall, P. A., Mason, N. J. and Hoffman, S. V., Chem. Phys. Lett., 364, 535, 2002).NASA: Evaluation No. 12, 1997 (see references in Introduction).Rebbert, R. E. and Ausloos, P. J.: J. Photochem. 4, 419, 1975.Simon, P. C., Gillotay, D., Vanlaethem-Meuree, N. and Wisemberg, J.: J. Atmos. Chem. 7, 107, 1988.
www.atmos-chem-phys.net/8/4141/2008/ Atmos. Chem. Phys., 8, 4141–4496, 2008

4408 R. Atkinson et al.: Evaluated kinetic and photochemical data for atmospheric chemistry
IV.A2.224
CFCl3 + hν→ products
Primary photochemical processes
Reaction 1H ◦/kJ.mol−1 λ threshold/nm
CFCl3 + hν → CFCl2 + Cl (1) 317 377→ CFCl + 2Cl (2) 558 214
Absorption cross-sections for CFCl3 at 295 K and 210 K
λ/nm 1020 σ /cm2 1020 σ /cm2 λ/nm 1020σ /cm2 1020 σ /cm2
295 K 210 Ka 295 K 210 K
174 313 210 14.8 9.9176 324 212 10.5 6.63178 323 214 7.56 4.31180 314 216 5.38 2.78182 296 218 3.79 1.77184 272 220 2.64 1.13186 243 230 222 1.82 0.71188 213 202 224 1.24 0.45190 179 170 226 0.84 0.29192 154 141 228 0.56 0.19194 124 115 230 0.37 0.12196 99.1 90.5 235 0.126198 78.0 71.8 240 0.046200 64.5 55.8 245 0.017202 50.0 42.0 250 0.0066204 37.4 30.0 255 0.0034206 28.0 21.6 260 0.0015208 19.7 14.9
a No temperature dependence atλ ≤ 184 nm.
Quantum yields for CFCl3 photolysis at 298K
φ(1) = 1 atλ > 180 nm.
Comments on Preferred Values
The preferred values of the absorption cross-sections for 174–250 nm at 295 K and 210 K are the values reported by Simonet al. (1988). This publication reports the results of the most comprehensive study of the temperature dependence (Simon etal., 1988). Forλ > 230 nm, the absorption cross-section values are those reported by Hubrich and Stuhl (1980). The valuesare in good agreement with those recommended in our previous evaluation, CODATA, 1982, where a detailed discussion ofearlier work can be found. They also agree with the recommendations of NASA (1997) which include an expression for thetemperature dependent cross-sections applicable over the range 190–210 nm:
σT = σ (218)exp{4.1× 10⁻⁴ (λ-184.9)(T -298)} [λ in nm;T in K].
Felder and Demuth (1993) studied laser photodissociation of CFCl3 at 193 nm using TOF-MS to investigate the nature andenergetics of the photofragments. At this wavelength dissociation occurs exclusively to yield CFCl2 + Cl products. This resultis in conflict with the earlier conclusions of Rebbert and Ausloos (1975) thatφ(2) increases from 0.06 at 220 nm to 0.43 at 170nm. This result from indirect experiments must now be considered dubious.
Atmos. Chem. Phys., 8, 4141–4496, 2008 www.atmos-chem-phys.net/8/4141/2008/

R. Atkinson et al.: Evaluated kinetic and photochemical data for atmospheric chemistry 4409
References
CODATA, Supplement I, 1982 (see references in Introduction).Felder, P. and Dermuth, C.: Chem. Phys. Lett. 208, 21, 1993.Hubrich, C. and Stuhl, F.: J. Photochem. 12, 93, 1980.NASA: Evaluation No. 12, 1997 (see references in Introduction).Rebbert, R. E. and Ausloos, P. J.: J. Photochem. 4, 419, 1975.Simon, P. C., Gillotay, D., Vanlaethem-Meuree, N. and Wisemberg, J.: J. Atmos. Chem. 7, 107, 1988.
www.atmos-chem-phys.net/8/4141/2008/ Atmos. Chem. Phys., 8, 4141–4496, 2008

4410 R. Atkinson et al.: Evaluated kinetic and photochemical data for atmospheric chemistry
IV.A2.225
CCl4 + hν→ products
Primary photochemical processes
Reaction 1H ◦/kJ.mol−1 λ threshold/nm
CCl4 + hν → CCl3 + Cl (1) 288 415→ CCl2 + 2Cl (2) 577 207
Preferred Values
Absorption cross-sections for CCl4 at 295 K and 210 K
λ/nm 1020 σ /cm2 1020 σ /cm2 λ/nm 1020σ /cm2 1020 σ /cm2
295 K 210 Ka 295 K 210 K
174 990 220 17.5 12.5176 1010 222 13.6 9.0178 975 224 10.2 6.4180 720 226 7.6 4.4182 590 228 5.6 3.16184 440 230 4.28 2.27186 310 232 3.04 1.52188 198 234 2.20 1.05190 147 236 1.60 0.72192 99.2 238 1.16 0.50194 76.7 240 0.830 0.234196 69.5 242 0.590 0.234198 68.0 244 0.413 0.158200 66.0 246 0.290 0.108202 63.8 248 0.210 0.076204 61.0 60.1 250 0.148 0.053206 57.0 54.4 255 0.066208 52.5 48.3 260 0.025210 46.9 41.5 265 0.013212 41.0 34.8 270 0.006214 34.5 27.9 275 0.002216 27.8 21.7218 22.1 16.3
a No temperature dependence atλ < 204 nm.
Quantum yields for CCl4 photolysis at 298K
φ(1) = 1 over wavelength range 174–275 nm.
Comments on Preferred Values
The preferred values of the absorption cross-sections for 174–230 nm at 295 K and 210 K are the values reported by Simon etal. (1988). This recent publication reports the results of the most comprehensive study of the temperature dependence Simonet al. (1988). Forλ > 230 nm, the absorption cross-section values are those reported by Hubrich and Stuhl (1980). The valuesat room temperature are in good agreement with those recommended in our previous evaluation, CODATA, 1982, where a
Atmos. Chem. Phys., 8, 4141–4496, 2008 www.atmos-chem-phys.net/8/4141/2008/

R. Atkinson et al.: Evaluated kinetic and photochemical data for atmospheric chemistry 4411
detailed discussion of earlier work can be found. Photodissociation via C-Cl bond fission expected to occur with unit quantumyield. There is also evidence for direct release of a second Cl atom (channel 2) atλ < 220 nm. The earlier results of Rebbertand Ausloos (1976/77) are now supported by pulsed laser photolysis experiments at 193 nm and 135 nm which giveφ(Cl) =1.5± 0.1 and 1.9± 0.1 respectively at these wavelengths (Hanf et al., 2003).
References
CODATA, Supplement I, 1982 (see references in Introduction).Hanf, A., Lauter, A. and Volpp, H-R.: Chem. Phys. Lett., 368, 445, 2003.Hubrich, C. and Stuhl, F.: J. Photochem. 12, 93, 1980.Rebbert, R. E. and Ausloos, P. J.: J. Photochem. 6, 265, 1976/77.Simon, P. C., Gillotay, D., Vanlaethem-Meuree, N. and Wisemberg, J.: J. Atmos. Chem. 7, 107, 1988.
www.atmos-chem-phys.net/8/4141/2008/ Atmos. Chem. Phys., 8, 4141–4496, 2008

4412 R. Atkinson et al.: Evaluated kinetic and photochemical data for atmospheric chemistry
IV.A2.226
CH3CF2Cl + hν→ products
Primary photochemical processes
Reaction 1H ◦/kJ.mol−1 λ threshold/nm
CH3CF2Cl + hν → CH3CF2 + Cl 335 (est) 360→ CH2CF2Cl + H 400 (est) 300
Preferred Values
Absorption cross-sections for CH3CF2Cl at 298 K and 220 K
λ/nm 1020 σ /cm2 1020 σ /cm2 λ/nm 1020σ /cm2 1020 σ /cm2
298 K 220 K 298 K 220 K
190 1.01 0.75 210 0.017 0.010192 0.69 0.51 212 0.010 0.006194 0.49 0.34 214 0.007 0.003196 0.33 0.22 216 0.004 0.002198 0.22 0.15 218 0.003 0.001200 0.14 0.091 220 0.002 0.0007202 0.09 0.057 222 0.0009 0.0004204 0.061 0.037 224 0.0005 0.0002206 0.039 0.024 226 0.0003 0.0001208 0.026 0.015 228 0.0002 0.0001
Comments on Preferred Values
The preferred values of the absorption cross-sections at 298 K are the mean of the values reported by Gillotay and Simon(1991), Orlando et al. (1991) and (for 190–210 nm) Nayak et al. (1996). The agreement between these studies over thewavelength range of preferred values is good. The results of Hubrich and Stuhl (1980) are in reasonable agreement. Thetemperature dependence down to about 220 K has been reported by Gillotay and Simon (1991), Orlando et al. (1991) andNayak et al. (1996). The preferred values at 220 K for the wavelength range 190 nm to 210 nm are the mean of the valuesreported by Gillotay and Simon (1991), Orlando et al. (1991) and Nayak et al. (1996). Because Nayak et al. (1996) did notreport values forλ > 210 nm at their lowest temperature of 223 K, and the values of Orlando et al. (1991) at wavelengthsgreater than approximately 210 nm have been questioned (Gillotay and Simon, 1991; Nayak et al., 1996), the preferred valuesat 220 K andλ > 210 nm are the values reported by Gillotay and Simon (1991). Photolysis is expected to occur with unitquantum efficiency. At 193 nm Melchior et al. (1997) have shown that C-Cl bond fission to give CH3CF2 + Cl is the mainchannel, but that C-H bond cleavage also occurs with a branching ratio of about 40%.
References
Gillotay, D. and Simon, P. C.: J. Atmos. Chem. 12, 269, 1991.Hubrich, C. and Stuhl, F.: J. Photochem. 12, 93, 1980.Melchior, A., Bar, I. and Rosenwaks, S.: J. Chem. Phys. 107, 8476, 1997.Nayak, A.K., Buckley, T. J., Kurylo, M. J. and Fahr, A.: J. Geophys. Res. 101, 9055, 1996.Orlando, J. J., Burkholder, J. B., McKeen, S. A. and Ravishankara, A. R.: J. Geophys. Res. 96, 5013, 1991.
Atmos. Chem. Phys., 8, 4141–4496, 2008 www.atmos-chem-phys.net/8/4141/2008/

R. Atkinson et al.: Evaluated kinetic and photochemical data for atmospheric chemistry 4413
IV.A2.227
CH3CFCl2 + hν→ products
Primary photochemical processes
Reaction 1H ◦/kJ.mol−1 λ threshold/nm
CH3CFCl2 + hν → CH3CFCl + Cl 335 (est) 360→ CH2CFCl2 + H 400 (est) 300
Preferred Values
Absorption cross-sections for CH3CFCl2 at 298 K and 210 K
λ/nm 1020 σ /cm2 1020 σ /cm2 λ/nm 1020σ /cm2 1020 σ /cm2
298 K 210 K 298 K 210 K
190 83.8 80.1 210 2.1 1.6192 64.1 59.5 212 1.4 1.0194 47.4 42.8 214 0.88 0.65196 34.0 30.0 216 0.57 0.41198 23.8 20.6 218 0.37 0.26200 16.4 13.8 220 0.24 0.16202 11.1 9.2 222 0.16 0.10204 7.4 6.0 224 0.10 0.06206 4.9 3.9 226 0.07 0.04208 3.2 2.5 228 0.04 0.03
Comments on Preferred Values
The preferred values of the absorption cross sections at 298 K are the values reported by Fahr et al. (1993). In this study (Fahret al., 1993), measurements were made in the gas phase (190–260 nm) and the liquid phase (230–260 nm) at 298 K. Correctionfactors were used to convert these liquid-phase values into accurate gas-phase values at the long wavelengths. Results reportedin this study (Fahr et al., 1993) are in very good agreement with those reported by Gillotay and Simon (1991). The resultsof Talukdar et al. (1991) are lower at shorter wavelengths and higher at longer wavelengths. Gillotay and Simon (1991) andTalukdar et al. (1991) report the temperature dependence down to 210 K. The low temperature values of Gillotay and Simon(1991) are preferred, and their 210 K values are given in the table. Photolysis is expected to occurwith unit quantum efficiency.At 193 nm Melchior et al. (1997) have shown that C-Cl bond fission to give CH3CFCl + Cl is the main channel, but that C-Hbond cleavage also occurs with a branching ratio of about 15%. H atom formation is also observed at 205-209 nm using thephotofragment velocity map imaging technique (Mashino et al., 2005).
References
Fahr, A., Braun, W. and Kurylo, M. J.: J. Geophys. Res. 98, 20467, 1993.Gillotay, D. and Simon, P. C.: J. Atmos. Chem. 12, 269, 1991.Mashino, M., Yamada, H., Sugita, A. and Kawasaki, M.: J. Photochem. Photobiol. A: Chem., 176, 78, 2005.Melchior, A., Bar, I. and Rosenwaks, S.: J. Chem. Phys. 107, 8476, 1997.Talukdar, R., Mellouki, A., Gierczak, T., Burkholder, J. B., McKeen, S. A. and Ravishankara, A. R.: J. Phys. Chem. 95, 5815,1991.
www.atmos-chem-phys.net/8/4141/2008/ Atmos. Chem. Phys., 8, 4141–4496, 2008

4414 R. Atkinson et al.: Evaluated kinetic and photochemical data for atmospheric chemistry
IV.A2.228
CH3CCl3 + hν→ products
Primary photochemical processes
Reaction 1H ◦/kJ.mol−1 λ threshold/nm
CH3CCl3 + hν → CH3CCl2 + Cl 335 (est) 360
Preferred Values
Absorption cross-sections for CH3CCl3 at 295 K and 210 K
λ/nm 1020 σ /cm2 1020 σ /cm2 λ/nm 1020σ /cm2 1020 σ /cm2
295 K 210 K 295 K 210 K
182 315 a 210 24.0 19.8184 280 a 212 16.8 13.2186 250 a 214 12.0 8.8188 220 a 216 8.6 6.1190 192 a 218 6.0 4.2192 163 a 220 4.1 2.9194 140 a 222 2.9 1.2196 118 a 224 2.0 1.2198 99 a 226 1.5 0.76200 81 a 228 1.0 0.51202 66 64 230 0.70 0.33204 52 49 232 0.49 0.18206 40 36 234 0.33 0.11208 31 26 236 0.23 0.064
238 0.15 0.036240 0.10 0.024
(a) No temperature dependence observed.
Comments on Preferred Values
The preferred values of the absorption cross-sections at 298 K and at 210 K are the values reported by Vanlaethem-Meuree etal. (1979), who determined absorption cross-section values at 295 K, 270 K, 250 K, 230 K and 210 K for the wavelength range180–240 nm. These values (Vanlaethem-Meuree et al., 1979) are preferred over the substantially higher values reported byHubrich and Stuhl (1980), in which study a correction was required for the presence of the UV-absorbing stabilizer 1,4-dioxane.In a recent study, Nayak et al. (1995) reported measurements in the gas phase (160–240 nm) and the liquid phase (235–260nm) over the temperature range 220–330 K. A wavelength shift procedure was used to convert the liquid-phase values intoeffective gas-phase values at the long wavelengths. The reported room temperature values of Nayak et al. (1995) are in goodagreement (within 15%) with those of Vanlaethem-Meuree et al. (1979) in the range 210–240 nm, whereas in the 180–210nm range they are 15% to 30% higher. Low temperature results are in relatively good agreement up to 230 nm. Photolysis isexpected to occur with unit quantum efficiency by breaking of the C-Cl bond to yield CH3CCl2 + Cl.
References
Hubrich, C. and Stuhl, F.: J. Photochem. 12, 93, 1980.Nayak, A. K., Kurylo, M. J. and Fahr, A.: J. Geophys. Res. 100, 11185, 1995.Vanlaethem-Meuree, N., Wisemberg, J. and Simon, P. C.: Geophys. Res. Lett. 6, 451, 1979.
Atmos. Chem. Phys., 8, 4141–4496, 2008 www.atmos-chem-phys.net/8/4141/2008/

R. Atkinson et al.: Evaluated kinetic and photochemical data for atmospheric chemistry 4415
IV.A2.229
CF3CHFCl + hν→ products
Primary photochemical processes
Reaction 1H ◦/kJ.mol−1 λ threshold/nm
CF3CHFCl + hν → CF3CHF + Cl 335 (est) 360
Preferred Values
Absorption cross-sections for CF3CHFCl at 298 K and 210 K
λ/nm 1020 σ /cm2 1020 σ /cm2 λ/nm 1020σ /cm2 1020 σ /cm2
298 K 210 K 298 K 210 K
190 0.77 0.62 210 0.018 0.010192 0.55 0.42 212 0.012 0.006194 0.39 0.29 214 0.008 0.004196 0.27 0.19 216 0.006 0.003198 0.18 0.13 218 0.004 0.002200 0.13 0.084 220 0.003 0.0011202 0.086 0.055 222 0.002 0.0007204 0.060 0.036 224 0.002 0.0005206 0.040 0.023 226 0.001 0.0003208 0.027 0.015 228 0.001 0.0002
Comments on Preferred Values
The preferred values of the absorption cross-sections at 298 K are the averages of the values reported by Orlando et al. (1991)and Gillotay and Simon (1991), which are in good agreement. Both studies investigated the temperature dependence down toabout 210 K. The temperature dependences of Orlando et al. (1991) are greater for shorter wavelengths (< 200 nm) and lessfor the longer wavelengths than those reported by Gillotay and Simon (1991). The low temperature values of Gillotay andSimon (1991) are preferred, and their 210 K values are given in the table. Photolysis is expected to occur with unit quantumefficiency by breaking of the C-Cl bond to yield CF3CHF + Cl.
References
Gillotay, D. and Simon, P. C.: J. Atmos. Chem. 13, 289, 1991.Orlando, J. J., Burkholder, J. B., McKeen, S. A. and Ravishankara, A. R.: J. Geophys. Res. 96, 5013, 1991.
www.atmos-chem-phys.net/8/4141/2008/ Atmos. Chem. Phys., 8, 4141–4496, 2008

4416 R. Atkinson et al.: Evaluated kinetic and photochemical data for atmospheric chemistry
IV.A2.230
CF3CHCl2 + hν→ products
Primary photochemical processes
Reaction 1H ◦/kJ.mol−1 λ threshold/nm
CF3CHCl2 + hν → CF3CHCl + Cl 335 (est) 360
Preferred Values
Absorption cross-sections for CF3CHCl2 at 298 K and 220 K
λ/nm 1020 σ /cm2 1020 σ /cm2 λ/nm 1020σ /cm2 1020 σ /cm2
298 K 220 K 298 K 220 K
190 61.5 54.3 210 1.8 1.2192 46.2 39.7 212 1.3 0.82194 33.9 28.1 214 0.84 0.55196 24.1 19.2 216 0.57 0.38198 17.2 13.4 218 0.38 0.27200 12.0 9.1 220 0.26 0.18202 8.3 6.1 222 0.18 0.13204 5.7 4.1 224 0.12 0.09206 3.9 2.7 226 0.09 0.06208 2.7 1.8 228 0.06 0.04
Comments on Preferred Values
The preferred values of the absorption cross-sections at 298 K are the mean of the values reported by Gillotay and Simon(1991), Orlando et al. (1991) and Nayak et al. (1996). The agreement between these studies over the wavelength range ofpreferred values is very good. The temperature dependence down to about 220 K has been reported by Gillotay and Simon(1991), Orlando et al. (1991) and Nayak et al. (1996). The preferred values at 220 K for the wavelength range 190 nm to 220nm are the mean of the values reported by Gillotay and Simon (1991), Orlando et al. (1991) and Nayak et al. (1996). BecauseNayak et al. (1996) did not report values forλ > 220 nm at their lowest temperature of 223 K, and the values of Orlando etal. (1991) at wavelengths greater than approximately 220 nm have been questioned (Gillotay and Simon, 1991; Nayak et al.,1996), the preferred values at 220 K andλ > 220 nm are the values reported by Gillotay and Simon (1991). Photolysis isexpected to occur with unit quantum efficiency by breaking of the C-Cl bond to yield CF3CHCl + Cl.
References
Gillotay, D. and Simon, P. C.: J. Atmos. Chem. 12, 269, 1991.Nayak, A. K., Buckley, T. J., Kurylo, M. J. and Fahr, N.: J. Geophys. Res. 101, 9055, 1996.Orlando, J. J., Burkholder, J. B., McKeen, S. A. and Ravishankara, A. R.: J. Geophys. Res. 96, 5013, 1991.
Atmos. Chem. Phys., 8, 4141–4496, 2008 www.atmos-chem-phys.net/8/4141/2008/

R. Atkinson et al.: Evaluated kinetic and photochemical data for atmospheric chemistry 4417
IV.A2.231
CF2ClCFCl2 + hν→ products
Primary photochemical processes
Reaction 1H ◦/kJ.mol−1 λ threshold/nm
CF2ClCFCl2 + hν → CF2ClCFCl + Cl (1) 346 (est) 346→ CFCl2CF2 + Cl (2) 346 (est) 346
Preferred Values
Absorption cross-sections for CF2ClCFCl2 at 295 K and 210 K
λ/nm 1020 σ /cm2 1020 σ /cm2 λ/nm 1020σ /cm2 1020 σ /cm2
295 K 210 K 295 K 210 K
184 118 a 210 1.80 1.12186 104 a 212 1.15 0.696188 83.5 a 214 0.760 0.452190 64.5 a 216 0.505 0.298192 48.8 a 218 0.318 0.184194 36.0 a 220 0.220 0.125196 26.0 24.3 222 0.145 0.081198 18.3 15.9 224 0.095 0.053200 12.5 10.1 226 0.063 0.034202 8.60 6.54 228 0.041 0.022204 5.80 4.09 230 0.027 0.014206 4.00 2.66208 2.65 1.68
(a) No temperature dependence observed.
Comments on Preferred Values
The preferred values of the absorption cross-sections are those reported by Simon et al. (1988). They are in good agreementwith the room temperature results of Chou et al. (1978) and Hubrich and Stuhl (1980), who also made low temperaturemeasurements. Photolysis is expected to occur with unit quantum efficiency by breaking of the C-Cl bond to yield CF2ClCFCl+ Cl or CFCl2CF2 + Cl.
References
Chou, C. C., Milstein, R. J., Smith, W. S., Vera Ruiz, H., Molina, M. J. and Rowland, F. S.: J. Phys. Chem. 82, 1, 1978.Hubrich, C. and Stuhl, F.: J. Photochem. 12, 93, 1980.Simon, P. C., Gillotay, D., Vanlaethem-Meuree, N. and Wisemberg, J.: Ann. Geophysicae 6, 239, 1988.
www.atmos-chem-phys.net/8/4141/2008/ Atmos. Chem. Phys., 8, 4141–4496, 2008

4418 R. Atkinson et al.: Evaluated kinetic and photochemical data for atmospheric chemistry
IV.A2.232
CF2ClCF2Cl + hν→ products
Primary photochemical processes
Reaction 1H ◦/kJ.mol−1 λ threshold/nm
CF2ClCF2Cl + hν → CF2ClCF2 + Cl 346 (est) 346
Preferred Values
Absorption cross-sections for CF2ClCF2Cl at 295 K and 210 K
λ/nm 1020 σ /cm2 1020 σ /cm2 λ/nm 1020σ /cm2 1020 σ /cm2
295 K 210 K 295 K 210 K
172 69 a 200 0.80 0.55174 55 a 202 0.54 0.34176 43 a 204 0.37 0.22178 34 a 206 0.24 0.13180 26 a 208 0.16 0.084182 19.8 a 210 0.104 0.051184 15.0 a 212 0.068 0.031186 11.0 a 214 0.044 0.020188 7.80 7.72 216 0.029 0.012190 5.35 5.03 218 0.019 0.007192 3.70 3.28 220 0.012 0.004194 2.56 2.13196 1.75 1.39198 1.20 0.88
(a) No temperature dependence observed.
Comments on Preferred Values
The preferred values of the absorption cross-sections are those reported by Simon et al. (1988). They are in good agreementwith the room temperature results of Chou et al. (1978). Hubrich and Stuhl (1980) reported higher values and a smallertemperature dependence. Photolysis is expected to occur with unit quantum efficiency by breaking of the C-Cl bond to yieldCF2ClCF2+ Cl.
References
Chou, C. C., Milstein, R. J., Smith, W. S., Vera Ruiz, H., Molina, M. J. and Rowland, F. S.: J. Phys. Chem. 82, 1, 1978.Hubrich, C. and Stuhl, F.: J. Photochem. 12, 93, 1980.Simon, P. C., Gillotay, D., Vanlaethem-Meuree, N. and Wisemberg, J.: Ann. Geophysicae 6, 239, 1988.
Atmos. Chem. Phys., 8, 4141–4496, 2008 www.atmos-chem-phys.net/8/4141/2008/

R. Atkinson et al.: Evaluated kinetic and photochemical data for atmospheric chemistry 4419
IV.A2.233
CF3CF2Cl + hν→ products
Primary photochemical processes
Reaction 1H ◦/kJ.mol−1 λ threshold/nm
CF3CF2Cl + hν → CF3CF2 + Cl 346 346
Preferred Values
Absorption cross-sections for CF3CF2Cl at 295 K to 225 K
λ/nm 1020 σ /cm2 λ/nm 1020σ /cm2
172 5.65 190 0.27174 4.05 192 0.19176 2.85 194 0.13178 2.05 196 0.090180 1.45 198 0.063182 1.05 200 0.044184 0.75 202 0.031186 0.53 204 0.021188 0.38
Comments on Preferred Values
The preferred values of the absorption cross-sections are those reported by Simon et al. (1988). In this study measurementswere made down to 225 K, and the absorption cross-section values were found to be independent of temperature. They arein good agreement with the results of Hubrich and Stuhl (1980), who also made low temperature measurements. Earliermeasurements of Chou et al. (1978) are 50% higher. Photolysis is expected to occur with unit quantum efficiency by breakingof the C-Cl bond to yield CF3CF2 + Cl.
References
Chou, C. C., Milstein, R. J., Smith, W. S., Vera Ruiz, H., Molina, M. J. and Rowland, F. S.: J. Phys. Chem. 82, 1, 1978.Hubrich, C. and Stuhl, F.: J. Photochem. 12, 93, 1980.Simon, P. C., Gillotay, D., Vanlaethem-Meuree, N. and Wisemberg, J.: Ann. Geophysicae 6, 239, 1988.
www.atmos-chem-phys.net/8/4141/2008/ Atmos. Chem. Phys., 8, 4141–4496, 2008

4420 R. Atkinson et al.: Evaluated kinetic and photochemical data for atmospheric chemistry
IV.A2.234
CF3CF2CHCl2 + hν→ products
Primary photochemical processes
Reaction 1H ◦/kJ.mol−1 λ threshold/nm
CF3CF2CHCl2 + hν → CF3CF2CHCl + Cl 335 (est) 360
Preferred Values
Absorption cross-sections for CF3CF2CHCl2 at 298 K
λ/nm 1020 σ /cm2 λ/nm 1020σ /cm2
160 269 200 16165 197 205 6.9170 183 210 2.9175 191 215 1.2180 177 220 0.46185 129 225 0.17190 74 230 0.065195 37 240 0.011
Comments on Preferred Values
The preferred values of the absorption cross-sections at 298 K are the values reported by Braun et al. (1991). In the same study,absorption cross-section measurements in the liquid phase were made over the wavelength range 205–270 nm (Braun et al.,1991). Correction factors were used to convert these liquid-phase values into gas-phase values. The combined set of gas-phasevalues for the wavelength range 170–270 nm were fitted (Braun et al., 1991) with the expression:
log10σ = -17.966 + 4.542× 10⁻² X - 2.036× 10−3 X2 + 1.042× 10−5 X3
whereX= (λ - 160 nm)
Photolysis is expected to occur with unit quantum efficiency by breaking of the C-Cl bond to yield CF3CF2CHCl + Cl.
References
Braun, W., Fahr, A., Klein, R., Kurylo, M. J. and Huie, R. E.: J. Geophys. Res. 96, 13009, 1991.
Atmos. Chem. Phys., 8, 4141–4496, 2008 www.atmos-chem-phys.net/8/4141/2008/

R. Atkinson et al.: Evaluated kinetic and photochemical data for atmospheric chemistry 4421
IV.A2.235
CF2ClCF2CHFCl + hν→ products
Primary photochemical processes
Reaction 1H ◦/kJ mol−1 λ threshold/nm
CF2ClCF2CHFCl + hν → CF2ClCF2CHF + Cl 335 (est) 360→ CHFClCF2CF2 + Cl 335 (est) 360
Preferred Values
Absorption cross-sections for CF2ClCF2CHFCl at 298 K
λ/nm 1020 σ /cm2 λ/nm 1020σ /cm2
160 188 185 9.1165 145 190 3.5170 91 195 1.5175 47 200 0.63180 21 205 0.33
210 0.25
Comments on Preferred Values
The preferred values of the absorption cross-sections at 298 K are the values reported by Braun et al. (1991). In the same study,absorption cross-section measurements in the liquid phase were made over the wavelength range 205–270 nm (Braun et al.,1991). Correction factors were used to convert these liquid-phase values into gas-phase values. The combined set of gas-phasevalues for the wavelength range 170–270 nm were fitted with the expression:
log10σ = -17.714 - 2.175× 10⁻² X - 1.484× 10−3 X2 + 1.147× 10−5 X3
whereX= (λ - 160 nm)
Photolysis is expected to occur with unit quantum efficiency by breaking of the C-Cl bond to yield CF2ClCF2CHF + Cl orCHFClCF2CF2 + Cl.
References
Braun, W., Fahr, A., Klein, R., Kurylo, M. J. and Huie, R. E.: J. Geophys. Res. 96, 13009, 1991.
www.atmos-chem-phys.net/8/4141/2008/ Atmos. Chem. Phys., 8, 4141–4496, 2008

4422 R. Atkinson et al.: Evaluated kinetic and photochemical data for atmospheric chemistry
IV.A2.236
HC(O)Cl + hν→ products
Primary photochemical processes
Reaction 1H ◦/kJ mol−1 λ threshold/nm
HC(O)Cl + hν → HCO + Cl 340 (est) 350
Preferred Values
Absorption cross-sections for HC(O)Cl at the band maxima(298 K, 1013 mbar of N2, spectral resolution 0.7 nm)
λ/nm 1020 σ /cm2 λ/nm 1020σ /cm2
236.1 3.8 280.2 2.4241.5 4.9 282.7 2.3247.3 5.6 285.3 1.64251.4 5.4 286.8 1.04253.7 6.0 288.0 0.86256.1 5.6 289.4 0.97258.2 5.8 292.2 0.81260.2 6.0 294.9 0.46263.5 5.1 296.7 0.32265.7 5.3 298.1 0.22267.9 5.2 299.5 0.25269.1 3.9 302.3 0.172270.2 3.5 305.2 0.080271.4 4.0 308.1 0.027273.8 4.1 309.3 0.021276.3 3.4 311.1 0.020277.7 2.4 314.1 0.013278.9 2.1 316.7 0.008
318.7 0.007
Comments on Preferred Values
The preferred values of the absorption cross-sections at 298 K are those reported by Libuda et al. (1990). These are thevalues of the absorption cross-sections at the absorption maxima and were measured at a spectral resolution of 0.7 nm. Theabsorption bands forλ > 265 nm became distinctly sharper when the spectral resolution was improved to 0.4 nm. The spectrumof HC(O)Cl is similar to that of HCHO but is shifted to shorter wavelengths by 45 nm. Although there have been no quantumyield studies of HC(O)Cl photolysis, it is reasonable to assume by analogy with the photolysis of C(O)Cl2 that the primaryphotolysis pathway proceeds by breaking of the C-Cl bond to yield HCO + Cl.
References
Libuda, H. G., Zabel, F., Fink, E. H. and Becker, K. H.: J. Phys. Chem. 94, 5860, 1990.
Atmos. Chem. Phys., 8, 4141–4496, 2008 www.atmos-chem-phys.net/8/4141/2008/

R. Atkinson et al.: Evaluated kinetic and photochemical data for atmospheric chemistry 4423
IV.A2.237
C(O)FCl + hν→ products
Primary photochemical processes
Reaction 1H ◦/kJ mol−1 λ threshold/nm
C(O)FCl + hν → FCO + Cl (1) 396 302→ ClCO + F (2) 485 247→ CO + F + Cl (3) 517 231→ CFCl + O(3P) (4) 707 169
Quantum yield data
Measurement Wavelength/nm Reference Comments
81 + 83 = 0.98± 0.09 193 Hermann et al., 1994 (a,b,c)81 + 83 = 0.90± 0.05 210± 2.5 Nolle et al., 1999 (a,d,e)81 + 83 = 0.85± 0.25 210 (a,b,e)81 + 83 = 0.77± 0.33 225.5 (a,b,e)81 + 83 = 0.71± 0.30 230 (a,b,e)81 + 83 = 0.52± 0.14 248 (a,b,e)
Comments
(a) The measured quantum yield is for the loss of C(O)FCl. The observed products were C(O)F2 (and in the study of Hermannet al. (1994), also CO). Product formation was explained using only channels (1) and (3), because decomposition of ClCOformed in channel (2) makes channel (2) equivalent to channel (3). Formation of C(O)F2 arises from the self-reaction ofFCO radicals formed in channel (1), FCO + FCO→ C(O)F2 + CO. Channel (3) should not be accessible for wavelengths> 231 nm, and hence the quantum yield measured by Nolle et al. (1999) at 248 nm is expected to be that for channel (1).
(b) Laser photolysis at 298 K.
(c) The initial C(O)FCl pressure was in the range 7–11 mbar. In addition to experiments in the absence of diluent gas,experiments were carried out with added N2 diluent gas at total pressures of 100 and 900 mbar. The relative contributionof channels (1) and (3) depended on pressure with an equal contribution of the two channels at 900 mbar N2.
(d) Photolysis with a medium pressure mercury lamp-monochromator combination at 298 K.
(e) The initial C(O)FCl pressure was∼ 5 mbar, with no added diluent gas.
www.atmos-chem-phys.net/8/4141/2008/ Atmos. Chem. Phys., 8, 4141–4496, 2008

4424 R. Atkinson et al.: Evaluated kinetic and photochemical data for atmospheric chemistry
Preferred Values
Absorption cross-sections for C(O)FCl at 298 K
λ/nm 1020 σ /cm2 λ/nm 1020σ /cm2
186.0 15.6 207.3 10.8187.8 14.0 209.4 9.9189.6 13.4 211.6 9.0191.4 12.9 213.9 7.9193.2 12.7 216.2 6.9195.1 12.5 218.6 5.8197.0 12.4 221.0 4.8199.0 12.3 223.5 3.8201.0 12.5 226.0 2.9203.0 12.0 228.6 2.2205.1 11.5 231.2 1.6
Quantum yields for C(O)FCl photolysis at 298 K
See Comments on Preferred Values
Comments on Preferred Values
The preferred values of the absorption cross-sections are those reported by Chou et al. (1977) over the wavelength range 186to 199 nm and those reported by Nolle et al. (1993) at longer wavelengths. The spectrum shows little structure; the valueslisted are averages over 500 cm−1 intervals. Nolle et al. (1993) reported values over the wavelength range 200–260 nm andthe temperature range 298–223 K. Their room temperature values are in good agreement with those of Chou et al. (1977).The effect of temperature on calculated photodissociation rates is negligible because no strong temperature dependence isobserved in the atmospheric window region where photolysis occurs (190–230 nm). Hermann et al. (1994) and Nolle et al.(1999) photolyzed C(O)FCl at a number of specific wavelengths in the range 193–248 nm. Within the substantial measurementuncertainties, the overall quantum yield for loss of C(O)FCl decreases approximately linearly with wavelength from 1.0 at 193nm to 0.5 at 248 nm. Until confirmatory data are available, use of the quantum yields measured by Hermann et al. (1994) andNolle et al. (1999) is recommended. Pulsed laser photolysis at 235 nm of C(O)FCl in a supersonic jet coupled to time-of-flightspectroscopy showed that channel (1) is operative at this wavelength (Maul et al., 1999), and a value of1H 0(C(O)FCl)[0 K]= -(397± 15) kJ mol−1 was obtained.
References
Chou, C. G., Crescentini, G., Vera-Ruiz, H., Smith, W. S. and Rowland, F.S.: Results presented at the 173rd AmericanChemical Society National Meeting, New Orleans, March, 1977.Hermann, M., Nolle, A. and Heydtmann, H.: Chem. Phys. Lett., 226, 559, 1994.Maul, C., Dietrich, C., Haas, T. and Gericke, K.-H.: Phys. Chem. Chem. Phys., 1, 1441, 1999.Nolle, A., Heydtmann, H., Meller, R. and Moortgat, G. K.: Geophys. Res. Lett., 20, 707, 1993.Nolle, A., Krumscheid, C. and Heydtmann, H.: Chem. Phys. Lett., 299, 561, 1999.
Atmos. Chem. Phys., 8, 4141–4496, 2008 www.atmos-chem-phys.net/8/4141/2008/

R. Atkinson et al.: Evaluated kinetic and photochemical data for atmospheric chemistry 4425
IV.A2.238
C(O)Cl2 + hν→ products
Primary photochemical transitions
Reaction 1H ◦/kJ mol−1 λ threshold/nm
C(O)Cl2 + hν → ClCO + Cl (1) 320 374→ CO + 2Cl (2) 352 340→ CCl2 + O(3P) (3) 699 171
Preferred Values
Absorption cross-sections for C(O)Cl2 at 298 K
λ/nm 1020 σ /cm2 λ/nm 1020σ /cm2
184.4 234 211.6 13.3186.0 186 213.9 12.6187.8 146 216.2 12.3189.6 116 218.6 12.2191.4 90.3 221.0 12.2193.2 71.5 223.5 12.4195.1 52.4 226.0 12.7197.0 39.9 228.6 13.1199.0 31.2 231.2 13.4201.0 25.2 233.9 13.6203.0 20.9 236.7 13.1205.1 17.9 239.5 12.5207.3 15.8 242.4 11.6209.4 14.3
Quantum yield for C(O)Cl 2 at 298 K
8(1) = 1.0 forλ > 184 nm.
Comments on Preferred Values
The preferred values of the absorption cross sections are those reported by Gillotay et al. (1993). The spectrum is a continuum;the values listed are averaged over 500 cm−1 intervals. The results of Gillotay et al. (1993) are in good agreement withthe earlier results of Chou et al. (1977). Gillotay et al. (1993) reported values over the wavelength range 170–310 nmand the temperature range 210–295 K. The temperature effect is only significant at longer wavelengths (λ > 250 nm). Theobservations of Wijnen (1961), Heicklen (1965) and earlier investigators (Calvert and Pitts, 1966) show that process (1) is theprimary photolysis pathway. In the atmosphere, the overall photolysis proceeds by process (2) [i.e., ClCO decomposes to yielda second Cl atom] and the quantum yield for Cl atom formation will be 2.0.
References
Calvert, J. G. and Pitts, Jr., J. N.: ”Photochemistry,” page 231, John Wiley and Sons, Inc., New York, 1966.Chou, G. C., Crescentini, G., Vera-Ruiz, H., Smith, W. S. and Rowland, F. S.: Results presented at the 173rd AmericanChemical Society National Meeting, New Orleans, March, 1977.Gillotay, D., Simon, P. C. and Dierickx, L.: Aeronomica Acta, A368, 1993; Institut d’Aeronomie Spatiale de Belgique,Brussels, Belgium; presented at Quadrennial Ozone Symposium, Charlottesville, Virginia, June 1992.Heicklen, J.: J. Am. Chem. Soc., 87, 445, 1965.Wijnen, W. H.: J. Am. Chem. Soc., 83, 3014, 1961.
www.atmos-chem-phys.net/8/4141/2008/ Atmos. Chem. Phys., 8, 4141–4496, 2008

4426 R. Atkinson et al.: Evaluated kinetic and photochemical data for atmospheric chemistry
IV.A2.239
CF2ClCHO + hν→ products
Primary photochemical processes
Reaction 1H ◦/kJ mol−1 λ threshold/nm
CF2ClCHO + hν → CF2Cl + HCO (1)→ CF2ClCO + H (2)→ CHF2Cl + CO (3)
Absorption cross-section data
Wavelength range/nm References Comments
235-370 Rattigan et al., 1998 (a)
Quantum yield data
There are no reported quantum yield data.
Comments
(a) Absorption cross-sections were measured using a dual-beam diode array spectrometer over the temperature range 243–298 K. The UV spectrum of difluorochloroacetaldehyde shows a broad band, centered at 300 nm and extending out to 365nm. Values ofσ were given at 5 nm intervals at 298 K together with values of B in the expression lnσ (T ) = ln σ (298 K)+ B(T -298).
Preferred Values
Absorption cross-sections for CF2ClCHO at 298 K and their temperature dependence
Wavelength 1020 σ (298 K)/cm2 104 B/K−1a)
235 0.192 -29.0240 0.408 -17.9245 0.736 -13.5250 1.25 -11.8255 1.99 -10.7260 3.02 -10.5265 4.36 -10.4270 6.05 -10.5275 8.00 -9.96280 10.1 -10.6285 12.1 -10.2290 14.0 -10.6295 15.4 -9.54300 16.3 -10.4305 15.9 -7.09310 15.4 -9.73315 13.4 -8.32
Atmos. Chem. Phys., 8, 4141–4496, 2008 www.atmos-chem-phys.net/8/4141/2008/

R. Atkinson et al.: Evaluated kinetic and photochemical data for atmospheric chemistry 4427
Wavelength 1020 σ (298 K)/cm2 104 B/K−1(a)
320 11.7 -7.71325 9.24 -5.02330 6.51 -3.03335 4.76 -2.83340 2.84 -2.84345 1.52 14.0350 0.711 37.3355 0.148 68.1360 0.036 75.8365 0.012 52.9370 0.003 63.1
(a) lnσ (T ) = ln σ (298 K) + B(T -298)
Quantum yield for CF2ClCHO
No recommendation.
Comments on Preferred Values
The preferred values for the cross-sections are those reported by Rattigan et al. (1998). There are no data on the quantumyields but, by analogy with acetaldehyde which shows a similar absorption spectrum, photodissociation is expected to bepredominantly by channel (1).
References
Rattigan, O. V., Wild, O. and Cox, R. A.: J. Photochem. Photobiol. A: Chem., 112, 1, 1998.
www.atmos-chem-phys.net/8/4141/2008/ Atmos. Chem. Phys., 8, 4141–4496, 2008

4428 R. Atkinson et al.: Evaluated kinetic and photochemical data for atmospheric chemistry
IV.A2.240
CFCl2CHO + hν→ products
Primary photochemical processes
Reaction 1H ◦/kJ mol−1 λ threshold/nm
CFCl2CHO + hν → CFCl2 + HCO (1)→ CFCl2CO + H (2)→ CHFCl2 + CO (3)
Absorption cross-section data
Wavelength range/nm References Comments
235-370 Rattigan et al., 1998 (a)
Quantum yield data
There are no reported quantum yield data.
Comments
(a) Absorption cross-sections were measured using a dual-beam diode array spectrometer over the temperature range 243–298 K. The UV spectrum of difluorochloroacetaldehyde shows a broad band, centered at 300 nm and extending out to 365nm. Values ofσ were given at 5 nm intervals at 298 K together with values of B in the expression lnσ (T ) = ln σ (298 K)+ B(T -298).
Preferred Values
Absorption cross-sections for CFCl2CHO at 298 K and their temperature dependence
Wavelength 1020 σ (298 K)/cm2 104 B/K−1(a)
235 0.402 136.0240 0.502 87.0245 1.080 30.6250 1.597 6.41255 2.391 1.24260 3.483 -6.12265 4.869 -7.55270 6.527 -8.11275 8.351 -8.28280 10.1 -8.04285 11.8 -7.82290 13.0 -6.89295 13.7 -6.41
Atmos. Chem. Phys., 8, 4141–4496, 2008 www.atmos-chem-phys.net/8/4141/2008/

R. Atkinson et al.: Evaluated kinetic and photochemical data for atmospheric chemistry 4429
Wavelength 1020 σ (298 K)/cm2 104 B/K−1(a)
300 13.6 -4.50305 12.9 -2.93310 11.6 1.73315 9.80 2.70320 7.93 6.97325 5.61 12.2330 3.89 15.6335 2.46 24.6340 1.26 36.5345 0.628 58.1350 0.254 84.9355 0.052 92.8360 0.017 93.2365 0.007 103.2370 0.002 138.3
(a) lnσ (T ) = ln σ (298 K) + B(T -298)
Quantum yield for CFCl 2CHO
No recommendation.
Comments on Preferred Values
The preferred values for the cross-sections are those reported by Rattigan et al. (1998). There are no data on the quantumyields but, by analogy with acetaldehyde which shows a similar absorption spectrum, photodissociation is expected to bepredominantly by channel (1).
References
Rattigan, O. V., Wild, O. and Cox, R. A.: J. Photochem. Photobiol. A: Chem., 112, 1, 1998.
www.atmos-chem-phys.net/8/4141/2008/ Atmos. Chem. Phys., 8, 4141–4496, 2008

4430 R. Atkinson et al.: Evaluated kinetic and photochemical data for atmospheric chemistry
IV.A2.241
CCl3CHO + hν→ products
Primary photochemical processes
Reaction 1H ◦/kJ mol−1 λ threshold/nm
CCl3CHO + hν → CCl3 + HCO (1)→ CCl3CO + H (2)→ CHCl3 + CO (3)→ CCl2CHO + Cl (4)
Absorption cross-section data
Wavelength range/nm References Comments
200-340 Rattigan et al., 1993 (a)200-370 Rattigan et al., 1998 (b)200-345 Talukdar et al., 2001 (c)
Quantum yield data
Measurement Wavelength/nm Reference Comments
8[H] = 0.04± 0.005 193 Talukdar et al., 2001 (d)8[O(3P)] <0.02 2488[H] <0.01 2488[O(3P)] <0.01 3088[H] <0.002 3088[Cl] = 1.3± 0.3 3088[-CCl3CHO] = 1.00± 0.05 290-400 Wenger et al., 2004 (e)
Comments
(a) Absolute absorption cross-sections were measured using a dual-beam diode array spectrometer over the temperature range240–300 K. The UV spectrum of trichloroacetaldehyde shows a broad band, centered at 290 nm and extending out to 360nm. Values ofσ were given at 5 nm intervals at 296 K and 243 K. A second absorption band appears at<230 nm.
(b) Absolute absorption cross-sections were measured using a dual-beam diode array spectrometer over the temperature range243–298 K. Values ofσ were given at 5 nm intervals at 298 K together with the values of B in the expression lnσ (T ) =ln σ (298 K) + B(T -298).
(c) Absolute absorption cross-sections were measured using a diode array spectrometer over the temperature range 240–360K. Values ofσ were listed at 298 K at 2 nm intervals, together with the values of B in the expression lnσ (T ) = ln σ (298K) + B(T -298).
(d) Determined from pulsed laser photolysis of CCl3CHO with detection of H, O(3P) and Cl atoms by resonance fluorescence.Experiments were carried out at 298± 2 K, and the H, O(3P) and Cl atom signals were placed on an absolute basis by useof photolysis of HBr (193 nm) or CH3SH (248 and 308 nm) as reference compounds for H atom formation, photolysis ofO3 in the presence of N2 at 248 and 308 nm as a reference compound for production of O(3P) atoms, and photolysis of Cl2at 308 nm as a reference compound for production of Cl atoms. Because Cl atoms react with CCl3CHO, their yield wasobtained by extrapolation to zero time. Cl atom formation was shown to be a primary process. Photolysis of CCl3CHOat 248 nm in the presence of O2 led to the formation of CO and C(O)Cl2, with no formation of CHCl3 (thereby ruling outthe occurrence of channel (3) at 248 nm).
Atmos. Chem. Phys., 8, 4141–4496, 2008 www.atmos-chem-phys.net/8/4141/2008/

R. Atkinson et al.: Evaluated kinetic and photochemical data for atmospheric chemistry 4431
(e) Determined from the photolysis of CCl3CHO in the∼200 m3 volume EUPHORE chamber under natural sunlight condi-tions at 298± 5 K. Cyclohexane was added to scavenge Cl atoms and SF6 was added to monitor dilution and loss throughleakage. CCl3CHO was monitored by FTIR spectroscopy and GC. The formation yield of Cl atoms was obtained from theamounts of cyclohexane consumed during the photolyses. The measured decay rates of CCl3CHO, corrected for dilution,were compared to the calculated decay rates for a photodissociation quantum yield of 1.00.
Preferred Values
Absorption cross-sections of CCl3CHO at 298 K and their temperature dependence
Wavelength 1020 σ (298 K)/cm2 104 B/K−1(a)
200 186.9 22.0202 152.5 23.9204 121.8 27.2206 95.7 30.6208 73.8 34.1210 56.3 37.5212 42.6 40.9214 31.8 44.0216 23.8 47.2218 17.7 50.2220 13.1 52.9222 9.75 55.6224 7.24 57.6226 5.39 59.0228 4.06 60.4230 3.07 60.5232 2.39 59.5234 1.90 55.9236 1.62 49.2238 1.43 41.6240 1.39 33.0242 1.41 24.0244 1.53 16.4246 1.66 10.4248 1.91 6.50250 2.18 3.73252 2.54 1.50254 2.92 0.324256 3.36 -0.569258 3.84 -0.877260 4.35 -1.23262 4.90 -1.65264 5.48 -1.62266 6.07 -1.50268 6.68 -1.41270 7.28 -1.22272 7.88 -1.07274 8.46 -0.931276 8.99 -0.584278 9.49 -0.412280 9.94 -0.481282 10.3 -0.235284 10.6 0.242286 10.8 0.475288 10.9 0.750290 10.9 1.09292 10.8 1.51294 10.6 1.96296 10.3 2.38298 9.92 2.71
www.atmos-chem-phys.net/8/4141/2008/ Atmos. Chem. Phys., 8, 4141–4496, 2008

4432 R. Atkinson et al.: Evaluated kinetic and photochemical data for atmospheric chemistry
Wavelength 1020 σ (298 K)/cm2 104 B/K−1(a)
300 9.25 3.07302 8.77 3.60304 8.17 4.37306 7.50 5.25308 6.86 6.10310 6.18 6.91312 5.58 7.90314 4.98 9.30316 4.33 11.2318 3.68 13.2320 3.09 15.1322 2.51 16.7324 2.09 18.5326 1.76 21.1328 1.43 25.0330 1.12 30.3332 0.849 36.6334 0.590 43.3336 0.373 49.8338 0.261 55.6340 0.188 60.2342 0.136 65.0344 0.100 69.0
(a) lnσ (T ) = ln σ (298 K) + B(T -298)
Quantum yield for CCl 3CHO
8(4) = 1.0 over the wavelength range 290–400 nm.
Comments on Preferred Values
The preferred values for the cross-sections are those reported by Talukdar et al. (2001), which are in excellent agreement withthe earlier data of Rattigan et al. (1998) except at 230–250 nm where the Rattigan et al. (1998) cross-sections are somewhatlower. The preferred quantum yield is based on the studies of Talukdar et al. (2001) at 308 nm and of Wenger et al. (2004)using natural sunlight photolysis over the wavelength region 290–400 nm. Wenger et al. (2004) observed the formation ofC(O)Cl2, CO and Cl atoms from the photolysis of CCl3CHO at 290–400 nm, with molar yields of 0.83± 0.04, 1.01± 0.05 and1.18± 0.06, respectively, which when combined with the data of Talukdar et al. (2001) indicates that the dominant primaryprocess atλ > 290 nm is to form Cl + CCl2CHO [channel (4)].
References
Rattigan, O. V., Wild, O. and Cox, R. A.: J. Photochem. Photobiol. A: Chem., 112, 1, 1998.Rattigan, O. V., Wild, O., Jones, R. L. and Cox, R. A.: J. Photochem. Photobiol. A: Chem., 73, 1 1993.Talukdar, R. K., Mellouki, A., Burkholder, J. B., Gilles, M. K., Le Bras, G. and Ravishankara, A. R.: J. Phys. Chem. A, 105,5188, 2001.Wenger, J. C., Le Calv, S., Sidebottom, H. W., Wirtz, K., Martn Reviejo, M. and Franklin, J. A.: Environ. Sci. Technol., 38,831, 2004.
Atmos. Chem. Phys., 8, 4141–4496, 2008 www.atmos-chem-phys.net/8/4141/2008/

R. Atkinson et al.: Evaluated kinetic and photochemical data for atmospheric chemistry 4433
IV.A2.242
CF3C(O)Cl + hν→ products
Primary photochemical processes
Reaction 1H ◦/kJ mol−1 λ threshold/nm
CF3C(O)Cl + hν → CF3 + ClCO (1)→ CF3CO + Cl (2)
Absorption cross-section data
Wavelength range/nm References Comments
200-330 Meller and Moortgat, 1997 (a)
Quantum yield data
Measurement Wavelength/nm Reference Comments
81 + 82 = 0.95± 0.05 254 Meller and Moortgat, 1997 (b)81 + 82 = 1.01± 0.11 193 Maricq and Szente, 1995 (c)81 + 82 = 1.01± 0.11 24881 + 82 = 0.98± 0.13 254-280 Weibel et al., 1995 (d)
Comments
(a) Absolute absorption cross-sections were measured using a diode array spectrometer over the temperature range 223–298K. The UV spectrum of trifluoroacetyl chloride shows two overlapping bands, the first having a maximum at 255 nm (σ
= 6.87× 10⁻¹⁹ cm2 molecule−1), and the second atλ < 200 nm. There is significant absorption at wavelengths> 300nm, where the cross-sections become increasingly temperature dependent. The estimated overall errors in the values ofσ
were± 3% over the wavelength range 200–310 nm, increasing to± 20% for longer wavelengths where the cross-sections(and hence absorptions) are low. Values ofσ were presented at 2 nm intervals at 223 K, 248 K, 273 K and 298 K. Themeasured absorption cross-sections were fit to the equation lnσ (λ, T ) = A0 + A1λ + A2λ
2 + A3λ3 + A4λ
4 + (B0 + B1λ +B2λ
2 + B3λ3 + B4λ
4)(T - 273), with the following values which fit the measurements to within 3% throughout most ofthe spectrum, but with larger errors in the range 220–230 nm (up to 6% error) and at>300 nm (up to 20% error at 330 nm):
λ = 200-220 nm λ = 218-330 nm
A0 -2.0111750× 10⁴ -8.8912918× 101
A1 3.1757333× 10² 9.6418661× 10⁻¹
A2 -2.5671017 -5.4370794× 10⁻³
A3 7.8520098× 10⁻³ 1.4975946× 10⁻⁵
A4 -8.9707718× 10⁻⁶ -1.6768324× 10⁻⁷
B0 3.0306320× 10² 3.7950580B1 -5.8082356 -5.9114731× 10⁻²
B2 4.1715164× 10⁻² 3.4406419× 10⁻⁴
B3 -1.3306565× 10⁻⁴ -8.8699856× 10⁻⁷
B4 1.5906451× 10⁻⁷ 8.5483894× 10⁻¹⁰
www.atmos-chem-phys.net/8/4141/2008/ Atmos. Chem. Phys., 8, 4141–4496, 2008

4434 R. Atkinson et al.: Evaluated kinetic and photochemical data for atmospheric chemistry
(b) Average of measurements of the overall loss of CF3C(O)Cl during photolysis in N2. Measurements of the photodissoci-ation quantum yield of CF3C(O)Cl in air at total pressures of 67–1013 mbar showed no effect of total pressure or of thepresence of O2.
(c) Pulsed laser photolysis of CF3C(O)Cl-C2H6-O2-N2 mixtures at a total pressure of 160 mbar, with detection of CF3O2radicals by time-resolved UV spectroscopy and of HCl by IR spectroscopy. CF3O2 radicals were formed from CF3radicals and HCl was formed from Cl + C2H6→ HCl + C2H5. The system was calibrated by photolysis of CH3Cl at 193nm and of Cl2 at 248 nm instead of CF3C(O)Cl, with the assumption that the photodissociation quantum yields of CH3Cland Cl2 are unity.
(d) Quantum yields derived from the amounts of C2F6 and CF3Cl formed from irradiating CF3C(O)Cl at 254 and 280 nm(high pressure mercury arc-monochromator combination). Actinometry was performed with potassium ferrioxalate solu-tion. It was observed that (2[C2F6] + [CF3Cl])/[CO] = 0.99± 0.05, consistent with formation of CF3 radicals, Cl atomsand CO followed by the combination reactions CF3 + CF3→ C2F6 and CF3 + Cl→ CF3Cl. Hence8(-CF3Cl(O)Cl) =28(C2F6) + 8(CF3Cl).
Preferred Values
Absorption cross-sections of CF3COCl at 298 K and their temperature dependence
λ/nm 1020 σ /cm2 1020 σ /cm2
298 K 223 K
200 50.16 45.83202 30.47 26.56204 17.70 14.63206 9.960 7.830208 5.567 4.197210 3.274 2.461212 2.102 1.662214 1.620 1.361216 1.442 1.343218 1.484 1.421220 1.665 1.641222 1.896 1.845224 2.201 2.184226 2.544 2.538228 2.904 2.901230 3.278 3.261232 3.685 3.646234 4.080 4.025236 4.505 4.456238 4.902 4.852240 5.283 5.223242 5.629 5.553
Atmos. Chem. Phys., 8, 4141–4496, 2008 www.atmos-chem-phys.net/8/4141/2008/

R. Atkinson et al.: Evaluated kinetic and photochemical data for atmospheric chemistry 4435
λ/nm 1020 σ /cm2 1020 σ /cm2
298 K 223 K
244 5.957 5.900246 6.271 6.177248 6.503 6.411250 6.694 6.577252 6.799 6.679254 6.863 6.712256 6.858 6.674258 6.786 6.586260 6.599 6.383262 6.393 6.148264 6.159 5.875266 5.859 5.567268 5.510 5.219270 5.120 4.814272 4.726 4.396274 4.306 3.965276 3.876 3.564278 3.444 3.133280 3.035 2.724282 2.630 2.304284 2.253 1.931286 1.907 1.619288 1.593 1.334290 1.324 1.090292 1.082 0.8672294 0.8670 0.6739296 0.6811 0.5117298 0.5282 0.3977300 0.4038 0.2978302 0.3035 0.2178304 0.2214 0.1520306 0.1580 0.1018308 0.1087 0.0642310 0.0722 0.0376312 0.0472 0.0211314 0.0301 0.0115316 0.0189 0.0061318 0.0123 0.0033320 0.0084 0.0019322 0.0057324 0.0037326 0.0025328 0.0017
Quantum yield for CF3COCl
81 + 82 = 1.0 over the wavelength range 200–325 nm.
www.atmos-chem-phys.net/8/4141/2008/ Atmos. Chem. Phys., 8, 4141–4496, 2008

4436 R. Atkinson et al.: Evaluated kinetic and photochemical data for atmospheric chemistry
Comments on Preferred Values
The data of Meller and Moortgat (1997) are in good agreement with the earlier results of Rattigan et al. (1993) and Jemi-Alade et al. (1991), except in the region of minimum absorption near 220 nm. The preferred values for the cross-sectionsare those reported by Meller and Moortgat (1997). The quantum yield is based on the measurements of Meller and Moortgat(1997), Marciq and Szente (1995) and Weibel et al. (1995). Maricq and Szente (1995) concluded that at 193 and 248 nmphotolysis proceeds via channel (1), with the CF3CO radical dissociating totally at 193 nm and∼ 86% of the time at 248 nm.This interpretation (Maricq and Szente, 1995) is reasonably consistent with the product data of Weibel et al. (1995) for thewavelength range 254–280 nm and of Malanca et al. (1997, 1998) at 254 nm.
References
Jemi-Alade, A. A., Lightfoot, P. D. and Lesclaux, R.: Chem. Phys. Lett., 179, 119, 1991.Malanca, F. E., Arguello, G. A. and Staricco, E. H.: J. Photochem. Photobiol. A: Chem., 103, 19, 1997.Malanca, F. E., Arguello, G. A., Staricco, E. H. and Wayne, R. P.: J. Photochem. Photobiol. A: Chem., 117, 163, 1998.Maricq, M. M. and Szente, J. J.: J. Phys. Chem., 99, 4554, 1995.Meller, R. and Moortgat, G. K.: J. Photochem. Photobiol. A: Chem., 108, 105, 1997.Rattigan, O. V., Wild, O., Jones, R. L. and Cox, R. A.: J. Photochem. Photobiol. A: Chem., 73, 1, 1993.Weibel, D. E., Arguello, G. A., de Staricco, E. R. and Staricco, E. H.: J. Photochem. Photobiol. A: Chem., 86, 27, 1995.
Atmos. Chem. Phys., 8, 4141–4496, 2008 www.atmos-chem-phys.net/8/4141/2008/

R. Atkinson et al.: Evaluated kinetic and photochemical data for atmospheric chemistry 4437
Appendix 3: BrOx Reactions
IV.A3.243
HO + CH3Br → H2O + CH2Br
1H ◦ = -71.9 kJ·mol−1
Rate coefficient data
k/cm3 molecule−1 s−1 Temp./K Reference Technique/Comments
Absolute Rate Coefficients(3.5± 0.8)× 10−14 296± 2 Howard and Evenson, 1976 DF-LMR7.93× 10−13 exp[-(889± 59)/T ] 244-350 Davis et al., 1976 FP-RF(4.14± 0.43)× 10−14 2982.35× 10−12 exp[-(1300± 150)/T ] 233-379 Mellouki et al., 1992 PLP-LIF(2.96± 0.36)× 10−14 2985.79× 10−12 exp[-(1560± 150)/T ] 250-400 Zhang et al., 1992 FP-RF(3.08± 0.47)× 10−14 2981.86× 10−12 exp[-(1230± 150)/T ] 248-390 Chichinin et al., 1994 DF-EPR(3.03± 0.45)× 10−14 298
Relative Rate Coefficients5.43× 10−18 T 2 exp[-(812± 46)/T ] 298-360 Hsu and Demore, 1994 RR (a)3.16× 10⁻¹⁴ 298
Comments
(a) HO radicals were generated from the UV photolysis of O3 in the presence of water vapor, in O3-H2O-CH3Br-CH3CHF2-O2-N2 mixtures. The concentrations of CH3Br and CH3CHF2 were measured by FTIR spectroscopy. The measured ratecoefficient ratio ofk(HO + CH3Br)/k(HO + CH3CHF2) = (1.94± 0.28) exp[-(232± 46)/T ] is placed on an absolute basisby use of a rate coefficient ofk(HO + CH3CHF2) = 2.80× 10⁻¹⁸ T 2 exp(-580/T ) cm3 molecule−1 s−1 (IUPAC, currentrecommendation).
Preferred Values
k = 2.9× 10⁻¹⁴ cm3 molecule−1 s−1 at 298 K.k = 1.7× 10⁻¹² exp(-1215/T ) cm3 molecule−1 s−1 over the temperature range 240-300 K.
Reliability
1 log k =± 0.08 at 298 K.1 (E/R) =± 150 K.
Comments on Preferred Values
The recent absolute rate coefficient measurements of Mellouki et al. (1992), Zhang et al. (1992) and Chichinin et al. (1994),which are in excellent agreement, are significantly lower than those previously determined by Howard and Evenson (1976)and Davis et al. (1976). The relative rate coefficients of Hsu and DeMore (1994) are also in excellent agreement with theabsolute rate coefficients of Mellouki et al. (1992), Zhang et al. (1992) and Chichinin et al. (1994). A unit-weighted least-squares analysis of the rate coefficients of Mellouki et al. (1992), Zhang et al. (1992) and Chichinin et al. (1992), using the
www.atmos-chem-phys.net/8/4141/2008/ Atmos. Chem. Phys., 8, 4141–4496, 2008

4438 R. Atkinson et al.: Evaluated kinetic and photochemical data for atmospheric chemistry
three parameter expressionk = CT 2 exp(-D/T ), leads tok = 3.44× 10⁻¹⁸ T 2 exp(-687 /T ) cm3 molecule−1 s−1 over thetemperature range 233–400 K. The preferred Arrhenius expression,k = A exp(-B/T ), is centered on a mid-range temperature,Tm, of 265 K and is derived from three parameter expression withA = C e2 T 2
m andB = D + 2Tm.
References
Chichinin, A., Teton, S., Le Bras, G. and Poulet, G.: J. Atmos. Chem. 18, 239, 1994.Davis, D. D., Machado, G., Conaway, B. C., Oh, Y. and Watson, R. T.: J. Chem. Phys., 65, 1268, 1976.Howard, C. J. and Evenson, K. M.: J. Chem. Phys., 64, 197, 1976.Hsu, K.-J. and DeMore, W. B.: Geophys. Res. Lett., 21, 805, 1994.Mellouki, A., Talukdar, R. K., Schmoltner, A.-M., Gierczak, T., Mills, M. J., Solomon, S. and Ravishankara, A. R.: Geophys.Res. Lett., 19, 2059, 1992.Zhang, Z., Saini, R. D., Kurylo, M. J. and Huie, R. E.: Geophys. Res. Lett., 19, 2413, 1992.
Atmos. Chem. Phys., 8, 4141–4496, 2008 www.atmos-chem-phys.net/8/4141/2008/

R. Atkinson et al.: Evaluated kinetic and photochemical data for atmospheric chemistry 4439
IV.A3.244
HO + CH2Br2→ H2O + CHBr 2
1H ◦ = -79.6 kJ·mol−1
Rate coefficient data
k/cm3 molecule−1 s−1 Temp./K Reference Technique/Comments
Absolute Rate Coefficients1.91× 10−12 exp[-(840± 100)/T ] 243-380 Mellouki et al., 1992 PLP-LIF(1.13± 0.15)× 10−13 2981.51× 10−12 exp[-(720± 60)/T ] 288-368 Zhang et al., 1997 DF-RF(1.33± 0.14)× 10−13
Relative Rate Coefficients(9.7± 0.6)× 10−14 298 Orlando et al., 1996 RR (a)1.51× 10⁻¹² exp[-(715± 39)/T ] 293-375 DeMore, 1996 RR (b)1.37× 10⁻¹³ 298
Comments
(a) HO radicals were generated by the photolysis of O3 in the presence of H2O, and acetone was used as the reference com-pound. CH2Br2 and acetone were monitored by FTIR spectroscopy, and a rate coefficient ratio ofk(HO + CH2Br2)/k(HO+ acetone) = 0.54± 0.03 was determined. This rate coefficient ratio is placed on an absolute basis by use of a ratecoefficient ofk(HO + acetone) = 1.8× 10⁻¹³ cm3 molecule−1 s−1 at 298 K (IUPAC, current recommendation).
(b) HO radicals were generated by the photolysis of O3 at 254 nm in the presence of H2O, and CH2Cl2 was used as thereference compound. CH2Br2 and CH2Cl2 were monitored by FTIR spectroscopy, and a rate coefficient ratio ofk(HO +CH2Br2)/k(HO + CH2Cl2) = 0.84 exp[(145± 39)/T ] was determined. This rate coefficient ratio is placed on an absolutebasis by use of a rate coefficient ofk(HO + CH2Cl2) = 1.8× 10⁻¹² exp(-860/T ) cm3 molecule−1 s−1 (IUPAC, currentrecommendation).
Preferred Values
k = 1.1× 10⁻¹³ cm3 molecule−1 s−1 at 298 K.k = 1.5× 10⁻¹² exp(-775/T ) cm3 molecule−1 s−1 over the temperature range 240-300 K.
Reliability
1 log k =± 0.15 at 298 K.1 (E/R) =± 200 K.
Comments on Preferred Values
The room temperature rate coefficients of Mellouki et al. (1992), Orlando et al. (1996), DeMore (1996) and Zhang et al.(1997) range from 9.7× 10⁻¹⁴ cm3 molecule−1 s−1 to 1.43× 10⁻¹³ cm3 molecule−1 s−1. The relative rate coefficients ofDeMore (1996) and the absolute rate coefficients of Zhang et al. (1997), obtained over the temperature range∼290–370 K, aresystematically higher than the absolute rate data of Mellouki et al. (1992), by∼20% at 290 K and∼10% at 370 K. Because theMellouki et al. (1992) study included measurements down to significantly lower temperatures than did the other studies, andtheir room temperature rate coefficient is in between those of Orlando et al. (1996), DeMore (1996) and Zhang et al. (1997),
www.atmos-chem-phys.net/8/4141/2008/ Atmos. Chem. Phys., 8, 4141–4496, 2008

4440 R. Atkinson et al.: Evaluated kinetic and photochemical data for atmospheric chemistry
the Mellouki et al. (1992) study is used as the basis for the preferred values. While an Arrhenius plot of the Mellouki et al.(1992) data shows little evidence for curvature, the absolute rate coefficients of Mellouki et al. (1992) have been fitted to thethree-parameter expressionk = CT 2 exp(-D/T ), resulting in k = 2.86× 10⁻¹⁸ T 2 exp(-246/T ) cm3 molecule−1 s−1 over thetemperature range 243–380 K. The preferred Arrhenius expression,k = A exp(B/T ), is centered on a mid-range temperature,Tm, of 265 K and is derived from three parameter expression withA = C e2 T 2
m andB = D + 2Tm.
References
DeMore, W. B.: J. Phys. Chem., 100, 5813, 1996.IUPAC: http://www.iupac-kinetic.ch.cam.ac.uk/, 2007.Mellouki, A., Talukdar, R. K., Schmoltner, A.-M., Gierczak, T., Mills, M. J., Solomon, S. and Ravishankara, A. R.: Geophys.Res. Lett., 19, 2059, 1992.Orlando, J. J., Tyndall, G. S., Wallington, T. J. and Dill, M.: Int. J. Chem. Kinet., 28, 433, 1996.Zhang, Z., Zhong, J. and Qiu, L.: J. Atmos. Chem., 27, 209, 1997.
Atmos. Chem. Phys., 8, 4141–4496, 2008 www.atmos-chem-phys.net/8/4141/2008/

R. Atkinson et al.: Evaluated kinetic and photochemical data for atmospheric chemistry 4441
IV.A3.245
HO + CHF2Br → H2O + CF2Br
Rate coefficient data
k/cm3 molecule−1 s−1 Temp./K Reference Technique/Comments
Absolute Rate Coefficients4.4× 10−13 exp[-(1050± 400)/T ] 275-420 Brown et al., 1990 DF-RF(1.3± 0.3)× 10−14 2987.4× 10−13 exp[-(1300± 100)/T ] 233-432 Talukdar et al., 1991 PLP-LIF/DF-LMR(1.06± 0.08)× 10−14 2989.3× 10−13 exp[-(1326± 33)/T ] 298-460 Orkin and Khamaganov, 1993 DF-EPR(1.10± 0.09)× 10−14 298
Relative Rate Coefficients6.11× 10−21 T 2.82 exp[-(527± 31)/T ] 283-368 Hsu and DeMore, 1995 RR (a)9.9× 10⁻¹⁵ 298
Comments
(a) HO radicals were generated by the UV photolysis of O3 in the presence of water vapor in O3-H2O-CHF2Br-CH4-O2-N2mixtures. The concentrations of CHF2Br and CH4 were measured by FTIR spectroscopy. The measured rate coefficientratio ofk(HO + CHF2Br)/k(HO + CH4) = (0.33± 0.03) exp[(460± 31)/T ] is placed on an absolute basis by using a ratecoefficient ofk(HO + CH4) = 1.85× 10⁻²⁰ T 2.82 exp(-987/T ) cm3 molecule−1 s−1 (IUPAC, current recommendation).
Preferred Values
k = 1.0× 10⁻¹⁴ cm3 molecule−1 s−1 at 298 K.k = 7.9× 10⁻¹³ exp(-1300/T ) cm3 molecule−1 s−1 over the temperature range 230-360 K.
Reliability
1 log k =± 0.10 at 298 K.1 (E/R) =± 150 K.
Comments on Preferred Values
The absolute coefficients of Talukdar et al. (1991) and Orkin and Khamaganov (1993), and the relative rate data of Hsu andDeMore (1995) are in excellent agreement at 298 K. The absolute rate coefficients of Brown et al. (1990) are significantlyhigher and are not used in the evaluation. Above room temperature, the absolute rate coefficients of Talukdar et al. (1991) arelower than those of Orkin and Khamaganov (1993): at 430 K the rate coefficient of Talukdar et al. (1991) is 20% lower thanthat of Orkin and Khamaganov (1993). The data of Hsu and DeMore (1995) display a slightly higher temperature dependencethan those observed in the absolute rate studies at temperatures up to 370 K.
The preferred 298 K rate coefficient is the mean of the absolute rate coefficients of Talukdar et al. (1991), Orkin andKhamaganov (1993) and the relative rate coefficient Hsu and DeMore (1995). The temperature dependence is that measuredby Talukdar et al. (1991), with the pre-exponential factor adjusted to fit the 298 K preferred value.
www.atmos-chem-phys.net/8/4141/2008/ Atmos. Chem. Phys., 8, 4141–4496, 2008

4442 R. Atkinson et al.: Evaluated kinetic and photochemical data for atmospheric chemistry
References
Brown, A. C., Canosa-Mas, C. E., Parr, A. D., Rothwell, K. and Wayne, R. P.: Nature 347, 541, 1990.Hsu, K.-J. and DeMore, W. B.: J. Phys. Chem. 99, 1235, 1995.IUPAC: http://www.iupac-kinetic.ch.cam.ac.uk/, 2007.Orkin, V. L. and Khamaganov, V. G.: J. Atmos. Chem. 16, 169, 1993.Talukdar, R., Mellouki, A., Gierczak, T., Burkholder, J. B., McKeen, S. A. and Ravishankara, A. R.: Science 252, 693, 1991.
Atmos. Chem. Phys., 8, 4141–4496, 2008 www.atmos-chem-phys.net/8/4141/2008/

R. Atkinson et al.: Evaluated kinetic and photochemical data for atmospheric chemistry 4443
IV.A3.246
HO + CF3Br → products
Rate coefficient data
k/cm3 molecule−1 s−1 Temp./K Reference Technique/Comments
Absolute Rate Coefficients<1.2× 10⁻¹⁶ 298 Burkholder et al., 1991 DF-LMR/PLP-LIF<2.0× 10−17 298 Orkin and Khamaganov, 1993 DF-EPR<4.0× 10⁻¹⁶ 460
Preferred Values
k < 6.0× 10⁻¹⁸ cm3 molecule−1 s−1 at 298 K.k < 1.0× 10⁻¹² exp(-3600/T ) cm3 molecule−1 s−1 over the temperature range 250-460 K.
Comments on Preferred Values
Only upper limits to the rate coefficients were observed in the studies of Burkholder et al. (1991) and Orkin and Khamaganov(1993). TheA-factor for the reaction was estimated to be∼1 × 10⁻¹² cm3 molecule−1 s−1. The lower limit forE/R wasestimated to be>3600 K based on the upper limit value of the rate coefficient determined by Orkin and Khamaganov (1993)at 460 K. The upper limit for the rate coefficient at 298 K is obtained using these parameters.
References
Burkholder, J. B., Wilson, R. R., Gierczak, T., Talukdar, R., McKeen, S. A., Orlando, J. J., Vaghjiani, G. L. and Ravishankara,A. R.: J. Geophys. Res. 96, 5025, 1991.Orkin, V. L. and Khamaganov, V. G.: J. Atmos. Chem. 16, 169, 1993.
www.atmos-chem-phys.net/8/4141/2008/ Atmos. Chem. Phys., 8, 4141–4496, 2008

4444 R. Atkinson et al.: Evaluated kinetic and photochemical data for atmospheric chemistry
IV.A3.247
HO + CF2ClBr → products
Rate coefficient data
k/cm3 molecule−1 s−1 Temp./K Reference Technique/Comments
Absolute Rate Coefficients<1× 10⁻¹⁵ 293 Clyne and Holt, 1979 DF-RF<2× 10⁻¹⁶ 293 Burkholder et al., 1991 DF-LMR<9× 10⁻¹⁷ 297 PLP-LIF<7× 10⁻¹⁷ 373 PLP-LIF<2× 10⁻¹⁶ 424 DF-LMR
Preferred Values
k < 1× 10⁻¹⁷ cm3 molecule−1 s−1 at 298 K.k < 1× 10⁻¹² exp(-3450/T ) cm3 molecule−1 s−1 over the temperature range 250-380 K.
Comments on Preferred Values
The studies of Clyne and Holt (1979) and Burkholder et al. (1991) both observed no reaction of HO radicals with CF2ClBr.The preferred upper limit Arrhenius expression is obtained from an assumed Arrhenius pre-exponential factor of 1× 10⁻¹²
cm3 molecule−1 s−1 and the upper limit rate coefficient at 373 K measured by Burkholder et al. (1991). The resulting upperlimit Arrhenius expression yields a 298 K upper limit rate coefficient which is consistent with the room temperature data ofClyne and Holt (1979) and Burkholder et al. (1991).
References
Burkholder, J. B., Wilson, R. R., Gierczak, T., Talukdar, R., McKeen, S. A., Orlando, J. J., Vaghjiani, G. L. and Ravishankara,A. R.: J. Geophys. Res., 96, 5025, 1991.Clyne, M. A. A. and Holt, P. M.: J. Chem. Soc. Faraday Trans. 2, 75, 569, 1979.
Atmos. Chem. Phys., 8, 4141–4496, 2008 www.atmos-chem-phys.net/8/4141/2008/
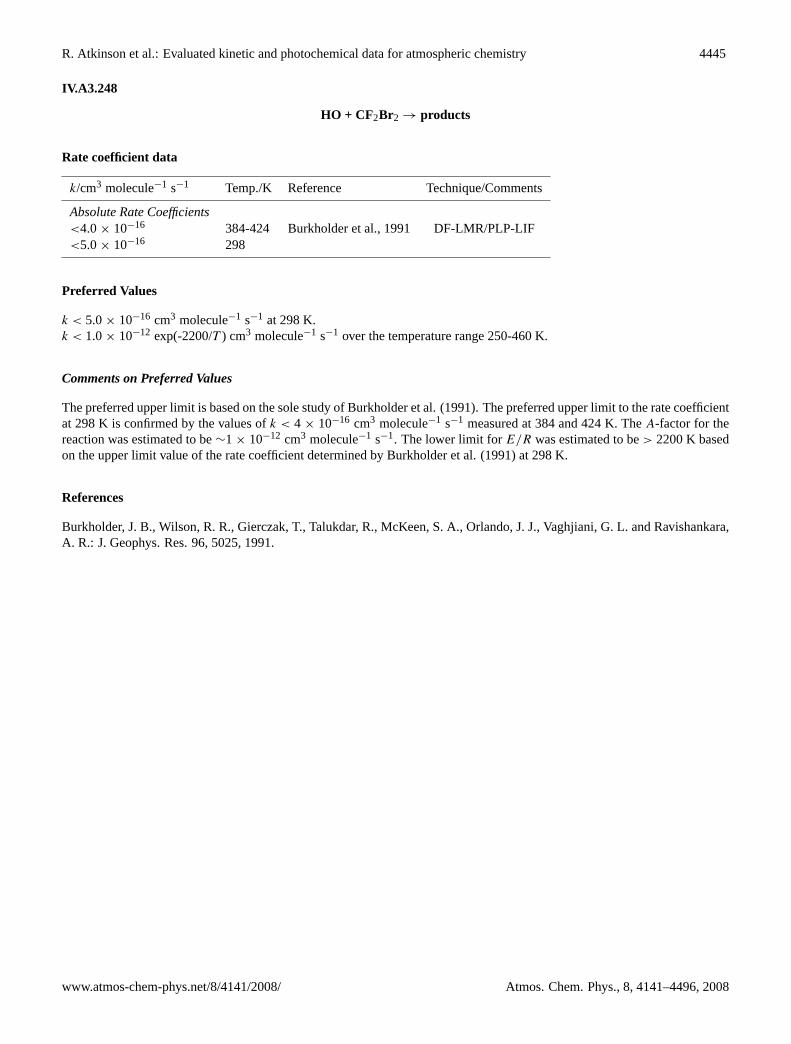
R. Atkinson et al.: Evaluated kinetic and photochemical data for atmospheric chemistry 4445
IV.A3.248
HO + CF2Br2→ products
Rate coefficient data
k/cm3 molecule−1 s−1 Temp./K Reference Technique/Comments
Absolute Rate Coefficients<4.0× 10⁻¹⁶ 384-424 Burkholder et al., 1991 DF-LMR/PLP-LIF<5.0× 10−16 298
Preferred Values
k < 5.0× 10⁻¹⁶ cm3 molecule−1 s−1 at 298 K.k < 1.0× 10⁻¹² exp(-2200/T ) cm3 molecule−1 s−1 over the temperature range 250-460 K.
Comments on Preferred Values
The preferred upper limit is based on the sole study of Burkholder et al. (1991). The preferred upper limit to the rate coefficientat 298 K is confirmed by the values ofk < 4× 10⁻¹⁶ cm3 molecule−1 s−1 measured at 384 and 424 K. TheA-factor for thereaction was estimated to be∼1× 10⁻¹² cm3 molecule−1 s−1. The lower limit forE/R was estimated to be> 2200 K basedon the upper limit value of the rate coefficient determined by Burkholder et al. (1991) at 298 K.
References
Burkholder, J. B., Wilson, R. R., Gierczak, T., Talukdar, R., McKeen, S. A., Orlando, J. J., Vaghjiani, G. L. and Ravishankara,A. R.: J. Geophys. Res. 96, 5025, 1991.
www.atmos-chem-phys.net/8/4141/2008/ Atmos. Chem. Phys., 8, 4141–4496, 2008

4446 R. Atkinson et al.: Evaluated kinetic and photochemical data for atmospheric chemistry
IV.A3.249
HO + CF3CH2Br → H2O + CF3CHBr
Rate coefficient data
k/cm3 molecule−1 s−1 Temp./K Reference Technique/Comments
Absolute Rate Coefficients8.5× 10−13 exp[-(1113± 35)/T ] 298-460 Orkin and Khamaganov, 1993 DF-EPR(2.05± 0.16)× 10−14 2981.39× 10−12 exp[-(1350± 195)/T ] 280-353 Nelson et al., 1993 DF-LIF(1.45± 0.13)× 10−14 294
Preferred Values
k = 1.6× 10⁻¹⁴ cm3 molecule−1 s−1 at 298 K.k = 1.4× 10⁻¹² exp(-1340/T ) cm3 molecule−1 s−1 over the temperature range 280-460 K.
Reliability
1 log k =± 0.2 at 298 K.1 (E/R) =± 300 K.
Comments on Preferred Values
The rate coefficients of Nelson et al. (1993) are∼15-25% lower than those of Orkin and Khamaganov (1993) over the temper-ature range common to both studies (298–353 K). A least-squares analysis of the rate coefficients of Orkin and Khamaganov(1993) and Nelson et al. (1993) yields the preferred Arrhenius expression.
References
Nelson Jr., D. D., Zahniser, M. S. and Kolb, C. E.: Geophys. Res. Lett. 20, 197, 1993.Orkin, V. L. and Khamaganov, V. G.: J. Atmos. Chem. 16, 169, 1993.
Atmos. Chem. Phys., 8, 4141–4496, 2008 www.atmos-chem-phys.net/8/4141/2008/

R. Atkinson et al.: Evaluated kinetic and photochemical data for atmospheric chemistry 4447
IV.A3.250
HO + CF3CHFBr → H2O + CF3CFBr
Rate coefficient data
k/cm3 molecule−1 s−1 Temp./K Reference Technique/Comments
Absolute Rate Coefficients1.13× 10−12 exp[-(1250± 364)/T ] 279-423 Brown et al., 1990 DF-RF(1.7± 0.3)× 10−14 2987.2× 10−13 exp[-(1111± 32)/T ] 298-460 Orkin and Khamaganov, 1993 DF-EPR(1.75± 0.17)× 10−14 298
Preferred Values
k = 1.7× 10⁻¹⁴ cm3 molecule−1 s−1 at 298 K.k = 8.1× 10⁻¹³ exp(-1155/T ) cm3 molecule−1 s−1 over the temperature range 270-460 K.
Reliability
1 log k =± 0.2 at 298 K.1 (E/R) =± 300 K.
Comments on Preferred Values
The absolute rate coefficients of Brown et al. (1990) and Orkin and Khamaganov (1993) are in good agreement. A least-squaresanalysis of the rate coefficients of Brown et al. (1990) and Orkin and Khamaganov (1993) yields the preferred values.
References
Brown, A. C., Canosa-Mas, C. E., Parr, A. D., Rothwell, K. and Wayne, R. P.: Nature 347, 541, 1990.Orkin, V. L. and Khamaganov, V. G.: J. Atmos. Chem. 16, 169, 1993.
www.atmos-chem-phys.net/8/4141/2008/ Atmos. Chem. Phys., 8, 4141–4496, 2008

4448 R. Atkinson et al.: Evaluated kinetic and photochemical data for atmospheric chemistry
IV.A3.251
HO + CF3CHClBr → H2O + CF3CClBr
Rate coefficient data
k/cm3 molecule−1 s−1 Temp./K Reference Technique/Comments
Absolute Rate Coefficients(6.0± 0.4)× 10−14 303 Brown et al., 1989; 1990 DF-RF1.28× 10−12 exp[-(995± 38)/T ] 298-460 Orkin and Khamaganov, 1993 DF-EPR(4.50± 0.40)× 10−14 298
Preferred Values
k = 4.6× 10⁻¹⁴ cm3 molecule−1 s−1 at 298 K.k = 1.2× 10⁻¹² exp(-970/T ) cm3 molecule−1 s−1 over the temperature range 290-460 K.
Reliability
1 log k =± 0.20 at 298 K.1 (E/R) =± 300 K.
Comments on Preferred Values
The rate coefficient of Brown et al. (1989; 1990) at 303 K is∼25% higher than that calculated from the Arrhenius expressionof Orkin and Khamaganov (1993). A least-squares analysis of the rate coefficients of Orkin and Khamaganov (1993) leads tothe preferred Arrhenius expression.
References
Brown, A. C., Canosa-Mas, C. E., Parr, A. D., Pierce, J. M. T. and Wayne, R. P.: Nature, 341, 635, 1989.Brown, A. C., Canosa-Mas, C. E., Parr, A. D. and Wayne, R. P.: Atmos. Environ., 24A, 2499, 1990.Orkin, V. L. and Khamaganov, V. G.: J. Atmos. Chem., 16, 169, 1993.
Atmos. Chem. Phys., 8, 4141–4496, 2008 www.atmos-chem-phys.net/8/4141/2008/

R. Atkinson et al.: Evaluated kinetic and photochemical data for atmospheric chemistry 4449
IV.A3.252
HO + CF2BrCF2Br → products
Rate coefficient data
k/cm3 molecule−1 s−1 Temp./K Reference Technique/Comments
Absolute Rate Coefficients<1.5× 10⁻¹⁶ 298 Burkholder et al., 1991 DF-LMR/PLP-LIF<2.0× 10−17 298 Orkin and Khamaganov, 1993 DF-EPR<4.0× 10⁻¹⁶ 460
Preferred Values
k < 6× 10⁻¹⁸ cm3 molecule−1 s−1 at 298 K.k < 1× 10⁻¹² exp(-3600/T ) cm3 molecule−1 s−1 over the temperature range 250-460 K.
Comments on Preferred Values
Only upper limits to the rate coefficients were observed in the studies of Burkholder et al. (1991) and Orkin and Khamaganov(1993). TheA-factor for the reaction was estimated to be∼1 × 10⁻¹² cm3 molecule−1 s−1. The lower limit forE/R wasestimated to be> 3600 K based on the upper limit value of the rate coefficient determined by Orkin and Khamaganov (1993)at 460 K. The upper limit for the rate coefficient at 298 K is obtained using these parameters.
References
Burkholder, J. B., Wilson, R. R., Gierczak, T., Talukdar, R., McKeen, S. A., Orlando, J. J., Vaghjiani, G. L. and Ravishankara,A. R.: J. Geophys. Res. 96, 5025, 1991.Orkin, V. L. and Khamaganov, V. G.: J. Atmos. Chem. 16, 169, 1993.
www.atmos-chem-phys.net/8/4141/2008/ Atmos. Chem. Phys., 8, 4141–4496, 2008

4450 R. Atkinson et al.: Evaluated kinetic and photochemical data for atmospheric chemistry
IV.A3.253
HO2 + CH2BrO2 → O2 + CH2BrO2H (1)→ O2 + HC(O)Br + H 2O (2)
Rate coefficient data (k = k1 + k2)
k/cm3 molecule−1 s−1 Temp./K Reference Technique/Comments
Absolute Rate Coefficients(6.7± 3.8)× 10−12 298 Villenave and Lesclaux, 1995 FP-UVA (a)
Branching Ratiosk1/k ≥ 0.85 297 Chen et al., 1995 UVP-FTIR (b)k2/k ≤ 0.15
Comments
(a) Flash photolysis of Cl2 in the presence of CH3Br-CH3OH-O2-N2 mixtures at a pressure of 1013 mbar. Decays in transientabsorptions (with contributions from CH2BrO2 and HO2) were recorded in the wavelength range 250 nm to 280 nm.k
derived from simulations of the decay traces using an explicit reaction mechanism.
(b) CH2BrO2 and HO2 radicals were generated from the steady-state photolysis of Cl2 in the presence of CH3Br-H2-airmixtures at 933 mbar. FTIR spectroscopic analysis identified CH2BrO2H and HC(O)Br as carbon-containing primaryproducts. The cited branching ratios were derived by taking account of secondary reactions in the system, and the possi-bility that HC(O)Br is formed from the in-situ oxidation of CH2BrO2H.
Preferred Values
k = 6.7× 10⁻¹² cm3 molecule−1 s−1 at 298 K.k1/k = 1.0 at 298 K.
Reliability
1 log k =± 0.5 at 298 K.1 (k1/k) = +0.00
−0.15 at 298 K.
Comments on Preferred Values
While the above value of the rate coefficient seems reasonable, it has been derived from the analysis of a comparatively complexchemical system and requires independent verification to reduce the recommended error limits. Within the uncertainty of thedetermination (Villenave and Lesclaux, 1995),k is indistinguishable from that recommended for the reactions of HO2 withCH3O2 and CH2ClO2 suggesting that, like Cl, the presence of the Br group has only a minor influence on the rate coefficient.However, the reported dominance of channel (1) (Chen et al., 1995) contrasts with that observed for CH2ClO2, for whichformation of HC(O)Cl, H2O and O2 is the major pathway. Confirmatory product studies are also required.
References
Chen, J., Catoire, V. and Niki, H.: Chem. Phys. Lett. 245, 519, 1995.Villenave, E. and Lesclaux, R.: Chem. Phys. Lett. 236, 376, 1995.
Atmos. Chem. Phys., 8, 4141–4496, 2008 www.atmos-chem-phys.net/8/4141/2008/

R. Atkinson et al.: Evaluated kinetic and photochemical data for atmospheric chemistry 4451
IV.A3.254/255
RO2 + NO→ RO + NO2 (1)
RO2 + NO + M → RONO2 (2)
(254: R = CH2Br; 255: R = CHBr 2)
Rate coefficient data (k = k1 + k2)
k/cm3 molecule−1 s−1 Temp./K Reference Technique/Comments
Absolute Rate CoefficientsR=CH2Br(1.07± 0.11)× 10−11 295 Sehested et al., 1993 PR-AS (a)R=CHBr2(1.74± 0.16)× 10−11 296 Bayes et al., 2005 PLP-RF (b)
Comments
(a) k determined from +d[NO2]/dt at a total pressure of 1 bar.
(b) Photolysis of CHBr3 in the presence of O2 and NO at 2.7–13 mbar.k was obtained from the formation kinetics ofsecondary Br atoms, generated from the prompt decomposition of CHBr2O. k was independent of pressure in the studiedrange.
Preferred Values
R = CH2Brk = 1.1× 10⁻¹¹ cm3 molecule−1 s−1 at 298 K.1log k =±0.3 at 298 K.
R = CHBr2k = 1.7× 10⁻¹¹ cm3 molecule−1 s−1 at 298 K.1log k =±0.3 at 298 K.
Comments on Preferred Values
R = CH2BrThe preferred values are the rounded-off rate coefficients determined by Sehested et al. (1993).
R = CHBr2The preferred value is the rounded-off rate coefficient determined by Bayes et al. (2005).
References
Bayes, K. D., Friedl, R. R. and Sander S. P.: J. Phys. Chem., A 109, 3045, 2005.Sehested, J., Nielsen, O. J. and Wallington, T. J.: Chem. Phys. Lett., 213, 157, 1993.
www.atmos-chem-phys.net/8/4141/2008/ Atmos. Chem. Phys., 8, 4141–4496, 2008

4452 R. Atkinson et al.: Evaluated kinetic and photochemical data for atmospheric chemistry
IV.A3.256
CH2BrO2 + CH2BrO2 → HC(O)Br + CH 2BrOH + O 2 (1)→ CH2BrO + CH 2BrO + O2 (2)
Rate coefficient data (k = k1 + k2)
k/cm3 molecule−1 s−1 Temp./K Reference Technique/Comments
Absolute Rate Coefficientskobs = (3.26± 0.31)× 10−11 298 Nielsen et al., 1991 PR-UVA (a,b)(1.05± 0.40)× 10−12 298 Villenave and Lesclaux, 1995 FP-UVA (c)
Branching Ratiosk2/k ≈ 1.0 298 Nielsen et al., 1991 UVP-FTIR (d)k2/k ≈ 1.0 297 Chen et al., 1995 UVP-FTIR (e)
Comments
(a) kobs is based on the measured overall second-order decay of CH2BrO2, defined by -d[CH2BrO2]/dt = 2kobs[CH2BrO2]2.Br atoms and HO2 radicals formed from the subsequent chemistry of CH2BrO (formed from channel (2)) are expected tolead to secondary removal of CH2BrO2, such thatkobs represents an upper limit for the true value ofk.
(b) Pulse radiolysis study of CH3Br-O2-SF6 mixtures with CH2BrO2 radicals being monitored by UV absorption, withσ250nm
= (7.20± 0.83)× 10−18 cm2 molecule−1. The derived value ofkobs was found to be independent of wavelength over therange 250–310 nm and of pressure over the range 150–1000 mbar of SF6.
(c) Flash photolysis of Cl2 in the presence of CH3Br-O2-N2 mixtures at a pressure of 1013 mbar, with CH2BrO2 radicalsbeing monitored by UV absorption, withσ250nm = (3.35± 0.10)× 10−18 cm2 molecule−1. Decays in transient absorptionsignals were recorded in the wavelength range 240 nm to 280 nm.k derived from simulations of the decay traces usingan explicit reaction mechanism.
(d) CH2BrO2 radicals were generated from the steady-state photolysis of Cl2 in the presence of CH3Br–air mixtures. Twomajor carbon-containing products, CO and HC(O)Br, were observed by FTIR spectroscopic analysis. HC(O)Br wasbelieved to arise from the reaction of CH2BrO with O2.
(e) CH2BrO2 radicals were generated from the steady-state photolysis of Cl2 in the presence of CH3Br-air mixtures at 930mbar. FTIR spectroscopic analysis identified CH2O as the major carbon-containing primary product, suggesting CH2BrO(formed from channel (2)) predominantly decomposes by Br atom elimination. Lower yields of HC(O)Br were observed,but CH2BrOH was not identified as a product. CO formation also observed from secondary reactions of primary productswith Cl and Br.
Preferred Values
k2/k = 1.0 at 298 K.
Reliability
1 (k2/k) = +0.0−0.1 at 298 K.
Atmos. Chem. Phys., 8, 4141–4496, 2008 www.atmos-chem-phys.net/8/4141/2008/

R. Atkinson et al.: Evaluated kinetic and photochemical data for atmospheric chemistry 4453
Comments on Preferred Values
The preferred unity value ofk2/k is based on the results of the product study of Chen et al. (1995), in which no evidence forformation of CH2BrOH (which would be formed by channel (1)) was obtained. Observation of CH2O as the major primaryproduct was also consistent with the dominance of channel (2),followed by decomposition of CH2BrO by Br atom elimination.
The two kinetics studies (Nielsen et al., 1991; Villenave and Lesclaux, 1995) are in significant disagreement, yielding ratecoefficients which differ by more than an order of magnitude, and UV absorption spectra for CH2BrO2 which differ in bothshape and magnitude. The spectrum reported by Villenave and Lesclaux (1995) is similar to that typically observed for peroxyradicals, with a single maximum at 240 nm. The spectrum reported by Nielsen et al. (1991) displays a second intense maximumat 280 nm, and thus appears to be subject to interference.
Although the value ofk reported by Villenave and Lesclaux (1995) is likely to be indicative of the magnitude of the self-reaction rate coefficient for CH2BrO2, the mechanism used to extractk from the observed decay profiles assumed secondaryremoval of CH2BrO2 by reaction with HO2 generated from the exclusive reaction of CH2BrO with O2. It is possible that theactual formation of Br atoms leads to a similar degree of secondary removal of CH2BrO2, but Villenave and Lesclaux (1995)did not observe formation of BrO (the likely product) in the system. More information is therefore needed on the kinetics andmechanism of the secondary reactions, in addition to further kinetics studies of the title reaction, to allowk to be defined moreaccurately.
References
Chen, J., Catoire, V. and Niki, H.: Chem. Phys. Lett. 245, 519, 1995.Nielsen, O. J., Munk, J., Locke, G. and Wallington, T. J.: J. Phys. Chem. 95, 8714, 1991.Villenave, E. and Lesclaux, R.: Chem. Phys. Lett. 236, 376, 1995.
www.atmos-chem-phys.net/8/4141/2008/ Atmos. Chem. Phys., 8, 4141–4496, 2008

4454 R. Atkinson et al.: Evaluated kinetic and photochemical data for atmospheric chemistry
IV.A3.257
BrCH 2CH2O2 + BrCH 2CH2O2 → BrCH 2CH2OH + BrCH 2CHO + O2 (1)→ 2BrCH2CH2O + O2 (2)
Rate coefficient data (k = k1 + k2)
k/cm3 molecule−1 s−1 Temp./K Reference Technique/Comments
Absolute Rate Coefficientskobs= (6.2± 1.2)× 10−12 298 Crowley and Moortgat, 1992 MM-UVA (a,b)6.15× 10⁻¹⁴ exp[(1247± 203)/T ] 275-373 Villenave et al., 2003 FP-UVA (c)(4.49± 0.22)× 10−12 298
Branching Ratiosk1/k = 0.43 296 Yarwood et al., 1992 UV-P-FTIR (d)k2/k = 0.57
Comments
(a) kobs is based on the measured overall second-order decay of CH2BrCH2O2, defined by -d[CH2BrCH2O2]/dt = 2kobs
[CH2BrCH2O2]2. As described in detail by Lesclaux (1997), HO2 radicals formed from the subsequent chemistry ofCH2BrCH2O (formed from channel (2)) are expected to lead to secondary removal of CH2BrCH2O2. The true value ofkis expected to fall in the rangekobs/(1 + α) < k < kobs, whereα = k2/k.
(b) Molecular modulation study of the photolysis of Br2 in the presence of C2H4-O2-N2 mixtures at total pressures up to 800mbar. Modulated waveforms for the formation and removal of CH2BrCH2O2 radicals were monitored by absorption at270 nm, i.e. where HO2 does not absorb.
(c) Flash photolysis of Br2 in the presence of C2H4-O2-N2 mixtures at a pressure of 1013 mbar. Decays in transient absorptionsignals (with contributions from CH2BrCH2O2 and HO2) were recorded in the wavelength range 210 nm to 290 nm.k
derived from simulations of the decay traces using an explicit reaction mechanism.
(d) Steady-state photolysis of Br2 in the presence of C2H4-O2-N2 mixtures at 933 mbar total pressure, with FTIR spectro-scopic determination of products. The major products observed were BrCH2CHO, BrCH2CH2OH, and BrCH2CH2OOH.The branching ratio,k2/k1 = 1.35± 0.07, was determined from the yields of BrCH2CHO and BrCH2CH2OH relative tothe loss of C2H4.
Preferred Values
k = 4.0× 10⁻¹² cm3 molecule−1 s−1 at 298 K.k = 6.0× 10⁻¹⁴ exp(1250/T ) cm3 molecule−1 s−1 over the temperature range 270-380 K.k1/k = 0.43 at 298 K.k2/k = 0.57 at 298 K.
Reliability
1 log k =± 0.2 at 298 K.1 (E/R) =± 500 K.1 (k1/k) = (k2/k) =±0.1 at 298 K.
Atmos. Chem. Phys., 8, 4141–4496, 2008 www.atmos-chem-phys.net/8/4141/2008/

R. Atkinson et al.: Evaluated kinetic and photochemical data for atmospheric chemistry 4455
Comments on Preferred Values
The preferred values ofk are based on the temperature dependence expression of Villenave et al. (2003), with which the earlier298 K kobs determination of Crowley and Moortgat (1992) is entirely consistent. The preferred values of the branching ratiosare based on the data of Yarwood et al. (1992), which require confirmation.
The above value ofk is similar to that for the self-reaction of CH2ClCH2O2, both showing an enhancement of a factor of ca.50 compared with the self-reaction rate coefficient for the unsubstituted analogue, C2H5O2.
References
Crowley, J. N. and Moortgat, G. K.: J. Chem. Soc. Faraday Trans. 88, 2437, 1992.Lesclaux, R.: Combination of peroxyl radicals in the gas phase. In ’Peroxyl Radicals’, edited by Alfassi, Z. B., John Wileyand Sons, 1997.Villenave, E., Moisan, S. and Lesclaux, R.: J. Phys. Chem. A 107, 2470, 2003.Yarwood, G., Peng, N. and Niki, H.: Int. J. Chem. Kinet. 24, 369, 1992.
www.atmos-chem-phys.net/8/4141/2008/ Atmos. Chem. Phys., 8, 4141–4496, 2008

4456 R. Atkinson et al.: Evaluated kinetic and photochemical data for atmospheric chemistry
IV.A3.258
BrO + CH 3O2 → CH3O + BrOO (1)→ CH3O + OBrO (2)→ HOBr + CH 2O2 (3)
1H ◦(1) = -3.5 kJ·mol−1
1H ◦(2)= +52.4 kJ·mol−1
Rate coefficient data (k = k1 + k2 + k3)
k/cm3 molecule−1 s−1 Temp./K Reference Technique/Comments
Absolute Rate Coefficients(5.7± 0.6)× 10−12 298 Aranda et al., 1997 DF-MS/LIF (a)
Branching Ratiosk3/k = 0.8± 0.2 298 Aranda et al., 1997 DF-MS/LIF (a)(k1 + k2)/k = 0.3± 0.1 298
Comments
(a) Flow tube operated at 1.3 mbar of He. BrO and CH3O2 were formed in the reactions Br + O3, and F + CH4 in the presenceof O2, respectively, and monitored by MS as their parent ions. The experiments were conducted under pseudo first-orderconditions, with BrO in excess of CH3O2. The products observed were HOBr (MS) and CH3O (LIF). The CH3O profilewas modeled by taking into account its presence as impurity in the CH3O2 source, and its reaction with BrO.
Preferred Values
k = 5.7× 10⁻¹² cm3 molecule−1 s−1 at 298 K.k1/k = 0.25 at 298 K.k3/k = 0.75 at 298 K.
Reliability
1 log k =± 0.3 at 298 K.1 (k1/k) =± 0.2 at 298 K.1 (k3/k) = +0.25
−0.4 at 298 K.
Comments on Preferred Values
The preferred value ofk(298 K) is taken from the sole study of this reaction with expanded error limits. The branching ratioto HOBr formation (reaction 3) was determined as (0.8± 0.2), and that to CH3O formation as (0.3± 0.1). Since this study,it has been shown that OBrO has a stable positive ion under similar experimental conditions (Li, 1999), and would have beenobserved by these authors if it were a significant product. They also report non-observation of CH3OBr and HBr. We also notethat channel (2) is significantly endothermic, whilst channel (3) is, within error limits, thermoneutral (Aranda et al., 1997). Forthis reason we do not consider reaction (2) and prefer to quotek1/k = 0.25 andk3/k = 0.75. We add expanded error limits toreflect the fact that calibration of the CH3O signal was achieved by modeling the CH3O2 source chemistry, which containssignificant uncertainty, and because HOBr was not directly calibrated. In the study of Aranda et al. (1997) it is not clear how thedirect formation of HOBr in channel (3) was separated from the indirect formation via channel (1) followed by rapid reactionof CH3O with the excess BrO (Aranda et al., 1998). Theoretical studies (Guha and Francisco, 2003) have been unable toreproduce the experimentally derived reaction mechanism and suggest that HOOBr and HCHO are formed via rearrangementof a CH3OOOBr association complex. Further experiments to examine temperature dependent kinetics and product formationin this reaction are desirable.
Atmos. Chem. Phys., 8, 4141–4496, 2008 www.atmos-chem-phys.net/8/4141/2008/

R. Atkinson et al.: Evaluated kinetic and photochemical data for atmospheric chemistry 4457
References
Aranda, A., Le Bras, G., La Verdet, G. and Poulet, G.: Geophys. Res. Lett. 24, 2745, 1997.Aranda, A., Daele, V., Le Bras, G. and Poulet, G.: Int. J. Chem. Kinetic. 30, 249, 1998.Guha, S. and Francisco, J. S.: J. Chem. Phys. 118, 1779, 2003.Li, Z.: J. Phys. Chem. A. 103, 1206, 1999.
www.atmos-chem-phys.net/8/4141/2008/ Atmos. Chem. Phys., 8, 4141–4496, 2008

4458 R. Atkinson et al.: Evaluated kinetic and photochemical data for atmospheric chemistry
IV.A3.259
CH3Br + hν→ products
Primary photochemical processes
Reaction 1H◦/kJ mol−1 λthreshold/nm
CH3Br + hν → CH3 + Br 296 404
Absorption cross-section data
Wavelength range/nm Reference Comments
180–260 Gillotay and Simon, 1988 (a)
Quantum yield data
Measurement Wavelength range/nm Reference Comments
8(Br)=1.01± 0.16 248 Talukdar et al., 1992 (b)8(Br)=1.10± 0.20 2228(Br)=1.05± 0.11 1938(H)=0.002± 0.001 193
Comments
(a) Spectra were obtained using a thermostatted absorption cell with a single pass optical path of 2 m coupled to a monochro-mator capable of a maximum resolution of 0.015 nm. Pressures of CH3Br used covered the range 0.053 - 29 mbar. Spectrawere recorded at 295 K, 270 K, 250 K, 230 K and 210 K. The data were fitted to a polynomial expression giving the crosssections as a function of temperature and pressure.
(b) Pulsed laser photolysis of CH3Br-N2 or He mixtures and detection of Br(2P3/2) by resonance fluorescence. A smallamount of H2 was added to ensure rapid quenching of the Br(2P1/2) also produced. The Br(2P3/2) measurements werecalibrated by HBr photolysis at 193 nm for which a quantum yield of unity was assumed. No H atom production could bedetected in the 248 nm and 222 nm photolyses.
Atmos. Chem. Phys., 8, 4141–4496, 2008 www.atmos-chem-phys.net/8/4141/2008/

R. Atkinson et al.: Evaluated kinetic and photochemical data for atmospheric chemistry 4459
Preferred Values
Absorption cross-sections of CH3Br at 295 K and 210 K.
λ/nm 1020 σ /cm2 1020 σ /cm2 λ/nm 1020 σ /cm2 1020 σ /cm2
295 K 210 K 295 K 210 K
190 43.9 (a) 226 23.0 21.6192 52.9 (a) 228 18.8 17.7194 62.0 (a) 230 15.4 14.4196 69.1 (a) 232 12.4 11.4198 76.0 (a) 234 9.87 8.86200 79.1 (a) 236 7.65 6.58202 79.7 (a) 238 5.95 4.97204 79.3 (a) 240 4.47 3.79206 76.7 (a) 242 3.35 2.76208 72.7 (a) 244 2.50 1.94210 66.6 (a) 246 1.82 1.42212 61.4 61.3 248 1.31 0.980214 55.9 55.6 250 0.957 0.675216 49.3 49.0 252 0.686 0.447218 44.2 43.3 254 0.487 0.315220 37.7 36.6 256 0.336 0.202222 32.4 31.2 258 0.235 0.129224 27.6 25.9 260 0.164 0.088
(a) No detectable change inσ over the range 210–295 K
Quantum Yield
8 = 1.0 over the wavelength range 200–260 nm.
Comments on Preferred Values
The preferred values of the absorption cross-section at 295 K and 210 K are those reported by Gillotay and Simon (1988).Values have also been reported at 298 K by Molina et al. (1982) at 5 nm intervals and by Robbins (1976), at 2 nm intervals.The agreement among these three studies is very good. Gillotay and Simon (1988) have fitted their data to a polynomial togive an expression for the cross sections as a function of temperature and pressure.
The preferred values for the quantum yield are based on the study of Talukdar et al. (1992) who showed that photolysisoccurs with unit quantum efficiency by rupture of the C-Br bond.
References
Gillotay, D. and Simon, P. C.: Annal. Geophys. 6, 211, 1988.Molina, L. T., Molina, M. J. and Rowland, F. S.: J. Phys. Chem. 86, 2672, 1982.Robbins, D. E.: Geophys. Res. Lett. 3, 213, 1976.Talukdar, R. K., Vaghjiani, G. L. and Ravishankara, A. R.: J. Chem. Phys. 96, 8194, 1992.
www.atmos-chem-phys.net/8/4141/2008/ Atmos. Chem. Phys., 8, 4141–4496, 2008

4460 R. Atkinson et al.: Evaluated kinetic and photochemical data for atmospheric chemistry
IV.A3.260
CF3Br + hν→ products
Primary photochemical processes
Reaction 1H◦/kJ mol−1 λthreshold/nm
CF3Br + hν → CF3 + Br 296 404
Absorption cross-section data
Wavelength range/nm Reference Comments
168–280 Gillotay and Simon, 1989 (a)190-285 Burkholder et al., 1991 (b)190-320 Orkin and Kasimovskaya, 1995 (c)
Quantum yield data
Measurement Wavelength range/nm Reference Comments
1.12± 0.16 193 Talukdar et al., 1992 (d)0.92± 0.15 222
Comments
(a) Spectra were obtained using a thermostatted absorption cell with a single pass optical path of 2 m coupled to a monochro-mator capable of a maximum resolution of 0.015 nm. Pressures of CF3Br used covered the range 0.8–950 mbar. Spectrawere recorded at 295 K, 270 K, 250 K, 230 K and 210 K. The data were fitted to a polynomial expression giving the crosssections as a function of temperature and pressure.
(b) Spectra were obtained using thermostatted absorption cells with single pass optical paths of 98.1 cm and 150 cm, coupledto spectrographs having resolutions in the range 0.4–0.5 nm. Spectra were recorded at 296 K, 270 K, 250 K, 230 K and210 K. The data werefitted to a polynomial expression giving the cross sections as a function of temperature and pressure.
(c) Spectra were obtained using a cell thermostatted at 295 K with a single path optical length of 14.0 cm and coupled to adouble beam spectrophotometric system. Sample pressures in the range 0.013–1 bar were used.
(d) Pulsed laser photolysis of CF3Br-N2 mixtures and detection of Br(2P3/2) by resonance fluorescence. A small amount ofH2 was added to ensure rapid quenching of the Br(2P1/2) also produced. The Br(2P3/2) measurements were calibrated byCH3Br photolysis at the same wavelength for which a quantum yield of unity was assumed.
Atmos. Chem. Phys., 8, 4141–4496, 2008 www.atmos-chem-phys.net/8/4141/2008/

R. Atkinson et al.: Evaluated kinetic and photochemical data for atmospheric chemistry 4461
Preferred Values
Absorption cross-sections of CF3Br at 295 K and 210 K.
λ/nm 1020 σ /cm2 1020 σ /cm2 λ/nm 1020 σ /cm2 1020 σ /cm2
295 K 210 K 295 K 210 K
190 6.50 7.11 230 2.98 2.24192 7.49 8.27 232 2.35 1.67194 8.49 9.43 234 1.83 1.21196 9.48 10.6 236 1.40 0.863198 10.4 11.7 238 1.06 0.607200 11.2 12.6 240 0.789 0.420202 11.8 13.2 242 0.574 0.287204 12.2 13.6 244 0.418 0.193206 12.4 13.8 246 0.301 0.129208 12.3 13.6 248 0.216 0.0848210 12.0 12.9 250 0.153 0.0562212 11.3 12.1 252 0.107 0.0371214 10.6 11.1 254 0.0751 0.0241216 9.69 9.86 256 0.0524 0.0163218 8.65 8.54 258 0.0364 0.0110220 7.58 7.25 260 0.0252 0.0074222 6.52 5.97 262 0.0176224 5.50 4.84 264 0.0121226 4.56 3.86 266 0.0086228 3.73 2.96 268 0.0061
Quantum Yields
8 = 1.0 over the wavelength range 200–270 nm.
Comments on Preferred Values
The preferred values of the absorption cross-sections at 295 K are the mean of the values obtained in the studies of Gillotay andSimon (1989), Burkholder et al. (1991) and Orkin and Kasimovskaya (1995). Molina et al. (1982) have also reported valuesat 5 nm intervals. The agreement among these four studies (Gillotay and Simon, 1989; Burkholder et al., 1991 and Orkin andKasimovskaya, 1995) over the wavelength range of the preferred values is excellent. The temperature dependence of the ofthe cross sections down to 210 K has been studied by Gillotay and Simon (1989) and by Burkholder et al. (1991) and in bothcases polynomial expressions were derived giving the cross sections as a function of temperature and wavelength. There aresignificant differences between the two studies (Gillotay and Simon, 1989; Burkholder et al., 1991). Thus atλ > 220 nm bothstudies reported a decrease in absorption as the temperature was lowered, but near the absorption peak (∼ 205 nm) Burkholderet al. (1991) found the cross-sections to be independent of temperature, while Gillotay and Simon (1989) found the absorptionto increase with decreasing temperature, with a 20% increase at the lowest temperature studied. Furthermore, at 210 K there isgood agreement on the values ofσ at longer wavelengths (∼ 280 nm), but the discrepancy between the two studies (Gillotayand Simon, 1989; Burkholder et al., 1991) increases steadily in going to shorter wavelengths with the values of Gillotay andSimon (1989) being∼30% larger than those of Burkholder et al. (1991) at 190 nm. Provisionally, the preferred values at 210K are taken as the mean of the values of Gillotay and Simon (1989) and of Burkholder et al. (1991).
The preferred quantum yields are based on the study of Talukdar et al. (1992) in which it was shown that photolysis occurswith unit quantum efficiency by rupture of the C-Br bond to give CF3 + Br. Studies of the dynamics of photodissociation at234 nm show that 80% of the Br atoms are produced in the2P1/2 excited state (Kim et al., 2001). CF3Br has no apparenttropospheric chemistry loss mechanism (Burkholder et al., 1991) and is estimated to have a tropospheric lifetime with respectto photolysis of greater than 1000 years (Molina et al., 1982).
www.atmos-chem-phys.net/8/4141/2008/ Atmos. Chem. Phys., 8, 4141–4496, 2008

4462 R. Atkinson et al.: Evaluated kinetic and photochemical data for atmospheric chemistry
References
Burkholder, J. B., Wilson, R. R., Gierczak, T., Talukdar, R., McKeen, S. A., Orlando, J. J., Vaghjiani, G. L. and Ravishankara,A. R.: J. Geophys. Res. 96, 5025, 1991.Gillotay, D. and Simon, P. C.: J. Atmos. Chem. 8, 41, 1989.Kim, T. K., Park, M. S., Lee, K. W. and Jung, K-H.: J. Chem. Phys., 115, 10745, 2001.Molina, L. T., Molina, M. J. and Rowland, F. S.: J. Phys. Chem. 86 2672, 1982.Orkin, V. L. and Kasimovskaya, E. E.: J. Atmos. Chem. 21, 1, 1995.Talukdar, R. K., Vaghjiani, G. L. and Ravishankara, A. R.: J. Chem. Phys. 96, 8194, 1992.
Atmos. Chem. Phys., 8, 4141–4496, 2008 www.atmos-chem-phys.net/8/4141/2008/

R. Atkinson et al.: Evaluated kinetic and photochemical data for atmospheric chemistry 4463
IV.A3.261
CF2ClBr + h ν→ products
Primary photochemical processes
Reaction 1H◦/kJ mol−1 λthreshold/nm
CF2ClBr + hν → CF2 + ClBr (1) 296 445→ CF2Cl + Br (2) 271 441→ CF2Br + Cl (3) 348 (est) 344→ CF2 + Cl+ Br (4) 488 245
Absorption cross-section data
Wavelength range/nm Reference Comments
170–302 Gillotay and Simon, 1989 (a)190–320 Burkholder et al., 1991 (b)190–304 Orkin and Kasimovskaya, 1995 (c)
Quantum yield data
Measurement Wavelength range/nm Reference Comments
8(Cl) = 1.03± 0.14 193 Talukdar et al., 1996 (d)8(Br) = 1.04± 0.14 1938(CF2) = 0.9± 0.2 1938(Cl) = 0.27± 0.04 2228(Br) = 0.86± 0.04 2228(Cl) = 0.18± 0.03 2488(Br) = 0.75± 0.12 2488(3) = 0.29± 0.03 157.6 Yokoyama et al., 2001 (e)8(2) = 0.46± 0.05 157.68(4) = 0.25± 0.05 157.68(3) = 0.24 234 Lee and Yung, 2001 (f)8(2) = 0.96 234
Comments
(a) Spectra were obtained using a thermostatted absorption cell with a single pass optical path of 2 m coupled to a monochro-mator capable of a maximum resolution of 0.015 nm. Pressures of CF2ClBr used covered the range 0.13 – 600 mbar.Spectra were recorded at 295 K, 270 K, 250 K, 230 K and 210 K. The data were fitted to a polynomial expression givingthe cross sections as a function of temperature and pressure.
(b) Spectra were obtained using thermostatted absorption cells with single pass optical paths of 98.1 cm and 150 cm, coupledto spectrographs having resolutions in the range 0.4–0.5 nm. Spectra were recorded at 296 K, 270 K, 250 K, 230 K and210 K. The data were fitted to a polynomial expression giving the cross sections as a function of temperature and pressure.
(c) Spectra were obtained using a cell thermostatted at 295 K with a single path optical length of 14.0 cm and coupled to adouble beam spectrophotometric system. Sample pressures in the range 0.013–1 bar were used.
(d) Quantum yields were determined by photolysis of CF2ClBr and a reference compound in ”back-to-back” experiments.For 8(Cl) determinations at 193 nm the reference compound was HCl and at 222 nm and 248 nm Cl atom yields were
www.atmos-chem-phys.net/8/4141/2008/ Atmos. Chem. Phys., 8, 4141–4496, 2008

4464 R. Atkinson et al.: Evaluated kinetic and photochemical data for atmospheric chemistry
measured relative to those at 193nm. CH3Br and C2F4 were used as reference compounds for measuring the yields of Brand CF2 respectively. [Cl] and [Br] were monitored by RF and [CF2] by long path absorption. [CF2ClBr] and [HCl] weredetermined by UV absorption and [C2F4] by pressure measurements.
(e) Laser photolysis with photofragment translational spectroscopy using TOF-MS to detect Br, Cl and CF2. All CClF2 andCBrF2 radicals produced dissociate spontaneously to produce Cl or Br + CF2.
(f) Laser photolysis with state selected photofragment imaging. Two primary channels (2) and (3) observed with relativeyields of 0.96 and 0.04. For the CF2Cl + Br channel the branching ratio for Br(2P1/2) and Br(2P3/2) is determined to be0.41±0.05.
Preferred Values
Absorption cross-sections of CF2ClBr at 295 K and 210 K.
λ/nm 1020 σ /cm2 1020 σ /cm2 λ/nm 1020 σ /cm2 1020 σ /cm2
295 K 210 K 295 K 210 K
190 47.4 50.5 240 17.7 15.6192 57.7 64.5 242 14.5 12.6194 70.3 79.3 244 11.9 9.97196 83.0 94.3 246 9.66 7.82198 95.6 106 248 7.77 6.13200 109 120 250 6.23 4.70202 117 130 252 4.93 3.57204 121 132 254 3.89 2.72206 122 134 256 3.05 2.02208 121 133 258 2.37 1.51210 117 129 260 1.83 1.11212 112 123 262 1.41 0.811214 104 115 264 1.07 0.589216 96.2 106 266 0.816 0.425218 87.8 96.2 268 0.618 0.307220 79.0 86.0 270 0.465 0.216222 70.3 75.7 272 0.349 0.153224 62.1 66.2 274 0.259 0.107226 54.3 57.2 276 0.190 0.0742228 47.3 49.0 278 0.139 0.0516230 40.9 41.3 280 0.103 0.0355232 35.2 34.6 282 0.075 0.0244234 29.9 28.8 284 0.055 0.0167236 25.4 23.7 286 0.040 0.0106238 21.3 19.4 288 0.029 0.00721
Quantum Yields
8 = 1.0 over the wavelength range 200–300 nm.
Comments on Preferred Values
The preferred values of the absorption cross-sections at 295 K are the mean of the values obtained in the studies of Gillotay andSimon (1989), Burkholder et al. (1991) and Orkin and Kasimovskaya (1995). Values have also been reported by Molina et al.(1982) at 5 nm intervals, and by Giolando et al. (1980) at 10 nm intervals. The agreement among these five studies (Gillotayand Simon, 1989: Burkholder et al., 1991; Orkin and Kasimovskaya, 1995; Molina et al., 1982; Giolando et al., 1980) at 295 K
Atmos. Chem. Phys., 8, 4141–4496, 2008 www.atmos-chem-phys.net/8/4141/2008/

R. Atkinson et al.: Evaluated kinetic and photochemical data for atmospheric chemistry 4465
over the wavelength range of the preferred values is excellent. The temperature dependence of the cross-sections down to 210K has been studied by Gillotay and Simon (1989) and by Burkholder et al. (1991) and in both cases polynomial expressionswere derived giving the cross-sections as a function of temperature and wavelength. Atλ > 234 nm both studies reported adecrease in absorption as the temperature was lowered. But near the absorption peak (∼ 205 nm) Burkholder et al. (1991)found the cross-sections to be independent of temperature, while Gillotay and Simon (1989) found the absorption to increasewith decreasing temperature, with a 20% increase at the lowest temperature studied. Furthermore, at 210 K the values ofσ
of Gillotay and Simon (1989) are larger than those of Burkholder et al. (1991) by∼ 13% at 288 nm, increasing to∼ 30% at190 nm. Provisionally, the preferred values at 210 K are taken as the mean of the values from Gillotay and Simon (1989) andBurkholder et al. (1991).
Talukdar et al. (1996) measured the quantum yields of CF2, Cl, and Br at 193 nm and found that the CF2ClBr was pho-todissociated to give CF2 with a quantum yield of unity, probably by initial production of CF2Cl which was not collisionallystabilized under their conditions but went on to give CF2 + Cl. Baum and Huber (1993), in a photofragment translational spec-troscopy study, also found that at 193 nm the dominant primary process is rupture of the C-Br bond followed by decompositionof the energised CF2Cl fragment, and a minor pathway involving initial rupture of the C-Cl bond was also detected. At 157.6nm CF2ClBr dissociates competitively in all three dissociation channels (2), (3 and (4), with 25% producing CF2 directly via(4) (Yokoyama et al., 2001). At longer wavelengths photodissociation by breaking of a C-halogen bond is expected to persistwith unit quantum efficiency, with direct Cl production (channel 3) decreasing to near zero at 267 nm (Huang et al., 2003).
CF2ClBr has been estimated to have a tropospheric lifetime with respect to photolysis of 15 to 20 years (Burkholder et al.,1991; Molina et al., 1982).
References
Baum, G. and Huber, J. R.: Chem. Phys. Lett. 213, 427, 1993.Burkholder, J. B., Wilson, R. R., Gierczak, T., Talukdar, R., McKeen, S. A., Orlando, J. J., Vaghjiani, G. L. and Ravishankara,A. R.: J. Geophys. Res. 96, 5025, 1991.Gillotay, D. and Simon, P. C.: J. Atmos. Chem. 8, 41, 1989.Giolando, D. M., Fazekas, G. B., Taylor, W. D. and Takacs, G. A.: J. Photochem. 14, 335, 1980.Huang, J., Dadong, X., Francisco, J. S. and Jackson, W. M.: J. Chem. Phys., 119, 3661, 2003.Lee, S-H. and Yung, K-H.: Chem. Phys. Lett., 350, 306 , 2001.Molina, L. T., Molina, M. J. and Rowland, F. S.: J. Phys. Chem. 86 2672, 1982.Orkin, V. L. and Kasimovskaya, E. E.: J. Atmos. Chem. 21, 1, 1995.Talukdar, R. K., Hunter, M., Warren, R. F., Burkholder, J. B. and Ravishankara, A. R.: Chem. Phys. Lett. 262, 669, 1996.Yokoyama, A., Yokoyama, K. and Takayanagi, T.: J. Chem. Phys., 114, 1617, 2001.
www.atmos-chem-phys.net/8/4141/2008/ Atmos. Chem. Phys., 8, 4141–4496, 2008

4466 R. Atkinson et al.: Evaluated kinetic and photochemical data for atmospheric chemistry
IV.A3.262
CF2Br2 + hν→ products
Primary photochemical processes
Reaction 1H◦/kJ mol−1 λthreshold/nm
CF2Br2 + hν → CF2Br + Br (1) 280 (est) 427→ CF2 + Br + Br (2) 419 286→ CF2 + Br2 (3) 226 529
Absorption cross-section data
Wavelength range/nm Reference Comments
170–302 Gillotay and Simon, 1989 (a)190–320 Burkholder et al., 1991 (b)190–304 Orkin and Kasimovskaya, 1995 (c)
Quantum yield data
Measurement Wavelength range/nm Reference Comments
8(CF2O) = 1.14 206.2 Molina and Molina, 1983 (d)8(Br2) = 1.118(-CBr2F2) = 1.128(CF2) = 1.03 247.78(Br2) = 0.998(-CBr2F2) = 1.05 302.48(CF2O) = 1.238(Br2) = 1.288(Br) = 1.96± 0.25 193 Talukdar et al., 1992 (e)8(Br) = 1.63± 0.19 2228(Br) = 1.01± 0.15 2488(CF2) = 1.11± 0.22 193 Talukdar et al., 1996 (e)8(CF2) = 1.18± 0.30 1938(1) = 0.84 234 Park et al., 2001 (f)8(2) = 0.158(3) = trace8(3) = 0.04± 0.01 248 Hsu et al., 2005 (g)
Comments
(a) Spectra were obtained using a thermostatted absorption cell with a single pass optical path of 2 m coupled to a monochro-mator capable of a maximum resolution of 0.015 nm. Pressures of CF2Br2 used covered the range 0.04–308 mbar. Spectrawere recorded at 295 K, 270 K, 250 K, 230 K and 210 K. The data were fitted to a polynomial expression giving the crosssections as a function of temperature and pressure.
(b) Spectra were obtained using thermostatted absorption cells with single pass optical paths of 98.1 cm and 150 cm, coupledto spectrographs having resolutions in the range 0.4–0.5 nm. Spectra were recorded at 296 K, 270 K, 250 K, 230 K and210 K. The data were fitted to a polynomial expression giving the cross sections as a function of temperature and pressure.
Atmos. Chem. Phys., 8, 4141–4496, 2008 www.atmos-chem-phys.net/8/4141/2008/

R. Atkinson et al.: Evaluated kinetic and photochemical data for atmospheric chemistry 4467
(c) Spectra were obtained using a cell thermostatted at 295 K with a single path optical length of 14.0 cm and coupled to adouble beam spectrophotometric system. Sample pressures in the range 0.013–1 bar were used.
(d) Product study on photolysis of CF2Br2-air mixtures at 1 bar. The only photolysis products found were CF2O and Br2.The CF2O and CBr2F2 concentrations were monitored by FTIR, and the Br2 concentrations by UV absorption.
(e) Both of the studies of Talukdar et al. (1992; 1996) employed basically the same technique. Pulsed laser photolysis offlowing CF2Br2-diluent (He, N2, or Ar) mixtures was used with a small amount of H2 added to ensure rapid quenchingof the Br(2P1/2) produced to Br(2P3/2). Br(2P3/2) was detected by resonance fluorescence and CF2 by UV absorption.The two values of8(CF2) cited were obtained by monitoring [CF2] at 248.7 and 258.3 nm. The Br(2P3/2) measurementswere calibrated by CH3Br photolysis at the same wavelength for which a quantum yield of unity was assumed. The CF2measurements were calibrated using C2F4 photolysis taking a quantum yield for CF2 production at 193 nm of 2.
(f) Photodissociation dynamics of CF2Br2 studied using 2-dimensional photofragment ion image technique, following laserphotolysis at 234 and 265 nm. At 265 nm the radical channel (1) is the major primary dissociation channel.
(g) Laser photolysis at 248 nm with CRDS detection of nascent Br2 in the B35+u- X16+g transition.
Preferred Values
Absorption cross-sections of CF2Br2 at 295 K and 210 K.
λ/nm 1020 σ /cm2 1020 σ /cm2 λ/nm 1020 σ /cm2 1020 σ /cm2
295 K 210 K 295 K 210 K
190 117 130 250 58.3 55.3192 110 122 252 46.5 39.1194 102 110 254 36.8 29.9196 91.4 97.8 256 28.9 22.6198 82.1 86.3 258 22.4 17.0200 74.8 78.4 260 17.3 12.5202 71.7 74.5 262 13.1 9.17204 73.4 77.1 264 9.90 6.66206 80.9 85.2 266 7.47 4.81208 92.3 100 268 5.59 3.44210 110 120 270 4.17 2.44212 134 145 272 3.08 1.72214 155 173 274 2.27 1.21216 180 202 276 1.66 0.844218 205 230 278 1.21 0.588220 226 254 280 0.888 0.406222 244 273 282 0.647 0.281224 253 282 284 0.470 0.194226 257 283 286 0.336 0.129228 253 277 288 0.245 0.0891230 245 264 290 0.177 0.0616
www.atmos-chem-phys.net/8/4141/2008/ Atmos. Chem. Phys., 8, 4141–4496, 2008

4468 R. Atkinson et al.: Evaluated kinetic and photochemical data for atmospheric chemistry
λ/nm 1020 σ /cm2 1020 σ /cm2 λ/nm 1020 σ /cm2 1020 σ /cm2
295 K 210 K 295 K 210 K
232 230 245 292 0.128 0.405234 212 222 294 0.093 0.277236 192 197 296 0.067 0.185238 170 171 298 0.049 0.127240 147 145 300 0.035 0.0083242 126 121 302 0.025 0.0056244 106 99.3 304 0.018 0.0011246 87.8 86.4 306 0.013248 72.0 64.1 308 0.009
Quantum Yields
8 = (81 + 82 + 83) = 1.0 over the range 200–310 nm.
Comments on Preferred Values
The preferred values for the absorption cross-sections at 295 K are the means of the values reported by Gillotay and Simon(1989), Burkholder et al. (1991) and Orkin and Kasimovskaya (1995). Values at 5 nm intervals have also been reported byMolina et al. (1982). The agreement among the four studies (Gillotay and Simon, 1989; Burkholder et al., 1991; Orkin andKasimovskaya, 1995; Molina et al.,1982) over the wavelength range of the preferred values is very good although discrepanciesappear at longer wavelengths. The temperature dependence down to 210 K has been studied by Gillotay and Simon (1989)and Burkholder et al. (1991). There is only fair agreement between the two studies. Atλ > 250 nm both report a decreasein absorption as the temperature is lowered (Gillotay and Simon, 1989; Burkholder et al., 1991), and near the absorption peak(about 230 nm) both studies find an 11% increase in absorption in going to the lowest temperature. However, although thevalues ofσ from the two studies are in good agreement close to the absorption maximum they steadily diverge on moving tolonger and shorter wavelengths reaching a 30% difference at 190 nm and a factor of 2 at 300 nm. Provisionally, the preferredvalues at 210 K are taken as the mean of the values from Gillotay and Simon (1989) and Burkholder et al. (1991).
Molina and Molina (1983) found that the only products of photolysis of CF2Br2-air mixtures at a pressure of 1 bar wereCF2O and Br2 and concluded that the quantum yield for photodissociation of CBr2F2 was unity over the wavelength range200–300 nm. This is supported by the findings of Talukdar et al. (1992; 1996). The preferred values for the quantum yields arebased on the studies of Molina and Molina (1983) and Talukdar et al. (1992; 1996). Molecular beam (Krajnovich et al., 1984)and spectroscopic studies (Gosnell et al., 1991; Vatsa et al., 1995) at 248 nm have detected the transient CF2Br. Cameron etal. (2000) used LIF to detect vibrational distribution of nascent CF2 produced by photolysis of CBr2F2 at discrete wavelegthsin the range 223–260 nm. Their results showed that CF2 production at 246 nm was accompanied by the production of twoBr fragments. However Hsu et al (2005) measured significant Br2 production (φ = 0.04) at 248 nm using CRDS detection,and Park et al (2001) report seeing a Br2 elimination channel at 234 nm. Here is insufficient information to recommendλ
dependence ofφ(Br), but it is recommended to useφ(Br) = 1.0 for tropospheric photolysis andφ(Br) = 2.0 for stratosphericphotolysis.
Because its absorption extends into the 290–310 nm wavelength range, CF2Br2 has a short tropospheric lifetime with respectto photolysis, of about 3 years.
References
Burkholder, J. B., Wilson, R. R., Gierczak, T., Talukdar,R., McKeen, S. A., Orlando, J. J., Vaghjiana, G. L. and Ravishankara,A. R.: J. Geophys. Res. 96, 5025, 1991.Cameron, M. R., Johns, S. A., Metha, G. F. and Cable, S.F.: Phys. Chem. Chem. Phys., 2, 2539. 2000.Gillotay, D. and Simon, P.C.: J. Atmos. Chem., 8, 41, 1989.Gosnell, T. R., Taylor, A. J. and Lyman, J. L.: J. Chem. Phys., 94, 5949, 1991.Hsu, C-Y., Huang, H-Y. and Lin, K-C.: J. Chem. Phys., 123, 134312, 2005.Krajnovich, D., Zhang, Z., Butler, L. and Lee, Y. T.: J. Phys. Chem., 88, 4561,1984.
Atmos. Chem. Phys., 8, 4141–4496, 2008 www.atmos-chem-phys.net/8/4141/2008/

R. Atkinson et al.: Evaluated kinetic and photochemical data for atmospheric chemistry 4469
Orkin, V. L. and Kasimovskaya, E. E.: J. Atmos. Chem., 21, 1, 1995.Molina, L. T., Molina, M. J. and Rowland, F. S.: J. Phys. Chem., 86, 2672, 1982.Molina, L. T. and Molina, M. J.: J. Phys. Chem., 87, 1306, 1983.Park, M. S., Kim, T. K., Lee, S-H. and Jung, K-H., Vollp, H-R. and Wolfrum, J.: J. Phys. Chem., 105, 5606, 2001.Talukdar, R. K., Vaghjiani, G. L. and Ravishankara, A. R.: J. Chem. Phys., 96, 8194, 1992.Talukdar, R. K., Hunter, M., Warren, R. F., Burkholder, J. B. and Ravishankara, A. R.: Chem. Phys. Lett., 262, 669, 1996.Vatsa, R. K., Kumar, A., Naik, P. D., Rao, K. V. S. R. and Mittal, J. P.: Bull. Chem. Soc. Jpn., 68, 2817, 1995
www.atmos-chem-phys.net/8/4141/2008/ Atmos. Chem. Phys., 8, 4141–4496, 2008

4470 R. Atkinson et al.: Evaluated kinetic and photochemical data for atmospheric chemistry
IV.A4.263
CHBr 3 + hν→ products
Primary photochemical processes
Reaction 1H◦/kJ mol−1 λthreshold/nm
CHBr3 + hν → CHBr2 + Br (1) 276 433→ CHBr +Br2 (2) 355 337
Absorption cross-section data
Wavelength range/nm Reference Comments
170–310 Gillotay and Simon, 1989 (a)286–362 Moortgat et al., 1993 (b)
Quantum yield data
Measurement Wavelength range/nm Reference Comments
8(Br) = 0.74 234 Xu et al., 2002 (c)8(Br2) = 0.268(Br) = 0.84 2678(Br2) = 0.168(Br) = 1.0 302-306 Bayes et al., 2003 (d)8(Br) = 0.76± 0.03 2668(Br2) = 0.23± 0.05 248 Huang et al., 2004 (e)
Comments
(a) Two different techniques were used. One employed a cell with a fixed optical path of 2 m and an evacuated monochromatorcapable of reaching wavelengths down to 170 nm. In the other a multiple reflection cell with optical paths up to 5 m wasused. In both cases the cells were thermostatted and measurements were made in the range 295–240 K.
(b) Measurements were made using two pieces of apparatus. In one a cell of 63 cm fixed path length was used and measure-ments made at 296 K. The other contained multiple pass optics with a total path length of 980 cm. The latter system wasused for measurements at 296 K, 286 K, 266 K, and 256 K.
(c) Photodissociation dynamics of CHBr3 studied using photofragment TOF-MS and velocity ion image imaging, followinglaser photolysis at 234 and 265 nm. Both excited spin orbit excited Br(2P1/2) and ground Br(2P3/2) were found by REMPI,and VUV photoionisation at 118 nm to detect radical products.
(d) Photolysis of using PLP with joule meter to measure the average pulse energy. Br detected by VUV-RF at discreteλ
between 130–163 nm.
(e) Laser photolysis at 248 nm with CRDS detection of nascent Br2 in the B35+u - X16+g transition.
Atmos. Chem. Phys., 8, 4141–4496, 2008 www.atmos-chem-phys.net/8/4141/2008/

R. Atkinson et al.: Evaluated kinetic and photochemical data for atmospheric chemistry 4471
Preferred Values
Absorption cross-sections of CHBr3 at 296 K and 210 K.
λ/nm 1020 σ /cm2 1020 σ /cm2 λ/nm 1020 σ /cm2 1020 σ /cm2
295 K 210 K 295 K 210 K
190 399 393 270 30.8 21.1192 360 351 272 24.8 16.5194 351 353 274 19.8 12.8196 366 383 276 15.8 9.94198 393 422 278 12.5 7.66200 416 466 280 9.88 5.88202 433 475 282 7.77 4.50204 440 474 284 6.10 3.42206 445 467 286 4.81 2.60208 451 471 288 3.75 1.97210 468 490 290 2.88 1.49212 493 522 292 2.22 1.05214 524 551 294 1.70 0.757216 553 593 296 1.28 0.547218 574 621 298 0.951 0.395220 582 633 300 0.719 0.285222 578 623 302 0.530 0.206224 558 597 304 0.394 0.149226 527 562 306 0.298 0.107228 487 516 308 0.226 0.078230 441 465 310 0.171 0.060232 397 409 312 0.127 0.040234 362 362 314 0.095 0.029236 324 324 316 0.071 0.021238 295 295 318 0.053 0.015240 273 272 320 0.039 0.011242 253 250 322 0.029 0.0079244 234 224 324 0.021 0.0057246 214 202 326 0.016 0.0041248 194 178 328 0.009 0.0030250 174 157 330 0.009 0.0022252 158 138 332 0.007 0.0016254 136 116 334 0.005 0.0011256 116 96.2 336 0.004 0.00081258 98.6 79.5 338 0.003 0.00059260 82.8 64.7 340 0.002 0.00042262 68.9 52.5264 56.9 42.2266 46.7 33.7268 38.0 26.7
Comments on Preferred Values
There have been two studies of the absorption cross-sections of CHBr3. Gillotay et al. (1989) reported values over thewavelength range 170–310 nm and the temperature range 295–240 K; Moortgat et al. (1993) reported values over the range245–360 nm and the temperature range 296–256 K. In the region where the measurements overlap, the agreement is very good.The preferred values at 296 K are those reported by Gillotay et al. (1989) over the wavelength range 190–284 nm and those
www.atmos-chem-phys.net/8/4141/2008/ Atmos. Chem. Phys., 8, 4141–4496, 2008

4472 R. Atkinson et al.: Evaluated kinetic and photochemical data for atmospheric chemistry
reported by Moortgat et al. (1993) at longer wavelengths. The preferred values at 210 K are those of Gillotay et al. (1989)over the range 190–298 K, which they obtained by extrapolation of their higher temperature results, and those over the range290–340 K are from the expression, lnσ (λ,T ) = (0.0618350 - 0.000241014λ)(273-T ) - (2.37616 + 0.1475688λ), which wasderived by Moortgat et al. (1993) from a fit to the combined data of their study and that of Gillotay et al. (1989). It is valid inthe wavelength range 290–340 nm and the temperature range 300–210 K.
The quantum yield for the formation of Br atoms determined by Bayes et al. (2003) for 303 to 306 nm, the Br-atom quantumyield was unity within experimental error. At longer wavelengths, the quantum yields decreases to 0.76 at 324 nm, but theauthors claim that the lower than unity values are the result of systematic and random errors and/or incorrect absorption crosssections. Support for unity quantum yield atλ >300 nm comes from theoretical calculations by Peterson and Francisco (2002),and is recommended for modeling in the troposphere.
Bayes et al. (2003) also report a Br-atom quantum yield of 0.76± 0.03 at 266 nm, indicating that another photodissociationchannel becomes important. This confirms the result of Xu et al. (2002) who measured atomic Br and molecular Br2 by TOFmass spectrometry from bromoform photolysis at 234 and 267 nm. Huang (2004) also observed Br2 production at 248 nm,using CRDS to probe the molecular fragment, and measured a quantum yield of 0.23±0.05. On the other hand the experimentsof McGivern et al. (2000) and Zou et al. (2004), using VUV ionisation photofragment translational spectroscopy at 193 nmand at 248 nm respectively, suggest that Br2 fragments do not arise from a single photon channel, and that channel (1) is theonly primary process. In view of these inconsistencies we are unable to recommend Br atom quantum yields forλ <300 nm.Note that regardless of whether Br or Br2 are formed, any Br2 will be rapidly photodissociated to 2Br in the sunlit atmosphere.
References
Bayes, K. D., Toohey, D. W., Friedl, R. R. and Sander, S. P.: J. Geophys. Res., 108, No D3, 4095, doi:10.29/2002 JD002877,2003.Gillotay, D., Jenouvrier, A., Coquart, B., Merrienne, M. F. and Simon, P. C.: Planet. Space Sci. 37, 1127, 1989.Huang, H-Y., Chuang, W-T., Shama, R. C., Hsu, C-Y., Lin, K-C. and Hu, C-H.: J. Chem. Phys., 121, 5253, 2004.McGivern, W. S., Sorkhabi, O., Suits, A. G., Derecskei-Kovacs, A. and North, S.W.: J. Phys. Chem., A 104, 10085, 2000.Moortgat, G. K., Meller, R. and Schneider, W.: pp. 359–369, in ”The Tropospheric Chemistry of Ozone in the Polar Regions,”Niki, H. and Becker, K. H. editors, NATO ASI Series, Volume 17, Springer-Verlag, Berlin, 1993.Peterson, K. A. and Francisco, J. S.: J. Chem. Phys., 117, 6103, 2002.Xu, D., Francisco, J. S., Huang, J. and Jackson, W. M.: J. Chem. Phys., 117, 2578, 2002.Zou, P., Shu, J., Sears, T., Hall, G. E. and North, S. W.: J. Phys. Chem., A 108, 1482, 2004.
Atmos. Chem. Phys., 8, 4141–4496, 2008 www.atmos-chem-phys.net/8/4141/2008/

R. Atkinson et al.: Evaluated kinetic and photochemical data for atmospheric chemistry 4473
IV.A4.264
CF2BrCF2Br + hν→ products
Primary photochemical processes
Reaction 1H◦/kJ mol−1 λthreshold/nm
CF2BrCF2Br + hν → CF2BrCF2 + Br 280 (est) 427
Absorption cross-section data
Wavelength range/nm Reference Comments
170–302 Gillotay et al., 1988 (a)190–320 Burkholder et al., 1991 (b)190-304 Orkin and Kasimovskaya, 1995 (c)
Quantum yield data
Measurement Wavelength range/nm Reference Comments
8(Br) = 1.9± 0.1 193 Zou et al., 2000 (d)8(Br) = 1.9± 0.1 2338(Br) = 1.4± 0.1 266
Comments
(a) Spectra were obtained using a thermostatted absorption cell with a single pass optical path of 2 m coupled to a monochro-mator capable of a maximum resolution of 0.015 nm. Spectra were recorded at 295 K, 270 K, 250 K, 230 K and 210 K.The data were fitted to a polynomial expression giving the cross sections as a function of temperature and pressure.
(b) Spectra were obtained using a thermostatted absorption cells with single pass optical paths of 98.1 cm and 150 cm, coupledto spectrographs having resolutions in the range 0.4–0.5 nm. Spectra were recorded at 296 K, 270 K, 250 K, 230 K and210 K. The data were fitted to a polynomial expression giving the cross sections as a function of temperature and pressure.
(c) Spectra were obtained using a cell thermostatted at 295 K with a single path optical length of 14.0 cm and coupled to adouble beam spectrophotometric system. Sample pressures in the range 0.65–160 mbar were used.
(d) Product branching ratios, angular and translational distributions measured using photofragment translational spectroscopy,following laser photodissociation of CF2BrCF2Br. Detection by VUV ionisation or REMPI.
www.atmos-chem-phys.net/8/4141/2008/ Atmos. Chem. Phys., 8, 4141–4496, 2008

4474 R. Atkinson et al.: Evaluated kinetic and photochemical data for atmospheric chemistry
Preferred Values
Absorption cross-sections of CF2BrCF2Br at 296 K and 210 K.
λ/nm 1020 σ /cm2 1020 σ /cm2 λ/nm 1020 σ /cm2 1020 σ /cm2
295 K 210 K 295 K 210 K
190 108 119 240 13.4 11.5192 114 124 242 10.7 8.95194 119 128 244 8.47 6.89196 123 131 246 6.69 5.25198 125 133 248 5.23 2.95200 125 133 250 4.05 2.93202 125 132 252 3.09 2.15204 121 129 254 2.36 1.56206 117 125 256 1.77 1.13208 112 119 258 1.32 0.807210 105 112 260 0.978 0.576212 98.6 104 262 0.724 0.391214 94.5 96.1 264 0.535 0.275216 83.4 85.0 266 0.394 0.191218 75.6 79.0 268 0.290 0.134220 67.8 70.3 270 0.212 0.093222 60.2 62.0 272 0.155224 53.0 54.3 274 0.112226 46.2 46.8 276 0.082228 40.0 40.1 278 0.060230 34.2 33.9 280 0.044232 29.0 27.9234 24.3 22.6236 20.1 18.2238 16.5 14.5
Quantum Yields
8 (Br) = 2 (in stratosphere).8 (Br) = 1 (in troposphere).
Comments on Preferred Values
The preferred values for the absorption cross-sections at 295 K are the means of the values reported by Gillotay et al. (1988),Burkholder et al. (1991) and Orkin and Kasimovskaya (1995). Values at 5 nm intervals have also been reported by Molina et al.(1982). The agreement among the four studies (Gillotay et al., 1988; Burkholder et al., 1991; Orkin and Kasimovskaya, 1995;Molina et al., 1982) over the wavelength range of the preferred values is very good. The temperature dependence down to 210K has been studied by Gillotay et al. (1988) and Burkholder et al. (1991). There are significant differences between the twostudies (Gillotay et al.,1988; Burkholder et al., 1991). Close to the absorption peak (∼200 nm) Burkholder et al. (1991) reporta 20% increase in the absorption cross-section in going from 295 K to 210 K, whereas Gillotay et al. (1988) report a smalldecrease. Furthermore, at 210 K the values of the cross-section obtained by Gillotay et al. (1988) are only∼4% lower thanthose of Burkholder et al. (1991) at short wavelengths but this difference increases in going to longer wavelengths, reaching∼40% at 270 nm. Provisionally, the preferred values at 210 K are taken as the mean of the values of Gillotay et al. (1988) andBurkholder et al. (1991).
Photolysis is expected to occur with unit quantum efficiency by rupture of the C-Br bond to give CF2BrCF2 + Br and promptdissociation of nascent CF2BrCF2 to give a second Br atom is likely to predominate in stratospheric photolysis, which is the
Atmos. Chem. Phys., 8, 4141–4496, 2008 www.atmos-chem-phys.net/8/4141/2008/

R. Atkinson et al.: Evaluated kinetic and photochemical data for atmospheric chemistry 4475
main atmospheric sink. CF2BrCF2Br has been estimated to have a tropospheric lifetime against direct solar photolysis of 34years (Burkholder et al., 1991).
References
Burkholder, J. B., Wilson, R. R., Gierczak, T., Talukdar, R., McKeen, S. A., Orlando, J. J., Vaghjiani, G. L. and Ravishankara,A. R.: J. Geophys. Res. 96, 5025, 1991.Gillotay, D., Simon, P. C. and Dierickx, L.: Aeronomica Acta 335, 1, 1988.Molina, L. T., Molina, M. J. and Rowland, F. S.: J. Phys. Chem. 86, 2672, 1982.Orkin, V. L. and Kasimovskaya, E. E.: J. Atmos. Res. 21, 1, 1995.Zou, P., McGivern, W. S., Sorkhabi, O., Suits, A. G. and North, S. W.: J. Chem. Phys., 113, 7149, 2000.
www.atmos-chem-phys.net/8/4141/2008/ Atmos. Chem. Phys., 8, 4141–4496, 2008

4476 R. Atkinson et al.: Evaluated kinetic and photochemical data for atmospheric chemistry
IV.A4.265
CH2Br2 + hν→ products
Primary photochemical processes
Reaction 1H◦/kJ mol−1 λthreshold/nm
CH2Br2 + hν → CH2Br + Br 292 410
Absorption cross-section data
Wavelength range/nm Reference Comments
200–300 Molina et al., 1982 (a)174–290 Gillotay et al., 1988 (b)215-300 Mossinger et al., 1998 (c)
Quantum yield data
No experimental data are available.
Comments
(a) The cross-sections were measured using a double beam spectrophotometer equipped with 10 cm and 180 cm cells. Pres-sures in the range 8–52 mbar were used.
(b) Spectra were obtained using a thermostatted absorption cell with a single pass optical path of 2 m coupled to a monochro-mator capable of a maximum resolution of 0.015 nm. Pressures of CH2Br2 used covered the range 0.05–47× 10−2 mbar.Spectra were recorded at 295 K, 270 K, 250 K, 230 K and 210 K.
(c) Spectra were obtained using a thermostatted absorption cell of optical path length 100 cm coupled to a double beam opticalsystem giving a resolution of∼ 0.6 nm. Pressures used were in the range 0.13–53 mbar. Absorption measurements weremade at 348 K, 328 K, 298 K, 273 K and 250 K. At each wavelength the temperature dependence of the cross-sectionswas expressed as lnσ T = ln σ 298 K + B(T - 298) and values ofB were derived.
Preferred Values
Absorption cross-sections of CH2Br2 at 298 K and 210 K.
λ/nm 1020 σ /cm2 1020 σ /cm2 λ/nm 1020 σ /cm2 1020 σ /cm2
298 K 210 K 298 K 210 K
200 226 223 255 14.1 8.51205 215 206 260 6.61 3.38210 235 240 265 3.03 1.34215 263 325 270 1.34 0.506220 272 356 275 0.514 0.199225 247 318 280 0.255 0.0773230 196 239 285 0.114 0.0324235 139 154 290 0.0499 0.0140240 88.6 86.1 295 0.0165 0.0049245 51.9 43.6 300 0.006 0.0013250 28.0 19.7
Atmos. Chem. Phys., 8, 4141–4496, 2008 www.atmos-chem-phys.net/8/4141/2008/

R. Atkinson et al.: Evaluated kinetic and photochemical data for atmospheric chemistry 4477
Quantum Yields
8 (Br) = 1 for λ > 240 nm.
Comments on Preferred Values
The preferred values for the absorption cross-sections at 298 K are the means of the values reported by Molina et al. (1982),Gillotay et al. (1988) and Mossinger et al. (1998). The agreement among the three studies (Molina et al., 1982; Gillotay etal., 1988; Mossinger et al., 1998) over the wavelength range of the preferred values is excellent. The temperature dependenceof σ over the range 210–295 K has been studied by Gillotay et al. (1988) and over the range 250–348 K by Mossinger et al.(1998). The results agree well in the region where they overlap and both find thatσ increases with decreasing temperatureat the absorption band maximum (219 nm) but shows a decrease with temperature decrease in the long wavelength tail of thespectrum. The preferred values at 210 K are those of Gillotay et al. (1988) which are in very good agreement with the valuescalculated from the expression and temperature coefficients of Mossinger et al. (1998), based on their measurements in therange 250–348 K.
There are no quantum yield measurements but an investigation of the photodissociation at 248 nm using product translationalspectroscopy shows that CH2Br2 undergoes a simple C-Br fission (Lee et al., 2003).
References
Gillotay, D., Simon, P.C. and Dierickx, L.: Aeron. Acta 35, 1, 1988.Lee, Y-R., Chen, C-C. and Lin, S-W.: J. Chem. Phys., 118, 10494, 2003.Molina, L. T., Molina, M. J. and Rowland, F. S.: J. Phys. Chem. 86, 2672, 1982.Mossinger, J. C., Shallcross, D. E. and Cox, R. A.: J. Chem. Soc. Faraday Trans. 94, 1391, 1998.
www.atmos-chem-phys.net/8/4141/2008/ Atmos. Chem. Phys., 8, 4141–4496, 2008

4478 R. Atkinson et al.: Evaluated kinetic and photochemical data for atmospheric chemistry
Appendix 4: IOx Reactions
IV.A4.266
HO + CH3I → H2O + CH2I
1H ◦ = -63.1 kJ·mol−1
Rate coefficient data
k/cm3 molecule−1 s−1 Temp./K Reference Technique/Comments
Absolute Rate Coefficients3.1× 10−12 exp[-(1119± 205)/T ] 271-423 Brown et al., 1990 DF-RF(7.2± 0.7)× 10−14 298(1.2± 0.4)× 10−13 299 Gilles et al., 1996 PLP-LIF (a)(9.9± 2.0)× 10−14 298± 2 Cotter et al., 2003 DF-RF
Comments
(a) Derived from the time-concentration profiles of HO radicals monitored by LIF after generation of O(3P) atoms (from 193nm pulsed laser photolysis of N2O in N2) in the presence of varying amounts of CH3I.
Preferred Values
k = 1.0× 10⁻¹³ cm3 molecule−1 s−1 at 298 K.k = 4.3× 10⁻¹² exp(-1120/T ) cm3 molecule−1 s−1 over the temperature range 270-430 K.
Reliability
1 log k =± 0.2 at 298 K.1 (E/R) =± 500 K.
Comments on Preferred Values
The room temperature rate coefficients of Brown et al. (1990), Gilles et al. (1996) and Cotter et al. (2003) are in reasonableagreement, and the preferred 298 K rate coefficient is an average of the room temperature rate coefficients from these threestudies. The temperature dependence obtained by Brown et al. (1990), the only temperature-dependent study to date, isaccepted and the pre-exponential factor is adjusted to fit the 298 K preferred value.
References
Brown, A. C., Canosa-Mas, C. E. and Wayne, R. P.: Atmos. Environ., 24A, 361, 1990.Cotter, E. S. N., Canosa-Mas, C. E., Manners, C. R., Wayne, R. P. and Shallcross, D. E.: Atmos. Environ., 37, 1125, 2003.Gilles, M. K., Turnipseed, A. A., Talukdar, R. K., Rudich, Y., Villalta, P. W., Huey, L. G., Burkholder, J. B. and Ravishankara,A. R.: J. Phys. Chem., 100, 14005, 1996.
Atmos. Chem. Phys., 8, 4141–4496, 2008 www.atmos-chem-phys.net/8/4141/2008/

R. Atkinson et al.: Evaluated kinetic and photochemical data for atmospheric chemistry 4479
IV.A4.267
HO + CF3I → products
Rate coefficient data
k/cm3 molecule−1 s−1 Temp./K Reference Technique/Comments
Absolute Rate Coefficients(1.2± 0.2)× 10−13 295 Garraway and Donovan, 1979 FP-RA(3.1± 0.5)× 10−14 300 Brown et al., 1990 DF-RF5.8× 10−12 exp[-(1359± 133)/T ] 281-443 Berry et al., 1998 FP-RF (a)(5.9± 1.4)× 10−14 2922.1× 10−11 exp[-(2000± 140)/T ] 271-370 Gilles et al., 2000 PLP-LIF (b)(2.35± 0.54)× 10−14 296
Comments
(a) The measured rate coefficients were observed to increase with flash energy (which affects both the initial concentration ofHO radicals and the amount of CF3I photolysis products). The cited rate coefficients at each temperature were obtainedfrom extrapolation to zero flash energy. Theoretical calculations indicated that the dominant channel is that to form CF3+ HOI.
(b) No effect on the rate coefficient of varying the laser fluence by a factor of∼5 was observed when 351 nm pulsed laserphotolysis of HONO was used as the HO radical source. However, a significant effect of laser fluence was observed whenusing 248 nm pulsed laser photolysis of O3 in the presence of H2O to generate HO radicals. The cited rate coefficientsand Arrhenius expression were obtained from experiments using 351 nm photolysis of HONO as the HO radical source.The CF3I concentrations were monitored by UV/visible absorption spectroscopy.
Preferred Values
k = 2.6× 10⁻¹⁴ cm3 molecule−1 s−1 at 298 K.k = 2.1× 10⁻¹¹ exp(-2000/T ) cm3 molecule−1 s−1 over the temperature range 270-370 K.
Reliability
1 log k =± 0.2 at 298 K.1 (E/R) =± 500 K.
Comments on Preferred Values
Studies of this reaction have the potential for secondary reactions (including, in the pulsed photolysis systems, with CF3Iphotolysis products), reactions with impurities, and/or heterogeneous wall reactions (Brown et al., 1990; Wayne et al., 1992;Berry et al., 1998; Gilles et al., 2000). The preferred values are based on the more extensive study of Gilles et al. (2000) inwhich HONO photolysis at 351 nm was used to generate HO radicals with no apparent problems due to secondary reactionsand with the CF3I concentrations being monitored by UV/visible absorption spectroscopy.
References
Berry, R. J., Yuan, J., Misra, A. and Marshall, P.: J. Phys. Chem. A, 102, 5182, 1998.Brown, A. C., Canosa-Mas, C. E. and Wayne, R. P.: Atmos. Environ., 24A, 361, 1990.Garraway, J. and Donovan, R. J.: J. Chem. Soc., Chem. Comm. 1108, 1979.Gilles, M. K., Talukdar, R. K. and Ravishankara, A. R.: J. Phys. Chem. A, 104, 8945, 2000.Wayne, R. P., Canosa-Mas, C. E., Heard, A. C. and Parr, A. D.: Atmos. Environ., 26A, 2371, 1992.
www.atmos-chem-phys.net/8/4141/2008/ Atmos. Chem. Phys., 8, 4141–4496, 2008

4480 R. Atkinson et al.: Evaluated kinetic and photochemical data for atmospheric chemistry
IV.A4.268
CH2IO2 + CH2IO2 → CH2IOH + HC(O)I + O 2 (1)→ 2CH2IO + O2 (2)
Rate coefficient data (k = k1 + k2)
k/cm3 molecule−1 s−1 Temp./K Reference Technique/Comments
Absolute Rate Coefficients∼9× 10⁻¹¹ 295± 2 Sehested et al., 1994 (a)
Comments
(a) Pulse radiolysis UV absorption spectrometric study of CH3I-O2-SF6 mixtures at a total pressure of 1000 mbar. CH2IO2radicals were monitored by UV absorption withσ370 = (2.1± 0.5)× 10−18 cm2 molecule−1. The interpretation ofthe kinetic data is complicated by the presence of CH3O2 radicals, which leads to mixed-order kinetics. The aboveapproximate value ofk was derived on the basis of several assumptions.
Preferred Values
No recommendation
Comments on Preferred Values
The approximate and exceptionally large rate coefficient obtained by Sehested et al. (1994) should be regarded with cautionowing to the inherent complications in their experimental system. Until more work is carried out in this reaction, we make norecommendation.
References
Sehested, J., Ellermann, T. and Nielsen, O. J.: Int. J. Chem. Kinet. 26, 259, 1994.
Atmos. Chem. Phys., 8, 4141–4496, 2008 www.atmos-chem-phys.net/8/4141/2008/

R. Atkinson et al.: Evaluated kinetic and photochemical data for atmospheric chemistry 4481
IV.A4.269
CH3I + hν→ products
Primary photochemical processes
Reaction 1H◦/kJ mol−1 λthreshold /nm
CH3I + hν → CH3 + I(2P3/2) (1) 239 541→ CH3 + I(2P1/2) (2) 330 362→ CH2 + HI (3) 403 297
Absorption cross-section data
Wavelength range/nm References Comments
210–360 Jenkin et al., 1993 (a)160–400 Fahr et al., 1995 (b)200-380 Roehl et al., 1997 (c)235-350 Rattigan et al., 1997 (d)
Quantum yield data
Measurement Wavelength range/nm References Comments
8(I2) 254 Christie, 1958 (e)8{I(2P1/2); I(2P3/2)} 266 Riley and Wilson, 1972 (f)8{I(2P1/2)} 248-308 Baughcum and Leone, 1980 (g)8{I(2P1/2); I(2P3/2)} 247.5-312.5 Hunter et al., 1983 (h)8I(2P1/2)=0.07± 0.02 304 Li et al., 2005 (i)8I(2P3/2)=0.93± 0.02 304
Comments
(a) The absorption spectrum of CH3I was recorded by diode array spectroscopy with a resolution of approx. 1 nm usinga purified sample. Tabulated cross section values for the indicated range were given, showing a single absorption bandextending from 210 to 365 nm. The absolute cross-section at the maximum of absorption at 257.9 nm wasσ = 1.22×10⁻¹⁸ cm2 molecule−1, which was in good agreement with the earlier published spectrum of Porret and Goodeve (1937).
(b) Absorption spectrum measured over temperature range 223–333 K at a resolution of 0.1 nm; cross sections at 0.5 nmintervals given. In addition to the gas phase measurements over the wavelength range 160–335 nm, liquid phase measure-ments over the range 330–400 nm were also reported. A wavelength shift was applied to convert the liquid phase data toaccurate gas phase cross sections at the long wavelengths.
(c) Absorption coefficients for CH3I were determined by diode array spectrometry with a spectral resolution of 0.6 nm.Tabulated cross section values for the indicated range were given. A single absorption band was observed to extend from< 230 nm to 365 nm with a maximum at 260 nm where the absorption cross section wasσ = (1.09±0.08)× 10−18 cm2
molecule−1 at 298 K. The temperature dependence of the absorption cross section was determined over the range 243–333K; broadening of the band was observed giving a significant decline inσ with decreasing temperature in the troposphericphotolysis region (λ > 290 nm).
(d) The absorption spectrum of CH3I (purity > 98%) was recorded by diode array spectrometry with a resolution of 0.3nm. Tabulated cross section values for the indicated range were given. The absolute cross-section at the maximum ofabsorption at 260 nm wasσ = 1.13× 10⁻¹⁸ cm2 molecule−1 with a stated overall uncertainty of±5%. Significant
www.atmos-chem-phys.net/8/4141/2008/ Atmos. Chem. Phys., 8, 4141–4496, 2008

4482 R. Atkinson et al.: Evaluated kinetic and photochemical data for atmospheric chemistry
temperature dependence of the absorption cross section was observed over the range 228–298 K, with a decrease inσ
with decreasing temperature in the long wavelength tail. A second absorption band is indicated by an increase inσ below210 nm.
(e) Photo-oxidation of CH3I; measurement of loss of CH3I and yield of I2 product.8(-CH3I) = 1.0;8(I2) = 0.5.
(f) Translational energy of the I atoms produced in 266 nm photolysis of CH3I in a molecular beam. Suggested the followingprimary processes:CH3I + hν→ CH3 + I(2P3/2)CH3I + hν→ CH3 + I(2P1/2)with I(2P3/2) production at 78% of the primary process.
(g) Pulsed tunable laser photolysis of CH3I, with I(2P1/2) detection by infra-red fluorescence at 1.315µm. 8{I(2P1/2)}increased from 0.05 to 0.81 over the wavelength range 308–248 nm.
(h) Branching ratio for I(2P1/2)/I(2P3/2) as a function of wavelength determined by an optical acoustic method.
(i) Crossed beam Laser photolysis - core sampling photofragment translational spectroscopy study. I(2P1/2) and I(2P3/2)detected by REMPI + pulsed acceleration TOF MS, giving high kinetic resolution. The8I(2P1/2) 2 + 1 is determinedrelative to the total I atom yield, using a calibration method reported by Kang et al. (1996).
Preferred Values
Absorption cross-sections of CH3I at 298 K
Wavelength/nm 1020 σ /cm2 103 B/K−1
205 7.0210 3.8215 5.2220 6.9225 9.1230 12.6235 20.2 0.67240 37.4 0.61245 63.6 0.34250 92.1 0.08255 111.1 -0.1260 112.3 -0.12265 96.6 0.1270 71.7 0.54275 47.1 1.33280 28.0 2.43285 15.2 3.74290 7.79 4.98295 3.92 6.38300 2.03 6.97305 1.09 6.82310 0.619 6.78315 0.356 6.95
Atmos. Chem. Phys., 8, 4141–4496, 2008 www.atmos-chem-phys.net/8/4141/2008/

R. Atkinson et al.: Evaluated kinetic and photochemical data for atmospheric chemistry 4483
Wavelength/nm 1020 σ /cm2 103 B/K−1
320 0.215 6.94325 0.124 6.79330 0.070 7.82335 0.033 9.34340 0.023 10.95345 0.0127 13.58350 0.0067 16.83355 0.0026 18.91360 0.0013 17.28365 0.0004 23.63
Temperature dependence given by: lnσ = ln σ (298) +B(T -298/K)
Quantum Yield
81 + 82 = 1.0 over the wavelength range 210–360 nm.
Comments on Preferred Values
Porret and Goodeve (1937) measured the absolute absorption cross-sections of methyl iodide in the range 200–360 nm in theirpioneering work on the quantitative investigation of electronic spectra of simple molecules. The first absorption band extendsfrom 360 nm to∼ 210 nm and is attributed to aσ → n transition. The reported cross sections of Jenkin et al. (1993), Rattiganet al. (1997) and Roehl et al. (1997) are in good agreement with each other and with those in the earlier published study(Porret and Goodeve, 1937). The results of Fahr et al. (1995) agree well with the other measurements atλ > 300 nm, but aresignificantly higher by∼20% at the maximum of absorption. The preferred values for the cross-sections at 298 K are basedon the data for the absolute absorption cross-sections reported by Jenkin et al. (1993), Rattigan et al. (1997) and Roehl et al.(1997). The listed values are actual values at 1 nm intervals.
The effect of temperature on the absorption cross-section has been studied by Fahr et al. (1995), Rattigan et al. (1997) andRoehl et al. (1997). All studies show excellent agreement for the temperature dependence and reveal an apparent narrowing ofthe band as temperature decreases, leading to an increase inσ at the band head and a decrease inσ in the long wavelength tailof absorption. The temperature dependence of CH3I absorption has also been investigated by Waschewsky et al. (1996) whoargue that the temperature-dependent cross section measurements are complicated by the presence of dimers and thereforedo not apply to atmospheric spectra. Analysis by Rattigan et al. (1997) and Roehl et al. (1997) of their measurementstaken over an extensive range of pressures and temperatures shows that the effect of dimers must be completely negligible fortheir experimental conditions. The recommended temperature dependence, expressed in terms of a single parameterB in theequation: lnσ = ln σ (298) +B(T -298/K) from the work of Rattigan et al. (1997) is adopted.
The photochemistry of alkyl iodides has been extensively studied since the early investigations of photolytic reactions andhas been reviewed by Majer and Simons (1964), Calvert and Pitts (1966) and Okabe (1978). For methyl iodide the primaryprocess is dissociation into a methyl radical and an iodine atom, processes (1) and (2), occurring with a quantum yield of unity.Reaction (3) may be important following absorption in the vacuum uv (Riley and Wilson, 1972).
The primary photodissociation processes have been studied extensively in conjunction with the laser emission: I(2P1/2)→I(2P3/2) + hν observed at 1.315µm in the near-UV flash photolysis of CH3I (Kasper and Pimentel, 1964). State-selectedphotofragment spectroscopy has shown that I atoms are produced in both the ground I(2P3/2) and the electronically excitedI(2P1/2) state. The relative yields of I(2P1/2) increases with decreasing wavelength below 304 nm to a maximum near themaximum in the A-band absorption of CH3I near 260 nm. This can be rationalised in terms of the correlations of I(2P1/2) andI(2P3/2) states with the3Qo+, 1Q1 and3Q1 electronic states, which haveλmax at 261 nm, 240 nm and 300 nm respectively(Gedanken et al., 1975).
www.atmos-chem-phys.net/8/4141/2008/ Atmos. Chem. Phys., 8, 4141–4496, 2008

4484 R. Atkinson et al.: Evaluated kinetic and photochemical data for atmospheric chemistry
References
Baughcum, S. L. and Leone, J.: Chem. Phys. 72, 6531, 1980.Calvert, J. G. and Pitts, J. N. Jr.: ’Photochemistry’ J. Wiley New York 1966.Christie, M. I. : Proc. Roy. Soc. (London) A 244, 411, 1958.Fahr, A., Nayak, K. A. and Kurylo, M. J.: Chem. Phys. 197, 195, 1995.Gedanken, A. and Rowe, H. D.: Chem. Phys. Lett., 34, 39, 1975.Hunter, T. F., Lunt, S. and Kristjansson, K. S.: J. Chem. Soc. Faraday Soc. 79, 303, 1983.Jenkin, M. E., Murrells, T. P., Shalliker, S. J. and Hayman, G. D. : J. Chem. Soc. Faraday Soc. 89, 433, 1993.Kang, W. K., Jung, K. W., Kim, D.-C. and Jung, K. H.: J. Chem. Phys., 104, 5815, 1996.Kasper, J. V. V. and Pimentel, G. C.: Appl. Physics Lett. 5, 231 1964.Li, G., Shin, Y. K. and Hwang, H. J.: J. Phys. Chem. A 109, 9226, 2005.Majer, J. R. and Simons, J. P.: Adv. Photochem. 2, 137, 1964.Okabe, H.: ”Photochemistry of Small Molecules”, Wiley Interscience, 1978.Porret, D. and Goodeve, C. F.: Trans. Faraday Soc. 33, 690, 1937.Rattigan, O. V., Shallcross, D. E. and Cox, R. A.: J. Chem. Soc. Faraday Trans. 93, 690, 1997.Riley, S. J. and Wilson, K. R.: Disc. Faraday Soc. 53, 132, 1972.Roehl, C. M., Burkholder, J. B., Moortgat, G. K., Ravishankara, A. R. and Crutzen, P. J.: J. Geophys. Res. 102, 12819, 1997.Waschewsky, G. C., Horansky, R. and Vaida, V.: J. Phys. Chem. 100, 11559, 1996.
Atmos. Chem. Phys., 8, 4141–4496, 2008 www.atmos-chem-phys.net/8/4141/2008/

R. Atkinson et al.: Evaluated kinetic and photochemical data for atmospheric chemistry 4485
IV.A4.270
CF3I + hν→ products
Primary photochemical processes
Reaction 1H◦/kJ mol−1 λthreshold/nm
CF3I + hν → CF3 + I(2P3/2) (1) 230 521→ CF3 + I(2P1/2) (2) 320 374
Absorption cross-section data
Wavelength range/nm References Comments
216–370 Solomon et al., 1994 (a)160–340 Fahr et al., 1995 (b)235–400 Rattigan et al., 1997 (c)
Quantum yield data
Measurement Wavelength range/nm References Comments
8{I(2P1/2); I(2P3/2)} 266 Riley and Wilson, 1972 (d)8{I(2P1/2); I(2P3/2)} 304 Kang et al., 1996 (e)8{I(2P1/2); I(2P3/2)} 275-303 Furlan et al., 1996 (f)
Comments
(a) Absorption coefficients for purified CF3I determined by diode array spectrometry, over temperature range 200–298 K.A single absorption band was observed to extend from 370–210 nm with a maximum at 267 nm where the absorptioncoefficient wasσ = 6.0× 10⁻¹⁸ cm2 molecule−1.
(b) The absorption spectrum of CF3I was recorded by diode array spectrometry with a resolution of approx. 1 nm usinga purified sample. The absolute cross-section at the maximum of absorption at 267 nm wasσ = 6.8× 10⁻¹⁸ cm2
molecule−1. A second band extends into the vacuum UV. The temperature dependence over the wavelength range 160–240 nm was determined at 240, 295 and 355 K; and over the range 240–350 nm for 218–333 K.
(c) The absorption spectrum of CF3I was recorded by diode array spectrometry with a resolution of approx. 0.6 nm using apurified sample. The absolute cross-section at the maximum of absorption at 267 nm wasσ = (6.0±0.1)× 10−18 cm2
molecule−1. A second band extends into the vacuum UV. The temperature dependence was determined for 243–333K.
(d) Translational energy of the I atoms produced in 266 nm photolysis of CF3I in a molecular beam. Suggested the followingprimary processes:CF3I + hν→ CF3 + I(2P3/2)CF3I + hν→ CF3 + I(2P1/2)with I(2P3/2) production at 78% of the primary process.
(e) Relative yield of I(2P1/2)/I(2P3/2) determined by (2+1) REMPI and pulsed field TOF-MS following laser photodissocia-tion of CF3I. 8{I(2P1/2)} = 0.69.
(f) Relative yield of I(2P1/2)/I(2P3/2) obtained by high resolution photofragment translational spectrometry using pulsed laserphotolysis and TOF-MS.8{I(2P1/2)} increased from 0.38 at 303 nm to 0.92 at 275 nm.
www.atmos-chem-phys.net/8/4141/2008/ Atmos. Chem. Phys., 8, 4141–4496, 2008

4486 R. Atkinson et al.: Evaluated kinetic and photochemical data for atmospheric chemistry
Preferred Values
Absorption cross-sections of CF3I at 298 K
Wavelength/nm 1020 σ /cm2 103 B/K−1
235 7.5 0.155240 13.4 0.21245 21.4 -0.121250 32.5 -0.45255 45.5 -0.766260 57.3 -0.992265 64.2 -1.07270 63.9 -0.936275 56.9 -0.554280 45.6 -0.0505285 33.8 1.02290 23.0 2.18295 14.6 3.34300 8.81 4.56305 5.13 5.81310 2.88 6.82315 0.907 7.89325 0.49 8.22330 0.263 8.57335 0.144 9.06340 0.0771 9.98345 0.0393 10.9350 0.0208 12.5355 0.0115 13.3360 0.0064 14.6365 0.0036 14.6370 0.002 15.5375 0.0011 17.1380 0.0007 17.7385 0.0004 19.7390 0.0001 22.6
Temperature dependence given by: lnσ = ln σ (298) +B(T -298/K)
Quantum Yield
81 + 82 = 1.0 over the wavelength range 210–360 nm.
Comments on Preferred Values
There is excellent agreement between all three reported data sets for the cross section and its temperature dependence. Themaximum of the first absorption band is lower and red-shifted compared with methyl iodide. The band narrowed with decreas-ing temperature leading to a significant decrease in the cross section in the long wavelength tail; at 320 nm the value decreasesby nearly 50% at 200 K. The recommended values forσ and its temperature dependence are the mean of all three studies(Solomon et al., 1994; Fahr et al., 1995; Rattigan et al. 1997).
Photolysis is expected to occur with quantum efficiency by breaking of the C-I bond to yield CF3 + I. State-selectedphotofragment spectroscopy has shown that I atoms are produced predominantly in the excited state I(2P1/2), following pho-todissociation of CF3I near the band maximum. The branching ratio for: I(2P1/2)/I(2P3/2) production decreases at longer
Atmos. Chem. Phys., 8, 4141–4496, 2008 www.atmos-chem-phys.net/8/4141/2008/

R. Atkinson et al.: Evaluated kinetic and photochemical data for atmospheric chemistry 4487
wavelengths but there is some disagreement in the actual values (Riley and Wilson, 1972; Kang et al., 1996; Furlan et al.,1996).
References
Fahr, A,. Nayak, A. K. and Huie, R. E.: Chem. Phys. 199, 275, 1995.Furlan, A., Gejo, T. and Huber, J. R.: J. Phys. Chem. 100, 7956, 1996.Kang, W. K., Jung, K. W., Kim, D. C. and Jung, H. H.: J. Chem. Phys. 104, 5815, 1996.Rattigan, O. V., Shallcross, D. E. and Cox, R. A.: J. Chem. Soc. Faraday Trans. 93, 2839, 1997.Riley, S. J. and Wilson, K. R.: Disc. Faraday Soc. 53, 132, 1972.Solomon, S., Burkholder, J. B., Ravishankara, A. R. and Garcia, R. R.: J. Geophys. Res. 99, 20929, 1994.
www.atmos-chem-phys.net/8/4141/2008/ Atmos. Chem. Phys., 8, 4141–4496, 2008

4488 R. Atkinson et al.: Evaluated kinetic and photochemical data for atmospheric chemistry
IV.A4.271
CH2ClI + h ν→ products
Primary photochemical processes
Reaction 1H◦/kJ mol−1 λthreshold/nm
CH2ClI + hν → CH2Cl + I (1) 217 551→ CH2I + Cl (2) 344 347
Absorption cross-section data
Wavelength range/nm Reference Comments
235–390 Rattigan et al., 1997 (a)200–380 Roehl et al., 1997 (b)
Quantum yield data
Measurement Wavelength range/nm Reference Comments
8(I2) 266 Schmitt and Comes, 1987 (c)8{I(2P1/2)} = 0.44 222 Senapati et al., 2002 (d)8{I(2P1/2)} = 0.50 2368{I(2P1/2)} = 0.50 2668{I(2P1/2)} = 0.55 2808{Cl(2P1/2)} = 0.34 304 Senapati and Das, 2004 (e)8{Cl(2P1/2)} = 0.44 2228{Cl(2P1/2)} = 0.44 2668{Cl(2P1/2)} = 0.30 2808{Cl(2P1/2)} = 0.22 304
Comments
(a) Absorption coefficients for CH2CII (purity 98%) were determined by diode array spectrometry with a spectral resolutionof 0.6 nm. A single absorption band was observed to extend from 230–400 nm with a maximum at 270 nm wherethe absorption coefficient wasσ = (1.21± 0.07)× 10−18 cm2 molecule−1 at 298 K. The temperature dependence ofthe absorption cross section was determined over the range 243-333 K; broadening of the band was observed giving asignificant decline inσ with decreasing temperature in the tropospheric photolysis region (λ > 290 nm).
(b) The absorption spectrum of CH2ClI (purity 97%) was recorded by by diode array spectrometry with a resolution of 0.3nm. The absolute cross section at the maximum of absorption at 270 nm wasσ = 1.35× 10⁻¹⁸ cm2 molecule−1 witha stated overall uncertainty of± 5%. Significance temperature dependence of the absorption cross section was observedover the range 228-298 K, with a decrease inσ with a decrease in temperature in the long wavelength tail. A secondabsorption band is indicated by an increase inσ below 220 nm.
(c) Laser photolysis of CH2ClI; measurement of yield of I2 by time resolved laser absorption spectroscopy at 514.5 nm.
(d) Laser Photolysis-REMPI detection of I(2P1/2) and I(2P3/2).
(e) Laser Photolysis-REMPI detection of Cl(2P1/2) and Cl(2P3/2). 8 determined relative to8{I(2P1/2)} production at thesame wavelength.
Atmos. Chem. Phys., 8, 4141–4496, 2008 www.atmos-chem-phys.net/8/4141/2008/
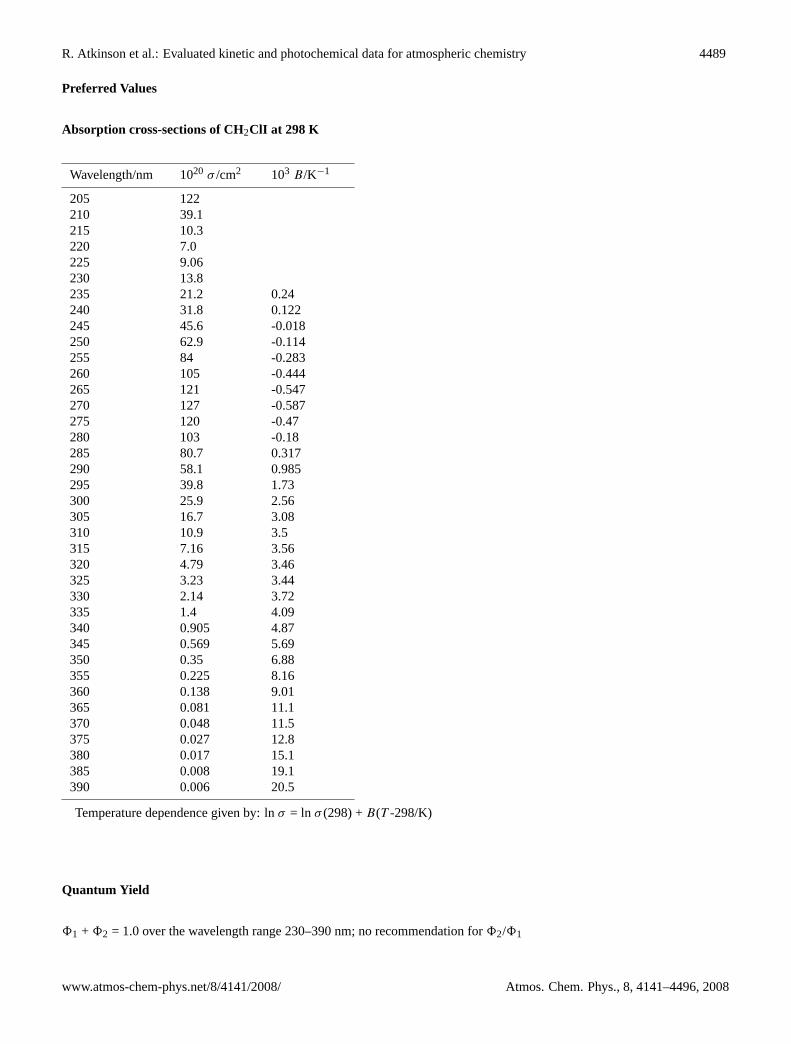
R. Atkinson et al.: Evaluated kinetic and photochemical data for atmospheric chemistry 4489
Preferred Values
Absorption cross-sections of CH2ClI at 298 K
Wavelength/nm 1020 σ /cm2 103 B/K−1
205 122210 39.1215 10.3220 7.0225 9.06230 13.8235 21.2 0.24240 31.8 0.122245 45.6 -0.018250 62.9 -0.114255 84 -0.283260 105 -0.444265 121 -0.547270 127 -0.587275 120 -0.47280 103 -0.18285 80.7 0.317290 58.1 0.985295 39.8 1.73300 25.9 2.56305 16.7 3.08310 10.9 3.5315 7.16 3.56320 4.79 3.46325 3.23 3.44330 2.14 3.72335 1.4 4.09340 0.905 4.87345 0.569 5.69350 0.35 6.88355 0.225 8.16360 0.138 9.01365 0.081 11.1370 0.048 11.5375 0.027 12.8380 0.017 15.1385 0.008 19.1390 0.006 20.5
Temperature dependence given by: lnσ = ln σ (298) +B(T -298/K)
Quantum Yield
81 + 82 = 1.0 over the wavelength range 230–390 nm; no recommendation for82/81
www.atmos-chem-phys.net/8/4141/2008/ Atmos. Chem. Phys., 8, 4141–4496, 2008

4490 R. Atkinson et al.: Evaluated kinetic and photochemical data for atmospheric chemistry
Comments on Preferred Values
The data of Rattigan et al. (1997) and Roehl et al. (1997) are in excellent agreement both in terms of the absolute absorptioncross sections, and their temperature dependence as a function of wavelength. The earlier data of Schmitt and Comes (1987)also showed a maximum at 270 nm but the absolute cross section was higher (1.5× 10⁻¹⁸ cm2 molecule−1). The preferredvalues for the cross-sections are a simple mean of data of Rattigan et al. (1997) and Roehl et al. (1997), and the temperaturedependence, expressed in terms of a single parameter B in the equation: lnσ = ln σ (298) + B(T - 298/K) from the work ofRattigan et al. (1997) is adopted.
The photodecomposition of CH2ClI studied by Schmitt and Comes (1987) indicated dissociation via reaction (1), in linewith other alkyl iodides, occurring with a quantum yield of unity. The quantum yield of I(2P1/2) are reported by Senapatiet al., (2002), who observed a similar trend with wavelength as that observed for photolysis of CH3I. This suggests that thephotodissociation occurs from 3 upper states similar to methyl iodide. However, Senapati and Das 2004 observed Cl(2P1/2)production and measured yields (relative to I(2P1/2)), which decrease with increasing wavelength in the range 222≤ λ ≤ 304nm. An inter-chromophore energy transfer mechanism between C-I and C-Cl chromophore is proposed to rationalise Cl(2P1/2)production.
On the basis of available data it is not possible to recommend a branching ratio for Cl atom formation, but I atom productionwill predominate in tropospheric photolysis.
References
Rattigan, O. V., Shallcross, D. E. and Cox, R. A.: J. Chem. Soc. Farad. Trans. 93, 2839, 1997.Roehl, C. M., Burkholder, J. B., Moortgat, G. K., Ravishankara, A. R. and Crutzen, P. J.: J. Geophys. Res. 102, 12819, 1997.Schmitt, G. and Comes, F. J.: J. Photochem. Photobiol. A, 41, 13, 1987.Senapati, D., Kavita, K. and Das, P. K.: J. Phys. Chem. A, 106, 8479, 2002.Senapati, D. and Das, P. K.: Chem. Phys. Lett., 393, 535, 2004.
Atmos. Chem. Phys., 8, 4141–4496, 2008 www.atmos-chem-phys.net/8/4141/2008/

R. Atkinson et al.: Evaluated kinetic and photochemical data for atmospheric chemistry 4491
IV.A4.272
CH2BrI + h ν→ products
Primary photochemical processes
Reaction 1H◦/kJ mol−1 λthreshold/nm
CH2BrI + hν → CH2Br + I (1) 214 559→ CH2I + Br (2) 280 427→ CH2 + IBr (3) 369 324
Absorption cross-section data
Wavelength range/nm Reference Comments
215–390 Mossinger et al., 1998 (a)
Quantum yield data
Measurement Wavelength range/nm Reference Comments
81/82 = 6 240-340 Lee and Bersohn, 1982 (b)81/82 = 6 248 Butler et al., 1987 (c)
Comments
(a) Absorption coefficients for CH2BrI (purity 98%) were determined by diode array spectrometry with a spectral resolutionof 0.6 nm. The purity of the CH2BrI sample was 92%, the main imputities being CH2Br2 (6.5%) and CH2I2 1.5%). Acorrection was applied for absorption by these impurities using spectra obtained in the same spectrometer. Tabulated crosssection values for the indicated range were given. Two broad absorption bands attributed to CH2BrI were observed withmaxima at 215nm and 270 nm where the absorption cross sections wereσ = (5.67±0.34)× 10−18 cm2 molecule−1 andσ = (2.34±0.14)× 10−18 cm2 molecule−1 respectively at 298 K. The temperature dependence of the absorption crosssection was determined over the range 273-348 K; broadening of both bands was observed giving a significant decline inσ with decreasing temperature in the tropospheric photolysis region (λ > 290 nm).
(b) Photodissociation of CH2BrI with broadband light source; dissociation fragments measured by mass spectrometry.Branching ratio for C-I and C-Br bond fission reported. These workers also reported a UV spectrum.
(c) Product state distributions measured for laser photodissociation CH2BrI at 193.3, 210, and 248.5 nm of in a molecularbeam, using TOF-MS. At 248.5 nm both C-I and C-Br bond fission occurs, with I formation dominant, producing groundstate2P3/2 and excited state2P1/2 atoms in ratio of 1.0:0.75. At shorter wavelengths elimination of IBr was also observed.
www.atmos-chem-phys.net/8/4141/2008/ Atmos. Chem. Phys., 8, 4141–4496, 2008

4492 R. Atkinson et al.: Evaluated kinetic and photochemical data for atmospheric chemistry
Preferred Values
Absorption cross-sections of CH2BrI at 298 K
Wavelength/nm 1020 σ /cm2 103 B/K−1
215 567 -2.16220 423 -0.12225 269 1.34230 155 2.06235 97.9 2.05240 80.9 1.01245 93.7 0.0250 125 -0.58255 170 -1.16260 207 -1.29265 228 -1.45270 229 -1.73275 214 -1.22280 184 -0.94285 150 -0.53290 110 0.1295 82.5 0.63300 60.6 1.03305 42.9 1.13310 31.4 1.41315 23.1 1.52320 16.8 1.71325 11.5 2.36330 8.02 2.99335 5.52 3.89340 3.50 4.79345 2.24 5.74350 1.41 6.73355 0.817 9.47360 0.498 11.5365 0.302 11.6370 0.165 14.3375 0.098 17.4380 0.070385 0.039390 0.025
Temperature dependence given by: lnσ = ln σ (298) +B(T -298/K)
Quantum Yield
81 = 1.0 over the wavelength range 290–380 nm.
Comments on Preferred Values
The preferred values for the cross sections and the temperature dependence are those of Mossinger et al. (1998), which appearsto be the only reported study where absolute cross section were reported. Cross sections obtained for other halocarbons by this
Atmos. Chem. Phys., 8, 4141–4496, 2008 www.atmos-chem-phys.net/8/4141/2008/

R. Atkinson et al.: Evaluated kinetic and photochemical data for atmospheric chemistry 4493
group agree well with other literature data and the CH2BrI data can be considered reliable. The absorption spectrum agreeswith earlier reported spectra (Lee and R. Bersohn, 1982; Butler et al., 1987), which show two broad bands peaking at 270 nmand 215 nm which are assigned to promotion of electrons from non-bonding orbitals in the C-I and C-Br bonds respectively.
The photodissociation of CH2BrI via reaction (1) is expected to occur in the first absorption band with a quantum yield ofunity, in line with other alkyl iodides. Studies of the photodissociation fragments (Lee and Bersohn, 1982) show that reaction(2) is dominant following absorption in the second band at 210 nm and that both processes occur in the region where the bandsoverlap. In the region for tropospheric photolysis (λ > 290 nm) reaction (1) will dominate.
References
Butler, L. J., Hintsa, E. J,. Shane, S. F. and Lee, Y. T.: J. Phys. Chem. 86, 2051, 1987.Lee, S. J. and Bersohn, R.: J. Phys. Chem. 86, 728, 1982.Mossinger, J. C., Shallcross, D. E. and Cox, R. A.: J. Chem. Soc. Farad. Trans. 94, 1391, 1998.
www.atmos-chem-phys.net/8/4141/2008/ Atmos. Chem. Phys., 8, 4141–4496, 2008
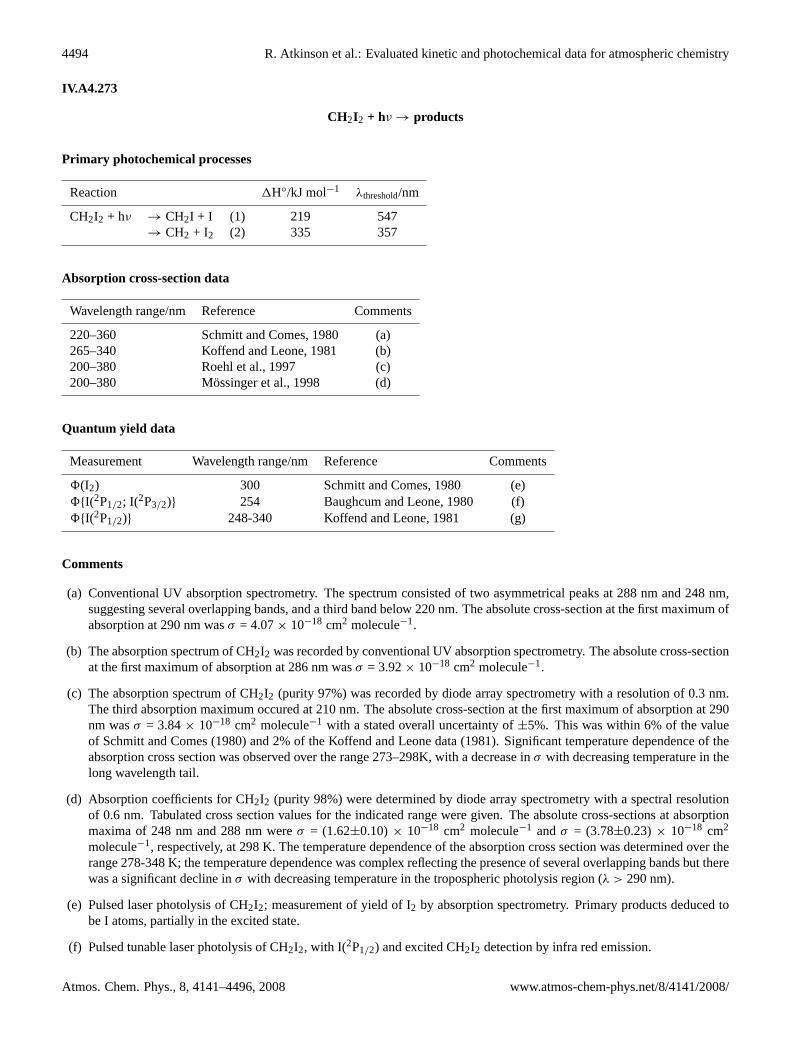
4494 R. Atkinson et al.: Evaluated kinetic and photochemical data for atmospheric chemistry
IV.A4.273
CH2I2 + hν→ products
Primary photochemical processes
Reaction 1H◦/kJ mol−1 λthreshold/nm
CH2I2 + hν → CH2I + I (1) 219 547→ CH2 + I2 (2) 335 357
Absorption cross-section data
Wavelength range/nm Reference Comments
220–360 Schmitt and Comes, 1980 (a)265–340 Koffend and Leone, 1981 (b)200–380 Roehl et al., 1997 (c)200–380 Mossinger et al., 1998 (d)
Quantum yield data
Measurement Wavelength range/nm Reference Comments
8(I2) 300 Schmitt and Comes, 1980 (e)8{I(2P1/2; I(2P3/2)} 254 Baughcum and Leone, 1980 (f)8{I(2P1/2)} 248-340 Koffend and Leone, 1981 (g)
Comments
(a) Conventional UV absorption spectrometry. The spectrum consisted of two asymmetrical peaks at 288 nm and 248 nm,suggesting several overlapping bands, and a third band below 220 nm. The absolute cross-section at the first maximum ofabsorption at 290 nm wasσ = 4.07× 10⁻¹⁸ cm2 molecule−1.
(b) The absorption spectrum of CH2I2 was recorded by conventional UV absorption spectrometry. The absolute cross-sectionat the first maximum of absorption at 286 nm wasσ = 3.92× 10⁻¹⁸ cm2 molecule−1.
(c) The absorption spectrum of CH2I2 (purity 97%) was recorded by diode array spectrometry with a resolution of 0.3 nm.The third absorption maximum occured at 210 nm. The absolute cross-section at the first maximum of absorption at 290nm wasσ = 3.84× 10⁻¹⁸ cm2 molecule−1 with a stated overall uncertainty of±5%. This was within 6% of the valueof Schmitt and Comes (1980) and 2% of the Koffend and Leone data (1981). Significant temperature dependence of theabsorption cross section was observed over the range 273–298K, with a decrease inσ with decreasing temperature in thelong wavelength tail.
(d) Absorption coefficients for CH2I2 (purity 98%) were determined by diode array spectrometry with a spectral resolutionof 0.6 nm. Tabulated cross section values for the indicated range were given. The absolute cross-sections at absorptionmaxima of 248 nm and 288 nm wereσ = (1.62±0.10)× 10−18 cm2 molecule−1 andσ = (3.78±0.23)× 10−18 cm2
molecule−1, respectively, at 298 K. The temperature dependence of the absorption cross section was determined over therange 278-348 K; the temperature dependence was complex reflecting the presence of several overlapping bands but therewas a significant decline inσ with decreasing temperature in the tropospheric photolysis region (λ > 290 nm).
(e) Pulsed laser photolysis of CH2I2; measurement of yield of I2 by absorption spectrometry. Primary products deduced tobe I atoms, partially in the excited state.
(f) Pulsed tunable laser photolysis of CH2I2, with I(2P1/2) and excited CH2I2 detection by infra red emission.
Atmos. Chem. Phys., 8, 4141–4496, 2008 www.atmos-chem-phys.net/8/4141/2008/

R. Atkinson et al.: Evaluated kinetic and photochemical data for atmospheric chemistry 4495
(g) Pulsed tunable laser photolysis of CH2I2, with I(2P1/2) detection by infra red fluorescence at 1.315µm. 8{I(2P1/2)}increased from zero to 0.46 over the wavelength range 340 – 248 nm.
Preferred Values
Absorption cross-sections of CH2I2 at 298 K
Wavelength/nm 1020 σ /cm2 103 B/K−1
205 407210 404215 322 0.1515220 260 0.14225 198 0.19230 132 0.51235 109 0.56240 123 0.15245 150 0.18250 157 0.67255 140 1.58260 120 2.04265 130 1.30270 179 0275 255 -0.71280 328 -1.24285 373 -1.21290 381 -0.94295 372 -0.58300 357 -0.37305 338 0310 314 0.07315 280 0.15320 244 0.27325 203 0.27330 161 0.51335 120 0.55340 83.3 1.36345 53.7 1.99350 32.6 3.19355 19.2 4.09360 10.9 5.39365 6.05 6.77370 3.4 8.25375 1.93 11.3380 1.16385 0.77
Temperature dependence given by: lnσ = ln σ (298) +B(T -298/K)
Quantum Yield
81 = 1.0 over the wavelength range 230–380 nm.
www.atmos-chem-phys.net/8/4141/2008/ Atmos. Chem. Phys., 8, 4141–4496, 2008

4496 R. Atkinson et al.: Evaluated kinetic and photochemical data for atmospheric chemistry
Comments on Preferred Values
There is good agreement between all the reported absorption spectra of CH2I2. The cross section data of Roehl et al. (1997) andMossinger et al. (1998) are in excellent agreement both in terms of the absolute absorption cross sections, and its temperaturedependence as a function of wavelength, expressed in terms of a single parameterB in the equation lnσ = ln σ (298) +B(T -298/K). The preferred values for the cross-sections are a simple mean from both data sets, and the temperature dependence ofMossinger et al. (1998) is adopted since it is based on a wider range of temperature.
The study of the photodecomposition of CH2I2 by Schmitt and Comes (1980) indicated dissociation via reaction (1), in linewith other alkyl iodides, occurring with a quantum yield of unity. Reaction (2) may be important following absorption in theband centered atλ = 215 nm. A significant fraction of I atoms are formed in the excited state in the tropospheric photolysis ofCH2I2.
References
Baughcum, S. L. and. Leone, S. R.: J. Chem. Phys. 72, 6531, 1980.Koffend, J. B. and Leone, S. R.: Chem. Phys. Lett. 81, 136, 1981.Mossinger, J. C., Shallcross, D. E. and Cox, R. A.: J. Chem. Soc. Faraday Trans. 94, 1391, 1998.Roehl, C. M., Burkholder, J. B., Moortgat, G. K., Ravishankara, A. R. and Crutzen, P. J.: J. Geophys. Res. 102, 12819, 1997.Schmitt, G. and Comes, F. J.: J. Photochem. 14, 107, 1980.
Atmos. Chem. Phys., 8, 4141–4496, 2008 www.atmos-chem-phys.net/8/4141/2008/