accounting for sustainability - tmi · accounting for sustainability ... millennium ecosystem...
TRANSCRIPT
1
Simon [email protected]
Accounting for
sustainability
(Inconv enient Truths and Conv enient Solutions)
Source: Global Footprint Network / Best Foot Forward
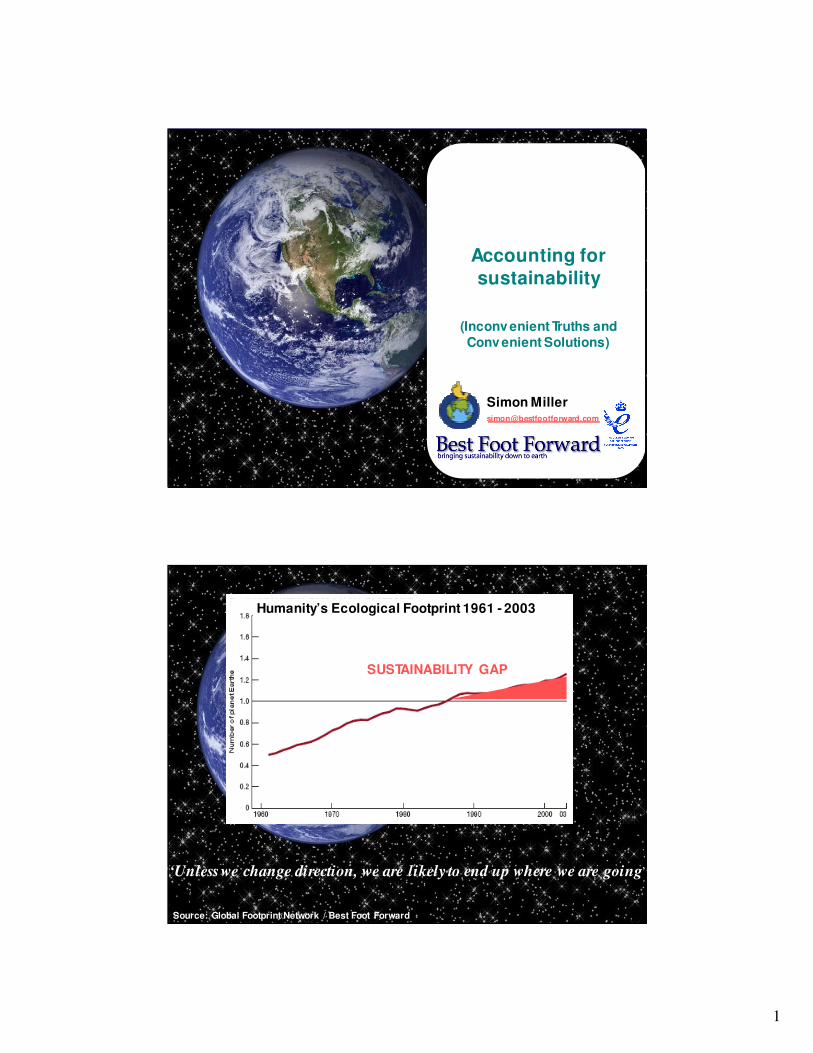
Humanity’s Ecological Footprint 1961 - 2003
SUSTAINABILITY GAP
“Unless we change direction, we are likely to end up where we are going”
2
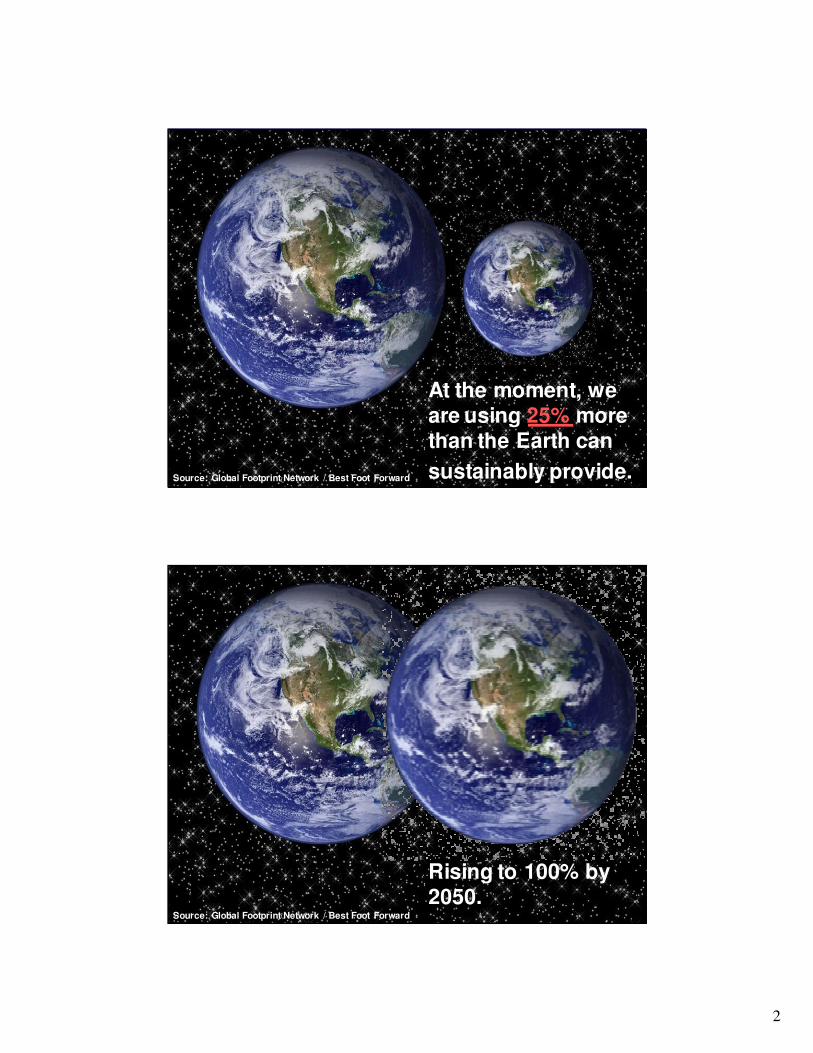
At the moment, we are using 25% more than the Earth can
sustainably provide.Source: Global Footprint Network / Best Foot Forward
Rising to 100% by 2050.
Source: Global Footprint Network / Best Foot Forward
3
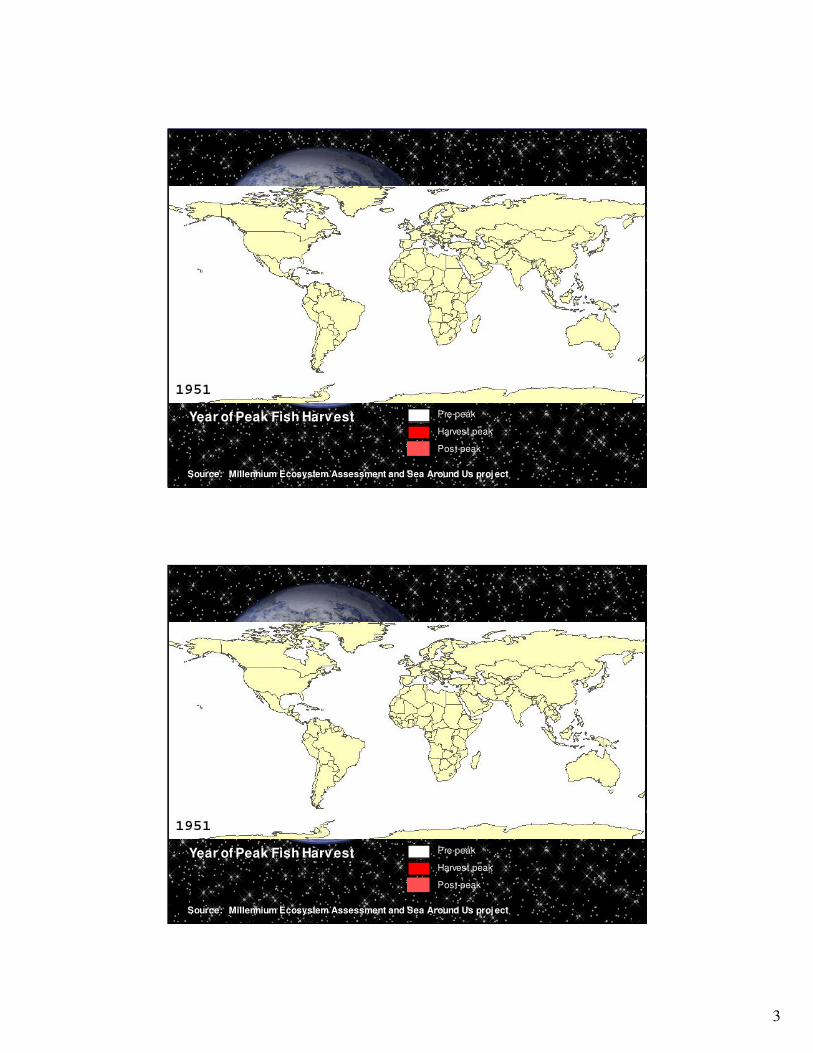
Year of Peak Fish Harv estHarvest peak
Pre-peak
Post-peak
Source: Millennium Ecosystem Assessment and Sea Around Us proj ect
Year of Peak Fish Harv estHarvest peak
Pre-peak
Post-peak
Source: Millennium Ecosystem Assessment and Sea Around Us proj ect
4
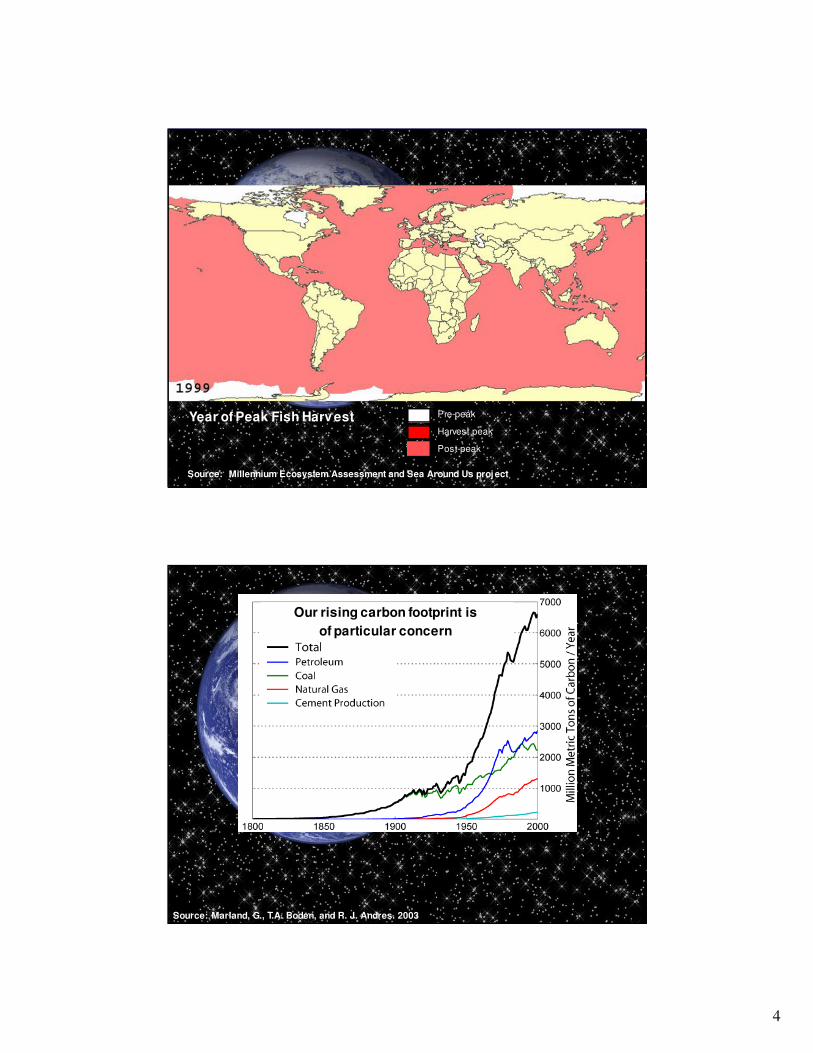
Year of Peak Fish Harv estHarvest peak
Pre-peak
Post-peak
Source: Millennium Ecosystem Assessment and Sea Around Us proj ect
Source: Marland, G., T.A. Boden, and R. J. Andres. 2003
Our rising carbon footprint is
of particular concern
5
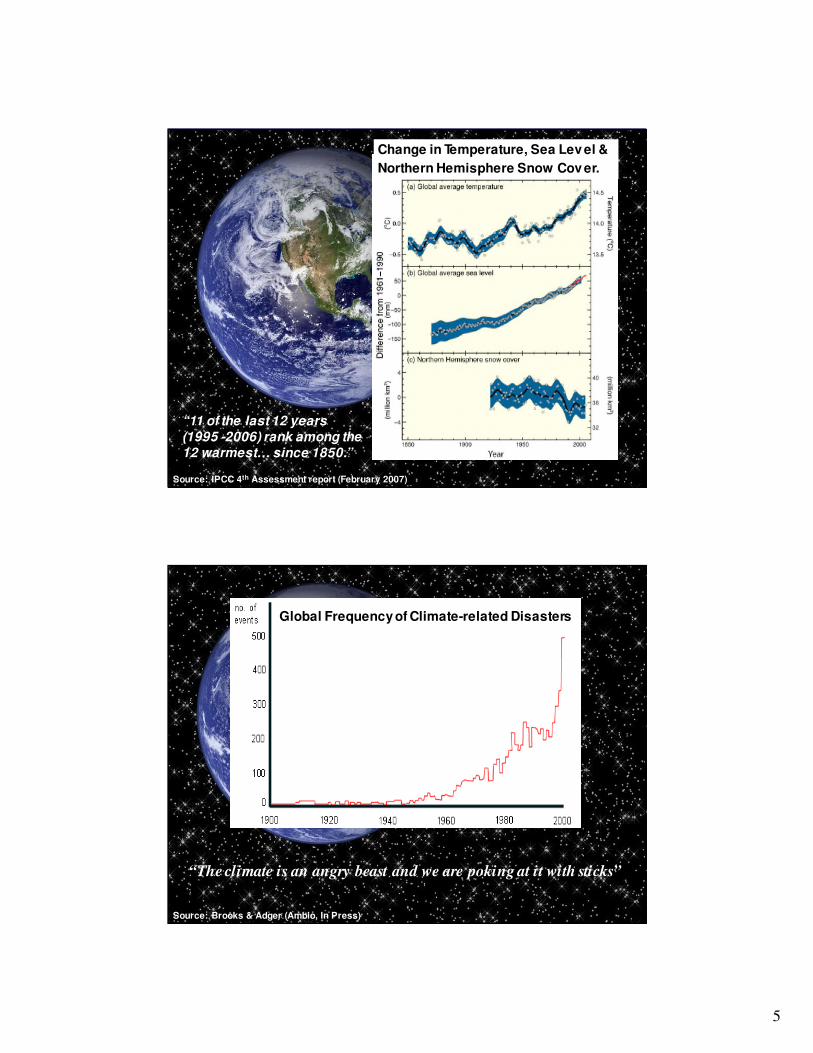
Source: IPCC 4th Assessment report (February 2007)
Change in Temperature, Sea Lev el &
Northern Hemisphere Snow Cov er.
“11 of the last 12 years (1995 -2006) rank among the 12 warmest… since 1850.”
Source: Brooks & Adger (Ambio, In Press)
Global Frequency of Climate-related Disasters
“The climate is an angry beast and we are poking at it with sticks”
6
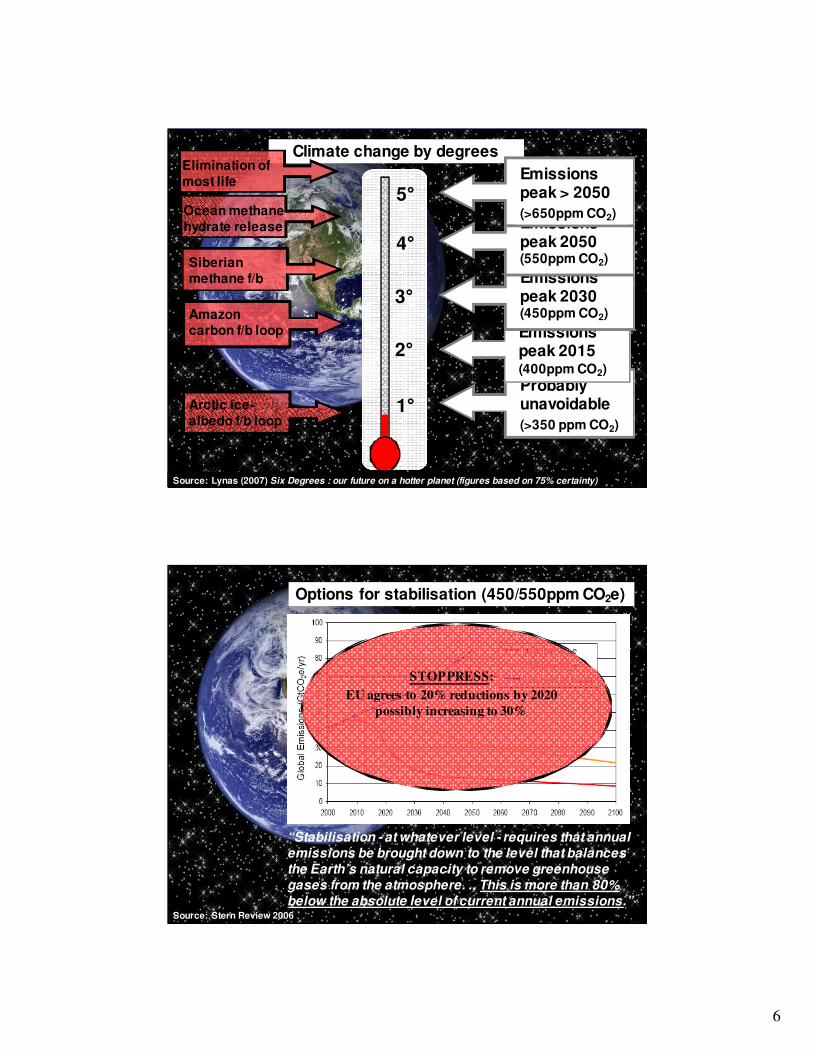
Climate change by degrees
Probably unavoidable
(>350 ppm CO2)
Emissions peak 2015 (400ppm CO2)
Emissions peak 2030 (450ppm CO2)
Emissions peak 2050 (550ppm CO2)
Emissions peak > 2050
(>650ppm CO2)
Amazon carbon f/b loop
Arctic ice-albedo f/b loop
Siberian methane f/b
Ocean methane hydrate release
Elimination of most life
1°
2°
3°
4°
5°
Source: Lynas (2007) Six Degrees : our future on a hotter planet (figures based on 75% certainty)
Options for stabilisation (450/550ppm CO2e)
Source: Stern Review 2006
“Stabilisation - at whatever level - requires that annual emissions be brought down to the level that balances the Earth’s natural capacity to remove greenhouse gases from the atmosphere. .. This is more than 80% below the absolute level of current annual emissions.”
STOP PRESS:
EU agrees to 20% reductions by 2020
possibly increasing to 30%
7
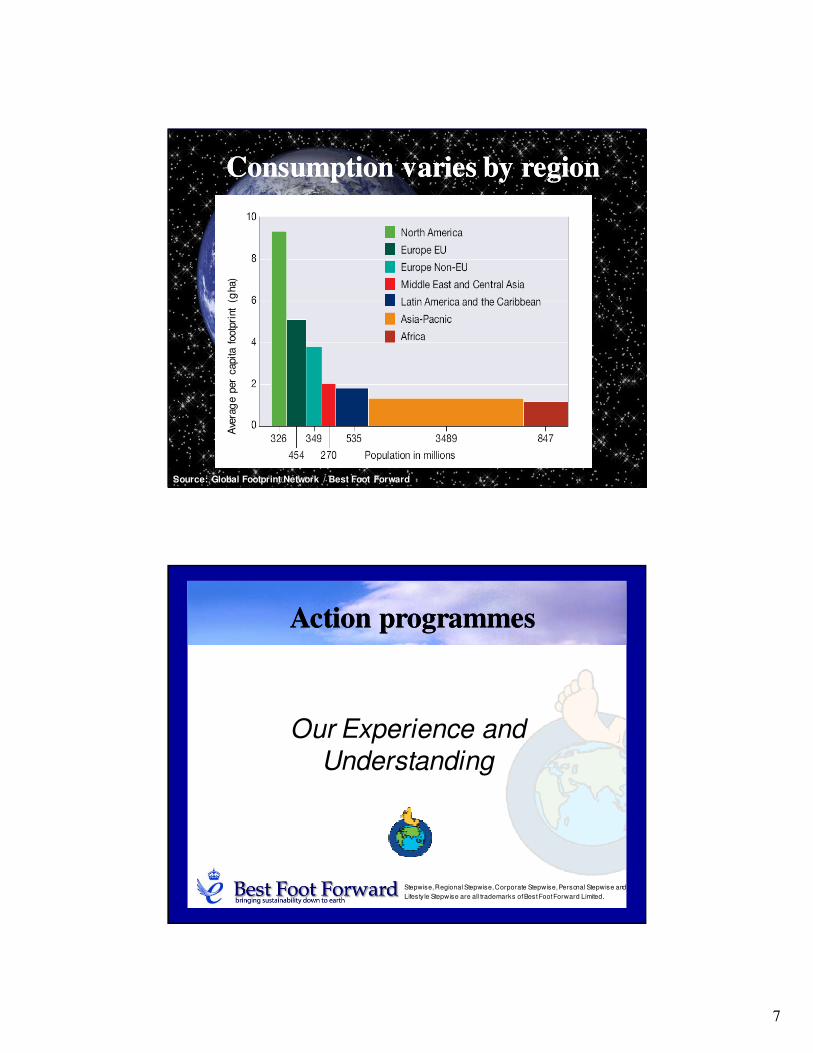
Consumption varies by regionConsumption varies by region
Ave
rag
e p
er
capita f
ootp
rint
(gha)
Source: Global Footprint Network / Best Foot Forward
Action programmesAction programmes
Our Experience and
Understanding
Stepwise, Regional Stepwise, Corporate Stepwise, Personal Stepwise and
Lifesty le Stepwise are all trademarks of Best Foot Forward Limited.
8
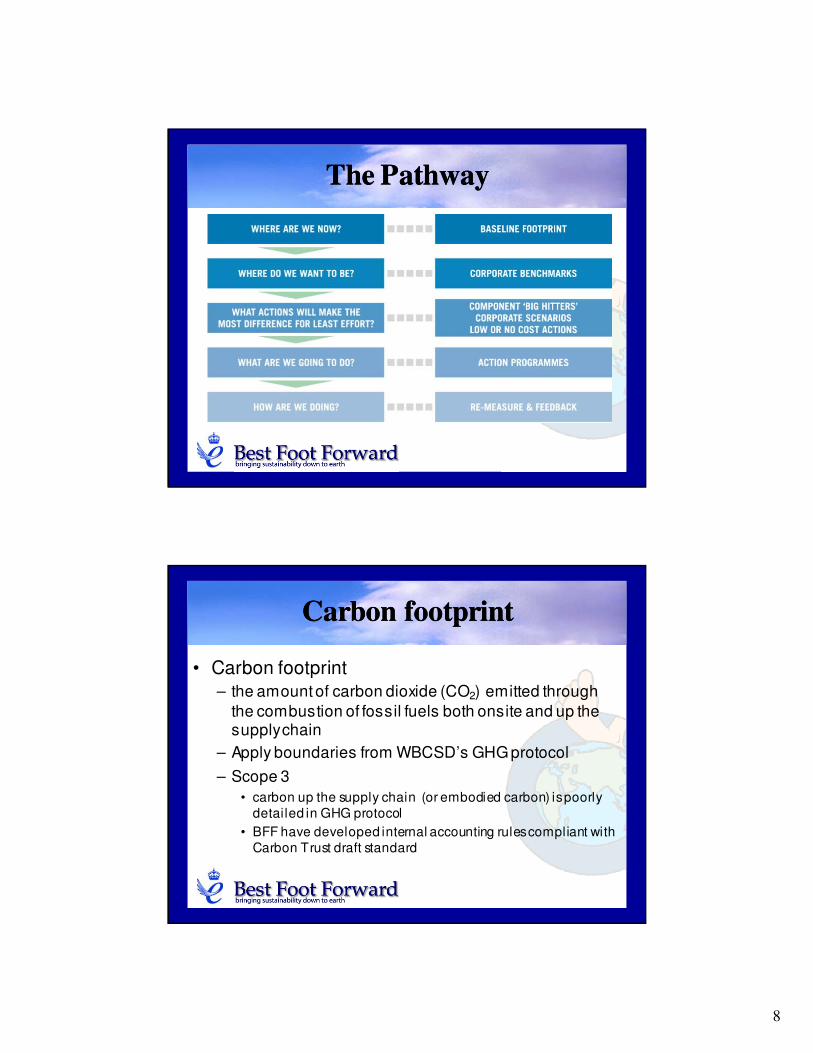
The PathwayThe Pathway
Carbon footprintCarbon footprint
• Carbon footprint
– the amount of carbon dioxide (CO2) emitted through
the combustion of fossil fuels both onsite and up the supply chain
– Apply boundaries from WBCSD’s GHG protocol
– Scope 3
• carbon up the supply chain (or embodied carbon) is poorly
detailed in GHG protocol
• BFF have developed internal accounting rules compliant with
Carbon Trust draft standard
9
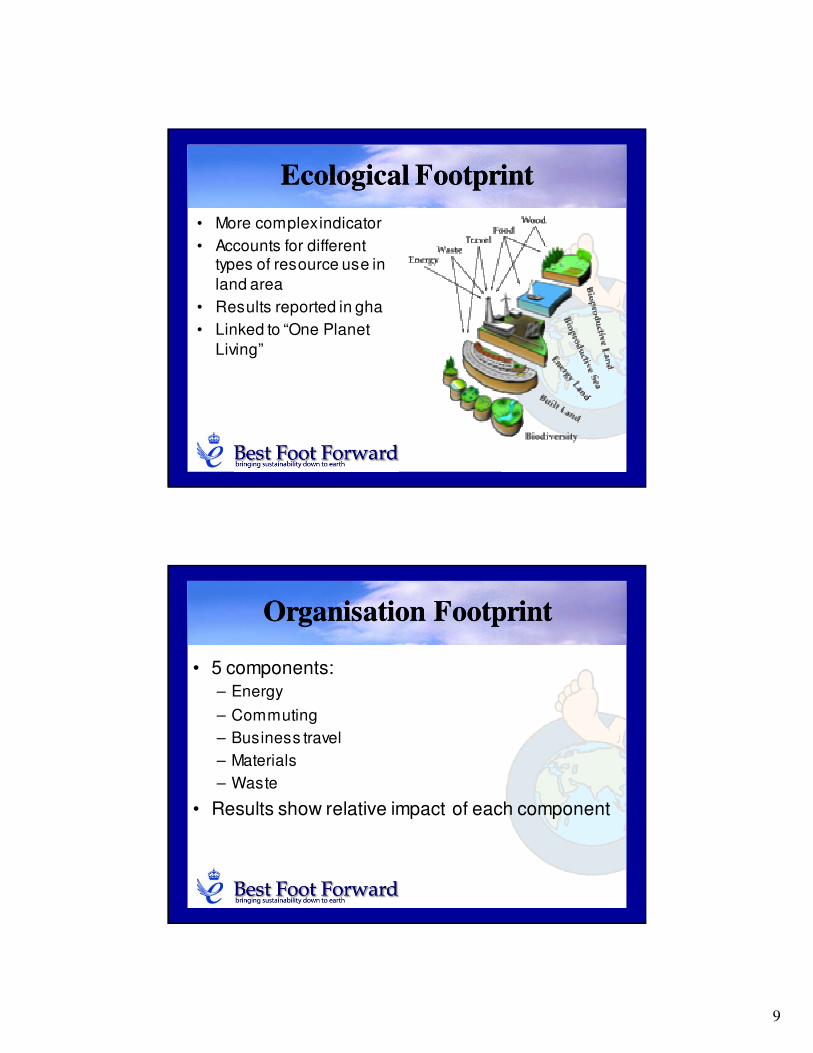
Ecological FootprintEcological Footprint
• More complex indicator
• Accounts for different types of resource use in
land area
• Results reported in gha
• Linked to “One Planet
Living”
Organisation FootprintOrganisation Footprint
• 5 components:
– Energy
– Commuting
– Business travel
– Materials
– Waste
• Results show relative impact of each component
10
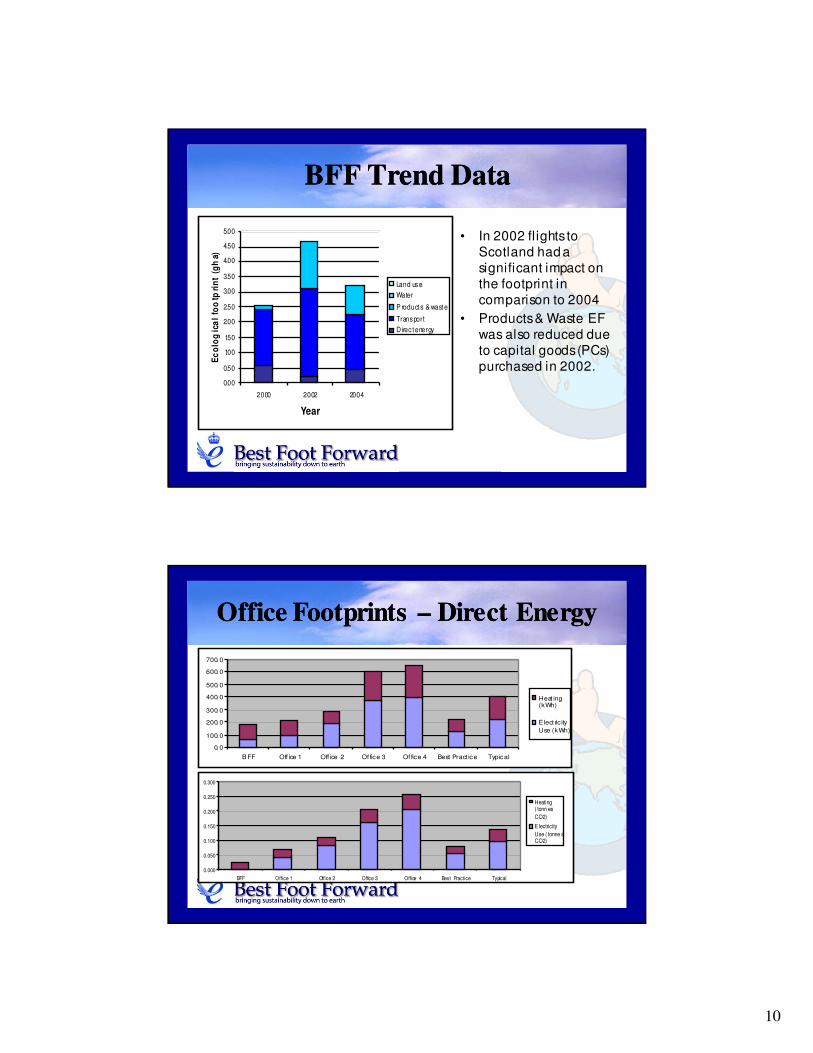
BFF Trend DataBFF Trend Data
• In 2002 fl ights to
Scotland had a
significant impact on
the footprint in
comparison to 2004
• Products & Waste EF
was also reduced due
to capital goods (PCs)
purchased in 2002.0.00
0.50
1.00
1.50
2.00
2.50
3.00
3.50
4.00
4.50
5.00
2000 2002 2004
Year
Ec
olo
gic
al
foo
tpri
nt
(gh
a)
Land use
Water
P roduct s & wast e
Transport
D irec t energy
Office Footprints Office Footprints –– Direct EnergyDirect Energy
0.0
100.0
200.0
300.0
400.0
500.0
600.0
700.0
BFF Off ice 1 Off ice 2 Of fice 3 Of fice 4 Best Pract ice Typical
Heat ing(kWh)
E lect ric ity
Use (kWh)
0.000
0.050
0.100
0.150
0.200
0.250
0.300
BFF Office 1 Office 2 Office 3 Office 4 Best Practice Typical
Heating( tonn es
CO2)
Electricity
Use ( tonne sCO2)
11
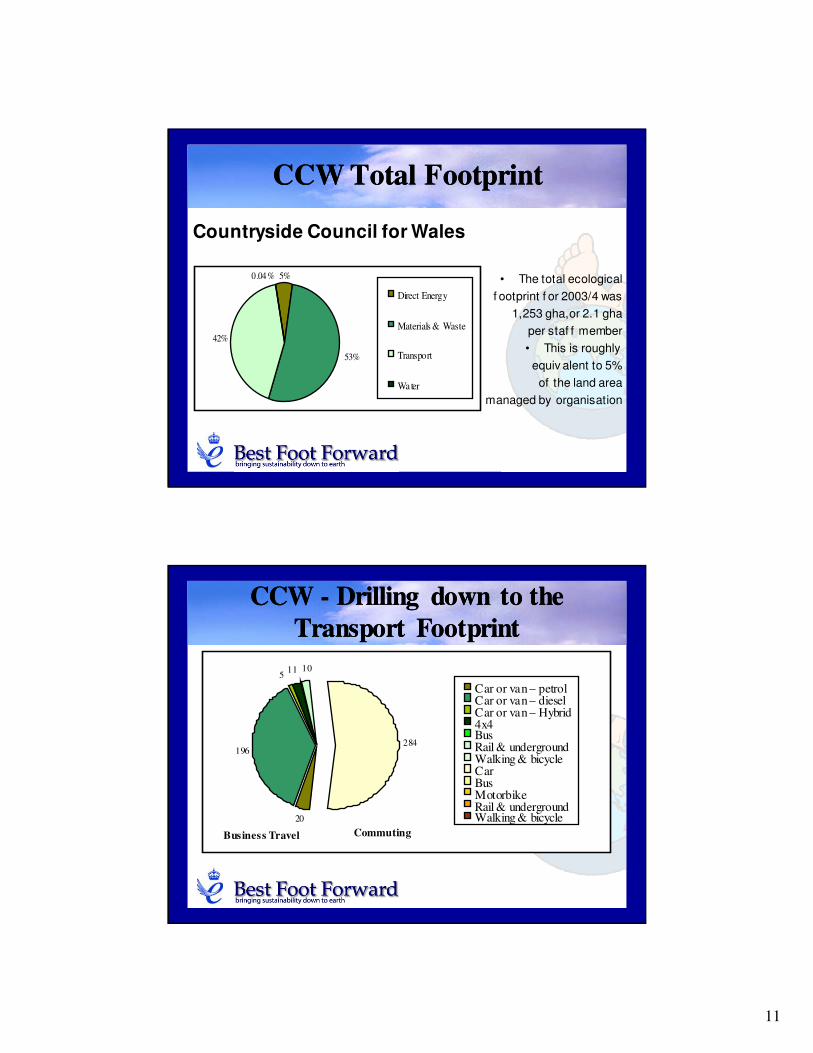
CCW Total Footprint CCW Total Footprint
Countryside Council for Wales
• The total ecological
f ootprint f or 2003/4 was
1,253 gha,or 2.1 gha
per staf f member
• This is roughly
equiv alent to 5%
of the land area
managed by organisation
42%
0.04% 5%
53%
Direct Energy
Materials & Waste
Transport
Water
CCW CCW -- Drilling down to the Drilling down to the
Transport FootprintTransport Footprint
20
284196
11
Commuting
105
Business Travel
Car or van – petrolCar or van – dieselCar or van – Hybrid 4x4Bus Rail & undergroundWalking & bicycleCarBus MotorbikeRail & undergroundWalking & bicycle
12
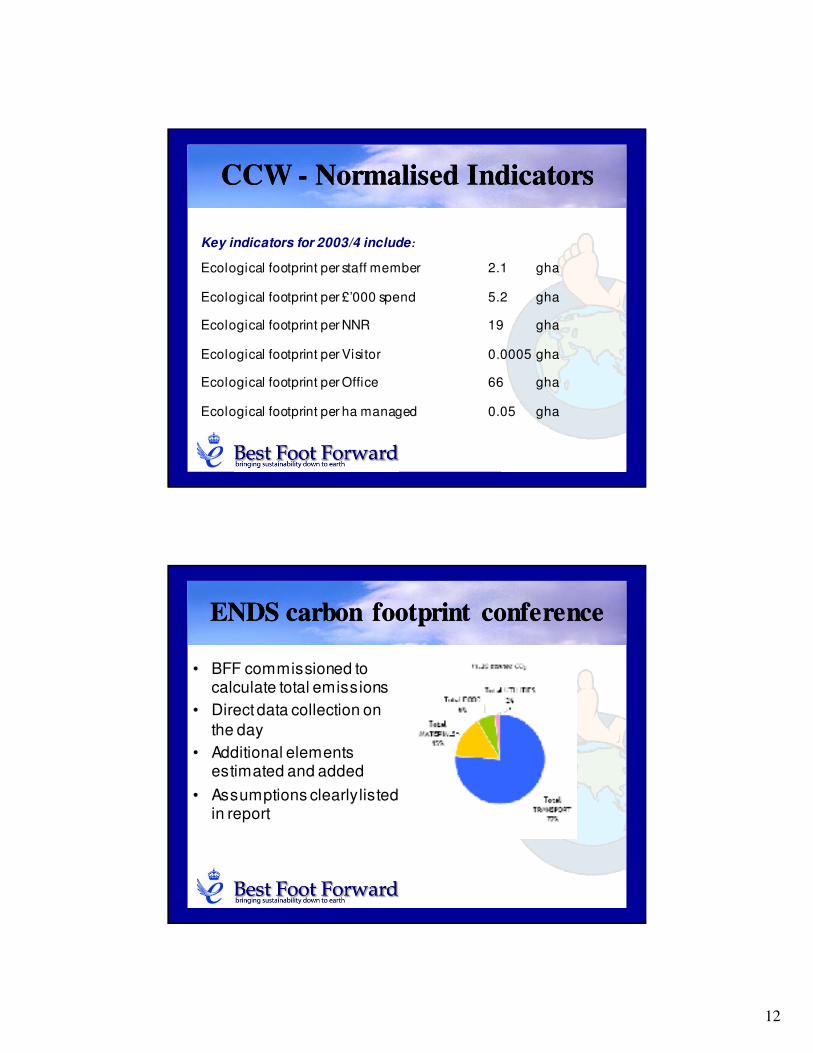
CCW CCW -- Normalised IndicatorsNormalised Indicators
Key indicators for 2003/4 include:
Ecological footprint per staff member 2.1 gha
Ecological footprint per £’000 spend 5.2 gha
Ecological footprint per NNR 19 gha
Ecological footprint per Visitor 0.0005 gha
Ecological footprint per Office 66 gha
Ecological footprint per ha managed 0.05 gha
ENDS carbon footprint conferenceENDS carbon footprint conference
• BFF commissioned to calculate total emissions
• Direct data collection on
the day
• Additional elements estimated and added
• Assumptions clearly listed in report
13
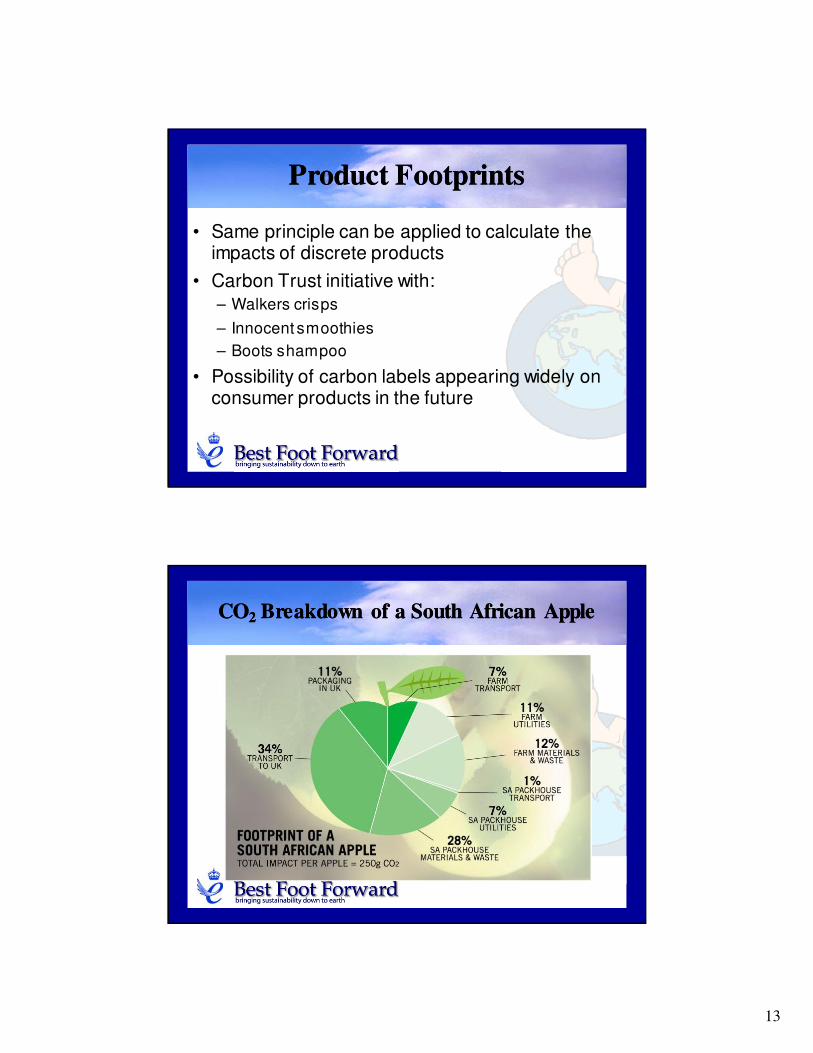
Product FootprintsProduct Footprints
• Same principle can be applied to calculate the impacts of discrete products
• Carbon Trust initiative with:
– Walkers crisps
– Innocent smoothies
– Boots shampoo
• Possibility of carbon labels appearing widely on consumer products in the future
COCO22 Breakdown of a South African AppleBreakdown of a South African Apple
14
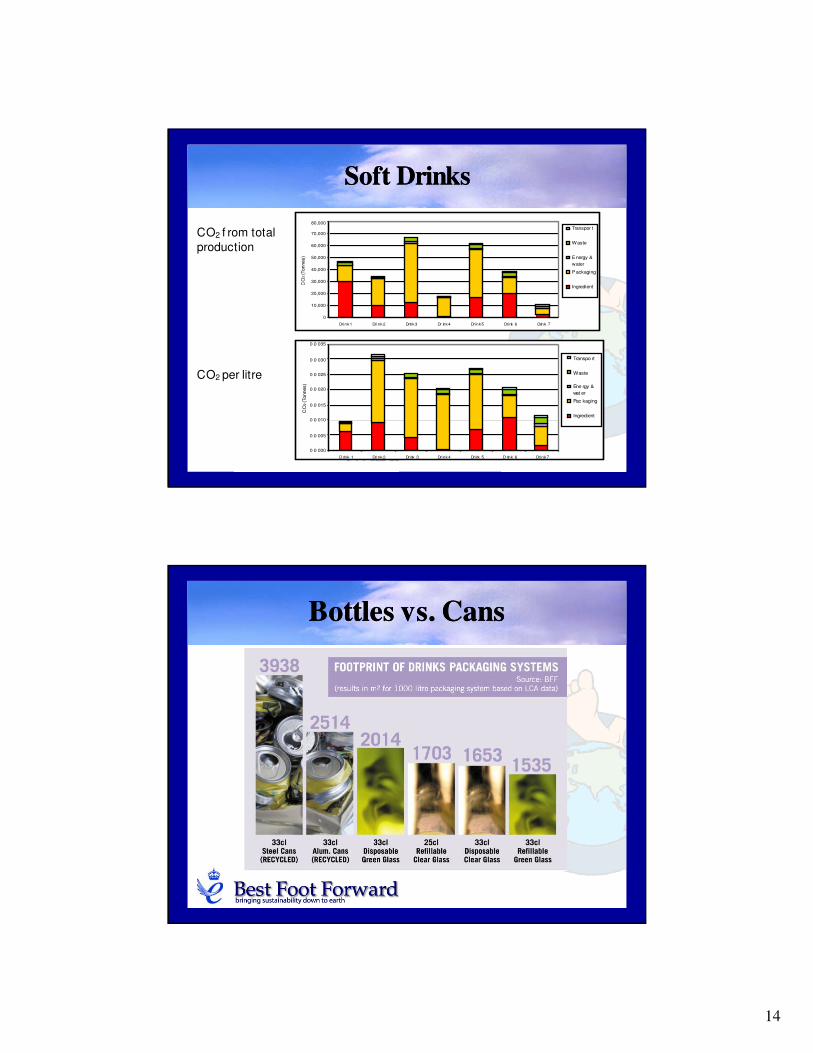
Soft DrinksSoft Drinks
0
10,000
20,000
30,000
40,000
50,000
60,000
70,000
80,000
Drink 1 Drink 2 Drink 3 Dr ink 4 Drink 5 Drink 6 Drink 7
CO
2 (T
onnes)
Transpor t
Waste
Energy &
water
Packaging
Ingredient
0 .0 000
0 .0 005
0 .0 010
0 .0 015
0 .0 020
0 .0 025
0 .0 030
0 .0 035
D rink 1 Drink 2 Drink 3 Drink 4 Drink 5 D rink 6 Drink 7
CO
2 (T
onnes)
Transpo rt
Waste
Ene rgy &
wat er
Pac kaging
Ingredient
CO2 f rom total
production
CO2 per litre
Bottles vs. CansBottles vs. Cans
15
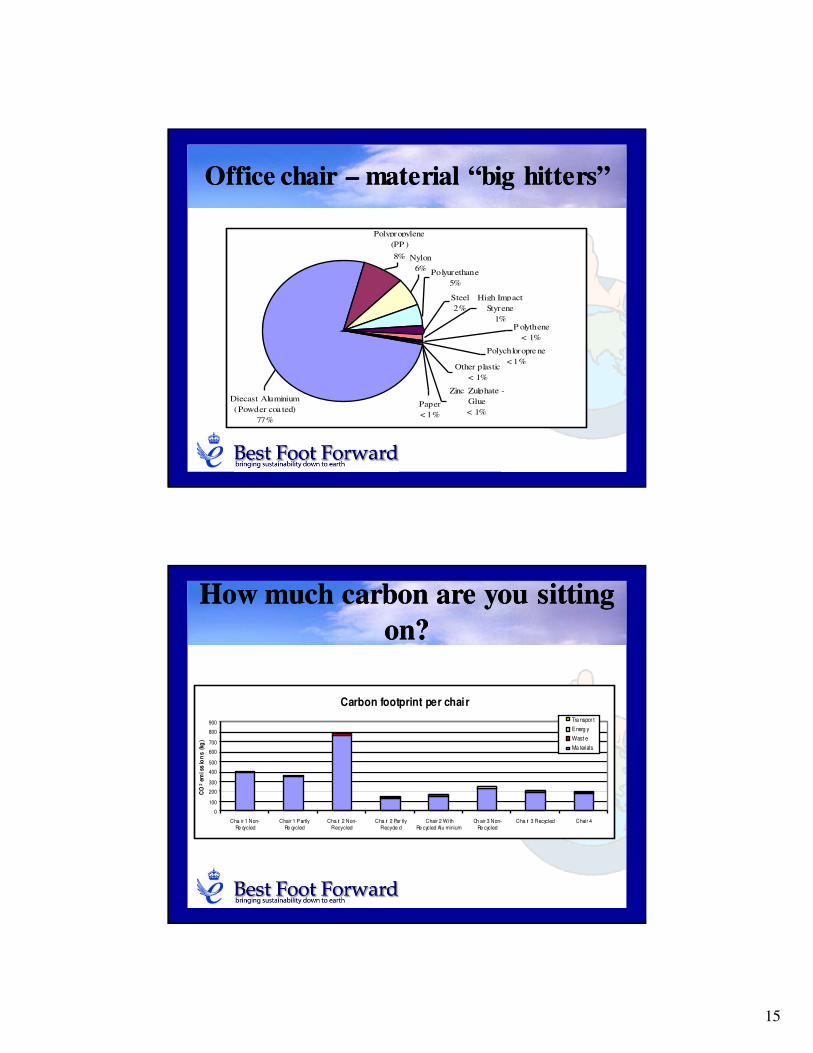
Office chair Office chair –– material “big hitters”material “big hitters”
Diecast Aluminium
(Powder coa ted)
77%
Nylon
6%
P olythene
< 1%
High Impact
Styrene
1%
Steel
2%
Polyurethane
5%
Polychloropre ne
< 1%
Paper
< 1%
Other plastic
< 1%
Zinc Zulphate -
Glue
< 1%
Polypropylene
(PP )
8%
How much carbon are you sitting How much carbon are you sitting
on?on?
Carbon footprint per chair
0
100
200
300
400
500
600
700
800
900
Cha ir 1 Non-Re cycled
Chair 1 PartlyRe cycled
Cha ir 2 Non-Recycled
Cha ir 2 Par tlyRecycle d
Chair 2 WithRe cycled Alu minium
Ch air 3 Non-Re cycled
Cha ir 3 Recycled Chair 4
CO
2 em
iss
ion
s (k
g)
Tra nspor t
Energ y
Wast e
Ma terials
16
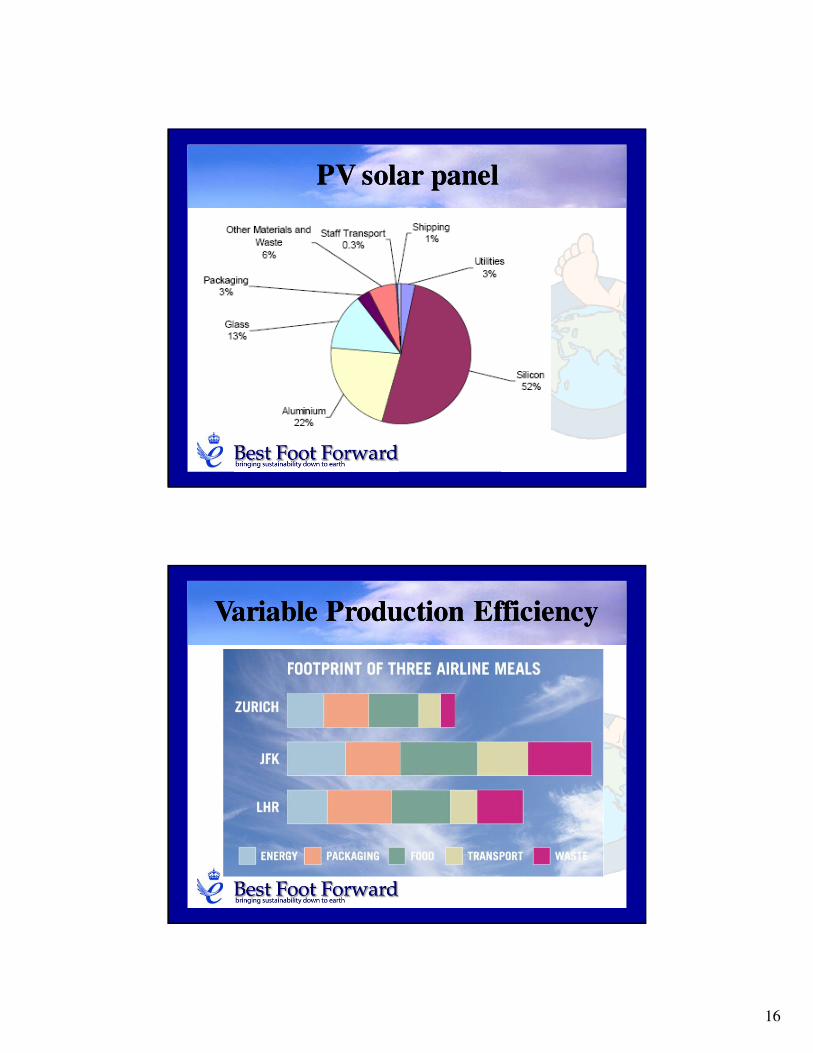
PV solar panelPV solar panel
Variable Production EfficiencyVariable Production Efficiency
17
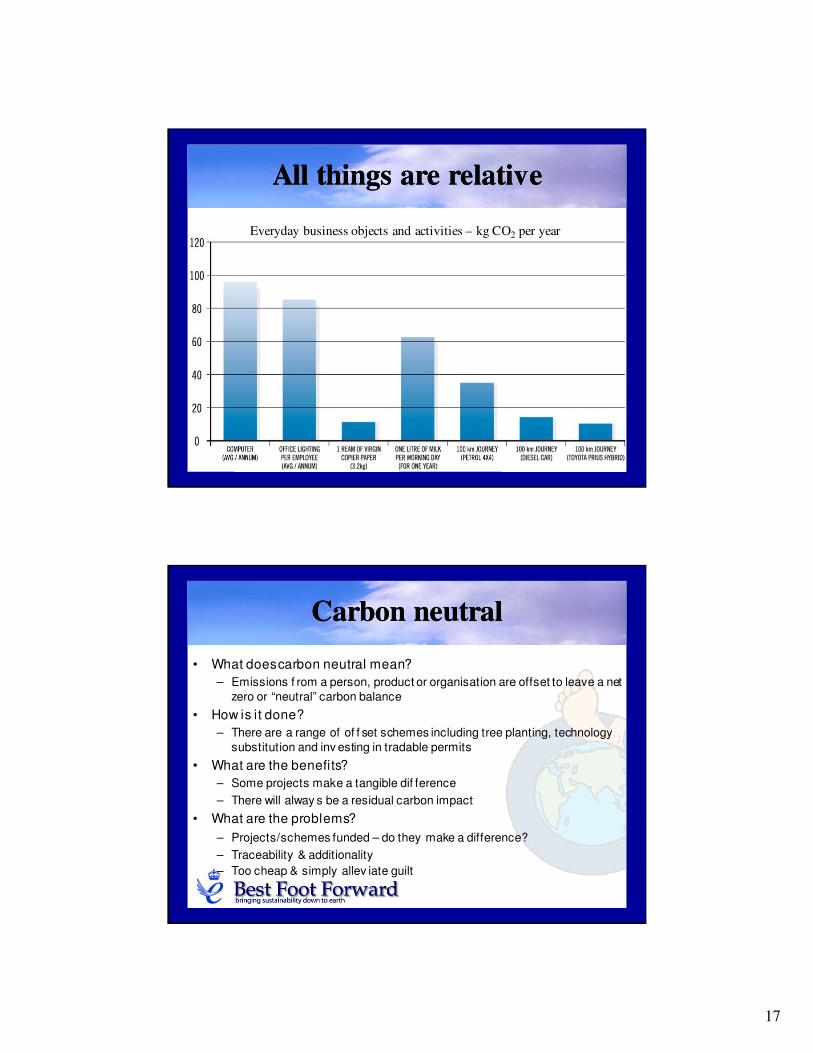
All things are relativeAll things are relative
Everyday business objects and activities – kg CO2 per year
Carbon neutralCarbon neutral
• What does carbon neutral mean?
– Emissions f rom a person, product or organisation are offset to leave a net
zero or “neutral” carbon balance
• How is it done?
– There are a range of of f set schemes including tree planting, technology
substitution and inv esting in tradable permits
• What are the benefits?
– Some projects make a tangible dif ference
– There will alway s be a residual carbon impact
• What are the problems?
– Projects/schemes funded – do they make a difference?
– Traceability & additionality
– Too cheap & simply allev iate guilt
18
Application for UK tourismApplication for UK tourism
• High interest from tourism sector
• Approaches
– Differentiation of hotel chain
– Benefits of UK-based holidays
• It’s a numbers game– Control and influence of tourists
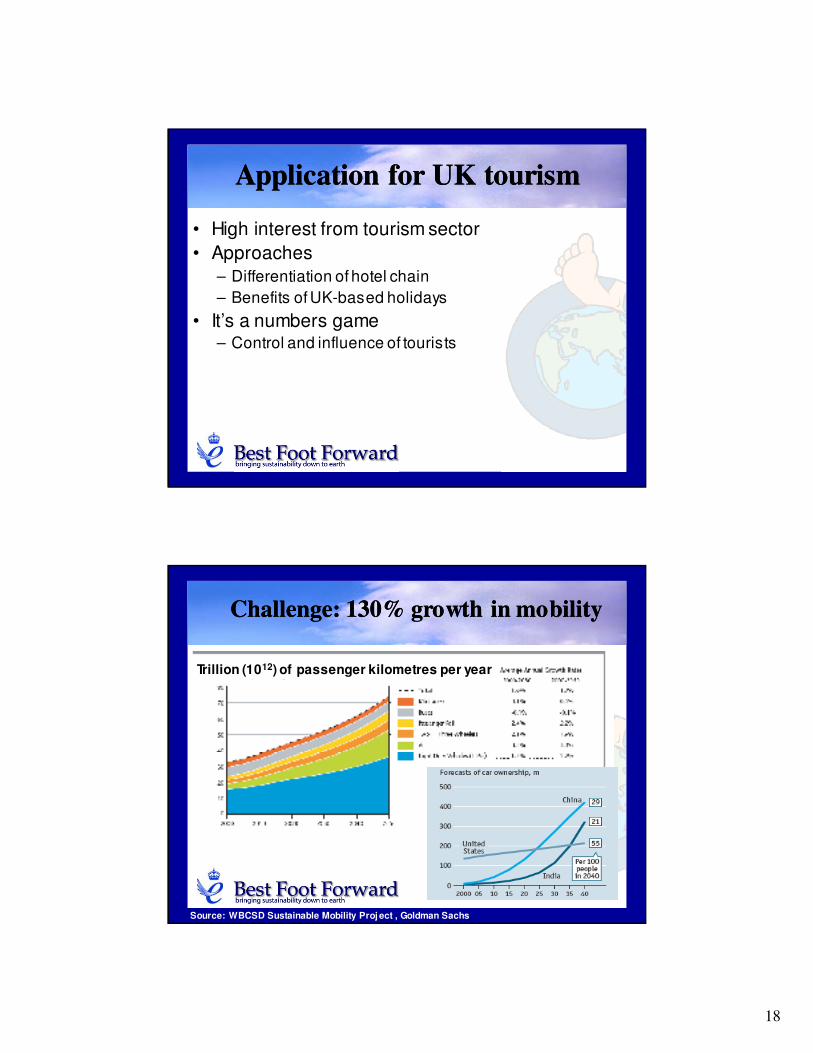
Challenge: 130% growth in mobilityChallenge: 130% growth in mobility
Trillion (1012) of passenger kilometres per year
Source: WBCSD Sustainable Mobility Proj ect , Goldman Sachs
19
Challenge: corresponding COChallenge: corresponding CO22 increaseincrease
Source: WBCSD Sustainable Mobility Proj ect, Stern Review
Gigatonnes (109) CO2 equiv alent emissions per year
“Transport was the fastest growing sector in OECD countries and the
second fastest growing sector in non-OECD countries between 1990 and 2002 (emissions increasing by 25% and 36% respectively).”
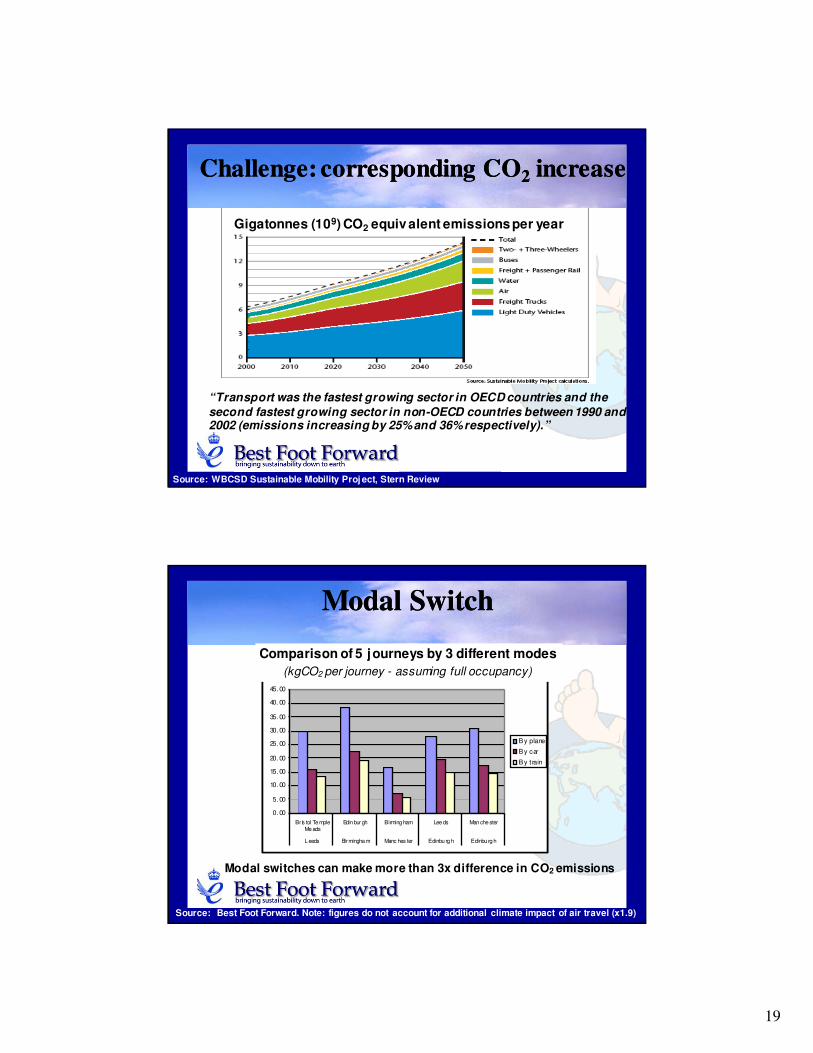
Modal SwitchModal Switch
Ful l occupancy
CO2 only
0.00
5.00
10.00
15.00
20.00
25.00
30.00
35.00
40.00
45.00
Br is tol Te mpleMe ads
Edin burgh Birming ham Lee ds Man che ster
L eeds Birmingha m Manc hes ter Edinbu rg h Edinbu rg h
By plane
By car
By t rain
Ful l occupancy
CO2 only
0.00
5.00
10.00
15.00
20.00
25.00
30.00
35.00
40.00
45.00
Br is tol Te mpleMe ads
Edin burgh Birming ham Lee ds Man che ster
L eeds Birmingha m Manc hes ter Edinbu rg h Edinbu rg h
By plane
By car
By t rain
Comparison of 5 journeys by 3 different modes
(kgCO2 per journey - assuming full occupancy)
Modal switches can make more than 3x difference in CO2 emissions
Source: Best Foot Forward. Note: figures do not account for additional climate impact of air travel (x1.9)
20
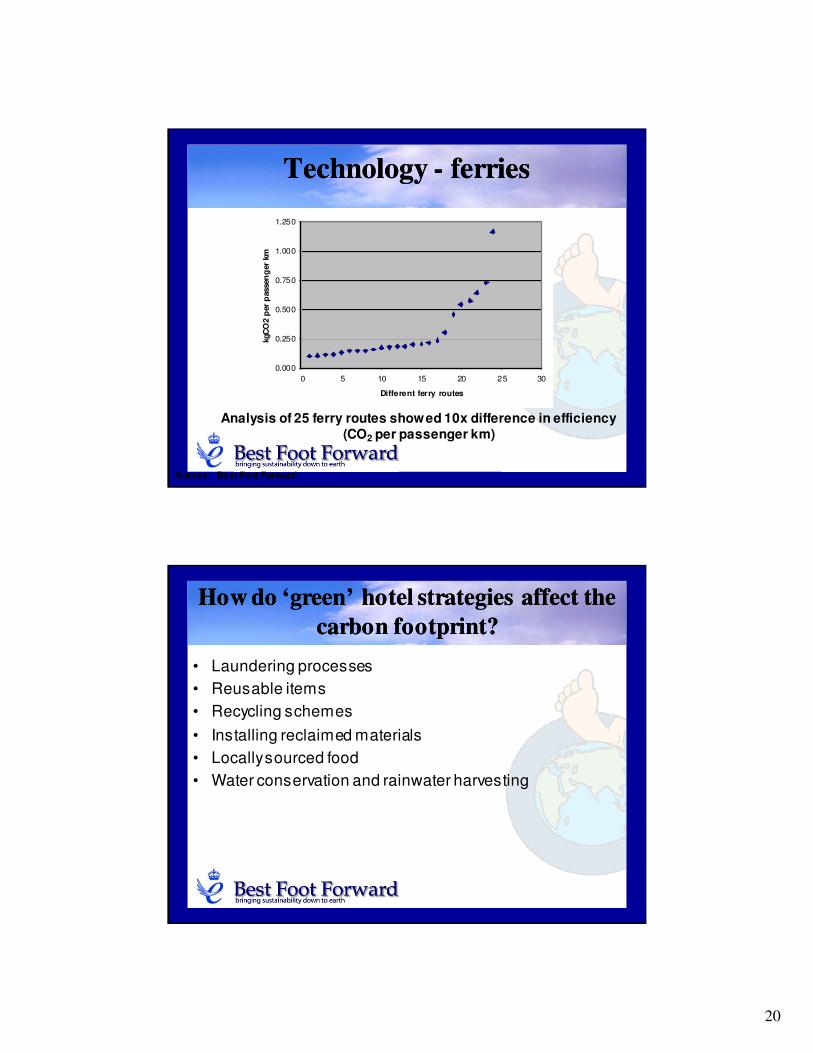
Technology Technology -- ferriesferries
0.000
0.250
0.500
0.750
1.000
1.250
0 5 10 15 20 25 30
Different ferry routes
kgC
O2 p
er
passen
ger
km
Analysis of 25 ferry routes showed 10x difference in efficiency (CO2 per passenger km)
Source: Best Foot Forward
How do ‘green’ hotel strategies affect the How do ‘green’ hotel strategies affect the
carbon footprint?carbon footprint?
• Laundering processes
• Reusable items
• Recycling schemes
• Installing reclaimed materials
• Locally sourced food
• Water conservation and rainwater harvesting
21
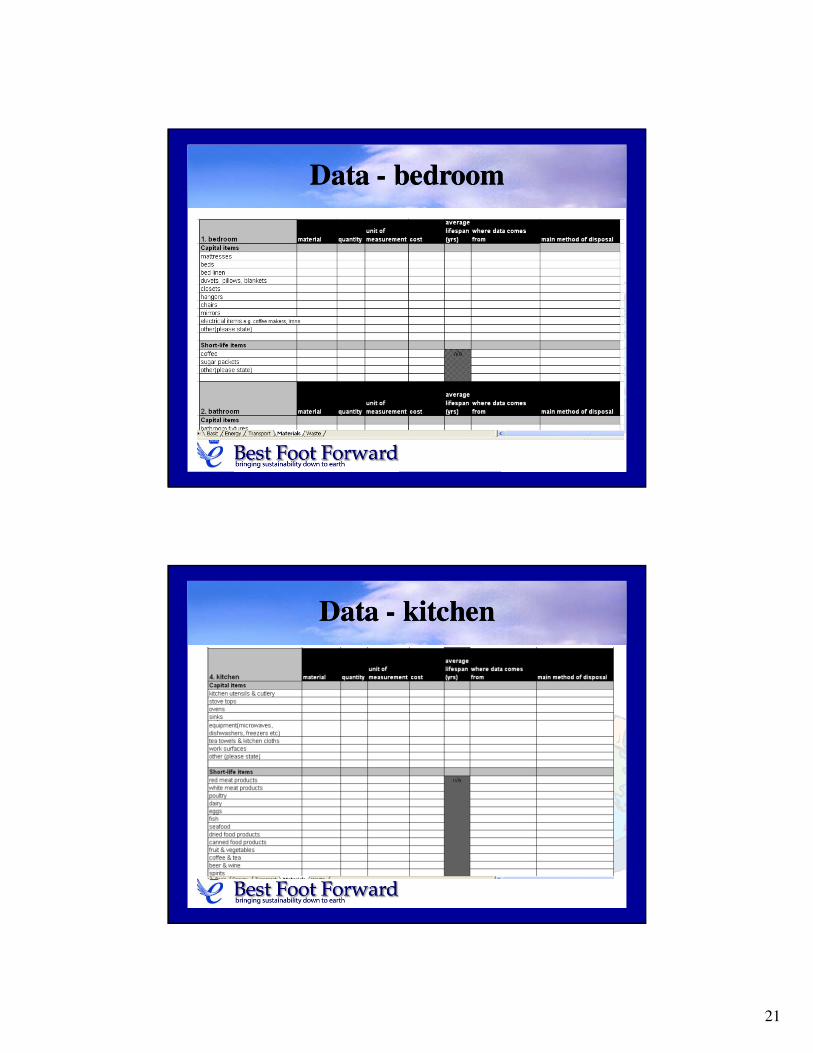
Data Data -- bedroombedroom
Data Data -- kitchenkitchen
22
Actions for youActions for you
• Where can you have the greatest reduction?
– Personal lifestyle or professional influence
• Which components are most significant?
– Undertake some kind of baseline measurement
– Travel, energy, materials, waste
• Set targets for reductions
• Integrate sustainability into all other processes
• Monitor progress
Simple fixesSimple fixes
• Travel
– Reduction, efficiency, modal switching
• Energy
– Behaviour, technology, supplier
• Materials
– Procurement, lifespan, consumption patterns
• Waste
– Source, treatment
23
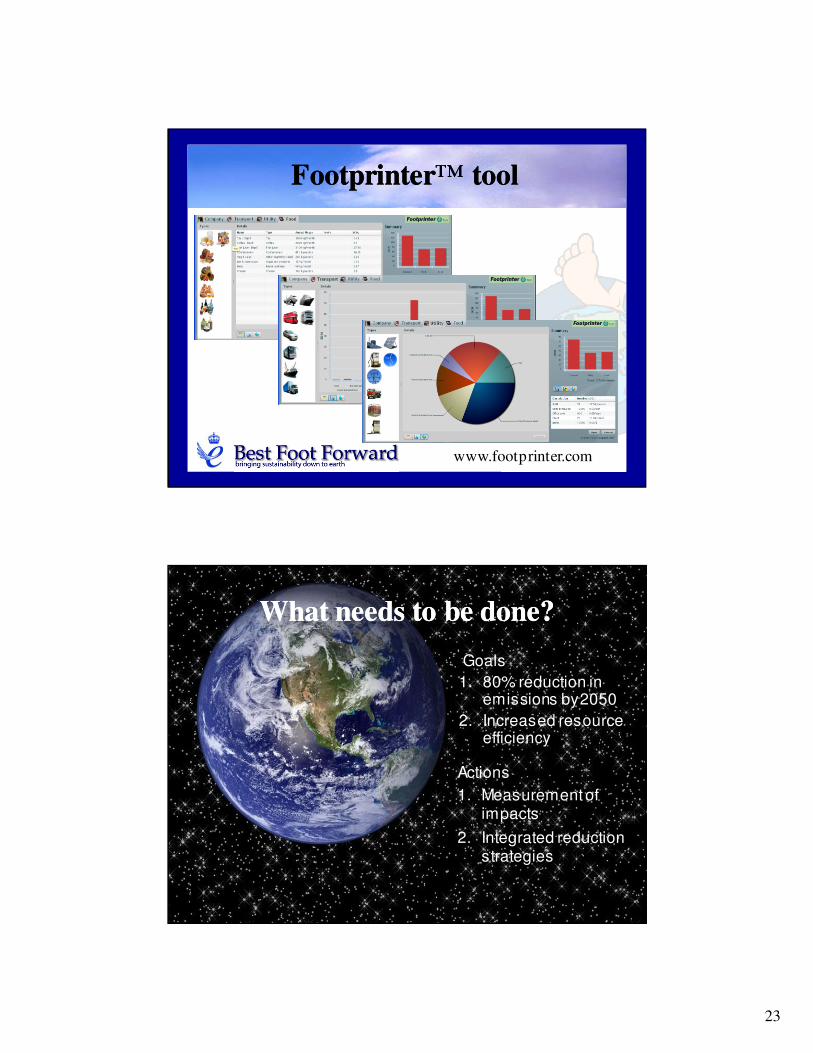
FootprinterFootprinter™™ tooltool
www.footprinter.com
What needs to be done?What needs to be done?
Goals
1. 80% reduction in emissions by 2050
2. Increased resource efficiency
Actions
1. Measurement of impacts
2. Integrated reduction strategies
24
For more information…For more information…
• www.bestfootforward.com
• www.ecologicalfootprint.com
• www.footprinter.com
• BFF, The Future Centre,
115 Magdalen Rd,
Oxford OX4 1RQ.
Tel: 01865 250818.
• ACCA Report
• Sharing Nature’s Interest