accounting chapter 22
TRANSCRIPT
Master Budgets
Chapter 22
22-1Copyright © 2014 Pearson Education, Inc. publishing as Prentice Hall
Learning Objectives
1. Describe budgeting objectives, benefits, and procedures and how human behavior influences budgeting
2. Define budget types and the components of the master budget
22-2Copyright © 2014 Pearson Education, Inc. publishing as Prentice Hall
Learning Objectives
3. Prepare an operating budget for a manufacturing company
4. Prepare a financial budget for a manufacturing company
5. Describe how information technology can be used in the budgeting process
22-3Copyright © 2014 Pearson Education, Inc. publishing as Prentice Hall

Learning Objectives
6. Prepare an operating budget for a merchandising company (Appendix 22A)
7. Prepare a financial budget for a merchandising company (Appendix 22A)
22-4Copyright © 2014 Pearson Education, Inc. publishing as Prentice Hall
Learning Objective 1
Describe budgeting Describe budgeting objectives, benefits, objectives, benefits, and procedures and and procedures and how human behavior how human behavior influences budgetinginfluences budgeting
22-5Copyright © 2014 Pearson Education, Inc. publishing as Prentice Hall
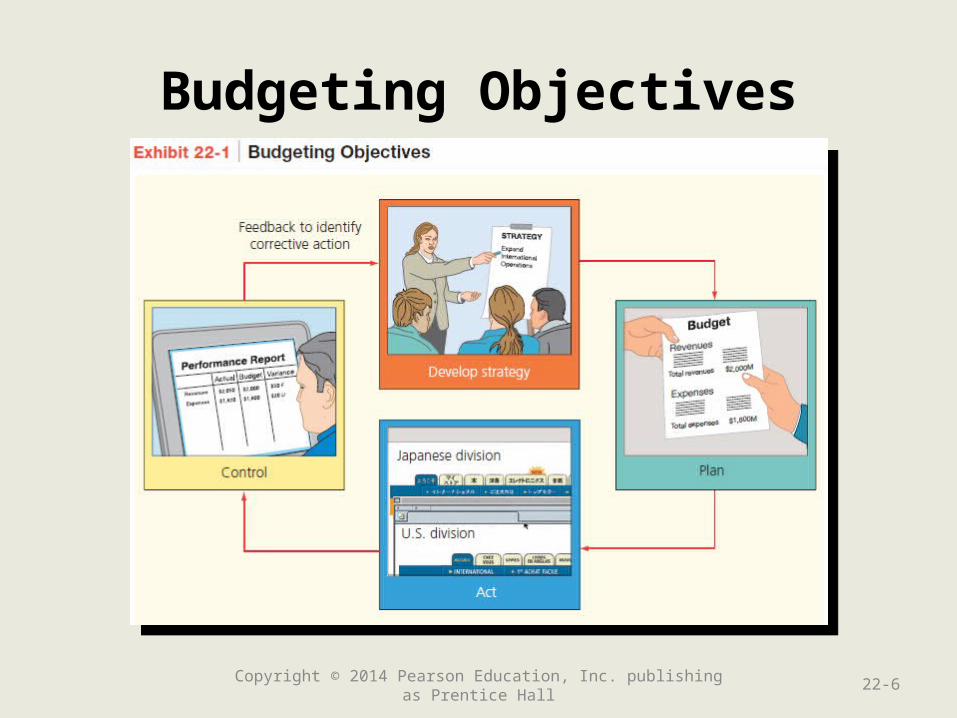
Budgeting Objectives
Copyright © 2014 Pearson Education, Inc. publishing as Prentice Hall 22-6
Benefits of Budgeting
• Requires managers to plan
• Promotes coordination and communication
• Provides a benchmark for evaluating actual performance
Copyright © 2014 Pearson Education, Inc. publishing as Prentice Hall 22-7
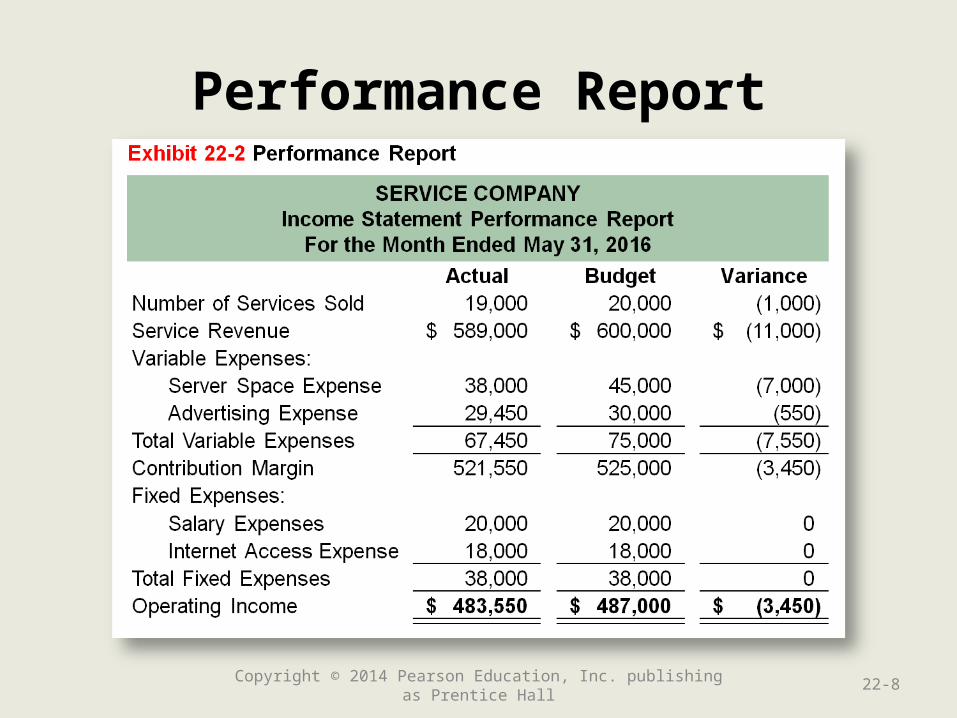
Performance Report
Copyright © 2014 Pearson Education, Inc. publishing as Prentice Hall 22-8
Budgeting Procedures
• Vary from company to company
• Should include income from all levels
• Usually begins several months before the beginning of the budget period
Copyright © 2014 Pearson Education, Inc. publishing as Prentice Hall 22-9
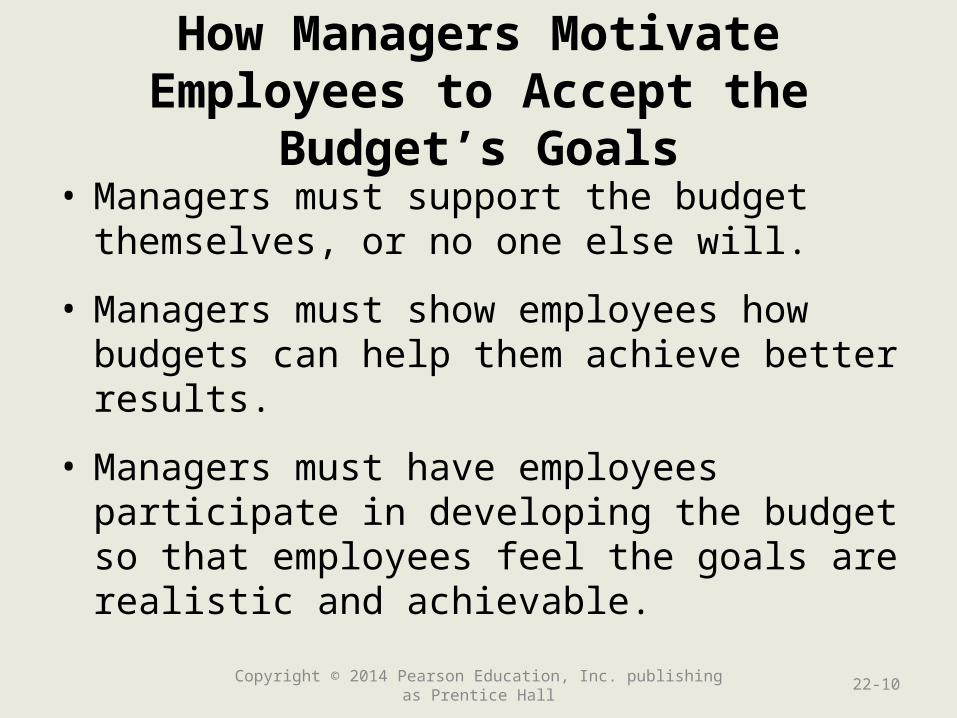
How Managers Motivate Employees to Accept the Budget’s Goals
• Managers must support the budget themselves, or no one else will.
• Managers must show employees how budgets can help them achieve better results.
• Managers must have employees participate in developing the budget so that employees feel the goals are realistic and achievable.
Copyright © 2014 Pearson Education, Inc. publishing as Prentice Hall 22-10
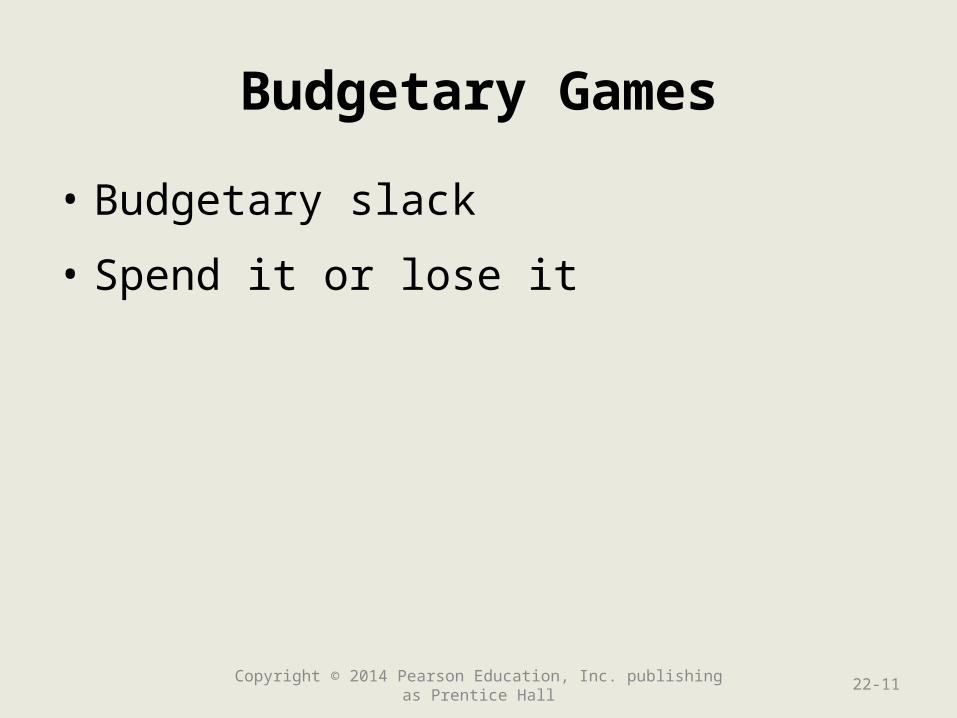
Budgetary Games
• Budgetary slack
• Spend it or lose it
Copyright © 2014 Pearson Education, Inc. publishing as Prentice Hall 22-11
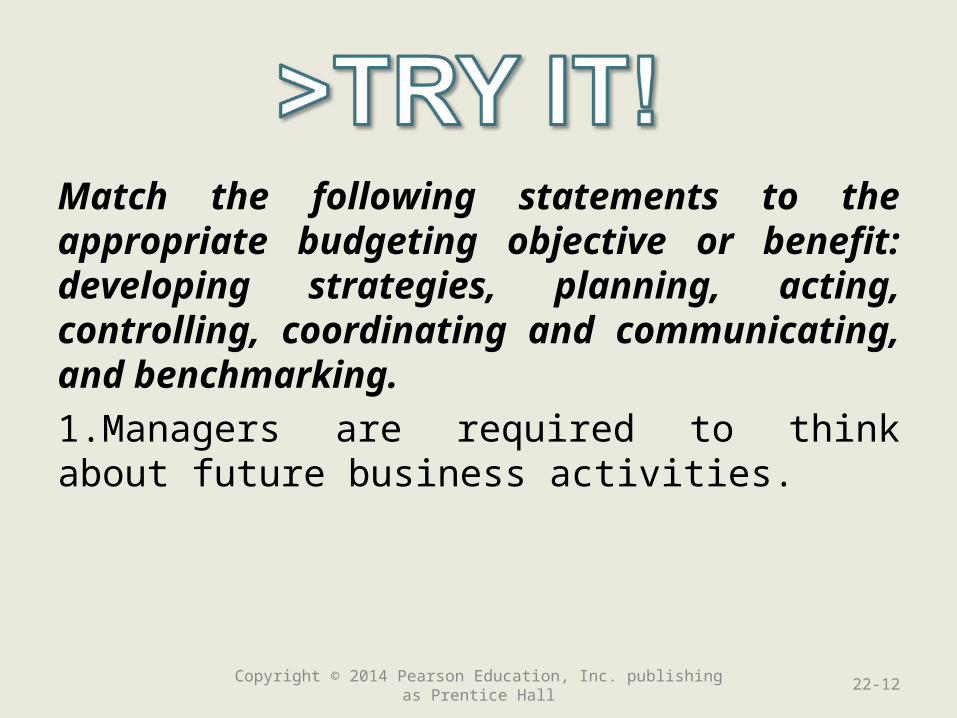
Match the following statements to the appropriate budgeting objective or benefit: developing strategies, planning, acting, controlling, coordinating and communicating, and benchmarking.
1.Managers are required to think about future business activities.
Copyright © 2014 Pearson Education, Inc. publishing as Prentice Hall 22-12
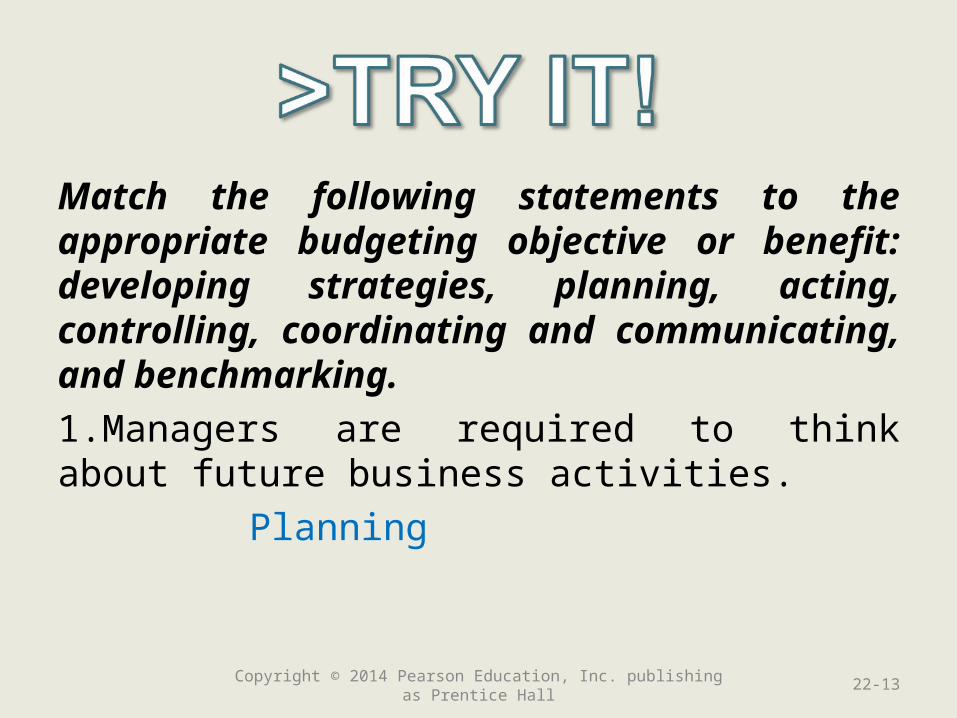
Match the following statements to the appropriate budgeting objective or benefit: developing strategies, planning, acting, controlling, coordinating and communicating, and benchmarking.
1.Managers are required to think about future business activities.
Planning
Copyright © 2014 Pearson Education, Inc. publishing as Prentice Hall 22-13
Match the following statements to the appropriate budgeting objective or benefit: developing strategies, planning, acting, controlling, coordinating and communicating, and benchmarking.
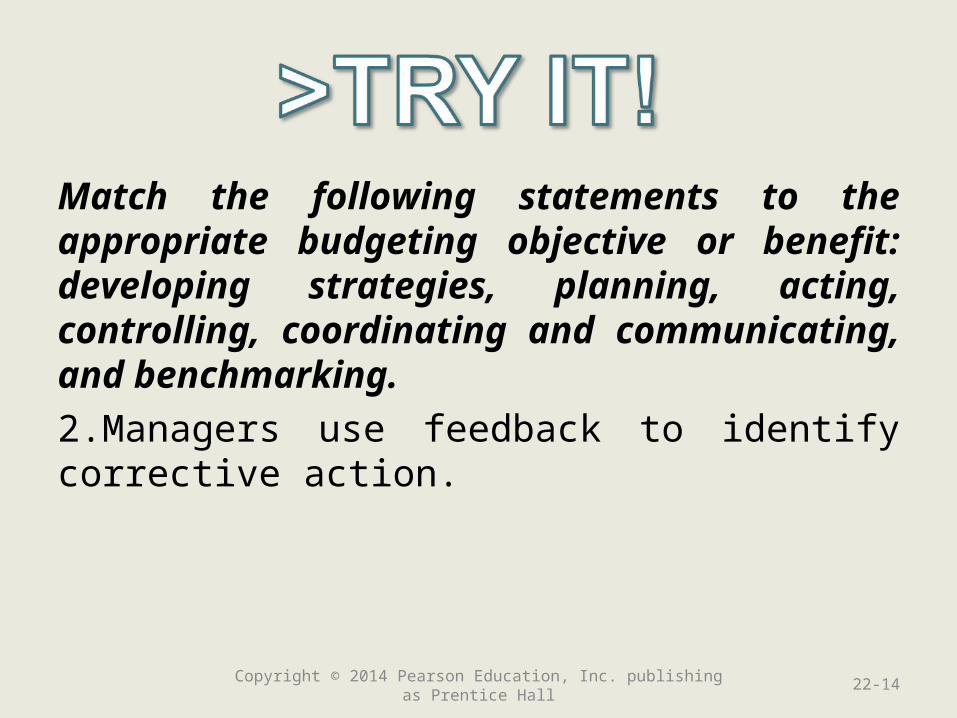
2.Managers use feedback to identify corrective action.
Copyright © 2014 Pearson Education, Inc. publishing as Prentice Hall 22-14
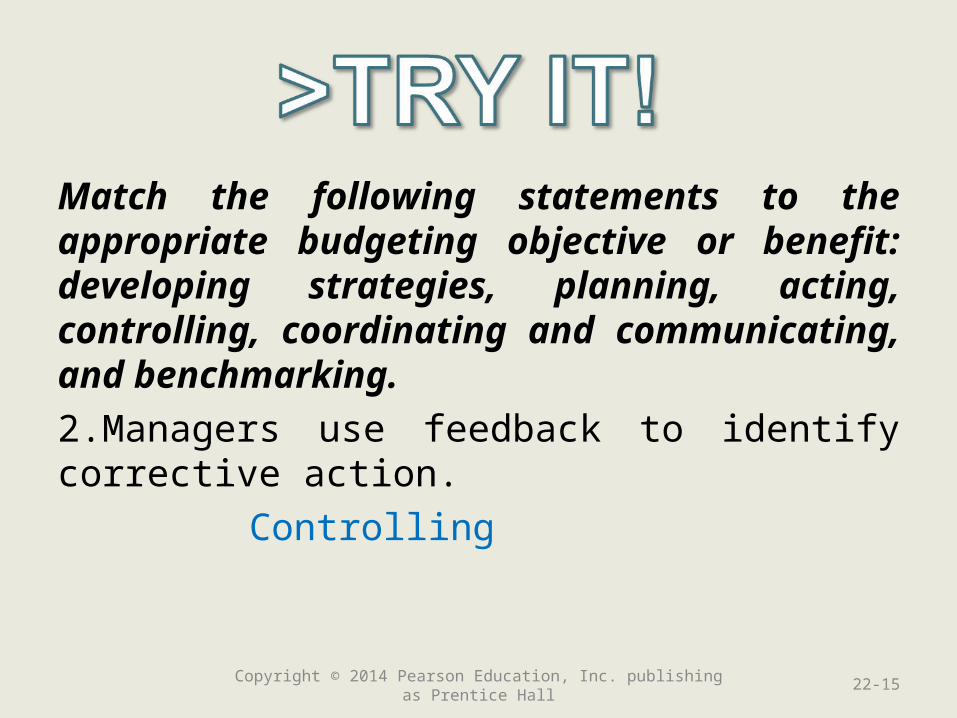
Match the following statements to the appropriate budgeting objective or benefit: developing strategies, planning, acting, controlling, coordinating and communicating, and benchmarking.
2.Managers use feedback to identify corrective action.
Controlling
Copyright © 2014 Pearson Education, Inc. publishing as Prentice Hall 22-15
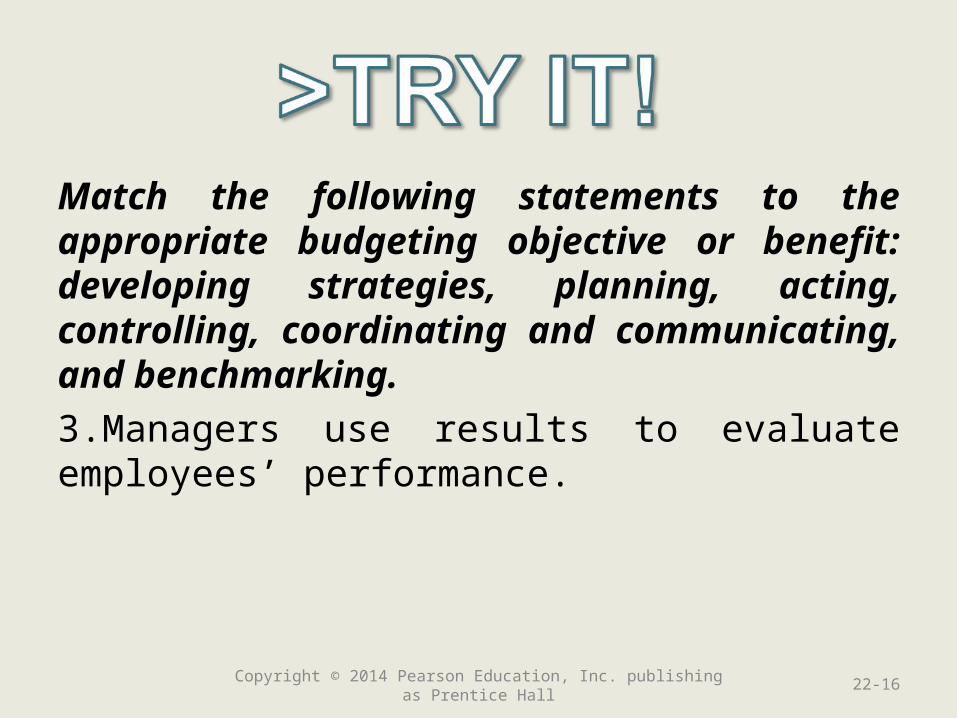
Match the following statements to the appropriate budgeting objective or benefit: developing strategies, planning, acting, controlling, coordinating and communicating, and benchmarking.
3.Managers use results to evaluate employees’ performance.
Copyright © 2014 Pearson Education, Inc. publishing as Prentice Hall 22-16
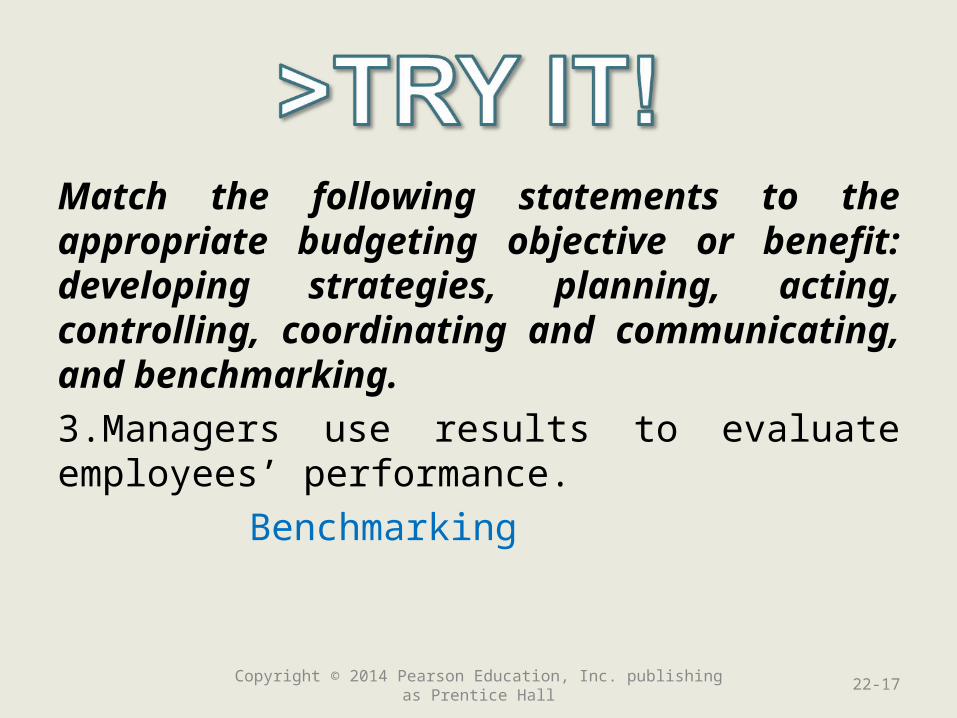
Match the following statements to the appropriate budgeting objective or benefit: developing strategies, planning, acting, controlling, coordinating and communicating, and benchmarking.
3.Managers use results to evaluate employees’ performance.
Benchmarking
Copyright © 2014 Pearson Education, Inc. publishing as Prentice Hall 22-17
Match the following statements to the appropriate budgeting objective or benefit: developing strategies, planning, acting, controlling, coordinating and communicating, and benchmarking.
4.Managers work with managers in other divisions.
Copyright © 2014 Pearson Education, Inc. publishing as Prentice Hall 22-18
Match the following statements to the appropriate budgeting objective or benefit: developing strategies, planning, acting, controlling, coordinating and communicating, and benchmarking.
4.Managers work with managers in other divisions.
Coordinating and communicating
Copyright © 2014 Pearson Education, Inc. publishing as Prentice Hall 22-19
Learning Objective 2
Define budget types Define budget types and the components of and the components of
the master budgetthe master budget
22-20Copyright © 2014 Pearson Education, Inc. publishing as Prentice Hall
Types of Budgets
• Strategic and operational budgets
• Static and flexible budgets
• Master budgets
Copyright © 2014 Pearson Education, Inc. publishing as Prentice Hall 22-21
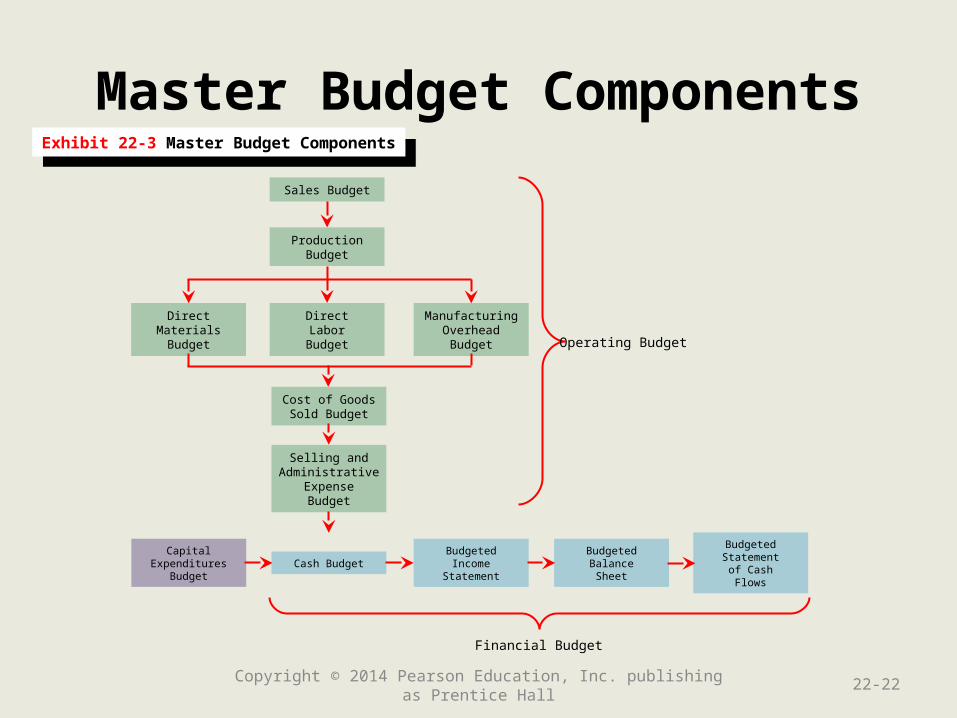
Master Budget Components
Copyright © 2014 Pearson Education, Inc. publishing as Prentice Hall 22-22
Exhibit 22-3 Master Budget ComponentsExhibit 22-3 Master Budget Components
Sales Budget
ProductionBudget
DirectMaterialsBudget
DirectLabor
Budget
ManufacturingOverhead
Budget
Cost of GoodsSold Budget
Selling andAdministrative
ExpenseBudget
Cash BudgetBudgetedIncome
Statement
BudgetedBalanceSheet
BudgetedStatement
of CashFlows
CapitalExpenditures
Budget
Operating Budget
Financial Budget
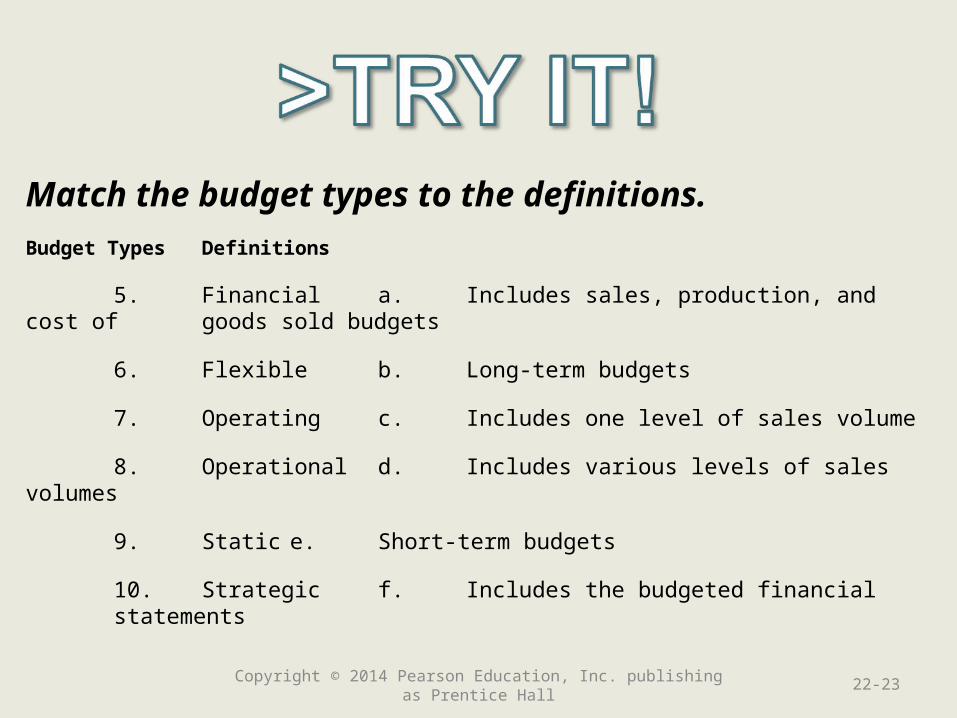
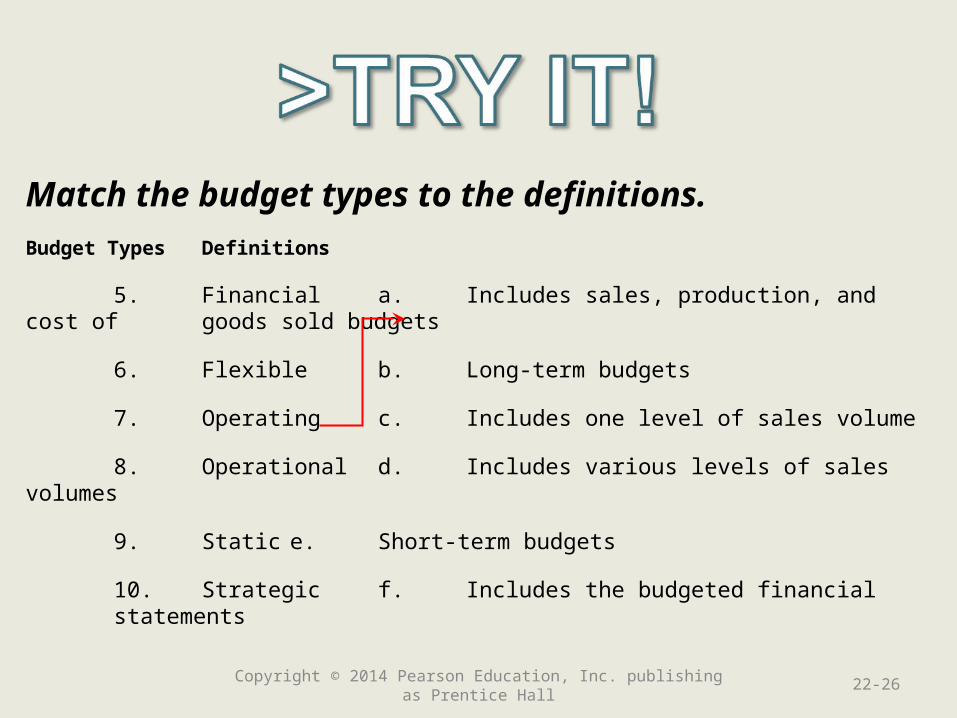
Match the budget types to the definitions.
Budget Types Definitions
5. Financial a. Includes sales, production, and cost of goods sold budgets
6. Flexible b. Long-term budgets
7. Operating c. Includes one level of sales volume
8. Operational d. Includes various levels of sales volumes
9. Static e. Short-term budgets
10. Strategic f. Includes the budgeted financial statements
Copyright © 2014 Pearson Education, Inc. publishing as Prentice Hall 22-23
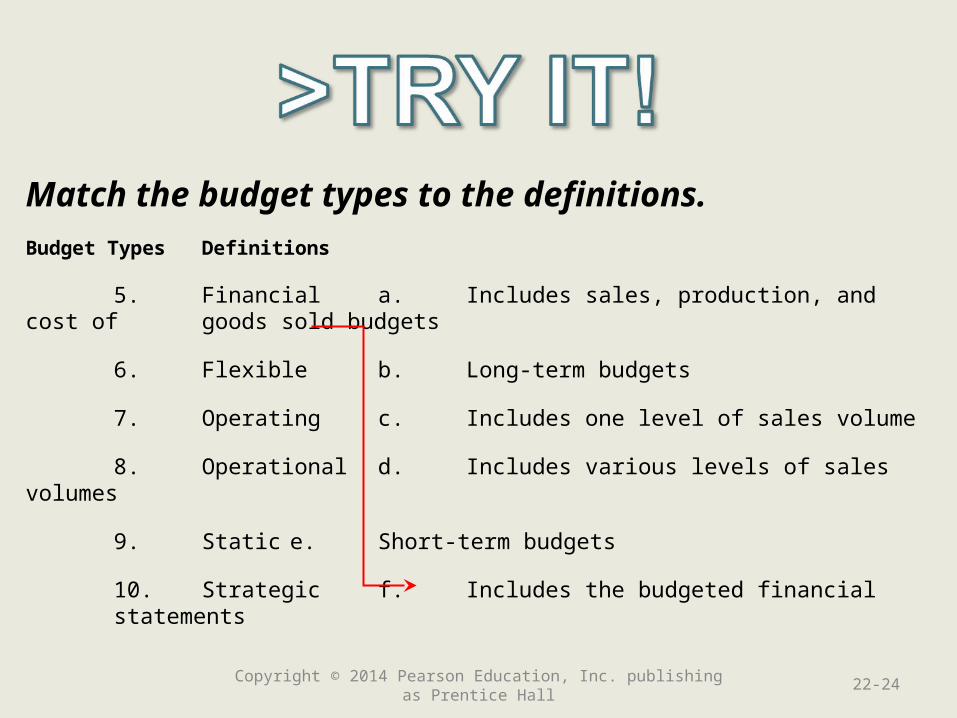
Match the budget types to the definitions.
Budget Types Definitions
5. Financial a. Includes sales, production, and cost of goods sold budgets
6. Flexible b. Long-term budgets
7. Operating c. Includes one level of sales volume
8. Operational d. Includes various levels of sales volumes
9. Static e. Short-term budgets
10. Strategic f. Includes the budgeted financial statements
Copyright © 2014 Pearson Education, Inc. publishing as Prentice Hall 22-24
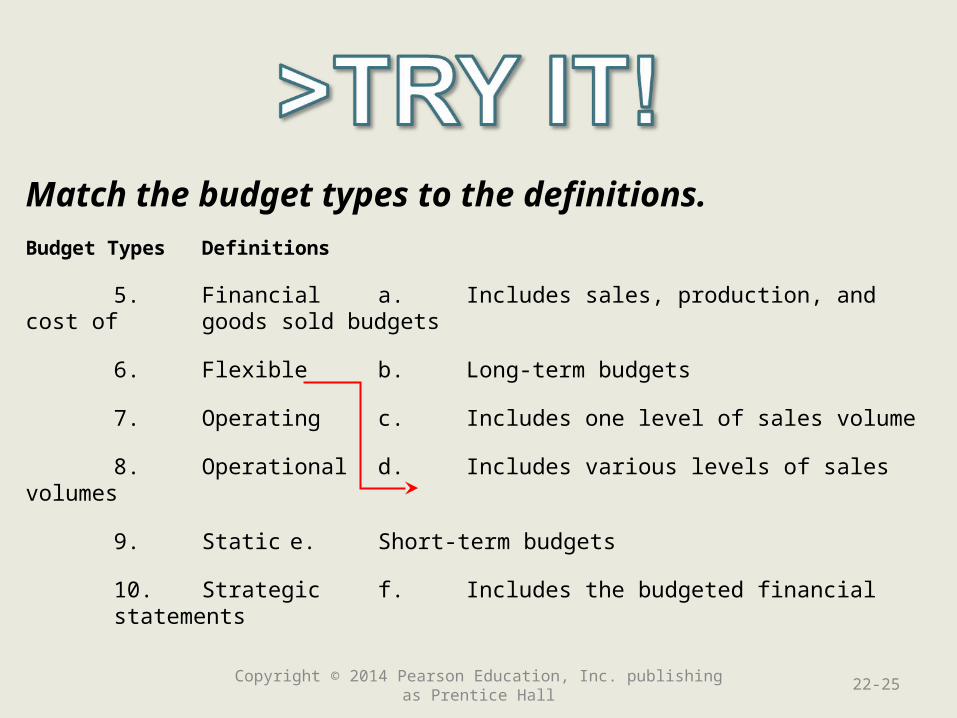
Match the budget types to the definitions.
Budget Types Definitions
5. Financial a. Includes sales, production, and cost of goods sold budgets
6. Flexible b. Long-term budgets
7. Operating c. Includes one level of sales volume
8. Operational d. Includes various levels of sales volumes
9. Static e. Short-term budgets
10. Strategic f. Includes the budgeted financial statements
Copyright © 2014 Pearson Education, Inc. publishing as Prentice Hall 22-25
Match the budget types to the definitions.
Budget Types Definitions
5. Financial a. Includes sales, production, and cost of goods sold budgets
6. Flexible b. Long-term budgets
7. Operating c. Includes one level of sales volume
8. Operational d. Includes various levels of sales volumes
9. Static e. Short-term budgets
10. Strategic f. Includes the budgeted financial statements
Copyright © 2014 Pearson Education, Inc. publishing as Prentice Hall 22-26
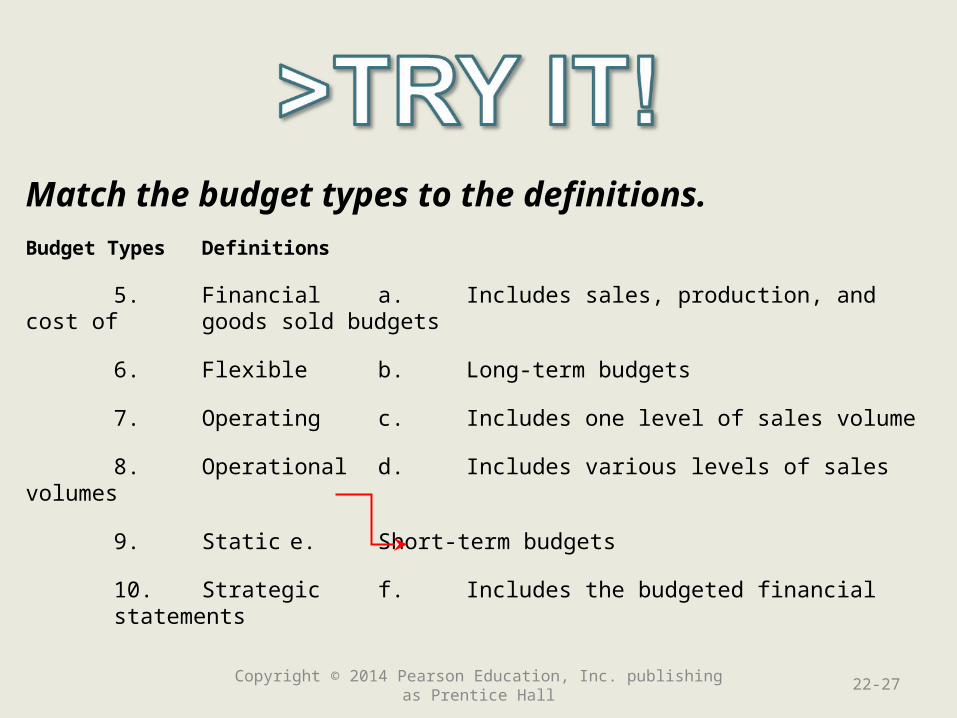
Match the budget types to the definitions.
Budget Types Definitions
5. Financial a. Includes sales, production, and cost of goods sold budgets
6. Flexible b. Long-term budgets
7. Operating c. Includes one level of sales volume
8. Operational d. Includes various levels of sales volumes
9. Static e. Short-term budgets
10. Strategic f. Includes the budgeted financial statements
Copyright © 2014 Pearson Education, Inc. publishing as Prentice Hall 22-27
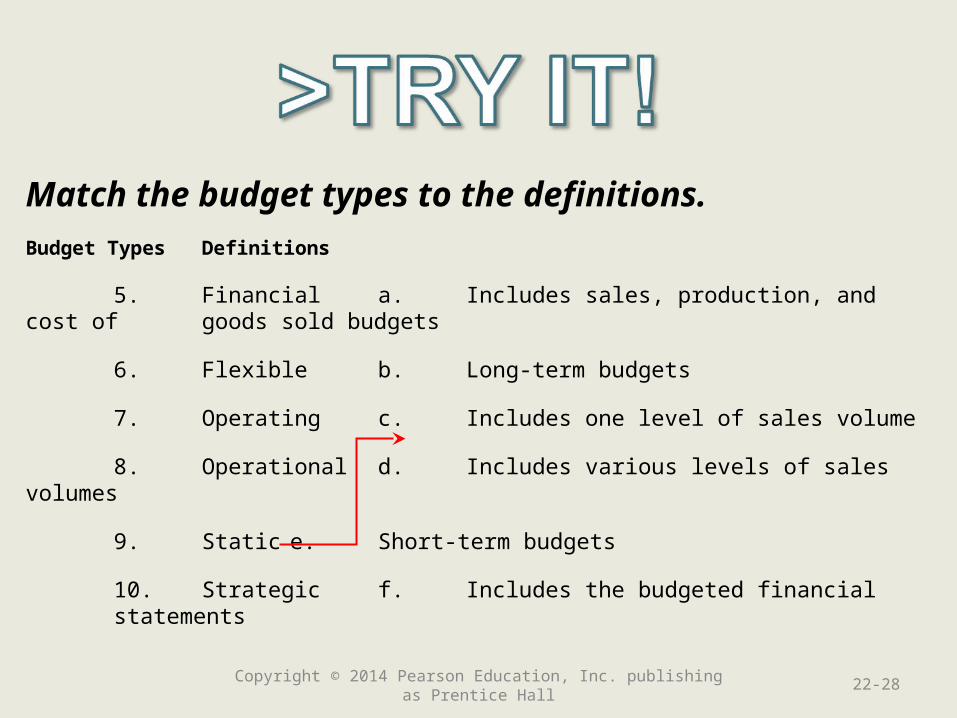
Match the budget types to the definitions.
Budget Types Definitions
5. Financial a. Includes sales, production, and cost of goods sold budgets
6. Flexible b. Long-term budgets
7. Operating c. Includes one level of sales volume
8. Operational d. Includes various levels of sales volumes
9. Static e. Short-term budgets
10. Strategic f. Includes the budgeted financial statements
Copyright © 2014 Pearson Education, Inc. publishing as Prentice Hall 22-28
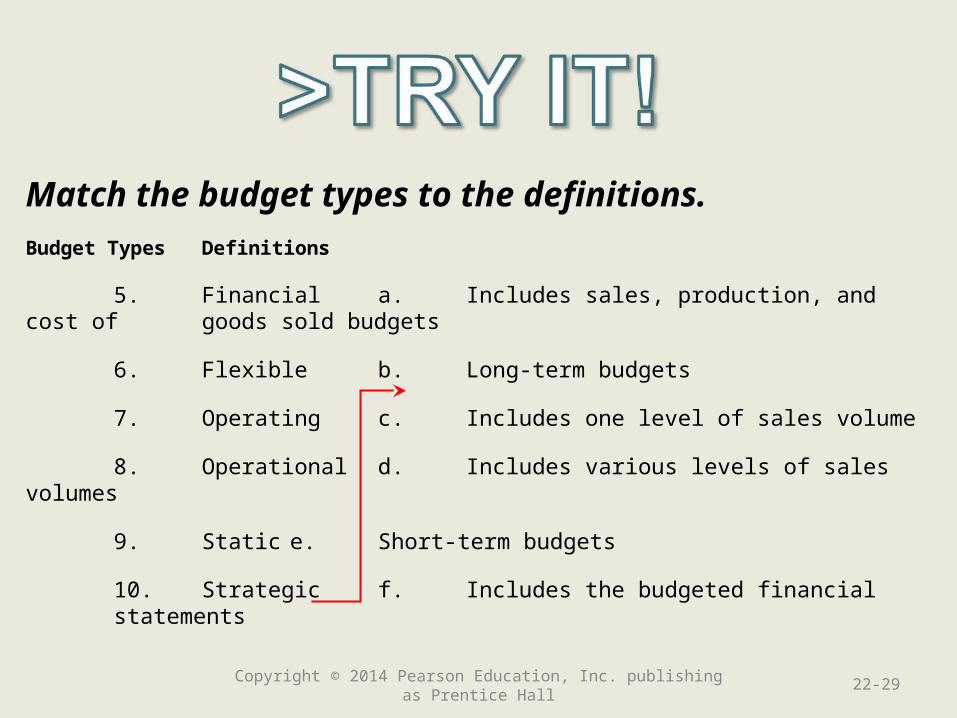
Match the budget types to the definitions.
Budget Types Definitions
5. Financial a. Includes sales, production, and cost of goods sold budgets
6. Flexible b. Long-term budgets
7. Operating c. Includes one level of sales volume
8. Operational d. Includes various levels of sales volumes
9. Static e. Short-term budgets
10. Strategic f. Includes the budgeted financial statements
Copyright © 2014 Pearson Education, Inc. publishing as Prentice Hall 22-29
Learning Objective 3
Prepare an operating Prepare an operating budget for a budget for a
manufacturing manufacturing companycompany
22-30Copyright © 2014 Pearson Education, Inc. publishing as Prentice Hall
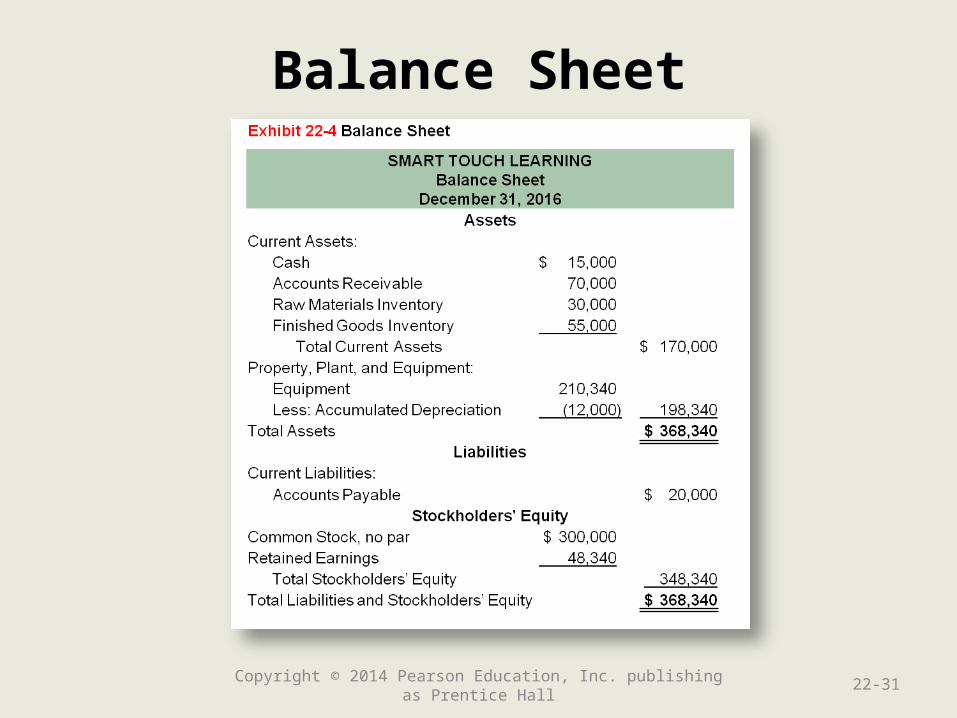
Balance Sheet
Copyright © 2014 Pearson Education, Inc. publishing as Prentice Hall 22-31
Data for the Sales Budget
• Will sell 500 tablet computers in the first quarter
• Sales will increase by 50 tablets each quarter
• The tablets sell for $500 each
Copyright © 2014 Pearson Education, Inc. publishing as Prentice Hall 22-32
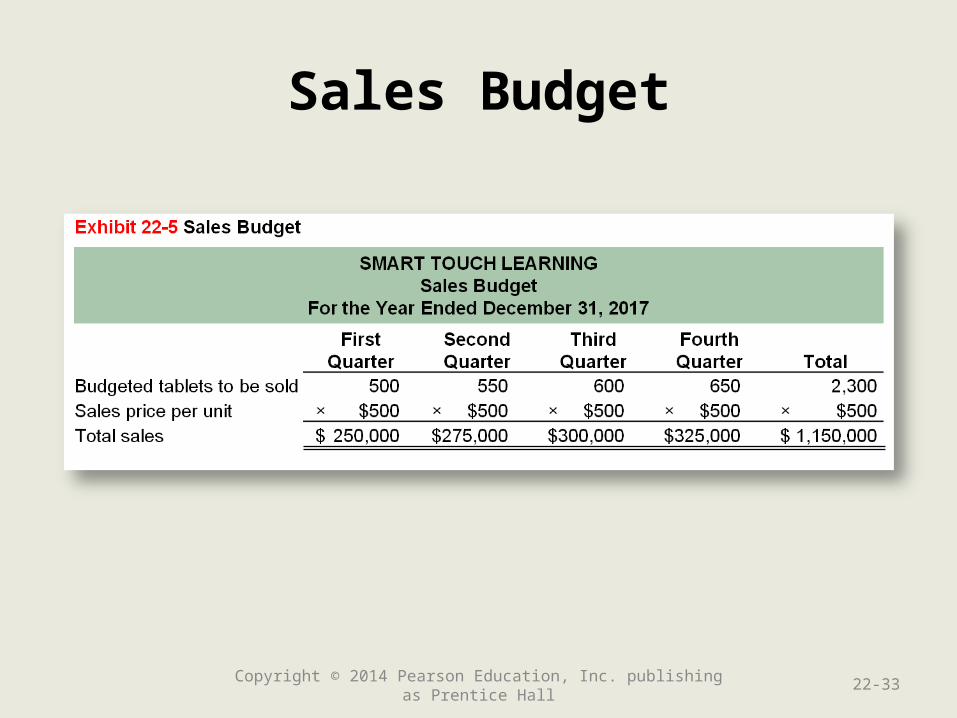
Sales Budget
Copyright © 2014 Pearson Education, Inc. publishing as Prentice Hall 22-33
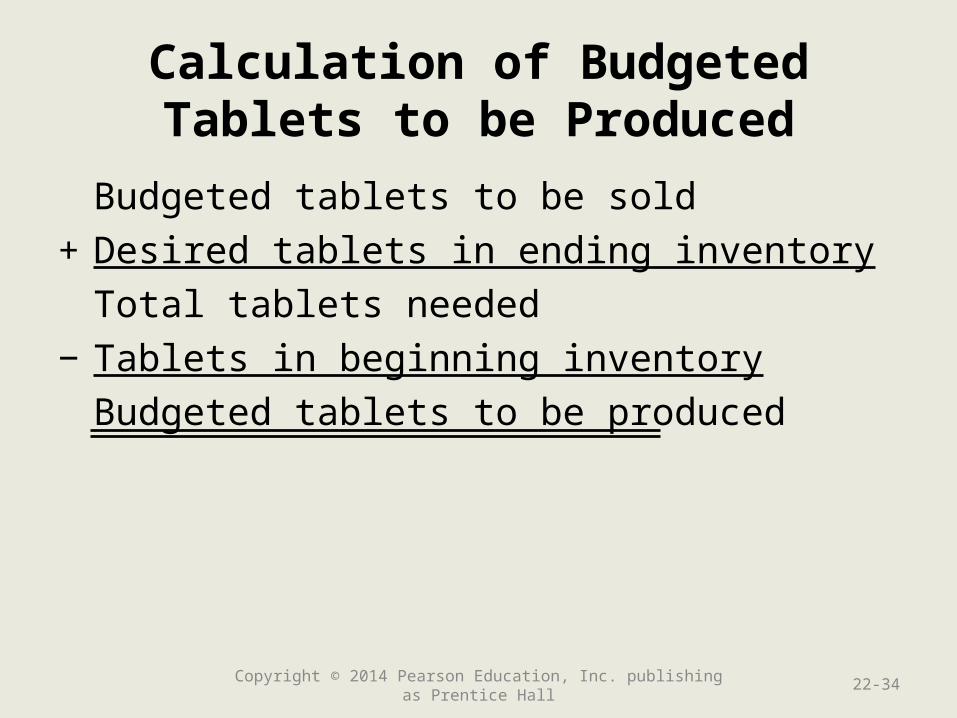
Calculation of BudgetedTablets to be Produced
Budgeted tablets to be sold
+ Desired tablets in ending inventory
Total tablets needed
− Tablets in beginning inventory
Budgeted tablets to be produced
Copyright © 2014 Pearson Education, Inc. publishing as Prentice Hall 22-34
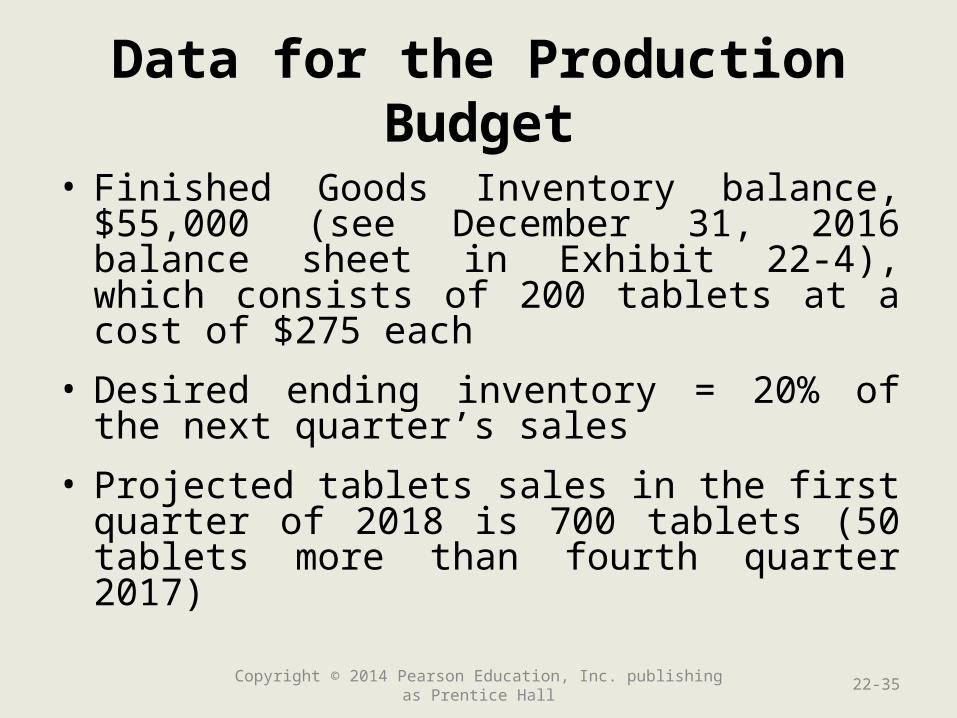
Data for the Production Budget
• Finished Goods Inventory balance, $55,000 (see December 31, 2016 balance sheet in Exhibit 22-4), which consists of 200 tablets at a cost of $275 each
• Desired ending inventory = 20% of the next quarter’s sales
• Projected tablets sales in the first quarter of 2018 is 700 tablets (50 tablets more than fourth quarter 2017)
Copyright © 2014 Pearson Education, Inc. publishing as Prentice Hall 22-35
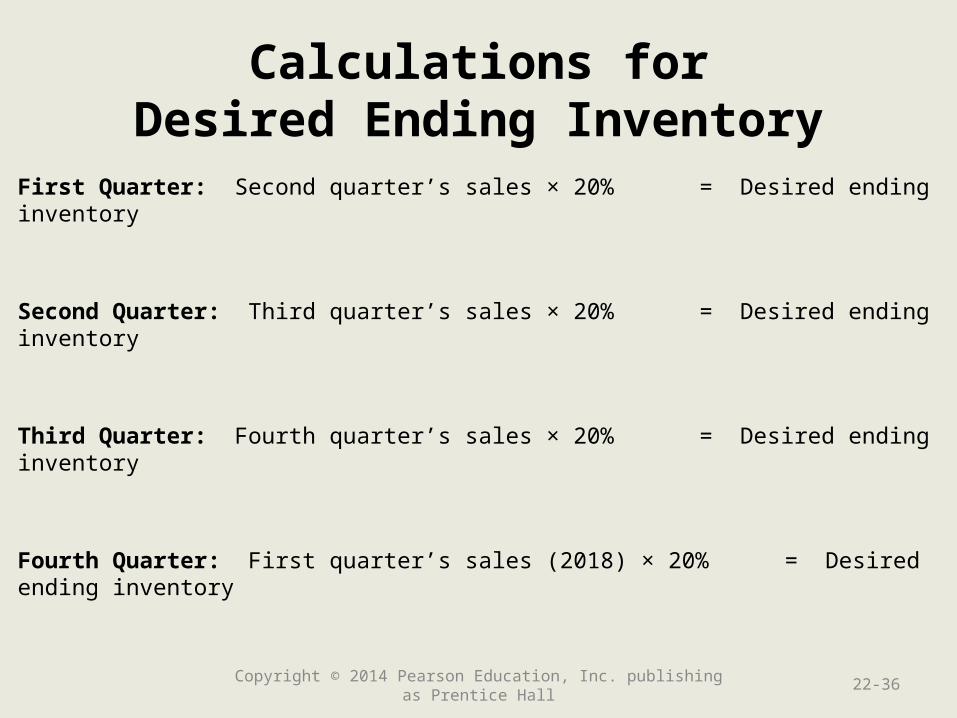
Calculations forDesired Ending Inventory
First Quarter: Second quarter’s sales × 20% = Desired ending inventory
Second Quarter: Third quarter’s sales × 20% = Desired ending inventory
Third Quarter: Fourth quarter’s sales × 20% = Desired ending inventory
Fourth Quarter: First quarter’s sales (2018) × 20% = Desired ending inventory
Copyright © 2014 Pearson Education, Inc. publishing as Prentice Hall 22-36
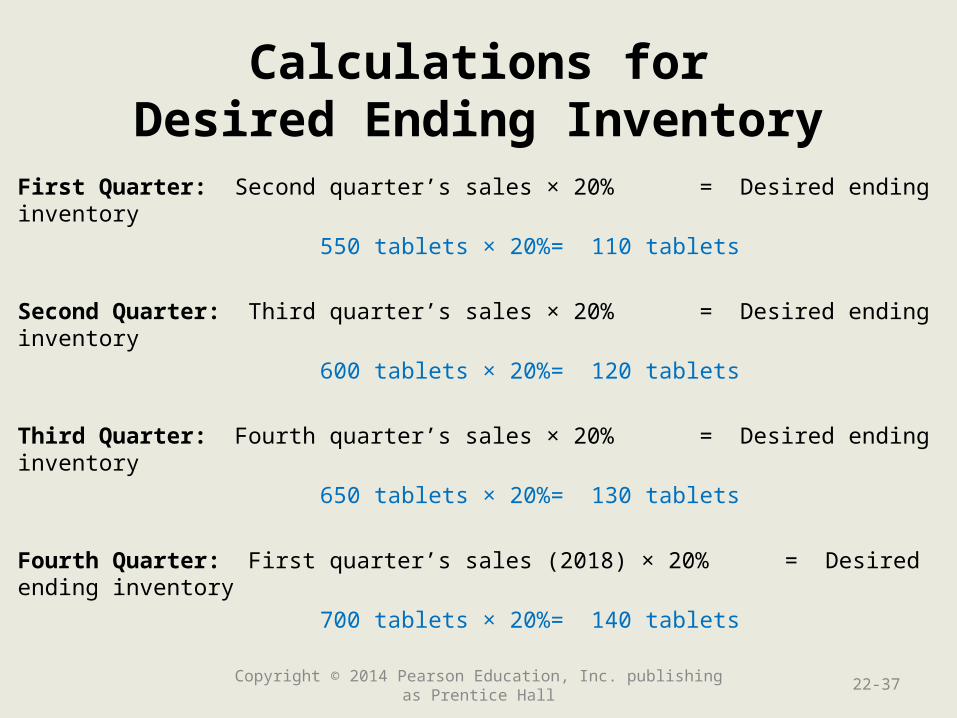
Calculations forDesired Ending Inventory
First Quarter: Second quarter’s sales × 20% = Desired ending inventory
550 tablets × 20% = 110 tablets
Second Quarter: Third quarter’s sales × 20% = Desired ending inventory
600 tablets × 20% = 120 tablets
Third Quarter: Fourth quarter’s sales × 20% = Desired ending inventory
650 tablets × 20% = 130 tablets
Fourth Quarter: First quarter’s sales (2018) × 20% = Desired ending inventory
700 tablets × 20% = 140 tablets
Copyright © 2014 Pearson Education, Inc. publishing as Prentice Hall 22-37
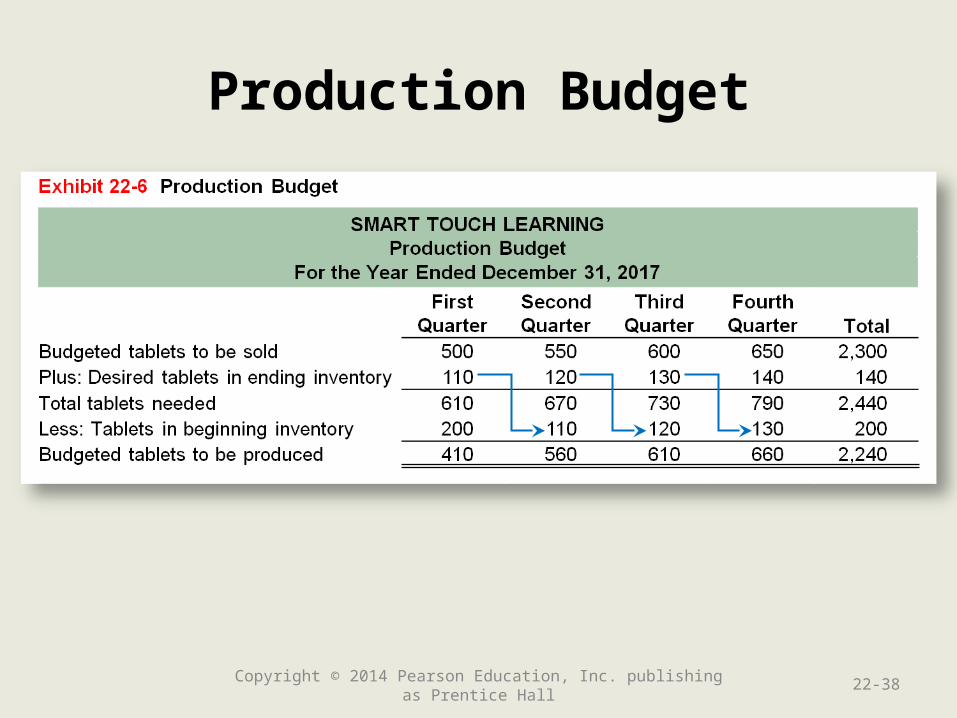
Production Budget
Copyright © 2014 Pearson Education, Inc. publishing as Prentice Hall 22-38
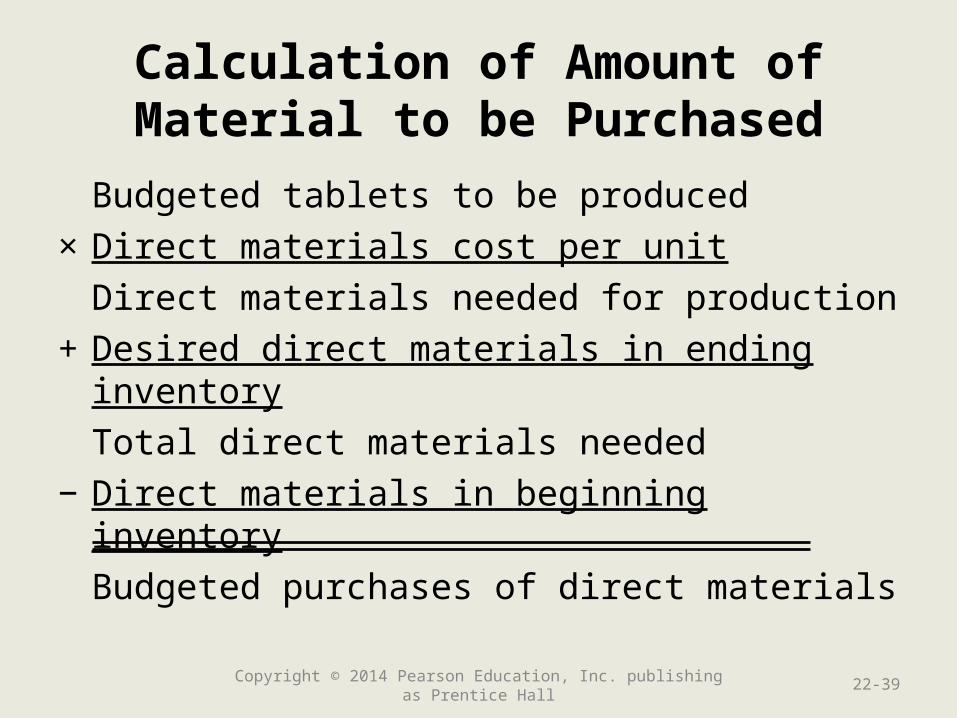
Calculation of Amount ofMaterial to be Purchased
Budgeted tablets to be produced
× Direct materials cost per unit
Direct materials needed for production
+ Desired direct materials in ending inventory
Total direct materials needed
− Direct materials in beginning inventory
Budgeted purchases of direct materials
Copyright © 2014 Pearson Education, Inc. publishing as Prentice Hall 22-39
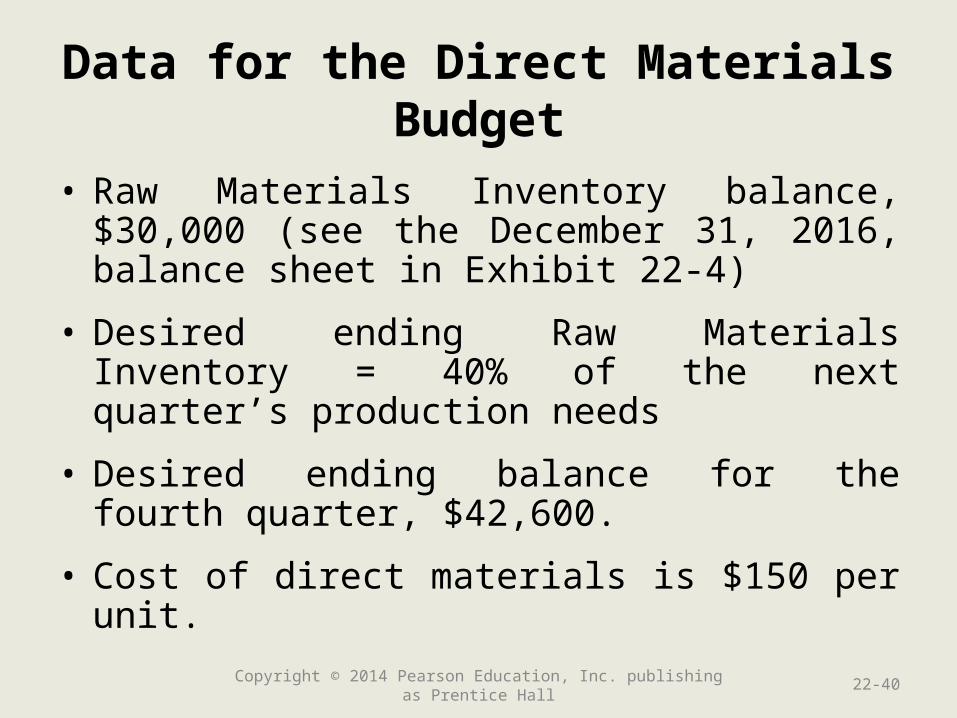
Data for the Direct Materials Budget
• Raw Materials Inventory balance, $30,000 (see the December 31, 2016, balance sheet in Exhibit 22-4)
• Desired ending Raw Materials Inventory = 40% of the next quarter’s production needs
• Desired ending balance for the fourth quarter, $42,600.
• Cost of direct materials is $150 per unit.
Copyright © 2014 Pearson Education, Inc. publishing as Prentice Hall 22-40
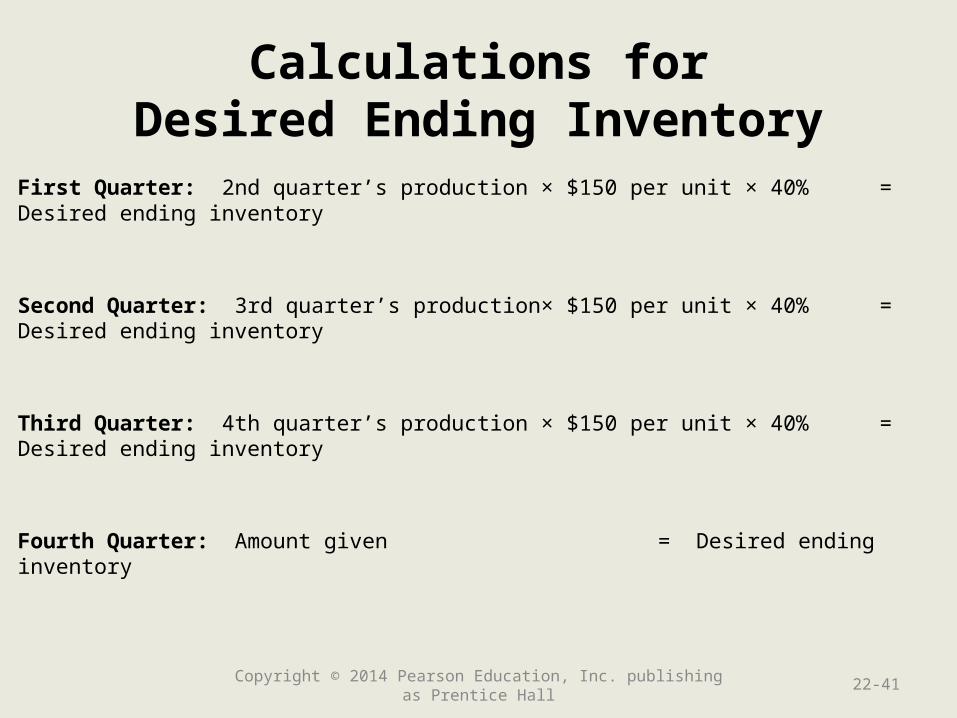
Calculations forDesired Ending Inventory
First Quarter: 2nd quarter’s production × $150 per unit × 40% = Desired ending inventory
Second Quarter: 3rd quarter’s production× $150 per unit × 40% = Desired ending inventory
Third Quarter: 4th quarter’s production × $150 per unit × 40% = Desired ending inventory
Fourth Quarter: Amount given = Desired ending inventory
Copyright © 2014 Pearson Education, Inc. publishing as Prentice Hall 22-41
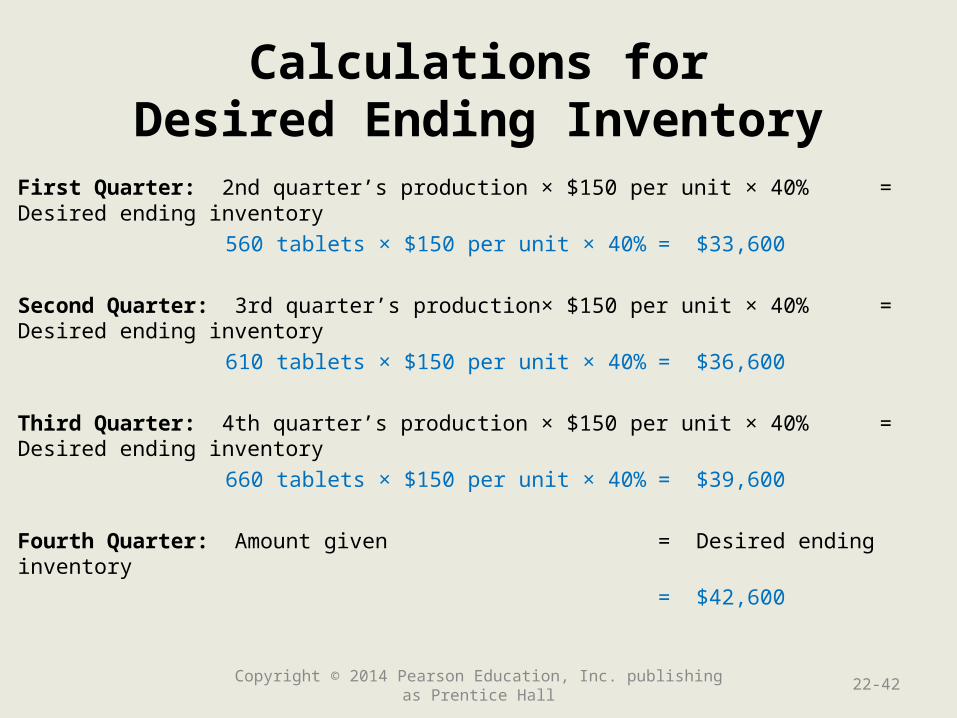
Calculations forDesired Ending Inventory
First Quarter: 2nd quarter’s production × $150 per unit × 40% = Desired ending inventory
560 tablets × $150 per unit × 40% = $33,600
Second Quarter: 3rd quarter’s production× $150 per unit × 40% = Desired ending inventory
610 tablets × $150 per unit × 40% = $36,600
Third Quarter: 4th quarter’s production × $150 per unit × 40% = Desired ending inventory
660 tablets × $150 per unit × 40% = $39,600
Fourth Quarter: Amount given = Desired ending inventory
= $42,600
Copyright © 2014 Pearson Education, Inc. publishing as Prentice Hall 22-42
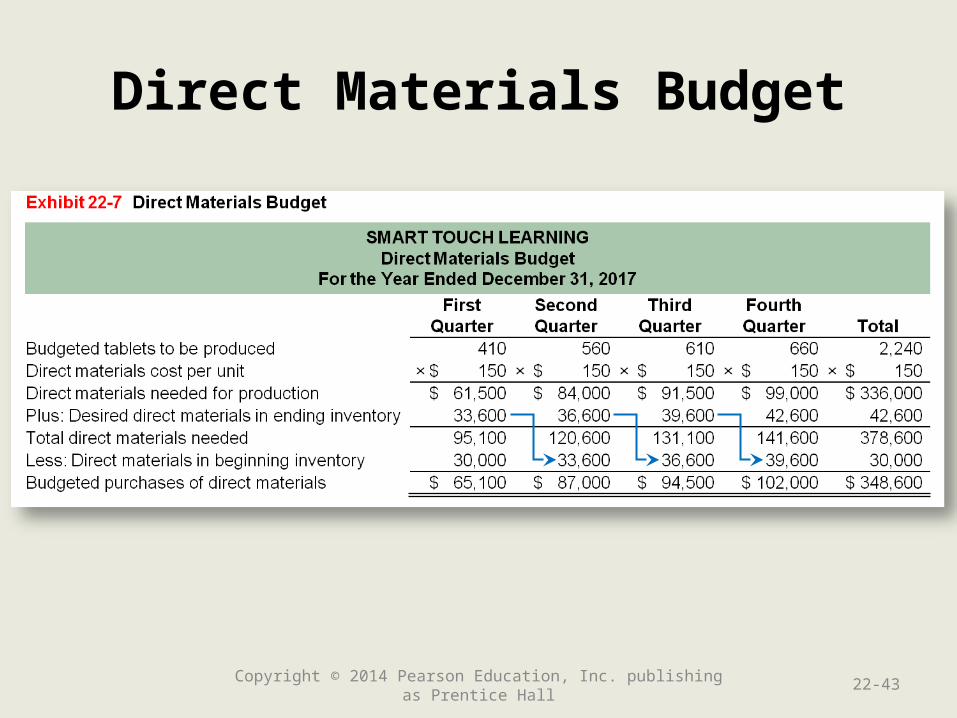
Direct Materials Budget
Copyright © 2014 Pearson Education, Inc. publishing as Prentice Hall 22-43
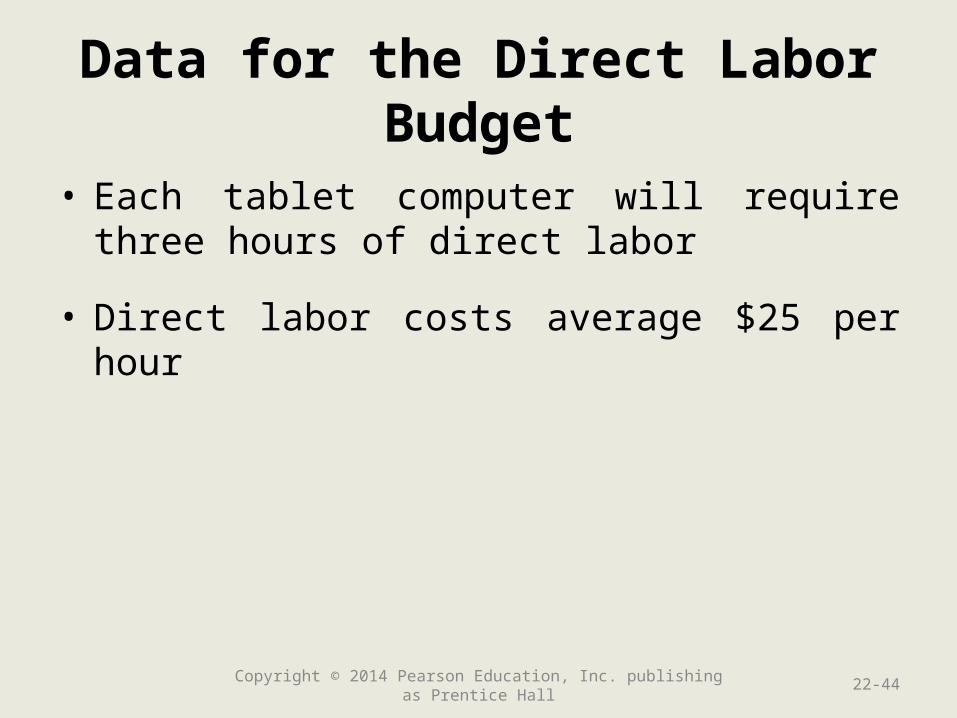
Data for the Direct Labor Budget
• Each tablet computer will require three hours of direct labor
• Direct labor costs average $25 per hour
Copyright © 2014 Pearson Education, Inc. publishing as Prentice Hall 22-44
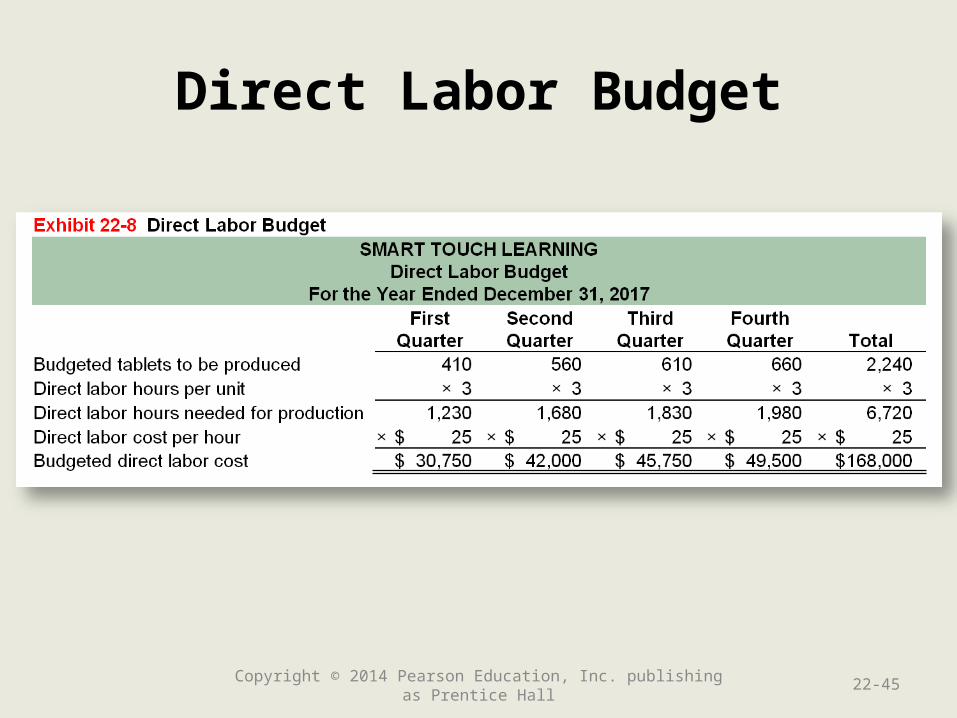
Direct Labor Budget
Copyright © 2014 Pearson Education, Inc. publishing as Prentice Hall 22-45
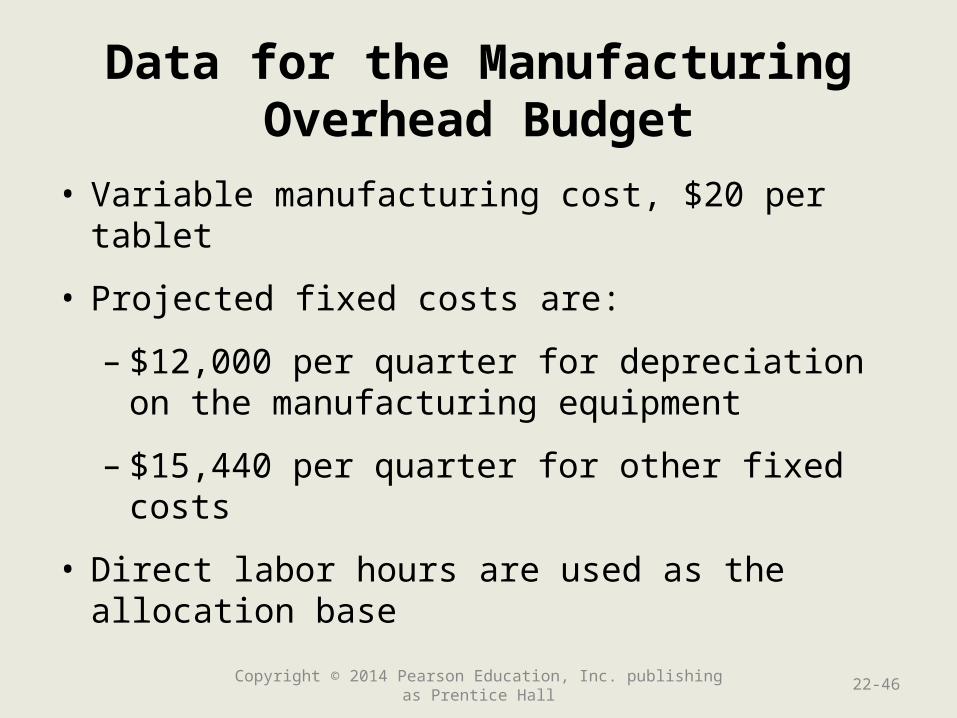
Data for the Manufacturing Overhead Budget
• Variable manufacturing cost, $20 per tablet
• Projected fixed costs are:
– $12,000 per quarter for depreciation on the manufacturing equipment
– $15,440 per quarter for other fixed costs
• Direct labor hours are used as the allocation base
Copyright © 2014 Pearson Education, Inc. publishing as Prentice Hall 22-46
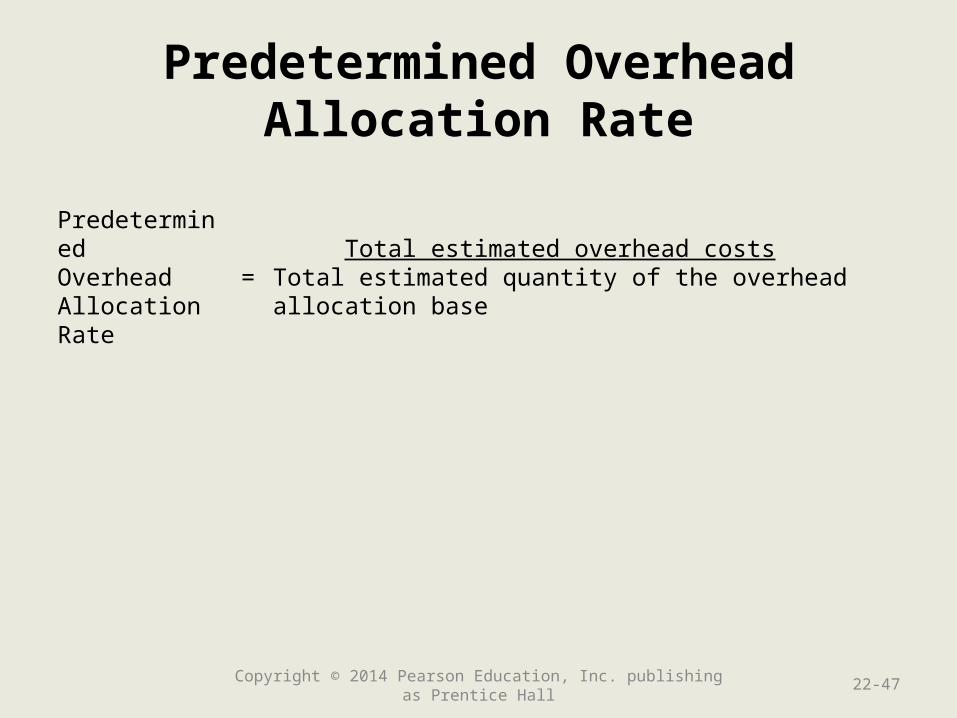
Predetermined OverheadAllocation Rate
Copyright © 2014 Pearson Education, Inc. publishing as Prentice Hall 22-47
PredeterminedOverheadAllocation Rate
=Total estimated overhead costs
Total estimated quantity of the overhead allocation base
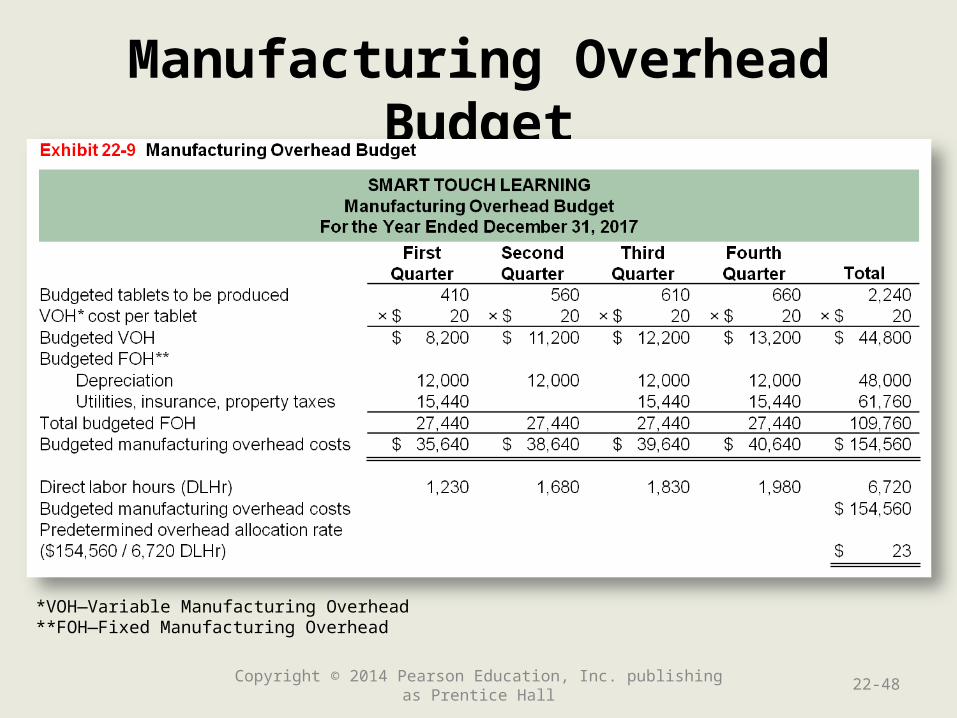
Manufacturing Overhead Budget
Copyright © 2014 Pearson Education, Inc. publishing as Prentice Hall 22-48
*VOH—Variable Manufacturing Overhead**FOH—Fixed Manufacturing Overhead
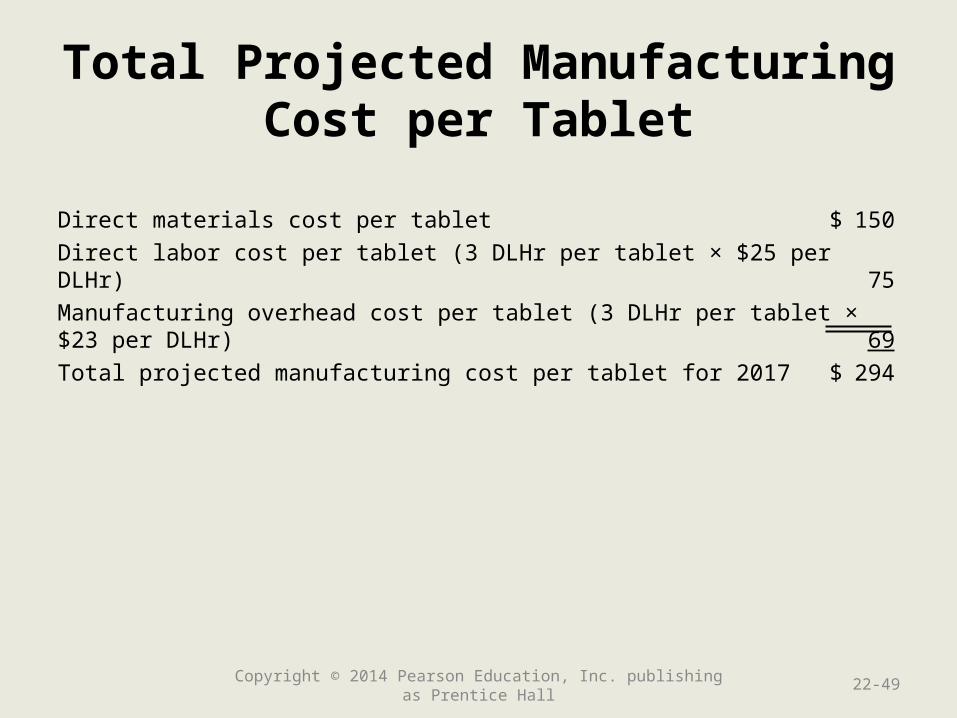
Total Projected ManufacturingCost per Tablet
Direct materials cost per tablet $ 150
Direct labor cost per tablet (3 DLHr per tablet × $25 per DLHr) 75
Manufacturing overhead cost per tablet (3 DLHr per tablet × $23 per DLHr) 69
Total projected manufacturing cost per tablet for 2017 $ 294
Copyright © 2014 Pearson Education, Inc. publishing as Prentice Hall 22-49
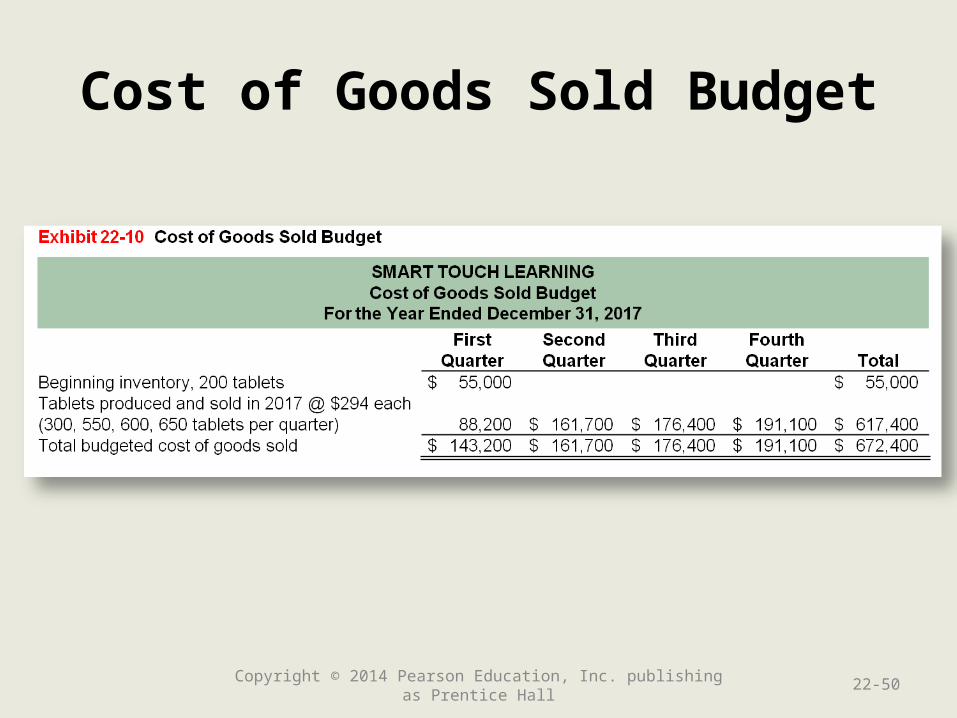
Cost of Goods Sold Budget
Copyright © 2014 Pearson Education, Inc. publishing as Prentice Hall 22-50
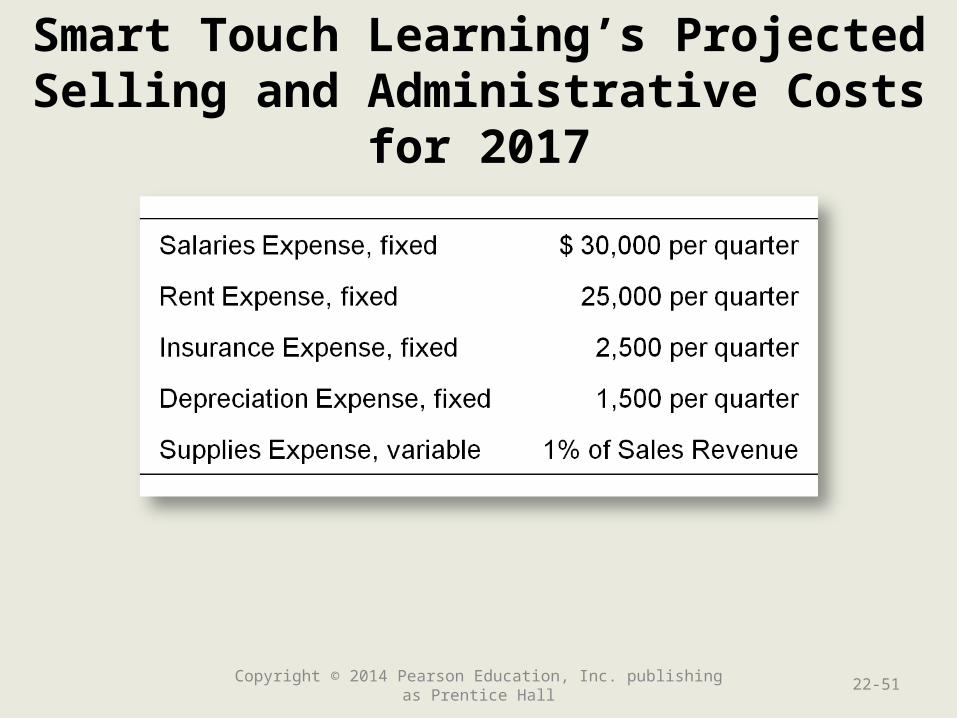
Smart Touch Learning’s ProjectedSelling and Administrative Costs for 2017
Copyright © 2014 Pearson Education, Inc. publishing as Prentice Hall 22-51
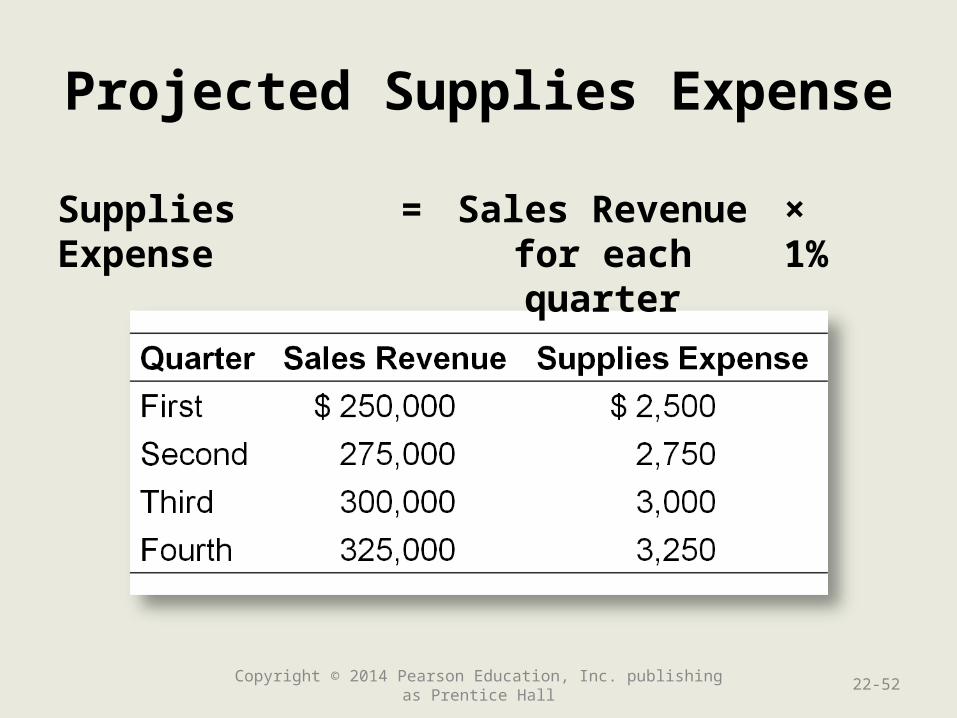
Projected Supplies Expense
Copyright © 2014 Pearson Education, Inc. publishing as Prentice Hall 22-52
Supplies Expense = Sales Revenue for each quarter
× 1%
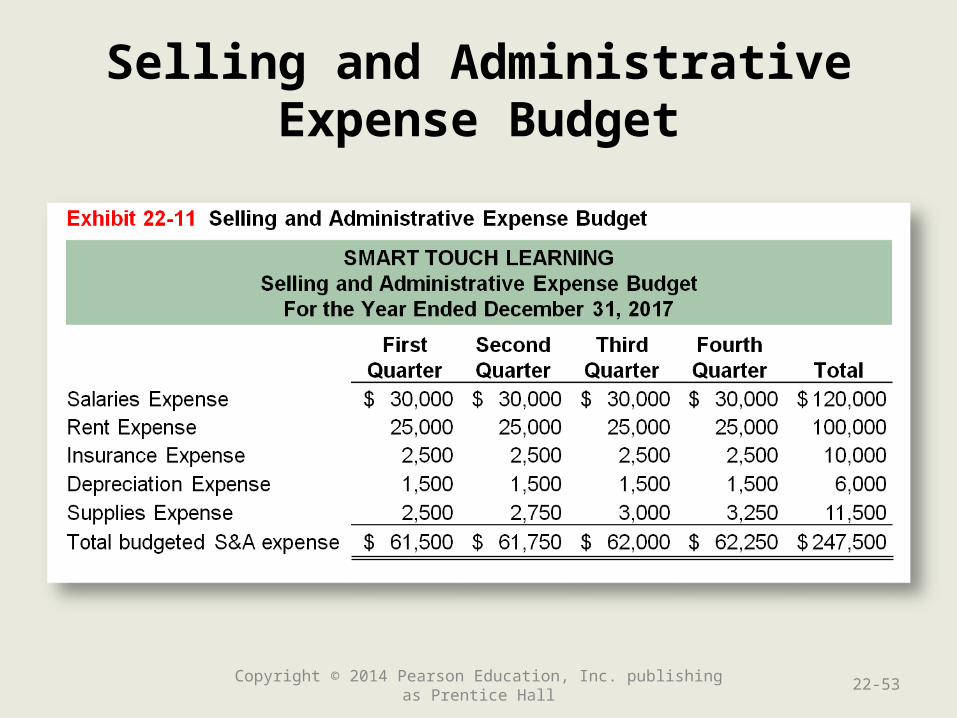
Selling and AdministrativeExpense Budget
Copyright © 2014 Pearson Education, Inc. publishing as Prentice Hall 22-53

11. Kendall Company projects 2015 first quarter sales to be $10,000 and increase by 5% per quarter. Determine the projected sales for 2015 by quarter and in total. Round answers to the nearest dollar.
Copyright © 2014 Pearson Education, Inc. publishing as Prentice Hall 22-54
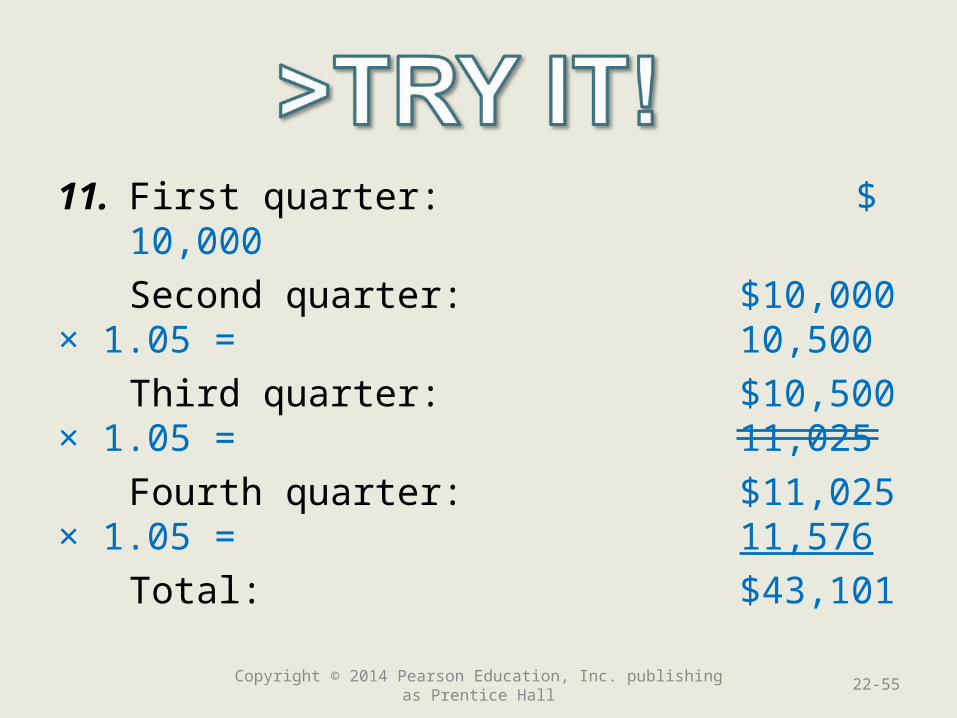
11. First quarter: $10,000
Second quarter: $10,000 × 1.05 = 10,500
Third quarter: $10,500 × 1.05 = 11,025
Fourth quarter: $11,025 × 1.05 = 11,576
Total: $43,101
Copyright © 2014 Pearson Education, Inc. publishing as Prentice Hall 22-55
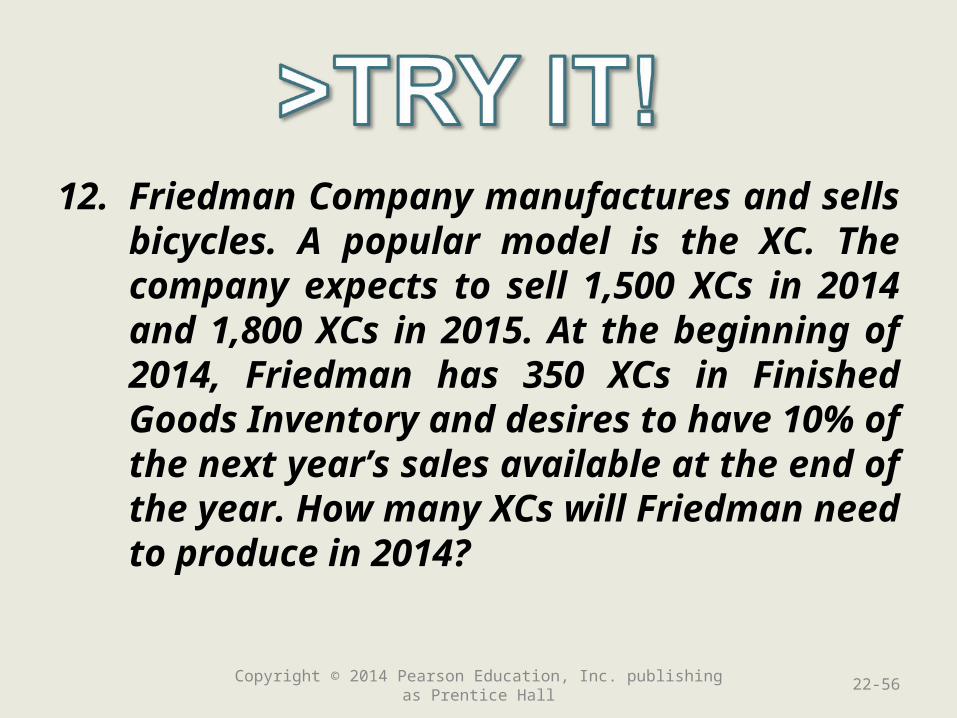
12. Friedman Company manufactures and sells bicycles. A popular model is the XC. The company expects to sell 1,500 XCs in 2014 and 1,800 XCs in 2015. At the beginning of 2014, Friedman has 350 XCs in Finished Goods Inventory and desires to have 10% of the next year’s sales available at the end of the year. How many XCs will Friedman need to produce in 2014?
Copyright © 2014 Pearson Education, Inc. publishing as Prentice Hall 22-56
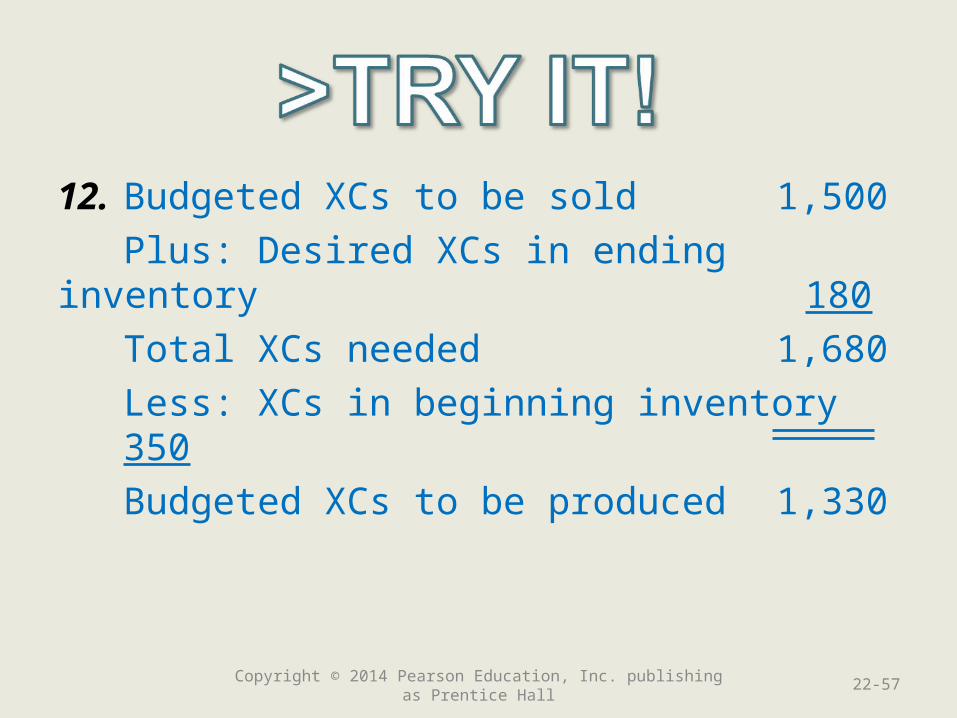
12. Budgeted XCs to be sold 1,500
Plus: Desired XCs in ending inventory 180
Total XCs needed 1,680
Less: XCs in beginning inventory 350
Budgeted XCs to be produced 1,330
Copyright © 2014 Pearson Education, Inc. publishing as Prentice Hall 22-57
Learning Objective 4
Prepare a financial Prepare a financial budget for a budget for a
manufacturing manufacturing companycompany
22-58Copyright © 2014 Pearson Education, Inc. publishing as Prentice Hall
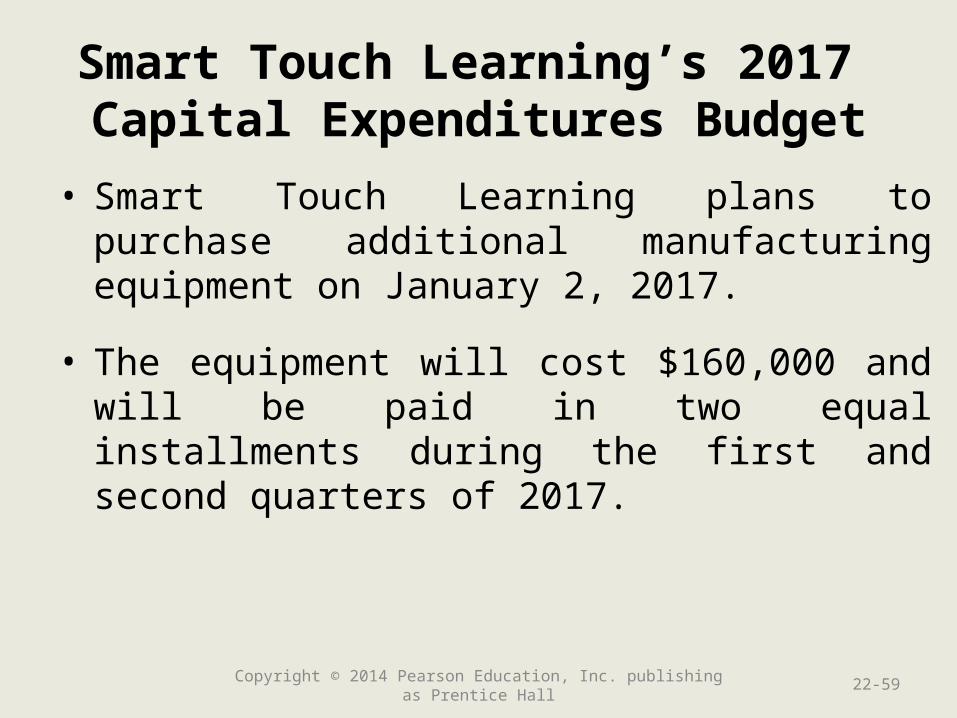
Smart Touch Learning’s 2017 Capital Expenditures Budget
• Smart Touch Learning plans to purchase additional manufacturing equipment on January 2, 2017.
• The equipment will cost $160,000 and will be paid in two equal installments during the first and second quarters of 2017.
Copyright © 2014 Pearson Education, Inc. publishing as Prentice Hall 22-59
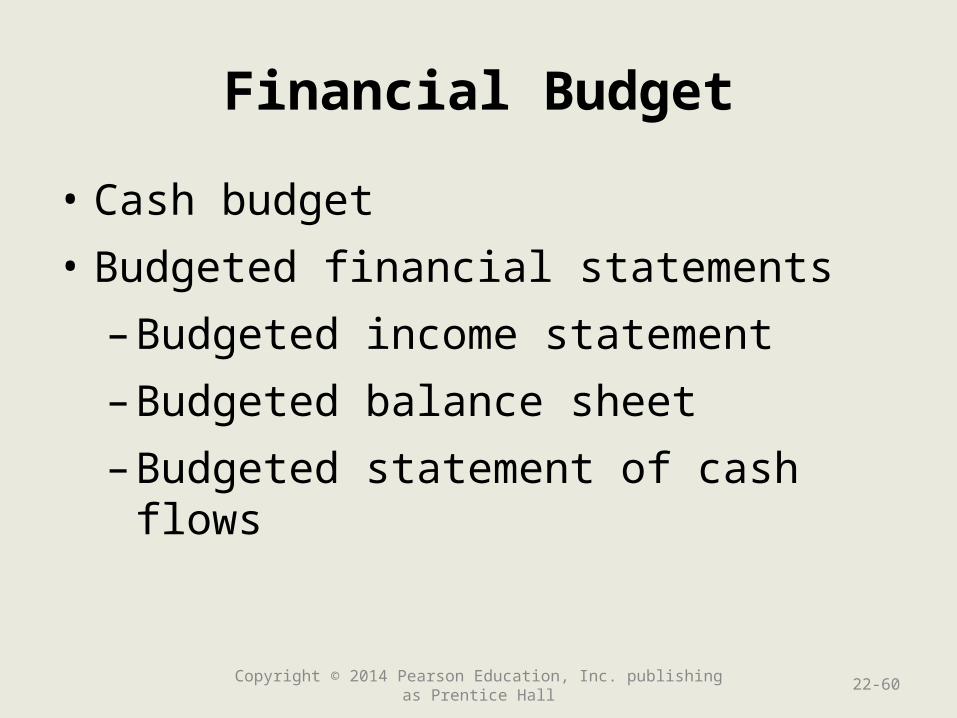
Financial Budget
• Cash budget
• Budgeted financial statements
– Budgeted income statement
– Budgeted balance sheet
– Budgeted statement of cash flows
Copyright © 2014 Pearson Education, Inc. publishing as Prentice Hall 22-60
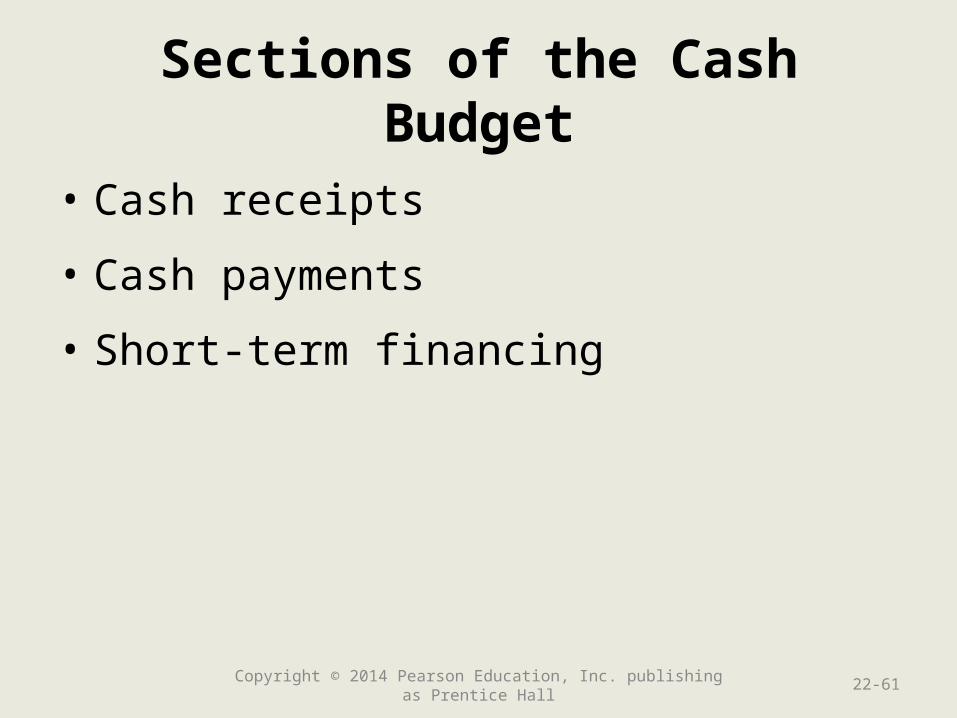
Sections of the Cash Budget
• Cash receipts
• Cash payments
• Short-term financing
Copyright © 2014 Pearson Education, Inc. publishing as Prentice Hall 22-61
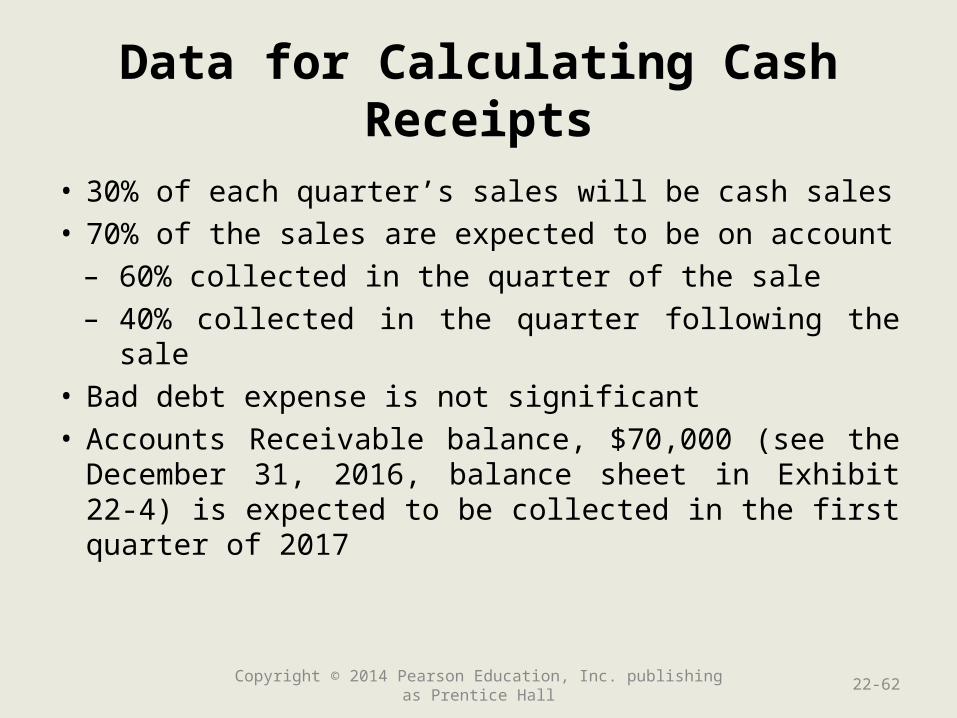
Data for Calculating Cash Receipts
• 30% of each quarter’s sales will be cash sales• 70% of the sales are expected to be on account
– 60% collected in the quarter of the sale– 40% collected in the quarter following the sale
• Bad debt expense is not significant• Accounts Receivable balance, $70,000 (see the
December 31, 2016, balance sheet in Exhibit 22-4) is expected to be collected in the first quarter of 2017
Copyright © 2014 Pearson Education, Inc. publishing as Prentice Hall 22-62
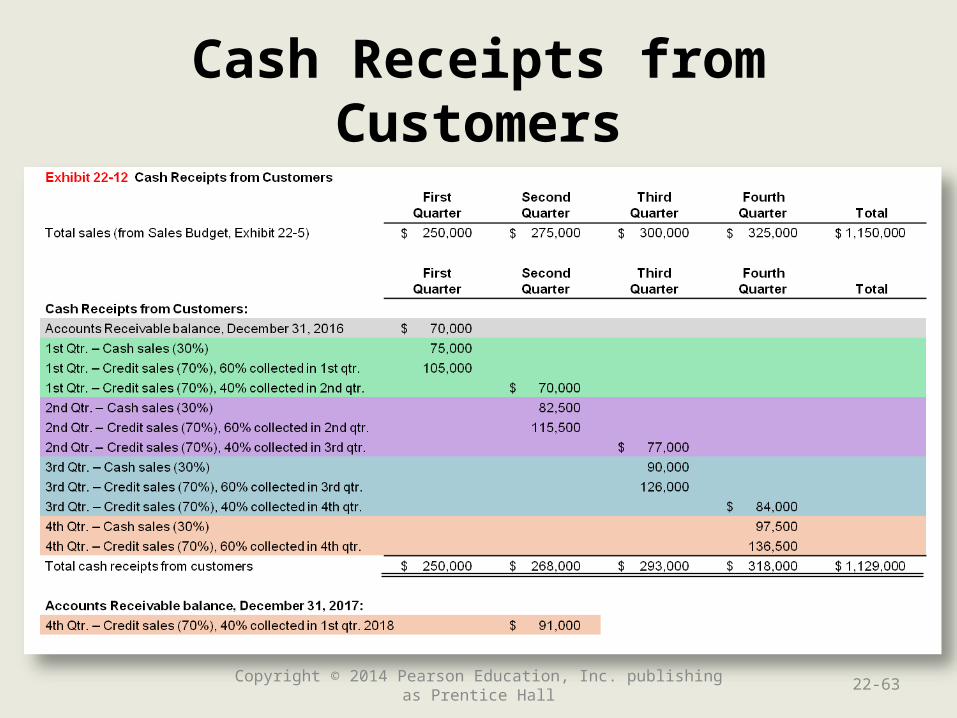
Cash Receipts from Customers
Copyright © 2014 Pearson Education, Inc. publishing as Prentice Hall 22-63
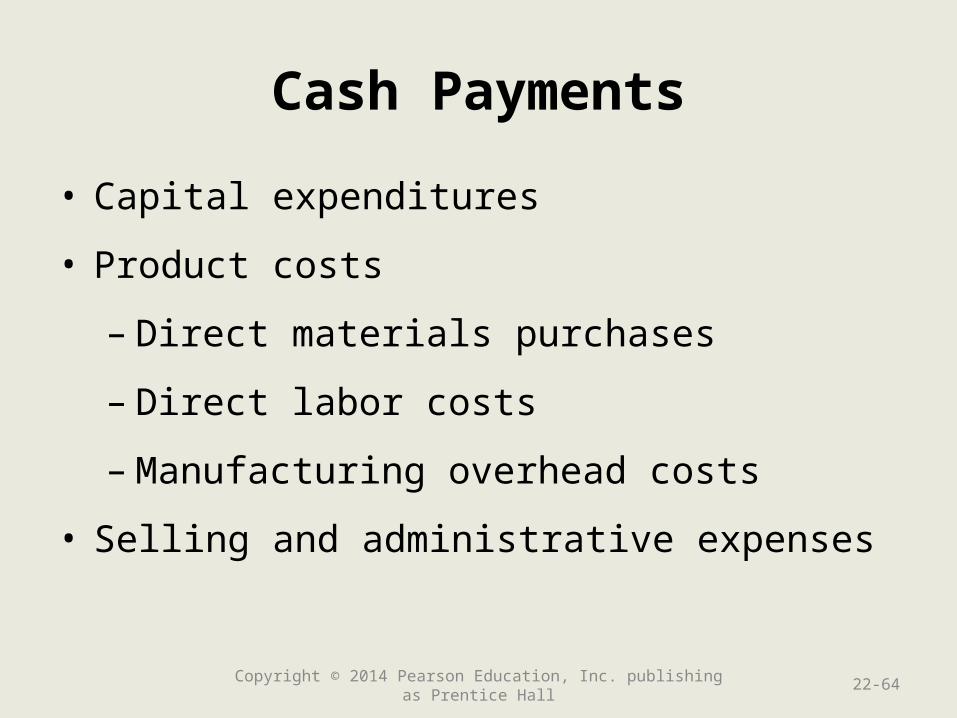
Cash Payments
• Capital expenditures
• Product costs
– Direct materials purchases
– Direct labor costs
– Manufacturing overhead costs
• Selling and administrative expenses
Copyright © 2014 Pearson Education, Inc. publishing as Prentice Hall 22-64
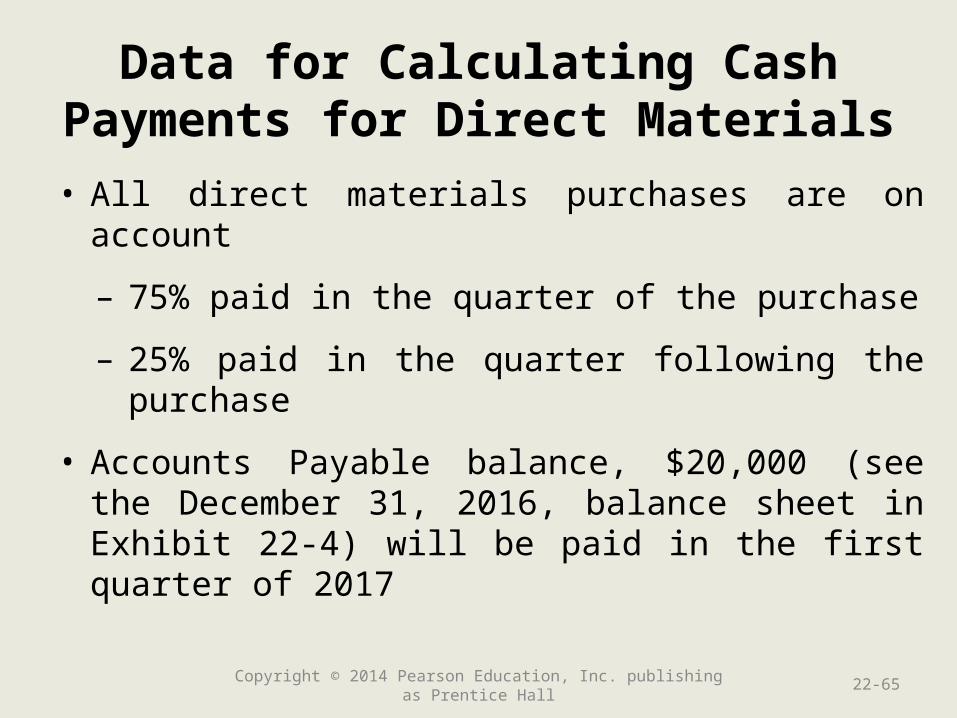
Data for Calculating CashPayments for Direct Materials
• All direct materials purchases are on account
– 75% paid in the quarter of the purchase
– 25% paid in the quarter following the purchase
• Accounts Payable balance, $20,000 (see the December 31, 2016, balance sheet in Exhibit 22-4) will be paid in the first quarter of 2017
Copyright © 2014 Pearson Education, Inc. publishing as Prentice Hall 22-65
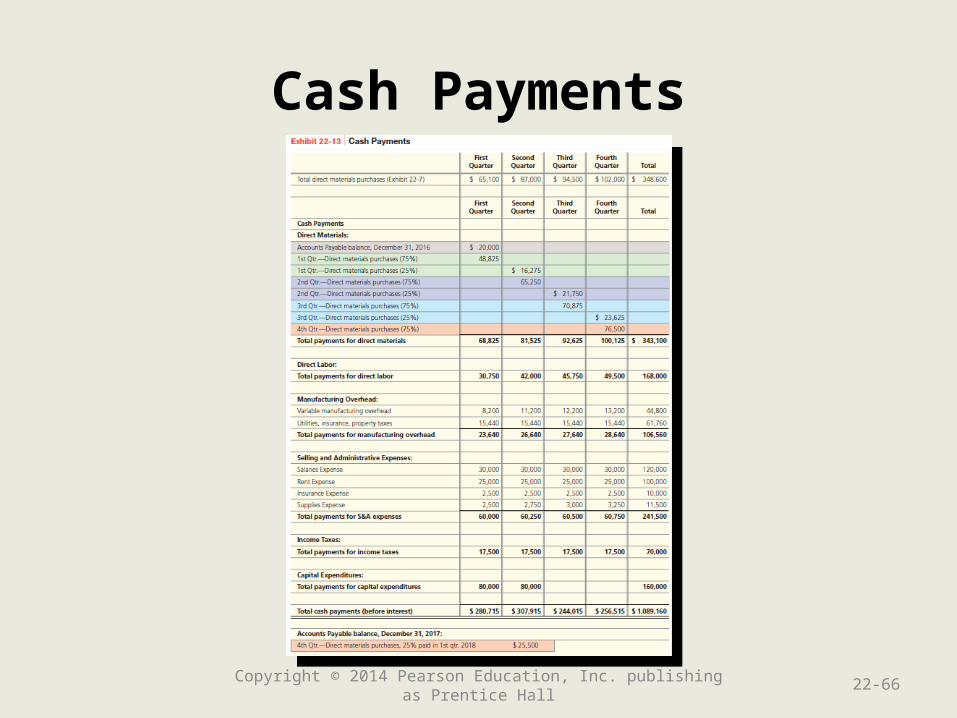
Cash Payments
Copyright © 2014 Pearson Education, Inc. publishing as Prentice Hall 22-66
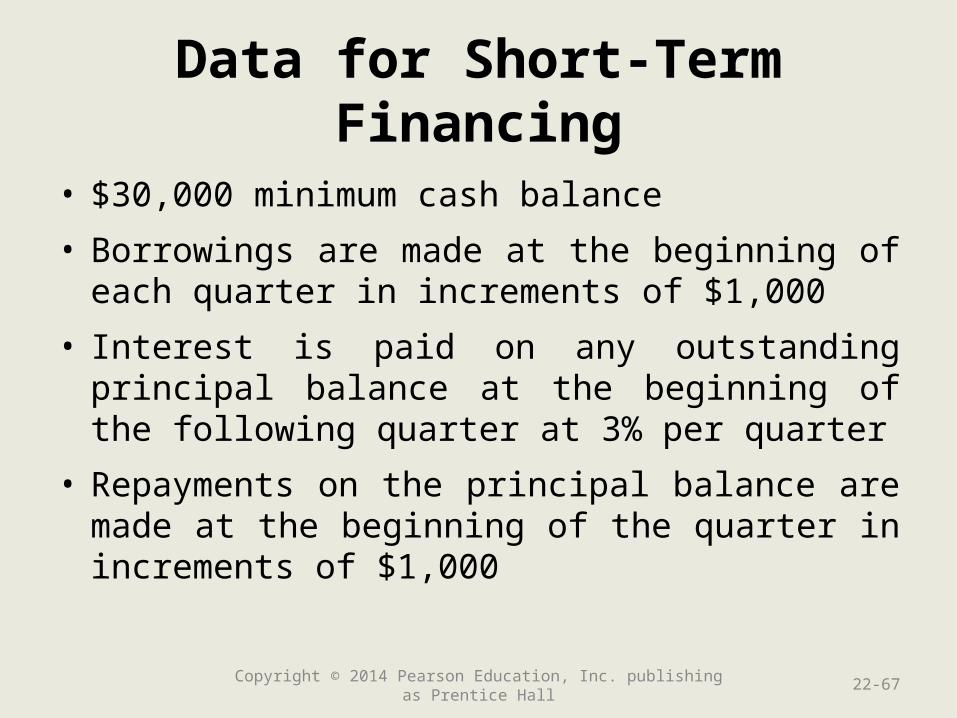
Data for Short-Term Financing
• $30,000 minimum cash balance
• Borrowings are made at the beginning of each quarter in increments of $1,000
• Interest is paid on any outstanding principal balance at the beginning of the following quarter at 3% per quarter
• Repayments on the principal balance are made at the beginning of the quarter in increments of $1,000
Copyright © 2014 Pearson Education, Inc. publishing as Prentice Hall 22-67
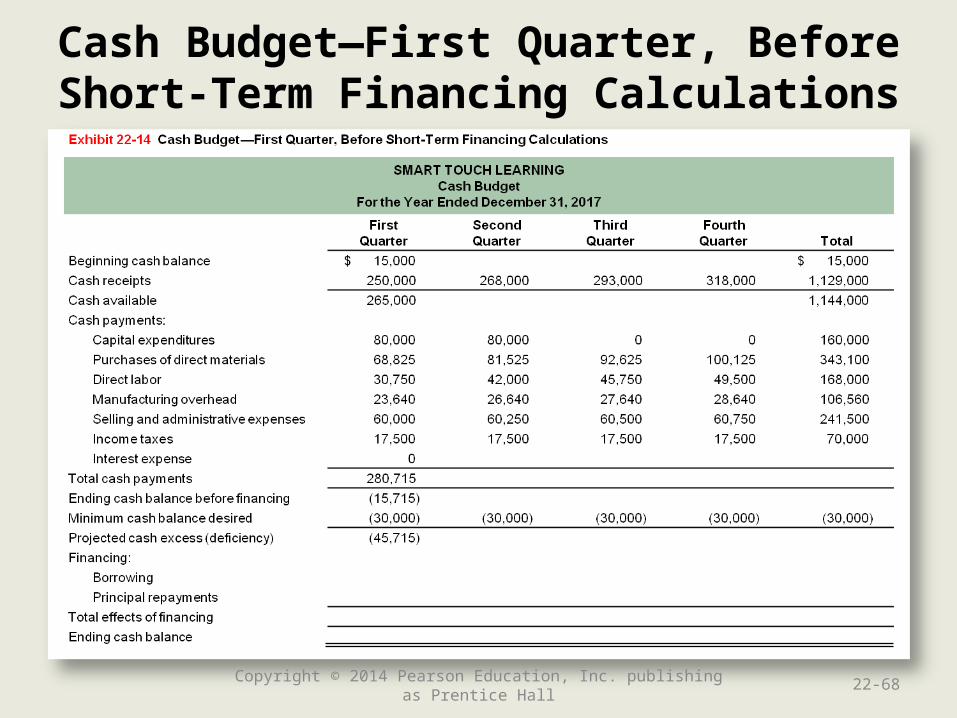
Cash Budget—First Quarter, Before Short-Term Financing Calculations
Copyright © 2014 Pearson Education, Inc. publishing as Prentice Hall 22-68
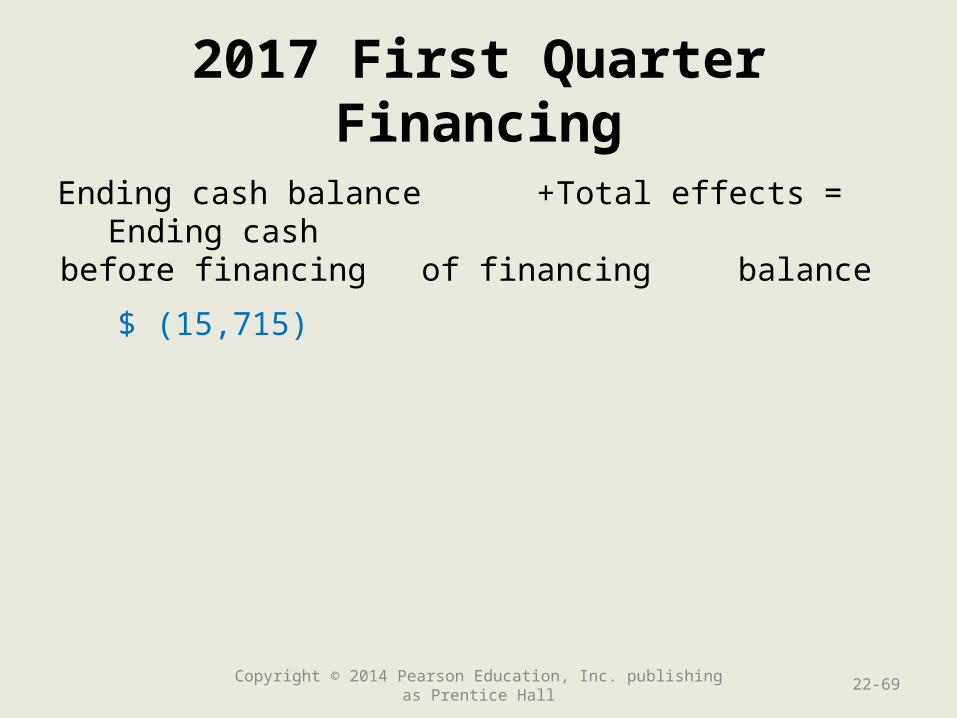
2017 First Quarter Financing
Ending cash balance + Total effects = Ending cashbefore financing of financing balance
$ (15,715)
Copyright © 2014 Pearson Education, Inc. publishing as Prentice Hall 22-69
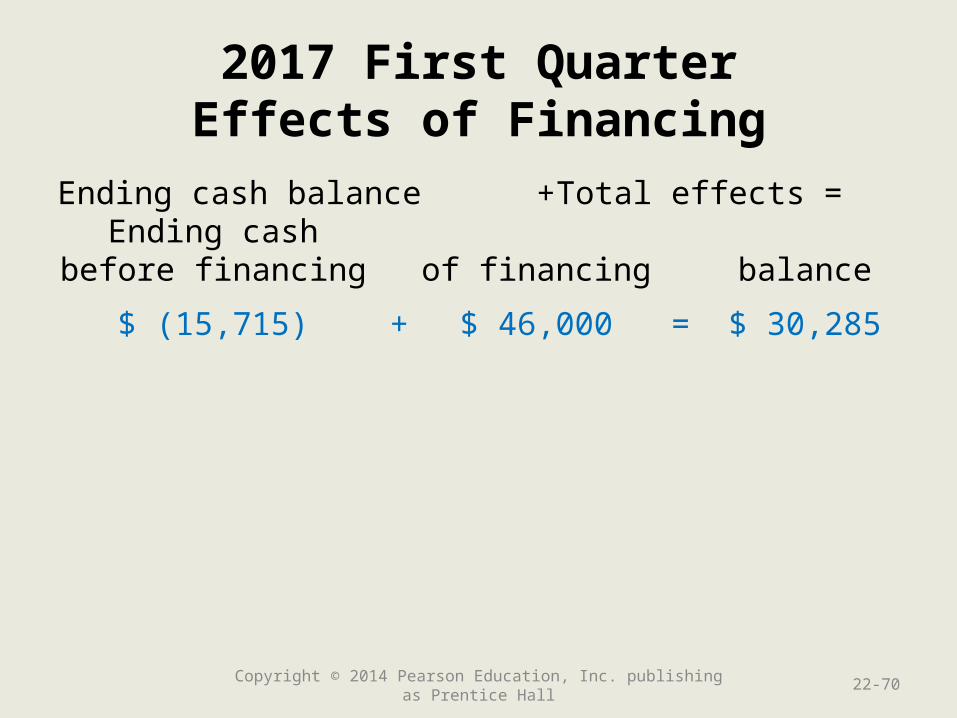
2017 First QuarterEffects of Financing
Ending cash balance + Total effects = Ending cashbefore financing of financing balance
$ (15,715) + $ 46,000 = $ 30,285
Copyright © 2014 Pearson Education, Inc. publishing as Prentice Hall 22-70
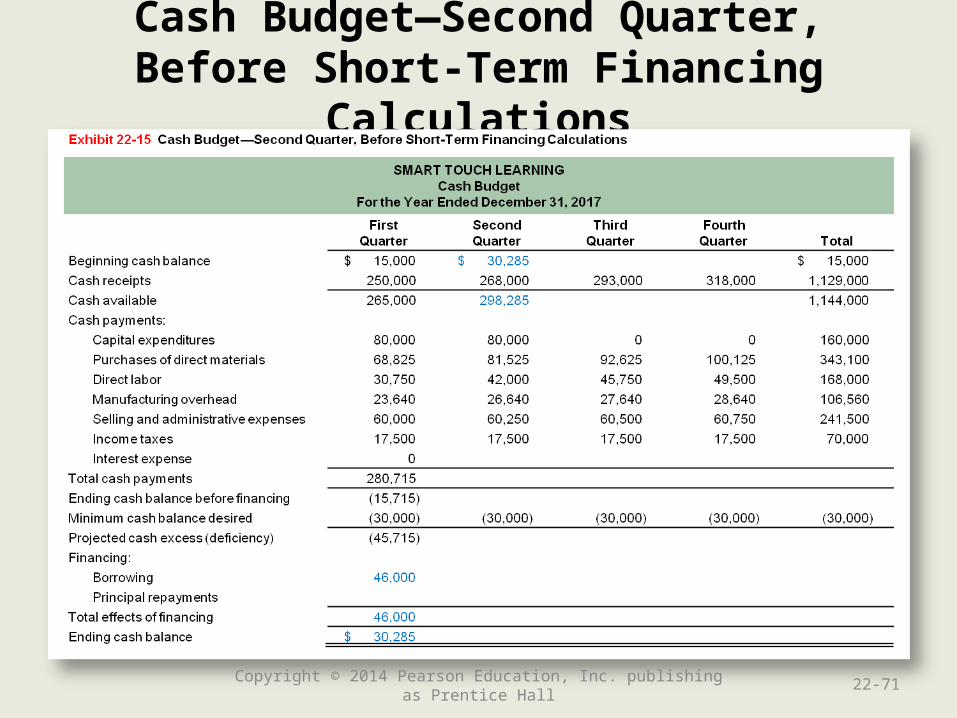
Cash Budget—Second Quarter, Before Short-Term Financing Calculations
Copyright © 2014 Pearson Education, Inc. publishing as Prentice Hall 22-71
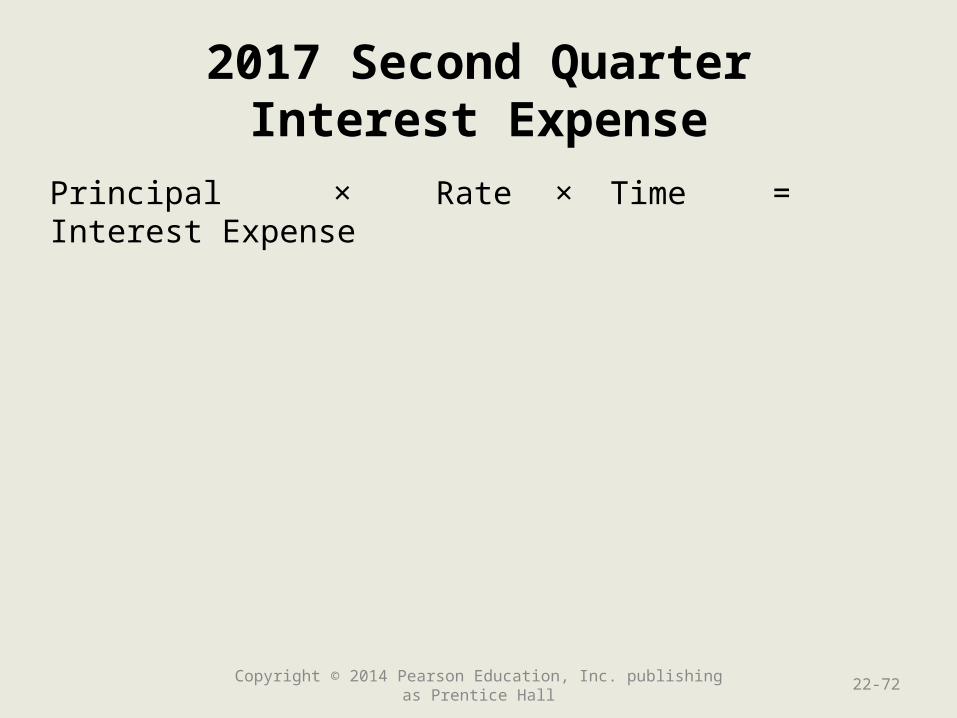
2017 Second QuarterInterest Expense
Principal × Rate × Time = Interest Expense
Copyright © 2014 Pearson Education, Inc. publishing as Prentice Hall 22-72
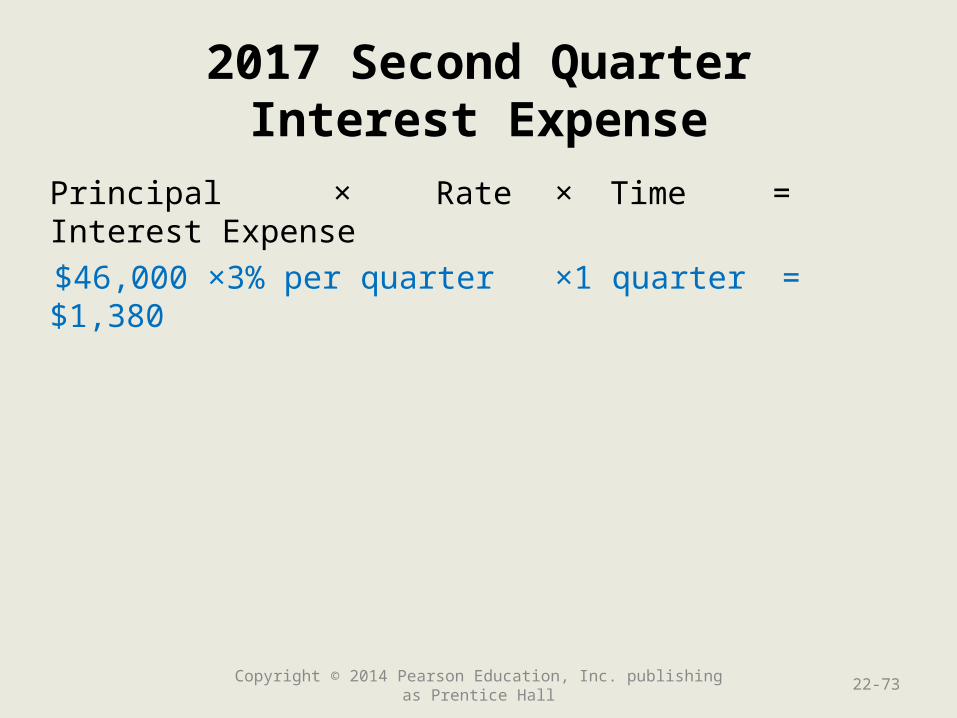
2017 Second QuarterInterest Expense
Principal × Rate × Time = Interest Expense
$46,000 × 3% per quarter × 1 quarter = $1,380
Copyright © 2014 Pearson Education, Inc. publishing as Prentice Hall 22-73
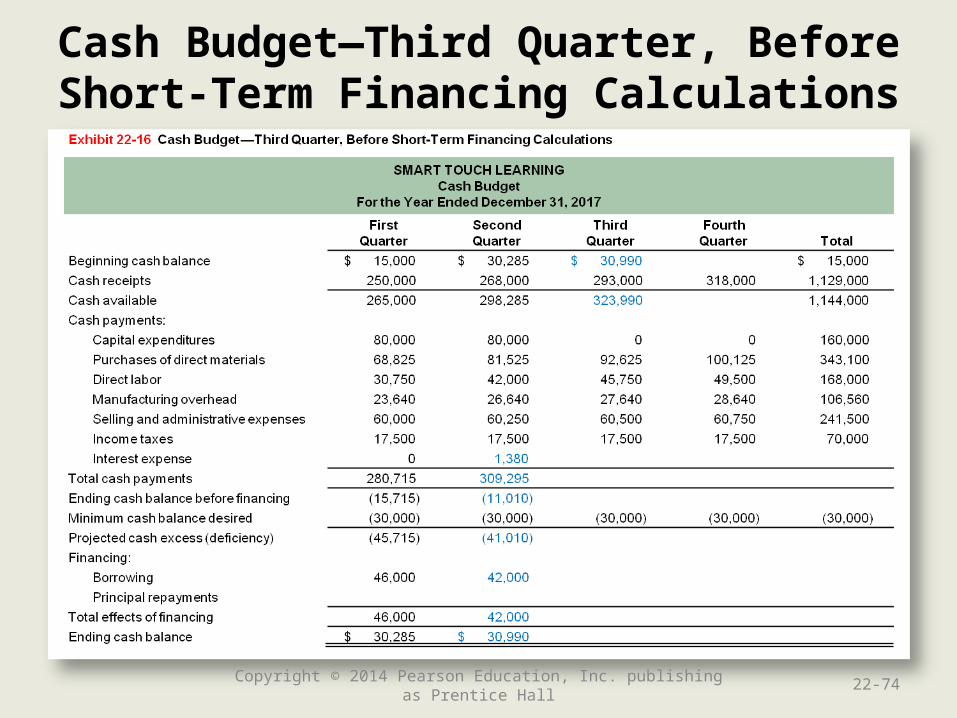
Cash Budget—Third Quarter, Before Short-Term Financing Calculations
Copyright © 2014 Pearson Education, Inc. publishing as Prentice Hall 22-74
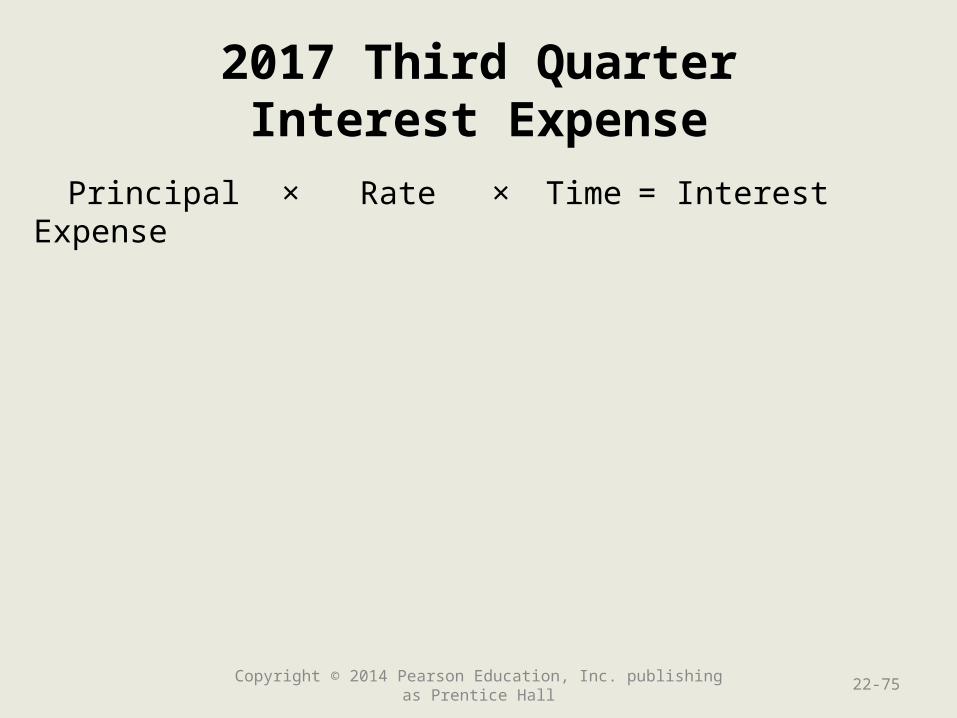
2017 Third QuarterInterest Expense
Principal × Rate × Time = Interest Expense
Copyright © 2014 Pearson Education, Inc. publishing as Prentice Hall 22-75
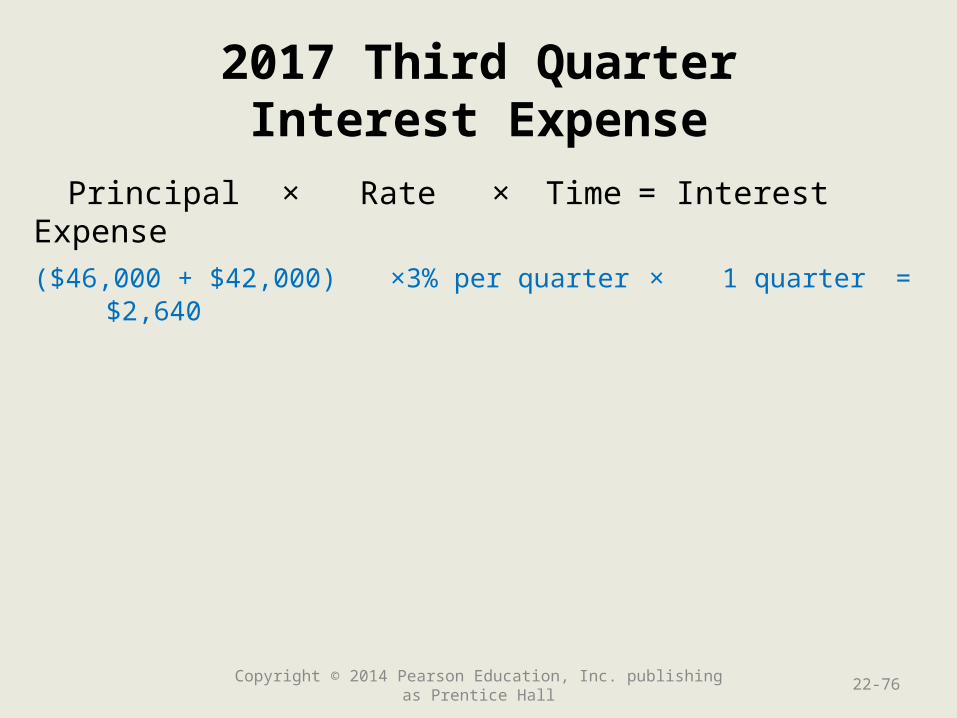
2017 Third QuarterInterest Expense
Principal × Rate × Time = Interest Expense
($46,000 + $42,000) × 3% per quarter × 1 quarter = $2,640
Copyright © 2014 Pearson Education, Inc. publishing as Prentice Hall 22-76

Completed Cash Budget
Copyright © 2014 Pearson Education, Inc. publishing as Prentice Hall 22-77
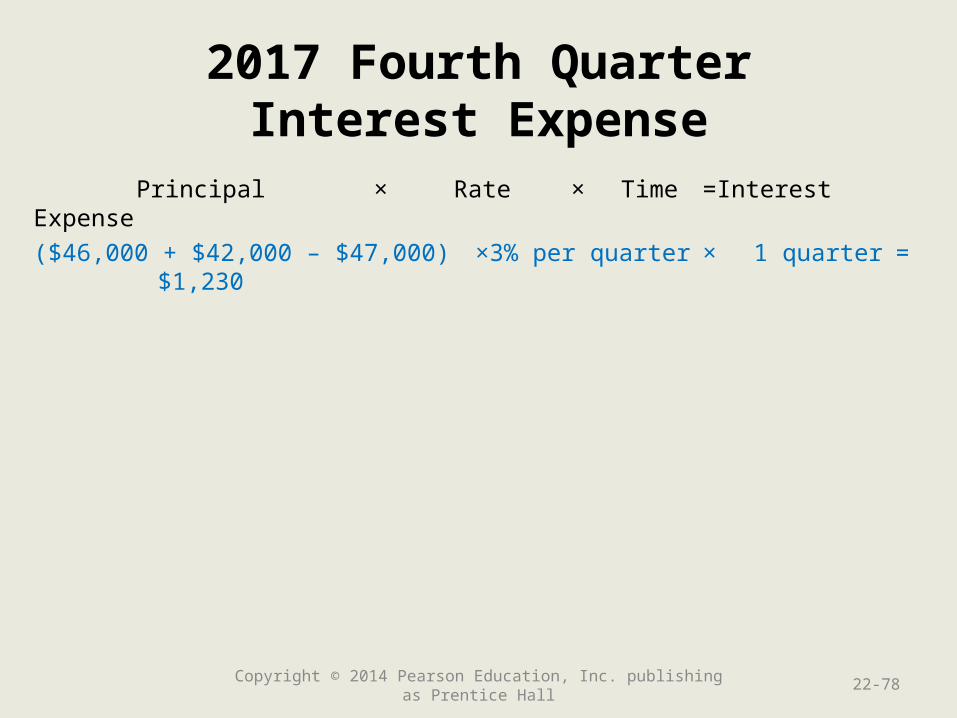
2017 Fourth QuarterInterest Expense
Principal × Rate × Time = Interest Expense
($46,000 + $42,000 – $47,000) × 3% per quarter × 1 quarter = $1,230
Copyright © 2014 Pearson Education, Inc. publishing as Prentice Hall 22-78
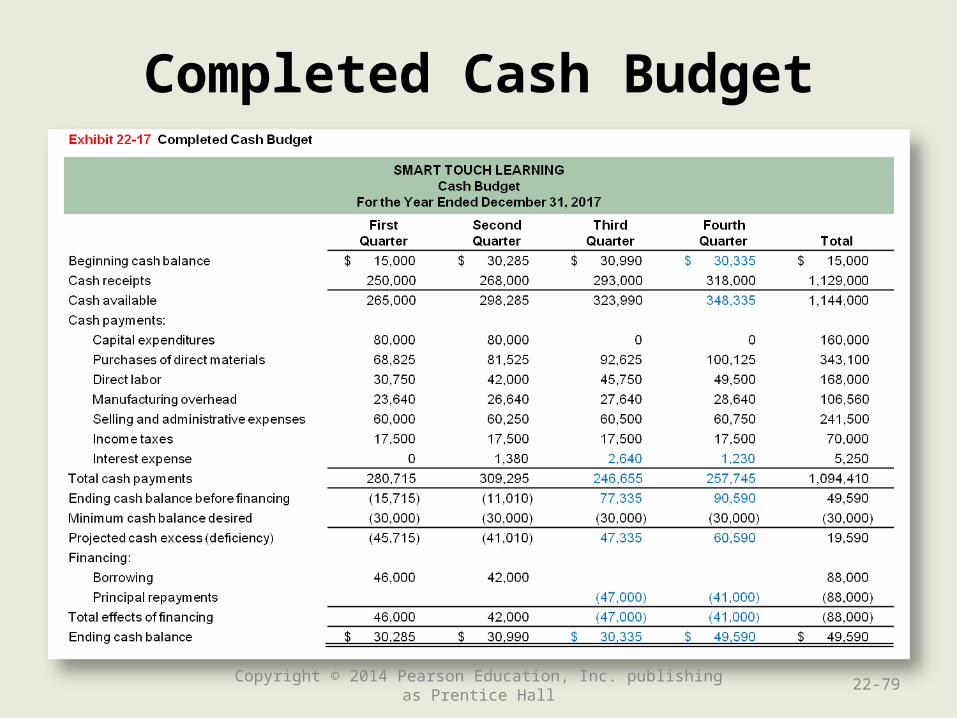
Completed Cash Budget
Copyright © 2014 Pearson Education, Inc. publishing as Prentice Hall 22-79
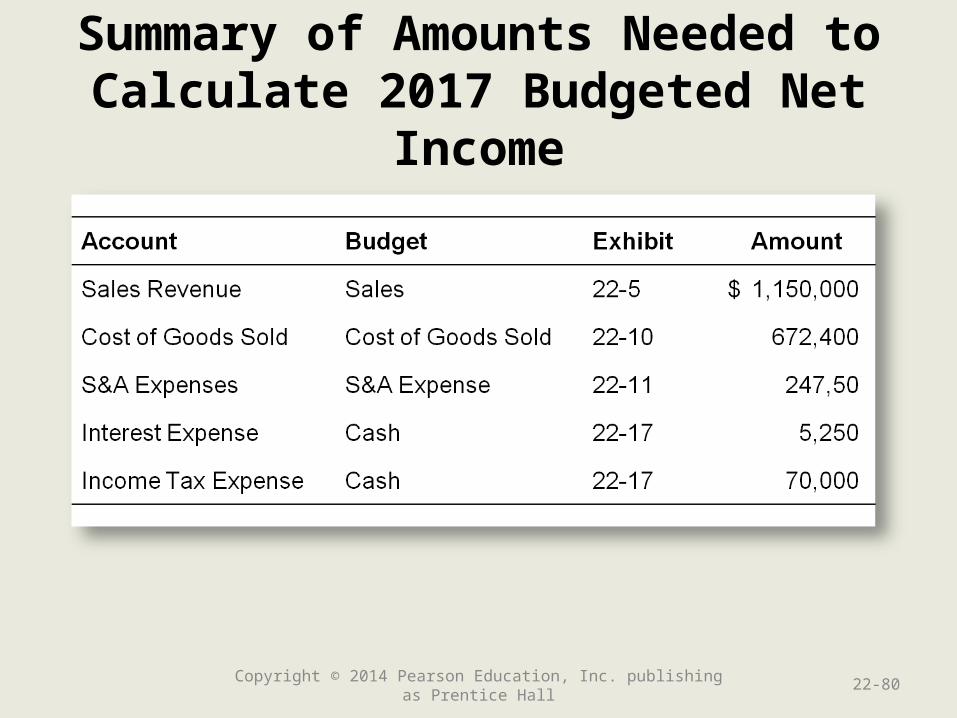
Summary of Amounts Needed to Calculate 2017 Budgeted Net Income
Copyright © 2014 Pearson Education, Inc. publishing as Prentice Hall 22-80
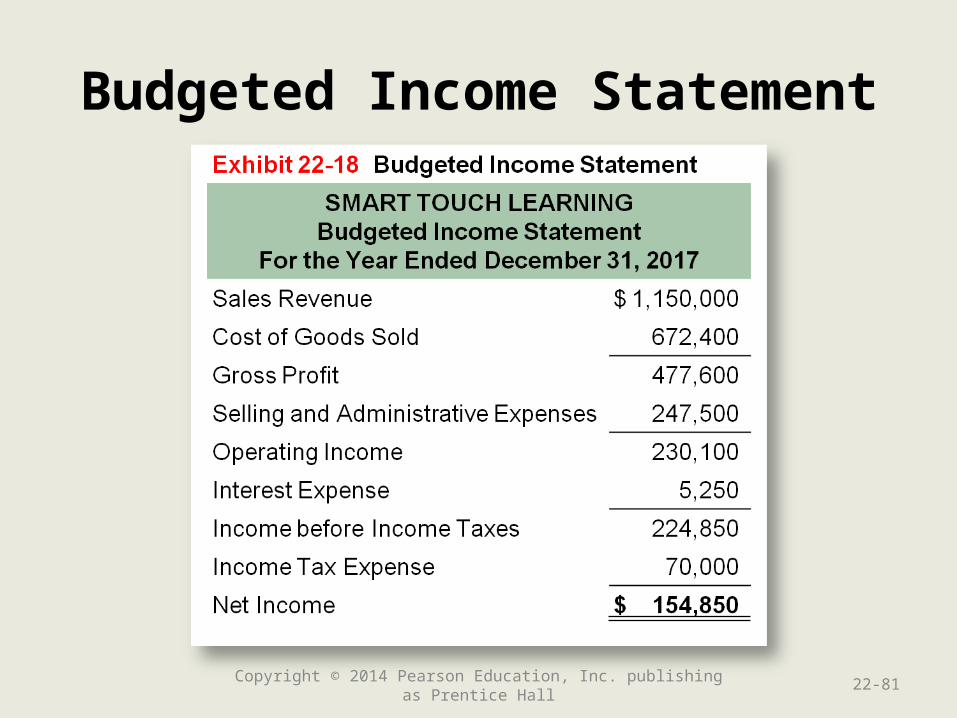
Budgeted Income Statement
Copyright © 2014 Pearson Education, Inc. publishing as Prentice Hall 22-81
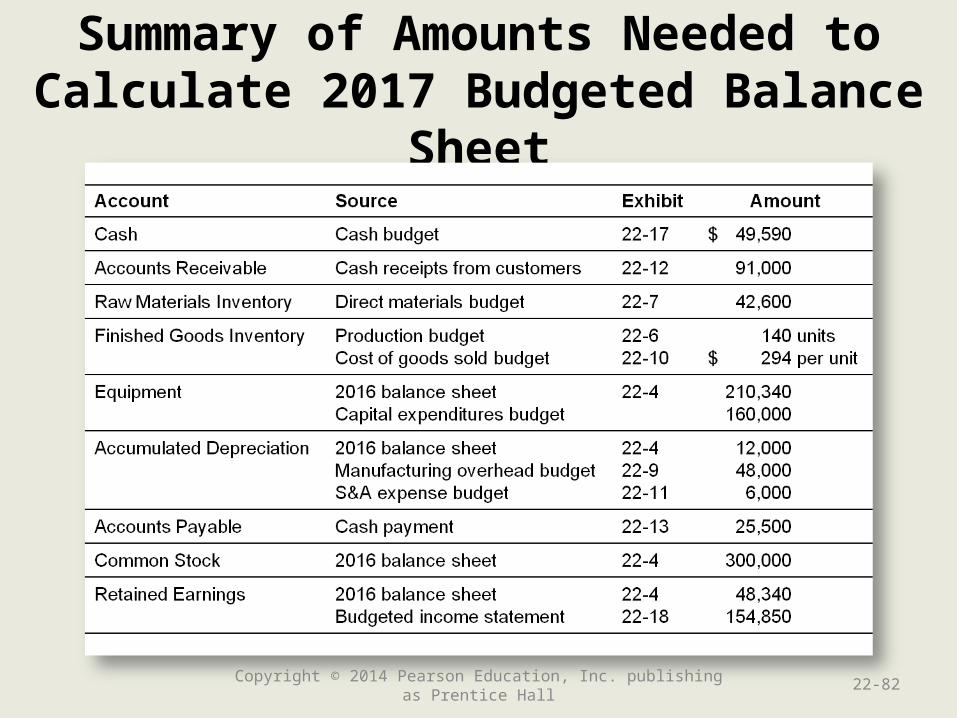
Summary of Amounts Needed to Calculate 2017 Budgeted Balance Sheet
Copyright © 2014 Pearson Education, Inc. publishing as Prentice Hall 22-82
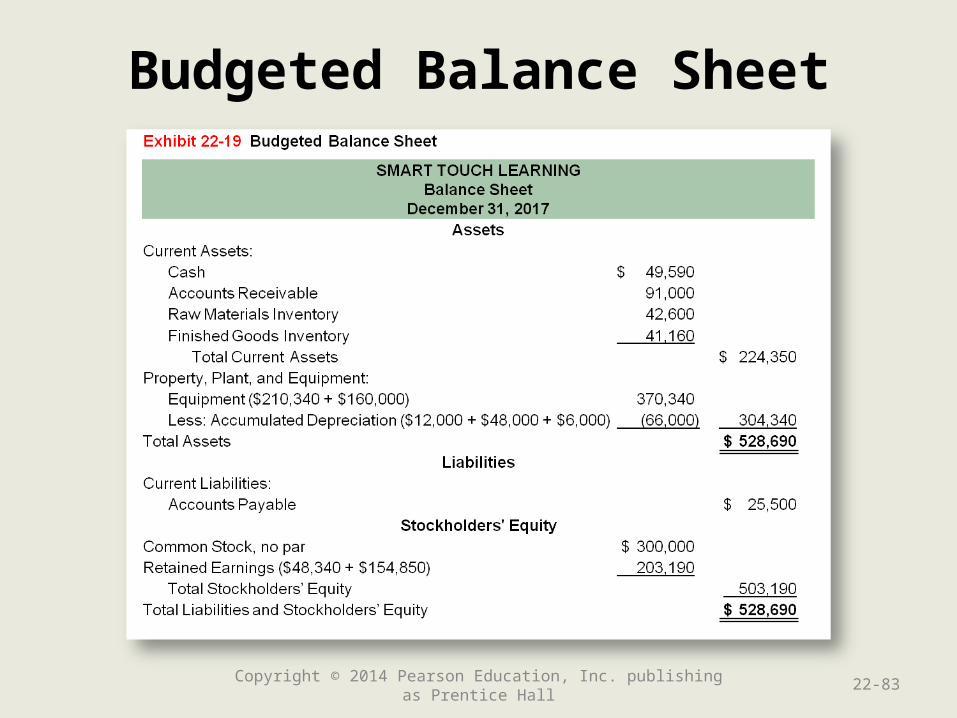
Budgeted Balance Sheet
Copyright © 2014 Pearson Education, Inc. publishing as Prentice Hall 22-83
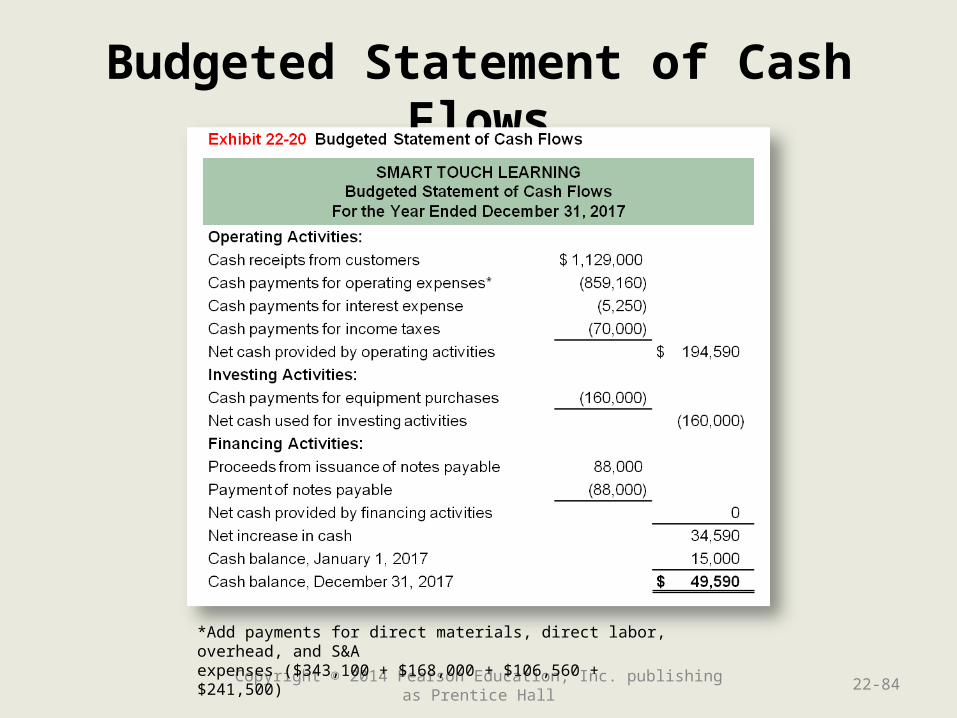
Budgeted Statement of Cash Flows
Copyright © 2014 Pearson Education, Inc. publishing as Prentice Hall 22-84
*Add payments for direct materials, direct labor, overhead, and S&Aexpenses ($343,100 + $168,000 + $106,560 + $241,500)
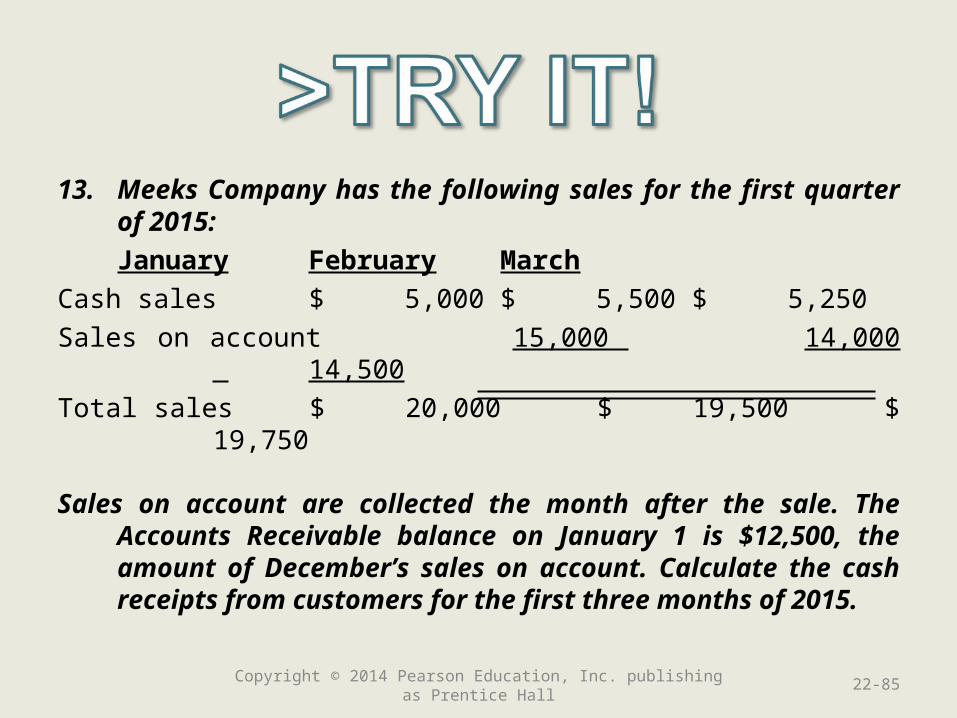
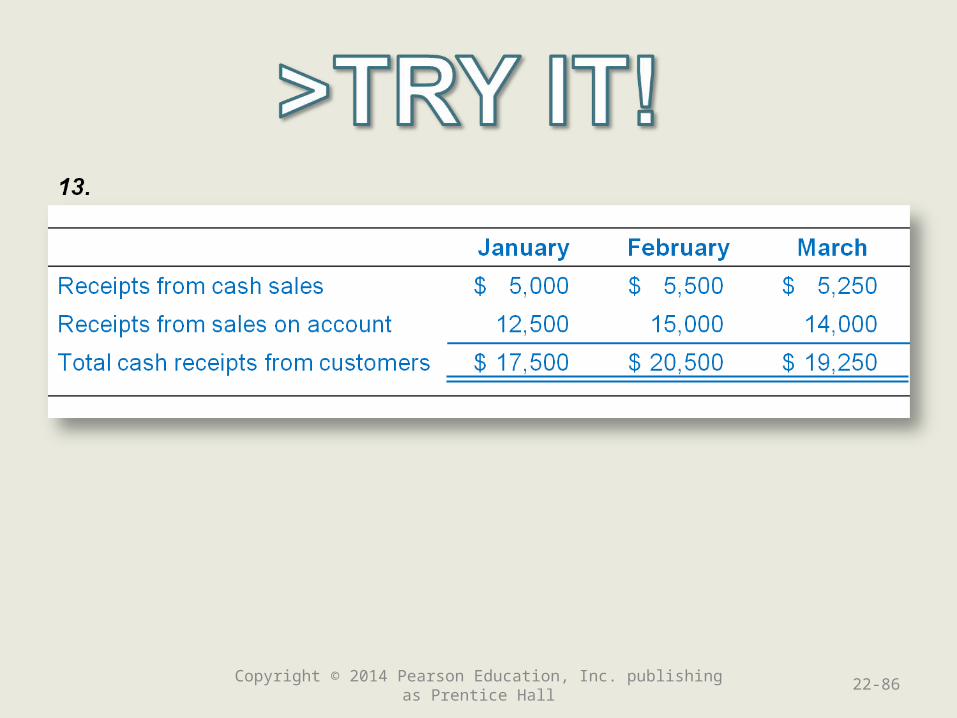
13. Meeks Company has the following sales for the first quarter of 2015:
January February March
Cash sales $ 5,000 $ 5,500 $ 5,250
Sales on account 15,000 14,000 14,500
Total sales $ 20,000 $ 19,500 $ 19,750
Sales on account are collected the month after the sale. The Accounts Receivable balance on January 1 is $12,500, the amount of December’s sales on account. Calculate the cash receipts from customers for the first three months of 2015.
Copyright © 2014 Pearson Education, Inc. publishing as Prentice Hall 22-85
Copyright © 2014 Pearson Education, Inc. publishing as Prentice Hall 22-86
Learning Objective 5
Describe how Describe how information technology information technology
can be used in the can be used in the budgeting processbudgeting process
22-87Copyright © 2014 Pearson Education, Inc. publishing as Prentice Hall
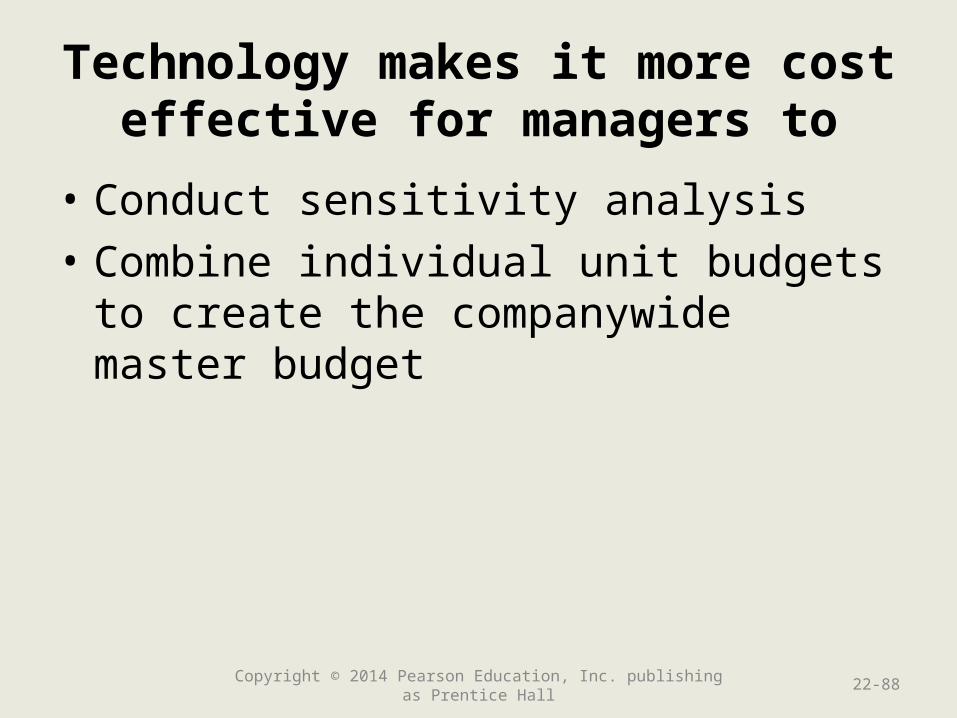
Technology makes it more cost effective for managers to
• Conduct sensitivity analysis
• Combine individual unit budgets to create the companywide master budget
Copyright © 2014 Pearson Education, Inc. publishing as Prentice Hall 22-88
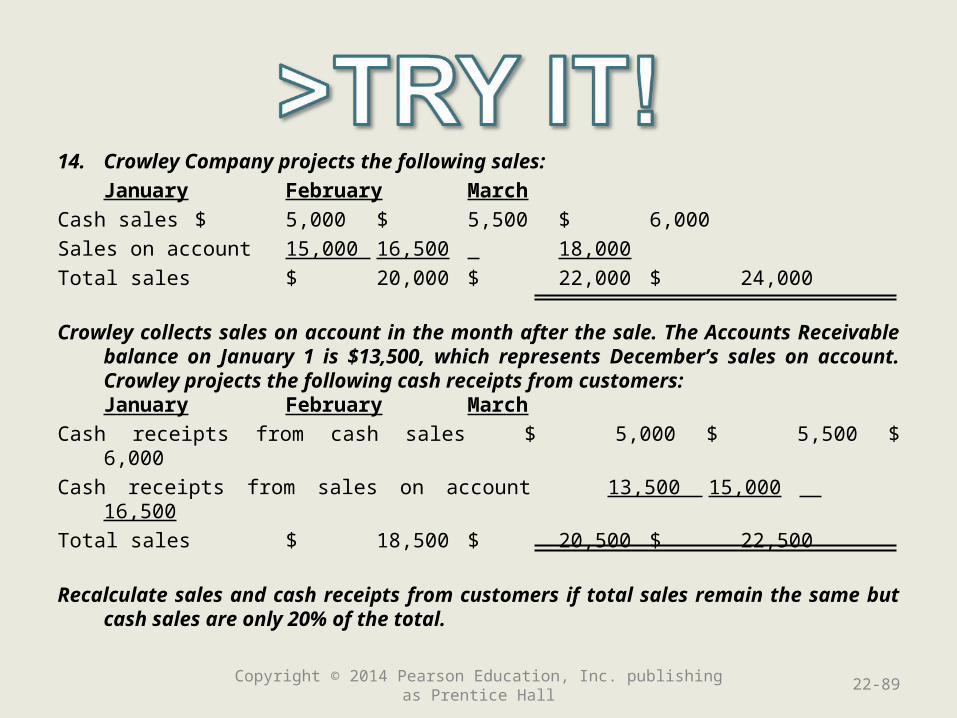
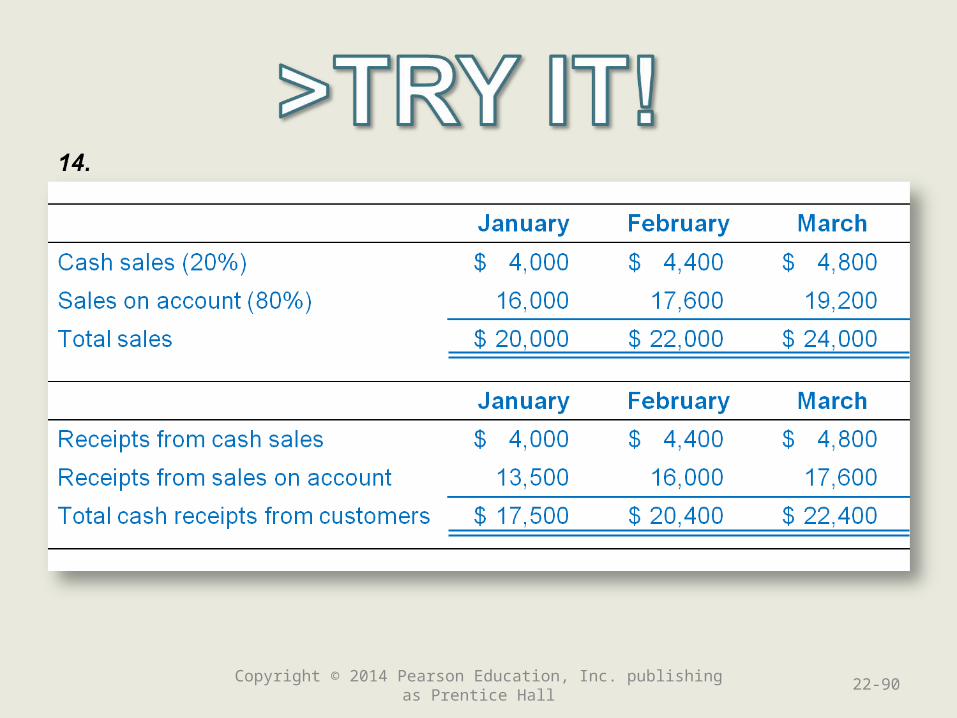
14. Crowley Company projects the following sales:
January February March
Cash sales $ 5,000 $ 5,500 $ 6,000
Sales on account 15,000 16,500 18,000
Total sales $ 20,000 $ 22,000 $ 24,000
Crowley collects sales on account in the month after the sale. The Accounts Receivable balance on January 1 is $13,500, which represents December’s sales on account. Crowley projects the following cash receipts from customers:January February March
Cash receipts from cash sales $ 5,000 $ 5,500 $6,000
Cash receipts from sales on account 13,500 15,000 16,500
Total sales $ 18,500 $ 20,500 $ 22,500
Recalculate sales and cash receipts from customers if total sales remain the same but cash sales are only 20% of the total.
Copyright © 2014 Pearson Education, Inc. publishing as Prentice Hall 22-89
Copyright © 2014 Pearson Education, Inc. publishing as Prentice Hall 22-90
Learning Objective 6
Prepare an operating Prepare an operating budget for a budget for a
merchandising merchandising companycompany
(Appendix 22A)(Appendix 22A)
22-91Copyright © 2014 Pearson Education, Inc. publishing as Prentice Hall
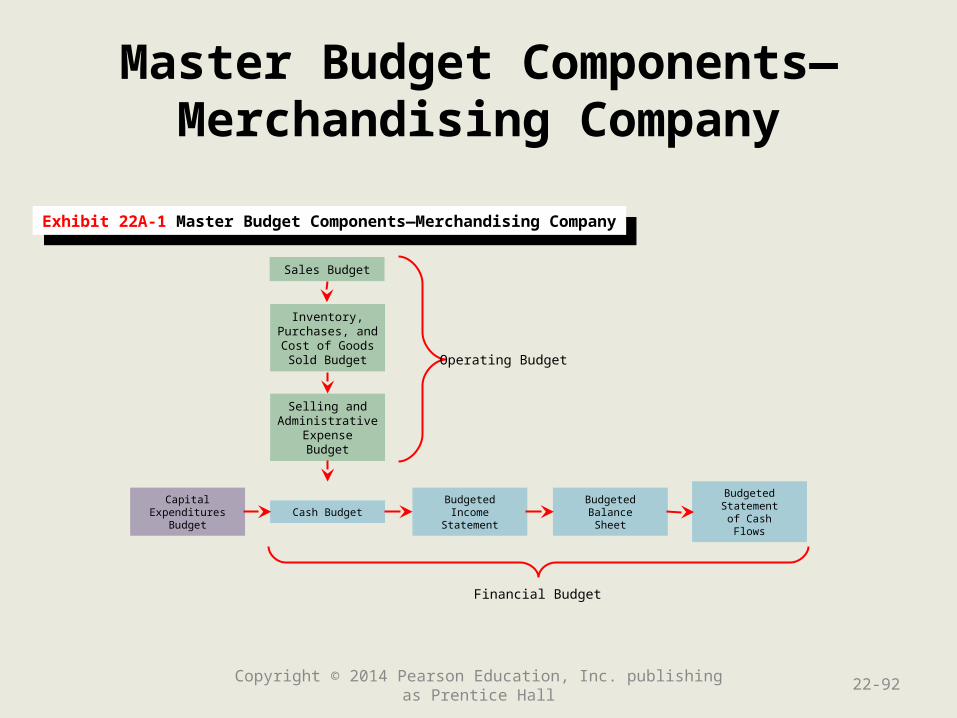
Master Budget Components—Merchandising Company
Copyright © 2014 Pearson Education, Inc. publishing as Prentice Hall 22-92
Exhibit 22A-1 Master Budget Components—Merchandising CompanyExhibit 22A-1 Master Budget Components—Merchandising Company
Sales Budget
Inventory,Purchases, andCost of GoodsSold Budget
Selling andAdministrative
ExpenseBudget
Cash BudgetBudgetedIncome
Statement
BudgetedBalanceSheet
BudgetedStatement
of CashFlows
CapitalExpenditures
Budget
Operating Budget
Financial Budget
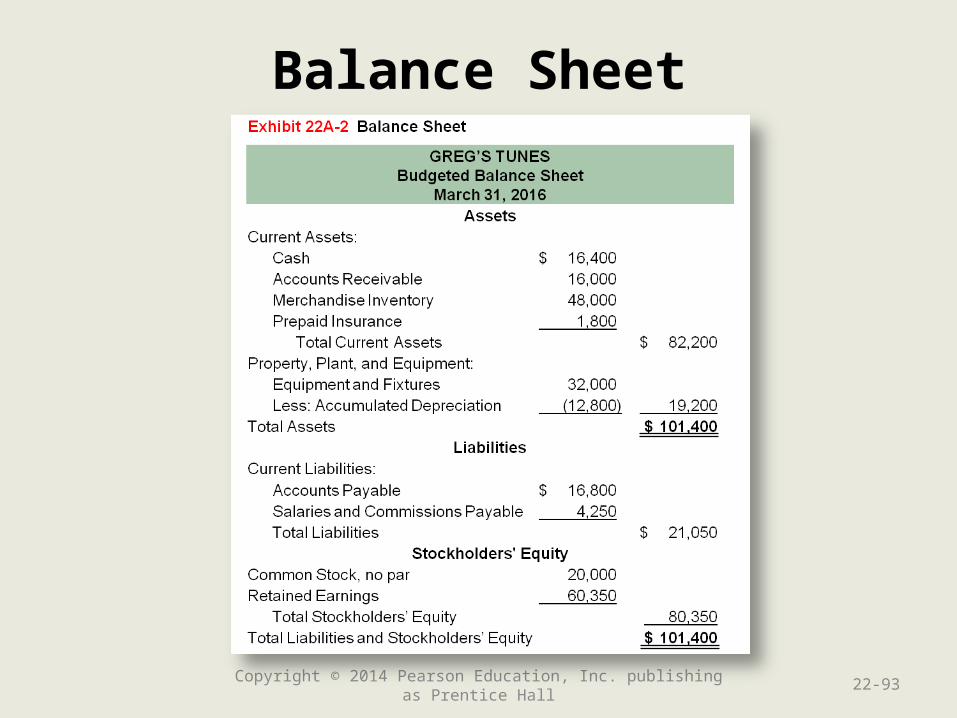
Balance Sheet
Copyright © 2014 Pearson Education, Inc. publishing as Prentice Hall 22-93
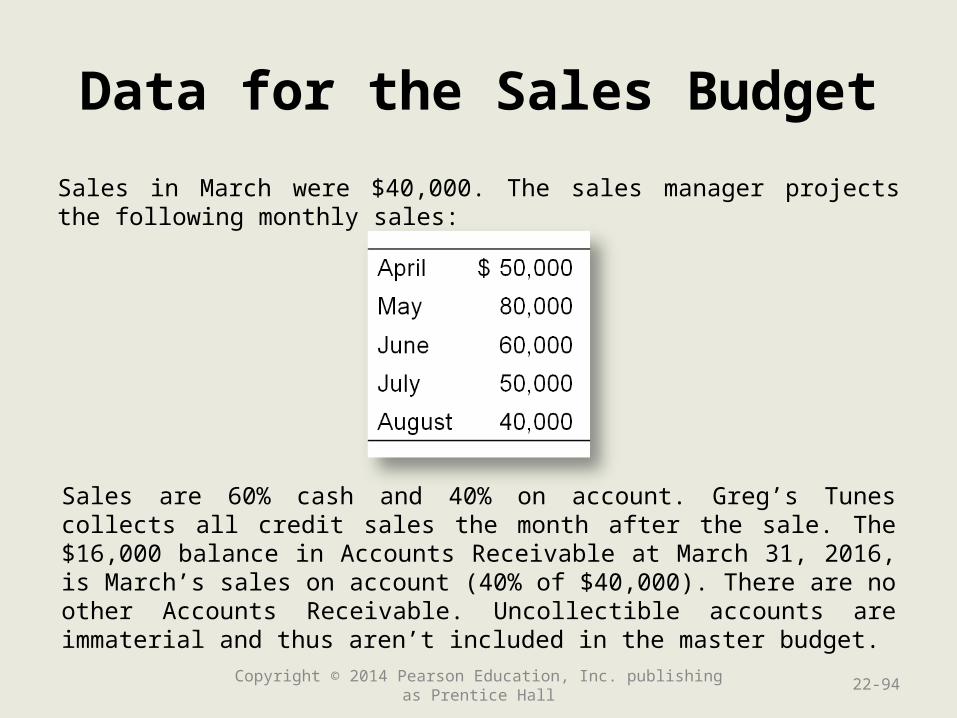
Data for the Sales Budget
Copyright © 2014 Pearson Education, Inc. publishing as Prentice Hall 22-94
Sales in March were $40,000. The sales manager projects the following monthly sales:
Sales are 60% cash and 40% on account. Greg’s Tunes collects all credit sales the month after the sale. The $16,000 balance in Accounts Receivable at March 31, 2016, is March’s sales on account (40% of $40,000). There are no other Accounts Receivable. Uncollectible accounts are immaterial and thus aren’t included in the master budget.
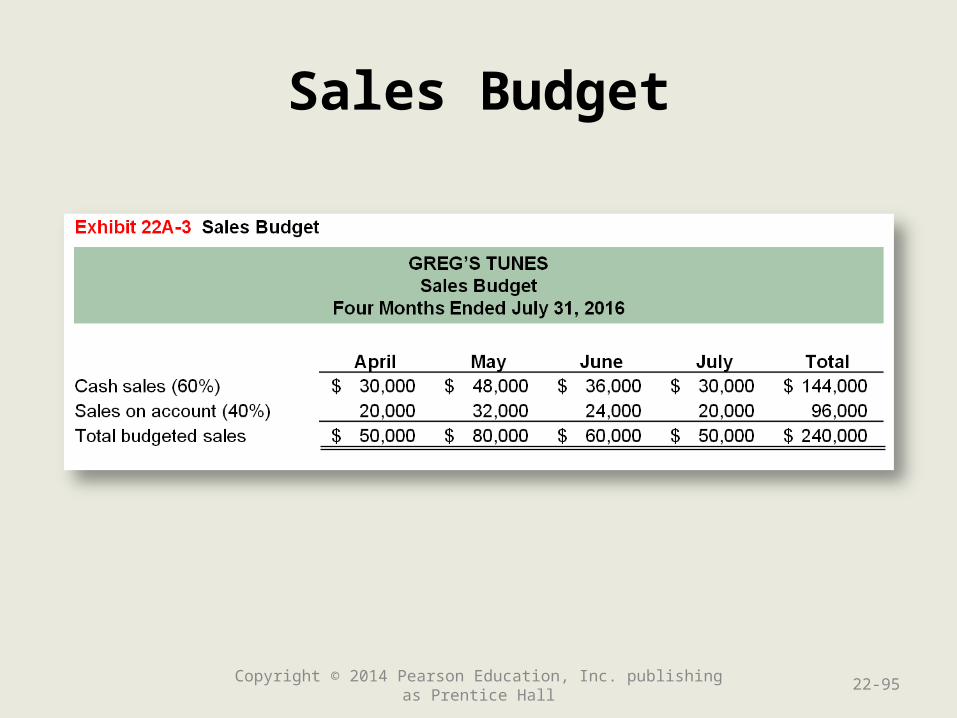
Sales Budget
Copyright © 2014 Pearson Education, Inc. publishing as Prentice Hall 22-95
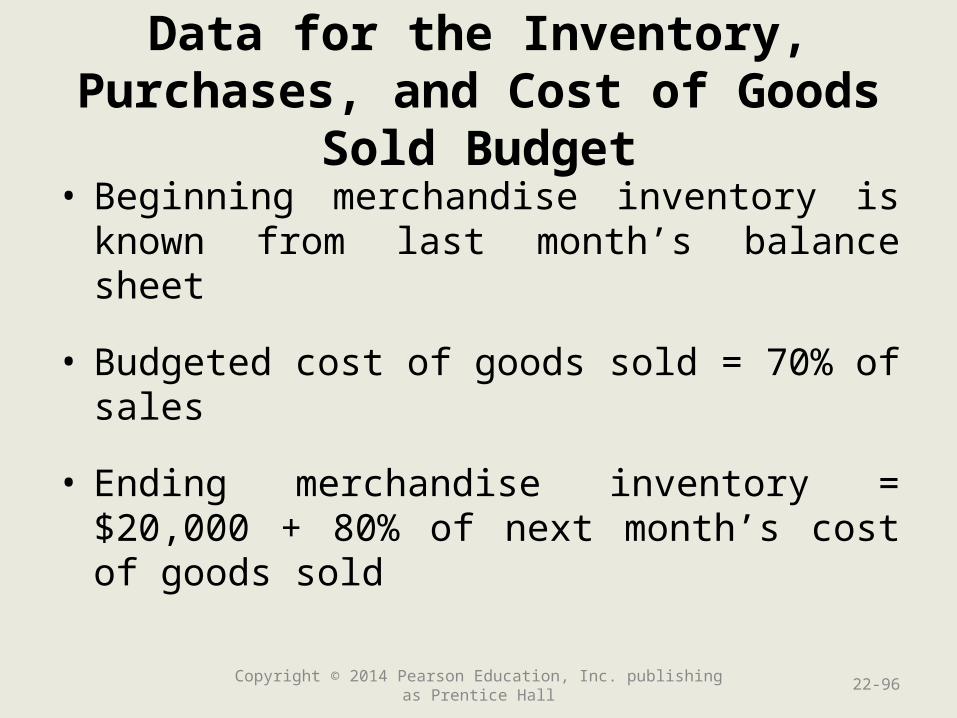
Data for the Inventory, Purchases, and Cost of Goods Sold Budget
• Beginning merchandise inventory is known from last month’s balance sheet
• Budgeted cost of goods sold = 70% of sales
• Ending merchandise inventory = $20,000 + 80% of next month’s cost of goods sold
Copyright © 2014 Pearson Education, Inc. publishing as Prentice Hall 22-96
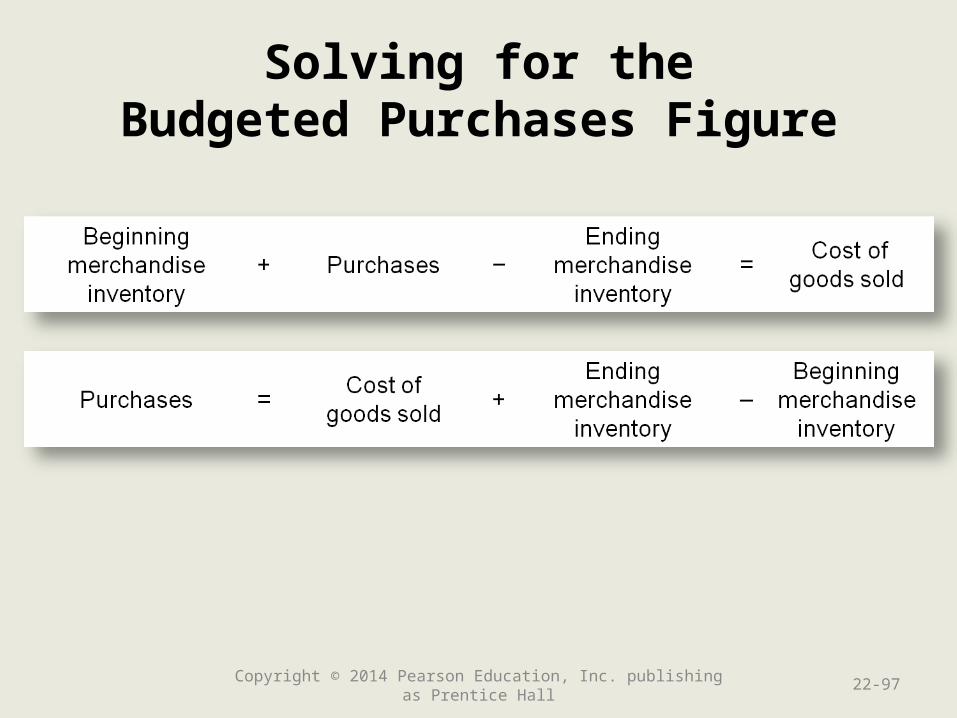
Solving for theBudgeted Purchases Figure
Copyright © 2014 Pearson Education, Inc. publishing as Prentice Hall 22-97
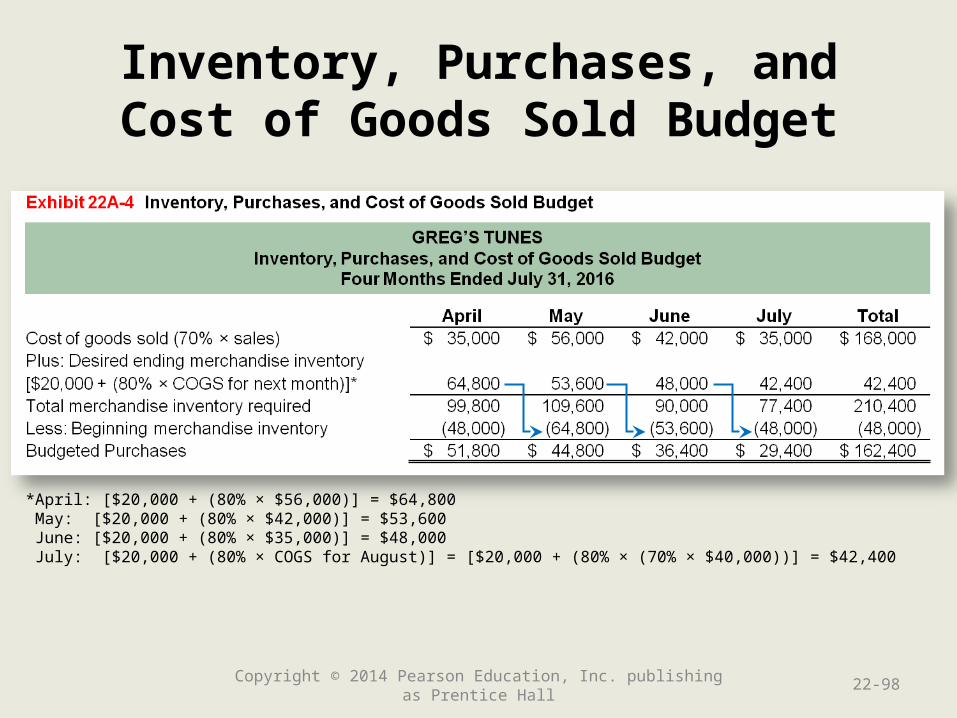
Inventory, Purchases, andCost of Goods Sold Budget
Copyright © 2014 Pearson Education, Inc. publishing as Prentice Hall 22-98
*April: [$20,000 + (80% × $56,000)] = $64,800 May: [$20,000 + (80% × $42,000)] = $53,600 June: [$20,000 + (80% × $35,000)] = $48,000 July: [$20,000 + (80% × COGS for August)] = [$20,000 + (80% × (70% × $40,000))] = $42,400
Data for the Selling andAdministrative Expense Budget
Copyright © 2014 Pearson Education, Inc. publishing as Prentice Hall 22-99
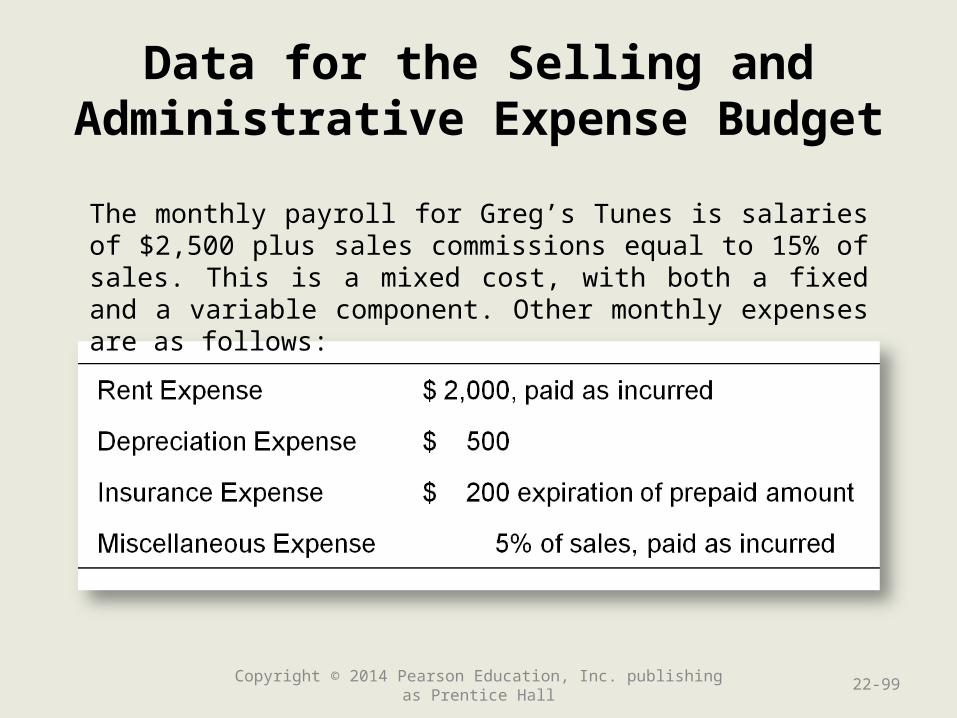
The monthly payroll for Greg’s Tunes is salaries of $2,500 plus sales commissions equal to 15% of sales. This is a mixed cost, with both a fixed and a variable component. Other monthly expenses are as follows:
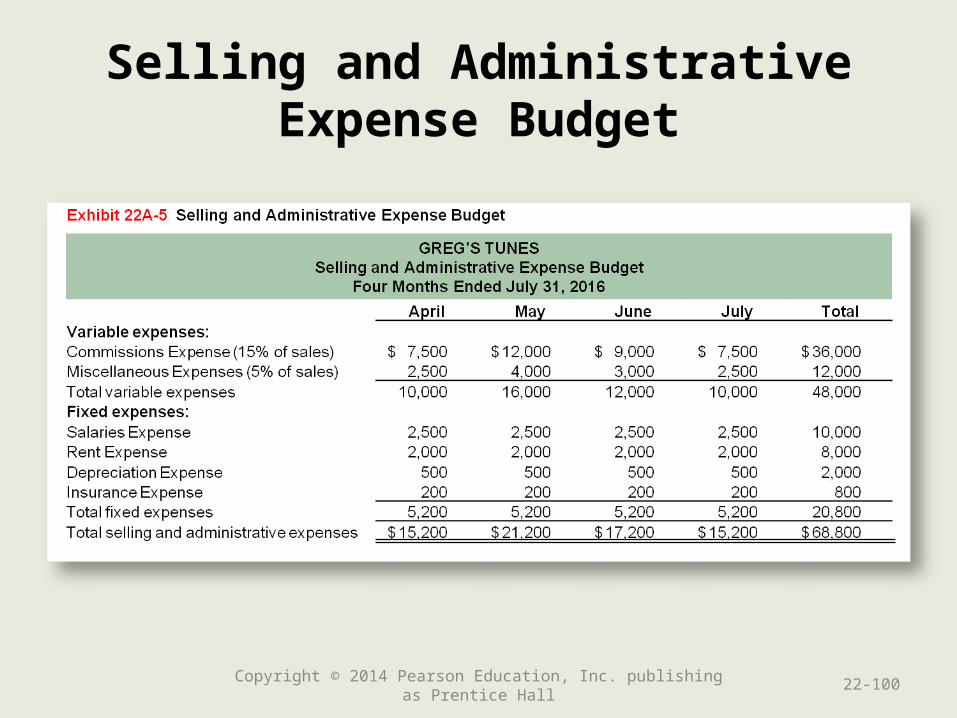
Selling and AdministrativeExpense Budget
Copyright © 2014 Pearson Education, Inc. publishing as Prentice Hall 22-100

15. Camp Company is a sporting goods store. The company sells a tent that sleeps six people. The store expects to sell 250 tents in 2014 and 280 tents in 2015. At the beginning of 2014, Camp Company has 25 tents in Merchandise Inventory and desires to have 5% of the next year’s sales available at the end of the year. How many tents will Camp Company need to purchase in 2014?
Copyright © 2014 Pearson Education, Inc. publishing as Prentice Hall 22-101
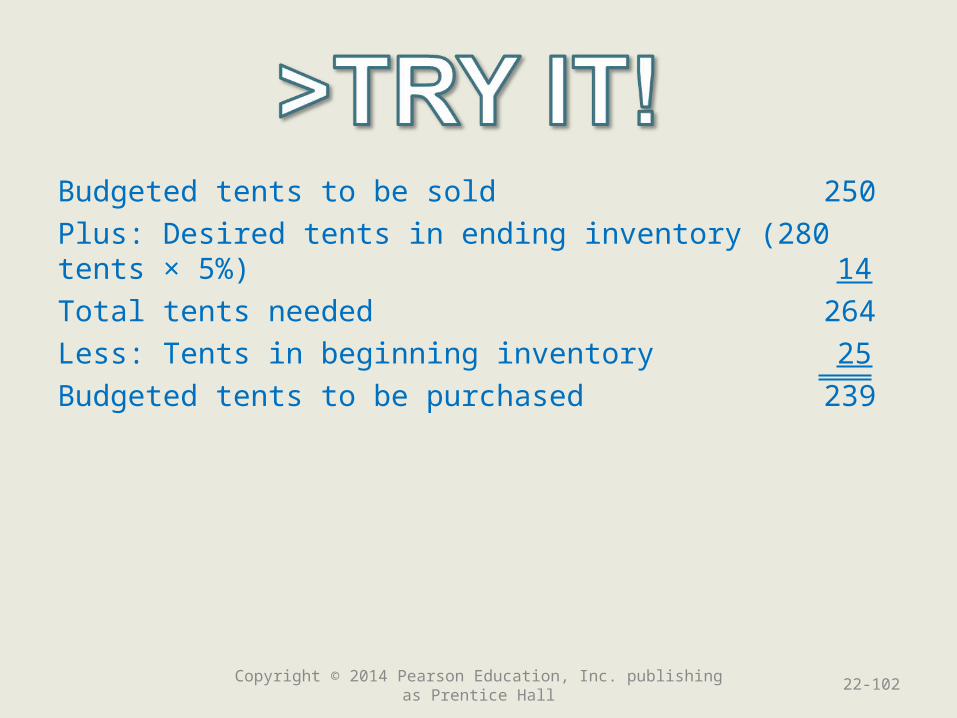
Budgeted tents to be sold 250
Plus: Desired tents in ending inventory (280 tents × 5%) 14
Total tents needed 264
Less: Tents in beginning inventory 25
Budgeted tents to be purchased 239
Copyright © 2014 Pearson Education, Inc. publishing as Prentice Hall 22-102
Learning Objective 7
Prepare a financial Prepare a financial budget for a budget for a
merchandising merchandising companycompany
(Appendix 22A)(Appendix 22A)
22-103Copyright © 2014 Pearson Education, Inc. publishing as Prentice Hall
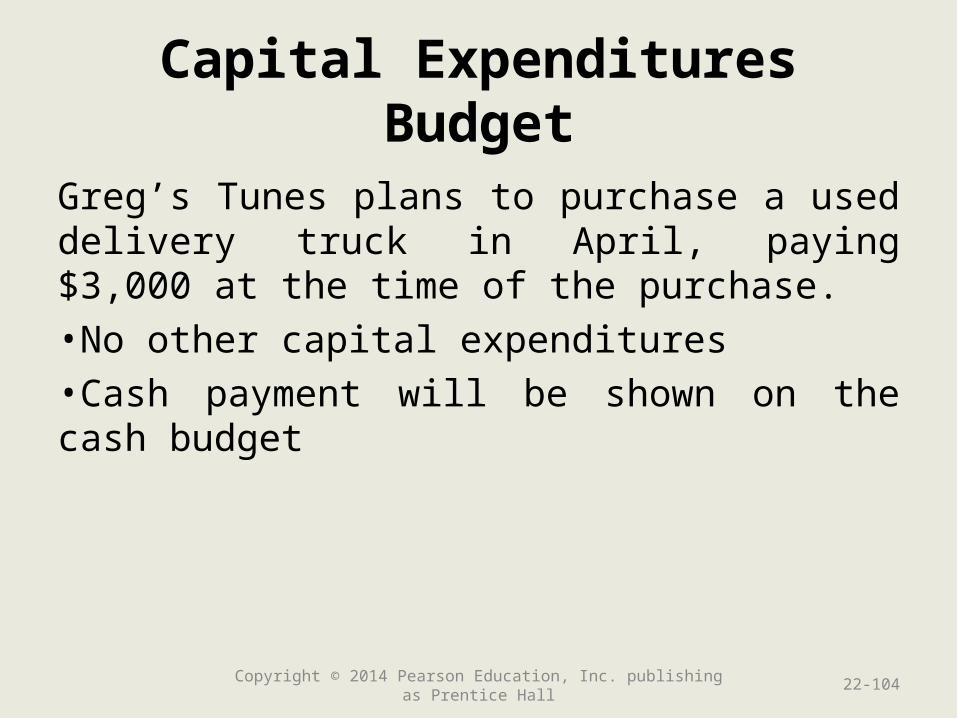
Capital Expenditures Budget
Greg’s Tunes plans to purchase a used delivery truck in April, paying $3,000 at the time of the purchase. •No other capital expenditures•Cash payment will be shown on the cash budget
Copyright © 2014 Pearson Education, Inc. publishing as Prentice Hall 22-104
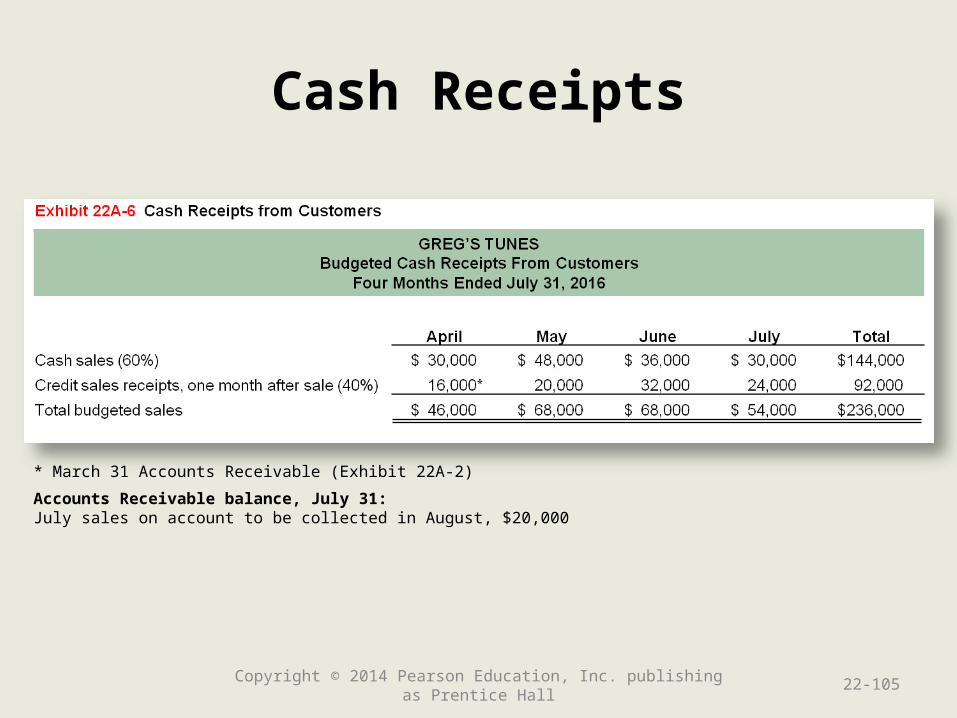
Cash Receipts
Copyright © 2014 Pearson Education, Inc. publishing as Prentice Hall 22-105
* March 31 Accounts Receivable (Exhibit 22A-2)
Accounts Receivable balance, July 31:July sales on account to be collected in August, $20,000
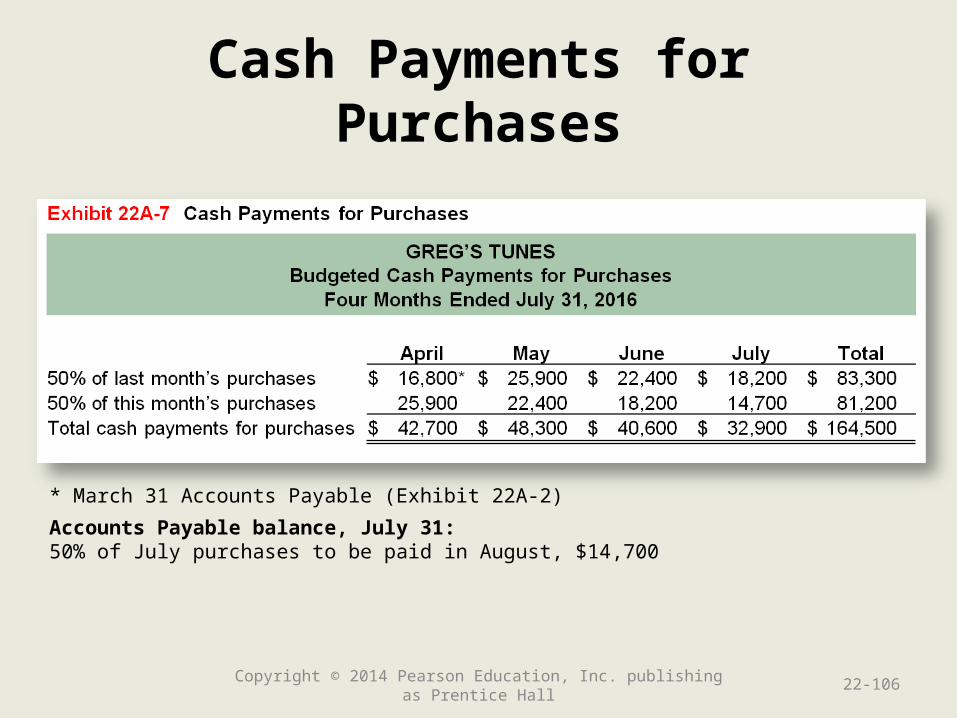
Cash Payments for Purchases
Copyright © 2014 Pearson Education, Inc. publishing as Prentice Hall 22-106
* March 31 Accounts Payable (Exhibit 22A-2)
Accounts Payable balance, July 31:50% of July purchases to be paid in August, $14,700
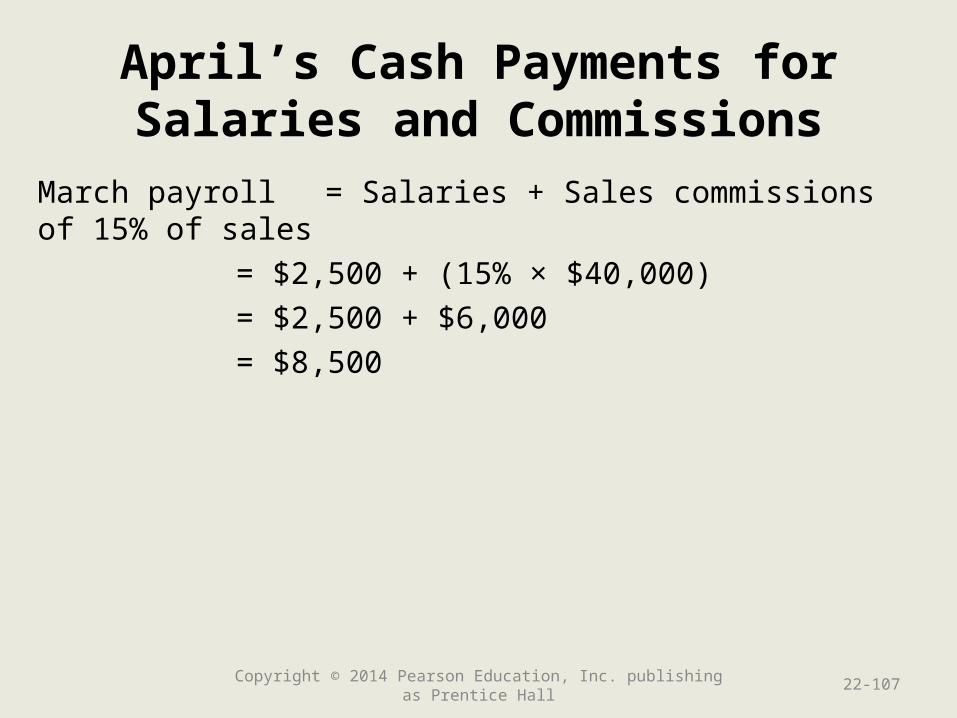
April’s Cash Payments forSalaries and Commissions
March payroll = Salaries + Sales commissions of 15% of sales
= $2,500 + (15% × $40,000)
= $2,500 + $6,000
= $8,500
Copyright © 2014 Pearson Education, Inc. publishing as Prentice Hall 22-107
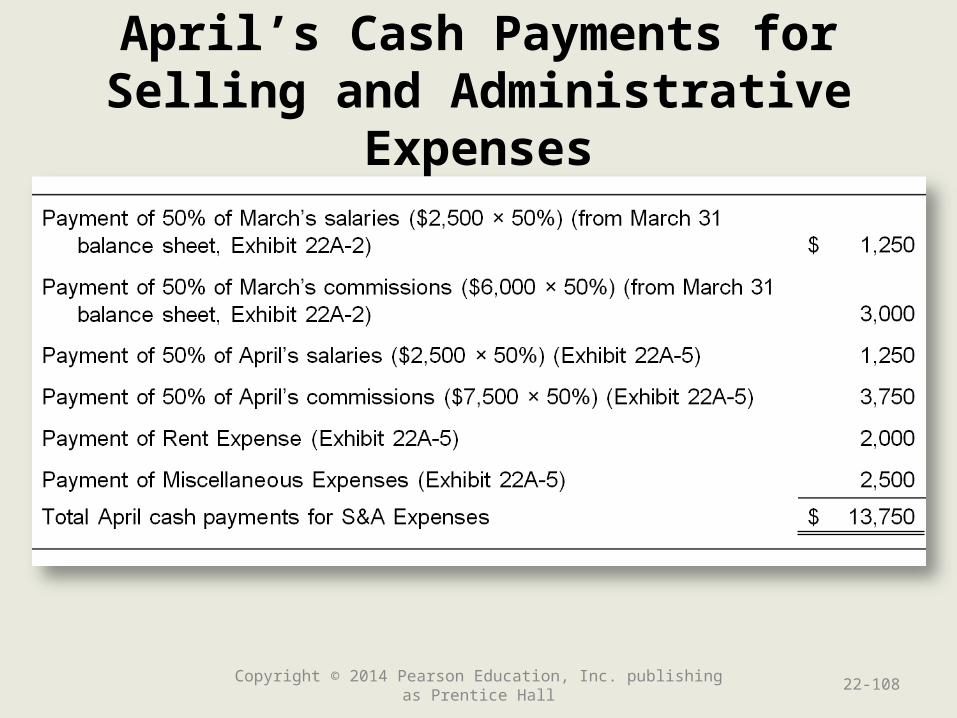
April’s Cash Payments for Selling and Administrative Expenses
Copyright © 2014 Pearson Education, Inc. publishing as Prentice Hall 22-108
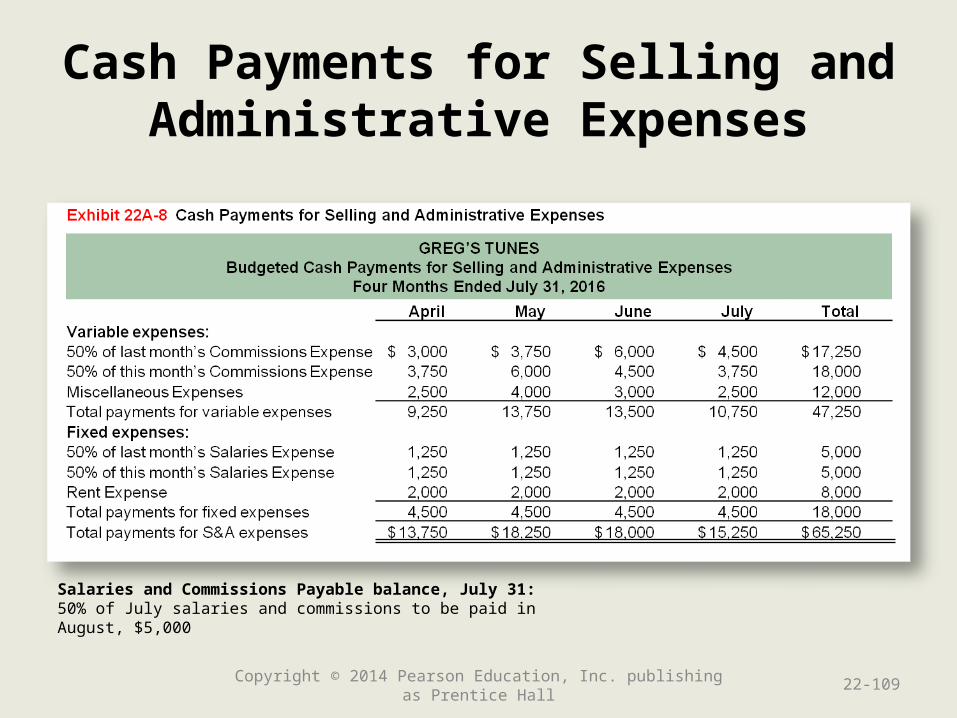
Cash Payments for Selling and Administrative Expenses
Copyright © 2014 Pearson Education, Inc. publishing as Prentice Hall 22-109
Salaries and Commissions Payable balance, July 31:50% of July salaries and commissions to be paid in August, $5,000
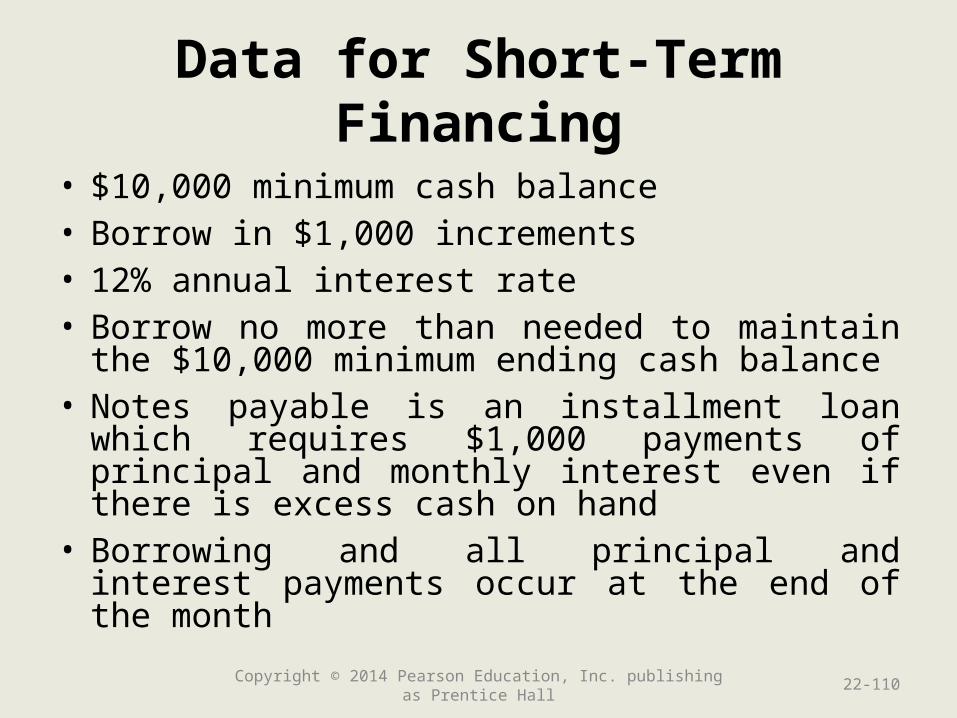
Data for Short-Term Financing
• $10,000 minimum cash balance• Borrow in $1,000 increments • 12% annual interest rate• Borrow no more than needed to maintain the
$10,000 minimum ending cash balance• Notes payable is an installment loan which
requires $1,000 payments of principal and monthly interest even if there is excess cash on hand
• Borrowing and all principal and interest payments occur at the end of the month
Copyright © 2014 Pearson Education, Inc. publishing as Prentice Hall 22-110
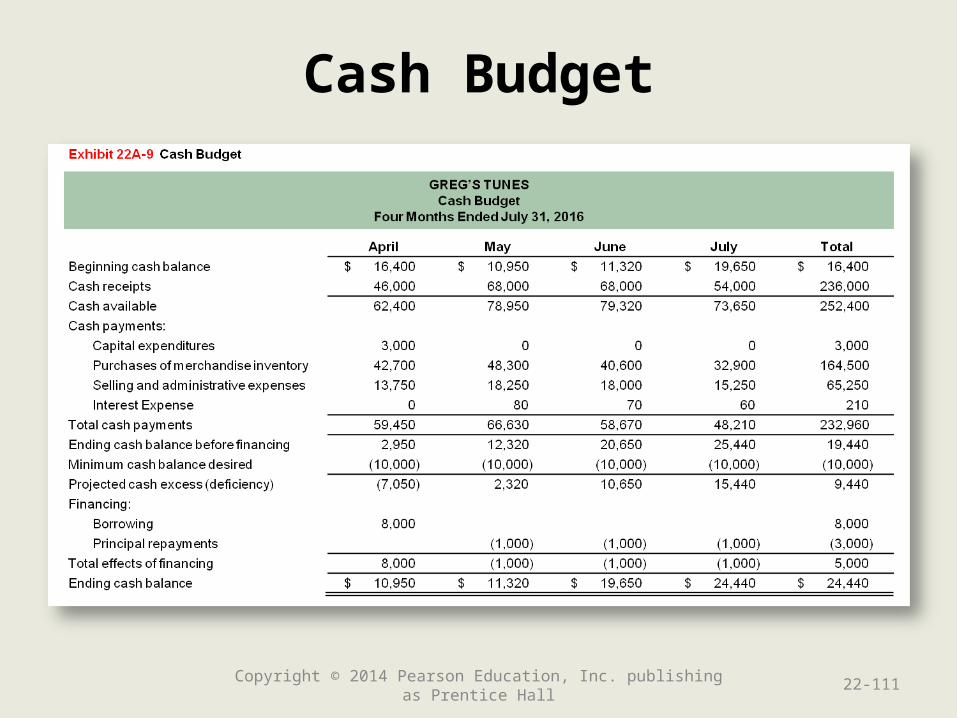
Cash Budget
Copyright © 2014 Pearson Education, Inc. publishing as Prentice Hall 22-111
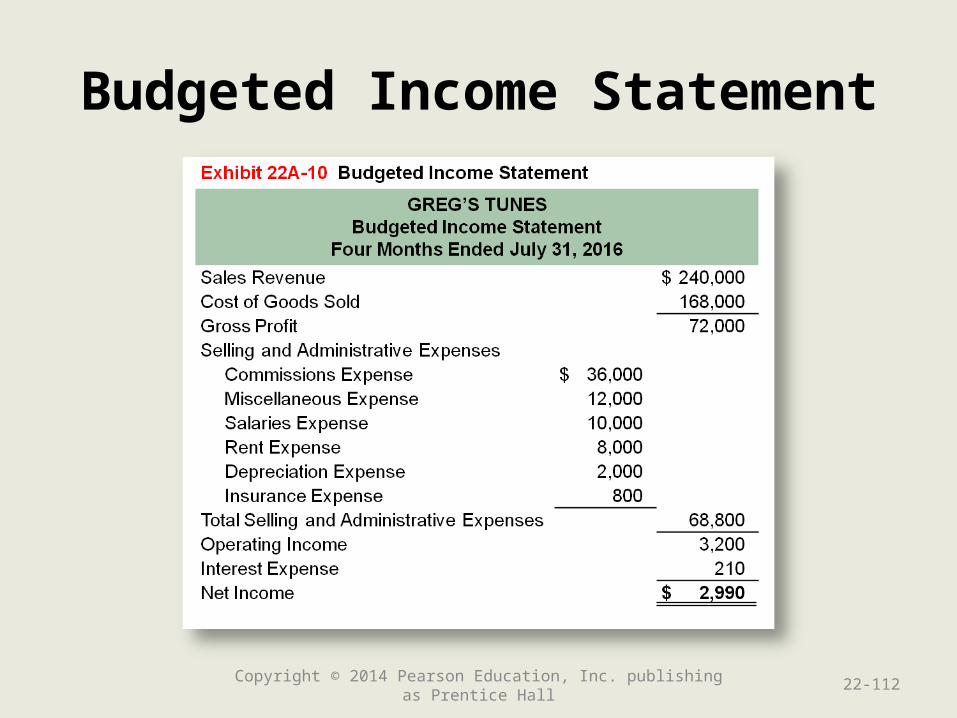
Budgeted Income Statement
Copyright © 2014 Pearson Education, Inc. publishing as Prentice Hall 22-112
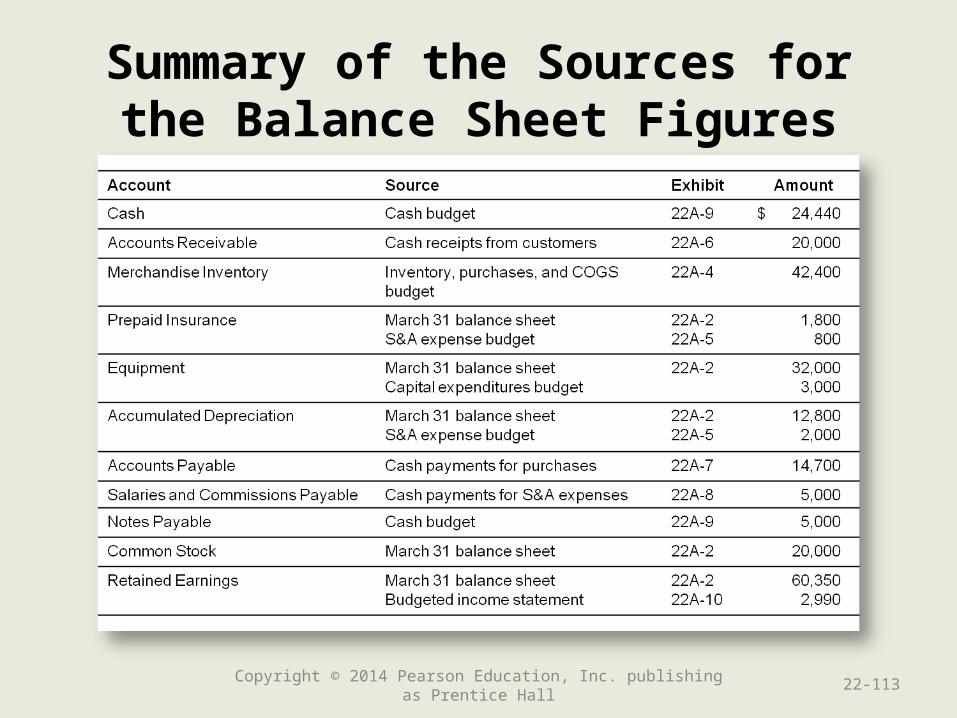
Summary of the Sources forthe Balance Sheet Figures
Copyright © 2014 Pearson Education, Inc. publishing as Prentice Hall 22-113
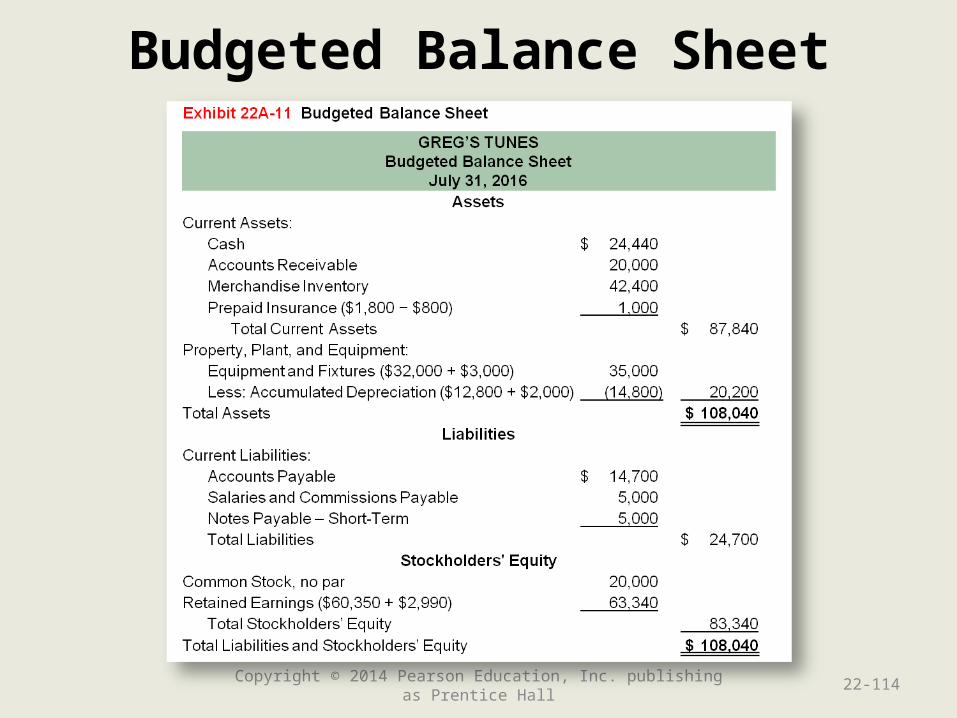
Budgeted Balance Sheet
Copyright © 2014 Pearson Education, Inc. publishing as Prentice Hall 22-114
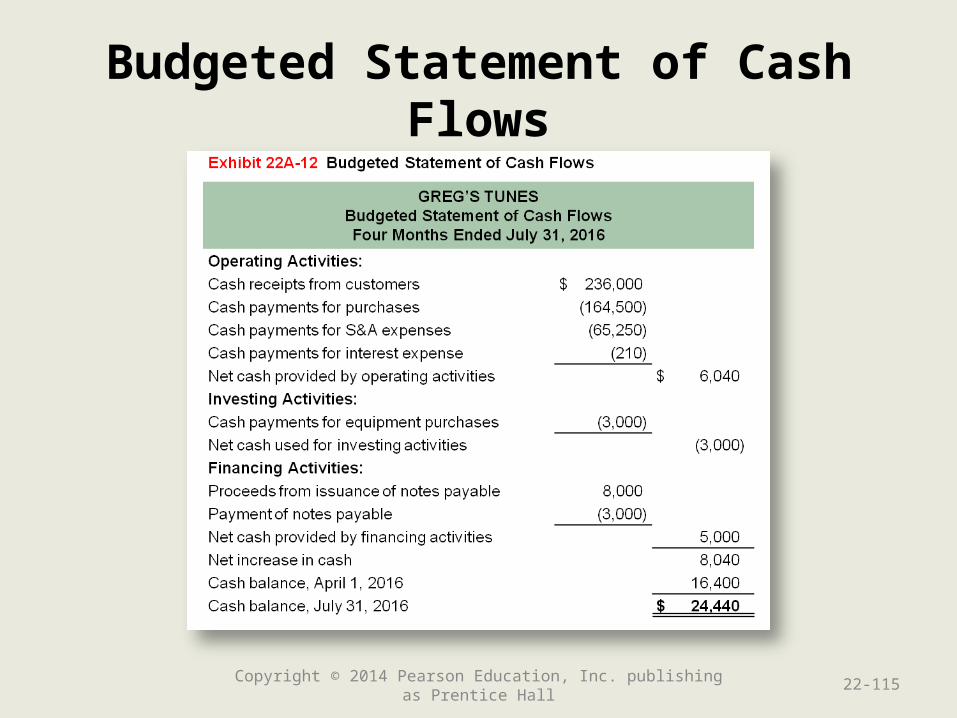
Budgeted Statement of Cash Flows
Copyright © 2014 Pearson Education, Inc. publishing as Prentice Hall 22-115
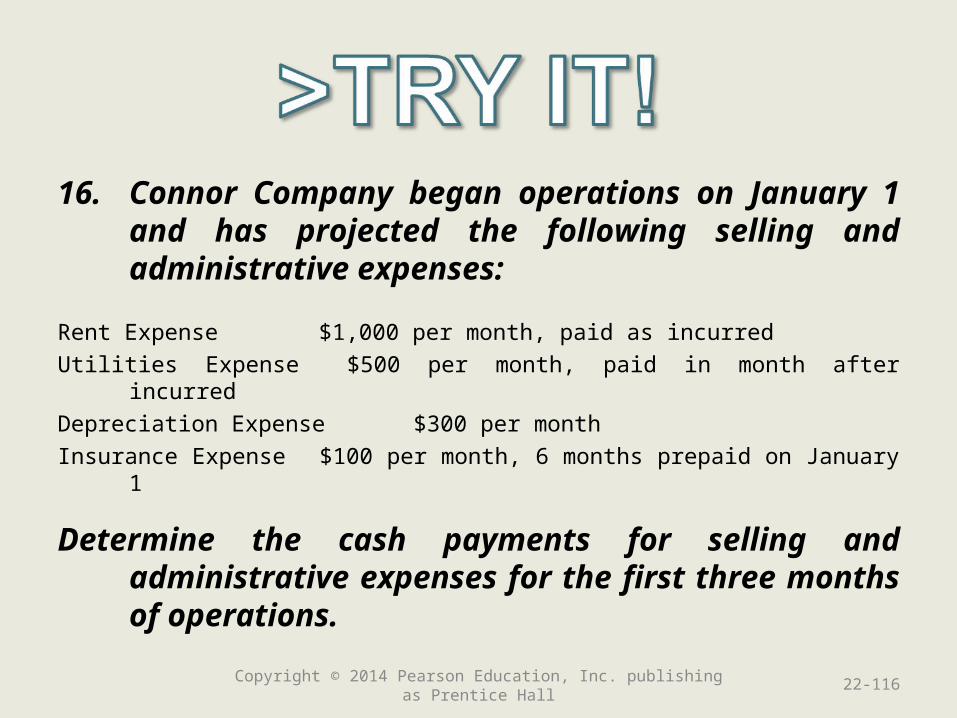
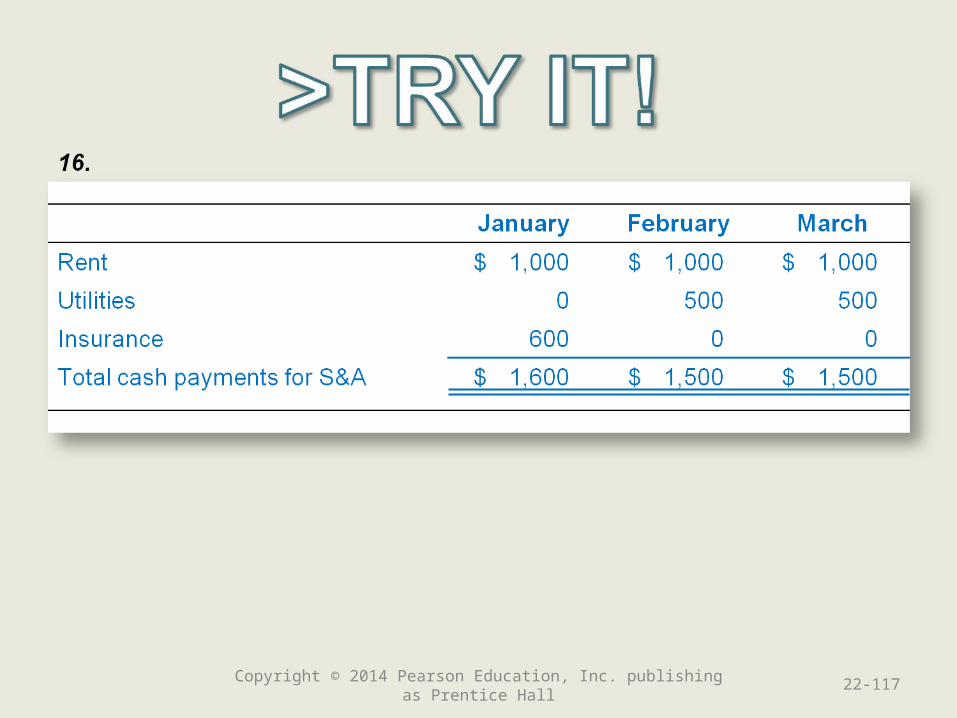
16. Connor Company began operations on January 1 and has projected the following selling and administrative expenses:
Rent Expense $1,000 per month, paid as incurred
Utilities Expense $500 per month, paid in month after incurred
Depreciation Expense $300 per month
Insurance Expense $100 per month, 6 months prepaid on January 1
Determine the cash payments for selling and administrative expenses for the first three months of operations.
Copyright © 2014 Pearson Education, Inc. publishing as Prentice Hall 22-116
Copyright © 2014 Pearson Education, Inc. publishing as Prentice Hall 22-117
End of Chapter 22
22-118Copyright © 2014 Pearson Education, Inc. publishing as Prentice Hall