access to healthful foods among an urban food insecure population: perceptions versus reality
TRANSCRIPT
Journal of Urban Health: Bulletin of the New York Academy of Medicine, Vol. 86, No. 6doi:10.1007/s11524-009-9408-x* 2009 The New York Academy of Medicine
Access to Healthful Foods among an UrbanFood Insecure Population: Perceptionsversus Reality
Darcy A. Freedman and Bethany A. Bell
ABSTRACT The influence of local food environments on the risk for obesity is importantoverall, but may be particularly important for food insecure populations in urbansettings. Access to healthful foods is most limited among racial and ethnic minoritiesand low-income populations; these same populations experience the highest rates ofobesity and food insecurity. Few valid and reliable measures have been developed toassess the quality of local food environments. This research addresses this gap byintroducing an inventory for measuring self-reported perceptions of food access andthen compares the perceptionsmeasure to objective assessments of local food environments.Data are focused on an urban population experiencing disproportionate rates of foodinsecurity. The four-item perceptions of food access inventory had high internal consistency(Cronbach’s alpha=0.80). Participants’ perceptions of access to healthful foods mirroredthe reality of their food environment; however, perceptions of access to alcohol and tobaccowere less accurate. Findings suggest that people living in low-income, urban, minority, andfood insecure communities can validly assess (in)access to healthful foods. Future research isneeded to further validate the perceptions of food access measure introduced and, moreimportantly, to develop strategies for increasing access to healthful foods in food insecurecontexts.
KEYWORDS Food security, Food access, Local food environment, Perceptions of foodaccess, Urban, Social determinants of health
INTRODUCTION
Concerned by the fact that over two thirds of Americans are overweight or obese,1
researchers and practitioners are beginning to acknowledge that health promotionand obesity prevention efforts focused on individual change alone are “ineffectual”over time because they do not take into account the contexts in which healthbehaviors and decisions are made.2 The obesity epidemic has, in turn, widened theaims of prevention research to include the influence of local food environments onhealth outcomes.
The influence of local food environments on risk for obesity is importantoverall, but may be particularly important for food insecure populations. That is,populations experiencing periods of time when they are “uncertain of having, orunable to acquire, enough food for all household members because they hadinsufficient money and other resources for food.”3 Approximately one in ten
Freedman is with the College of Social Work, University of South Carolina, Columbia, SC, USA; Bell iswith the College of Education, University of South Carolina, Columbia, SC 29208, USA.
Correspondence: Darcy A. Freedman, University of South Carolina, DeSaussure Hall, Columbia, SC29208, USA. (E-mail: [email protected])
825
households in the United States is food insecure, a trend that has remained consistentsince 1995.4 Food insecurity rates are higher than the national average forhouseholds with incomes below the federal poverty line (37.7% were food insecurein 2007), households with children headed by single women (30.2%), and Black(22.2%) and Hispanic households (20.1%).5 Paradoxically, for both adults andchildren, food insecurity (i.e., hunger) is associated with increased risk for obesity.6, 7
BACKGROUND
Disparities in Local Food EnvironmentsA growing body of evidence suggests that local food environments in the US differbased on the racial and economic composition of a community.8 Stores selling awide variety of food items such as chain supermarkets tend to be located in areasthat are predominantly populated by Whites and by people representing middle orhigh levels of income (i.e., populations with low levels of food insecurity), whereasconvenience stores and smaller, nonchain grocery stores are more prevalent incommunities predominantly populated by racial minorities and people living inpoverty (i.e., populations with high levels of food insecurity).9–14 In short, an inverserelationship exists between community access to chain supermarkets and rates offood insecurity.
The types of foods sold inside food stores also differ by social context. A marketbasket survey that examined the costs of several basic grocery items found thatnonchain grocery stores, which are most common in low-income and racial andethnic minority communities, were much less likely to sell “healthier” foodalternatives (e.g., whole wheat bread, skinless chicken) compared to chain super-markets.2 Nonchain food stores including convenience and small and midsizedgrocery stores are up to two times less likely to sell all varieties of fresh fruits andvegetables compared to chain supermarkets.10 Moreover, foods sold in convenience ornonchain grocery stores are typically more expensive (i.e., have a higher price tag)than the same product in a chain supermarket.10
These data suggest that populations living in low-income and racial and ethnicminority communities, contexts in which food insecurity is most prevalent, mayhave difficulty adhering to obesity prevention efforts such as eating five or morefruits and vegetables per day because these healthful food options are inaccessible.Understanding the person–environment interaction in areas with limited or noaccess to healthful foods is particularly important as public health efforts aredeveloped to address obesity and food insecurity among disparate populations.
Perceptions of Healthful Food AccessOne of the challenges of research focused on the relationship between local foodenvironments and health outcomes is the dearth of valid and reliable measures forassessing food context.15,16 The most common method for assessing local foodenvironments involves a process of counting food stores and then geographicallyanchoring the stores in space using geographic information system (GIS) software;this method typically involves food store identification through existing commercialdatabases and address books.17–20 Limitations related to this method include therisk of misidentification of food stores in the commercial database, store closurebetween the creation of the data source and mapping, and GIS mapping errors.Observational approaches represent another method for examining local food
FREEDMAN AND BELL826
environments. Observations are used to both “ground truth” existing commercialdatabases and assess the types and quality of foods sold inside the stores.2,21–24 Bothof these methods provide an assessment of physical access to food stores byhighlighting whether or not a food store is present in a community. The presence ofa food store, however, does not necessarily translate into enhanced perceptions offood access, especially if the quality of the food in the store is less than ideal.24
Limited efforts have been made to assess perceptions of food access.15,25,26,27 Athree-item scale was developed by Moore and colleagues to assess perceivedavailability of healthy foods within a 1-mi radius (20-min walk) of participants’residence.15 Perceived availability of access to healthy foods was then compared toactual access to supermarkets and other smaller food stores identified throughInfoUSA®, a comprehensive commercial database of businesses in the US. Thisstudy found that participants living in areas of low supermarket density rated theirperceived availability of healthy foods 17% lower than those living in areas with thehighest densities of supermarkets.15 Perceived availability to healthy foods waslowest for non-Hispanic Black and low-income participants.15 Moreover, partic-ipants living in neighborhoods characterized as having low perceived levels ofavailability of healthy foods were 22% to 25% less likely to have a healthy dietcompared to those living in the highest-ranked neighborhoods.27 In an Australianstudy by Giskes and colleagues, perceptions of food price and availability, ratherthan actual (objective) measures of the local food environment, were significantlyassociated with food-purchasing patterns.26
RESEARCH QUESTIONS
The purpose of the present study was to extend existing research on physical accessto healthful foods in three ways. First, the methodology used to measure local foodenvironments was based on in-store observations rather than a computerizeddatabase of businesses. This allowed for the verification of all stores in the studycontext and for the assessment of foodstuffs sold inside each store. Second, anextended measure of perceptions of food access was developed based on qualitativefeedback from participants living in the target communities.24,28 This measure wasadministered in the present study. Finally, this research is grounded in theperspectives of an urban population disproportionately affected by food insecurity.
This study responds to a call by Lytle in her recent state of the science review oflocal food environment research by examining the complex intersection betweenindividuals and their environments.29 Using a mixed methods approach, thefollowing research questions were examined: (1) What types of food stores andfoodstuffs are available in a southeastern urban community experiencing high ratesof food insecurity?, (2) How do participants in this context rate their perceptions offood access?, and (3) How do perceptions of food access and the reality of foodstores relate to one another?
METHOD
Data were collected in 2008 at farmers’ markets that were developed as a part of amultiyear (2006–2008) study seeking to increase access to healthful foods in foodinsecure communities in Nashville, TN, USA. The farmers’ markets took place atBoys and Girls Clubs. Data presented in these analyses focus on three Boys and GirlsClub sites that are located adjacent to government-subsidized public housing
ACCESS TO HEALTHFUL FOODS AMONG AN URBAN FOOD INSECURE POPULATION 827
projects. The median annual household income in the census tracts surroundingthe three research sites (range, $14,714–$21,936) was approximately 50% orless than the median annual income for the county overall ($39,232).30 Two datasources are included in this study: food store audits and self-reported surveys. Theresearch protocol was approved by the Vanderbilt University Institutional ReviewBoard.
SampleThe source population includes all customers frequenting the farmers’ marketsincluding parents/guardians of children attending the Boys and Girls Clubs, stafffrom the clubs, and community members. A convenience sample of customers wasrecruited to complete four different surveys that were conducted over a 10-weektimeframe in 2008. The current analysis is only focused on the first two of thesesurveys. Each of the four surveys was designed to gather different types ofinformation from famer’s market customers (e.g., demographics, perceptions offood access, food security status). The surveys did not include repeated assessmentsof the same questions. The main reason for using multiple surveys was to reduceparticipant burden. Surveys were completed at the farmers’ markets, over thetelephone, or by e-mail. Each survey was self-reported and completed individuallyor, upon request, with the assistance of a research assistant. All participantsreceived a $5 voucher to be redeemed at the farmers’ markets after completingeach survey.
The sample originally examined in the present study consisted of 82 customerswho completed surveys 1 and 2. A subsample was then created; this limited thesample to 37 of the 82 participants who were living within a 1-mi radius of one ofthe three research sites. Distances between participants’ residence and the threesearch sites were calculated in ArcMap version 9.3 using POINTDISTANCE, astraight-line distance utility. This process ensured that the analytic sample (N=37)consisted of participants residing in the same 1-mi geographic boundaries in whichthe food stores audits were conducted.
Measures
Local Food Environment Audits of all food stores located within 1 mi of the threeBoys and Girls Clubs, where the farmers’ markets were held, were conducted. Therubric of a 1-mi radius represented a walkable distance for accessing the storeslocated near each Boys and Girls Club.18 Food stores included supermarkets (i.e.,chain food stores that sell a wide variety of items including food, medicine, toiletries,and alcohol); local markets (i.e., nonchain food stores selling a modest variety ofitems); and convenience stores (i.e., chain or nonchain stores selling a limited varietyof items). A total of 42 food stores were identified and audits were conducted inside33 of the stores. Of the nine stores that were not audited, eight store owners did notpermit the conduct of an audit in their stores and one store was deemed unsafe byresearch personnel.
The food store audits were conducted by trained student researchers. Eachstudent team was assigned a target area and then each traversed all streets within1 mi of the Boys and Girls Clubs. For each store, students recorded the layout andflow of the store, types of foods sold in the store, and whether or not the store soldalcohol or tobacco products. The food store audit used in this research was based onan inventory developed by the University of Missouri-Kansas City Health Research
FREEDMAN AND BELL828
Group.* A copy of the instrument is available upon request from the correspondingauthor.
Based on the food audit data, local food environment was operationalized intotwo domains: availability of healthful foods and availability of alcohol and tobacco.Availability of healthful foods focused on access to fresh fruit, fresh vegetables, leanmeats (skinless poultry or 86% or greater lean ground meat), low-fat milk, andwhole-grain breads. Availability of alcohol and tobacco focused on access to anyalcoholic beverage (beer, liquor, wine) or any tobacco product (cigarettes, cigars,chewing tobacco). Coding options for each foodstuff are listed in Table 2. An overallstore quality composite score was also calculated by summing the values for each ofthe above items (Cronbach’s alpha=0.76, N=33).
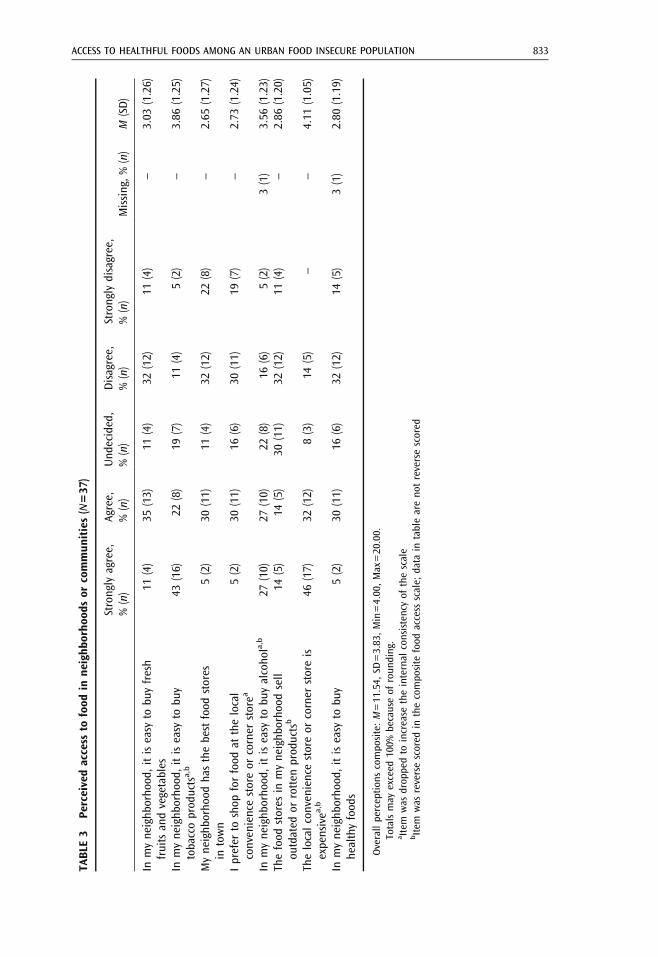
Perceptions of Access to Healthful Foods The perceptions of access to healthfulfoods scale was developed based on qualitative feedback provided during the firstand second years of the farmers’ market study. This eight-item inventory askedparticipants to rate the food stores in their neighborhood according to a five-pointLikert scale (1=strongly disagree to 5=strongly agree). The inventory focused onaccess to healthful foods, access to alcohol and tobacco, and the quality and value ofthe neighborhood food stores. Each item in the scale is listed in Table 3.
An overall measure of participants’ perceptions of access to healthful foods wascalculated using all eight items in the inventory (Cronbach’s alpha=0.64, N=37).Due to the low level of internal consistency yielded from this initial composite,ultimately, a subset of four items was retained and included in the overallperceptions of access to healthful foods scale (Cronbach's alpha=0.80, N=37).
Food Security Status Food security status was measured using a subset ofquestions developed by the US Department of Agriculture.31 Four questions focusedon skipping meals over the past year and had a response choice of yes or no. Sixquestions focused on worries about food over the past year and included a responsechoice of often true, sometimes true, and never true. Three of the six questions wereonly answered by participants with children.
To determine food security status (secure versus insecure), the above items weresummed, using values of 0 (no) and 1 (yes) for the four yes/no response items andvalues 0 (never true) and 1 (sometimes or often true) for the six often true,sometimes true, and never true response items. The sum of the food security itemswas then used to classify participants as food secure (sum≤2) or food insecure(sum≥3). The same cut points were used for those with children and those without.
Demographics Demographic variables related to sex, race/ethnicity, level ofeducation, household income, number of children, and receipt of food assistancewere also collected.
AnalysisAll statistical analyses were conducted in SAS version 9.1.3. Descriptive statisticsincluding frequencies and means were calculated for local food environment,perceived food access, and demographic variables. To examine the level of
*The lead investigators of the UM-KC research project included Walker C. Poston, C. Keith Haddock,and Joseph Hughey.
ACCESS TO HEALTHFUL FOODS AMONG AN URBAN FOOD INSECURE POPULATION 829
agreement/disagreement between participants’ perceptions of food access and thelocal food environment, chi-square goodness of fit tests were conducted (α=0.05).Four separate chi-square analyses were conducted. The first two focused onperceptions versus reality regarding the availability of fresh fruits and vegetablesand healthy foods in general, respectively, whereas the third and fourth chi-squareanalyses focused on perceptions versus reality regarding the availability of tobaccoand alcohol products, respectively.
Before conducting the chi-square analyses, data included in the analyses wererecoded into yes/no categories. More specifically, to examine the level of agreement/disagreement between participants’ perceptions on the availability of fresh fruits andvegetables with the reality of availability in the local food environment, participantswho agreed or strongly agreed to the survey item “In my neighborhood, it is easy tobuy fresh fruits and vegetables” were classified as yes and those that respondedundecided, disagree, or strongly disagree were classified as no. Food stores that sold atleast one fresh fruit or one fresh vegetable were classified as yes and stores that did notoffer any fresh fruits of vegetables were classified as no. A similar process was used tocompare perceptions versus reality regarding access to healthful foods more generally.Participants who agreed or strongly agreed to the survey item “In my neighborhood,it is easy to buy healthy foods” were classified as yes and those that respondedundecided, disagree, or strongly disagree were classified as no. To categorize theavailability of healthy foods in the local food environment, the overall store qualitycomposite score was used. Stores with an overall store quality composite score of 3 orgreater were classified as yes and those with scores G3 were classified as no.
Next, even though the tobacco and alcohol availability items were not includedin the four-item composite food access scale, it was theoretically important toexamine the relationship between perceptions and reality regarding these unhealthyitems. Thus, using the self-report and food store audit items related to tobacco andalcohol availability, the same general process as previously described was used toexamine perceptions versus reality for tobacco and alcohol availability.
RESULTS
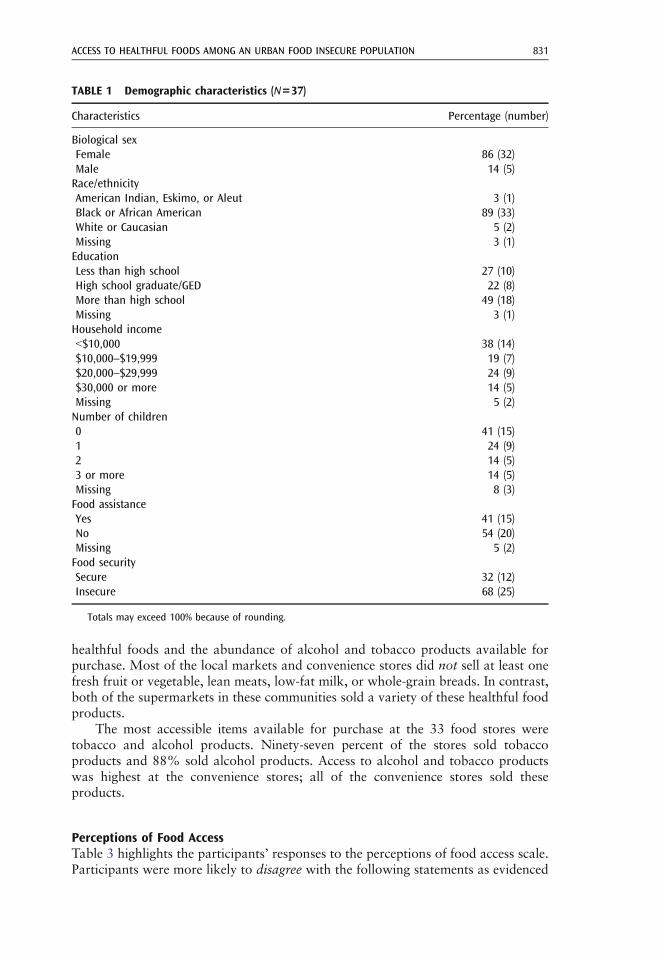
Participants reported high rates of food insecurity. Over two thirds (68%)experienced food insecurity in the past year (see Table 1). Most of the participantswere female (86%) and self-identified as Black or African American (89%). Abouthalf of the participants had more than a high school level of education. Level ofhousehold income varied among participants with 38% earning G$10,000/year.Approximately half of the respondents were parents with one or more childrenunder the age of 18 years living in their households. Forty-one percent of therespondents were currently receiving government food assistance (food stamps,Special Supplemental Nutrition Program for Women, Infants, and Children (WIC),or free or reduced price school lunches).
Food EnvironmentSeventy percent of the food stores surrounding the three Boys and Girls Clubs wereconvenience stores, 24% were local markets, and 6% were supermarkets (seeTable 2). The mean overall food store quality composite scores for the three storetypes ranged from 6.5 for supermarkets to −0.38 and −0.74 for local markets andconvenience stores, respectively. The relatively low average composite scores for thelocal markets and convenience stores were related to the limited quantity of
FREEDMAN AND BELL830
healthful foods and the abundance of alcohol and tobacco products available forpurchase. Most of the local markets and convenience stores did not sell at least onefresh fruit or vegetable, lean meats, low-fat milk, or whole-grain breads. In contrast,both of the supermarkets in these communities sold a variety of these healthful foodproducts.
The most accessible items available for purchase at the 33 food stores weretobacco and alcohol products. Ninety-seven percent of the stores sold tobaccoproducts and 88% sold alcohol products. Access to alcohol and tobacco productswas highest at the convenience stores; all of the convenience stores sold theseproducts.
Perceptions of Food AccessTable 3 highlights the participants’ responses to the perceptions of food access scale.Participants were more likely to disagree with the following statements as evidenced
TABLE 1 Demographic characteristics (N=37)
Characteristics Percentage (number)
Biological sexFemale 86 (32)Male 14 (5)Race/ethnicityAmerican Indian, Eskimo, or Aleut 3 (1)Black or African American 89 (33)White or Caucasian 5 (2)Missing 3 (1)EducationLess than high school 27 (10)High school graduate/GED 22 (8)More than high school 49 (18)Missing 3 (1)Household incomeG$10,000 38 (14)$10,000–$19,999 19 (7)$20,000–$29,999 24 (9)$30,000 or more 14 (5)Missing 5 (2)Number of children0 41 (15)1 24 (9)2 14 (5)3 or more 14 (5)Missing 8 (3)Food assistanceYes 41 (15)No 54 (20)Missing 5 (2)Food securitySecure 32 (12)Insecure 68 (25)
Totals may exceed 100% because of rounding.
ACCESS TO HEALTHFUL FOODS AMONG AN URBAN FOOD INSECURE POPULATION 831
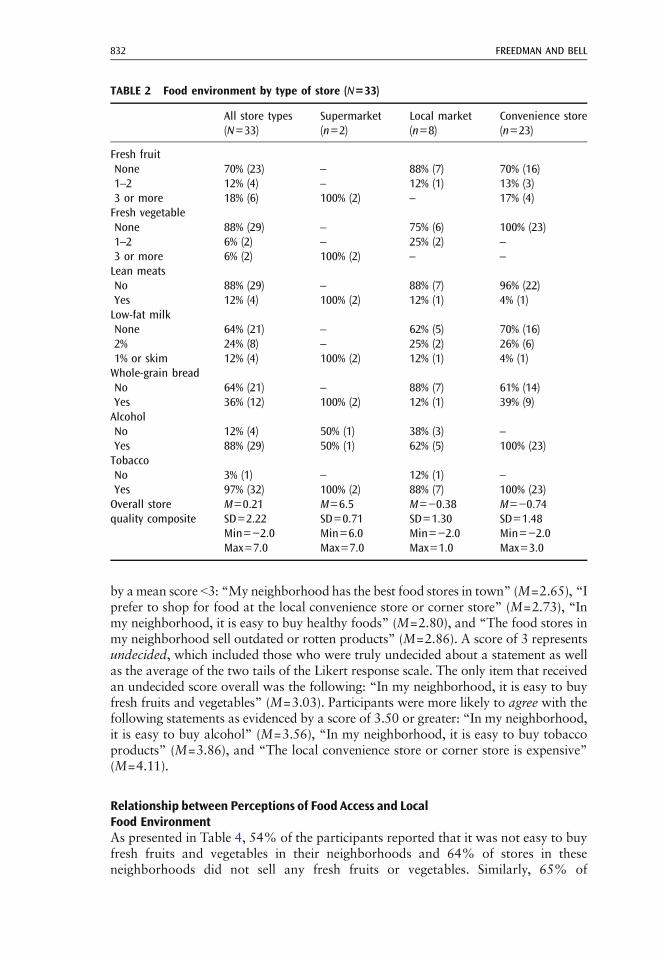
by amean score G3: “My neighborhood has the best food stores in town” (M=2.65), “Iprefer to shop for food at the local convenience store or corner store” (M=2.73), “Inmy neighborhood, it is easy to buy healthy foods” (M=2.80), and “The food stores inmy neighborhood sell outdated or rotten products” (M=2.86). A score of 3 representsundecided, which included those who were truly undecided about a statement as wellas the average of the two tails of the Likert response scale. The only item that receivedan undecided score overall was the following: “In my neighborhood, it is easy to buyfresh fruits and vegetables” (M=3.03). Participants were more likely to agree with thefollowing statements as evidenced by a score of 3.50 or greater: “In my neighborhood,it is easy to buy alcohol” (M=3.56), “In my neighborhood, it is easy to buy tobaccoproducts” (M=3.86), and “The local convenience store or corner store is expensive”(M=4.11).
Relationship between Perceptions of Food Access and LocalFood EnvironmentAs presented in Table 4, 54% of the participants reported that it was not easy to buyfresh fruits and vegetables in their neighborhoods and 64% of stores in theseneighborhoods did not sell any fresh fruits or vegetables. Similarly, 65% of
TABLE 2 Food environment by type of store (N=33)
All store types(N=33)
Supermarket(n=2)
Local market(n=8)
Convenience store(n=23)
Fresh fruitNone 70% (23) – 88% (7) 70% (16)1–2 12% (4) – 12% (1) 13% (3)3 or more 18% (6) 100% (2) – 17% (4)Fresh vegetableNone 88% (29) – 75% (6) 100% (23)1–2 6% (2) – 25% (2) –
3 or more 6% (2) 100% (2) – –
Lean meatsNo 88% (29) – 88% (7) 96% (22)Yes 12% (4) 100% (2) 12% (1) 4% (1)Low-fat milkNone 64% (21) – 62% (5) 70% (16)2% 24% (8) – 25% (2) 26% (6)1% or skim 12% (4) 100% (2) 12% (1) 4% (1)Whole-grain breadNo 64% (21) – 88% (7) 61% (14)Yes 36% (12) 100% (2) 12% (1) 39% (9)AlcoholNo 12% (4) 50% (1) 38% (3) –
Yes 88% (29) 50% (1) 62% (5) 100% (23)TobaccoNo 3% (1) – 12% (1) –
Yes 97% (32) 100% (2) 88% (7) 100% (23)Overall store M=0.21 M=6.5 M=−0.38 M=−0.74quality composite SD=2.22 SD=0.71 SD=1.30 SD=1.48
Min=−2.0 Min=6.0 Min=−2.0 Min=−2.0Max=7.0 Max=7.0 Max=1.0 Max=3.0
FREEDMAN AND BELL832
TABLE
3Pe
rceivedaccess
tofood
inne
ighb
orho
odsor
commun
ities(N=37
)
Strongly
agree,
%(n)
Agree,
%(n)
Und
ecided,
%(n)
Disagree,
%(n)
Strongly
disagree,
%(n)
Missing,%(n)
M(SD)
Inmyneighb
orho
od,itiseasy
tobu
yfresh
fruitsandvegetables
11(4)
35(13)
11(4)
32(12)
11(4)
–3.03
(1.26)
Inmyneighb
orho
od,itiseasy
tobu
ytobaccoprod
uctsa,b
43(16)
22(8)
19(7)
11(4)
5(2)
–3.86
(1.25)
Myneighb
orho
odhasthebestfood
stores
intown
5(2)
30(11)
11(4)
32(12)
22(8)
–2.65
(1.27)
Iprefer
toshop
forfood
atthelocal
conveniencestoreor
corner
storea
5(2)
30(11)
16(6)
30(11)
19(7)
–2.73
(1.24)
Inmyneighb
orho
od,itiseasy
tobu
yalcoho
la,b
27(10)
27(10)
22(8)
16(6)
5(2)
3(1)
3.56
(1.23)
Thefood
stores
inmyneighb
orho
odsell
outdated
orrotten
prod
uctsb
14(5)
14(5)
30(11)
32(12)
11(4)
–2.86
(1.20)
Thelocalconveniencestoreor
corner
storeis
expensivea
,b46
(17)
32(12)
8(3)
14(5)
––
4.11
(1.05)
Inmyneighb
orho
od,itiseasy
tobu
yhealthyfood
s5(2)
30(11)
16(6)
32(12)
14(5)
3(1)
2.80
(1.19)
Overallperceptio
nscompo
site:M=11.54,
SD=3.83,Min=4.00,Max=20.00.
Totalsmay
exceed
100%
becauseof
roun
ding.
a Item
was
drop
pedto
increase
theinternal
consistencyof
thescale
bItem
was
reversescored
inthecompo
site
food
access
scale;
data
intableareno
treversescored
ACCESS TO HEALTHFUL FOODS AMONG AN URBAN FOOD INSECURE POPULATION 833
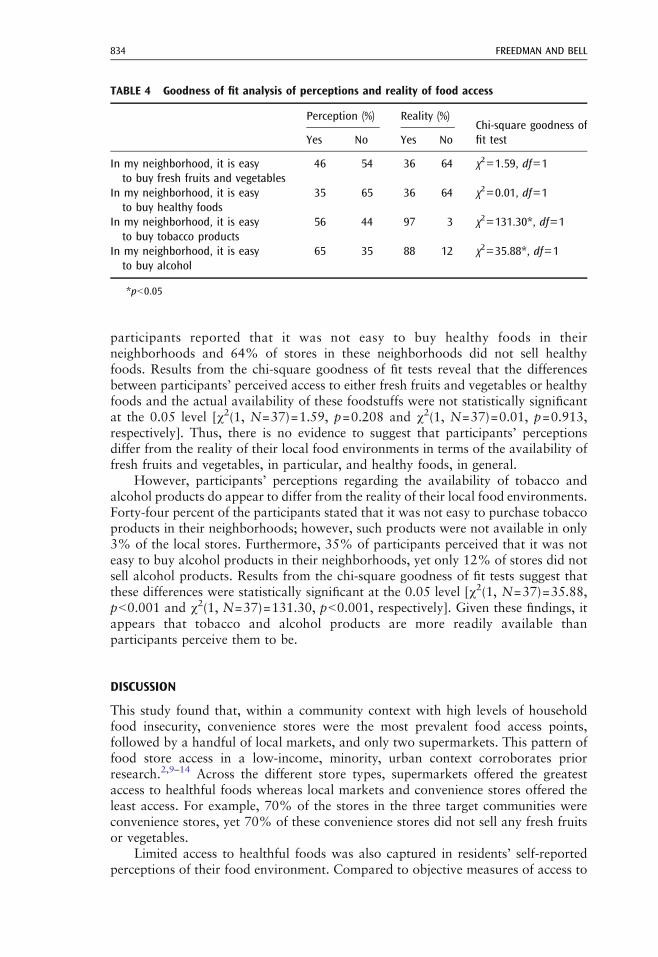
participants reported that it was not easy to buy healthy foods in theirneighborhoods and 64% of stores in these neighborhoods did not sell healthyfoods. Results from the chi-square goodness of fit tests reveal that the differencesbetween participants’ perceived access to either fresh fruits and vegetables or healthyfoods and the actual availability of these foodstuffs were not statistically significantat the 0.05 level [χ2(1, N=37)=1.59, p=0.208 and χ2(1, N=37)=0.01, p=0.913,respectively]. Thus, there is no evidence to suggest that participants’ perceptionsdiffer from the reality of their local food environments in terms of the availability offresh fruits and vegetables, in particular, and healthy foods, in general.
However, participants’ perceptions regarding the availability of tobacco andalcohol products do appear to differ from the reality of their local food environments.Forty-four percent of the participants stated that it was not easy to purchase tobaccoproducts in their neighborhoods; however, such products were not available in only3% of the local stores. Furthermore, 35% of participants perceived that it was noteasy to buy alcohol products in their neighborhoods, yet only 12% of stores did notsell alcohol products. Results from the chi-square goodness of fit tests suggest thatthese differences were statistically significant at the 0.05 level [χ2(1, N=37)=35.88,pG0.001 and χ2(1, N=37)=131.30, pG0.001, respectively]. Given these findings, itappears that tobacco and alcohol products are more readily available thanparticipants perceive them to be.
DISCUSSION
This study found that, within a community context with high levels of householdfood insecurity, convenience stores were the most prevalent food access points,followed by a handful of local markets, and only two supermarkets. This pattern offood store access in a low-income, minority, urban context corroborates priorresearch.2,9–14 Across the different store types, supermarkets offered the greatestaccess to healthful foods whereas local markets and convenience stores offered theleast access. For example, 70% of the stores in the three target communities wereconvenience stores, yet 70% of these convenience stores did not sell any fresh fruitsor vegetables.
Limited access to healthful foods was also captured in residents’ self-reportedperceptions of their food environment. Compared to objective measures of access to
TABLE 4 Goodness of fit analysis of perceptions and reality of food access
Perception (%) Reality (%)Chi-square goodness offit testYes No Yes No
In my neighborhood, it is easyto buy fresh fruits and vegetables
46 54 36 64 χ2=1.59, df=1
In my neighborhood, it is easyto buy healthy foods
35 65 36 64 χ2=0.01, df=1
In my neighborhood, it is easyto buy tobacco products
56 44 97 3 χ2=131.30*, df=1
In my neighborhood, it is easyto buy alcohol
65 35 88 12 χ2=35.88*, df=1
*pG0.05
FREEDMAN AND BELL834
healthful foods in local contexts, perceptions of food access do not appear to bebiased among the sample population. Participants’ perceptions of access to healthfulfoods mirrored the reality of their food environments. However, when investigatingaccess to alcohol and tobacco products, participants’ perceptions appear to be lessaccurate. In reality, a surfeit of alcohol and tobacco products was available forpurchase at the food stores in the target communities; however, many participantsdid not perceive these items to be accessible. This discrepancy between perceptionsand reality regarding access to alcohol and tobacco may be related to other factorsthat influence access such as the financial resources necessary to purchase products.Indeed, future research is warranted to examine this phenomenon and may alsoextend into perceptions versus reality of access to other unhealthful products such ashigh-fat snacks and sweetened beverages.
The congruence between the two measurements of access to healthful foods—perceptions and reality—that were assessed in this study is a key finding in thisresearch. This finding corroborates other research on the relationship betweenperceived and actual measures of local food environments, which suggest thatperceptions of access may be as good or even better predictors of food access thanobjective measures.26 Results from this study indicate that participants living in low-income, urban, minority, and food insecure communities can validly assess access tohealthful foods, and data collection instruments aimed at uncovering participants'perceptions of healthful food access such as the scale introduced herein ought to beincluded in future research. Moreover, our findings suggest that researchers need notsolely rely on objective measures of local food environments through food storemapping and auditing data when examining access to healthful foods sinceperceptions of access appear to be valid. While it is advantageous to includemultiple measures of food access in obesity and food security research, if resourcesare constrained, then measures of perceptions of food access may sufficiently captureimportant features of local food environments.
LimitationsAlthough this study included novel approaches for examining local food environ-ments, it is not without limitations. First, the use of a small, nonrandom samplelimits the external generalizability of the findings in terms of both people and places(i.e., not only was our analytic sample a convenience sample, but the locale for thestudy was also based on convenience). Other important elements of potential samplebias include the relatively high education level of the sample and the mere fact thatall of the participants in the current study frequented the farmers’ markets, thus,potentially indicating an underlying difference between them and other residents inthese urban communities. Even with these limitations, the convenience sampleprovides a unique and important perspective since all of the participants were livingwithin the same geographic boundaries in which the food store audits wereconducted.
Similar to other food environment studies, we imposed geographic boundariesto capture access to food within a 1-mi radius of participants' residence. However,we do not know if these boundaries match the boundaries that participants use todefine their local food environment. Future qualitative research is warranted toinvestigate the spatial boundaries community members use to define their local foodenvironment.32 Finally, while all of the participants shopped at the Boys and GirlsClub farmers’ markets, we do not know where they purchased the majority of theirfoodstuffs. Thus, we do not know if the local food environment is the only food
ACCESS TO HEALTHFUL FOODS AMONG AN URBAN FOOD INSECURE POPULATION 835
access point or if participants travel to other environments to gain access to healthierfoods. In our prior research, we found that participants in the target communitiesfrequently traveled outside of the local food environment one time per month forlarge food purchases; however, they frequented convenience stores and localmarkets in the community for smaller purchases much more frequently.24
Given these limitations, additional research on the relationship betweenperceptions and reality of local food environments among food insecure populationsis warranted. In particular, future research ought to include larger samples, gatherinformation on how participants define the boundaries of their local food environment,and examine where people shop for large and small food purchases (i.e., do they stay inthe neighborhoods in which they live or do they travel to gain access to healthierfoods?).
CONCLUSION
The obesity epidemic is beginning to draw attention to the ways that local foodenvironments influence the public’s health.33 Though important overall, local foodenvironments may have an even greater impact on the health of food insecurepopulations. Measures of access to healthful foods in local food environments areemergent,16,29 and few measures of perceptions of food access have beendeveloped.15,26,34 This study contributes to extant research on local food environ-ments in several ways. First, this study focuses on the unique needs of an urbanpopulation experiencing very high rates of food insecurity. Second, it offers a newmeasure for assessing perceptions of access to healthful foods. Third, the newlydeveloped measure was validated by comparing self-reported perceptions of foodaccess to objective assessments of food context. Findings suggest that participantsliving in low-income, urban, minority, and food insecure communities are able toaccurately assess the dearth of access to healthful foods in their communities. Futureresearch is needed to further validate the perceptions of food access measureintroduced in this research and, more importantly, to develop strategies forincreasing access to healthful foods among food insecure populations.
ACKNOWLEDGEMENTS
This research was supported in part by grants from the Baptist Healing Trust, FirstTennessee, AMERIGROUP, and Tennessee Department of Health. Thank you to LizAleman, Anna Au, Leigh Forbush, Renee Langston, Mary Kate Mouser, BrittaMuller, Laine Peeler, Sharon Shields, and Lynn Shirley for their research assistanceand to the study participants for their time. We are thankful to the anonymousreviewers for their thoughtful feedback. We have no financial disclosures to report.
REFERENCES
1. Ogden CL, Carroll MD, Curtin LR, McDowell MA, Tabak CJ, Flegal KM. Prevalence ofoverweight and obesity in the United States, 1999–2004. JAMA. 2006; 295(13): 1549-1555.
2. Jetter KM, Cassady DL. The availability and cost of healthier food alternatives. Am JPrev Med. 2006; 30(1): 38-44.
3. Nord M, Andrews M, Carlson S. Household food security in the United States, 2006.Washington: U.S. Department of Agriculture; 2007. Report No. ERR-49.
FREEDMAN AND BELL836
4. Nord M, Andrews M, Carlson S. Household food security in the United States, 2004.Washington: Economic Research Service; 2005. Report No. ERR-49.
5. Nord M, Andrews M, Carlson S. Household food insecurity in the United States, 2007.Washington: U.S. Department of Agriculture; 2008. Report No. ERR-60.
6. Adams EJ, Grummer-Strawn L, Chavez G. Food insecurity is associated with increasedrisk of obesity in California women. J Nutr. 2003; 133: 1070-1074.
7. Casey PH, Simpson PM, Gossett JM, et al. The association of child and household foodinsecurity with childhood overweight status. Pediatrics. 2006; 118(5): e1406-e1413.
8. Beaulac J, Kristjansson E, Cummins S. A systematic review of food deserts, 1966–2007.Prev Chronic Dis. 2009; 6(3): 1-10.
9. Baker E, Schootman M, Barnidge E, Kelly C. The role of race and poverty in access tofoods that enable individuals to adhere to dietary guidelines. Prev Chronic Dis. 2006; 3(3): 1-11.
10. Chung C, Myers SL. Do the poor pay more for food? An analysis of grocery storeavailability and food price disparities. J Consum Aff. 1999; 33(2): 276-296.
11. MacQueen KM, McLellan E, Metzger DS, et al. What is community? An evidence-baseddefinition for participatory public health. Am J Public Health. 2001; 91(12): 1929-1938.
12. Moore LV, Diez Roux AV. Associations of neighborhood characteristics with the locationand type of food stores. Am J Public Health. 2006; 96(2): 325-331.
13. Morland K, Wing S, Diez Roux A, Poole C. Neighborhood characteristics associated withthe location of food stores and food service places. Am J Prev Med. 2002; 22(1): 23-29.
14. Sloane DC, Diamant A, Lewis LB, et al. Improving the nutritional resource environmentfor healthy living through community-based participatory research. J Gen Intern Med.2003; 18: 568-575.
15. Moore LV, Diez Roux A, Brines S. Comparing perceptions-based and geographicinformation system (GIS)-based characterizations of the local food environment. J UrbanHealth. 2008; 85(2): 206-216.
16. McKinnon RA, Reedy J, Morrissette MA, et al. Measure of the food environment: acompilation of the literature, 1990–2007. Am J Prev Med. 2009; 36(4S): S124-S133.
17. Zenk S, Powell L. U.S. secondary schools and food outlets. Health Place. 2008; 14(2):336-346.
18. Moore L, Roux A, Nettleton A, Jacobs D. Associations of the local food environmentwith diet quality—a comparison of assessments based on surveys and geographicinformation systems: the multi-ethnic study of atherosclerosis. Am J Epidemiol. 2008;167(8): 917-924.
19. Wang M, Kim S, Gonzalez A, MacLeod K, Winkleby M. Socioeconomic and food-relatedphysical characteristics of the neighborhood environment are associated with body massindex. J Epidemiol Community Health. 2007; 61: 491-498.
20. Alwitt L, Donley T. Retail stores in poor urban neighborhoods. J Consum Aff. 1997; 31(1): 139-164.
21. Morland K, Filomena S. Disparities in the availability of fruits and vegetables betweenracially segregated urban neighborhoods. Public Health Nutr. 2007; 10: 1481-1489.
22. Liese AD, Weis KE, Pluto D, Smith E, Lawson A. Food store types, availability, and costof foods in a rural environment. J Am Diet Assoc. 2007; 107(11): 1916-1923.
23. Sallis J, Nader P, Rupp J, Atkins C, Wilson W. San Diego surveyed for heart healthy foodsand exercise facilities. Public Health Rep. 1986; 101(2): 216-219.
24. Freedman DA. Local food environments: they're all stocked differently. Am J CommunityPsychol. 2009; in press.
25. Odoms-Young AM, Zenk SN, Mason M. Measuring food availability and access inAfrican-American communities: implications for intervention and policy. Am J Prev Med.2009; 36(4S): S145-S150.
26. Giskes K, Van Lenthe FJ, Brug J, Mackenbach JP, Turrell G. Socioeconomic inequalities infood purchasing: the contribution of respondent-perceived and actual (objectivelymeasured) price and availability of foods. Prev Med. 2007; 45: 41-48.
ACCESS TO HEALTHFUL FOODS AMONG AN URBAN FOOD INSECURE POPULATION 837
27. Moore LV, Diez Roux A, Nettleton JA, Jacobs DR. Associations of the local foodenvironment with diet quality: a comparison of assessments based on surveys andgeographic information systems. Am J Epidemiol. 2008; 167(8): 917-924.
28. Freedman DA. Politics of food access in food insecure communities. Nashville: VanderbiltUniversity; 2008. Dissertation.
29. Lytle LA. Measuring the food environment: state of the science. Am J Prev Med. 2009; 36(4S): S134-S144.
30. U.S. Census Bureau. Decennial Census. Washington: U.S. Census Bureau; 2000.31. Bickel G, Nord M, Price C, Hamilton W, Cook J. Guide to Measuring Household Food
Security. Alexandria: U.S. Department of Agriculture; 2000.32. Gittelsohn J, Sharma S. Physical, consumer, and social aspects of measuring the local food
environment among diverse low-income populations. Am J Prev Med. 2009; 36(4S):S161-S165.
33. Glanz K. Measuring food environments. Am J Prev Med. 2009; 36(4S): S93-S98.34. Mujahid MS, Diez Roux AV, Morenoff JD, Raghunathan R. Assessing the measurement
properties of neighborhood scales: from psychometrics to ecometrics. Am J Epidemiol.2007; 165: 858-867.
FREEDMAN AND BELL838