accelerated aging: prediction of chemical stability of...
TRANSCRIPT

International Journal of Pharmaceutics 293 (2005) 101–125
Accelerated aging: Prediction of chemical stability ofpharmaceuticals
Kenneth C. Waterman∗, Roger C. Adami
Pfizer Global Research and Development, Eastern Point Road, Groton, CT 06340, USA
Received 8 June 2004; received in revised form 15 December 2004; accepted 15 December 2004
Abstract
Methods of rapidly and accurately assessing the chemical stability of pharmaceutical dosage forms are reviewed with re-spect to the major degradation mechanisms generally observed in pharmaceutical development. Methods are discussed, with theappropriate caveats, for accelerated aging of liquid and solid dosage forms, including small and large molecule active pharma-ceutical ingredients. In particular, this review covers general thermal methods, as well as accelerated aging methods appropriateto oxidation, hydrolysis, reaction with reactive excipient impurities, photolysis and protein denaturation.© 2005 Elsevier B.V. All rights reserved.
Keywords:Drug stability; Accelerated aging; Hydrolysis; Oxidation; Shelf-life
1
ositmaso
f
(
pu-ty;sin-alsedza-ed
dailyis
tionevelalertionical
tion
0
. Introduction
In the development of pharmaceutical dosage forms,ne of the persistent challenges is assuring acceptabletability. While classically stability refers to the abil-ty to withstand loss of a chemical due to decomposi-ion, in the pharmaceutical world, the term “stability”ore often refers to the storage time allowed beforeny degradation product in the dosage form achieves aufficient level to represent a risk to the patient. Basedn this time, the expiration date (shelf-life) of a product
∗ Corresponding author. Tel.: +1 860 715 3492;ax: +1 860 715 1626.E-mail address:ken [email protected]
K.C. Waterman).
is determined. The allowable level of any given imrity will depend on the dose and likelihood of toxicihowever, for most drugs, the allowable levels of agle impurity permissible without explicit toxicologicclinical testing are generally well less than 1% baon the drug. The International Council of Harmonition (ICH) specifies the amount of impurities allowto form during product storage (ICH, 2003).
The amounts permitted are based on the totalintake of the drug. The amount of impurity alloweddescribed as a reporting, identification, or qualificathreshold. A reporting threshold is defined as the lthat must be reported to regulatory agencies tothem of the presence of the impurity. An identificatthreshold is defined as the level that requires chemidentification of the substance. Finally, the qualifica
378-5173/$ – see front matter © 2005 Elsevier B.V. All rights reserved.doi:10.1016/j.ijpharm.2004.12.013

102 K.C. Waterman, R.C. Adami / International Journal of Pharmaceutics 293 (2005) 101–125
Table 1Total amount of degradants allowed for new drug products based on regulatory guidelines (International Council of Harmonization, 2003)(TDI = total daily intake)
Type of threshold Maximum daily dose Threshold
Reporting ≤1 g 0.1% TDI>1 g 0.05% TDI
Identification <1 mg 1.0% TDI or 5�g (lower of two)1 mg–10 mg 0.5% TDI or 20�g (lower of two)10 mg–2 g 0.2% TDI or 2 mg (lower of two)>2 g 0.10%
Qualification <10 mg 1.0% TDI or 50�g (lower of two)10 mg–100 mg 0.5% TDI or 200�g (lower of two)100 mg–2 g 0.2% TDI or 3 mg (lower of two)>2 g 0.15% TDI
threshold is the level that must be tested in toxicologystudies to ensure the safety of the compound. Theseare defined as a percent of the drug total daily intake oran absolute mass amount, whichever is lower.Table 1describes the specific levels of impurities allowed foreach threshold.
One of the consequences of using product formationrather than drug loss to determine stability is that theprecision of measurements is inherently higher for lowconversions. This is due to the fact that it is generallyharder to detect a small change in a large number thanthe same absolute change in a small number becausethe relative change in values is much greater in thelatter case. For example, for a product formed duringa degradation study going from 0.05 to 0.50% is a1000% increase in the level of the material, whiledecreasing the initial amount of drug by the sameamount, i.e., from 100.00 to 99.50%, is a decrease ofonly 0.5%.
The advent of more sensitive analytical methods inpharmaceutical development has resulted in a concomi-tant decrease in the allowable levels of impurities anddegradants in dosage forms. In the development of apharmaceutical product, speed to market has a greatinfluence on the profitability of that product. Forma-tion of a degradant at levels significantly below 1% ofthe drug during an anticipated shelf-life (usually two tothree years) may result in significant product introduc-tion delays, especially if such instability is uncoveredlate in the development process. Once clinical trialsh itatea thef tive
to predict any instability in pharmaceutical formula-tions as early as possible in the development process,thereby enabling remedies to be applied. It is impor-tant that such methods be effective enough to predicteven slow rates of degradant formation, yet remain ac-curate enough that relevant degradation problems areaddressed.
In this review, we examine a number of methods inuse for accelerating chemical degradation with a spe-cial emphasis on recent advances in the field. Otherreviews previously published largely predate the ad-vent of highly sensitive assays (Pope, 1980a, 1980b;Parikh, 1981; Stewart and Tucker, 1984a, 1984b,1985a, 1985b; Witthaus, 1981; Meunier, 1981). Morerecent reviews have addressed accelerated stability test-ing in biological products, hence this field is onlybriefly mentioned in the present review (Franks, 1994;Young, 1990). Most of the previously reviewed workinvolved loss of potency of drug rather than formationof low levels of degradant products. Current formula-tion development and expiry determination is more of-ten concerned with the formation of specific degradants(Darrington and Jiao, 2004). Though the basic sciencebehind current methodology has not changed signif-icantly, the methods available for predicting stabilityhave evolved over the years as will be discussed in thisreview.
Another type of stability important for pharmaceu-tical dosage forms is physical stability. In this review,physical stability is only discussed with respect to its ef-f gingf edi
ave begun, a change in formulation may necessdditional clinical trials to assure bioequivalence of
ormulations. Consequently, there is a strong incen
ects on chemical stability; however, accelerated aor prediction of physical stability has been reviewn the literature (Stewart and Tucker, 1985c).
K.C. Waterman, R.C. Adami / International Journal of Pharmaceutics 293 (2005) 101–125 103
In assessing the stability of drugs, the use of multi-ple methods can help in determining the mechanism ofdegradation. Learning the degradation mechanism can,in turn, be helpful in the design of stabilization methodsor, potentially in redesign of the active pharmaceuticalingredient (API).
In this review, we discuss various options for accel-erated study of product formation from drug chemicaldegradation. These options are not necessarily the sameas those used for regulatory testing to set expiry dating.Instead, this review focuses on options for getting anearly stability assessment and providing some mech-anistic understanding to help in taking remedial ac-tions to rapidly develop a prototype commercial dosageform. This manuscript first describes the general use ofthermal acceleration methods, which are broadly appli-cable to many degradation mechanisms. Some of thespecific major degradation mechanisms common withactive pharmaceutical ingredients are then discussedin greater detail. Since the type of accelerated agingused will often depend on the specific dosage form,these are separated out for each mechanism as appro-priate. Finally, photostability and estimation of stabilityin packaged products are reviewed.
2. Thermal methodologies
Accelerated aging traditionally involves use oftemperature increases to speed reactions. The processo ingt thene thep nglet to ad ow.
2
rmso r-m ratesw nceo de-g ticalt ualp y ors the
determining factor in setting shelf-life expiry. Whiledrugs commonly decompose to give multiple products,the shelf-life is rarely determined by the overall drugdecomposition rate (i.e., the sum of these individualrates), but rather by the rate of formation of individualproducts (as determined by their toxicity limits). Thetime dependence of drug degradation will vary, depend-ing on whether or not the drug itself is involved in therate-determining step of its degradation (zero order ifnot, first order for most reactions that do depend on thedrug concentration). The form of the rate equation isshown below for zero and first order reactions based onformation of product (D0 is initial drug concentration,Pt is the product concentration at timet; P0, the initialproduct concentration is assumed to be zero):
zero order : Pt = kt (1)
first order : ln
(1 − Pt
D0
)= −kt (2)
For zero-order reactions (i.e., zero-order in drug),the reaction rate is independent of the drug concentra-tion, while for first order reactions, the rate dependslinearly on drug concentration. The logarithmic termof Eq. (2) can be expressed as a series expansion withlittle error for low conversions; i.e., for total drug con-versions of less than 2% as is common in pharmaceu-tical stability programs, it is possible to ignore higherorder terms in the expansion to give the following:
l
t rugc
tf ilityp canb firsto nitiall ther tionp or-m the
f estimating ambient stability involves estimathe reaction rate at different temperatures, andxtrapolating to the desired temperature. Bothrocess determining the reaction rate at a si
emperature and the process for extrapolatingesired temperature are discussed separately bel
.1. Estimating reaction rates
Chemical stability is generally expressed in tef a rate constant,k, representing either product foation or drug degradation. In general, these twoill not be the same except in the special circumstaf a one step reaction where the drug irreversiblyrades to a single product. In current pharmaceu
esting programs, the rate of formation of individroducts, independent of whether they are primarecondary decomposition products of the drug, is
n(1 − PtD0) ≈ −PtD0 (3)
Substituting Eq.(3) into Eq. (2), and assigningk′o equal the rate constant divided by the initial doncentration gives Eq.(4).
−PtD0 = −kt
Pt =(
kD0
)t
Pt = k′t(4)
Comparison between Eqs.(1) and (4)shows thaor low conversions typical in pharmaceutical stabrograms, both zero and first order processese treated as following zero-order kinetics. Forrder processes, this is accomplished using the i
inear portion of the data to provide an estimate ofeaction rate. Though this zero-order approximarovides a rate of reaction for the initial product fation, for reactions that are indeed first order in
104 K.C. Waterman, R.C. Adami / International Journal of Pharmaceutics 293 (2005) 101–125
drug, the zero-order rate constant determined by initialrates will depend on the initial drug concentration.With a zero-order reaction, however, this rate constantwill be independent of the initial concentration. Usingthis distinction can be helpful in elucidating themechanism of a degradation process. This is mostuseful in solution, where drug concentrations can bevaried to determine the reaction dependency.
Obtaining rate constants based on experimental dataat a given temperature is most often accomplished byfitting the data using linear least squares methods. Thismethod can provide acceptable rate constants, espe-cially in liquid dosage forms. With solid dosage forms,better predictability is reported using median-based ro-bust regression methods, especially when there are out-liers (Cabiglioli et al., 1996). This is partially achievedby taking replicates into account. It has also been notedthat since least square fitting (linear regression) gen-erally relates the drug concentration at a given timeto the initial concentration of drug, the error associ-ated with the initial drug concentration gets multipleweightings. Fitting of data using nonlinear regression,factoring in confidence intervals, has been proposed tobetter account for the errors associated with the initialdrug concentration (Ebel et al., 1989). Confidence in-tervals become important since there is a coupling ofthe uncertainty of the prediction due to both fitting forthe rate constants at each temperature and fitting of thetemperature dependence for extrapolation to storagetemperatures.
2
q.( rugd enceotg ofa
l
k
Here,kT is the degradation rate at temperatureT, andk′ is the degradation rate at temperatureT′ (usually thedesired temperature for prediction). The rate constantequals the amount of product formed per unit time,assuming low conversions.
In practice, many systems do not show Arrheniusbehavior, at least over a wide temperature range. Thefollowing are a list of some of the major reasons fornon-linearity in Arrhenius plots:
1. Phase transitions: If a phase change (e.g., melt, glasstransition, vaporization) occurs in the temperaturerange studied, there can be a discontinuity (see forexampleDuddu and DalMonte, 1997; Jans-Frontiniand Mielck, 1996; Duddu and Weller, 1996). Simi-larly, as temperature shifts, the solubility of a drug orreactive species in a solvent or excipient can change.For example, the solubility of oxygen in excipients(solvents) tends to decrease with increasing temper-ature. This will also be true with volatile reactivespecies. In suspensions, changes in the amount ofmaterial dissolved in the solvent can have dramaticeffects on reaction rates.
2. pH shifts: As temperature changes, the pH of a so-lution can change even with buffers present (Bates,1962). In fact, even with an adequate buffer capac-ity, the pH of a buffer itself can change as a result ofa change in pKa values for the buffer with tempera-ture as well as shifts in the autoprotolysis constantKw (Connors, 1982). This shift can alter the rate of
3 itynifi-or
in
4 tepis
p astureandtepsfor-owsf re-ingtivehed,
.2. Temperature dependence
Reaction rates will follow Arrhenius kinetics (E5)) for the majority of products generated by degradation. Arrhenius kinetics is a linear dependf the natural logarithm of the reaction rate,k, versus
he reciprocal of the absolute temperatureT (R is theas constant andA is an indication of the entropyctivation for the process).
n k = ln A − Ea
RT(5)
This can also be expressed as:
T = k′ exp
[Ea
R(1/T ′ − 1/T )
](6)
reaction in a non-Arrhenius fashion.. Uncontrolled relative humidity: Relative humid
changes as a function of temperature can sigcantly impact the linearity of Arrhenius plots fsolid dosage forms. This is further discussedSection2.4.
. Complex reaction mechanisms: For multi-sreaction pathways, the overall reaction ratedependent directly on the rate-determining stewell as indirectly on earlier steps. As temperachanges, different activation energies (slopes)pre-exponential terms (intercepts) for these scan lead to non-Arrhenius behavior of productmation, even if each individual rate constant shArrhenius behavior. For example, in the case ocombinant bovine granulocyte-colony stimulatfactor, a reversible equilibrium between the naprotein and an intermediate state is establis
K.C. Waterman, R.C. Adami / International Journal of Pharmaceutics 293 (2005) 101–125 105
followed by irreversible aggregation (Roberts,2003). Temperature changes affect the equilib-rium (i.e., the rate constants for the forward andbackwards reactions) with different Arrheniusparameters than that for the rate-determining step.The consequence is an overall non-Arrhenius tem-perature behavior for product formation, though theindividual steps appear to behave in an Arrheniusfashion. In the extreme case, a switch in the rate-determining step or shift of reaction pathway to theproduct can occur. In the case of multiple pathwaysto a single product, where one pathway dominatesat low temperature while another dominates athigh temperature, the predictions based on the hightemperature behavior will always underestimatethe instability, since the high temperature slopewill be steeper than the low temperature slope.Since the failure in this case is for an underestimateof a stability issue, this possibility can be a verysignificant issue in predicting shelf-life. For thisreason it is advisable to always maintain a lowtemperature (∼25◦C) sample to ensure a completeunderstanding of the temperature dependent profile.
5. Change in Arrhenius parameters with temperature.Although the Arrhenius parameters are generallyassumed to be temperature independent overthe narrow temperature ranges typically used inaccelerated aging studies, they will in fact vary withtemperature based on any heat capacity changeon going to the activated complex (Vyazovkin,
dide.
ruptc per-a oth-e forc en-d bovet en-t ands ostp plotg tem-p ismsg per-a
To take into account the non-linear Arrhenius be-havior, in many cases, it is possible to use the modifiedArrhenius relationship shown in Eq.(7) (IUPAC, 1996)to better fit the data:
k = ATn e−Ea/RT (7)
whereA, n andEa are parameters determined usingnonlinear fitting programs (0 <n< 1). This equationcan be mathematically simplified to give Eq.(8), whichis generally easier to use fitting programs to solve:
ln k = α − β ln m − γm (8)
Here,mequals 1/T, andα, β andγ are fitted param-eters based on a linear least square fit to the experimen-tal data (0 <β < 1). It should be noted that for kineticsthat indeed follow the Arrhenius equation,β goes tozero, and a linear relation is determined between lnkand 1/T. Use of this equation allows for better generalpredictions of room-temperature stability (Herbergeret al., 1987) since some level of curvature in the Arrhe-nius plot can be accounted for. As would be expected,the number of temperature points must be sufficientto allow fitting to Eq.(8) (greater than three). Othermodified Arrhenius relationships have also been usedsuccessfully with pharmaceutical systems to improvepredictions (Ertel and Carstensen, 1990).
2.3. Non-isothermal accelerated aging
ilitys ures.T thenb s( set rma-c sid-e trap-o ftene ient.B wert rvalsf ced.U nsc nter-v ods( 85;C 983;
1999; Wold and Exner, 1973). This factor shoulbe considered especially when using a wtemperature range in accelerated aging studies
Characteristically, some systems show abhanges in their Arrhenius curves at specific temtures (at a phase transition, for example), whilers show more continuous curvature; for exampleomplex reactions with different temperature depence for different steps. In the former case, data a
he critical temperature for the discontinuity is essially useless for predictions of lower temperatureshould not be included in extrapolations. For mhase transitions, the curvature in the Arrheniusives higher than expected reaction rates at higheratures, while most complex reaction mechanive lower than expected reaction rates at high temture.
Traditionally, accelerated pharmaceutical stabtudies are carried out at a set of fixed temperathe data provided by this isothermal method cane used in an Arrhenius (Eq.(6)) or modified ArrheniuEq. (8)) fashion to predict ambient stability. Becauhe number of temperatures generally used in phaeutical investigations is small, there can be conrable error associated with the temperature exlations. To counter this, long aging times are omployed, especially at temperatures close to amby lowering the error bars associated with the lo
emperature degradation rates, the confidence inteor the final extrapolated ambient rates are redunfortunately, the time involved in such predictioan be considerable. To narrow the confidence ials in the same aging time, non-isothermal methZhan et al., 1997; Yoshioka et al., 1987; Tucker, 19respo and Alvarez, 1985; Hempenstall et al., 1
106 K.C. Waterman, R.C. Adami / International Journal of Pharmaceutics 293 (2005) 101–125
Tucker and Owen, 1982), where samples are placed intemperature ramping ovens and pulled at various timepoints have been suggested. Conceptually, the tight-est confidence intervals for the final prediction occurwith more data under the lowest temperature condi-tions such that extrapolation is minimized. At highertemperatures, the conversion percentage as a functionof time increases such that there are tighter degradantlevel confidence intervals; however, the extrapolationdistance is greater, effectively expanding those confi-dence intervals based on the extrapolation distance. Tomore evenly balance the effects of rates and confidenceintervals, it has been shown that an exponential heat-ing process, which increases the time a sample spendsin the low temperature range relative to the highertemperatures, provides greater accuracy and precisionfor room-temperature extrapolations than other non-isothermal heating protocols (Zhan et al., 1997). Thegeneral form of this temperature profile is shown inEq.(9),
T = T0 − 10 ln
[1 − t/tfinal(1 − d−�T/10)
ln d
](9)
whereT is the temperature at timet, T0 the initial tem-perature,tfinal the experiment duration,�T the temper-ature range of the experiment andd is a factor between1 and 4. Thed-factor is based on the activation en-ergy for the process, with higherd-values indicated forhigher activation energies. If the activation energy isn rea-s . Onec -a e).T tinge aturew ectt ex-p oo mo
�
x
wheret is the time for the individual pull points,k′ isthe rate constant at temperatureT′ (k′ is determined aspart of the fitting program) andλ is a fitted parameterequal toEa/R. Solving this equation requires assigninga temperature for which a rate is desired (e.g., 25◦C),assuming a value forλ, numerically solving the integral(e.g., by Simpson’s integration) at each time point, thenperforming a linear, least squares fit of the data (i.e.,�c versus the integral). This is iterated over values ofλ until the best correlation is achieved.
Non-isothermal aging allows for samples to experi-ence effectively many temperature/time points from asingle oven by pulling samples at multiple time pointsduring a heat cycle. The disadvantage of this approachis that an oven is dedicated to a single experimentalset for the duration of a program. This in turn requiresa multitude of ovens for multiple concurrent stabilityprograms.
2.4. Humidity
Humidity can have a significant effect on solid drugsubstances or drug products, even for reactions whichthemselves do not involve water. Among the effects arechanges in the drug form (such as hydrate formation)and plasticization (dissolution) of drug or excipients.Plasticization, where water acts to lower the glass tran-sition of a material, can lead to a significant increasein mobility and corresponding reactivity in solidd icalc ) arer hant thes ict ity( ityo ingi thes hichi nei e airf thea iv-i thisr gha lates an
ot known, exponential heating can still provide aonable process for conducting accelerated agingan assume a value of 2 ford (i.e., doubling the rection rate with every 10◦C increase in temperaturhe data from an exponential, non-isothermal heaxperiment can then be analyzed replacing temperith an integral of the temperature profile with resp
o time. Arrhenius kinetics, for example, can beressed as shown in Eqs.(10) and (11)(assuming zerrder kinetics and ad-factor for the heating prograf 2).
c = k′t∫0
exp
[λ
(1
T ′ − 1
x(t)
)]dt (10)
(t) = T ′ − 14.43 ln
[1 − t
tfinal(1 − 2−�T/10)
](11)
osage forms. The role of moisture in causing physhanges (as well as its role as a reactive specieselated to the water activity of the system rather the moisture content of either the dosage form orurrounding air. Water activity is a thermodynamerm referring to the equilibrium relative humidERH) over a sample. At equilibrium, the water activf a sample is equal to the ERH of the air surround
t. ERH represents the moisture content relative toaturated moisture content at that temperature, ws defined as ERH = 100% (water activity = 1). As oncreases temperature, the amount of water in thor a given relative humidity increases; however,ctivity of the water, that is its ability to affect react
ty, permeation and plasticization, depends only onelative humidity, not the absolute humidity. Thouccelerated aging predictions will generally correignificantly better using ERH (water activity) th

K.C. Waterman, R.C. Adami / International Journal of Pharmaceutics 293 (2005) 101–125 107
with total water content in the dosage form or absolutehumidity in the environment (Heidemann and Jarosz,1991), correlations are sometimes seen betweenwater content and drug stability using the Carstensenequation (see for exampleMatsunaga et al., 1993). Inthis report, a plot of the logarithm of the degradationrate versus the logarithm of the water content is linearwith the slope being an interaction term between watercontent and reaction rate (Carstensen et al., 1966).In reality, drug product water content will directlycorrelate with the degradation rate only when the watercontent correlates directly with the water activity.This lack of correlation can be seen, for example,with a lyophile of vecuronium bromide where thedegradation rate correlated with the water activitybut only roughly with water content (especially whencomparing different formulations) (Vromans andSchalks, 1994). Since water activity is in principlefeasible to measure, this would be the preferredmethod; especially until a correlation between wateractivity and water content is established.
For solid samples open to the environment (e.g.,open bottles in stability chambers), the ERH will equalthe RH of the chamber. For packaged systems, trans-port of moisture to the dosage form (or formulation)can be rate limiting. Water activity in the package willdepend on the amount of initial water associated witheach component, the initial packaging relative humid-ity, the relative vapor sorptions of the drug and var-ious excipients, as predicted using the SDMT model( -m rnale qui-l tera essh thec ex-ca anb eas-i as-ia portl thew x-a watera rugo of a
fixed concentration of water as temperature increases(decreased relative humidity for the same absolute hu-midity). One method of studying the change in wateractivity in closed systems, as a function of temperatureis to use small, self-contained, battery operated humid-ity meters (such as those produced by Microtek Cor-poration). These meters can be packaged into bottleswith a dosage form, stored over extended periods, andthen removed. Upon removal, the thermal and humidityhistory can be downloaded directly onto a computer.
Even in liquid dosage forms, water activity can af-fect reaction kinetics. The water activity of aqueoussolutions is affected by the overall concentration ofspecies in solution. Since this water activity can changewith temperature (based on solubility changes), reac-tion rates can be affected in a non-Arrhenius fashion.Though not reported in the pharmaceutical literature,we would suggest that it should be possible, by mea-suring water activity as a function of temperature, toexplicitly correct for the water activity changes in ac-celerated aging studies.
In conducting accelerated aging studies on solidsamples, it is important to know how high in relativehumidity one should go before the rates become non-predictive for extrapolation to relevant relative humidi-ties. This can be done by first determining the criticalrelative humidity (CRH) of a system (Kontny andZografi, 1995), that is, the relative humidity abovewhich moisture will start to dissolve some of thecomponents in the formulation (deliquesce). Sincea s ist ings top auseb ille ingt willp iona onsa canb tionk
singca nc.,P theC teda sed
Zografi et al., 1988; Kontny, 1988), the water pereability of the package and the RH of the extenvironment. With more hygroscopic excipients, e
ibrium is often reached more slowly; that is, the wactivity can be lower within the package than with lygroscopic excipients present. This can result inounterintuitive situation where more hygroscopicipients stabilize moisture-sensitive drugs (Heidemannnd Jarosz, 1991). In contrast, some excipients cring moisture into closed packages thereby incr
ng the water activity (relative humidity) and decreng the drug stability (Patel et al., 1988). When doingccelerated aging predictions in such water-trans
imited systems, it is important to understand howater activity varies with different conditions. For emple, at higher temperatures in closed systems,ctivity can increase due to water desorption from dr excipients, or decrease due to the lower activity
mbient storage of formulations and dosage formypically below their CRH values, accelerated agtudies above this value will often not extrapolateroduct storage conditions. This is the case becelow the CRH, the water activity in the sample wquilibrate to the water activity in the air surround
he sample, while above the CRH, the sampleick up water to dissolve material until the solutctivity can match the surroundings. For conditibove the CRH, water vapor and heat transporte rate-limiting processes rather than the reacinetics themselves (Kontny and Zografi, 1985).
The CRH of a sample can be measured uommercial instrumentation such as AquaLab® waterctivity meters (available from Decagon Devices Iullman, WA). Another method of determiningRH for a drug or formulation is to prepare a saturaqueous slurry of the material. The ERH of a clo
108 K.C. Waterman, R.C. Adami / International Journal of Pharmaceutics 293 (2005) 101–125
system over the slurry will equal the CRH. When usinga formulation, as opposed to a drug alone, care must betaken that no single component is below its saturationpoint. A technique that provides similar values but canbe carried out with smaller sample volumes and shorterrun times is isothermal microcalorimetry (Jacobsen etal., 1997). Another indirect technique especially usefulfor mixtures of solids involves extrapolating the watersorption rate of the material as a function of high rela-tive humidities back to a zero sorption rate (Kontny andZografi, 1985). Any of these techniques can also be ap-plied to determine the CRH at different temperatures.It should be noted that solubility changes as a functionof temperature can lead to significant changes in theCRH value of a system as the temperature changes.
Solid formulations can be homogeneous (for ex-ample, some lyophiles), or more commonly, heteroge-neous. When all components of a formulation interactonly minimally, one would anticipate that the highestrelative humidity appropriate for use in accelerated ag-ing would be the CRH equal to that of the lowest valuefor the individual components or even just that for thedrug alone. As an aid to determining the maximum pre-dictive storage humidity for accelerated aging of soliddosage forms, the CRH values for a number of com-mon pharmaceutical excipients are listed inTable 2.For chemically interacting components, CRH valuescan be estimated as the product of the individual CRHvalues (expressed as fractions) (Ross, 1975).
Once the CRH is determined, various humidities be-l thed vityo pre-d hlym fer-e RH.K ofp ta nt thed canb d inT id-i
pi-e faceo igh-e
Table 2Critical relative humidity values for a number of common excipients(Waterman and MacDonald, unpublished data)
Excipient CRH (%)at 20◦C
CRH (%)at 40◦C
Dextrose 100 88Fructose 72 64Lactose 100 100Mannitol 100 100Sorbitol 80 69Sucrose 86 83Xylitol 91 73Ascorbic acid 100 98Fumaric acid 100 100Tartaric acid 84.5 78Calcium chloride 29 21Potassium chloride 84 82Potassium sulfate 97 97Sodium chloride 75 75Sodium citrate 60.5 78Hydroxypropylcellulose 100 100Polyethylene glycol (3350) 94 85Polyvinylpyrollidone 100 100Hydroxypropylmethyl cellulose 100 100Polyethylene oxide 100 96Sodium carboxymethylcellulose 84 83.5Hydroxyethyl cellulose 93 91Pluronic F127 96 99Pluronic F87 88 92.5
The importance of this effect on a given system will de-pend on a number of properties of the material includ-ing solubility, surface area and presence of defects andamorphous regions. This effect can account for somehighly humidity dependent processes even for samplesstudied below their CRH values.
For a range of solid formulations below the CRH,the effect of relative humidity on the Arrhenius behav-
Table 3Salts for control of relative humidity in accelerated aging studies(Marsh, 1987; ASTM, 1991; Greenspan, 1977)
Salt % Relative humidity over slurry atindicated temperature
20◦C 30◦C 40◦C 50◦C 70◦C
LiCl 11.3 11.3 11.2 11.1 10.8MgCl2 33.1 32.4 31.6 30.5 27.8K2CO3 43.2 43.2Mg(NO3)2 54.4 51.4 48.4 45.4NaCl 75.3 75.1KCl 85.1 83.6 82.3 81.2 79.2K2SO4 97.9 97.0 96.4 95.8
ow the CRH can be examined for their effect onrug degradant formation rate. Knowing the sensitif a system to the RH can help in making accurateictions to ambient conditions. For example, a higoisture sensitive drug product can show very difnt 20◦C degradation rates at 20% RH versus 60%nowing this sensitivity can also help in the designackaging or justify the use of desiccants (Badawy el., 2001). Allowing free equilibration of a formulatio
o a range of controlled RH environments permitsetermination of the RH sensitivity. Salt slurriese used to provide a range of humidities as listeable 3, or one can use commercially available hum
ty controlled chambers.Even below the CRH for a bulk drug or exci
nt, moisture can affect (partially dissolve) the surf particles, presumably due to the presence of hnergy molecules at the surface (Kontny et al., 1987).
K.C. Waterman, R.C. Adami / International Journal of Pharmaceutics 293 (2005) 101–125 109
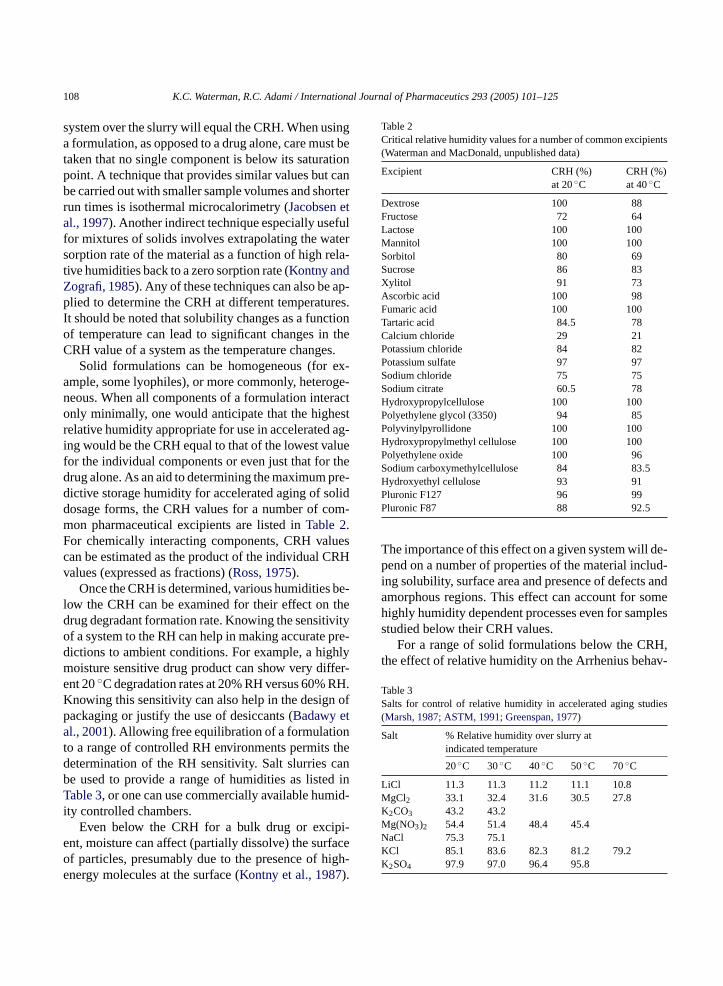
Fig. 1. Rate of formation of dehydroascorbic acid (k) from com-mercial Vitamin C tablets as a function of temperature and relativehumidity (Waterman, 2004).
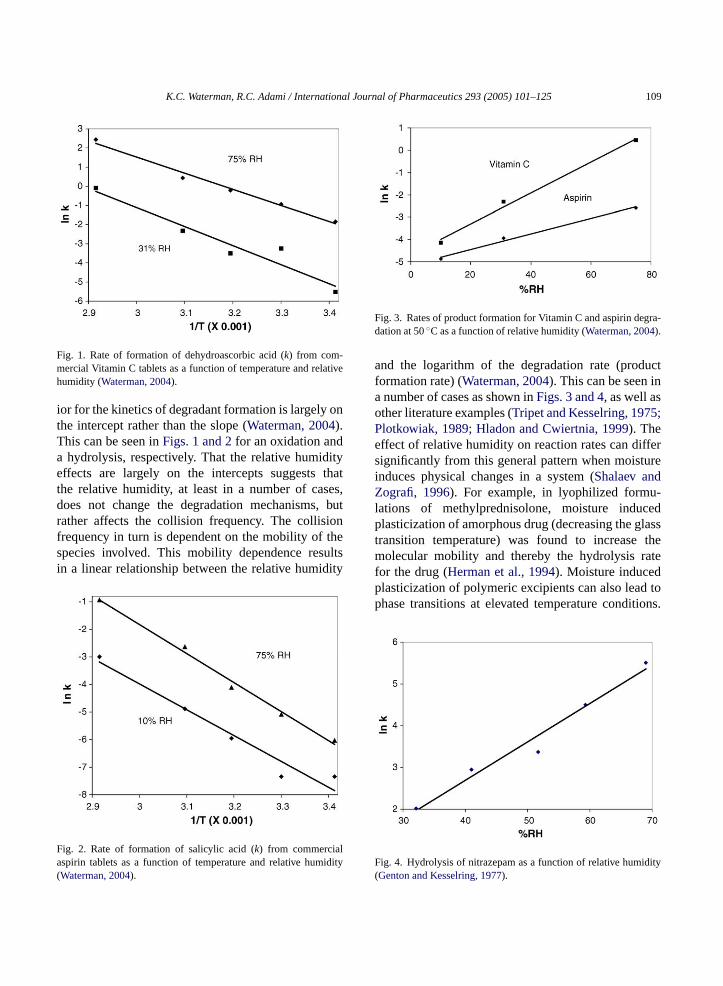
ior for the kinetics of degradant formation is largely onthe intercept rather than the slope (Waterman, 2004).This can be seen inFigs. 1 and 2for an oxidation anda hydrolysis, respectively. That the relative humidityeffects are largely on the intercepts suggests thatthe relative humidity, at least in a number of cases,does not change the degradation mechanisms, butrather affects the collision frequency. The collisionfrequency in turn is dependent on the mobility of thespecies involved. This mobility dependence resultsin a linear relationship between the relative humidity
Fig. 2. Rate of formation of salicylic acid (k) from commercialaspirin tablets as a function of temperature and relative humidity(
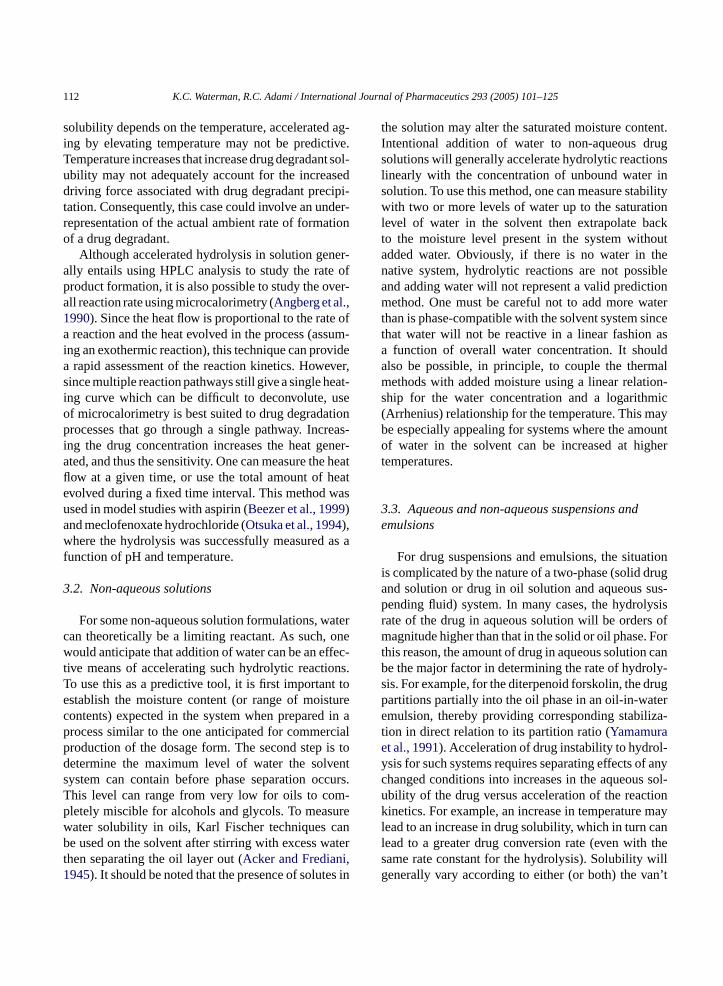
Fig. 3. Rates of product formation for Vitamin C and aspirin degra-dation at 50◦C as a function of relative humidity (Waterman, 2004).
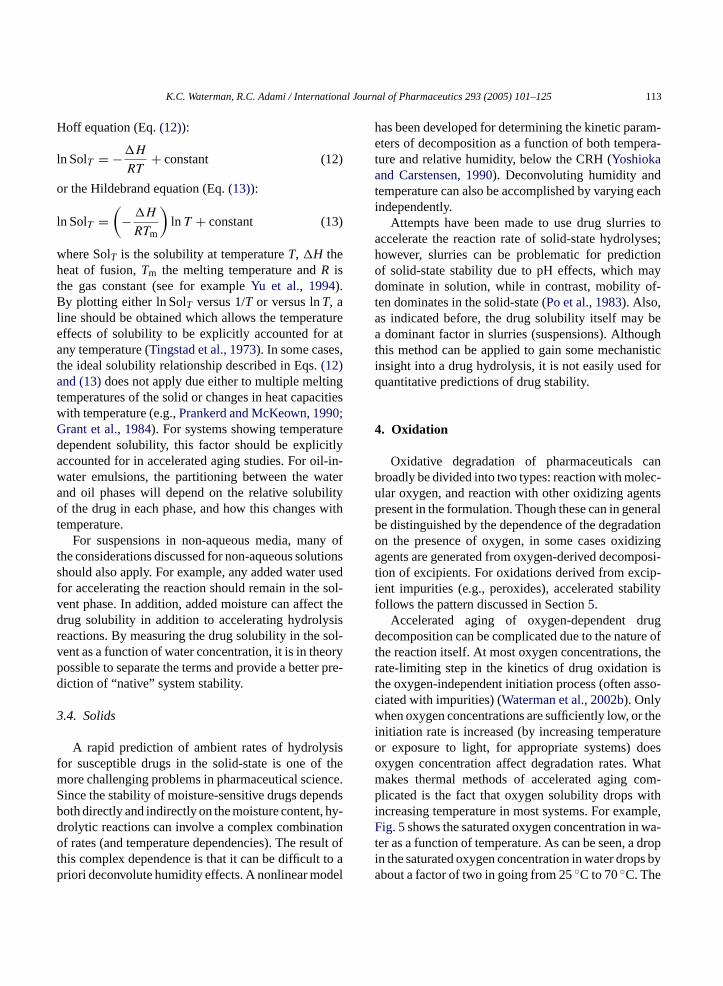
and the logarithm of the degradation rate (productformation rate) (Waterman, 2004). This can be seen ina number of cases as shown inFigs. 3 and 4, as well asother literature examples (Tripet and Kesselring, 1975;Plotkowiak, 1989; Hladon and Cwiertnia, 1999). Theeffect of relative humidity on reaction rates can differsignificantly from this general pattern when moistureinduces physical changes in a system (Shalaev andZografi, 1996). For example, in lyophilized formu-lations of methylprednisolone, moisture inducedplasticization of amorphous drug (decreasing the glasstransition temperature) was found to increase themolecular mobility and thereby the hydrolysis ratefor the drug (Herman et al., 1994). Moisture inducedplasticization of polymeric excipients can also lead tophase transitions at elevated temperature conditions.
F dity(
Waterman, 2004).ig. 4. Hydrolysis of nitrazepam as a function of relative humiGenton and Kesselring, 1977).

110 K.C. Waterman, R.C. Adami / International Journal of Pharmaceutics 293 (2005) 101–125
Such transitions can provide non-predictive stabilityin extrapolations to lower temperatures. For example,elevated temperature aging combined with highhumidity resulted in exceeding the glass transitiontemperature of the excipient polyvinylpyrrolidone in atablet formulation, which did not transfer to conditionsbelow that temperature/humidity, and were thereforenon-predictive (Fitzpatrick et al., 2002). In some casesthe mobility increase due to moisture and temperaturecan allow a drug to react with an excipient that it other-wise might remain separated from and unreactive. Forexample, reaction of ibuprofen with bases in the solidstate was found to be highly moisture sensitive (Byrnet al., 2001). In each of these cases, high humidity con-ditions caused an overestimate of the rate of degradantformation from the rate actually observed at ambienthumidities.
When accelerated conditions of humidity and tem-perature are used with drugs, formulations and dosageforms, caution must be observed that there are no formchanges across the conditions used. In some cases, dif-ferential scanning calorimetry (DSC) or other calori-metric techniques can be useful to study temperatureeffects, though coupling humidity effects may requirespecialized instrumentation. For the drug, hydration ordehydration can result in the formation of new crystalstructures or loss of crystallinity, both of which can re-sult in a change in stability. Importantly, these changesmay only occur under accelerated conditions and there-fore be non-predictive of issues under ambient condi-t atero ent tion( terh on-v hu-m
odsf ings ut an ech-a
3
m-m .,
2002a). In addition to rate dependencies on the tem-perature and moisture, hydrolysis rates can depend onthe concentration of catalytic species, usually acids orbases. With many hydrolytic reactions, such as thoseinvolving esters and aryl carbamates, the reactions arereversible, i.e., degradation products can react to re-form the drug (March, 1992). The result is that at highdrug conversions, the reaction rate may slow due toaccumulation of product; i.e., the back reaction be-comes significant as the products accumulate in anapproach to equilibrium. It is therefore generally ad-visable, for purposes of predicting drug stability, toonly carry reactions out to low conversions (forma-tion of less than 10% of a degradant, or more prefer-ably, less than 2% of a degradant). Unfortunately,even with low drug conversions, the reaction may stillapproach an equilibrium value; that is, a 10% con-version could represent complete reaction. Althoughin theory one could measure the forward and back-ward reaction rate constants, in practice, most oftenconversions are limited to levels consistent with theexpiry-limiting degradant level (generally below 1%).In solid systems, local high product concentrationscan result in product accumulation effects even withlow overall conversions. Without the diluting effectof the solvent, the equilibrium position of a hydrol-ysis can shift to the starting material. The overall re-sult can be that a hydrolysis that goes to high con-versions in solution (where the drug product is diluteand shifts the equilibrium to the product direction)g theh to-w mayb odelt lowc eret eac-t or-d iso re-a ilib-r be-t Ane ticr Witht samei pHe
ions. For example, cefixime trihydrate loses its wf crystallization, first to give a disordered crystal, th
o give amorphous material upon further dehydraKitamura et al., 1990). These changes result in greaydrolysis rates under low humidity, where drug certs to a less stable amorphous form, than at highidity, where crystals remain intact.While in the preceding sections, general meth
or accelerated aging were reviewed, in the followections, more specific discussion is included aboumber of common pharmaceutical degradation mnisms.
. Hydrolysis
Hydrolytic reactions are among the most coon processes for drug degradation (Waterman et al
oes only to low conversions in the solid (whereigh product concentrations shift the equilibriumards the reactants). Under these conditions, ite necessary to use a more complex kinetic m
han the zero-order approximation discussed foronversions. More specifically, under conditions whhe back reaction becomes significant, the back rion’s dependence will be second order (i.e., firster in each product), while the forward reactionnly first order in drug. This second order backction explains the high dependence of the equium position (which represents the competitionween the two rates) on the drug concentration.xception to this is with internally cleaved hydrolyeactions as seen with lactones and lactams.hese species, the extent of reaction remains then solid and solution, assuming similar effectivenvironments.

K.C. Waterman, R.C. Adami / International Journal of Pharmaceutics 293 (2005) 101–125 111
3.1. Aqueous solutions
For many aqueous drug solutions, pH-stabilityprofiles are generated to determine the pH of maxi-mum stability (Carstensen, 2000). Using a pH wherea drug is unstable to predict quantitatively howfast a degradant will form at a pH where the drugis more stable requires fitting the pH profile to atypically parabolic curve shape, then extrapolatingto the desired pH. In some cases, such an analysiscan provide an understanding of mechanistic factorsinvolved in the degradant formation. For example,4-dedimethylaminosancycline was studied over a pHrange of 2–10, with such results able to be rationalizedin terms of the degradation of various ionized forms andbase catalysis (Pinsuwan et al., 1999). Because of thesensitivity to catalysis, however, pH rate profiles caninvolve discontinuities, which can lead to erroneouspredictions (Mirrlees and Taylor, 1994). In addition,since many aqueous drug solutions are buffered, in-tentionally changing the pH for accelerated aging willrequire exceeding a buffer capacity, which increasesionic strength, another factor in the rate of some drugdegradation.
Products of hydrolysis can sometimes affect the hy-drolysis rate itself by catalyzing further drug degrada-tion, usually in unbuffered systems. For example, esterdrugs can hydrolyze to give acidic products, therebylowering the pH of the solution once the buffer capac-ity is exceeded. This was seen, for example with thed ei rseo stedi tom ingo velso
be-t romc sucha tion,f onea avilyo rvedw -v cc mi ast
in some cases. For example, shifts in pH with tem-perature may result in a product formation, which willdisappear when the temperature is reduced. The analyt-ical results can therefore depend on whether samplesare monitored in situ or worked up back at ambienttemperatures.
In some cases the drug itself can act as a catalystin its own decomposition such that the reaction kinet-ics will depend on the drug concentration. This hasbeen observed with ceftazidime, which acts as a gen-eral base in catalyzing its own hydrolysis (Fubara andNotari, 1998). This example emphasizes both the im-portance of using drug concentrations similar to thoseof the ultimate drug product and again of carrying outreactions to only low conversions.
Although the solution pH generally has a significantimpact on drug hydrolyses, one should also note thatgeneral acid or base catalysis (buffer catalysis) canalso be significant (Carstensen, 2000). Generally, theimplications of this are that buffer concentrationsmust be carefully controlled during acceleratedaging studies to assure predictive results, thoughmathematical models have been developed that canhelp interpret pH and buffer catalysis for stability(Can der Houwen et al., 1994). Such models can allowspecifications to be set on catalysts levels for suchproducts.
Temperature changes during accelerated aging canalter solution pH, leading to non-Arrhenius behavior(Newton and Miller, 1987). It is therefore useful to mea-s anget onec rvedc lpiesfs n suc-c d itsgv eta iush
s ins ra-d thatp ro-c ivelys canb dant
rug lonapalene (Powell et al., 1988). In this case, thnitial pH dropped from 6–7 to 4–5 during the couf the reaction. Since we are generally most intere
n the formation of drug degradants, it is possibleinimize the effect of such pH changes by carryut accelerated aging only to produce only low lef such products.
For reversible drug hydrolysis, re-equilibrationween the drug and its hydrolyzed form can result fhanges to the system external to the drug itself,s a change in pH or co-solvent ratio (by evapora
or example). For example, equilibria between lactnd ring-opened acid moieties on drugs depend hen pH and the presence of co-solvents as is obseith canrenoic acid (Garrett and Won, 1971) and atorastatin (Kearney et al., 1993). This thermodynamiontrol of drug degradant formation is different frorreversible reactivity controlled by catalysis, at le
ure the solution pH over the desired temperature ro assure the pH remains constant. Alternatively,ould use a computer model that simulates obsehanges in pH with temperature based on enthaor dissociation (Kipp and Schuck, 1995). Without pHhifts, high temperature accelerated aging has beeessful as seen, for example, with indomethacin anlycolamide ester (Arrhenius hydrolysis up to 70◦C inarious buffer solutions (Chiba et al., 1992; Kahnsl., 1989)) and adenosine triphosphate, ATP (Arrhenydrolysis up to 80◦C (Seki and Hayashi, 1982)).
When carrying out accelerated aging processeolution, it is important to distinguish between degation products that remain in solution and thoserecipitate from the solution, at least for reversible pesses. In the former case, the kinetics are relattraightforward; however, in the latter case, mattersecome quite complex. For example, if the degra
112 K.C. Waterman, R.C. Adami / International Journal of Pharmaceutics 293 (2005) 101–125
solubility depends on the temperature, accelerated ag-ing by elevating temperature may not be predictive.Temperature increases that increase drug degradant sol-ubility may not adequately account for the increaseddriving force associated with drug degradant precipi-tation. Consequently, this case could involve an under-representation of the actual ambient rate of formationof a drug degradant.
Although accelerated hydrolysis in solution gener-ally entails using HPLC analysis to study the rate ofproduct formation, it is also possible to study the over-all reaction rate using microcalorimetry (Angberg et al.,1990). Since the heat flow is proportional to the rate ofa reaction and the heat evolved in the process (assum-ing an exothermic reaction), this technique can providea rapid assessment of the reaction kinetics. However,since multiple reaction pathways still give a single heat-ing curve which can be difficult to deconvolute, useof microcalorimetry is best suited to drug degradationprocesses that go through a single pathway. Increas-ing the drug concentration increases the heat gener-ated, and thus the sensitivity. One can measure the heatflow at a given time, or use the total amount of heatevolved during a fixed time interval. This method wasused in model studies with aspirin (Beezer et al., 1999)and meclofenoxate hydrochloride (Otsuka et al., 1994),where the hydrolysis was successfully measured as afunction of pH and temperature.
3.2. Non-aqueous solutions
aterc onew fec-t ons.T t toe turec in ap rcialp is tod ents curs.T m-p urew anb atert i,1 s in
the solution may alter the saturated moisture content.Intentional addition of water to non-aqueous drugsolutions will generally accelerate hydrolytic reactionslinearly with the concentration of unbound water insolution. To use this method, one can measure stabilitywith two or more levels of water up to the saturationlevel of water in the solvent then extrapolate backto the moisture level present in the system withoutadded water. Obviously, if there is no water in thenative system, hydrolytic reactions are not possibleand adding water will not represent a valid predictionmethod. One must be careful not to add more waterthan is phase-compatible with the solvent system sincethat water will not be reactive in a linear fashion asa function of overall water concentration. It shouldalso be possible, in principle, to couple the thermalmethods with added moisture using a linear relation-ship for the water concentration and a logarithmic(Arrhenius) relationship for the temperature. This maybe especially appealing for systems where the amountof water in the solvent can be increased at highertemperatures.
3.3. Aqueous and non-aqueous suspensions andemulsions
For drug suspensions and emulsions, the situationis complicated by the nature of a two-phase (solid drugand solution or drug in oil solution and aqueous sus-p ysisr s ofm Fort canb ly-s rugp tere iza-te l-y f anyc sol-u tionk mayl canl thes willg n’t
For some non-aqueous solution formulations, wan theoretically be a limiting reactant. As such,ould anticipate that addition of water can be an ef
ive means of accelerating such hydrolytic reactio use this as a predictive tool, it is first importanstablish the moisture content (or range of moisontents) expected in the system when preparedrocess similar to the one anticipated for commeroduction of the dosage form. The second stepetermine the maximum level of water the solvystem can contain before phase separation ochis level can range from very low for oils to coletely miscible for alcohols and glycols. To measater solubility in oils, Karl Fischer techniques ce used on the solvent after stirring with excess w
hen separating the oil layer out (Acker and Fredian945). It should be noted that the presence of solute
ending fluid) system. In many cases, the hydrolate of the drug in aqueous solution will be orderagnitude higher than that in the solid or oil phase.
his reason, the amount of drug in aqueous solutione the major factor in determining the rate of hydrois. For example, for the diterpenoid forskolin, the dartitions partially into the oil phase in an oil-in-wamulsion, thereby providing corresponding stabil
ion in direct relation to its partition ratio (Yamamurat al., 1991). Acceleration of drug instability to hydrosis for such systems requires separating effects ohanged conditions into increases in the aqueousbility of the drug versus acceleration of the reacinetics. For example, an increase in temperatureead to an increase in drug solubility, which in turnead to a greater drug conversion rate (even withame rate constant for the hydrolysis). Solubilityenerally vary according to either (or both) the va
K.C. Waterman, R.C. Adami / International Journal of Pharmaceutics 293 (2005) 101–125 113
Hoff equation (Eq.(12)):
ln SolT = −�H
RT+ constant (12)
or the Hildebrand equation (Eq.(13)):
ln SolT =(
− �H
RTm
)ln T + constant (13)
where SolT is the solubility at temperatureT, �H theheat of fusion,Tm the melting temperature andR isthe gas constant (see for exampleYu et al., 1994).By plotting either ln SolT versus 1/T or versus lnT, aline should be obtained which allows the temperatureeffects of solubility to be explicitly accounted for atany temperature (Tingstad et al., 1973). In some cases,the ideal solubility relationship described in Eqs.(12)and (13)does not apply due either to multiple meltingtemperatures of the solid or changes in heat capacitieswith temperature (e.g.,Prankerd and McKeown, 1990;Grant et al., 1984). For systems showing temperaturedependent solubility, this factor should be explicitlyaccounted for in accelerated aging studies. For oil-in-water emulsions, the partitioning between the waterand oil phases will depend on the relative solubilityof the drug in each phase, and how this changes withtemperature.
For suspensions in non-aqueous media, many ofthe considerations discussed for non-aqueous solutionsshould also apply. For example, any added water usedfor accelerating the reaction should remain in the sol-v t thed sisr sol-v oryp r pre-d
3
sisf them nce.S ndsb hy-d iono ult oft to ap del
has been developed for determining the kinetic param-eters of decomposition as a function of both tempera-ture and relative humidity, below the CRH (Yoshiokaand Carstensen, 1990). Deconvoluting humidity andtemperature can also be accomplished by varying eachindependently.
Attempts have been made to use drug slurries toaccelerate the reaction rate of solid-state hydrolyses;however, slurries can be problematic for predictionof solid-state stability due to pH effects, which maydominate in solution, while in contrast, mobility of-ten dominates in the solid-state (Po et al., 1983). Also,as indicated before, the drug solubility itself may bea dominant factor in slurries (suspensions). Althoughthis method can be applied to gain some mechanisticinsight into a drug hydrolysis, it is not easily used forquantitative predictions of drug stability.
4. Oxidation
Oxidative degradation of pharmaceuticals canbroadly be divided into two types: reaction with molec-ular oxygen, and reaction with other oxidizing agentspresent in the formulation. Though these can in generalbe distinguished by the dependence of the degradationon the presence of oxygen, in some cases oxidizingagents are generated from oxygen-derived decomposi-tion of excipients. For oxidations derived from excip-ient impurities (e.g., peroxides), accelerated stabilityf
rugd re oft ther ist sso-cw thei tureo oeso hatm om-p ithi ple,F wa-t dropi s bya
ent phase. In addition, added moisture can affecrug solubility in addition to accelerating hydrolyeactions. By measuring the drug solubility in theent as a function of water concentration, it is in theossible to separate the terms and provide a betteiction of “native” system stability.
.4. Solids
A rapid prediction of ambient rates of hydrolyor susceptible drugs in the solid-state is one ofore challenging problems in pharmaceutical scieince the stability of moisture-sensitive drugs depeoth directly and indirectly on the moisture content,rolytic reactions can involve a complex combinatf rates (and temperature dependencies). The res
his complex dependence is that it can be difficultriori deconvolute humidity effects. A nonlinear mo
ollows the pattern discussed in Section5.Accelerated aging of oxygen-dependent d
ecomposition can be complicated due to the natuhe reaction itself. At most oxygen concentrations,ate-limiting step in the kinetics of drug oxidationhe oxygen-independent initiation process (often aiated with impurities) (Waterman et al., 2002b). Onlyhen oxygen concentrations are sufficiently low, or
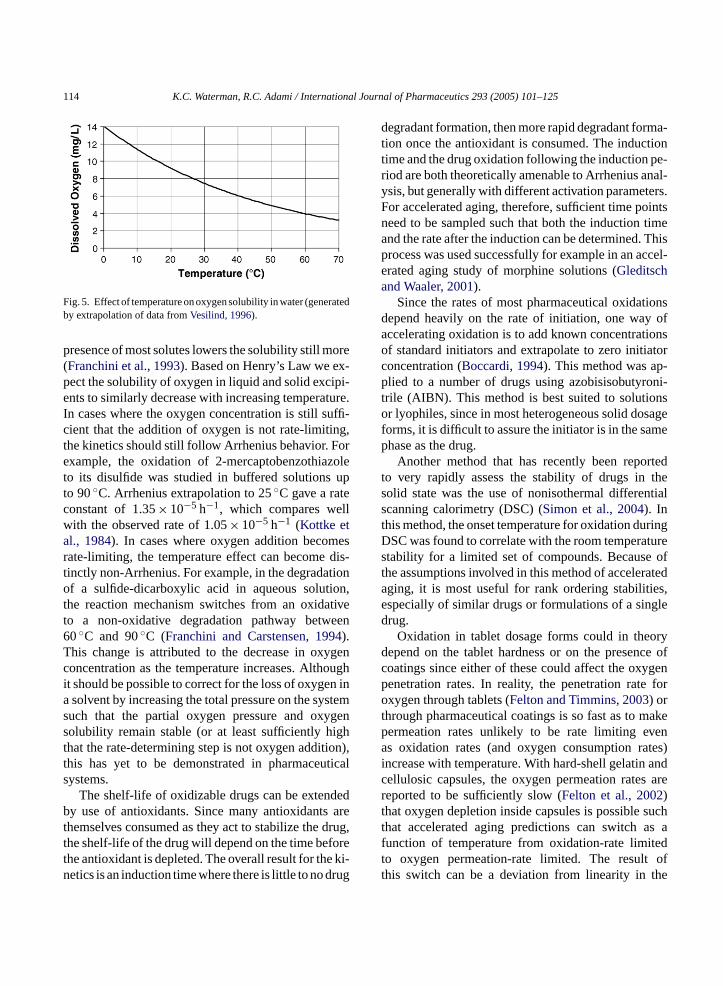
nitiation rate is increased (by increasing temperar exposure to light, for appropriate systems) dxygen concentration affect degradation rates. Wakes thermal methods of accelerated aging clicated is the fact that oxygen solubility drops w
ncreasing temperature in most systems. For examig. 5shows the saturated oxygen concentration in
er as a function of temperature. As can be seen, an the saturated oxygen concentration in water dropbout a factor of two in going from 25◦C to 70◦C. The
114 K.C. Waterman, R.C. Adami / International Journal of Pharmaceutics 293 (2005) 101–125
Fig. 5. Effect of temperature on oxygen solubility in water (generatedby extrapolation of data fromVesilind, 1996).
presence of most solutes lowers the solubility still more(Franchini et al., 1993). Based on Henry’s Law we ex-pect the solubility of oxygen in liquid and solid excipi-ents to similarly decrease with increasing temperature.In cases where the oxygen concentration is still suffi-cient that the addition of oxygen is not rate-limiting,the kinetics should still follow Arrhenius behavior. Forexample, the oxidation of 2-mercaptobenzothiazoleto its disulfide was studied in buffered solutions upto 90◦C. Arrhenius extrapolation to 25◦C gave a rateconstant of 1.35× 10⁻⁵ h−1, which compares wellwith the observed rate of 1.05× 10⁻⁵ h−1 (Kottke etal., 1984). In cases where oxygen addition becomesrate-limiting, the temperature effect can become dis-tinctly non-Arrhenius. For example, in the degradationof a sulfide-dicarboxylic acid in aqueous solution,the reaction mechanism switches from an oxidativeto a non-oxidative degradation pathway between60◦C and 90◦C (Franchini and Carstensen, 1994).This change is attributed to the decrease in oxygenconcentration as the temperature increases. Althoughit should be possible to correct for the loss of oxygen ina solvent by increasing the total pressure on the systemsuch that the partial oxygen pressure and oxygensolubility remain stable (or at least sufficiently highthat the rate-determining step is not oxygen addition),this has yet to be demonstrated in pharmaceuticalsystems.
The shelf-life of oxidizable drugs can be extendedby use of antioxidants. Since many antioxidants aret drug,t oret ki-n rug
degradant formation, then more rapid degradant forma-tion once the antioxidant is consumed. The inductiontime and the drug oxidation following the induction pe-riod are both theoretically amenable to Arrhenius anal-ysis, but generally with different activation parameters.For accelerated aging, therefore, sufficient time pointsneed to be sampled such that both the induction timeand the rate after the induction can be determined. Thisprocess was used successfully for example in an accel-erated aging study of morphine solutions (Gleditschand Waaler, 2001).
Since the rates of most pharmaceutical oxidationsdepend heavily on the rate of initiation, one way ofaccelerating oxidation is to add known concentrationsof standard initiators and extrapolate to zero initiatorconcentration (Boccardi, 1994). This method was ap-plied to a number of drugs using azobisisobutyroni-trile (AIBN). This method is best suited to solutionsor lyophiles, since in most heterogeneous solid dosageforms, it is difficult to assure the initiator is in the samephase as the drug.
Another method that has recently been reportedto very rapidly assess the stability of drugs in thesolid state was the use of nonisothermal differentialscanning calorimetry (DSC) (Simon et al., 2004). Inthis method, the onset temperature for oxidation duringDSC was found to correlate with the room temperaturestability for a limited set of compounds. Because ofthe assumptions involved in this method of acceleratedaging, it is most useful for rank ordering stabilities,e gled
oryd ce ofc genp forot akep ena tes)i andc arert sucht as af edt oft he
hemselves consumed as they act to stabilize thehe shelf-life of the drug will depend on the time befhe antioxidant is depleted. The overall result for theetics is an induction time where there is little to no d
specially of similar drugs or formulations of a sinrug.
Oxidation in tablet dosage forms could in theepend on the tablet hardness or on the presenoatings since either of these could affect the oxyenetration rates. In reality, the penetration ratexygen through tablets (Felton and Timmins, 2003) or
hrough pharmaceutical coatings is so fast as to mermeation rates unlikely to be rate limiting evs oxidation rates (and oxygen consumption ra
ncrease with temperature. With hard-shell gelatinellulosic capsules, the oxygen permeation rateseported to be sufficiently slow (Felton et al., 2002)hat oxygen depletion inside capsules is possiblehat accelerated aging predictions can switchunction of temperature from oxidation-rate limito oxygen permeation-rate limited. The resulthis switch can be a deviation from linearity in t

K.C. Waterman, R.C. Adami / International Journal of Pharmaceutics 293 (2005) 101–125 115
Arrhenius plot with high temperature extrapolationsunderestimating the drug degradant formation rate.
5. Reaction with excipients
Reactivity of drugs with excipients (including co-solvents, sugars or stabilizers) often involve reactionof nucleophilic drugs (e.g., amines, sulfides and phe-nols) with electrophilic excipients (e.g., esters), or elec-trophilic drugs (e.g., carboxylic acids, esters, amidesand alkyl halides) with nucleophilic excipients (e.g.,alcohols). Assuming the reactive excipient is presentin molar excess, many of the reactions with drugs willdepend linearly on the excipient concentration (pseudo-first order kinetics). In solutions, this can be used toaccurately accelerate such reactions by extrapolatingreaction rates as a function of the reactive excipientconcentration back to the planned formulation excipi-ent concentration.
One of the most common reactions observed be-tween drugs and excipients is the reaction of primaryand secondary amine drugs with reducing carbohydrateexcipients. Reducing carbohydrates include lactose,fructose, dextrose, glucose and maltose. Non-reducingcarbohydrates include mannitol, sucrose and trehalose.This reaction is known as the Maillard reaction and isoften observed as a brown color formation in dosageforms (Kumar and Banker, 1994). Although salts ofamine drugs would be expected to be less reactive thanf otone ini-t hlo-r itha cingse re-a po-s iplep olorf anyp me-d le toc low-i ctsa ratec ters,i ture
rates for degradant formation. In the case of fluoxitineand lactose, this type of analysis was able to predictthe time to reach 0.1% total degradants at room tem-perature based on extrapolation from temperatures of75–95◦C (Wirth et al., 1998). When the intermediateis not detectable, one may be forced to follow loss ofstarting drug, a less sensitive indication of stability asdiscussed in the introduction. In some cases, the forma-tion of the brown color itself can be used as an assay fordegradation (using reflection spectroscopy for solids)(see for examplePellerin et al., 1971).
Excipient impurities and degradants, can react ei-ther directly with drugs or act as catalysts for otherdrug degradation processes, e.g., hydrolysis or oxida-tion (Waterman et al., 2003). A characteristic of drugdegradation by an excipient impurity (generally a lowmolecular weight electrophile (Waterman et al., 2003))is a limited extent of reaction based on the impuritylevel. This generally manifests itself as a rapid reac-tion rate that depends on the ratio of drug to excipient(lower drug concentration leads to a greater extent ofreaction) followed by slower degradation (often by adifferent pathway). Even in the early stages of formu-lation development, examining drug stability at severalratios of drug to excipient can provide clues as to thesensitivity of a drug to excipient impurity levels. Whatmakes this problem particularly insidious is that theexcipient impurity level may vary from lot to lot orvendor to vendor. In particular, peroxides (especiallyhydrogen peroxide (Huang et al., 2003)), small alde-h mplew lc atei p tos lowm lowd ls ofd sor-b eactw tion( ton cipi-e apidr po-l heni ly al erms
ree amine bases, there is generally sufficient prxchange, most likely through trace moisture, toiate the reaction. For example, fluoxetine hydrocide was found to react in the Maillard reaction (wn Amadori rearrangement) with a number of reduugars with the reaction accelerated by moisture (Wirtht al., 1998). Accelerated aging studies of Maillardctions are often complicated by secondary decomition of drug-carbohydrate adducts, often to multroducts. The shelf-life can also be limited by the c
ormation itself rather than the absolute amount ofroduct formed in the degradation. When the interiate adduct is detectable, it is sometimes possibharacterize the drug degradation process by folng both loss of starting drug, and formation of addus a function of time and temperature. From theonstants and their respective activation paramet is sometimes possible to predict room tempera
ydes (especially formaldehyde, as seen for exaith polysorbate 80 (Chafetz et al., 1984)) and smalarboxylic acids (especially formic acid and formon) can be present in many excipients at levels ueveral hundred parts per million. Because of theolecular weight of these reactive impurities, forose formulations, unacceptable degradation leverug can occur. For example, formaldehyde in polyate 80 and PEG 300 were recently shown to rith an experimental drug in a parenteral formula
Nassar et al., 2004). Caution must also be observedot over-exaggerate a problem associated with exnt impurities. This can easily happen because of reaction of a drug with an impurity thereby extraating to a long-term unacceptable formulation, wn reality, the impurity may be consumed after onow extent of reaction resulting in adequate long-ttability.
116 K.C. Waterman, R.C. Adami / International Journal of Pharmaceutics 293 (2005) 101–125
Reaction of drugs with excipient degradationproducts can in many ways mimic the reaction ofdrugs with excipient impurities; however, while inthe latter case the impurity level will limit the extentof reaction, drug reaction in the former case willcontinue. Often, a reactive excipient degradant willshow a biphasic kinetic plot of drug degradation as afunction of time: an initial rapid reaction will occuras accumulated excipient degradant reacts with drugfollowed by a slower process limited by the rate of theexcipient degradant formation. These processes willshow a drug to excipient ratio dependence (lower drugconcentration gives faster reaction). Because of thebiphasic kinetics, the shelf-life of the drug (based onallowable levels of drug degradation or of formation ofa degradant) can easily be underestimated. To preventthis, it is desirable, whenever possible, to carry out ac-celerated aging studies under conditions that producedrug degradation or individual degradant formation toa greater extent than the allowable levels. One shouldespecially use caution when formulating with suchexcipients as polyethers and polyvinylpyrrolidone.For example, peroxide degradants of polyethyleneglycols were found to react with a steroid in a topicalformulation (McGinity et al., 1975). In this case,removal of the peroxides led to a decrease in initialreaction, though peroxides eventually reformed.Similarly, peroxides in povidone reacted with ralox-ifene to generate anN-oxide product (Hartauer etal., 2000). Removal of peroxide from the excipients ormf agec
cip-i cipi-e ther ionp sent( le inaC chv fac-t sta-b chc ene( ler-a ,2 e to
sublimation or evaporation, the rate of excipient degra-dation, and hence drug degradation, can accelerate dra-matically. The result from processes that have a limit-ing amount of a stabilizer is that initial drug degradantformation will be slow, and then increase as the sta-bilizer is consumed. If the stabilizer loss occurs at aphase transition, a non-Arrhenius temperature depen-dence can result; i.e., rapid degradation of the drugabove the phase transition. The above pitfalls empha-size the general advantages of understanding a drug’sdegradation mechanism when estimating the shelf-lifeof that drug in a formulation.
The most common catalytic impurities in excipientsare transition metals, acids or bases (Waterman et al.,2003). Metal contaminants are often associated withoxidation reactions (Waterman et al., 2002b; Hovorkaand Schoneich, 2001). Acid and base impurities are of-ten associated with hydrolyses (Waterman et al., 2002a)and cyclizations (e.g., lactone or lactam formation). Insolution, metal-catalyzed processes can be acceleratedby addition of known concentrations of the appropriatemetal salts (often copper or iron) and extrapolating therate of drug degradation back to measured or antici-pated metal concentrations as was done in the recentstudy of a drug candidate (Hong et al., 2004). In thesolid state, this is more difficult since the added metalsalts are not necessarily in the same chemical phase asthe reactive excipient and therefore are not necessarilyrepresentative of how the catalyst will affect a drug inthe corresponding dosage form.
6p
a-t tiono ivep od-u n theb g ora singSa -m andt etry( ellya
tabilized the drug, but peroxides eventually refrom oxidation of the povidone, depending on storonditions.
In some cases, the drug reactivity with an exent degradant can depend on the loss of an exnt stabilizer. In the case of polyethylene glycol,ate of peroxide formation resulting from an oxidatrocess depends on the level of antioxidants preadded by the manufacturer), as shown for exampstudy on extruded excipient (Crowley et al., 2002).areful monitoring of the antioxidant level, whiaries from lot to lot and depends on the manuurer, is crucial to successful prediction of ambientility when using such excipients. In addition, suommon antioxidants as butylated hydroxytoluBHT) can sublime out of a formulation under acceted aging (or processing conditions) (Dow Chemical003). When antioxidants are consumed or lost du
. Accelerated aging of proteinharmaceuticals
Whereas with small molecules, the rate of formion of reaction products is the most sensitive indicaf drug stability, with proteins, degradation to inactrotein does not always yield isolable reaction prcts. Consequently, proteins are often assayed oasis of activity or structure changes (e.g., unfoldinggregating). Chemical purity is usually assessed uDS-PAGE or capillary electrophoresis (Wiltfang etl., 1991; Hutterer and Dolnik, 2003). Structural inforation is often evaluated using circular dichroism,
he extent of folding is assessed using microcalorimCai and Dass, 2003; Keiderling and Xu, 2002; Knd Price, 2000; Boye et al., 1997).

K.C. Waterman, R.C. Adami / International Journal of Pharmaceutics 293 (2005) 101–125 117
Chemical degradation of proteins is often precededby a physical change in secondary, tertiary or evenquaternary structure. Some temperature-dependentstructural changes correspond to phase transitions,potentially detectable using DSC (Lyubarev andKurganov, 2001; Shnyrov and Zhadan, 2000; Cooperet al., 2001; Lopez and Makhatadze, 2002). Sinceit can be difficult to extrapolate to low temperaturesusing data above a phase transition, phase transitiontemperatures will often represent the upper limit ofusable temperatures for accelerated aging. Even belowa phase transition, the complexity of the structure ofproteins means that many degradation pathways are of-ten present which in some cases can result in deviationsfrom Arrhenius behavior. In spite of this, Arrheniusbehavior has been observed in both solid and solutionformulations of proteins (Yoshioka et al., 1994).
Some non-Arrhenius behavior can be accounted forby the observation that the most common degradationmechanism for proteins involves equilibration of thenative protein with an aggregation-prone intermediate(usually a denatured form of the protein) followedby irreversible protein degradation (aggregation)(Roberts, 2003). In this scenario, the overall proteindegradation rate depends on both the equilibriumconstant for formation of the aggregation-prone stateand the rate of irreversible aggregation. Since both theequilibrium constant and the aggregation rate constantcan change as a function of temperature, the overallkinetics will not necessarily follow the Arrheniusr iumc g theh enat-u .,1 nceo teina eticsf fullym
7
n insi bed.S es-c nil
at wavelengths shorter than about 320 nm, one gen-erally is most concerned with drug chromophores hav-ing relatively long ultraviolet to visible absorptions.Although a discussion of the various mechanisms in-volved in photochemical reactions is beyond the scopeof the present review, such reactions can broadly bedivided into processes that depend on oxygen (pho-tooxidations) and those independent of oxygen (such asdehydrogenations, rearrangements and dimerizations).The degree to which accelerated studies can success-ful predict ambient photostability depends largely onthe extent of the system reciprocity with respect to theexposure. Ideal reciprocity is seen when light given inshort, high intensity exposure, or long duration, lowintensity exposure, or even pulsed exposures, gives thesame amount of photodegradation if the same numberof photons are absorbed. In such a situation, a plot of thelog of the radiant light intensity versus the log of thedegradant formation rate is a linear relationship. Forsystems that are reciprocal, accelerated aging can beaccomplished by using high intensity exposures. For-tunately, such reciprocity is common in pharmaceuti-cal systems. Reciprocity was seen, for example, withnifedipine in solution (Zhao et al., 2003) and in the solidstate (Teraoka et al., 1999), and with tretinoi tocoferilin the solid state (Teraoka et al., 2001). However, it isimportant to recognize when high intensity will not bepredictive of ambient exposure conditions, i.e., whenthere is high intensity reciprocity failure. Although notoften recognized in the pharmaceutical literature, suchr lds( chr
1 en-me
thatt thethani.e.,eac-ner
his. Inaterthehigh-
elation. The temperature effects on the equilibronstant have successfully been estimated usineat capacities and entropies associated with the dration based on the individual residues (Ganesh et al999). With estimates of the temperature dependef the equilibrium constant between the native prond the aggregation-prone state, the overall kin
or the protein degradation have been successodeled and used to predict ambient stability.
. Photochemical degradation
Light exposure can induce chemical degradatiousceptible molecules (Tonnesen, 1996). For light tonduce a chemical reaction, the light must be absorince transmission of ambient light (solar, incandent or fluorescent) through glass is minimal or
eciprocity failure is well documented in other fieKinameri et al., 1981). The major reasons for sueciprocity failures are as follows:
. Depletion of a diffusible species: When high intsity light strikes a sample, it is possible to consua reactive species locally such that diffusion ofspecies becomes rate limiting. The result is thadegradation kinetics at high intensity are lessproportional to the amount of light absorbed,more light exposure does not lead to more rtion. A particular example of this is with oxidatiowhere local oxygen depletion can result in lowthan proportional degradation. A variation on tis the local depletion of a quenching speciesthis case, the high intensity response will be grethan would be observed at low intensities (forsame amount of absorbed quanta) due to the
118 K.C. Waterman, R.C. Adami / International Journal of Pharmaceutics 293 (2005) 101–125
intensity light locally overwhelming the quenchingspecies.
2. Accumulation of diffusible reaction products: Ifdegradants cannot diffuse at the rate they areformed, their presence can affect the drug photore-activity. Ambient exposure conditions can allow fordiffusion, while high exposure conditions may not.The diffusing species can act to increase or decreasethe reactivity of the drug such that the acceleratedconditions can either over or under predict the am-bient light stability.
3. Generation of increased temperatures: When mate-rials absorb light, much of that energy is generallyconverted to heat. With the low intensity exposurecommon under ambient conditions, the temperaturerise will be low due to convective and radiative heatloss. However, with higher intensity exposure, tem-peratures can increase significantly. This tempera-ture increase can in turn lead to a rate increase be-yond that due to the photochemical process itself.This problem is especially challenging in packagedsystems (e.g., glass bottles) where convective andradiative heat loss in minimized. Temperature mon-itoring can at least assure that any temperature in-crease in minimal. It is important, however, that thetemperature monitoring be of the sample and not ofa control that does not absorb the same amount oflight since the latter will not show the same degreeof temperature rise. When possible, circulating airaround samples can help. Another factor that can
ichini-form-
buton
ccel-e unto incet spe-c cedf tali icala of ac ield( d to
calibrate a particular exposure chamber. Several suchactinometers have been reported in the pharmaceuti-cal literature (Piechocki and Wolters, 1993; Baertschi,1997; Favaro, 1998; Bovina et al., 1998; Allen et al.,2000). Electronic photometers can be useful for deter-mining light intensity at a given time; however, due tofluctuations in light intensities, integration of the lightintensity over the exposure time is needed to determinethe actual exposure of samples in light chambers.
The photostability of a drug can be heavily influ-enced by excipients (Thoma and Kuebler, 1997) andmanufacturing processes (Aman and Thoma, 2002a).In particular, titanium dioxide particles can catalyze thephotodecomposition of drugs. The degradation ratesfor drugs are expected to depend on the intimacy ofcontact between the titanium dioxide and the drug, afactor that can lead to variability in predictions. Pho-tocatalysis by titanium dioxide has also been shown tobe moisture sensitive (Kakinoki et al., 2004).
The absorption wavelength of a drug can changewith its environment. This can be particularly pro-nounced when looking at a drug in solution versus thesolid state, but can be observed even when changingsolvents. For this reason, changes in formulations maycause changes in the apparent stability with no changein mechanism.
In some cases, photolytic products can themselvesabsorb light and undergo photochemical transforma-tions. As discussed with thermal processes, these sec-ondary processes can confuse the low-level degrada-t ilityp ighc
ilityo pthi ipi-e n thes cen-t eaterp s. Inc canl ex-a letsop werl
tiona nge
help is to use long-wavelength cutoff filters, whcan eliminate infrared emissions. This helps mmize temperature increases while still allowingaccelerated photostability since little photocheistry occurs at long wavelengths (low energy),absorption (especially in the infrared) is command causes temperature increases.
For most pharmaceutical systems, the key to arated photostability predictions is to know the amof degradant formed for a given total exposure. S
he exact exposure of a sample will depend on theific light source and the distance the sample is plarom the light, it is often useful to determine the tontegrated amount of incident light using a chemctinometer. In chemical actinometers, a solutionompound that degrades with a known quantum ymoles of product per mole of light absorbed) is use
ion picture important in most pharmaceutical stabrograms. It is therefore generally useful to avoid honversions.
One of the challenges in determining photostabf solid drug products is that the light penetration de
s often limited by the absorption of the drug and excnts. The result is that there can be high exposure ourface of a dosage form, with little exposure at theer. If the light bleaches the drug as it degrades, grenetration can continue as the reaction proceedontrast, if the drug degradant absorbs strongly, itimit the penetration depth for photoreaction. Formple, the photodegradation of nifedipine in tabccurred to depths between 360�m and 880�m, de-ending on drug loading (higher penetration with lo
oading) (Aman and Thoma, 2003a).Photodegradation on solids can lead to discolora
t the surface with little to no measurable bulk cha

K.C. Waterman, R.C. Adami / International Journal of Pharmaceutics 293 (2005) 101–125 119
of the drug. Since appearance change can be a factorin setting drug expiry, color changes can in some casesbe a more sensitive assay than bulk methods (such asHPLC). Additionally, since the surface exposure is im-portant with photolytic processes, the dosage form size(surface area to volume ratio) can impact the overalldegradation rate (smaller dosage forms showing greaterinstability on a percentage basis). This factor makes itimportant that the size and shape of a dosage form thatis tested be representative of the intended final dosageform.
For tablets, film coatings can provide a significantreduction in the exposure of the tablet core to light. Theeffects of opacifying agent level and coating thicknessof film coats on photosensitive drug cores have beencharacterized in terms of a contrast ratio (Bechard etal., 1992). It was found that good light protection isafforded with contrast ratios greater than 98%, whichwas achieved with a coating of 29.5% titanium diox-ide with a thickness of 145�m. Care must be taken,however, that variations in film coating do not lead toa reduction in the opacity of a coating, and thereby failto provide the desired protection. In accelerated pho-tostability studies, it can be useful to use film coatedtablets at the thinnest coating level likely to be seenin production in order to anticipate whether this wouldaffect the exposure limits of the dosage form.
Ambient light conditions are difficult to define sincethis will depend on storage conditions. To get a roughidea of this exposure, consider a 100 W light source ata 4 hp
e
in-d centl ag-i ardf -r etai theirl thee /ma ar’s
light exposure would then equal 48 million lux-hours;however, since the fraction of the light likely to causeharm is significantly less than this, the standard expo-sure requirements set by the ICH are 1.2 million lux-hours. With commercial light chambers, it is possibleto achieve the ICH exposure conditions for both ul-traviolet and visible exposure in less than a week. Anumber of lamps have been used in pharmaceuticaltesting (Piechocki, 1998; Boxhammer and Willwoldt,1998; Matsuo et al., 1996). Often the desired exposurecan be achieved by a combination of an artificial day-light fluorescent lamp with an ultraviolet emitting lamp(typically, a xenon arc lamp).
8. Prediction of stability in packaged product
In many cases, drug product stability studies mustinclude the packaging to provide an assessment of theshelf-life of the product as used. Two major factorsdominate considerations on predicting the effect ofpackaging on drug products: (1) leachable (or volatile)impurities that affect the drug product, and (2) perme-ability of the packaging largely to moisture and oxygen.
8.1. Leachable and extractable substances
Leachable chemicals in packaging are generally ofgreater concern for liquid dosage forms than for solids,due to the direct liquid contact with the packagingm ree persa 6I ablem drugf er-a erialsc hesem rugs ffect-i thed (3)t euti-c tingp turesf viorf cificf . In
distance of 1 m from a sample with the light on 2er day. The overall exposure would then be:
xposure= 100 W
4π(1 m)2× 365 days year× 24 h/day
= 70 kWh/(m2 year)
Light sources, including direct and indirect (oors) sunlight, fluorescent lights and incandes
ights have only a fraction of light in the most damng ultraviolet region. For this reason, the ICH standor UV exposure is 200 Wh/m2 (International Confeence of Harmonization, 1997; Drew, 1998; Thatcherl., 2001a, 2001b; Aman and Thoma, 2003b). For vis-
ble light, exposure sources are rated in terms ofux values. Lux represents light flux corrected foryes’ response. One lux is equivalent to 1.46 mW2
t 555 nm. Using the above approximation, a ye
aterials (Jenke, 2002). Of particular concern axtractable materials in elastomers used for stopnd seals for packaging (Groeger and Compton, 199).
ndependent of the specific nature of various leachaterials in bottles and stoppers and the specific
ormulation, the rate of leaching is generally tempture dependent. Leachable and extractable matan be undesirable for a number of reasons: (1) taterials can affect the chemical stability of the d
ubstance either as reactants, as catalysts or by ang the pH of a drug solution and thereby affectingrug stability; (2) they can themselves be toxic; or
hey can induce physical changes in the pharmacal formulation (e.g., cause precipitation). Predicackaged product stability using elevated tempera
aces the usual challenges of non-Arrhenius behaor complex reaction pathways, as well as speactors affecting the chemical leaching process
120 K.C. Waterman, R.C. Adami / International Journal of Pharmaceutics 293 (2005) 101–125
many cases, the degradant from the reaction of thedrug with a leachable material is different from otherdrug degradants. In this case, it is possible to follow theformation of the appropriate degradant(s) as an indica-tion of the packaging sensitivity. The leaching processgenerally follows the Stokes–Einstein relationshipfor diffusional processes; that is, it depends linearlyon temperature and inversely on viscosity. Viscosity,in turn, is exponentially dependent on temperature.In the absence of a phase transition, one wouldtherefore anticipate the temperature dependence ofleaching to follow the Arrhenius or modified Arrheniusrelationship shown in Eq.(8). At phase transitions(for example, theTg of a plastic), the viscosity ofthe packaging material, and hence its permeability,can change dramatically. For this reason, care mustbe taken in accelerated aging studies to use temper-atures below such transitions to predict the ambientbehavior.
8.2. Moisture and oxygen permeability
While glass and foil packaging show virtually nopermeation of moisture or oxygen, many pharmaceu-tical packaging systems (e.g., plastic bottles, plasticblisters, etc.) show significant permeability. In accel-erated aging, the functional dependence of the per-meability with temperature can sometimes complicatepredictions for ambient conditions. The permeabilityto moisture and oxygen of most packaging plastics fol-l rme-a lityd per-m , asw is ont agef
pt-a tione om-m xy-g ,2 icst f in-c e ofa ly ifo ures.W tics
to oxygen, this is unlikely to be a real issue in acceler-ated aging studies.
With moisture transfer through packaging, the situ-ation can be quite a bit more complicated. The moisturecontent of a drug product varies with the relative hu-midity surrounding it and the residual moisture of thesample when packaged. Samples stored at humiditiesabove their CRH values will continue to pick up mois-ture, while below the CRH, the moisture content inthe samples will eventually equilibrate to that relativehumidity. When studying stability of moisture sensi-tive products in packaging, samples can both gain orlose moisture through the packaging depending on therelative humidities of the external environment and theenvironment surrounding the dosage form. For this rea-son, it is important that any higher temperature studiesdone to predict ambient stability be done at a constantrelative humidity. The permeability of plastic bottlesshows temperature dependencies that follow Arrheniusbehavior in the temperature ranges used in most ac-celerated aging studies. For example, for high densitypolyethylene (HDPE), the activation energy for mois-ture permeability was found to be about 10 kcal/mol(Morillon et al., 2000). In some cases, this temperaturedependence can dominate over the degradation reactionkinetics, at least at higher temperatures. The absolutepermeability depends on the difference in relative hu-midity inside and outside a bottle. A new model hasbeen proposed for predicting the moisture uptake bysolid dosage forms packaged in plastic (Chen and Li,2
8
llyo tol ag-i ductu ores nderd ging( ingt int thed ofH ti non y, if
ows the Arrhenius equation; thus, whether such pebility affects the predictions of ambient drug stabiepends on the relative activation energetics of theeability versus that of the chemical degradationell as how dependent the chemical degradation
he moisture or oxygen level surrounding the dosorm.
Oxygen permeability for pharmaceutically acceble plastic packaging is high; however, the activanergies are low. For example, polyethylene, a con bottle plastic, shows an activation energy for oen permeation of less than 1 kcal/mol (Gajdos et al.001). While the permeability of packaging plast
o oxygen increases with temperature, the rate orease will often be lower than the rate of increasdrug oxidation rate. This remains an issue on
xygen concentration is depleted at high temperatith the high permeability of most packaging plas
003).
.3. Photolysis in packaged products
Since light protection by packaging can partiar completely eliminate exposure of a dosage form
ight, testing photostability of drug products in packng is essential to understand the stability of a pronder real-world conditions. ICH guidelines therefuggest that drug products be tested not only uirect exposure, but also in their immediate packai.e., blister packs, bottles, vials or any packaghat is in direct contact with the drug product) andhe marketing packaging (i.e., the box or packagerug product is sold in) (International Conferencearmonization, 1997). Obviously, if the drug produc
tself withstands the light exposure, then there iseed to test under packaging conditions. Similarl

K.C. Waterman, R.C. Adami / International Journal of Pharmaceutics 293 (2005) 101–125 121
the immediate packaging protects the drug product,there is no need for testing in the marketing package.Clear blister packaging of different colors has beenstudied for its effectiveness at protecting light sensitivedrugs (Aman and Thoma, 2002b). With glass andplastic bottles, light transmission can vary significantlyeven for bottles of similar description (e.g., amberglass bottles) (Baumgartner et al., 1995; Beyrichand Tibussek, 1981; Krogerus et al., 1970). Forpharmaceutical products that require light protec-tion from the packaging, it is important that theaccelerated aging be conducted with the actualpackaging or that the specific transmission spectrumbe measured of the packaging to assure that anypackaging changes do not result in greater lighttransmission.
9. Concluding remarks
Assuring adequate product stability remains one ofthe primary challenges in the development of pharma-ceuticals. The present review provides a comprehen-sive survey of advances in the field since the last majorreviews in the 1980s. In particular, with the advance-ment of analytical chemistry, drug stability is morecommonly associated with formation of low levels ofdegradants rather than loss of drug potency. This hasresulted in some factors actually becoming easier toa therf tionp dedm toryr eedf d fora ictiveo rnsa withf nis-t leadt esem duet pientp Wea d ag-i rrentt
References
Acker, M.M., Frediani, H.A., 1945. Determination of water con-tent in oils. In: Eimer, Amend (Eds.), Industrial and EngineeringChemistry, vol. 17. Analytical Edition, New York, pp. 793–794.
Allen, J.M., Allen, S.K., Baertschi, S.W., 2000. 2-Nitrobenzaldehyde: a convenient UV-A and UV-B chemicalactinometer for drug photostability testing. J. Pharm. Biomed.Anal. 24, 167–178.
Aman, W., Thoma, K., 2002a. The influence of formulation and man-ufacturing process on the photostability of tablets. Int. J. Pharm.243, 33–41.
Aman, W., Thoma, K., 2002b. Photostabilization of tablets by blistercovers. Pharm. Ind. 64, 1287–1292.
Aman, W., Thoma, K., 2003a. Particular features of photolabile sub-stances in tablets. Pharmazie 58, 645–650.
Aman, W., Thoma, K., 2003b. ICH guideline for photostability test-ing: aspects and directions for use. Pharmzie 58, 877–880.
Angberg, M., Nystrom, C., Carstensson, S., 1990. Evaluation of heat-conduction microcalorimetry in pharmaceutical stability stud-ies (II) methods to evaluate microcalorimetric response. Int. J.Pharm. 61, 67–77.
ASTM, 1991. Standard Practice for Maintaining Constant RelativeHumidity by Means of Aqueous Solutions, ASTM Standard E104-85, Reapproved.
Badawy, S.I.F., Gawronski, A.J., Alvarez, F.J., 2001. Application ofsorption-desorption moisture transfer modeling to the study ofchemical stability of a moisture sensitive drug product in differentpackaging configurations. Int. J. Pharm. 223, 1–13.
Baertschi, S.W., 1997. Commentary on the quinine actinometry sys-tem described in the ICH draft guideline on photostability testingof new drug substances and products. Drug Stability 1, 193–195.
Bates, R.G., 1962. Revised standard values for pH measurementsfrom 0 to 95◦C. J. Res. Nat. Bur. Standards 66A, 179.
Baumgartner, P., Hofstaetter, I., Wirthumer-Hoche, C., 1995. De-ers.
B : ef-the
B C.,ng-
B ce ofse ofhar-
B tionrs.
B ns-V-ASoc.
B har-ting.
ddress (less relevance for reaction order), while oactors have become more complex (multiple reacroducts with overlapping mechanisms). The adeasurement sensitivity has led to tighter regula
equirements for allowable degradant levels. The nor rapid drug development has increased the neeccelerated stability measurements that are predf actual storage conditions. When stability concerise, rapid assessments of improvements can help
ormulation and packaging improvements. Mechaic insights, as described in this review, can ofteno remedies for stability problems. In addition, thethods will help prevent unexpected instabilities
o changes in processing, drug substance or exciurity during commercialization of a drug product.nticipate future advances in the field of accelerate
ng based on new technologies and better use of cuheories.
termination of light transmission for colored glass containScientia Pharm. 63, 71–79.
echard, S.R., Quaraishi, O., Kwong, E., 1992. Film coatingfect of titanium dioxide concentration and film thickness onphotostability of nifedipine. Int. J. Pharm. 87, 133–139.
eezer, A.E., Gaisford, S., Hills, A.K., Willson, R.J., Mitchell, J.1999. Pharmaceutical microcalorimetry: applications to loterm stability studies. Int. J. Pharm. 179, 159–165.
eyrich, T., Tibussek, P., 1981. Studies on the light transmittancolored plastic bottles. Part 43: Problems concerning the uplastic containers for liquid pharmaceutical preparations. Pmazie 36, 337–341.
occardi, G., 1994. Autoxidation of drugs: prediction of degradaimpurities from results of reaction with radical chain initiatoFarmaco 49, 431–435.
ovina, E., De Filippis, P., Cavrini, V., Ballardini, R., 1998. Tra2-nitrocinnamaldehyde as chemical actinometer for the Urange in photostability testing of pharmaceuticals. RoyalChem. 225, 305–316 (special publication).
oxhammer, J., Willwoldt, C., 1998. Design and validation cacteristics of environmental chambers for photostability tesRoyal Soc. Chem. 225, 272–287 (special publication).

122 K.C. Waterman, R.C. Adami / International Journal of Pharmaceutics 293 (2005) 101–125
Boye, J.I., Alli, I., Ismail, A.A., 1997. Use of differential scanningcalorimetry and infrared spectroscopy in the study of thermaland structural stability of�-lactalbumin. J. Agric. Food Chem.45, 1116–1125.
Byrn, S.R., Xu, W., Newman, A.W., 2001. Chemical reactivity insolid-state pharmaceuticals: formulation implications. Adv. DrugDel. Rev. 48, 115–136.
Cabiglioli, G., Drava, G., Cafaggi, S., Parodi, B., Bignardi, G., 1996.Median-based robust regression methods in prediction of drugstability. J. Pharm. Sci. 85, 1096–1104.
Cai, X., Dass, C., 2003. Conformational analysis of proteins andpeptides. Curr. Organic Chem. 7, 1841–1854.
Can der Houwen, O.A.G.J., Beijnen, J.H., Bult, A., Underberg,W.J.M., 1994. A general approach to the interpretation ofpH buffer catalyzed degradation profiles. Int. J. Pharm. 109,191–196.
Carstensen, J.T., 2000. Kinetic pH profiles. Drugs Pharm. Sci. 107,57–111.
Carstensen, J.T., Aron, E.S., Spera, D.C., Vance, J.T., 1966. Moisturestress tests in stability programs. J. Pharm. Sci. 55, 561–567.
Chafetz, L., Hong, W.H., Tsilifonis, D.C., Taylor, A.K., Philip,J., 1984. Decrease in the rate of capsule dissolution due toformaldehyde from polysorbate 80 autoxidation. J. Pharm. Sci.73, 1186–1187.
Chen, Y., Li, Y., 2003. A new model for predicting moisture uptakeby packaged solid pharmaceuticals. Int. J. Pharm. 255, 217–225.
Chiba, K., Takahashi, M., Hayase, N., Akutsu, S., Inagaki, S., 1992.Stability of indomethacin in aqueous solution. Kinetic studies ofsolvents on the hydrolysis of indomethacin. Byoin Yakugaku 18,43–51.
Connors, K.A., 1982. The determination of intrinsic activation en-ergies of specific acid-base catalyzed reactions. J. Parenter. Sci.Tech. 36, 205–209.
Cooper, A., Nutley, M.A., Wadood, A., 2001. Differential scan-ning microcalorimetry. In: Harding, S.E., Chowdhry, B.Z. (Eds.),
etry.
Cisi
C bil-elt
D edic-tionstrom-
D rage.
D prod-ICH
–242
D tem-ing. 14,
Duddu, S.P., Weller, K., 1996. Importance of glass transition tem-perature in accelerated stability testing of amorphous solids: casestudy using a lyophilized aspirin formulation. J. Pharm. Sci. 85,345–347.
Ebel, S., Fleischer, P., Ledermann, M., Wustenhagen, 1989. Vorher-sage der Stabilitat von Arzneiformen aus der Kinetik der Ab-baureaktion des Arzneistoffes Teil 1: Auswertung KinetischerDaten. Acta Pharm. Technol. 35, 210–217.
Ertel, K.D., Carstensen, J.T., 1990. Examination of a modified Ar-rhenius relationship for pharmaceutical stability prediction. Int.J. Pharm. 61, 9–14.
Favaro, G., 1998. Actinometry: concepts and experiments. RoyalSoc. Chem. 225, 295–304 (special publication).
Felton, L.A., Timmins, G.S., 2003. A Nondestructive technique toquantify oxygen permeation through tablets. Poster presentationfrom AAPS Annual Meeting, Salt Lake City.
Felton, L.A., Wiley, C.J., Timmins, G.S., 2002. AAPS Pharm. Sci.4, 4.
Fitzpatrick, S., McCabe, J.F., Petts, C.R., Booth, S.W., 2002. Effect ofmoisture on polyvinylpyrrolidone in accelerated stability testing.Int. J. Pharm. 246, 143–151.
Franchini, M., Unvala, H., Carstensen, J.T., 1993. Effect of elec-trolytes on oxygen solubility in aqueous systems. J. Pharm. Sci.82, 550.
Franchini, M.K., Carstensen, J.T., 1994. Failure of high temperatureextrapolation of oxidative reactions in solution. Int. J. Pharm.111, 153–158.
Franks, F., 1994. Accelerated stability testing of bioproducts: attrac-tions and pitfalls. Trends Biotechnol. 12, 114–117.
Fubara, J.O., Notari, R.E., 1998. A kinetic oxymoron: concentration-dependent first-order rate constants for hydrolysis of ceftazidime.J. Pharm. Sci. 87, 53–58.
Gajdos, J., Galic, K., Kurtanjek, Z., Cikovic, N., 2001. Gas perme-ability and DSC characteristics of polymers used in food pack-aging. Polym. Testing 20, 49–57.
G adara-e ofnce.
G ceu-and09.
G rela-Sci.
G mor-287.
G .E.,nd
8.GG ation
: An-l. 3,
H .A.,ang,
Protein–Ligand Interactions: Hydrodynamics and CalorimOxford University Press, Oxford, UK, pp. 287–318.
respo, D.L.M., Alvarez, R.S., 1985. Metodos non isotermicos enla prediccion de la estabilidad de los medicamentos. Revonbibliografica. Rev. Cub. Farm. 19, 443–449.
rowley, M.M., Zhang, F., Koleng, J.J., McGinity, J.W., 2002. Staity of polyethylene oxide in matrix tablets prepared by hot-mextrusion. Biomaterials 23, 4241–4248.
arrington Richard, T., Jiao, Jim., 2004. Rapid and accurate prtion of degradant formation rates in pharmaceutical formulausing high-performance liquid chromatography-mass specetry. J. Pharm. Sci. 93, 838–846.
ow Chemical Technical Data, 2003. Water soluble-resin stostability technical data. Form Number 326-00044-0203AMS
rew, H.D., 1998. Photostability of drug substances and drugucts: a validated reference method for implementing thephotostability study guidelines. Royal Soc. Chem. 225, 227(special publication).
uddu, S.P., Dal Monte, P.R., 1997. Effect of glass transitionperature on the stability of lyophilized formulations containa chimeric therapeutic monoclonal antibody. Pharm. Res591–595.
anesh, C., Eswar, N., Srivastava, S., Ramakrishnan, C., Varjan, R., 1999. Prediction of the maximal stability temperaturmonomeric globular proteins solely from amino acid sequeFEBS Lett. 454, 31–36.
arrett, E.R., Won, C.M., 1971. Prediction of stability in pharmatical preparations XVI: Kinetics of hydrolysis of canrenonelactonization of canrenoic acid. J. Pharm. Sci. 60, 1801–18
enton, D., Kesselring, U.W., 1977. Effect of temperature andtive humidity on nitrazepam stability in solid state. J. Pharm.66, 676–680.
leditsch, E., Waaler, P.J., 2001. Accelerated stability studies ofphine injections in plastic ampoules. Int. J. Pharm. 212, 275–
rant, D.J.W., Mendizadeh, M., Chow, A.H.-L., Fairbrother, J1984. Non-linear van’t Hoff solubility-temperature plots atheir pharmaceutical interpretation. Int. J. Pharm. 18, 25–3
reenspan, L.J., 1977. Res. Nat. Bur. Stand. 81A, 89.roeger, J.H., Compton, L.M., 1996. Unexpected contamin
from pharmaceutical packaging: sources and solutions. Innual Tech. Conf. — Society of Plastics Engineers, 54th, vopp. 2835–2839.
artauer, K.J., Arbuthnot, G.N., Baertschi, S.W., Johnson, RLuke, W.D., Pearson, N.G., Rickard, E.C., Tingle, C.A., Ts
K.C. Waterman, R.C. Adami / International Journal of Pharmaceutics 293 (2005) 101–125 123
P.K.S., Wiens, R.E., 2000. Influence of peroxide impurities inpovidone and crospovidone on the stability of raloxifene hy-drochloride in tablets: identification and control of an oxidativedegradation product. Pharm. Dev. Tech. 5, 303–310.
Heidemann, D.R., Jarosz, P.J., 1991. Preformulation studies in-volving moisture uptake in solid dosage forms. Pharm. Res. 8,292–297.
Hempenstall, J.M., Irwin, W.J., Po, A.L.W., Andrews, A.H., 1983.Nonisothermal kinetics using a microcomputer: a derivative ap-proach to the prediction of the stability of penicillin formulations.J. Pharm. Sci. 72, 668–673.
Herberger, K., Kemeny, S., Vidoczy, T., 1987. On the errors of Arrhe-nius parameters and estimated rate constant values. Int. J. Chem.Kinetics 19, 171–181.
Herman, B.D., Sinclair, B.D., Milton, N., Nail, S.L., 1994. Theeffect of bulking agent on the solid-state stability of freeze-dried methylprednisolone sodium succinate. Pharm. Res. 11,1467–1473.
Hladon, T., Cwiertnia, B., 1999. The effect of humidity on thestability of diclofenac sodium in inclusion complex with�-cyclodextrin in the solid state. Pharmazie 54, 943–944.
Hong, J., Lee, E., Carter, J.C., Masse, J.A., Oksanen, D.A., 2004.Antioxidant-accelerated oxidative degradation: a case study oftransition metal ion catalyzed oxidation in formulation. Pharm.Dev. Tech. 9, 171–179.
Hovorka, S.W., Schoneich, C., 2001. Oxidative degradation of phar-maceuticals: theory, mechanisms and inhibition. J. Pharm. Sci.90, 253–269.
Huang, T., Garceau, M.E., Gao, P., 2003. Liquid chromatographic de-termination of residual hydrogen peroxide in pharmaceutical ex-cipients using platinum and wired enzyme electrodes. J. Pharm.Biomed. Anal. 31, 1203–1210.
Hutterer, K., Dolnik, V., 2001-2003. Capillary electrophoresis of pro-teins. Electrophoresis 24, 3998–4012.
International Conference of Harmonization, 1997. Guidelines foructs.
I uri-ister
I sec-
J 1997.. I.77.
J dis-nderharm.
J ic ma-. PDA
K eticsrugs
K , Y.,ity
of titanium dioxide and photostability of famotidine. J. Pharm.Sci. 93, 582–589.
Kearney, A.S., Crawford, L.F., Mehta, S.C., Radebaugh, G.W., 1993.The interconversion kinetics, equilibrium, and solubilities of thelactone and hydroxyacid forms of the HMG-CoA reductase in-hibitor, CI-981. Pharm. Res. 10, 1461–1465.
Keiderling, T.A., Xu, Q., 2002. Unfolded peptides and proteins stud-ied with infrared absorption and vibrational circular dichroismSpectra. Adv. Protein Chem. 62, 111–161, Unfolded Proteins.
Kelly, S.M., Price, N.C., 2000. The use of circular dichroism in theinvestigation of protein structure and function. Curr. Protein Pep-tide Sci. 1, 349–384.
Kinameri, K., Nonaka, M., Nishizawa, M., Yokomizo, H., 1981.Measurement of near-UV irradiance taking into considerationreciprocity law failure for irradiated materials. J. Light VisualEnv. 5, 11–17.
Kipp, J.E., Schuck, D.F., 1995. Computer simulation of the effect oftemperature on pH. J. Pharm. Sci. 84, 1347–1352.
Kitamura, S., Koda, S., Miyamae, A., Yasuda, T., Morimoto, Y.,1990. Dehydration effect on the stability of cefixime trihydrate.Int. J. Pharm. 59, 217–224.
Kontny, M.J., 1988. Distribution of water in solid pharmaceuticalsystems. Drug Dev. Ind. Pharm. 14, 1991–2027.
Kontny, M.J., Grandolfi, G.P., Zografi, G., 1987. Water vapor sorp-tion of water-soluble substances: studies of crystalline solidsbelow their critical relative humidities. Pharm. Res. 4, 104–112.
Kontny, M.J., Zografi, G., 1985. Moisture sorption kinetics for water-soluble substances. IV: Studies with mixtures of solids. J. Pharm.Sci. 74, 124–127.
Kontny, M.J., Zografi, G., 1995. Sorption of water by solids. DrugsPharm. Sci. 70, 387–418.
Kottke, D., Beck, K., Beyrich, T., 1984. Suitability of short-termtests for oxidation-sensitive pharmaceuticals. Part 2. Kinet-ics of 2-mercaptobenzothiazole oxidation. Pharmazie 39, 546–
K ans-ttinen
K ility.
L ing73,
L malRe-
M cha-ork,
M r thetific
M naya,l sta-em.
the photostability testing of new drug substances and prodFederal Register, 62, 27115–27122.
nternational Conference of Harmonization Q3B(R), 2003. Impties in new drug products (revised guideline). Federal Reg68, 64628–64629.
UPAC, 1996. Compendium of Chemical Terminology, vol. 68,ond ed., p. 174.
acobsen, D.F., Frokjaer, S., Larsen, C., Niemann, H., Buur, A.,Application of isothermal microcalorimetry in preformulationHygroscopicity of drug substances. Int. J. Pharm. 156, 67–
ans-Frontini, H., Mielck, J.B., 1996. Stability of drugs in solidpersions. Effect of glass transition on degradation kinetics ustress in systems of reserpine and PVP. Eur. J. Pharm. Biop42, 303–312.
enke, D., 2002. Extractable/leachable substances from plastterials used as pharmaceutical product containers/devicesJ. Pharm. Sci. Technol. 56, 332–371.
ahns, A.H., Jensen, P.B., Moerk, N., Bundgaard, H., 1989. Kinof hydrolysis of indomethacin and indomethacin ester prodin aqueous solution. Acta Pharm. Nordica 1, 327–336.
akinoki, K., Yamane, K., Teraoka, R., Otsuka, M., Matsuda2004. Effect of relative humidity on the photocatalytic activ
548.rogerus, V.E., Nieminen, E., Savolainen, U.M., 1970. Light tr
mission of glass containers used in pharmacy. FramaseuAikakauslehti 79, 101–107.
umar, V., Banker, G.S., 1994. Maillard reaction and drug stabRoyal Soc. Chem. 151, 20–27 (special publication).
opez, M.M., Makhatadze, G.I., 2002. Differential scanncalorimetry. Methods Mol. Biol. (Totowa, NJ, United States) 1113–119.
yubarev, A.E., Kurganov, B.I., 2001. Study of irreversible therdenaturation of proteins by differential scanning calorimetry.cent Res. Dev. Biophys. Chem. 2, 141–165.
arch, J., 1992. Advanced Organic Chemistry: Reactions, Menism and Structure, fourth ed. John Wiley and Sons, New Yp. 373.
arsh, K.N. (Ed.), 1987. Recommended Reference Materials foRealization of Physicochemical Properties. Blackwell ScienPublications, Oxford, UK, pp. 157–162.
atsunaga, Y., Ohta, R., Bando, N., Yamada, H., Yuasa, H., KaY., 1993. Effects of water content on physical and chemicability of tablets containing an anticancer drug TAT-59. ChPharm. Bull. 41, 720–724.
124 K.C. Waterman, R.C. Adami / International Journal of Pharmaceutics 293 (2005) 101–125
Matsuo, M., Machida, Y., Furuichi, H., Nakamura, K., Takeda, Y.,1996. Suitability of photon sources for photostability testing ofpharmaceutical products. Drug Stability 1, 179–187.
McGinity, J.W., Hill, J.A., La Via, A.L., 1975. Influence of peroxideimpurities in polyethylene glycols on drug stability. J. Pharm.Sci. 64, 356–357.
Meunier, P.J., 1981. Advantages and limits of accelerated stabilitytesting. Sci. Tech. Pharm. 10, 375–381.
Mirrlees, M.S., Taylor, P.J., 1994. The hydrolysis of N-methylisatin:on how a simple rate-pH profile may mislead. Drug Design Disc.11, 223–230.
Morillon, V., Debeaufort, F., Blond, G., Voilley, A., 2000. Temper-ature influence on moisture transfer through synthetic films. J.Membr. Sci. 168, 223–231.
Nassar, M.N., Nesarikar, V.N., Lozano, R., Parker, W.L., Huang,Y., Palaniswamy, V., Xu, W., Khaselev, N., 2004. Influence offormaldehyde impurity in polysorbate 80 and PEG-300 on thestability of a parenteral formulation of BMS-204352: identifica-tion and control of the degradation product. Pharm. Dev. Tech.9, 189–195.
Newton, D.W., Miller, K.W., 1987. Estimating shelf life of drugs insolution. Am. J. Hosp. Pharm. 44, 1633–1640.
Otsuka, T., Yoshioka, S., Aso, Y., Terao, T., 1994. Application of mi-crocalorimetry to stability testing of meclofenoxate hydrochlo-ride anddl-�-tocopherol. Chem. Pharm. Bull. 42, 130–132.
Parikh, R.H., 1981. Stability of pharmaceuticals—prediction ofshelf-life by accelerated testing. Ind. Drugs Pharm. Ind. 16,23–24.
Patel, N.K., Patel, I.J., Cutie, A.J., Wadke, D.A., Monkhouse, D.C.,Reier, G.E., 1988. The effect of selected direct compression ex-cipients on the stability of aspirin as a model hydrolyzable drug.Drug Dev. Ind. Pharm. 14, 77–98.
Pellerin, F., Baylocq, M.D., Mancheron, D., 1971. Detection of theMaillard reaction in pharmaceutical preparations. Ann. Pharm.Franc. 29, 529–532.
P uticalecial
P ght-
P .H.,e, a181,
P cer-irhar-
P si-n the
P n of62,
P n of60,
Powell, M.F., Magill, A., Becker, A.R., Kenlye, R.A., Chen, S., Vi-sor, G.C., 1988. Non-steroidal anti-psoriatic prodrugs. II. Citricacid stabilization of lonapalene in various alcohol media and anointment formulation. Int. J. Pharm. 44, 225–234.
Prankerd, R.J., McKeown, R.H., 1990. Physico-chemical propertiesof barbituric acid derivatives Part I. Solubility-temperature de-pendence for 5,5-disubstituted barbituric acids in aqueous solu-tions. Int. J. Pharm. 62, 37–52.
Roberts, C.J., 2003. Kinetics of irreversible protein aggregation:analysis of extended Lumry Eyring models and implications forpredicting protein shelf life. J. Phys. Chem. 107, 1194–1207.
Ross, K.D., 1975. Estimation of water activity in intermediate foods.Food Technol. 29, 26, 28, 30, 32, 34.
Seki, H., Hayashi, T., 1982. Stability of drugs in aqueous solu-tions. Kinetic studies on anaerobic hydrolysis of adenosine-5′-triphosphate. Chem. Pharm. Bull. 30, 2926–2934.
Shalaev, E.Y., Zografi, G., 1996. How does residual water affect thesolid-state degradation of drugs in the amorphous state? J. Pharm.Sci. 85, 1137–1141.
Shnyrov, V.L., Zhadan, G.G., 2000. Irreversible thermal denaturationof complex biological structures. Recent Res. Dev. Phys. Chem.4, 351–367.
Simon, P., Veverka, M., Okuliar, J., 2004. New screening method forthe determination of stability of pharmaceuticals. Int. J. Pharm.270, 21–26.
Stewart, P.J., Tucker, I.G., 1984a. Prediction of drug stability—Part1: mechanisms of drug degradation and basic rate laws. Aust. J.Hosp. Pharm. 14, 165–170.
Stewart, P.J., Tucker, I.G., 1984b. Prediction of drug stability—Part2: hydrolysis. Aust. J. Hosp. Pharm. 14, 165–170.
Stewart, P.J., Tucker, I.G., 1985a. Prediction of drug stability—Part4: isomerization. Aust. J. Hosp. Pharm. 15, 181–188.
Stewart, P.J., Tucker, I.G., 1985b. Prediction of drug stability—Part3: oxidation and photolytic degradation. Aust. J. Hosp. Pharm.15, 111–117.
S Part
T pho--4-ier-nt. J.
T d ox-em.
T chi,prac-to
, 98,
T chi,prac-
to50,
T pho-.
iechocki, J.T., 1998. Selecting the right source for pharmacephotostability testing. Royal Soc. Chem. 225, 247–271 (sppublication).
iechocki, J.T., Wolters, R.J., 1993. Use of actinometry in listability studies. Pharm. Tech. 17, 46, 48, 50, 52.
insuwan, S., Alvarez-Nunez, F.A., Tabibi, E.S., Yalkowsky, S1999. Degradation kinetics of 4-dedimethylaminosancyclinnew anti-tumor agent, in aqueous solutions. Int. J. Pharm.31–40.
lotkowiak, Z., 1989. The effect of the chemical character oftain penicillins on the stability of the�-lactam group in themolecules. Part 7: Effect of humidity in the solid state. Pmazie 44, 837–839.
o, A.L.W., Mroso, P.V., Irwin, W.J., 1983. Modeling decompotion in the solid state: stability of salsalate in suspensions ipresence of excipients. Int. J. Pharm. 16, 115–123.
ope, D.G., 1980a. Accelerated stability testing for predictiodrug stability. Drug Cosmetic Ind. 127, 54, 56, 59–60,116.
ope, D.G., 1980b. Accelerated stability testing for predictiodrug stability. Drug Cosmetic Ind. 127, 48, 50, 55–56, 58,62, 64–66, 110, 112–116.
tewart, P.J., Tucker, I.G., 1985c. Prediction of drug stability—5: physical stability. Aust. J. Hosp. Pharm. 15, 236–246.
eraoka, R., Otsuka, M., Matsuda, Y., 1999. Evaluation oftostability of solid-state dimethyl 1,4-dihydro-2,6-dimethyl(2-dinitro-phenyl)-3,5-pyridinedicarboxyalte by using Fourtransformed reflection-absorption infrared spectroscopy. IPharm. 184, 35–43.
eraoka, R., Konishi, Y., Matsuda, Y., 2001. Photochemical anidative degradation of the solid-state tretinoin tocoferil. ChPharm. Bull. 49, 368–372.
hatcher, S.R., Mansfield, R.K., Miller, R.B., Davis, C.W., BaertsS.W., 2001a. Pharmaceutical photostability: a technical andtical interpretation of the ICH guideline and its applicationpharmaceutical stability-part I. Pharm. Tech. North Am. 25100, 102, 104, 106, 108, 110.
hatcher, S.R., Mansfield, R.K., Miller, R.B., Davis, C.W., BaertsS.W., 2001b. Pharmaceutical photostability: a technical andtical interpretation of the ICH guideline and its applicationpharmaceutical stability-part II. Pharm. Tech. North Am. 25,52, 54, 56, 58, 60, 62.
homa, K., Kuebler, N., 1997. Influence of excipients on thetodegradation of drug substances. Pharmazie 52, 122–129
K.C. Waterman, R.C. Adami / International Journal of Pharmaceutics 293 (2005) 101–125 125
Tingstad, J., Dudzinski, J., Lachman, L., Shami, E., 1973. Simplifiedmethod for determining chemical stability of drug substances inpharmaceutical suspensions. J. Pharm. Sci. 62, 1361–1363.
Tonnesen, H.H. (Ed.), 1996. The photostability of drugs and drugformulations. In: 1st International Meeting on Photostability ofDrugs, held in Oslo, Norway, June 1995, Taylor & Francis, Lon-don.
Tripet, F.Y., Kesselring, U.W., 1975. The stability of folic acid insolid the state as a function of temperature and humidity. Pharm.Acta Helv. 50, 318–322.
Tucker, I., 1985. Nonisothermal stability testing. Pharm. Technol.,68–78.
Tucker, I.G., Owen, W.R., 1982. Estimation of all parameters fromnonisothermal kinetic data. J. Pharm. Sci. 71, 969–974.
Vesilind, P.A., 1996. Introduction to Environmental Engineering.PWS Publishing Company, Boston.
Vromans, H., Schalks, E.J.M., 1994. Comparative and predictiveevaluation of the stability of different freeze-dried formulationscontaining an amorphous moisture-sensitive ingredient. DrugDev. Ind. Pharm. 20, 757–768.
Vyazovkin, S., 1999. Concept of variable activation energy (why itjust can’t stay put). In: Proc. NATAS Ann. Conf. Thermal Anal.Appl. 27th, pp. 55–60.
Waterman, K.C., 2004. Accelerated aging and oxidation. Presenta-tion at “Oxidative Degradation and Stabilization of Pharmaceu-ticals Conference”, Princeton, NJ, organized by the Institute forInternational Research.
Waterman, K.C., Adami, R.C., Alsante, K.M., Antipas, A.S., Aren-son, D.R., Carrier, R., Hong, J., Landis, M.S., Lombardo, F.,Shah, J.C., Shalaev, E., Smith, S.W., Wang, H., 2002a. Hy-drolysis in pharmaceutical formulations. Pharm. Dev. Tech. 7,1113–1146.
Waterman, K.C., Adami, R.C., Alsante, K.M., Hong, J., Landis, M.S.,Lombardo, F., Roberts, C.J., 2002b. Stabilization of pharmaceu-ticals to oxidative degradation. Pharm. Dev. Tech. 7, 1–32.
W rugola-Aca-
W icgel
electrophoresis of proteins and peptides with molecular masses100,000–1000, and their detection with picomolar sensitivity.Electrophoresis 12, 352–366.
Wirth, D.D., Baertschi, S.W., Johnson, R.A., Maple, S.R., Miller,M.S., Hallenbeck, D.K., Gregg, S.M., 1998. Maillard reactionof lactose and fluoxetine hydrochloride, a secondary amine. J.Pharm. Sci. 87, 31–39.
Witthaus, G., 1981. Drug stability. Accelerated storage tests: predic-tive value. Top. Pharm. Sci., Proc. Int. Congr. Pharm. Sci. F.I.P.41.
Wold, S., Exner, O., 1973. Statistics of the enthalpy-entropy rela-tion. IV. Temperature dependent activation parameters. ChemicaScripta 3, 5–11.
Yamamura, K., Nakao, M., Yano, K., Miyamoto, K., Yotsuyanagi,T., 1991. Stability of forskolin in lipid emulsions and oil/waterpartition coefficients. Chem. Pharm. Bull. 39, 1032–1034.
Yoshioka, S., Aso, Y., Izutsu, K., Terao, T., 1994. Application ofaccelerated testing to shelf-life prediction of commercial proteinpreparations. J. Pharm. Sci. 83, 454–456.
Yoshioka, S., Carstensen, J.T., 1990. Nonlinear estimation of kineticparameters for solid-state hydrolysis of water-soluble drugs. II:Rational presentation mode below the critical moisture content.J. Pharm. Sci. 79, 799–801.
Yoshioka, S., Aso, Y., Uchiyama, M., 1987. Statistical evaluationof nonisothermal prediction of drug stability. J. Pharm. Sci. 76,794–798.
Young, W.R., 1990. Accelerated temperature pharmaceutical prod-uct stability determinations. Drug Dev. Ind. Pharm. 16, 551–569.
Yu, X., Zipp, G.L., Davidson Jr., G.W.R., 1994. The effect of tem-perature and pH on the solubility of quinolone compounds: esti-mation of heat of fusion. Pharm. Res. 11, 522–527.
Zhan, X., Yin, G., Wang, L., Ma, B., 1997. Exponential heating indrug stability experiment and statistical evaluation of nonisother-mal and isothermal prediction. J. Pharm. Sci. 86, 709–715.
Z onnyi
Z 88.r via
aterman, K.C., Adami, R.C., Hong, J., 2003. Impurities in dproducts. In: Ahuja, S., Alsante, K.M. (Eds.), Handbook of Istion and Characterization of Impurities in Pharmaceuticals.demic Press, San Diego, pp. 75–88.
iltfang, J., Arold, N., Neuhoff, V., 1991. A new multiphasbuffer system for sodium dodecyl sulfate-polyacrylamide
hao, W., Cui, L., Zhou, C., Lin, J., Zhan, X., 2003. Studyphotodecomposition kinetics of nifedipine solution. Dier JuDaxue Xuebao 24, 210–213.
ografi, G., Grandolfi, G.P., Kontny, M.J., Mendenhall, D.W., 19Prediction of moisture transfer in mixtures of solids: transfethe vapor phase. Int. J. Pharm. 42, 77–88.