ac2012-3703: introductoryadsorptionlaboratoryexper- iment · ac2012-3703:...
TRANSCRIPT

AC 2012-3703: INTRODUCTORY ADSORPTION LABORATORY EXPER-IMENT
Dr. Polly R. Piergiovanni, Lafayette College
c©American Society for Engineering Education, 2012

Introductory Adsorption Laboratory Experiment Abstract It is always exciting to bring nonengineering or first year engineering students into the laboratory – they can learn a lot about engineering by working in the space, but the experiment needs to be safe and accessible. This paper describes an adsorption experiment with safe and easy data collection. The analysis can be simple (graphing disappearance of a dye as a function of time) or complex (calculating equilibria, rate expressions and thermodynamic quantities). Groups of students can collect data under different conditions and tell a more complete story about the adsorption process. Background Students may have a basic understanding of adsorption or absorption, but not necessarily understand the difference. Both processes are commonly used in processes familiar to students. Students may have a good understanding of absorption through high school biology and chemistry labs (for example, the absorption of oil, iron, or drugs appear to be common high school laboratory experiments). Adsorption laboratory exercises seem to be less common, although the students may have seen examples of activated carbon used in wastewater treatment, odor removal, or food product decolorization. Or they may have realized that the silica gel packets packaged with new electronic equipment adsorb water from the air to protect the equipment. Because many pollution prevention processes use adsorption, it is useful for all students to have some knowledge of the process. Students who understand basic principles of adsorption will have better insight about the limitations of industrial and environmental processes. Two undergraduate students helped develop a laboratory experiment and analysis to teach nonengineering students or first year engineering students about the adsorption process1. The experiment will be used in an “Engineering for Everyone” course as well as an Introduction to Engineering course for first year engineering students (using slightly different mathematical presentations in the two courses). Assessment results will be available in March 2012 (for the revised ASEE paper). Theory After discussing the definitions of absorption and adsorption, the class focuses on adsorption. The history of Langmuir and Freundlich and their research on adsorption is presented. We diagram the adsorption process and define words such as “equilibrium”, “adsorbate”, “adsorbent” and “bulk fluid”, so the students have a picture of the adsorption process. Adsorption is usually modeled using isotherms, a word which may intimidate many students. However, only an understanding of algebra, logarithms and linear regression is necessary to model the process using a Freundlich or Langmuir isotherm. Background information for the instructor is available in many chemical engineering textbooks2,3 and can be presented in a simplified manner for these students. The Freundlich isotherm is introduced as an empirical model (equation (1)) where qe represents the amount of dye adsorbed at equilibrium, Ce represents the concentration of

dye in the bulk fluid at equilibrium, and k and n are parameters that depend on the adsorbate and adsorbent.
€
qe = k Ce
1n (1)
The equation can be linearized and the temperature dependent constants k and 1/n found by linear regression:
€
lnqe =lnk+1nlnCe (2)
First year engineering students and many nonengineering students can prepare the graphs and perform the regression in Excel with little problem. The Langmuir isotherm assumes a uniform surface, which is reasonable with many fabrics. The isotherm is represented by the equation
€
qe =QbCe
1+bCe
(3)
which can be linearized as
€
1qe
=1Q
+1
QbCe
(4)
Again, the students can use Excel to plot equation (4) and determine the parameters. The constant Q represents the maximum adsorbate that can be adsorbed onto the surface, and b is the isotherm constant. If b is large, and the quantity Q b is much larger than one, the isotherm is favorable. The implications can be discussed in class. Modeling the adsorption kinetics is more complicated, and requires a differential equation. This is probably not too difficult for first year engineering students, but may be for students with less mathematical background. To assist nonengineering students understand a first order process, it is helpful to first show them some examples: flow of fluid from a tank, or the braking of an automobile. They can see how the change occurs rapidly at first, and then slows as time passes. Next, a general first order differential equation can be presented and the terms explained to the students. Finally, the kinetic model for the adsorption process is presented. A pseudo first order model (Equation 5) can be used, where qt represents the amount of dye adsorbed at time t and k1 is the rate constant.
€
dqtdt
=k1(qe −qt ) (5)
Solving equation (5) with the initial condition that qt = 0 at t = 0 yields
€
ln(qe −qt )=lnqe −k1 t (6)

Again, students are able to graph the data and use regression in Excel to obtain estimates of the rate constant k1 and equilibrium adsorption qe. The calculated value of qe can be compared to the experimental value. Procedure Students were assigned to read an introductory article describing adsorption4, followed by the presentation in class. Before going to the lab, they completed a questionnaire, displaying their understanding of adsorption, its vocabulary and the concepts they were going to observe. (See the Appendix for the questionnaire). We also review laboratory safety policies. In the laboratory, they performed the adsorption isotherm experiment. For 14 students, four packets of red KoolAid are added to 1.2 liters of a 4:1 solution of water and vinegar. Various dilutions are prepared (from undiluted to about 1:64) and 151 ml of the solution is distributed to each student. Each student removes a 1 ml sample of the solution to measure the initial dye concentration (Co) using a spectrophotometer. The absorbance is converted to mg dye/ml using a calibration equation. Next, white fabric is weighed, and then immersed in the solution, and the students cover the flasks and place them in an oven, incubator or water bath. The pieces of fabric should be similar in size and small enough to be fully immersed in the liquid. KoolAid adsorbs strongly to protein fabrics, such as wool and silk. While it can stain cotton, polyester and linen fabric, the dye does not adsorb. Any color of KoolAid can be used, but red and green have fewer particulates than blue, pink or yellow colors. (In a future experiment, we will use blue KoolAid, and perform filtration first, to demonstrate another unit operation). Ideally the instructor or lab assistant should swirl the beakers periodically to ensure good contact between dye and fabric, but it is not essential. The students return to the lab the next day to measure the final absorbance of the dye solution (Ce). The amount of dye adsorbed on the fabric is calculated from a mass balance:
€
qe = (Co −Ce )VW
(7)
where V is the volume of dye solution, and W is the mass of the fabric. To perform the kinetics experiment, student groups are given beakers with one, two or eight packets of red KoolAid dissolved in 625 ml of the water/vinegar mixture. The mixtures are kept at a constant temperature, usually between 40 and 90 C. Each group removes a 1 ml sample of the solution to measure the initial dye concentration (Co) using a spectrophotometer. The absorbance is converted to mg dye/ml using the calibration equation. Next, a piece of white fabric is weighed, and then immersed in the solution. The fabric should be small enough to be fully covered by the liquid, but large enough to adsorb most of the dye (approximately 14 g of fabric in 625 ml of liquid was satisfactory for most experiments). The students remove a 1ml sample of liquid every two minutes until the water is clear (and the fabric is colored). This provides Ct data, and equation (7) can be used to calculate qt.
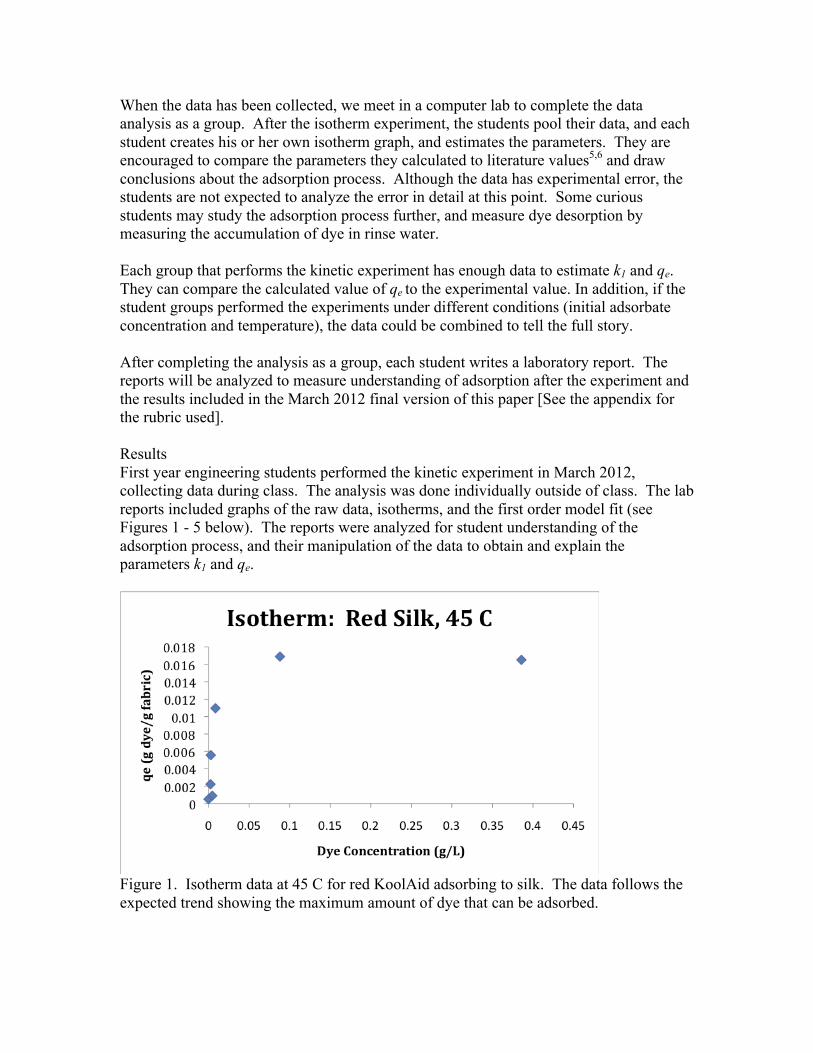
When the data has been collected, we meet in a computer lab to complete the data analysis as a group. After the isotherm experiment, the students pool their data, and each student creates his or her own isotherm graph, and estimates the parameters. They are encouraged to compare the parameters they calculated to literature values5,6 and draw conclusions about the adsorption process. Although the data has experimental error, the students are not expected to analyze the error in detail at this point. Some curious students may study the adsorption process further, and measure dye desorption by measuring the accumulation of dye in rinse water. Each group that performs the kinetic experiment has enough data to estimate k1 and qe. They can compare the calculated value of qe to the experimental value. In addition, if the student groups performed the experiments under different conditions (initial adsorbate concentration and temperature), the data could be combined to tell the full story. After completing the analysis as a group, each student writes a laboratory report. The reports will be analyzed to measure understanding of adsorption after the experiment and the results included in the March 2012 final version of this paper [See the appendix for the rubric used]. Results First year engineering students performed the kinetic experiment in March 2012, collecting data during class. The analysis was done individually outside of class. The lab reports included graphs of the raw data, isotherms, and the first order model fit (see Figures 1 - 5 below). The reports were analyzed for student understanding of the adsorption process, and their manipulation of the data to obtain and explain the parameters k1 and qe.
Figure 1. Isotherm data at 45 C for red KoolAid adsorbing to silk. The data follows the expected trend showing the maximum amount of dye that can be adsorbed.

Figure 2. Langmuir isotherm at 45 C for red KoolAid adsorbing to wool. The slope and intercept were used to find Q, which indicates the adsorption capacity, and b, which is related to the affinity of the binding sites. In this example Q = 0.0188 g dye/g wool, which is similar to the experimental value (0.0177 g dye/g wool). The parameter b is 404 L/g dye, and Qb = 7.6. Since Qb is >> 1, the isotherm is favorable, which is confirmed by observation.
Figure 3. Freundlich isotherm at 45 C for red KoolAid adsorbing to wool. The Freundlich parameters, n and k were estimated to be 2.03 and 0.123 g dye/ g wool, respectively. Values of n greater than 1.0 indicate favorable adsorption, again confirmed by observation.

Figure 4. Typical kinetic data for dyeing wool. This experiment used 1 packet of KoolAid in 625 ml liquid (approximately 0.1 mg dye/ml) and the solution was maintained at 65 C.
Figure 5. First order model fit for wool (0.1 mg dye/ml at 65 C). The calculated value of qe is 0.0168 g dye/g wool, which is similar to the experimental value of 0.0157 g dye/g wool.

Eighteen students submitted laboratory reports, and all but one of them explained the adsorption process correctly (average score 7.9/10; one student omitted the introductory paragraph). Some of the explanations seemed to be adapted from Wikipedia, but several students went beyond the basic information. One student included a description of the driving force, rate constant and equilibrium adsorption concentration. The experiment was introduced to the students using the idea of wastewater treatment, and this seemed to make the concept accessible to the students. All of the students were able to create the graphs, label them correctly and perform the calculations to obtain the parameters (average score 8.1/10). The most common problem was adjusting the significant figures in Excel. The students were able to correctly calculate the parameters, but many did not include units (average score 8.8/10). Finally, the students were also able to explain the meaning of the parameters and the errors involved in the experiment (average score 9.1/10). Conclusions The experiment is safe, simple and, because of the color, interesting to students. As the dye is adsorbed onto the fabric, the students can see the liquid turning clear. This provides a visual example of adsorption, which aids the mathematical analysis. The isotherm experiment can be set up in less than an hour, with the students returning later to collect the final data. The entire kinetic experiment can be completed in two hours. The mathematical analysis is straightforward in Excel. Students may also observe how temperature and concentration affect the total amount of dye adsorbed. Analysis of the students’ reports showed that their understanding of the adsorption process increased and they were able to apply the mathematics to the data. The laboratory experiment can also be modified and used as an outreach experience for younger students. Fabric can be removed from the dye bath at intervals to show how the color becomes darker as more dye molecules adsorb to the fabric. Once the students understand the basic principles of adsorption, they can apply them to other examples: Why do you have to change the water filter in your refrigerator? Why do adsorbents have so much surface area? How long do you think a silica gel packet will protect electronic equipment? References: 1. Wallitsch, E and Smith, A.I., “Kinetics of Dyeing” Undergraduate Poster Presentation, 9/15/2011.
2. McCabe, W.L., Smith, J.C. and Harriott, P., Unit Operations of Chemical Engineering, 7th Edition,
McGraw-Hill, 2005, pages 836 – 841.
3. Seader, J.D., Henley, E.J., Separation Process Principles, 2nd Edition, Wiley, 2006, pages 548 – 613.

4. Felder, R. M., and Rousseau, R. W., Elementary Principles of Chemical Processes, 3rd Edition, Wiley, 2005, pages 275-76.
5. Chairat, M., Rattanaphani, S., Bremer, J.B., Rattanaphani, V., An adsorption and kinetic study of lac dyeing on silk. Dyes and Pigments 2005 (64): 231 – 41.
6. Smith, A.I. and Wallitsch, E., Comparison of Wool and Silk Dyeing Kinetics using Allura (Red No. 20). Subitted to Dyes and Pigments, Summer 2012.

Appendix PrelabQuestionnaireIdentifyeachprocessbelowasadsorptionorabsorption.Identifytheabsorbentandtheadsorbatefortheadsorptionprocesses.
Amaneatsavanillacreampie.Amanhasavanillacreampiethrownonhim.Aredlineisdrawnonawhitepieceofpaper.Poolfilterkeepsthepoolwaterclean.Oxygengasdissolvesinwater.Activatedcharcoalremovespollutantsfromair.Benzenedissolvesinhydrocarbonoil.Ion‐exchangechromatographbeadsseparateaclassofmolecules.Proteinssticktothesurfaceoflargermolecules.
Anisothermdescribestheamountofadsorbatethatattachestotheadsorbentasafunctionofitsconcentrationatconstanttemperature.Fortheadsorptionprocessofadyeattachingtofabric,
whatistheadsorbate?_______________theadsorbent?______________
Sketchwhatanisothermmightlooklikeonthegraphbelow:
Whydoesithavethatshape?Writetheequationthatdescribesthekineticprocessofdyeing:

Usethesketchesbelowtoexplainwhathappensduringthetimeofdyeing,linkingittothekineticequation:
l l l l l l l l ll
l l l l l l l l ll
l l l l l l l l ll
l l l l l l l l ll
l l l l l l l l ll
Time=0min
Time=1min
Time=5min
Time=20min
Time=60min
Fabric
Dyemolecules

Usethediagramstosketchthegraphofthekineticsofdyeingthatyouexpect:

Rubricforgradinglaboratoryreports: Category Excellent
(8–10points)Good
(7–9points)Developing(5–7points)
Score:
Backgroundinformation
Describestheadsorptionprocessclearly.Explainswhatanisothermis.Explainsfirstorderkinetics.
Describestheadsorptionprocessclearly.Canexplainanisotherm,butkineticsarenotasclearlyexplained.
Canclearlydescribeadsorption,butnotwhatanisothermisorkinetics.
Graphs Graphsarecorrectlymade.Axisarelabeled,pointsfordataandlinefortheory.Regressionequationprovidedongraph.
Graphsarecorrectlymadeandlabeledwithoneminorerror.
Graphshaveseveralminor(oramajor)errors.
Calculations Regressionequationusedcorrectlytocalculateisothermparameters,andqeandk1forthekinetics.Valuesincludecorrectunits.
Regressionequationsareusedcorrectly,butvaluesdonothavecorrectunits.
Regressionequationsarenotusedcorrectly.
Conclusions Explainsthemeaningoftheparameterscalculated.Conclusionsarecorrectgiventhestudents’data.
Explainmeaning,butconclusionsdonotfollowthestudents’data.
Conclusionsareunclear.