abstract - agecon searchageconsearch.umn.edu/bitstream/124502/2/odonnell.pdf3 the fixed proportions...
TRANSCRIPT
MARKETING MARGINS AND MARKET POWER IN THE AUSTRALIAN
DAIRY PROCESSING AND RETAILING SECTORS
by
C. J. O’Donnell
Graduate School of Agricultural and Resource Economics
University of New England
Armidale NSW 2350
Abstract
We use a New Empirical Industrial Organisation (NEIO) approach to estimate industry marketing
margins for several Australian dairy products. Our model allows for differences in input- and output-
market conjectural elasticities under the assumption of a fixed proportions production technology. Other
assumptions on the production technology include the use of a single agricultural input to produce
multiple outputs, and substitutability between agricultural and non-agricultural inputs. Two alternative
methods are used to decompose the price of manufacturing milk into the prices of components used to
produce different manufacturing milk products. We estimate margins equations for carton milk, whole-
milk powder (WMP), butter, cheese and skim-milk powder (SMP) using state-level data. Nonlinear least
squares is used to impose a number of inequality constraints implied by economic theory. The results
suggest that, in price-deregulated markets, only three market intermediaries possess market power: carton
milk retailers possess market power in output markets; carton milk processors possess market power in
both input and output markets; and butter processors possess market power in input markets.
Paper prepared for the 43rd Annual Conference of the AARES, Christchurch, New Zealand, 20-22 January 1999. The author acknowledges the generous assistance of Kate Owen who extended and updated an earlier data set used by O’Donnell and Coelli (1997).
2
1. INTRODUCTION
Analysis of market power in non-competitive food industries is increasingly being conducted within a
New Empirical Industrial Organisation (NEIO) (Bresnahan, 1989) framework. A feature of the NEIO
approach is the use of econometric models to estimate parameters of industry marginal cost functions and
measures of industry conduct. Most NEIO studies measure industry conduct by way of conjectural
elasticities (ie. the percentage changes in industry output resulting from one-percentage changes in the
outputs of individual firms). This approach has been used by Schroeter (1988) and Schroeter and Azzam
(1991) to analyse firm conduct in the U.S. meat industry, and by Wann and Sexton (1992) to analyse
behaviour in the U.S. pear processing industry. In this paper we apply the NEIO methodology to the
Australian dairy retailing and processing industry. Our choice of empirical application has been
motivated by recent moves to eliminate price controls on milk products in some Australian states.
A limitation of many NEIO studies is that the assumed form of the production technology is very
simplistic. Schroeter and Azzam, for example, assume that a single homogenous agricultural input is
combined with non-agricultural inputs to produce a single homogenous output. Wann and Sexton assume
that agricultural and non-agricultural inputs are non-substitutable in the production process. Our choice
of empirical application forces us to abandon these assumptions in favour of assumptions which allow a
single agricultural input (eg. manufacturing milk) to be combined with non-agricultural inputs (eg. labour
and capital) to produce several outputs (eg. butter, cheese and powdered milk). We also assume that all
inputs are substitutable.
A second limitation of many NEIO studies is that the conjectural elasticities used to measure firm conduct
in input and output markets are assumed to be equal. Differing degrees of firm concentration in
agricultural input and output markets (arising from differences in geographical scope) usually make this
assumption untenable. Wann and Sexton argue that the assumed equivalence of input- and output-market
conjectural elasticities is usually a corrollary of a fixed proportions assumption on the production
technology. This paper shows how input- and output-market conjectural elasticities can still differ under
a fixed proportions assumption.
3
The fixed proportions assumption is only one of many assumptions we make concerning demands in
output markets, supplies in input markets and the production technologies of market intermediaries.
Some of the important assumptions which make our empirical model tractable are that output demand
functions are linear in prices, input supply functions are linear in the squares of prices (a special case of a
normalised quadratic supply function), and the production technologies of market intermediaries exhibit
constant returns to scale. Less important assumptions are that the production technologies of market
intermediaries are normalised quadratic, and all inputs are normal (ie. increases in outputs are associated
with increases in all inputs). Many of these assumptions are commonplace in the agricultural economics
literature. Importantly, they make it possible to derive linear industry marketing margins equations from
the first-order conditions for profit maximisation by individual firms.
Our empirical work involves the estimation of industry marketing margins equations for carton milk,
whole-milk powder (WMP), butter, cheese and skim-milk powder (SMP), using state-level data. The
estimation process is complicated by our assumption that a single agricultural input can be used to
produce multiple outputs. Thus, the margin for each output must be calculated as the difference between
the output price and an unknown proportion of the single input price. In this paper we use two
methodologies (one deterministic and one stochastic) to decompose the price of manufacturing milk into
the prices of components used to produce different manufacturing milk products. Nonlinear least squares
is then used to estimate the parameters of our margins equations subject to a number of inequality
constraints implied by economic theory. Our results suggest that carton milk processors possess market
power in the purchase and sale of market milk. Carton milk retailers also possess market power in the
sale of market milk. We find that butter processors have market power in the purchase of manufacturing
milk, but no other market intermediaries possess market power in either input or output markets.
The outline of the paper is as follows. Our theoretical model of margins behaviour in the retail and
processing sectors is presented in Section 2. This section gives explicit consideration to the effects of
price regulation at the farmgate level. Estimation methods are discussed in Section 3. Data collection
procedures are presented in Section 4. Results are presented in Section 5 and the paper is concluded in
Section 6.
4
2. THEORETICAL MODEL
In this section we develop a theoretical model of marketing margins determination predicated on
assumptions concerning the production technologies and behavioural objectives of economic agents. For
ease of exposition, and without loss of generality, the model is presented in the context of the Australian
dairy industry. Our interest centres on the form of empirical marketing margins equations in price-
deregulated markets and in markets where a regulating authority sets the price of market milk at the farm-
processor point of exchange.
2.1 Deregulated markets
Let the subscripts m = 1, …, 5 denote carton milk, whole-milk powder (WMP), butter, cheese and skim-
milk powder (SMP). Also let pm represent the price of output m, wm the price of input m, Qm the
aggregate quantity of output m, and Xm the aggregate quantity of input m. We assume that demand in the
output market can be described by a demand function of the form:
(1) Qm = gm(pm) m = 1, …, 5
implying an inverse demand function of the form
(2) pm = gm-1(Qm) m = 1, …, 5.
Market intermediaries (retailers and/or processors) are assumed to face dairy-input supply functions of the
form
(3) Xm = dm(w1, …, w5) m=1, …, 5.
We assume that n = 1, …, N market intermediaries produce output vectors qn = (qn1, …, qn5)' using the
vectors of dairy inputs xn=(xn1, …, xn5)' together with vectors of non-dairy variable inputs (eg. labour and
materials). The prices of these non-dairy variable inputs are included with firm invariant non-price
exogenous variables in the (K1) vector z. The production relationship between each output and
5
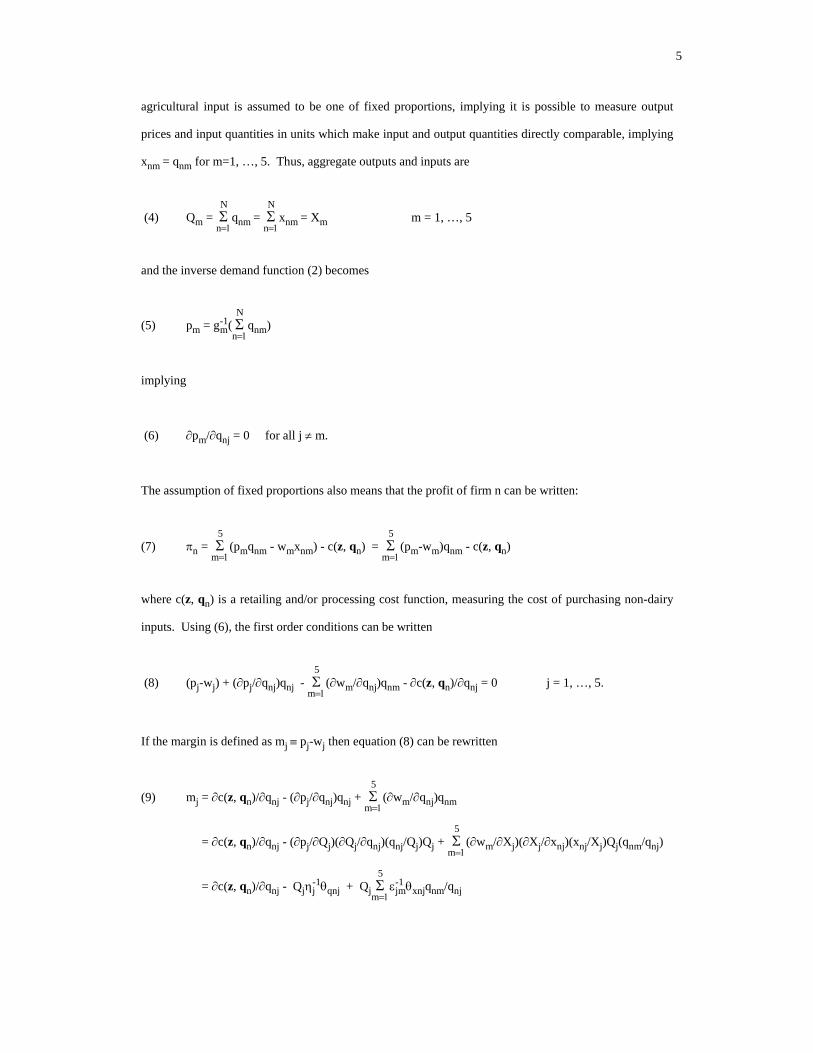
agricultural input is assumed to be one of fixed proportions, implying it is possible to measure output
prices and input quantities in units which make input and output quantities directly comparable, implying
xnm = qnm for m=1, …, 5. Thus, aggregate outputs and inputs are
(4) Qm = n
N qnm =
n
N xnm = Xm m = 1, …, 5
and the inverse demand function (2) becomes
(5) pm = gm-1(
n
N qnm)
implying
(6) pm/qnj = 0 for all j m.
The assumption of fixed proportions also means that the profit of firm n can be written:
(7) n = m
5 (pmqnm - wmxnm) - c(z, qn) =
m
5 (pm-wm)qnm - c(z, qn)
where c(z, qn) is a retailing and/or processing cost function, measuring the cost of purchasing non-dairy
inputs. Using (6), the first order conditions can be written
(8) (pj-wj) + (pj/qnj)qnj - m
5 (wm/qnj)qnm - c(z, qn)/qnj = 0 j = 1, …, 5.
If the margin is defined as mj pj-wj then equation (8) can be rewritten
(9) mj = c(z, qn)/qnj - (pj/qnj)qnj + m
5 (wm/qnj)qnm
= c(z, qn)/qnj - (pj/Qj)(Qj/qnj)(qnj/Qj)Qj + m
5 (wm/Xj)(Xj/xnj)(xnj/Xj)Qj(qnm/qnj)
= c(z, qn)/qnj - Qjj-1qnj+ Qj
m
5 jm
-1 xnjqnm/qnj
6
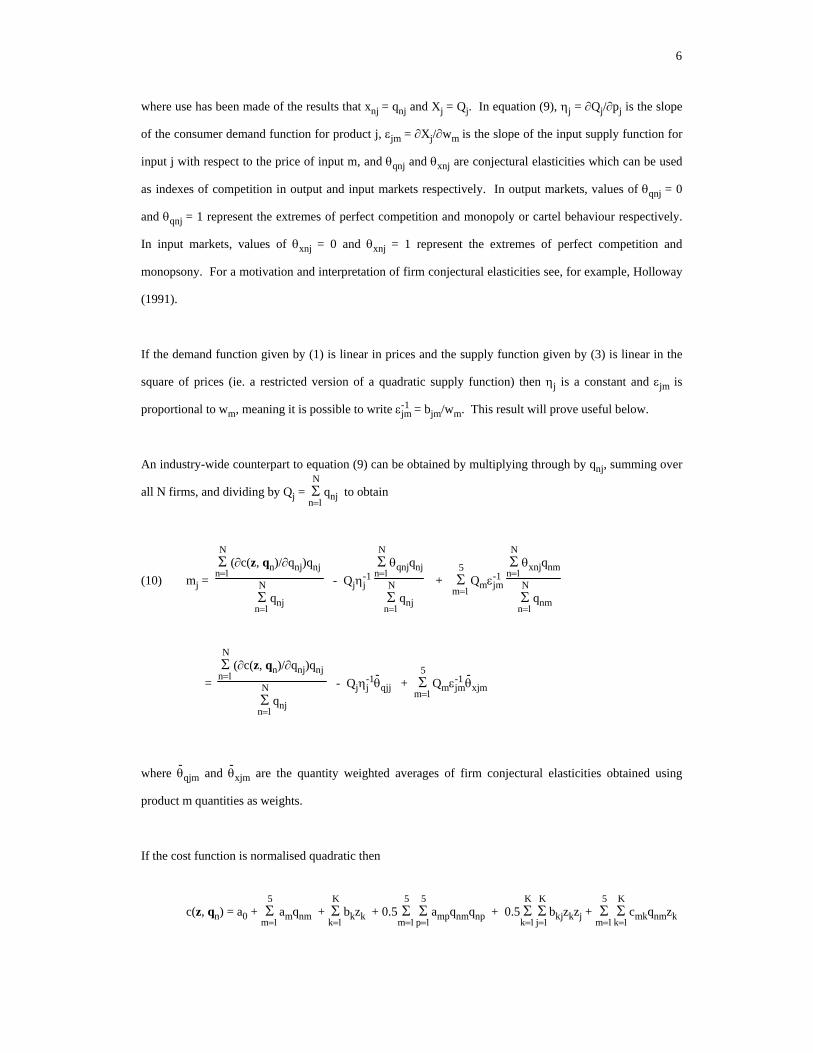
where use has been made of the results that xnj = qnj and Xj = Qj. In equation (9), j = Qj/pj is the slope
of the consumer demand function for product j, jm = Xj/wm is the slope of the input supply function for
input j with respect to the price of input m, and qnj and xnj are conjectural elasticities which can be used
as indexes of competition in output and input markets respectively. In output markets, values of qnj = 0
and qnj = 1 represent the extremes of perfect competition and monopoly or cartel behaviour respectively.
In input markets, values of xnj = 0 and xnj = 1 represent the extremes of perfect competition and
monopsony. For a motivation and interpretation of firm conjectural elasticities see, for example, Holloway
(1991).
If the demand function given by (1) is linear in prices and the supply function given by (3) is linear in the
square of prices (ie. a restricted version of a quadratic supply function) then j is a constant and jm is
proportional to wm, meaning it is possible to write jm-1
= bjm/wm. This result will prove useful below.
An industry-wide counterpart to equation (9) can be obtained by multiplying through by qnj, summing over
all N firms, and dividing by Qj = n
N qnj to obtain
(10) mj = n
N (c(z, qn)/qnj)qnj
n
N qnj
- Qjj-1
n
N qnjqnj
n
N qnj
+ m
5 Qmjm
-1 n
N xnjqnm
n
N qnm
= n
N (c(z, qn)/qnj)qnj
n
N qnj
- Qjj-1
-qjj +
m
5 Qmjm
-1 -
xjm
where -
qjm and -
xjm are the quantity weighted averages of firm conjectural elasticities obtained using
product m quantities as weights.
If the cost function is normalised quadratic then
c(z, qn) = a0 + m
5 amqnm +
k
K bkzk + 0.5
m
5
p
5 ampqnmqnp + 0.5
k
K
j
K bkjzkzj +
m
5
k
K cmkqnmzk
7
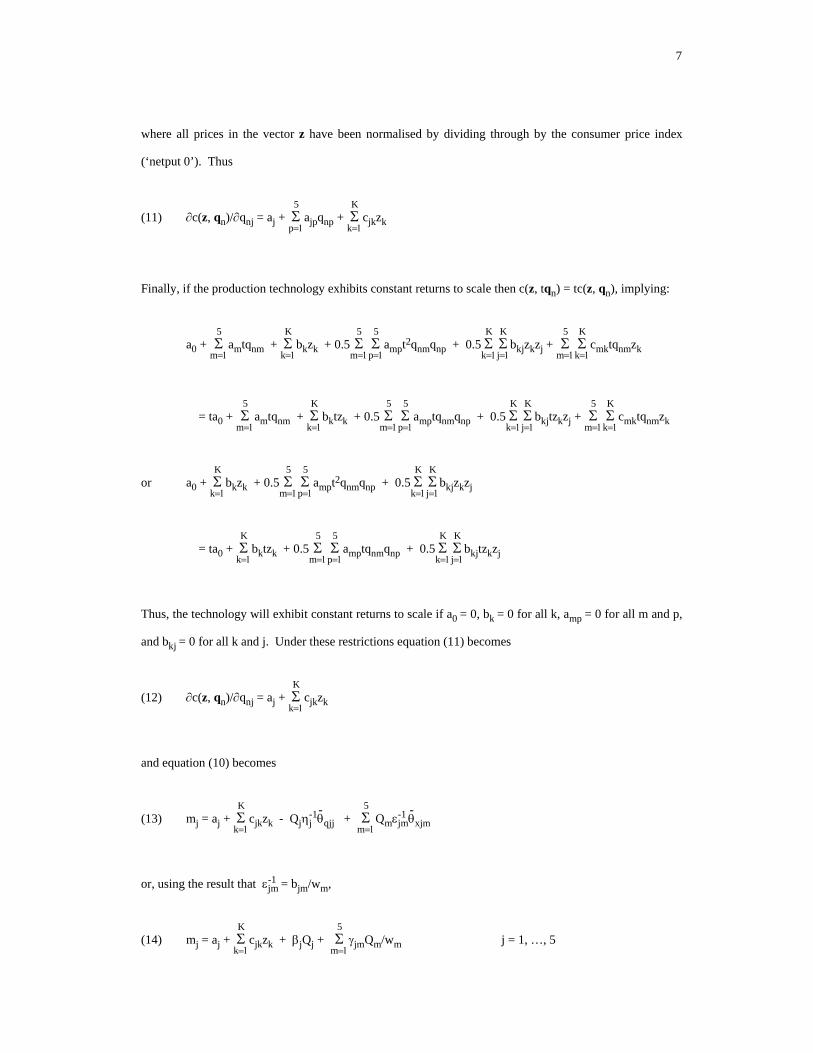
where all prices in the vector z have been normalised by dividing through by the consumer price index
(‘netput 0’). Thus
(11) c(z, qn)/qnj = aj + p
5 ajpqnp +
k
K cjkzk
Finally, if the production technology exhibits constant returns to scale then c(z, tqn) = tc(z, qn), implying:
a0 + m
5 amtqnm +
k
K bkzk + 0.5
m
5
p
5 ampt2qnmqnp + 0.5
k
K
j
K bkjzkzj +
m
5
k
K cmktqnmzk
= ta0 + m
5 amtqnm +
k
K bktzk + 0.5
m
5
p
5 amptqnmqnp + 0.5
k
K
j
K bkjtzkzj +
m
5
k
K cmktqnmzk
or a0 + k
K bkzk + 0.5
m
5
p
5 ampt2qnmqnp + 0.5
k
K
j
K bkjzkzj
= ta0 + k
K bktzk + 0.5
m
5
p
5 amptqnmqnp + 0.5
k
K
j
K bkjtzkzj
Thus, the technology will exhibit constant returns to scale if a0 = 0, bk = 0 for all k, amp = 0 for all m and p,
and bkj = 0 for all k and j. Under these restrictions equation (11) becomes
(12) c(z, qn)/qnj = aj + k
K cjkzk
and equation (10) becomes
(13) mj = aj + k
K cjkzk - Qjj
-1-
qjj + m
5 Qmjm
-1 -
xjm
or, using the result that jm-1
= bjm/wm,
(14) mj = aj + k
K cjkzk + jQj +
m
5 jmQm/wm j = 1, …, 5
8
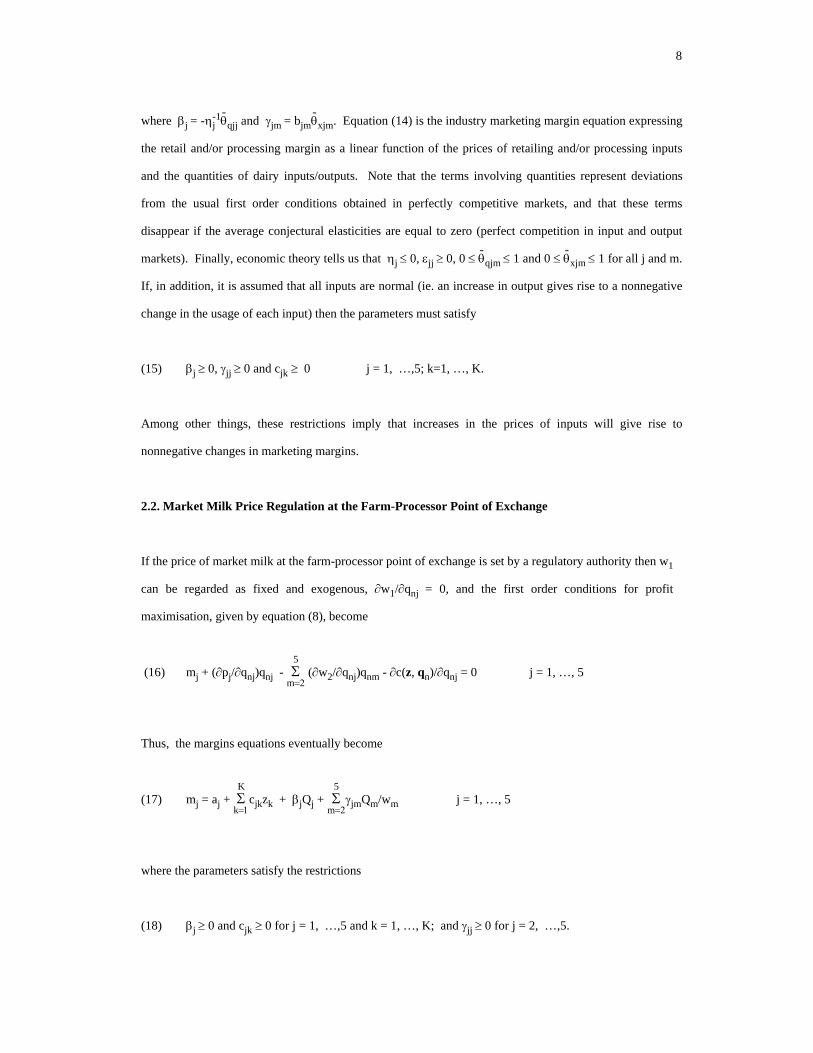
where j = -j-1
-qjj and jm = bjm
-xjm. Equation (14) is the industry marketing margin equation expressing
the retail and/or processing margin as a linear function of the prices of retailing and/or processing inputs
and the quantities of dairy inputs/outputs. Note that the terms involving quantities represent deviations
from the usual first order conditions obtained in perfectly competitive markets, and that these terms
disappear if the average conjectural elasticities are equal to zero (perfect competition in input and output
markets). Finally, economic theory tells us that j 0, jj 0, 0 -
qjm 1 and 0 -
xjm 1 for all j and m.
If, in addition, it is assumed that all inputs are normal (ie. an increase in output gives rise to a nonnegative
change in the usage of each input) then the parameters must satisfy
(15) j 0, jj 0 and cjk 0 j = 1, …,5; k=1, …, K.
Among other things, these restrictions imply that increases in the prices of inputs will give rise to
nonnegative changes in marketing margins.
2.2. Market Milk Price Regulation at the Farm-Processor Point of Exchange
If the price of market milk at the farm-processor point of exchange is set by a regulatory authority then w1
can be regarded as fixed and exogenous, w1/qnj = 0, and the first order conditions for profit
maximisation, given by equation (8), become
(16) mj + (pj/qnj)qnj - m
5 (w2/qnj)qnm - c(z, qn)/qnj = 0 j = 1, …, 5
Thus, the margins equations eventually become
(17) mj = aj + k
K cjkzk + jQj +
m
5 jmQm/wm j = 1, …, 5
where the parameters satisfy the restrictions
(18) j 0 and cjk 0 for j = 1, …,5 and k = 1, …, K; and jj 0 for j = 2, …,5.
9
Production quotas on the amount of market milk farmers can produce are assumed not to impact upon the
amount of market milk processors will use as an input into the production process, other than through
price effects.
3. ESTIMATION METHODS
In deregulated markets the margins equations are given by (14), and the parameters satisfy the restrictions
given by (15). In markets where there is market milk price regulation at the processor-farmgate point of
exchange, marketing margins are given by (17) and the parameters satisfy the restrictions given by (18).
Empirical versions of these equations can be written compactly as
(19) mjt = aj + k
K cjkzkt + jQjt + j1DtQ1t/w1t +
m
5 jmQmt/wmt + vjt j = 1, …, 5
where the vjt are normal random variables with zero means and constant variances vj2 , Dt is a dummy
variable which takes the value 1 when there is no market milk price regulation and 0 otherwise, and the
parameters satisfy the restrictions given by (15).
Retail-farmgate and processor-farmgate margins equations for carton milk and WMP were estimated as an
SUR system. Lack of data prevented the estimation of both types of margins equations for other products.
Instead it was only possible to estimate retail-farmgate margins equations for butter and cheese, and only
processor-farmgate margins for SMP. These margins equations were estimated as single equation models.
In all cases non-linear least squares (NLS) was used to impose the restrictions given by (15).
4. DATA
The data consists of quarterly observations on farmgate prices and outputs of manufacturing and market
milk, and the ex-processor and/or retail prices and quantities of five milk products (carton milk, WMP,
butter, cheese and SMP) in six Australian states for the period 1986(1) to 1997(4). The data set is an
extended and updated version of the data set used by O'Donnell and Coelli. Several observations are
10
missing on the prices or quantities of particular milk products. Thus, only 213 observations were
available to estimate carton-milk margins equations, 133 observations were available to estimate WMP
margins equations, 264 observations were available to estimate butter and cheese equations, and 159
observations were available to estimate the SMP margins equation.
The measurement of margins for manufacturing milk products was problematic for three reasons. First,
all four manufacturing milk products (WMP, butter, cheese and SMP) are joint products, implying that
the single price paid for manufacturing milk is an aggregate of unobserved prices paid for the different
‘components’ of manufacturing milk which can be used to produce different products (eg. solids non-fat,
buttermilk). Second, it is possible to produce different amounts of different products using the same fixed
amount of manufacturing milk. For example, a fixed amount of manufacturing milk can be used to
produce SMP, butter and butter-milk powder (BMP); or it can be used to produce WMP, butter and BMP;
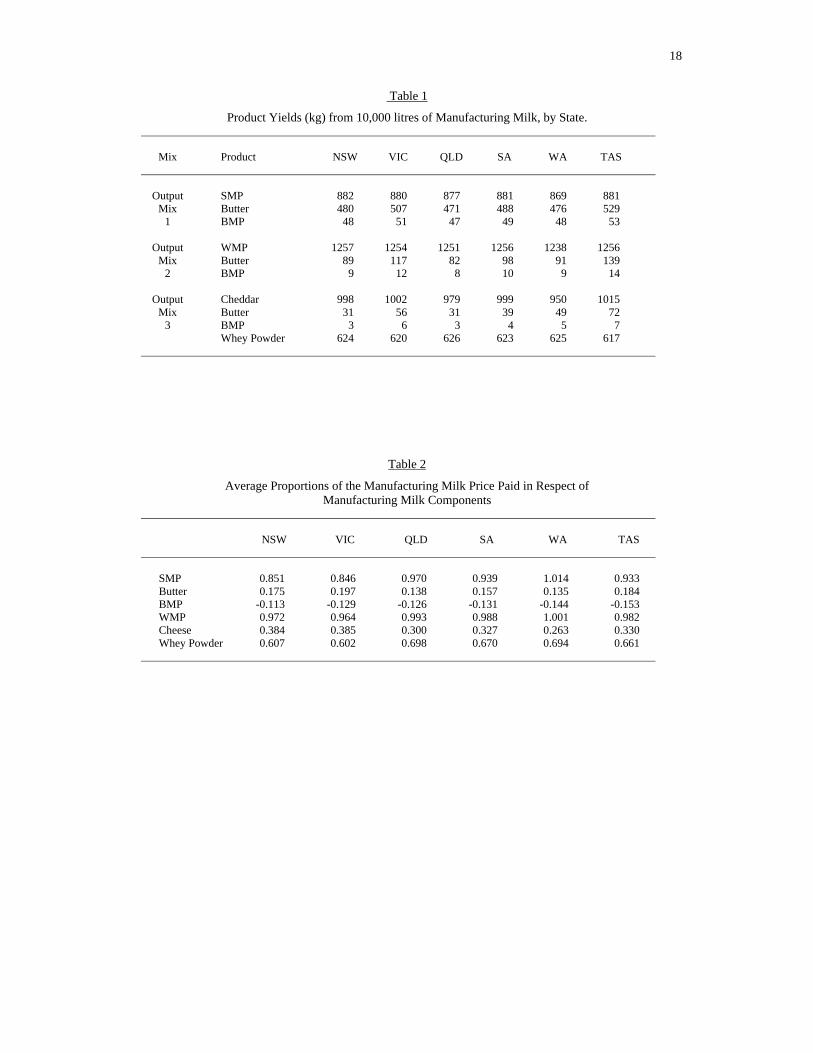
or it can be used to produce cheese, butter, BMP, and whey powder. Finally, differences in milkfat and
protein percentages mean that these mixes of joint outputs can vary from state to state (a summary of
product yields across states, for three common output mixes, is presented in Table 1).
In order to measure margins for the different milk products which can be obtained from the same physical
quantity of manufacturing milk, the manufacturing milk price is broken down into the prices paid for the
different components of manufacturing milk used to produce them. We undertake this decomposition
using two alternative methodologies: a deterministic methodology involving the solution to a set of
simultaneous equations, and a stochastic methodology involving non-linear regression analysis.
Simultaneous Equations Approach
The simultaneous equations approach suggests that approximately 85% of the observed manufacturing
milk price in NSW can be regarded as being payment for the components of manufacturing milk which
can be used to produce SMP, and approximately 18% is regarded as being payment for those components
which can be used to produce butter. These numbers add up to more than one because processors appear
to receive an amount equal to approximately 11% of the manufacturing milk price in return for accepting
nuisance components used for the production of buttermilk powder (BMP). Of course, the manufacturing
11
milk price also reflects payments for components which can be used to produce WMP, cheese and whey
powder.
This apportionment of the manufacturing milk price between various components is based on the figures
appearing in Table 1. Specifically, we assume that observed manufacturing milk prices are simply
weighted averages of the unobserved ‘component prices’, where the weights are given by the component
quantities. Then the figures in Table 1 can be used to obtain equations of the form:
NSW manuf. milk price = [882(NSW SMP component price)
+ 480(NSW butter component price)
+ 48(NSW BMP component price)] / (882+480+48)
NSW manuf. milk price = [1257(NSW WMP component price)
+ 89(NSW butter component price)
+ 9(NSW BMP component price)] / (1257+89+9)
and so on, across states and output mixes, yielding a set of 18 equations in 36 unknown component prices
(six components by six states). It is assumed that all component prices are identical in NSW and Victoria,
and that prices for the components used in the production of BMP, SMP and whey powder are equal
across all states, leaving a set of 18 equations in 18 unknowns. Solving these equations for the unknowns
makes it possible to express the prices of the different components in each state as functions of the
manufacturing milk prices in all states (the full set of equations and the precise method of solution are
available in a Technical Appendix available on request). Thus, for example, the average manufacturing
milk prices in each state can be used to find the average NSW component price for SMP. Expressing this
average NSW component price for SMP as a proportion of the average NSW manufacturing milk price
yields 0.85147 (or approximately 85%). By way of further example, expressing the average NSW
component price for butter as a proportion of the average NSW manufacturing milk price yields 0.17518
(or approximately 18%).
12
These average proportions were used to generate component prices in different states and time periods,
and these component prices are regarded as the farmgate prices of manufacturing milk products. The
average proportions differ by state and by product and are reported in Table 2.
Regression Approach
In the regression approach we assume
(20) wj = j the price of manufacturing milk)
where the j are unknown parameters to be estimated. We simply substitute (20) into (19) and rearrange
the result to leave the output price as the dependent variable. Non-linear least squares is then used to
estimate the seemingly unrelated regression (SUR) system of seven equations describing the prices of five
products at up to two points of exchange. The parameters are estimated subject to the restrictions (15)
and the additional restrictions 0 j 1 and j
5j = 1. The pattern of missing prices and quantities in
the data set means that only 104 observations are available to estimate the system. Using this
methodology we estimate that 56% of the observed manufacturing milk price can be regarded as being
payment for those components which can be used to produce SMP, approximately 38% can be regarded
as being payment for components used to produce cheese, and approximately 6% can be regarded as
payment for components used to produce WMP.
Irrespective of whether the simultaneous equations method or the regression method is used to break
down the manufacturing milk price, the application of our estimated percentages to observed farmgate
manufacturing milk prices yields farmgate prices for manufacturing milk products on a cents/litre basis
(because the manufacturing milk price is measured in cents/litre, and the application of these percentages
simply apportions this price between different products). However, it is convenient to measure margins
for manufacturing milk products in terms of cents/kg rather than cents/litre. For WMP this means
multiplying the cents/litre price by 10/1.25 (because 10 litres are needed to produce approximately 1.25
kg), for cheese it means multiplying the cents/litre price by 10, and for SMP it means multiplying the
cents/litre price by 10/0.88. In the case of butter there are three output mixes which yield different
quantities of butter so the cents/litre price is multiplied by 30/(0.5+0.11+0.05) (using the average).
13
Reported retail prices of manufacturing milk products are converted to a cents/kg basis by dividing the
WMP retail price by 0.75 and dividing the butter and cheese retail prices by 0.5. All quantities are left in
their original units (tonnes or kg): note from the form of the estimating equations that multiplying or
dividing quantities by 1000 will simply have the effect of increasing or decreasing the order of the
coefficients of the quantity variables by 1000.
5. RESULTS
All results were generated using SHAZAM (White, 1997). Our estimation methods ensure that all
estimated coefficients are correctly signed. Thus, our discussion of the empirical results is mainly limited
to the statistical significance of the estimated coefficients and the implications this may have for the
capacity of different market agents to exert market power.
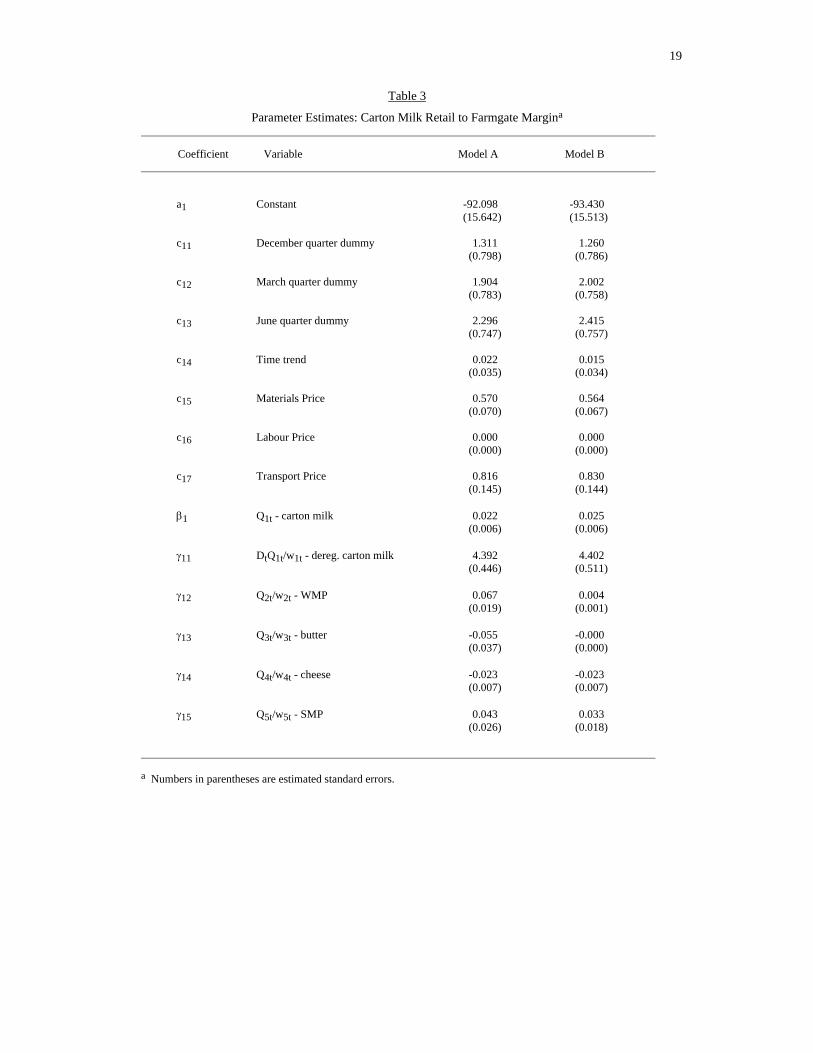
Estimates of the coefficients of the carton milk retail to farmgate margins equation are presented in Table 3.
The two columns in Table 3 are the estimates obtained when the simultaneous equations method (Model A)
and the regression method (Model B) are used to apportion the manufacturing milk price. There are several
implications to be drawn from Table 3. First, our estimate of 1 is significantly different from zero1,
implying carton milk retailers possess market power in the sale of market milk to consumers. If the slope
of the consumer demand function for carton milk at the retail level is, for example, -0.5 then our estimate of
1 implies that -
q11, the conjectural elasticity which measures the percentage change in aggregate output in
response to a one-percentage change in the output of an individual firm, is approximately 0.01. Second, our
estimate of 11 is also significantly different from zero, with the implication that, in deregulated markets,
carton milk processors possess market power in the purchase of market milk from farmers. Third, materials
and transport prices have a statistically significant impact on the size of the carton milk retail to farmgate
margin, but labour prices do not. Interestingly, the estimated labour price coefficient is exactly zero, with
estimated standard error exactly zero. This is a direct consequence of the sampling theory approach to
imposing inequality constraints: when the constraint is binding, parameter estimates are placed exactly on
the inequality boundary. Fourth, after accounting for all other price and quantity effects, the margin
appears to be significantly greater in the March and June quarters, by approximately 2 cents/litre/quarter.
1 The usual t statistic is asymptotically standard normal even though the parameter is inequality
constrained and the null hypothesis places it at the inequality boundary. See Gourieroux et al (1982).

14
Finally, the similarity between our Model A and Model B results suggests that these conclusions are robust
to the method of apportioning the manufacturing milk price between different outputs.
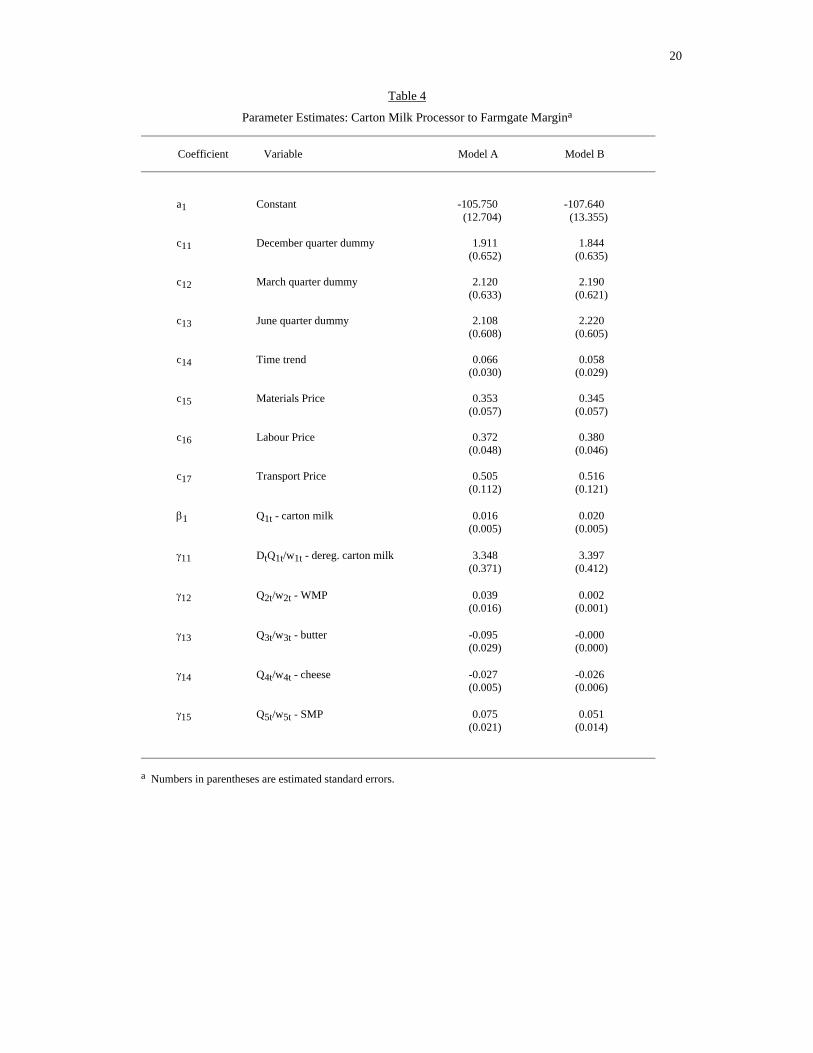
Estimates of the coefficients of the carton milk processor to farmgate margins equation are presented in
Table 4. Again, our estimates of 1 and 11 are significantly different from zero, suggesting that carton-
milk processors possess market power in both output and (deregulated) input markets. These results are
consistent with the results presented in Table 3. The estimates also suggest that labour, materials and
transport prices all have a statistically significant impact on the processor-farmgate margin. Finally, after
accounting for all input price and quantity effects, it appears that processor to farmgate carton milk
margins are higher in the December, March and June quarters, and have been increasing over time at the
low rate of approximately 0.06 cents/litre per annum.
Estimates of the coefficients of the WMP retail to farmgate margins equation are presented in Table 5. It
is evident from this table that WMP retailers possess no market power in the sale of WMP to consumers
(our Model A and Model B estimates of 2 are exactly zero), nor do WMP processors possess market
power in the purchase of manufacturing milk from farmers (our Model A and Model B estimates of 22
are not significantly different from zero). The estimates suggest that, after accounting for all input price
and quantity effects, the WMP retail to farmgate margin has been falling at a rate of approximately 2 or 3
cents/kg per annum.
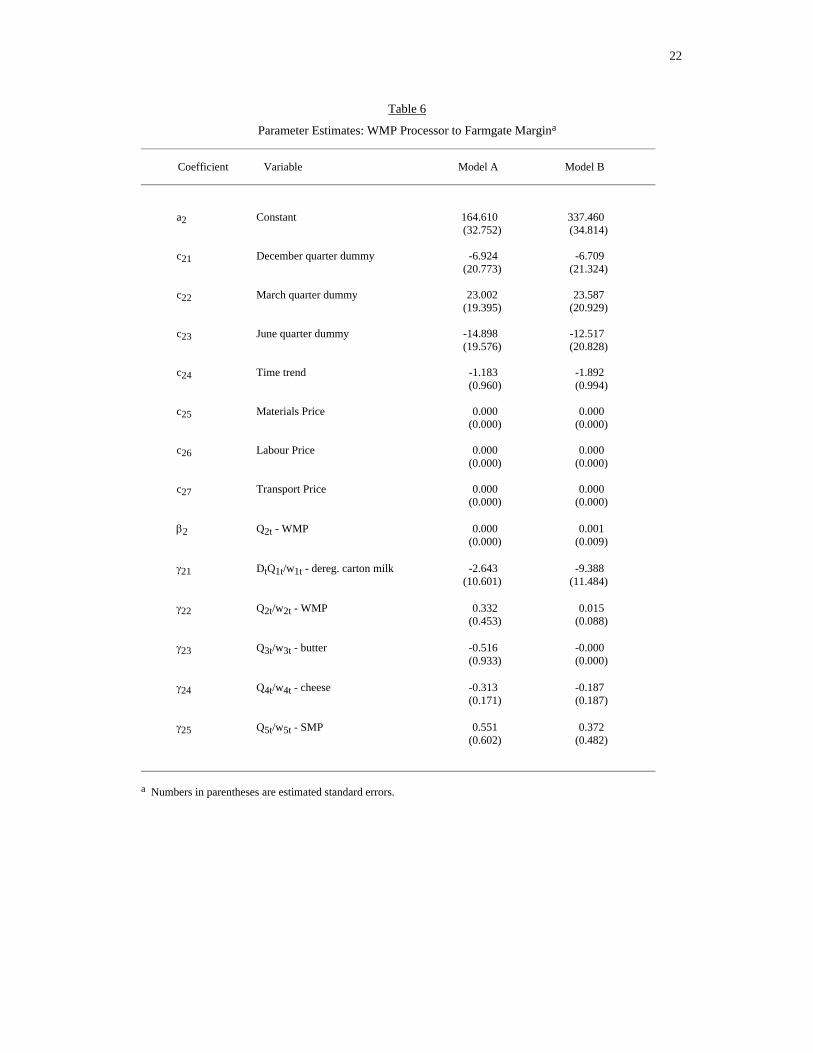
Results for the WMP processor to farmgate margins equation are presented in Table 6. Our Model A and
Model B estimates of 22 are not significantly different from zero, confirming that WMP processors
possess no market power in the purchase of manufacturing milk from farmers. Our estimates of 2 also
suggest that WMP processors possess no market power in the sale of WMP to retailers. Finally, in line
with the decline over time in the retail to farmgate WMP margin, the processor to farmgate WMP margin
has been shrinking at a rate of approximately 2 cents/kg per annum.
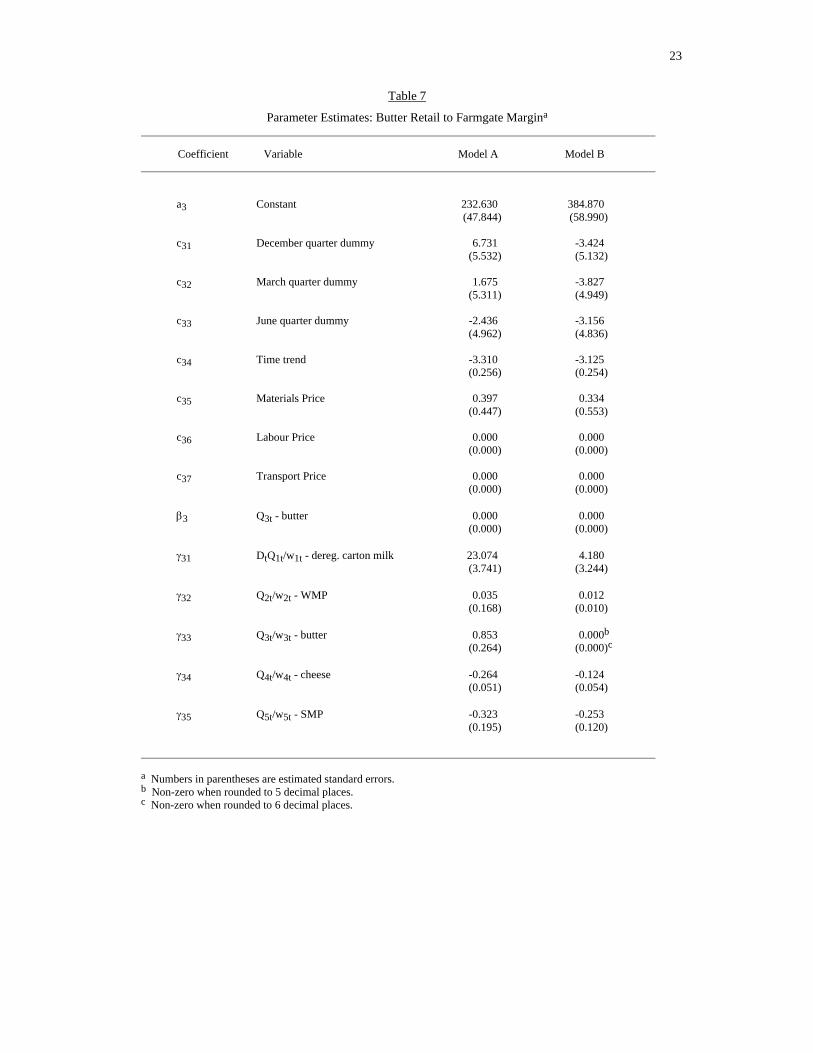
Results from estimating the butter retail to farmgate margin are reported in Table 7. Our estimates of 3
are exactly zero, implying butter retailers have no market power in the sale of butter to consumers.
However, our estimates of 33 are statistically significant, suggesting that butter processors have market
power in the purchase of manufacturing milk from farmers. Materials, labour and transport prices appear
15
not to have any significant impact on the margin. There is some evidence that butter margins increase
with increases in the production of carton milk and decreases in the production of cheese and SMP,
reflecting the nature of the joint production technology. After accounting for all input price and quantity
effects, the butter retail to farmgate margin has been decreasing over time, at a rate of approximately 3.3
cents/kg per annum.
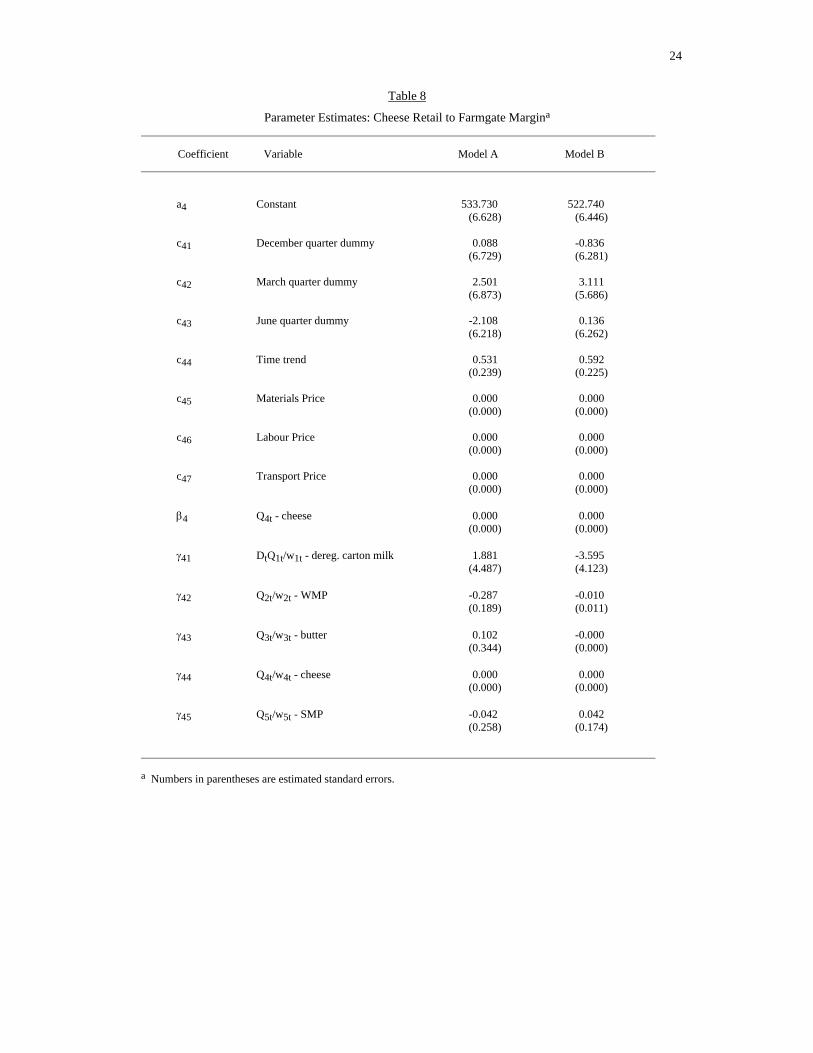
Estimates of the coefficients of the cheese retail to farmgate margins equation are presented in Table 8.
Cheese retailers and processors appear to have no market power in either the sale of cheese to consumers
or the purchase of manufacturing milk from farmers. There appear to be no price or quantity variables
influencing cheese retail to farmgate margins. The only variable influencing the margin appears to be the
passage of time: cheese margins appear to be increasing at a rate of approximately 0.5 cents/kg per
annum.
Our final set of estimates are for SMP processor to farmgate margins, and these are presented in Table 9.
Again, SMP processors appear to have no market power in either input or output markets. Moreover,
there is evidence that SMP margins vary with variations in the production levels of carton milk, butter
and cheese, confirming the joint product relationships identified in Table 7. Finally, after all price and
quantity effects are accounted for, SMP margins appear to have been increasing over time, at a rate of
somewhere between 1 and 2 cents/kg per annum.
6. CONCLUSION
We have used economic theory to derive a set of industry marketing margins equations for five dairy
products (carton milk, whole-milk powder, butter, cheese and skim-milk powder) at the retail and
processor levels. Our theoretical model permits conjectural elasticities in input and output markets to
differ, and allows for multiple outputs to be produced using a single agricultural input. Lack of data on
some retail and ex-processor prices has prevented the estimation of retail-farmgate and processor-
farmgate margins for some products. Many of the estimated coefficients were constrained to possess the
signs implied by economic theory, and all coefficients have good statistical properties.
16
The results suggest that, in price-deregulated markets, carton milk retailers and processors possess market
power in the sale of carton milk, and carton milk processors possess market power in the purchase of
market milk from farmers. Butter processors also appear to possess market power in the purchase of
manufacturing milk. It appears that no other market intermediaries possess market power in either input
or output markets.
The usefulness of our empirical results is limited by our inability to separately identify the slopes of our
input demand and output supply functions, and therefore the conjectural elasticities. The identification of
these quantities is possible only by including these functions in an extended empirical model. It is also
possible to extend the theoretical model by considering alternative and possibly more general functional
forms, although this may result in nonlinear margins equations which may be difficult to estimate.
Assuming a normalised quadratic input supply or output demand function, for example, will result in
margins equations which are highly nonlinear and where functions of the parameters must satisfy highly
nonlinear inequality constraints. The sampling theory approach we have used to impose inequality
constraints in this paper has the drawback that if the constraints are binding then our estimates necessarily
take values on the inequality boundary (ie. at zero), and this is inefficient because it ignores sample
information away from the boundary. Future research might focus on overcoming this drawback by
estimating the model within a Bayesian framework.
17
REFERENCES
Bresnahan, T.F. (1989) 'Empirical Studies of Industries with Market Power'. In Schmalensee, R. and R. Willig
(eds.), Handbook of Industrial Organisation. Amsterdam, North-Holland.
Gourieroux, C., A. Holly and A. Monfort (1982) 'Likelihood Ratio Test, Wald Test, and Kuhn-Tucker Test in
Linear Models with Inequality Constraints on the Regression Parameters'. Econometrica
50(1):63-80.
Holloway, G.J. (1991) ‘The Farm-Retail Price Spread in an Imperfectly Competitive Food Industry’. American
Journal of Agricultural Economics, 73(4):979-989.
O'Donnell, C.J. and T. Coelli (1997) 'Marketing Margins for Australian Dairy Products'. Appendix 1 of
the NSW DFA submission to the Hilmer Competition Policy Review.
Schroeter, J. (1988) 'Estimating the Degree of Market Power in the Beef Packing Industry'. Review of
Economics and Statistics, 70:158-62.
Schroeter, J. and A. Azzam (1991) ‘Marketing Margins, Market Power, and Price Uncertainty’. American
Journal of Agricultural Economics, 73(4):990-999.
Wann, J.J. and R.J. Sexton (1992) 'Imperfect Competition in Multiproduct Food Industries with Application to
Pear Processing'. American Journal of Agricultural Economics, 74(4):980-990.
White, K.J. (1997) SHAZAM Users Reference Manual Version 8.0. McGraw-Hill.
18
Table 1
Product Yields (kg) from 10,000 litres of Manufacturing Milk, by State.
Mix Product NSW VIC QLD SA WA TAS
Output SMP 882 880 877 881 869 881 Mix Butter 480 507 471 488 476 529 1 BMP 48 51 47 49 48 53 Output WMP 1257 1254 1251 1256 1238 1256 Mix Butter 89 117 82 98 91 139 2 BMP 9 12 8 10 9 14 Output Cheddar 998 1002 979 999 950 1015 Mix Butter 31 56 31 39 49 72 3 BMP 3 6 3 4 5 7 Whey Powder 624 620 626 623 625 617
Table 2
Average Proportions of the Manufacturing Milk Price Paid in Respect of Manufacturing Milk Components
NSW VIC QLD SA WA TAS
SMP 0.851 0.846 0.970 0.939 1.014 0.933 Butter 0.175 0.197 0.138 0.157 0.135 0.184 BMP -0.113 -0.129 -0.126 -0.131 -0.144 -0.153 WMP 0.972 0.964 0.993 0.988 1.001 0.982 Cheese 0.384 0.385 0.300 0.327 0.263 0.330 Whey Powder 0.607 0.602 0.698 0.670 0.694 0.661
19
Table 3
Parameter Estimates: Carton Milk Retail to Farmgate Margina
Coefficient Variable Model A Model B
a1 Constant -92.098 -93.430 (15.642) (15.513)
c11 December quarter dummy 1.311 1.260 (0.798) (0.786)
c12 March quarter dummy 1.904 2.002 (0.783) (0.758) c13 June quarter dummy 2.296 2.415 (0.747) (0.757) c14 Time trend 0.022 0.015 (0.035) (0.034) c15 Materials Price 0.570 0.564 (0.070) (0.067) c16 Labour Price 0.000 0.000 (0.000) (0.000) c17 Transport Price 0.816 0.830 (0.145) (0.144) 1 Q1t - carton milk 0.022 0.025 (0.006) (0.006) 11 DtQ1t/w1t - dereg. carton milk 4.392 4.402 (0.446) (0.511) 12 Q2t/w2t - WMP 0.067 0.004 (0.019) (0.001) 13 Q3t/w3t - butter -0.055 -0.000 (0.037) (0.000) 14 Q4t/w4t - cheese -0.023 -0.023 (0.007) (0.007) 15 Q5t/w5t - SMP 0.043 0.033 (0.026) (0.018)
a Numbers in parentheses are estimated standard errors.
20
Table 4
Parameter Estimates: Carton Milk Processor to Farmgate Margina
Coefficient Variable Model A Model B
a1 Constant -105.750 -107.640 (12.704) (13.355)
c11 December quarter dummy 1.911 1.844 (0.652) (0.635)
c12 March quarter dummy 2.120 2.190 (0.633) (0.621) c13 June quarter dummy 2.108 2.220 (0.608) (0.605) c14 Time trend 0.066 0.058 (0.030) (0.029) c15 Materials Price 0.353 0.345 (0.057) (0.057) c16 Labour Price 0.372 0.380 (0.048) (0.046) c17 Transport Price 0.505 0.516 (0.112) (0.121) 1 Q1t - carton milk 0.016 0.020 (0.005) (0.005) 11 DtQ1t/w1t - dereg. carton milk 3.348 3.397 (0.371) (0.412) 12 Q2t/w2t - WMP 0.039 0.002 (0.016) (0.001) 13 Q3t/w3t - butter -0.095 -0.000 (0.029) (0.000) 14 Q4t/w4t - cheese -0.027 -0.026 (0.005) (0.006) 15 Q5t/w5t - SMP 0.075 0.051 (0.021) (0.014)
a Numbers in parentheses are estimated standard errors.

21
Table 5
Parameter Estimates: WMP Retail to Farmgate Margina
Coefficient Variable Model A Model B
a2 Constant 463.260 646.840 (16.826) (14.721)
c21 December quarter dummy 7.712 8.249 (9.869) (8.546)
c22 March quarter dummy -2.977 -2.986 (9.394) (7.968) c23 June quarter dummy 7.540 9.215 (9.349) (7.836) c24 Time trend -2.494 -3.325 (0.508) (0.428) c25 Materials Price 0.000 0.000 (0.000) (0.000) c26 Labour Price 0.000 0.000 (0.000) (0.000) c27 Transport Price 0.000 0.000 (0.000) (0.000) 2 Q2t - WMP 0.000 0.000 (0.000) (0.000) 21 DtQ1t/w1t - dereg. carton milk 13.531 9.479 (5.028) (4.616) 22 Q2t/w2t - WMP 0.061 0.012 (0.224) (0.011) 23 Q3t/w3t - butter 0.278 0.000 (0.505) (0.000) 24 Q4t/w4t - cheese -0.130 -0.152 (0.095) (0.085) 25 Q5t/w5t - SMP -0.071 -0.047 (0.321) (0.195)
a Numbers in parentheses are estimated standard errors.
22
Table 6
Parameter Estimates: WMP Processor to Farmgate Margina
Coefficient Variable Model A Model B
a2 Constant 164.610 337.460 (32.752) (34.814)
c21 December quarter dummy -6.924 -6.709 (20.773) (21.324)
c22 March quarter dummy 23.002 23.587 (19.395) (20.929) c23 June quarter dummy -14.898 -12.517 (19.576) (20.828) c24 Time trend -1.183 -1.892 (0.960) (0.994) c25 Materials Price 0.000 0.000 (0.000) (0.000) c26 Labour Price 0.000 0.000 (0.000) (0.000) c27 Transport Price 0.000 0.000 (0.000) (0.000) 2 Q2t - WMP 0.000 0.001 (0.000) (0.009) 21 DtQ1t/w1t - dereg. carton milk -2.643 -9.388 (10.601) (11.484) 22 Q2t/w2t - WMP 0.332 0.015 (0.453) (0.088) 23 Q3t/w3t - butter -0.516 -0.000 (0.933) (0.000) 24 Q4t/w4t - cheese -0.313 -0.187 (0.171) (0.187) 25 Q5t/w5t - SMP 0.551 0.372 (0.602) (0.482)
a Numbers in parentheses are estimated standard errors.
23
Table 7
Parameter Estimates: Butter Retail to Farmgate Margina
Coefficient Variable Model A Model B
a3 Constant 232.630 384.870 (47.844) (58.990)
c31 December quarter dummy 6.731 -3.424 (5.532) (5.132)
c32 March quarter dummy 1.675 -3.827 (5.311) (4.949) c33 June quarter dummy -2.436 -3.156 (4.962) (4.836) c34 Time trend -3.310 -3.125 (0.256) (0.254) c35 Materials Price 0.397 0.334 (0.447) (0.553) c36 Labour Price 0.000 0.000 (0.000) (0.000) c37 Transport Price 0.000 0.000 (0.000) (0.000) 3 Q3t - butter 0.000 0.000 (0.000) (0.000) 31 DtQ1t/w1t - dereg. carton milk 23.074 4.180 (3.741) (3.244) 32 Q2t/w2t - WMP 0.035 0.012 (0.168) (0.010) 33 Q3t/w3t - butter 0.853 0.000b (0.264) (0.000)c 34 Q4t/w4t - cheese -0.264 -0.124 (0.051) (0.054) 35 Q5t/w5t - SMP -0.323 -0.253 (0.195) (0.120)
a Numbers in parentheses are estimated standard errors. b Non-zero when rounded to 5 decimal places. c Non-zero when rounded to 6 decimal places.
24
Table 8
Parameter Estimates: Cheese Retail to Farmgate Margina
Coefficient Variable Model A Model B
a4 Constant 533.730 522.740 (6.628) (6.446)
c41 December quarter dummy 0.088 -0.836 (6.729) (6.281)
c42 March quarter dummy 2.501 3.111 (6.873) (5.686) c43 June quarter dummy -2.108 0.136 (6.218) (6.262) c44 Time trend 0.531 0.592 (0.239) (0.225) c45 Materials Price 0.000 0.000 (0.000) (0.000) c46 Labour Price 0.000 0.000 (0.000) (0.000) c47 Transport Price 0.000 0.000 (0.000) (0.000) 4 Q4t - cheese 0.000 0.000 (0.000) (0.000) 41 DtQ1t/w1t - dereg. carton milk 1.881 -3.595 (4.487) (4.123) 42 Q2t/w2t - WMP -0.287 -0.010 (0.189) (0.011) 43 Q3t/w3t - butter 0.102 -0.000 (0.344) (0.000) 44 Q4t/w4t - cheese 0.000 0.000 (0.000) (0.000) 45 Q5t/w5t - SMP -0.042 0.042 (0.258) (0.174)
a Numbers in parentheses are estimated standard errors.

25
Table 9
Parameter Estimates: SMP Processor to Farmgate Margina
Coefficient Variable Model A Model B
a5 Constant -70.991 37.289 (15.639) (13.212)
c51 December quarter dummy -6.318 -2.276 (9.904) (8.967)
c52 March quarter dummy 17.293 16.399 (9.913) (8.747) c53 June quarter dummy 4.864 2.585 (10.339) (8.912) c54 Time trend 1.635 0.960 (0.456) (0.387) c55 Materials Price 0.000 0.000 (0.000) (0.000) c56 Labour Price 0.000 0.000 (0.000) (0.000) c57 Transport Price 0.000 0.000 (0.000) (0.000) 5 Q5t - SMP 0.000 0.000 (0.000) (0.002) 51 DtQ1t/w1t - dereg. carton milk -11.499 -4.774 (5.472) (4.830) 52 Q2t/w2t - WMP -0.282 -0.016 (0.269) (0.014) 53 Q3t/w3t - butter -1.291 -0.000 (0.505) (0.000) 54 Q4t/w4t - cheese 0.306 0.214 (0.098) (0.087) 55 Q5t/w5t - SMP 0.590 0.299 (0.321) (0.330)
a Numbers in parentheses are estimated standard errors.