about dundee 2016 · ... comics and video games. ... comics including the beano and dandy, orange...
TRANSCRIPT

About Dundee 2016 l dundeecity.gov.uk 1
ABOUT DUNDEE
2016statistics
demographicsgeneral reference material

About Dundee 2016 l dundeecity.gov.ukAbout Dundee 2016 l dundeecity.gov.uk 2

About Dundee 2016 l dundeecity.gov.uk 3
FOREWORD
Welcome to About Dundee 2016, the thirteenth edition of the booklet. About Dundee is a compilation of frequently requested, useful statistics about Dundee. The information is provided in both tabular and graphical form, with accompanying comments on some of the main points to note.
Where possible the most recent figures available at the time of production have been used. In some categories the only information available is from the 2011 Census. All the information from this booklet may be copied or referred to, providing the appropriate acknowledgement of the source is clearly stated.
Sources are given at the foot of each table, graph, map and commentary. Maps have been included to provide a schematic overview. Requests for further information should be directed to the email address shown below.
Main access to the document is available online, enabling individual pages to be printed off or copied and pasted.
The booklet is available at:
http://www.dundeepartnership.co.uk/content/about-dundee
The booklet is produced by the Corporate Information and Research Team who work within the Chief Executive Department.
Contact Details: Dundee City Council Corporate Information and Research TeamChief Executive Department8 City SquareDundeeDD1 3BG
E-mail: [email protected]

About Dundee 2016 l dundeecity.gov.ukAbout Dundee 2016 l dundeecity.gov.uk 4
CONTENTS Page
1 Introduction 1
2 Dundee at a Glance 3
3 Population 4
4 Health 19
5 Education 34
6 Economy 42
7 Households 52
8 Safer and Stronger Communities 61
9 Scottish Index of Multiple Deprivation 65
10 Political Representation 71
11 Tourism 75
12 Climate 78
13 Environment 79
14 Transport 82
About Dundee 2016 l dundeecity.gov.uk 5
SOURCES
The following are some of the sources used in the compilation of this booklet.
Scottish Census 2011 – Scottish Census Statistics www.scotlandscensus.gov.uk
NRS- National Records of Scotland www.nrscotland.gov.uk
Statistics.Gov.Scot {Beta Site} – Formerly Scottish Neighbourhood Statistics http://statistics.gov.scot
RoS- Register of Scotland www.ros.gov.uk
NOMIS – Official Labour Market Statistics www.nomisweb.co.uk/Default.asp
Scottish Government www.scotland.gov.uk/Home
HESA – Higher Education Statistics Agencywww.hesa.ac.uk
ISD – Information Services Division www.isdscotland.org
Transport Scotlandwww.transportscotland.gov.uk
Visit Scotlandwww.visitscotland.com
Met Office www.metoffice.gov.uk

About Dundee 2016 l dundeecity.gov.ukAbout Dundee 2016 l dundeecity.gov.uk 6

About Dundee 2016 l dundeecity.gov.uk 1
INTRODUCTION
Dundee is Scotland’s fourth largest city and is situated on the north coast of the mouth of the Tay Estuary, in a stunning location. Edinburgh lies 60 miles to the south and Aberdeen 67 miles to the north.
The most recent estimate of Dundee’s population is 148,210 (National Records of Scotland (NRS) 2015 Mid-year population estimate). Dundee has a sizeable student population, and is home to the University of Dundee, Abertay University and Dundee & Angus College.
The Dundee City Council area covers 60 square kilometres and is, geographically, the smallest local authority area in Scotland. It is bordered by Perth and Kinross Council to the west and Angus Council to the north and east. The former Tayside Regional Council area previously covered all three councils, and Dundee continues to serve as the regional centre for this area and North-East Fife, with an estimated catchment population of some 400,000 people.
Dundee is Scotland's sunniest city, with an average of over 1,500 hours of sunshine per year from 1971 to 2000.
Easy access is available in Dundee to the main road and rail networks. The A90 Edinburgh to Aberdeen Road passes through the City, and the Tay Road Bridge connects to North-East Fife. Regular ScotRail services between Glasgow and Aberdeen, and Edinburgh and Aberdeen stop at Dundee, as do services between London Kings Cross and Aberdeen. Scottish City Link and Stagecoach operate bus services between Dundee and Perth, Edinburgh, Glasgow, Aberdeen, Fife and other destinations.
Dundee Airport is the most convenient fly-in destination for some 1,000 square miles of Central Scotland. Situated only two miles from Dundee City Centre, and less than 10 minutes by taxi from mainline rail and bus stations, it affords quick and easy access to Fife via the nearby Tay Road Bridge, and lies within five minutes of the main Scottish Trunk Road network. There are scheduled flights between Dundee and London Stansted, Dundee and Jersey and Dundee and Amsterdam (Source: Highland & Islands Airports, Dundee Airport Information).
In 2013, Dundee was shortlisted for the title of City of Culture 2017. Despite a successful campaign the title was won by Hull.
1

About Dundee 2016 l dundeecity.gov.ukAbout Dundee 2016 l dundeecity.gov.uk 2
In December 2014 Dundee was named as the UK’s first City of Design by the United Nations. The City has been recognised by UNESCO for its diverse contributions to fields including medical research, comics and video games. The City of Design designation has previously been awarded to 12 cities including Beijing, Berlin and Montreal.
Dundee was added to the UNESCO grouping of “creative cities” alongside European cities Turin, Helsinki, Bilbao and Curitiba in Brazil. The title recognises the design innovations which Dundee has contributed to the world, including aspirin, biomedical research which has led to hundreds of new cancer drugs, comics including The Beano and Dandy, orange marmalade and video games including Lemmings and Grand Theft Auto.
Dundee is twinned with:
• Alexandria, USA• Nablus, Palestine• Orleans, France• Wurzburg, Germany• Zadar, Croatia

About Dundee 2016 l dundeecity.gov.uk 3
2Total Population NRS 2015 mid-year population estimate
148,210
Male population NRS 2015 mid-year population estimate
71,427 (48%)
Female population NRS 2015 mid-year population estimate
76,783 (52%)
Administrative Area NRS 2015 mid-year population estimate
60 sq. km
Population Density NRS 2015 mid-year population estimate
2,477 people per sq. km
Female Life Expectancy at Birth NRS Life Expectancy for areas in Scotland 2012-14 (Dundee City)
80.2 years
Male Life Expectancy at Birth NRS Life Expectancy for areas in Scotland 2012-14 (Dundee City)
75.3 years
Residential Properties Dundee City Council Corporate Address Gazetteer as at October 2016
74,365
Number of Households NRS Estimates of Households and Dwellings in Scotland 2015
69,534
Number of Households with no car 2011 Census
28,896
Electorate NRS, Local Government and Scottish Parliment Electors on Electoral Register by Council Area, Scotland Dec 2015
107,120
Median Gross Annual Pay (FTE) ONS Annual Survey of Hours and Earnings 2015
£24,090
Claimant Count Rate Claimant Count is a measure of the number of people claiming unemployment related benefits. Dundee City Council Economic Profile as at July 2016
3.7
Travel from Dundee to Travel time by train Distance by road
Aberdeen 1 hr. 12 mins 66 miles
Edinburgh 1 hr. 13 mins 54 miles
Glasgow 1 hr. 24 mins 81 miles
Perth 25 mins 23 miles
Stirling 51 mins 56 milesSource: Scotrail Source: RAC
DUNDEE AT A GLANCE

About Dundee 2016 l dundeecity.gov.ukAbout Dundee 2016 l dundeecity.gov.uk 4
136000 138000 140000 142000 144000 146000 148000 150000 152000 154000 156000 158000
1991
1992
1993
1994
1995
1996
1997
1998
1999
2000
2001
2002
2003
2004
2005
2006
2007
2008
2009
2010
2011
2012
2013
2014
2015
Popu
latio
n
Year
POPULATIONDundee City has an estimated population of 148,210 as of the 30th June 2015 (NRS Mid Year Population Estimate). This is an increase of 0.1% when compared to the 2014 population estimate of 148,130*. Chart 1 shows historical population totals for the City since 1981, and indicates the estimated population projection to 2039.* Please note National Records of Scotland published corrected mid year population estimates for Mid-2012, Mid-2013 and Mid-2014 in their 2015 Mid Year Population Estimate publication. As such updated figures for these years have been included in the chart below.
Chart 1: Dundee City's historic and projected population 1981 to 2039
Source: NRS Mid Year Population Estimates 2015 and NRS Population Projections for Scottish Areas (2014 based)
Chart 2 shows that the estimated population in Dundee City experienced a gradual decline until 2006 when the figure stabilised. National Records of Scotland population estimates have shown an increase in the Dundee City population since 2008.
Chart 2: Dundee City's population, 1991 to 2015
Source: NRS Mid Year Population Estimates 2015
3
Estimated Population
Projected Population

About Dundee 2016 l dundeecity.gov.uk 5
Figure 1: Dundee City - Male Population by Age Group 2015
Source: NRS 2015 Mid Year Population Estimates
According to the 2015 National Records of Scotland Mid Year Population Estimates, 25% of the male population in Dundee City were aged 16-29 years. Nineteen percent of males were aged 45-59 years, 18% were aged 30-44 years and 17% were aged 0-15 years. Seven percent of the Dundee City male population are estimated to be 75 years or older.
Figure 2: Dundee City – Female Population by Age Group 2015
Source: NRS 2015 Mid Year Population Estimates
Population
0-15 (17%)
16-29 (25%)
30-44 (18%)
45-59 (19%)
60-74 (14%)
75+ (7%)
0-15 (15%)
16-29 (24%)
30-44 (18%)
45-59 (19%)
60-74 (14%)
75+ (10%)

About Dundee 2016 l dundeecity.gov.ukAbout Dundee 2016 l dundeecity.gov.uk 6
According to the 2015 National Records of Scotland Mid Year Population Estimates, 24% of the female population in Dundee City were aged 16-29 years. Nineteen percent were aged 45-59 years, 18% were aged 30-44 years and 15% were aged 0-15 years. Ten percent of the Dundee City female population were estimated to be 75 years or older.
Chart 3: Dundee City – Population by Gender
Source: NRS 2015 Mid Year Population Estimates
Chart 4: Scottish – Population by Gender
Source: NRS 2015 Mid Year Population Estimates
Population

About Dundee 2016 l dundeecity.gov.uk 7
In Dundee City 24.2% of the population are aged 16 to 29 years. This is larger than Scotland where 18.2% of the population are aged 16 to 29 years. Persons aged 60 and over account for 22.5% of the Dundee City population. This is smaller than Scotland where 24.2% of the population are aged 60 and over.
A detailed break down of the Dundee City Population is shown below:
Table 1: Dundee City, Estimated Population 2015 breakdown by Age Group
Age Group
Number of males
% of Dundee City male population
Number of females
% of Dundee City female population
Total Number of Persons
% of total Dundee City Population
0 – 4 4,160 5.8% 3,991 5.2% 8,151 5.5%
5 – 9 3,783 5.3% 3,634 4.7% 7,417 5.0%
10 – 14 3,538 5.0% 3,278 4.3% 6,816 4.6%
15 – 19 4,318 6.0% 4,675 6.1% 8,993 6.1%
20 – 24 7,302 10.2% 7,804 10.2% 15,106 10.2%
25 – 29 6,683 9.4% 6,466 8.4% 13,149 8.9%
30 – 34 5,211 7.3% 5,378 7.0% 10,589 7.1%
35 – 39 3,902 5.5% 4,158 5.4% 8,060 5.4%
40 – 44 3,906 5.5% 4,081 5.3% 7,987 5.4%
45 – 49 4,507 6.3% 4,691 6.1% 9,198 6.2%
50 – 54 4,746 6.6% 5,348 7.0% 10,094 6.8%
55 – 59 4,551 6.4% 4,710 6.1% 9,261 6.2%
60 – 64 3,678 5.1% 3,853 5.0% 7,531 5.1%
65 – 69 3,686 5.2% 4,119 5.4% 7,805 5.3%
70 – 74 2,549 3.6% 3,056 4.0% 5,605 3.8%
75 – 79 2,227 3.1% 2,833 3.7% 5,060 3.4%
80 – 84 1,519 2.1% 2,377 3.1% 3,896 2.6%
85 – 89 806 1.1% 1,486 1.9% 2,292 1.5%
90+ 355 0.5% 845 1.1% 1,200 0.8%
Total 71,427 100.0% 76,783 100.0% 148,210 100.0%
Source: NRS, Mid Year Population Estimates 2015
Population
About Dundee 2016 l dundeecity.gov.ukAbout Dundee 2016 l dundeecity.gov.uk 8
Dundee City
Edinburgh City of
Glasgow City
Scotland
50% (114,414)
48% (71,427)
49% (242,653)
49% (294,275)
49% (2,610,469)
50% (115,936)
52% (76,783)
51% (256,157)
51% (312,065)
51% (2,762,531)
Aberdeen City
Males Females
Chart 5: Dundee Population Pyramid 2015
Source: NRS, Mid Year Population Estimates 2015
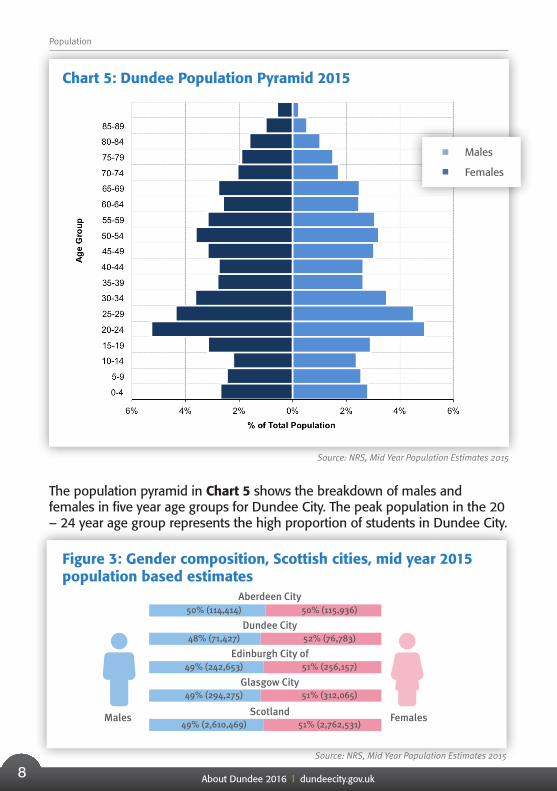
The population pyramid in Chart 5 shows the breakdown of males and females in five year age groups for Dundee City. The peak population in the 20 – 24 year age group represents the high proportion of students in Dundee City.
Figure 3: Gender composition, Scottish cities, mid year 2015 population based estimates
Population
Source: NRS, Mid Year Population Estimates 2015
Males
Females

About Dundee 2016 l dundeecity.gov.uk 9
Figure 3 shows that Dundee City has a slightly higher proportion of females than Aberdeen City, Edinburgh City Of, Glasgow City and Scotland as a whole.
Table 2: Projected population, by age group in Dundee, 2014 to 2039
Age Group
Base Year
Projected Years % Change
2014 2019 2024 2029 2034 2039 Change 2014-2039
0-15 23,716 24,709 25,649 25,786 25,874 25,649 8.2%
16-29 36,186 34,038 31,200 31,373 32,493 32,983 -8.9%
30-49 26,268 28,303 31,823 32,235 30,875 29,319 11.6%
50-64 28,569 27,350 24,881 24,301 25,817 28,769 0.7%
65-74 20,856 22,355 23,523 24,670 23,834 21,828 4.7%
75+ 12,535 12,395 13,683 14,597 16,336 18,329 46.2%
All ages
148,130 149,150 150,759 152,962 155,229 156,877 5.9%
Source: NRS Population Projections for Scottish Areas (2014 based) published 2016
By 2039 the population of Dundee City is projected to be 156,877. This is an increase of 5.9% when compared to the base year of 2014. The distribution of change by age is shown in Chart 6. As well as the figures for Dundee City, Chart 6 also shows the Scottish figure for comparison.
Population
Males
Females

About Dundee 2016 l dundeecity.gov.ukAbout Dundee 2016 l dundeecity.gov.uk 10
Population
Chart 6: Projected population change for Dundee City and Scotland by age group, 2014 to 2039 (2014-based projection)
Source: NRS Population Projections for Scottish Areas (2014 based) published 2016
Chart 6 shows that over the 25 year period, the age group that is projected to increase the most is the 75+ age group.
Table 3: Sub-Council Area Projected Population (2012 Based) 2012-2026
Area 2012 2014 2016 2018 2020 2022 2024 2026 % Change 2012-2026
Coldside 17,666 17,603 17,543 17,524 17,521 17,523 17,534 17,568 -0.6%
East End 16,004 16,335 16,622 16,969 17,358 17,779 18,223 18,684 16.7%
Lochee 19,614 19,883 20,110 20,389 20,702 21,038 21,389 21,755 10.9%
Maryfield 17,983 18,509 19,199 19,953 20,747 21,572 22,414 23,256 29.3%
North East 15,993 16,058 16,022 16,003 15,995 15,989 15,977 15,962 -0.2%
Strathmartine 18,827 19,048 19,151 19,273 19,419 19,568 19,717 19,864 5.5%
The Ferry 19,698 20,099 20,421 20,750 21,082 21,416 21,748 22,074 12.1%
West End 22,015 21,378 21,341 21,334 21,336 21,336 21,314 21,241 -3.5%
Dundee City (Total)
147,800 148,913 150,409 152,194 154,160 156,221 158,315 160,404 8.5%
Source: NRS – Population and Household Projections for Scottish Sub-Council Areas (2012-based)
* Please note NRS have made some adjustments in student areas to account for high numbers and have used an average figure of students over the past 5 years. The areas affected by these adjustments are Maryfield, Coldside
and West End. Due to the methodology used to calculate the population projections – the recent increase in student numbers over recent years means that this has been carried forward in these projections.
-20.0%
0.0%
20.0%
40.0%
60.0%
80.0%
100.0%
0-15 16-29 30-49 50-64 65-74 75+
Percen
tageCha
nge
Dundee
Scotland
Dundee
Scotland

About Dundee 2016 l dundeecity.gov.uk 11
In March 2016, the National Records of Scotland (NRS) published the results of a one-off research project to produce population projections for sub-council areas. The figures in Table 3 are based on past trends and are projections not forecasts. The population projections are calculations based on past trends including fertility, mortality and migration. Therefore the projections in the table do not take account of any future changes that may occur as a result of policy initiatives, social or economic change. The projections therefore have limitations in their use but they do however give an indication of how an area may change if past trends were to continue.
Chart 7: Population Share 2015 – By Single Year Of Age
Source: NRS, Mid Year Population Estimates 2015
Chart 7 shows the population share of the 2015 mid year population estimate by single year of age. The chart shows that when compared to the average population share, Dundee City has a larger share of the population who are aged 18-30 years. It also shows that Dundee City has a slightly larger share of the very elderly population.
Population
Dundee
Scotland

About Dundee 2016 l dundeecity.gov.ukAbout Dundee 2016 l dundeecity.gov.uk 12
Table 4: Components of population change mid 2014 to mid 2015
Births Deaths Migration (and other)
Net Change
Aberdeen City 2,567 2,260 1,123 1,430
Dundee City 1,635 1,763 208 80
Edinburgh, City of 5,401 4,380 5,179 6,200
Glasgow City 7,254 6,540 5,986 6,700
Perth and Kinross 1,391 1,620 1,229 1,000
Stirling 795 917 1,432 1,310
Scotland 55,809 57,841 27,432 25,400
Source: NRS Mid Year Population Estimates 2015
Chart 8: Migration, in, out and net, Dundee City, Annual Average, 2013- 2015*
Source: NRS Total Net Migration by Council Area
Please note: Migration figures are based on a 3-year average and include migration within Scotland, between Scotland and the rest of the UK and between Scotland and Overseas. They do not include asylum seekers and armed
forces movements.
Migration in and out of Dundee City is summarised in Chart 8. On average in 2013-15 there was a net inflow of 168 people into Dundee City per year, meaning that more people entered Dundee City (6,979 per year) than left (6,811 per year). The 16 to 29 year old age group accounted for the largest
Population
In migration
Out migration
Net migration

About Dundee 2016 l dundeecity.gov.uk 13
0
500
1,000
1,500
2,000
2,500
2012-2
013
2014-2
015
2016-2
017
2018-2
019
2020-2021
2022-2023
2024-2025
2026-2027
2028-2029
2030-2031
2032-2033
2034-2035
2036-2037
Proj
ecte
d Po
pula
tion
Year of Projection
Dundee City - Projected No of Births
group of in-migrants into Dundee City. The largest group of out-migrants was also the 16 to 29 year olds.
Chart 9: Births by gender, Dundee City, 1999 to 2015
Source: NRS Vital Events 2015
Please note: the rates in the chart above were calculated using the original mid-year population estimates for 2011 and earlier years, which were based on the 2001 Census figures.
The number of births in Dundee City since 1999 is shown in Chart 9. In 2015 there were 1,555 births in Dundee City. This is a decrease of 9.3% when compared to the 1,715 births recorded in 2014. The Fertility rate in Dundee City per 1,000 women aged 15-44 was 47.8 in 2015.
Chart 10: Projected Births (2012-based projections) 2012-2013 to 2036-2037
Source: NRS Population Projections for Scottish Areas (2012-based) – Table 4 Projected births (2012-based) by Council and NHS Board Areas 2012-2037
Population
Dundee City - Projected No. of births
In migration
Out migration
Net migration

About Dundee 2016 l dundeecity.gov.ukAbout Dundee 2016 l dundeecity.gov.uk 14
Chart 10 shows that according to National Records of Scotland Birth Projections, the number of births in Dundee City is predicted to increase by 11.4% during the period 2012-2013 to 2036-2037. National Records of Scotland predict that the number of the births in the City will increase from 1,709 births in 2012-2013 to 1,903 in 2036-2037.
Table 5: Ethnicity of Population, Dundee City 2011
Population Count Percentage of Population
White British 131,610 89.4%
White Irish 1,369 0.9%
White Gypsy or Traveller
98 0.1%
White Other 5,383 3.7%
Mixed or multiple ethnic groups
685 0.5%
Indian 1,417 1.0%
Pakistani 2,047 1.4%
Bangladeshi 310 0.2%
Chinese 1,274 0.9%
African 1,163 0.8%
Black or Caribbean 233 0.1%
Black Other 36 0.1%
Arabic 693 0.5%
Other Ethnic Groups 950 0.6%
Source: Scottish Census 2011, Table KS201SC
Please note: White British - White Scottish and White Other BritishWhite Other - White Polish and Other WhiteIndian - Indian, Indian Scottish or Indian BritishPakistani - Pakistani, Pakistani Scottish or Pakistani British Bangladeshi - Bangladeshi, Bangladeshi Scottish or Bangladeshi BritishChinese - Chinese, Chinese Scottish or Chinese BritishAfrican - African, African Scottish or African BritishBlack or Caribbean - Caribbean, Caribbean Scottish, Caribbean British, Black, Black Scottish or Black BritishBlack Other - Caribbean or Black Other Arabic - Arab, Arab Scottish or Arab BritishOther Ethnic Groups - Other Asian, Other African or Other Ethnic Group
Population

About Dundee 2016 l dundeecity.gov.uk 15
Table 6: Ethnicity by Age Group, Dundee City 2011
% of pop. Aged 0-15
% of pop. Aged 16-29
% of pop. Aged 30-49
% of pop. Aged 50-64
% of pop. Aged 65-74
% of pop. Aged 75+
White British 88.9% 81.2% 88.0% 95.6% 96.8% 97.5%
White Irish 0.2% 2.1% 0.7% 0.6% 0.9% 0.6%
White Gypsy or Traveller
0.1% 0.1% 0.1% 0.1% 0.0% 0.0%
White Other 3.0% 7.1% 4.3% 1.3% 0.6% 1.0%
Mixed or Multiple Ethnic Groups
1.2% 0.7% 0.3% 0.1% 0.1% 0.1%
Indian 1.0% 1.5% 1.2% 0.4% 0.5% 0.2%
Pakistani 2.3% 1.7% 1.6% 0.8% 0.5% 0.3%
Bangladeshi 0.2% 0.3% 0.2% 0.2% 0.1% 0.0%
Chinese 0.5% 2.2% 0.7% 0.3% 0.2% 0.2%
African 0.9% 1.3% 1.2% 0.2% 0.0% 0.0%
Black or Caribbean
0.1% 0.3% 0.2% 0.1% 0.0% 0.0%
Black Other 0.0% 0.1% 0.0% 0.0% 0.0% 0.0%
Arabic 0.9% 0.6% 0.6% 0.2% 0.1% 0.0%
Other Ethnic Group
0.6% 0.9% 1.0% 0.3% 0.1% 0.1%
Source: Scottish Census 2011, Table DC2101SC, Ethnic Group by Sex and Age
Ethnicity breakdowns are as per classification categories in Table 5.
Population

About Dundee 2016 l dundeecity.gov.ukAbout Dundee 2016 l dundeecity.gov.uk 16
Population
Table 7: Marital Status, Dundee City 2011
Population Count
Percentage of Population
Single (never married or never registered a same-sex civil partnership)
53,321 43.2%
Married 44,593 36.1%
In a registered same-sex civil partnership
171 0.1%
Separated (but still legally married or still legally in a same-sex civil partnership)
4,185 3.4%
Divorced or formerly in a same-sex civil partnership which is now legally dissolved
11,493 9.3%
Widowed or surviving partner from a same-sex civil partnership
9,801 7.9%
Source: Scottish Census 2011, Table KS103SC, Marital and Civil Partnership Status
National Records of Scotland Statistics relating to marriage found:There were 525 marriages in Dundee City in 2015. This is a decrease of 3.1% from 2014. (Source: National Records of Scotland, Vital Events).
Source: National Records of Scotland, Vital Events
Table 8: Religion, Dundee City 2011
Population Count Percentage of Population
Christian 71,814 48.8%
Buddhist 391 0.3%
Hindu 706 0.5%
Jewish 63 0.0%
Muslim 3,875 2.6%
Sikh 152 0.1%
Other religion 476 0.3%
No religion 60,155 40.8%
Religion not stated 9,636 6.5%
Source: Scottish Census 2011, Table KS209SCa – Religion (UK harmonised)

About Dundee 2016 l dundeecity.gov.uk 17
Population
Table 9: Proficiency in English, Dundee City 2011
Population Count Percentage of Population
Speaks English very well 125,402 88.0%
Speaks English well 14,666 10.3%
Does not speak English well 2,045 1.4%
Does not speak English at all 376 0.3%
Source: Scottish Census 2011, Table QS205SC – Proficiency in English
*Please note the above table is based on all individuals aged 3 and over.
Table 9 shows that in the 2011 Scottish Census, 98.3% of the Dundee City population indicated they can speak English “Very well” or “Well”.
Table 10: Country of Birth, Dundee City 2011
Population Count Percentage of Population
Scotland 123,242 83.7%
England 8,882 6.0%
Wales 340 0.2%
Northern Ireland 1,539 1.0%
Republic of Ireland 572 0.4%
Other Countries 7,705 5.2%
Other EU: Member Countries in March 2001
2,248 1.5%
Other EU: Accession countries April 2001-March 2011
2,740 1.9%
Source: Scottish Census 2011, Table KS204SC- Country of Birth
Please note: Other Countries include all other countries which do not fall into the categories listed above.

About Dundee 2016 l dundeecity.gov.ukAbout Dundee 2016 l dundeecity.gov.uk 18
Table 11: Length of Residence in UK, Dundee City 2011
Population Count Percentage of Population
Born in the UK 134,015 91.0%
Less than two years 4,242 2.9%
Two years or more and less than five years
2,744 1.9%
Five years or more and less than ten years
2,187 1.5%
Ten years or more 4,080 2.8%
Source: Scottish Census 2011, Table QS803SC, Length of residence in UK
Tables 10 and 11 show that in the Scottish Census 2011, the majority of those in Dundee City indicated they were born in Scotland and had been a resident of the UK since birth.
Population

About Dundee 2016 l dundeecity.gov.uk 19
4HEALTHThe following section provides details of health provision in Dundee City. Table 12 summarises the number of GP’s in post in Dundee City and compares this with Angus, Perth and Kinross and Scotland as whole.
Table 12: Number of GPs in post (headcount) by Local Authority as at 30th September 2015 (All GPs)
All Male Female
Scotland 4,938 2,096 2,842
Angus 98 45 53
Dundee 138 55 83
Perth and Kinross 139 72 67
Source: ISD ScotlandPlease note:
1.Data Source: General Practitioner Contractor Database (GPCD), Information Services Division, NHS Scotland
2.Excludes GPS’s working only on a locum/sessional basis and the majority of those working only in Out of Hours Services
3.GPs may hold multiple posts simultaneously therefore the Scotland total may not equal the sum of the different types of GP post or the sum of the headcount in the different local authorities
4.This data is sourced from a dynamic administrative database. Previously published figures will be subject to change due to administrative time lag in updating information in the database
Table 13: Number of Patients Registered with All Practices by Local Authority as at 1st October 2015
Number of Practices Average Practice List Size
Scotland 981 5,736
Angus 17 6,931
Dundee 23 7,033
Perth and Kinross 26 5,601
Source: ISD ScotlandPlease note:
1.Data Source (for practices): General Practitioner Contractor Database *(GPCD), Information Services Division, NHS Scotland
Data Source (for patient numbers): GMS Warehouse, Information Services Division, NHS Scotland
2.“All Practices” comprises patients registered in all practice types: new GMS(17J), and all 2C and Admin, practice types
3.Excludes practices which do not have registered patients and which are run directly by the NHS Boards, e.g. Out of Hours Services centres, virtual clinics
4.The boundaries of NHS Boards have changed to some degree twice (2006, 2014) in the period covered by this data. Refreshes of data retain the structure of the NHS Boards at the time point reported, As such, it is not safe to compare wholesale across years for some NHS Boards.
5.This data is sourced from a dynamic administrative database. Previously published figures will be subject to change
due to administrative time lag in updating information on the database.

About Dundee 2016 l dundeecity.gov.ukAbout Dundee 2016 l dundeecity.gov.uk 20
Table 14: Self Assessed Health, Dundee City 2011
Population Count Percentage of Population
Very Good Health 75,918 51.6%
Good Health 44,382 30.1%
Fair Health 18,027 12.2%
Bad Health 6,731 4.6%
Very Bad Health 2,210 1.5%
Source: Scottish Census 2011, Table QS302SC, General Health
Table 15: Health Limits, Dundee City 2011
Population Count Percentage of Population
Day-to-day activities limited a lot
15,390 10.5%
Day-to-day activities limited a little
15,321 10.4%
Day-to-day activities not limited
116,557 79.2%
Source: Scottish Census 2011, Table QS303SC, Long-term health problem or disability
The 2015 Dundee City Council Annual Citizens Survey outlined that:
• 84% of participants rate their health as good or very good• 99% of participants were registered with a GP or Health Centre• 95% of participants were registered with a dentist • 25% of participants stated that they were current smokers. 25% said
that they used to smoke and 51% have never smoked. • 3 in 10 participants (30%) said that they drink the recommended
alcohol allowance (8 units for men / 6 for women) or more at least once a week.
• 36% of participants stated that they never drink the recommended alcohol allowance.
Health

About Dundee 2016 l dundeecity.gov.uk 21
Table 16: Number of patients on general practice QOF Register with crude rates per 100 patients by Community Health Partnership (All practice contract types) April 2014 – March 2015
QOF Register Patients on this QOF Register (Dundee Community Health Partnership)
Dundee Community Health Partnership – Raw Prevalence Rate (per 100 patients)
Scotland – Raw Prevalence Rate (per 100 patients)
Asthma 10,723 6.29 6.33
Atrial Fibrillation 2,685 1.57 1.64
Cancer 3,477 2.04 2.30
Coronary Heart Disease (CHD)
6,919 4.06 4.14
Chronic Kidney Disease (CKD)
5,335 3.13 3.16
Chronic Obstructive Pulmonary Disease (COPD)
4,907 2.88 2.21
Dementia 1,546 0.91 0.78
Depression 9,129 5.35 6.28
Diabetes 8,834 5.18 4.85
Heart Failure 1,676 0.98 0.82
Hypertension 23,766 13.93 13.85
Mental Health 1,893 1.11 0.88
Osteoporosis 204 0.12 0.10
Peripheral Arterial Disease
2,007 1.18 0.87
Rheumatoid Arthritis 918 0.54 0.58
Stroke and Transient Ischaemic Attack (TIA)
3,958 2.32 2.16
Source: ISD Scotland – General Practice – Quality and Outcomes Framework (QOF) Prevalence Data 2014/15.
• QOF prevalence rates are what is known as “raw” or “crude” rates – which means that they take no account of differences between practice populations in terms of their age or gender profiles, or other factors that influence the prevalence of health conditions. A QOF prevalence rate is simply the total number of patients on the register, expressed as a proportion of the total number of patients registered with the practice at one point in time. This means that for example a practice with an older population might appear to have higher prevalence rates for age-related conditions than another practice with a younger population.• Prevalence = number of patients on the specified QOF register, divided by list size, multiplied by 100
Health

About Dundee 2016 l dundeecity.gov.ukAbout Dundee 2016 l dundeecity.gov.uk 22
Table 16 shows the QOF Register crude prevalence rates 2014/15 sourced from the ISD Scotland website. This table displays the prevalence rates of health conditions in the Dundee Community Health Partnership compared to Scotland. The table shows that in some cases the crude prevalence rate in Dundee Community Health Partnership is higher than the rate for Scotland.
Table 17: Life Expectancy at birth in Scotland 2002-04 and 2012-2014 comparison (Males)
Male Life Expectancy at Birth
2002-2004 2012-2014 Difference % Change
Aberdeen City 74.4 76.8 2.4 3.2%
Dundee City 72.4 75.3 2.9 4.0%
Edinburgh, City of
75.2 77.9 2.7 3.5%
Glasgow City 69.3 73.4 4.1 5.9%
Perth and Kinross
76.2 79.5 3.3 4.3%
Stirling 75.7 78.4 2.6 3.5%
Scotland 73.8 77.1 3.4 4.6%
Source: NRS, Life Expectancy for areas in Scotland 2012-2014
Table 17 shows that Dundee City with a male life expectancy at birth of 75.3 years has the second lowest life expectancy for males when compared to the other cities contained in the above table. The life expectancy at birth for a male in Dundee City is -1.8 years lower than the Scottish average.
Health

About Dundee 2016 l dundeecity.gov.uk 23
Table 18: Life Expectancy at birth in Scotland 2002-04 and 2012-2014 comparison (Females)
Female Life Expectancy at Birth
2002-2004 2012-2014 Difference % Change
Aberdeen City 79.9 81.1 1.2 1.5%
Dundee City 78.3 80.2 1.9 2.4%
Edinburgh, City of
80.3 82.2 1.8 2.3%
Glasgow City 76.4 78.7 2.3 3.1%
Perth and Kinross
80.1 83.0 2.8 3.5%
Stirling 79.8 82.0 2.2 2.7%
Scotland 79.0 81.1 2.1 2.7%
Source: NRS, Life Expectancy for areas in Scotland 2012-2014
Table 18 shows that Dundee City with a female life expectancy at birth of 80.2 years has the second lowest life expectancy for females when compared to the other cities contained in the above table. The life expectancy at birth for a female in Dundee City is -0.9 years lower than the Scottish average.
Chart 11: Age Standardised death rates for all causes (All Ages), 2006 to 2015
Source: NRS – Age Standardised Death Rates Calculated Using the European Standard Population 2013
Death rates are based per 100,000 population
* Rates for 2006 to 2012 have been revised as the methodology is now based on the 2013 European standard population
Health
About Dundee 2016 l dundeecity.gov.ukAbout Dundee 2016 l dundeecity.gov.uk 24
31.2%
27.2%
13.1%
5.4%
7.3%
15.9% Cancer
Circulatory Diseases
Respiratory Diseases
Digestive Diseases
External Causes
Other
Chart 12: Cause of Death (Males) 2015
Chart 13: Cause of Death (Females) 2015
Source: NRS, Vital Events 2015
* Please note the rates in the above pie charts, were calculated using the original mid-year population estimates for 2011 and earlier years, which are based on the 2001 Census figures.
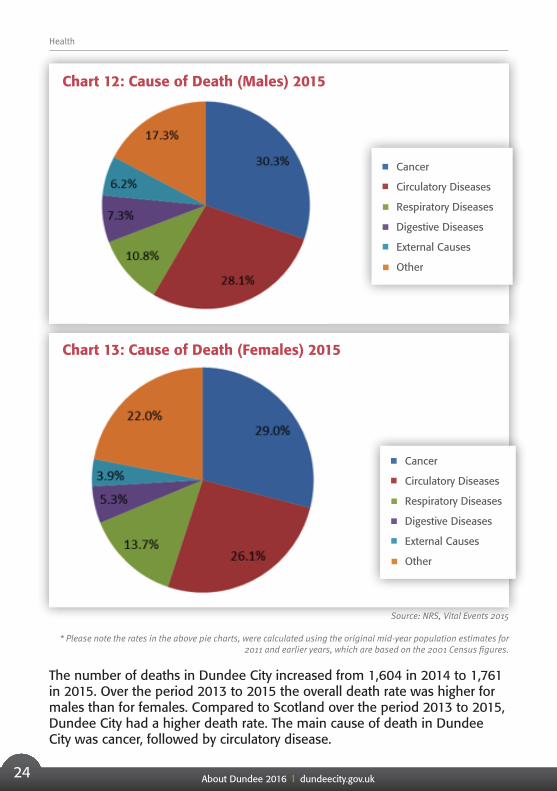
The number of deaths in Dundee City increased from 1,604 in 2014 to 1,761 in 2015. Over the period 2013 to 2015 the overall death rate was higher for males than for females. Compared to Scotland over the period 2013 to 2015, Dundee City had a higher death rate. The main cause of death in Dundee City was cancer, followed by circulatory disease.
Cancer
Circulatory Diseases
Respiratory Diseases
Digestive Diseases
External Causes
Other
Cancer
Circulatory Diseases
Respiratory Diseases
Digestive Diseases
External Causes
Other
2.4%
3.9%
Health

About Dundee 2016 l dundeecity.gov.uk 25
Chart 14: Dundee City alcohol related mortality 1979-2015
Source: NRS Alcohol Related Deaths 2015
Chart 14 shows mortality in Dundee City where alcohol was the underlying cause of death.
Table 19: Breastfeeding (Includes Mixed Breast and Formula Fed) at the 6-8 Week Review by Year of Birth
2005 - 06
2006 - 07
2007 - 08
2008 - 09
2009 - 10
2010 - 11
2011 - 12
2012 - 13
2013 - 14
2014 - 15
Dundee City
33.4% 31.3% 28.8% 30.3% 33.2% 31.0% 32.5% 31.9% 28.2% 33.6%
Source: ISD Scotland – Breastfeeding by Local Authority: Financial Years 2005/06 – 2014/15
The proportion of mothers in Dundee City initiating breastfeeding has not increased over a considerable period. Table 19 shows that the proportion of mothers still breastfeeding at the 6-8 week review has increased from 28.2% in 2013/14 to 33.6% in 2014/15.
Health

About Dundee 2016 l dundeecity.gov.ukAbout Dundee 2016 l dundeecity.gov.uk 26
Chart 15: Smoking at booking 2006-2015*, Year Ending 31st March – NHS Tayside Health Board
Source: ISD Scotland – Births in Scottish Hospitals – Year Ending 31 March 2015, Publication Date 24 November 2015 (Data source SMR02)
* Please note data for 2015 is provisional data
Chart 15 shows that in the year ending 31st March 2006, 19.8% of women indicated that they were smokers when they attended the booking, 11.1% were former smokers and 34.1% indicated that they had never smoked. In comparison in the year ending 31st March 2015, the provisional figures showed that 20.1% of those at the booking were current smokers, 8.3% were former smokers and 70.5% had never smoked.
It is important to remember that data on smoking behaviour is often based on self-reported information, there is often considerable pressure on women not to smoke during pregnancy and as such there could be instances of under-reporting.
Table 20: Percentage of P1 Children Categorised as a Healthy Weight (Epidemiological categories for both sexes)
2008-09
2009-10
2010-11
2011-12
2012-13
2013-14
2014-15
Dundee City
74.2% 74.8% 72.2% 74.1% 74.1% 74.8% 73.0%
Source: ISD Scotland, Primary 1 Body Mass Index (BMI) Statistics – School Year 2014/15
Table 20 shows the percentage of children in primary 1 who were a healthy weight has fluctuated over the years. In 2014-15 73.0% of P1 Children were of a healthy weight this has decrease by 1.8% when compared to 2013-14.
Health

About Dundee 2016 l dundeecity.gov.uk 27
The Scottish Schools Adolescent Life Style and Substance Use Survey (SALSUS)
The Scottish Schools Adolescent Lifestyle and Substance Use Survey (SALSUS) is part of an important and long established series of national surveys on smoking, drinking and drug use. The survey is conducted on a biennial basis, targeting secondary school pupils in local authority and independent schools. The most recent SALSUS Survey was undertaken in autumn 2013.
Table 21 – SALSUS Survey – Regular Smokers (usually smokes one or more cigarettes in a week) by Administrative Area: 2006 - 2013
2006 2010 2013
Administrative Area
% of 13 year olds
% of 15 year olds
% of 13 year olds
% of 15 year olds
% of 13 year olds
% of 15 year olds
Dundee City 3% 13% 5% 11% 2% 6%
Angus 2% 11% 1% 13% 1% 6%
Perth & Kinross 3% 15% 1% 10% 2% 7%
Tayside 3% 14% 3% 11% 2% 6%
Scotland 4% 15% 3% 13% 2% 9%
Source: SALSUS Report 2013
Table 21 shows that in Dundee City, the percentage of 13 year olds surveyed in the SALSUS who indicated that they were regular smokers reduced from 5% in 2010 to 2% in 2013. Similarly the percentage of 15 year olds who indicated they were regular smokers reduced from 11% in 2010 to 6% in 2013.
Health

About Dundee 2016 l dundeecity.gov.ukAbout Dundee 2016 l dundeecity.gov.uk 28
Table 22: SALSUS Survey 2013 – Alcohol Related Questions
Dundee City Angus Perth and Kinross
Percentage of respondents who reported….
% of 13 year olds
% of 15 year olds
% of 13 year olds
% of 15 year olds
% of 13 year olds
% of 15 year olds
…had ever had a proper ‘alcoholic drink’ (whole drink, not a sip)
33% 66% 30% 74% 29% 74%
Of those who indicated they had ever had a proper ‘alcoholic drink’
…Usually drink at least once a week (including those who drink ‘almost every day’ and ‘about twice a week’)
4% 11% 2% 15% 3% 15%
Of those who indicated that they’ve had a proper alcoholic drink… been drunk at least once
44% 68% 43% 68% 35% 65%
Source: SALSUS Report 2013
Health

About Dundee 2016 l dundeecity.gov.uk 29
Table 22 shows that in Dundee City, 33% of 13 year olds surveyed in the SALSUS indicated that they have ever had an alcoholic drink (whole drink, not just a sip). Of the 13 years olds who indicated that they had a proper alcoholic drink, 4% indicated that they usually drink at least once a week. Of the 13 year olds in Dundee City who indicated that they had ever had an alcoholic drink, 44% indicated that they had been drunk at least once.
In Dundee City, 66% of 15 year olds surveyed in the SALSUS indicated that they had ever had a proper ‘alcoholic drink’ (whole drink, not just a sip). Of the 15 year olds who indicated that they had a proper alcoholic drink, 11% indicated that they usually drink at least once a week. Of the 15 year olds in Dundee City who indicated that they had ever had a proper alcoholic drink, 68% indicated that they had been drunk at least once.
Table 23: SALSUS Survey 2013 – Prevalence of Drug Use
Dundee City
Percentage of respondents who reported…
% of 13 year olds % of 15 year olds
Having never tried any drugs 97% 87%
Having used or taken one or more drugs, even if only once
3% 13%
Using drugs in the last month 1% 6%
Source: SALSUS Report 2013
Table 23 shows that the majority of 13 and 15 year olds who participated in the SALSUS Survey indicated that they had never tried drugs. 3% of 13 year olds who participated in the survey indicated they had taken drugs. 13% of 15 year olds who participated in the survey indicated that they had taken drugs.
Health

About Dundee 2016 l dundeecity.gov.ukAbout Dundee 2016 l dundeecity.gov.uk 30
Mental Wellbeing
The Warwick-Edinburgh Mental Well-being Scale (WEMWBS) was developed by researchers at the Universities of Warwick and Edinburgh to enable the measurement of mental wellbeing of adults in the UK. WEMWBS is a 14 item scale of mental well-being covering subjective well-being and psychological functioning, in which all items are worded positively and address aspects of positive mental health.
Findings from the 2015 Dundee City Council, Annual Citizens Survey show that for Dundee City as a whole, the mean score for WEMWBS is 53.3. The mean score for Dundee City in 2014 was 56.8, in 2013 it was 57.1 and in 2012 it was 52.2.
Drug Use
Table 24: Estimated number of individuals with problem drug use by Council area (ages 15 to 64) 2012/13
Number Prevalence rate (%)
Dundee City 2,800 2.80%
Angus 700 0.96%
Perth & Kinross 1,100 1.20%
NHS Tayside 4,600 1.73%
Scotland 61,500* 1.74%*
Source: ISD Scotland – Estimating the National and Local Prevalence of Problem Drug use in Scotland 2012/13 – Originally published October 2014 – updated 4th March 2016
* Please note ISD revised the Scotland figure in March 2016. The revised estimates for 2012/13 incorporate new treatment data submissions from Glasgow City and East Renfrewshire
Substance misuse is associated with adverse health outcomes and presents a major health challenge for Dundee City. It is estimated that in 2012/13 there were 61,500 problem drug users in Scotland as a whole, with 7.5% of these being within the NHS Tayside area. In 2012/13 within Tayside, Dundee City had the highest rate of the three council areas and the prevalence was also higher than the overall Scotland rate.
Health

About Dundee 2016 l dundeecity.gov.uk 31
Learning Disabilities
Chart 16: Number of adults with learning disabilities known to local authorities
Source: Scottish Commission for Learning Disability (SCLD) – Learning Disability Statistics Scotland, 2015 – Annex B: Local Authority Level Learning Disability Statistics Scotland (2015)
Please note: These figures include adults with learning disabilities who are known to local authorities from contacts in the last 3 years. The figures include 16 and 17 year olds who are not in full-time education. Adults known to local
authorities are not necessarily receiving a service. Adults who have been assessed for a service but refused a service will still appear in this return. Please note that this data does not include adults with learning disabilities who are not
known to local authority areas.
Chart 16 shows that the number of adults in Dundee City known to local authorities with learning disabilities has increased by 27% from 952 in 2009 to 1,209 in 2015.
952999
1114 11321179 1181 1209
0
2
4
6
8
10
12
0
200
400
600
800
1000
1200
1400
2009 2010 2011 2012 2013 2014 2015
Rateper1,000
adu
ltpo
pula/o
n
Noofadu
ltswith
LearningDisability
AdultsinDundeewithLearningDisabili=es Dundee Scotland
Health
About Dundee 2016 l dundeecity.gov.ukAbout Dundee 2016 l dundeecity.gov.uk 32
Carers
Chart 17: Age breakdown of all clients receiving Home Care in Dundee City 2012-2015
Source: Scottish Government, Social Care Statistics, November 2015 (Revised December 2015) – Data Source Home Care Census up to 2012, Social Care Survey from 2013
Notes:- Some figures have been suppressed to protect small numbers
- Client groups and further age breakdowns are not available at local authority, due to small numbers
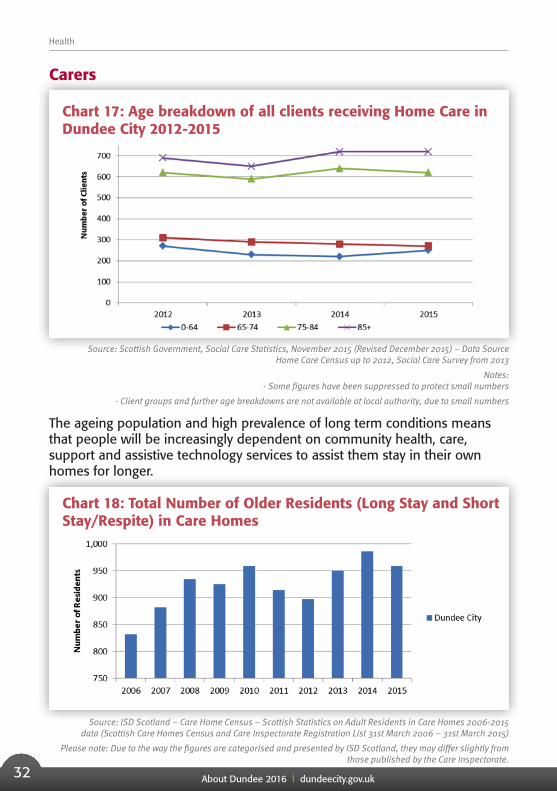
The ageing population and high prevalence of long term conditions means that people will be increasingly dependent on community health, care, support and assistive technology services to assist them stay in their own homes for longer.
Chart 18: Total Number of Older Residents (Long Stay and Short Stay/Respite) in Care Homes
Source: ISD Scotland – Care Home Census – Scottish Statistics on Adult Residents in Care Homes 2006-2015 data (Scottish Care Homes Census and Care Inspectorate Registration List 31st March 2006 – 31st March 2015)
Please note: Due to the way the figures are categorised and presented by ISD Scotland, they may differ slightly from those published by the Care Inspectorate.
Health

About Dundee 2016 l dundeecity.gov.uk 33
Health
Chart 18 shows the number of older residents (Long Stay, Short Stay and Respite) in care homes in Dundee City has increased from 832 in 2006 to 959 in 2015, this equates to an increase of 15%.
Chart 19: Percentage of people aged 65 and over with long-term care needs receiving 10+ hrs of home care
Source: Scottish Government Quarterly Monitoring Survey, Scottish Government Social Care Survey and ISD Continuing Care Census
Chart 19 shows the percentage of people aged 65 and over receiving 10+ hours of Home Care increased from 22.4% in 2006 to 30.1% in 2015.
Table 25: Provision of Unpaid Care, Dundee City 2011
Population Count Percentage of Population
Provides no unpaid care
134,196 91.1%
Provides 1-19 hours unpaid care a week
6,833 4.6%
Provides 20-49 hours unpaid care a week
2,330 1.6%
Provides 50+ hours unpaid care a week
3,909 2.7%
Scottish Census 2011, Table QS301SCa Provision of unpaid care (UK harmonised)

About Dundee 2016 l dundeecity.gov.ukAbout Dundee 2016 l dundeecity.gov.uk 34
EDUCATION5Table 26: Number of Local Authority Schools as at 1st April 2015
No Primary Schools
No Secondary Schools
No Special Schools
Aberdeen City 47 12 6
Dundee City 35 9 2
Edinburgh, City of 88 23 12
Glasgow City 138 30 31
Perth and Kinross 73 10 1
Stirling 40 7 3
All local Authorities
2,043 361 138
Source: Scottish Government, School Estates 2015, supplementary dataset
* Table above excludes Independent and Grant-Aided Schools
* All special local authority schools that were open in April 2015 have been included in this table. However, some special schools were unable to provide estates information as they do not have a separate building.
When compared to the other local authority areas listed in the table, Dundee City has the least amount of primary schools and the second lowest amount of secondary and special schools.
Table 27: Pupil Numbers by Sector and Local Authority as at September 2015
No Primary Pupils
No Secondary Pupils
No Special School Pupils
Aberdeen City 13,353 8,753 155
Dundee City 10,399 7,236 279
Edinburgh, City of 28,804 18,163 666
Glasgow City 39,610 24,915 1,499
Perth and Kinross 10,265 7,494 62
Stirling 6,588 5,767 21
All local authorities
390,687 281,355 6,709
Source: Scottish Government, Pupils in Scotland 2015

About Dundee 2016 l dundeecity.gov.uk 35
EDUCATION
When compared to the other local authority areas listed in Table 27 Dundee City has the third lowest number of primary pupils with only Stirling and Perth and Kinross recording fewer. Table 27 shows that Dundee City has the second lowest number of secondary pupils. In contrast Dundee City has the third highest number of pupils who attend special schools when compared to the other local authorities listed in the table.
Table 28: Dundee City – Primary, Secondary, Special Educational Establishments by School Denomination as at September 2015
Primary Secondary Special
Denomination Type
Schools Pupils Schools Pupils Schools Pupils
Non-Denom 24 7,811 7 5,495 2 279
Denominational 11 2,588 2 1,741 0 0
All Schools 35 10,399 9 7,236 2 279
Source: Scottish Government, Pupils in Scotland 2015
Table 28 shows that the greatest proportion of Primary and Secondary Schools in Dundee City are Non-Denominational. There are 0 Denominational Special Schools in Dundee City.
Table 29: Publicly Funded Teachers by Sector, Dundee City 2015
ELC Primary Secondary Special Centrally Employed
Teacher Numbers 32 632 646 68 30
Source: Scottish Government, Teachers in Scotland 2015
* These figures refer to full-time equivalents of teachers
* ELC includes partnership, ELC centres, and teachers in ELC centres whether centre-based, centrally employed or home visiting
Education

About Dundee 2016 l dundeecity.gov.ukAbout Dundee 2016 l dundeecity.gov.uk 36
Education
Pupil Attainment
The Curriculum for Excellence was introduced to Scottish schools in 2010. This led to the introduction of a new Senior Phase in 2014 to cover stages S4, S5 and S6 along with a new set of National exams in the 2014 exam diet to replace standard grades. The National 4 and 5 exams were designed to be studied over one year and the recommended number of subjects to study was reduced from 8 to 6. In addition, schools were given much greater flexibility over the curriculum model they wished to use in the Senior Phase. So, for instance, a pupil might not take any exams in S4 and work towards Highers in S5. This change led the Scottish Government to develop a new senior phase benchmarking tool, Insight. This replaced the previous reporting tool Standard Tables and Charts (STACs) published by ScotXed.
The most important change to measuring attainment is the move to measuring at the point of leaving school rather than particular stage results. Old measures such as the percentage of S4 pupils achieving five or more awards at SCQF level 5 are important for gauging historical performance but going forward the Insight measures will be used to assess performance within the senior phase of the Curriculum for Excellence.
A radical addition to the Insight tool is the Virtual Comparator. The virtual comparator is made up of pupils from schools in other local authorities who have similar characteristics to the pupils in the school in question. It allows one to see how the performance of pupils compares to a similar group of pupils from across Scotland to help undertake self-evaluation and improvement activities. For each pupil in the cohort of interest, 10 matching pupils are randomly selected from other local authorities based on the following characteristics:
• Gender • Additional support needs • Latest stage • Scottish Index of Multiple Deprivation vigintile.
This allows virtual comparators to be produced for the target cohort of interest, so, if School A has 20 school leavers all of whom have the same characteristics, 200 different pupils with these same characteristics from schools in the other 31 local authorities will be selected to compare them to Table 30 to Table 32 look at school leaver attainment, the data contained in the tables is taken from Insight and pertains to school leavers for academic year 2014/15 which is the latest data available.

About Dundee 2016 l dundeecity.gov.uk 37
Education
Table 30: Percentage of school leavers attaining literacy and numeracy
Dundee City SCQF Level 4 or better
Virtual Comparator SCQF Level 4 or better
National SCQF Level 4 or better
Dundee City SCQF Level 5 or better
Virtual Comparator SCQF Level 5 or better
National SCQF Level 5 or better
2014/15 83.77% 84.94% 85.76% 51.00% 57.38% 58.62%
Source: Insight
SCQF Levels of Main Awards:SCQF Level 4 – National 4SCQF Level 5 - National 5
Table 31: Average Total Tariff points for School Leavers 2014/15
Lowest 20% attaining leavers
Middle 60% attaining leavers
Highest 20% attaining leavers
Dundee City 124 729 1746
Virtual comparator 159 784 1804
National 168 823 1834
Source: Insight

About Dundee 2016 l dundeecity.gov.ukAbout Dundee 2016 l dundeecity.gov.uk 38
Table 32: Percentage of 2014/15 School Leavers Gaining X or More Awards at SCQF Level Y or Better – Dundee City
Awards SCQF Level 4 or Better
SCQF Level 5 or Better
SCQF Level 6 or Better
SCQF Level 7 or Better
1 or more 95.05% 83.15% 59.20% 17.31%
2 or more 92.12% 75.43% 49.54% 6.57%
3 or more 89.88% 69.40% 41.42% 2.09%
4 or more 86.79% 62.13% 34.00% 0.08%
5 or more 83.38% 55.64% 27.82% 0.00%
6 or more 77.51% 47.06% 18.70% 0.00%
7 or more 66.15% 37.56% 9.20% 0.00%
8 or more 57.88% 29.68% 2.94% 0.00%
9 or more 45.75% 20.79% 0.54% 0.00%
10 or more 30.14% 10.36% 0.08% 0.00%
Source: Insight
SCQF Levels of Main Awards:SCQF Level 4 – National 4SCQF Level 5 – National 5
SCQF Level 6 – Higher SCQF Level 7 – Advanced Higher
School Attendance Rates
Attendance rates across Scotland and Dundee City have remained essentially static over the last four academic sessions and national figures are published every second year.
Table 33: Overall attendance rates for Scotland and Dundee City
2012/13 2013/14 2014/15 2015/16
Scotland 93.6% - 93.7% -
Dundee City 92.3% 92.7% 92.4% 92.5%
Source: Dundee City Council, Children and Families Service
Education

About Dundee 2016 l dundeecity.gov.uk 39
Table 34: Attendance rates by sector for Scotland and Dundee City
2012/13 2013/14 2014/15 2015/16
Primary Scotland 94.9% - 95.1% -
Dundee City 94.0% 94.6% 94.3% 94.3%
Secondary Scotland 91.9% - 91.9% -
Dundee City 90.4% 90.4% 90.0% 90.2%
Source: Dundee City Council, Children and Families Service
Attendance at Dundee Schools remained broadly similar over the last four sessions; figures for each education sector have shown very little variation over this period. The largest contributions to unauthorised absence are unauthorised parental holidays and truancy; of these, truancy has the greater impact. The Children and Families service through central support and in every school have a range of strategies to promote attendance. In addition to this they have taken a number of actions to promote attendance working on the positive benefits of attendance with parents, young people and schools.
Table 35: All People Aged 16 and Over Highest Level of Qualifications
Dundee City
Dundee City %
Scotland Scotland %
No Qualifications 33,208 26.9% 1,173,116 26.8%
Level 1 28,185 22.8% 1,010,875 23.1%
Level 2 19,238 15.6% 627,423 14.3%
Level 3 12,278 9.9% 424,996 9.7%
Level 4 and Above 30,655 24.8% 1,142,662 26.1%
Source: Scottish Census 2011, Table QS501SC – Highest Level of Qualification, All People aged 16 and over
Highest level of qualification is defined as:
Level 1: 0 Grade, Standard Grade, Access 3 Cluster, Intermediate 1 or 2, GCSE, CSE, Senior Certification or equivalent; GSVQ Foundation or Intermediate, SVQ level 1 or 2, SCOTVEC Module, City and Guilds Craft or equivalent; Other school qualifications not already mentioned (including foreign qualifications).
Level 2: SCE Higher Grade, Higher, Advanced Higher, CSYS, A Level, AS Level, Advanced Senior Certificate or equivalent; GSVQ Advanced, SVQ level 3, ONC, OND, SCOTVEC National Diploma, City and Guilds Advanced Craft or equivalent.
Level 3: HNC, HND, SVQ level 4 or equivalent; Other post-school but pre-Higher Education qualifications not already mentioned (including foreign qualifications).
Level 4 and above: Degree, Postgraduate qualifications, Masters, PhD, SVQ level 5 or equivalent; Professional qualifications (for example, teaching, nursing, accountancy); Other Higher Education qualifications not already mentioned (including foreign qualifications).
Education

About Dundee 2016 l dundeecity.gov.ukAbout Dundee 2016 l dundeecity.gov.uk 40
Chart 20: Destination of Leavers, Dundee City 2014/15
Source: Skills Development Scotland, Dundee City Council – Community Planning Partnership Report December 2015 (initial destinations)
Annually Skills Development Scotland (SDS) provides information on the destinations of school leavers from publicly funded schools to the Scottish Government. The 2014/15 cohort includes leavers from publicly funded secondary schools who left school between 1st August 2014 and 15th September 2015. The statistical extracts of the destination of school leavers are taken from a shared dataset held by Skills Development Scotland. The status information has been gathered through the use of shared administrative data from local authorities, colleges and the Department for Work and Pensions (DWP), Student Awards Agency for Scotland (SAAS) and the Skills Development Scotland Corporate Training System.
Chart 20 shows that 35.1% of leavers in Dundee City indicated that they entered higher education. This is 3.2% lower than the national average of 38.3%. The percentage of leavers entering further education is 35.9% which is 8.1% higher than the national average of 27.8%. In Dundee City, 17.3% of leavers indicated that they had entered employment; this is 4.4% lower than the national average of 21.7%. The percentage of leavers entering training is 4.1% this is 0.3% higher than the national average of 3.8%. The percentage of leavers who are unemployed seeking employment is 5.0%; this is 0.4% lower than the national average of 5.4%. School leavers whose destination is unconfirmed is 0.2% this is 0.3% lower than the national average of 0.5%.
Education

About Dundee 2016 l dundeecity.gov.uk 41
Table 36: Students, totals, University of Dundee 2014/15
Mode of Study Undergraduate Students Postgraduate Students
No % No %
Full Time 8,770 86% 1,665 33%
Part Time 1,430 14% 3,315 67%
Domicile Undergraduate Students Postgraduate Students
No % No %
United Kingdom
8,835 87% 3,825 77%
Other European Union
820 8% 335 7%
Non-European Union
540 5% 815 16%
Source: Higher Education Statistics Agency (HESA)
* Please note writing-up and sabbatical students (applicable to HE level only) are not included in standard counts of students.
Table 37: Students, totals, Abertay University 2014/15
Mode of Study Undergraduate Students Postgraduate Students
No % No %
Full Time 3,630 94% 185 54%
Part Time 245 6% 160 46%
Domicile Undergraduate Students Postgraduate Students
No % No %
United Kingdom
3,540 91% 210 60%
Other European Union
295 8% 70 20%
Non-European Union
40 1% 70 20%
Source: Higher Education Statistics Agency (HESA)
* Please note writing-up and sabbatical students (applicable to HE level only) are not included in standard counts of students.
Education

About Dundee 2016 l dundeecity.gov.ukAbout Dundee 2016 l dundeecity.gov.uk 42
6 ECONOMY
Chart 21: Employees (Residence-based) 2009-2014
Source: Nomis Annual Population Survey-Residence Analysis
Between 2009 and 2014, the total number of residence based Dundee City employees declined from 65,300 to 61,000. The number of full time employees also declined during this period from 47,000 to 41,800. During the period the number of part-time employees increased from 18,100 in 2009 to 18,900 in 2014.
Chart 22: Employees (Dundee City Work Place) – 2009-2014
Source: ONS Business Register and Employment Survey

About Dundee 2016 l dundeecity.gov.uk 43
Economy
Between 2009 and 2014, the total number of employees who worked within Dundee City declined from 75,600 to 73,600. The number of full time employees also declined during this period from 51,700 to 49,200. The number of part-time employees increased from 23,800 to 24,400.
Chart 23: Employee Rate (Aged 16-64) – Dundee City and Scotland 2012-2016
Source: ONS Annual Population Survey
Between April 2015 and March 2016, the employment rate for Dundee City was 63.5% and 63,400 people in employment, with 55,900 employees and 7,300 people self-employed. The employment rate for Scotland during the same period was 72.9%, 9.4% higher than the Dundee City rate. Dundee City had the lowest employment rate of any Scottish local authority in March 2016.

About Dundee 2016 l dundeecity.gov.ukAbout Dundee 2016 l dundeecity.gov.uk 44
Chart 24: Number of Enterprises – Dundee City 2015
Source: Dundee Economic Profile March 2016 – Data sourced from The Scottish Government Businesses in
Scotland 2015
In 2015, the largest sectors in terms of the number of enterprises in Dundee City were Wholesale, Retail and Repairs (22.5%), Professional, Scientific and Technical (13.4%) and Construction (10.6%).
Chart 25: Total Employment in Registered Enterprises – Dundee City 2015
Source: Dundee Economic Profile March 2016 – Data sourced from The Scottish Government: Businesses in Scotland 2015
Economy
1,510(3.0%)1,860(3.6%)
10,040(19.7%)2,900(5.7%)3,090(6.0%)
800(1.6%)1,300(2.5%)
2,800(5.5%)4,650(9.1%)
1,720(3.4%)12,270(24.0%)
2,820(5.5%)4,910(9.6%)
410(0.8%)
0 2000 4000 6000 8000 10000 12000 14000
SOtherServiceAc2vi2esRArts,EntertainmentandRecrea2on
P,QEduca2on,HealthandSocialNAdministra2veandSupportServices
MProfessional,Scien2ficandTechnicalLRealEstateAc2vi2es
KFinancialandInsuranceAc2vi2esJInforma2onandCommunica2on
IAccommoda2onandFoodServiceHTransportandStorage
GWholesale,RetailandRepairsFConstruc2on
CManufacturingA,B,D,EPrimaryIndustries
TotalEmployment
TotalEmploymentInRegisteredEnterprises-DundeeCity2015

About Dundee 2016 l dundeecity.gov.uk 45
Economy
In 2015, the largest sectors in terms of total employment within Dundee were Wholesale, Retail and Repairs (12,270 employees), Education, Human Health and Social Service (10,040 employees), Manufacturing (4,910 employees) and Accommodation and Food Services (4,650 employees).
Table 38: Largest Enterprise by Employment: Dundee City
Employer Name
Tesco
B T
Michelin Tyre plc
D C Thomson & Company Limited
Asda
The James Hutton Institute
NCR Financial Solutions Group Limited
Teletaxis (Dundee) Limited
Gowrie Care Limited
Handy Taxis
C J Lang & Son Limited
Joinery & Timber Creations (65) Limited
Bank of Scotland
McGill
Tokheim UK Limited
Wm Morrison Supermarket Plc
505050 Limited
Profile Security Services Limited
J Sainsbury’s Plc
W H Brown Construction (Dundee) Limited
Alliance Trust Plc
Galloway Group Limited
Tayforth V O T C
Day International (UK) Limited
Hillcrest Housing Association
Table continued on next page

About Dundee 2016 l dundeecity.gov.ukAbout Dundee 2016 l dundeecity.gov.uk 46
Marks & Spencer Plc
Thorntons Solicitors
Dundee Private Hire Ltd
Allied Health Care
Debenhams plc
Source: Dundee City Company Survey 2012
Please note organisations marked in bold are those with 250 plus employees in 2012 and classified as large enterprises.
The data shown in Table 38 is accurate as at 2012 Dundee City Company Survey. Revisions have been made in relation to what is known about major organisations which are no longer in operation.
Table 39: Public Sector Jobs 2009-2014
Year Dundee City % Scotland %
2009 25,210 33.4% 639,259 26.6%
2010 25,954 35.4% 637,585 27.4%
2011 24,228 33.7% 613,924 26.1%
2012 23,699 33.2% 600,204 25.9%
2013 23,337 32.6% 603,278 25.7%
2014 22,259 30.2% 571,741 23.5%
Source: ONS Business Register and Employment Survey Public/Private Sector Data
Table 40: Knowledge Intensive Jobs 2009-2014
Year Dundee City % Scotland %
2009 36,500 48.3 995,500 41.4
2010 36,100 49.2 968,800 41.6
2011 35,700 49.5 974,900 41.5
2012 34,800 48.8 955,700 41.2
2013 35,100 49.0 960,900 40.9
2014 35,700 48.4 988,700 40.6
Source: ONS Business Register and Employment Survey: Knowledge Intensive Industries (consistent with ONS terminology and other years)
Economy
Table continued from previous page
About Dundee 2016 l dundeecity.gov.uk 47
Economy
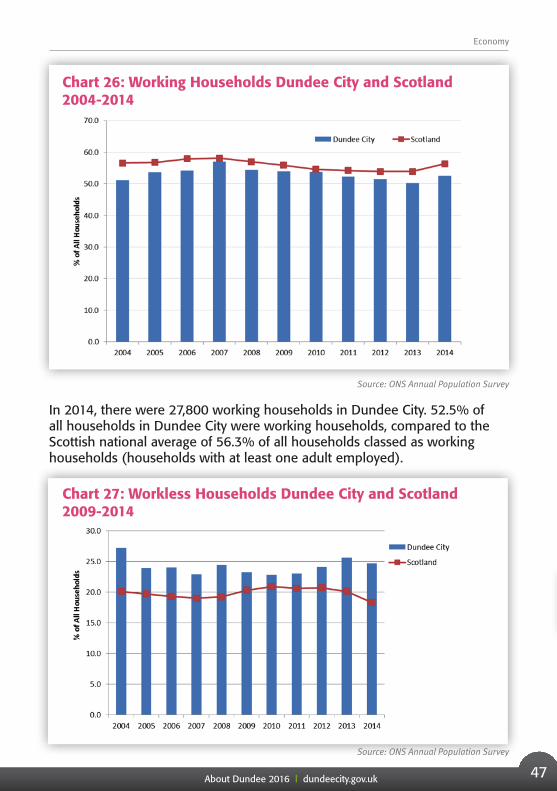
Chart 26: Working Households Dundee City and Scotland 2004-2014
Source: ONS Annual Population Survey
In 2014, there were 27,800 working households in Dundee City. 52.5% of all households in Dundee City were working households, compared to the Scottish national average of 56.3% of all households classed as working households (households with at least one adult employed).
Chart 27: Workless Households Dundee City and Scotland 2009-2014
Source: ONS Annual Population Survey

About Dundee 2016 l dundeecity.gov.ukAbout Dundee 2016 l dundeecity.gov.uk 48
In 2014 there were 13,100 workless households in Dundee City. 24.7% of households in Dundee City were workless household compared to 18.3% of households being workless in Scotland. In 2014, Dundee City had the third highest rate of workless households in all of Scotland (unemployed and economically inactive households).
Table 41: Economic Activity and Economic Inactivity, Dundee City, April 2015-March 2016
Economically Active Number %
Economic Active – Aged 16-64 67,900 68.9%
Economic Active– Males 34,200 71.1%
Economic Active – Females 33,700 66.7%
Employment Rate – Aged 16-64 61,600 62.5%
Employment Rate Males – Aged 16-64 29,700 61.7%
Employment Rate Females – Aged 16-64 31,900 63.2%
Employees 54,700 55.5%
Self Employed 6,700 6.8%
Unemployment rate – Aged 16-64 6,300 6.4%
Unemployment rate Males – Aged 16-64 4,500 9.4%
Unemployment rate Females – Aged 16-64 1,800 3.6%
Economically Inactive Number %
Economically Inactive – Aged 16-64 29,100 29.5%
Inactive who want a job 9,100 9.2%
Inactive who do not want a job 20,000 20.3%
Inactive student 8,600 8.7%
Inactive looking after family/home 5,500 5.6%
Inactive temporary sick 1,200 1.2%
Inactive long-term sick 7,900 8.0%
Inactive retired 3,000 3.0%
Inactive other 2,600 2.6%
Source: ONS Annual Population Survey* Percentage figure expressed as a proportion of cohort group
Economy
About Dundee 2016 l dundeecity.gov.uk 49
8.3%
23.6%
24.5%
35.6%
8.0%
Hours worked by all persons aged 16-‐74 in employment
Part-‐0me 1 to 15 hours
Part-‐0me 16 to 30 hours
Full-‐0me 31 to 37 hours
Full-‐0me 38 to 48 hours
Full-‐0me 49 hours or more
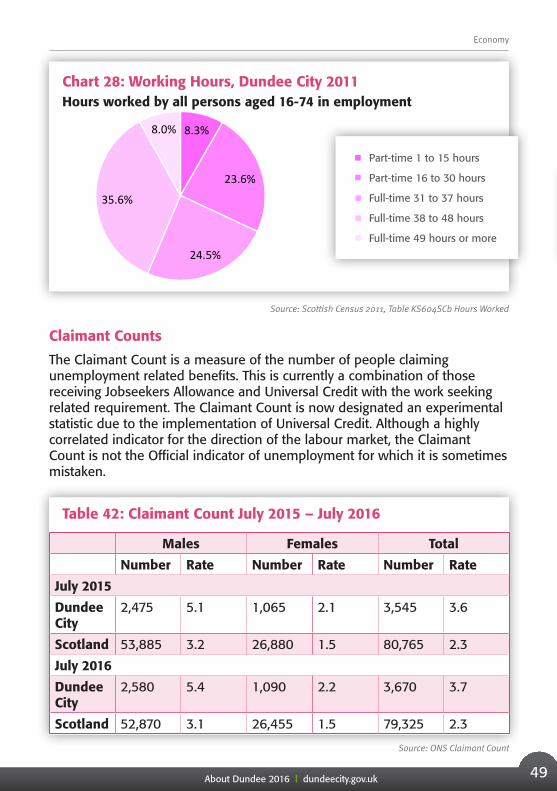
Chart 28: Working Hours, Dundee City 2011Hours worked by all persons aged 16-74 in employment
Source: Scottish Census 2011, Table KS604SCb Hours Worked
Claimant Counts
The Claimant Count is a measure of the number of people claiming unemployment related benefits. This is currently a combination of those receiving Jobseekers Allowance and Universal Credit with the work seeking related requirement. The Claimant Count is now designated an experimental statistic due to the implementation of Universal Credit. Although a highly correlated indicator for the direction of the labour market, the Claimant Count is not the Official indicator of unemployment for which it is sometimes mistaken.
Table 42: Claimant Count July 2015 – July 2016
Males Females Total
Number Rate Number Rate Number Rate
July 2015
Dundee City
2,475 5.1 1,065 2.1 3,545 3.6
Scotland 53,885 3.2 26,880 1.5 80,765 2.3
July 2016
Dundee City
2,580 5.4 1,090 2.2 3,670 3.7
Scotland 52,870 3.1 26,455 1.5 79,325 2.3
Source: ONS Claimant Count
Part-time 1 to 15 hours
Part-time 16 to 30 hours
Full-time 31 to 37 hours
Full-time 38 to 48 hours
Full-time 49 hours or more
Economy

About Dundee 2016 l dundeecity.gov.ukAbout Dundee 2016 l dundeecity.gov.uk 50
The Dundee City claimant rate stood at 3.7 in July 2016, this has increased slightly from 3.6 in the same period of July 2015. The Dundee City claimant rate remains above the Scottish rate which was 2.3 in July 2016.
Table 43: Long-Term Claimant Count – July 2015 – July 2016
Males Females Total
Number Rate Number Rate Number Rate
July 2015
Dundee City
880 1.8 295 0.6 1,170 1.2
Scotland 15,165 0.9 6,220 0.4 21,385 0.6
July 2016
Dundee City
905 1.9 310 0.6 1,220 1.2
Scotland 16,520 1.0 6,920 0.4 23,450 0.7
Source: ONS Claimant Count, DWP Stat-Xplore
The long-term claimant count in Dundee City was 1.2 in July 2016, this is consistent with the long-term claimant rate of 1.2 in July 2015. The Dundee City long-term claimant rate was higher than the Scottish rate which stood at 0.7 in July 2016.
Table 44: Claimant Count (those aged 18-24) July 2015 – July 2016
Males Females Total
Number Rate Number Rate Number Rate
July 2015
Dundee City
630 6.7 335 3.3 960 4.9
Scotland 12,780 5.1 6,800 2.7 19,580 3.9
July 2016
Dundee City
660 7.0 310 3.0 970 4.9
Scotland 12,555 5.0 6,480 2.6 19,030 3.8
Source: ONS Claimant Count* Rate expressed as a proportion of gender group aged 18-24
Economy

About Dundee 2016 l dundeecity.gov.uk 51
The claimant count of those aged 18-24 in Dundee City was 4.9 in July 2016, this was consistent with the rate at July 2015. The Dundee City Claimant rate for those aged 18-24 was higher than the Scottish rate which stood at 3.8 in July 2016.
Chart 29: Gross Weekly Pay (FTE/Median): Dundee City and Scotland 2015
Source: Dundee City Economic Profile 2016, Data Source; ONS Annual Survey of Hour and Earnings – Resident/Workplace Analysis
Gross median weekly earnings for full-time workers working in Dundee City in 2015 were £523.50 per week, compared to £527.00 for the rest of Scotland. Gross median weekly earnings for full-time workers living in Dundee City in 2015 were £463.30 per week. Gross weekly earnings for full-time employees working in Dundee were £60.20 higher than for full-time employees living in Dundee in 2015.
Chart 30: Median* Gross Annual Pay (Full-Time Employees) 2015
Source: ONS Annual Survey of Hours and Earnings (resident analysis) 2015 * All data in table above is for full time workers
Economy

About Dundee 2016 l dundeecity.gov.ukAbout Dundee 2016 l dundeecity.gov.uk 52
7 HOUSEHOLDS
Table 45: Tenure of Households, Dundee City 2011
Dundee City % Scotland %
Total number of households (with residents)
69,193 100.0% 2,372,777 100.0.%
Privately owned outright
15,971 23.1% 660,643 27.8%
Owned with mortgage or loan
18,609 26.9% 800,175 33.7%
Shared ownership 305 0.4% 10,168 0.4%
Rented from local authority
12,826 18.5% 312,745 13.2%
Other social rent 7,971 11.5% 263,674 11.1%
Privately rented 12,921 18.7% 294,892 12.4%
Living rent free 590 0.9% 30,480 1.3%
Source: Scottish Census 2011, Table KS402SC, Tenure, All Households
The Scottish Census 2011 found that of all the households with residents in Dundee City, 50.4% were owned and 48.7% were rented.
Table 46: Number of People living in Households, Dundee City 2011
Dundee City % Scotland %
Total number of households (with residents)
69,193 100.0% 2,372,777 100.0%
Number of 1 person households
27,955 40.4% 823,314 34.7%
Number of 2 person households
22,424 32.4% 807,658 34.0%
Number of 3 person households
9,779 14.1% 357,491 15.1%

About Dundee 2016 l dundeecity.gov.uk 53
Households
Number of 4 person households
6,309 9.1% 272,329 11.5%
Number of 5 person households
2,014 2.9% 86,722 3.7%
Number of 6 or more person households
712 1.0% 25,263 1.1%
Source: Scottish Census 2011, Table QS406SC, Household Size, All Occupied Household Spaces
Table 46 shows that according to the 2011 Scottish Census, 40.4% of households in Dundee City were 1 person households. 55.6% of households in Dundee City had between 2-4 persons living in them.
Chart 31: Household Estimates, Dundee City, Estimates and Projections 2001 - 2037
Source: NRS Household Projections for Scotland 2012 based and Estimates of households and dwellings in Scotland 2015
The 2015 estimate of the number of households in Dundee City is 69,534. This is a decrease of 0.1% when compared to the 2014 estimate of 69,610. The total number of households in Dundee City is projected to increase from 69,263 in 2012 to 85,065 in 2037. This is an increase of 22.8% over the 25-year period.
0
10,000
20,000
30,000
40,000
50,000
60,000
70,000
80,000
90,000
2001
20
02
2003
20
04
2005
20
06
2007
20
08
2009
20
10
2011
20
12
2013
20
14
2015
20
16
2017
20
18
2019
20
20
2021
20
22
2023
20
24
2025
20
26
2027
20
28
2029
20
30
2031
20
32
2033
20
34
2035
20
36
2037
Household Es6mates 2013
2012 Based Projec6ons
2010 Based Projec6ons
2008 Based Projec6ons
2006 Based Projec6ons
2004 Based Projec6ons
Household Estimates 2015
2012 Based Projections
2010 Based Projections
2008 Based Projections
2006 Based Projections
2004 Based Projections

About Dundee 2016 l dundeecity.gov.ukAbout Dundee 2016 l dundeecity.gov.uk 54
Table 47: Projected number of households by age group, Dundee City (2012 based projections)
Age of head of house hold
Base year
Projected number of households % change in Dundee City 2012-2037
% change in Scotland 2012- 2037
2012 2017 2022 2027 2032 2037
16-29 yrs
12,523 13,556 12,192 11,882 12,449 13,532 8% 5%
30-44 yrs
16,292 17,567 21,872 24,092 24,381 22,410 38% 7%
45-59 yrs
17,898 18,100 16,702 16,356 17,992 22,652 27% 1%
60-74 yrs
13,592 13,970 14,929 15,515 15,474 13,977 3% 16%
75+ yrs 8,958 8,989 9,545 10,384 11,175 12,494 39% 82%
Total house holds Dundee City
69,263 72,181 75,240 78,229 81,471 85,065 23% 17%
Source: NRS Household Projections for Scotland (2012 based) published July 2014
The NRS 2012 based household projections show that the overall number of households in Dundee City is projected to increase by 23% between 2012 and 2037. The table above shows that the percentage of households where the head of the household is aged 75+ is expected to increase by 39% between 2012 and 2037.
Households

About Dundee 2016 l dundeecity.gov.uk 55
Households
Table 48: National Records of Scotland – Sub Council Area Household Projections (2012 based) 2012-2026
Area 2012 2014 2016 2018 2020 2022 2024 2026 % Change 2012-2026
Coldside 10,043 10,019 10,053 10,092 10,149 10,235 10,319 10,428 3.8%
East End 7,410 7,507 7,664 7,830 7,979 8,163 8,316 8,476 14.4%
Lochee 9,490 9,564 9,699 9,819 9,930 10,075 10,206 10,353 9.1%
Maryfield 9,381 9,765 10,244 10,738 11,198 11,694 12,180 12,670 35.1%
North East 6,652 6,634 6,653 6,678 6,676 6,693 6,696 6,691 0.6%
Strathmartine 7,905 7,940 8,033 8,100 8,171 8,236 8,275 8,318 5.2%
The Ferry 8,900 9,062 9,277 9,486 9,678 9,869 10,046 10,227 14.9%
West End 9,481 9,586 9,821 10,065 10,180 10,274 10,360 10,437 10.1%
Dundee City (Total)
69,263 70,075 71,445 72,809 73,961 75,240 76,396 77,600 12.0%
Source: NRS Population and Household Projections for Sub-Council Areas (2012-Based)
In 2016, National Records of Scotland (NRS) published the results of a one-off research project to produce household projections for sub-council areas. The figures in Table 48 are based on past trends and are projections not forecasts. Household projections incorporate past trends in house building. The figures reflect past policy changes and trends in housebuilding but they do not incorporate any future housebuilding and/or policy trends. For example an area may have had a high level of house building over the last few years, which is now coming to an end but the projections will show a continuation as the assumption is made that this will continue. The projections therefore have limitations in their use. They do however give an indication of how an area may change if past trends were to continue.

About Dundee 2016 l dundeecity.gov.ukAbout Dundee 2016 l dundeecity.gov.uk 56
74%
21%
5%
A-‐C
D-‐E
F-‐H
A-C
D-E
F-H
53%
18%
18%
11%
Flat
Terraced
Semi-‐detached
Detached
Flat
Terraced
Semi-detached
Detached
19%
52%
74%
Dundee City – Estimated Number of Dwellings
National Records of Scotland Estimates of households and dwellings in Scotland 2015, estimated that there were 73,689 dwellings in Dundee City. Of these 70,233 (95.3%) were occupied dwellings, 3,192 (4.3%) were vacant dwellings and 264 (0.4%) were second home dwellings.
Chart 32: Types of dwelling in Dundee City, 2014
Source: NRS Estimates of Household and Dwellings 2014
*NRS are expected to provide 2015 figures for the types of dwelling in 2015 in the coming months
Chart 33: Dwelling Council Tax Bands
Source: NRS Estimates of Household and Dwellings 2015
Households
22%

About Dundee 2016 l dundeecity.gov.uk 57
Households
Council Tax Bands:
Bands A-C = Up to £45,000Bands D-E = Over £45,000 up to £80,000Bands F-H = Over £80,000
* Please note that Council Tax Bands are based on the property values as at 1st April 1991 and not the present value of the property.
Chart 32 shows that according to NRS Estimates of Households and Dwellings 2014, the most common type of dwelling in Dundee City was a flat. Chart 33 shows that 74% of Dwellings in Dundee City were in Council Tax bands A-C.
Chart 34: Volume of residential property sales per quarter 2003 to 2015
Source: Register of Scotland, Property Statistics 2015
Chart 34 shows the number of property sales per quarter for Dundee City from 2003 to 2015. The normal seasonal fluctuations in the number of sales from 2003 to 2007 can be seen, with fewer sales taking place in winter. However, in 2008 the effects of the national property market crash have a clear overriding effect on the number of sales. 2009 through to 2015 shows evidence of a return to the expected seasonal pattern but a markedly lower number of transactions than before the property sales crash.

About Dundee 2016 l dundeecity.gov.ukAbout Dundee 2016 l dundeecity.gov.uk 58
Chart 35: Quarterly Median Residential Property Prices for Dundee and Scotland 2003 to 2015
Source: Register of Scotland Property Statistics 2015
Table 49: Quarterly Median Property Prices for Dundee and Scotland 2012, to 2015
Quarter Dundee Scotland
2012 First £95,000 £125,000
Second £100,000 £125,000
Third £100,550 £130,013
Fourth £105,500 £127,000
2013 First £105,000 £121,000
Second £108,559 £125,000
Third £115,750 £135,000
Fourth £112,000 £133,000
2014 First £103,500 £125,000
Second £117,000 £135,000
Third £109,500 £142,539
Fourth £109,000 £139,000
2015 First £106,000 £138,000
Second £108,500 £140,000
Third £117,750 £144,500
Fourth £115,434 £141,264
Source: Register of Scotland, Quarterly House Price Statistical Report
Households

About Dundee 2016 l dundeecity.gov.uk 59
Households
Chart 36: General condition of your house/flat
Overall, how do you rate the general condition of your house/flat?
Source: Dundee City Council, Annual Citizens Survey 2015
Chart 36 shows the vast majority of respondents (96%) in the 2015 Dundee City Council Annual Citizens Survey indicated the general condition of their home was “very” or “fairly” good. 4% of respondents stated that their house/flat was in average condition.
Key Findings from the 2015 Dundee City Council Annual Citizens Survey
• 50% of participants stated they had lived in their current neighbourhood for more than 10 years
• The top two reasons for what people liked best about living in their neighbourhood was it was quiet/peaceful (49%) and neighbours (27%)
• 75% of respondents stated there was “nothing” that they did not like about their neighbourhood when asked to indicate the worst aspects of their neighbourhood
• The most popular reasons given by those who were able to provide examples of what they disliked about their neighbourhood included drug problems (3%), anti-social neighbours (4%) and difficult or poor parking (3%).
• Overall satisfaction with the quality of life in the neighbourhood is high, with almost all participants (99%) stating they were very satisfied or satisfied. Overall satisfaction with the neighbourhood quality of life had remained consistent with the results of the 2014 survey
• Overall satisfaction with quality of life in Dundee is high with all participants (100%) stating they were very satisfied or satisfied.

About Dundee 2016 l dundeecity.gov.ukAbout Dundee 2016 l dundeecity.gov.uk 60
House Completions
Chart 37: Dundee City – Completions (By Tenure) Figures as at April each year
Source: Dundee Housing Land Audit 2016
Households

About Dundee 2016 l dundeecity.gov.uk 61
Chart 38: Safety in the neighbourhoodTaking everything into account how safe do you feel your neighbourhood is as a place to live?
Source: Dundee City Council, Annual Citizens Survey 2015
Chart 38 shows that 99% of respondents who participated in the Dundee City Council Annual Citizens Survey indicated that their neighbourhood was a “very” or “fairly” safe place to live. In contrast just 1% of respondents indicated that it was a bit unsafe. These results are consistent with the results of the 2014 Annual Citizens Survey.
Chart 39: Perception of Safety walking in the neighbourhood during the day
Source: Dundee City Council, Annual Citizens Survey 2015
8SAFER AND STRONGER COMMUNITIES
2012
2013
2014
2015
2011
2012
2013
2014
2015

About Dundee 2016 l dundeecity.gov.ukAbout Dundee 2016 l dundeecity.gov.uk 62
Chart 39 shows that in the 2015 Dundee City Council Annual Citizens Survey, 100% of respondents indicated they felt “very” or “fairly” safe walking alone in their neighbourhood during the day.
Chart 40: Perception of safety when walking in your neighbourhood after dark
Source: Dundee City Council, Annual Citizens Survey 2015
Chart 40 shows that 83% of respondents in the 2015 Dundee City Council Annual Citizens Survey indicated they felt “very” or “fairly” safe when walking alone in their neighbourhood after dark.
Chart 41: Perception of safety when alone in your home during the day
Source: Dundee City Council, Annual Citizens Survey 2015
Safer and Stronger Communities
2011
2012
2013
2014
2015
2011
2012
2013
2014
2015
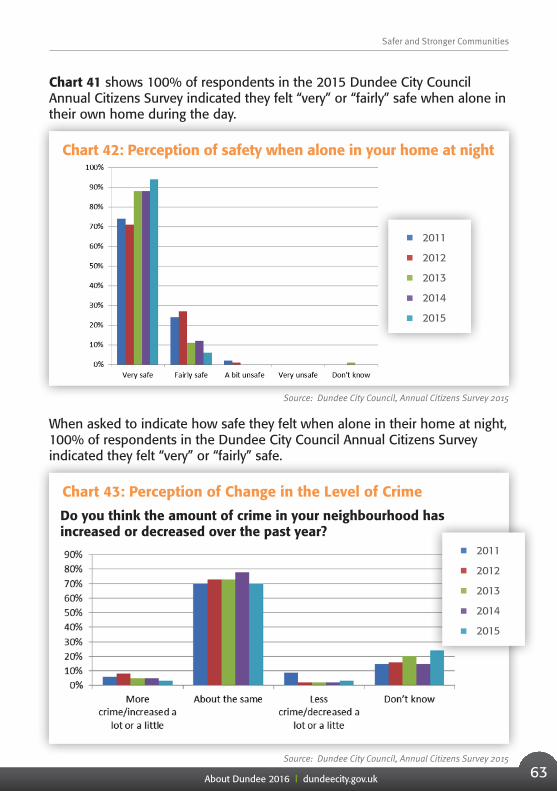
About Dundee 2016 l dundeecity.gov.uk 63
Chart 41 shows 100% of respondents in the 2015 Dundee City Council Annual Citizens Survey indicated they felt “very” or “fairly” safe when alone in their own home during the day.
Chart 42: Perception of safety when alone in your home at night
Source: Dundee City Council, Annual Citizens Survey 2015
When asked to indicate how safe they felt when alone in their home at night, 100% of respondents in the Dundee City Council Annual Citizens Survey indicated they felt “very” or “fairly” safe.
Chart 43: Perception of Change in the Level of Crime
Do you think the amount of crime in your neighbourhood has increased or decreased over the past year?
Source: Dundee City Council, Annual Citizens Survey 2015
Safer and Stronger Communities
2011
2012
2013
2014
2015
2011
2012
2013
2014
2015

About Dundee 2016 l dundeecity.gov.ukAbout Dundee 2016 l dundeecity.gov.uk 64
Chart 43 shows that when asked about the change in the level of crime in the past year, the majority of respondents (70%) in the 2015 Dundee City Council Annual Citizens Survey were of the opinion that the level of crime has remained about the same over the last year. This is lower than the results of the 2014 survey (78%). On the other hand, 3% of respondents said there had been an increase in the level of crime (5% in 2014) and 3% said the level of crime had decreased (2% in 2014).
Chart 44: Fear of CrimeTo what extent, if at all, does fear of crime prevent you from taking part in every day activities?
Source: Dundee City Council, Annual Citizens Survey 2015
The vast majority (91%) of respondents of the Dundee City Council, Annual Citizens Survey 2015 stated that the fear of crime does not prevent them at all from taking part in everyday activities. These results are consistent with the results of the 2014 Annual Citizens Survey.
Table 50: Recorded Crimes and Offences, Dundee City 2015-16 Crime Group Number Recorded Rate per 10,000
population
Group 1: Crimes of Violence 235 15.9
Group 2: Sexual Crimes 419 28.3
Group 3: Crimes of Dishonesty 4,508 304.2
Group 4: Fire-raising, Malicious Mischief etc
1,900 128.2
Group 5: Other Crimes 1,775 119.8
Total Crimes (Groups 1 to 5) 8,837 596.2
Source: Police Scotland – Management Information, Council Area Report, Quarter 4 2015/16
2012
2013
2014
2015
Safer and Stronger Communities

About Dundee 2016 l dundeecity.gov.uk 65
The Scottish Index of Multiple Deprivation (SIMD) is the Scottish Government’s official tool for identifying places in Scotland suffering from deprivation. Deprivation in this context refers to the range of problems that arise due to the lack of resources or opportunities covering health, safety, education, employment, housing and access to services as well as financial aspects.
The most recent Scottish Index of Multiple Deprivation was released by the Scottish Government on 31st August 2016. The SIMD divides Scotland into 6,976 small areas called data zones with roughly an equal population in each data zone. The Scottish Government then look at the indicators to measure the different sides of deprivation in each data zone including pupil performance, travel times to GP’s, crime, unemployment etc. These 38 indicators of deprivation are then grouped into 7 types called domains. These domains are:
• Income• Employment• Education• Health• Access to Services• Crime• Housing
The 7 domains are combined into one SIMD, ranking each data zone in Scotland from 1 (Most Deprived) to 6,976 (Least Deprived). The SIMD allows organisations to target policies and place resources in the areas with greatest need.
The boundaries used to collate the SIMD have changed in 2016 as the analysis was based on the 2011 data zones which were produced by the Scottish Government. The previous SIMD’s published by the Scottish Government were based on the Scottish Governments 2001 based data zones. This means that the data zones used in the 2016 SIMD are not directly comparable with previous data zones.
Table 51: Comparison of SIMD 2012 and SIMD 2016 – Data Zone Counts and Population
SIMD Publication
Total Number of Scottish Data Zones
Number of Dundee City Data Zones
Total Dundee City Population
SIMD 2012 6,505 179 144,290
SIMD 2016 6,976 188 148,260
Source: Scottish Government, Scottish Index of Multiple Deprivation 2016
9SCOTTISH INDEX OF MULTIPLE DEPRIVATION
2012
2013
2014
2015

About Dundee 2016 l dundeecity.gov.ukAbout Dundee 2016 l dundeecity.gov.uk 66
Table 51 shows that Scotland and Dundee City were divided into a larger number of data zones in the SIMD 2016 when compared to the number of data zones contained in the 2012 SIMD. The overall population of Dundee City has grown since the SIMD 2012 publication.
Local Share
The SIMD examines various levels of local share of the most deprived. This looks at the proportion of data zones in each area which are among the most deprived. This local share is calculated by dividing the number of deprived data zones in the area by all data zones in this area. For example, the “local share of the 15% most deprived in Dundee City” is the number of data zones in Dundee City that are in the 15% most deprived in Scotland (55 data zones) divided by the number of all data zones in Dundee City (188 data zones). This results in a local share of 29.3%.
15% Most Deprived Data Zones
• Dundee City has 55 data zones which are in the 15% most deprived in Scotland
• 29% of the Dundee City population live within these areas• 65% of the Dundee City population within the 15% most deprived
areas are of working age• Whilst Dundee City has a slightly smaller percentage of its population
living in the 15% most deprived data zones the number of people has remained almost the same since 2012. The drop in percentage is due to a larger overall population.
Table 52: Dundee City Local Share of 15% Most Deprived Data Zones 2004 to 2016
SIMD 2016 SIMD 2012 SIMD 2009 SIMD 2006 SIMD 2004
55 (29.3%) 55 (30.7%) 54 (30.2%) 53 (29.6%) 51 (28.5%)
Source: Scottish Government, Scottish Index of Multiple Deprivation 2016
Scottish Index of Multiple Deprivation

About Dundee 2016 l dundeecity.gov.uk 67
Scottish Index of Multiple Deprivation
Table 53: Dundee City Population Living in 15% Most Deprived Data Zones 2004 to 2016
SIMD Publication Person Percentage
SIMD 2016 42,350 28.6%
SIMD 2012 42,125 29.2%
SIMD 2009 41,454 29.2%
SIMD 2006 40,941 28.9%
SIMD 2004 41,221 28.3%
Source: Scottish Government, Scottish Index of Multiple Deprivation 2016
Map 1: Scottish Index of Multiple Deprivation 2016 – Data Zones contained in the 15% Most Deprived
Map 1 outlines the location of the 15% most deprived data zones in Dundee City:
Source: Scottish Government, Scottish Index of Multiple Deprivation 2016

About Dundee 2016 l dundeecity.gov.ukAbout Dundee 2016 l dundeecity.gov.uk 68
5% Most Deprived Data Zones
• Dundee City has 21 data zones which are in the 5% most deprived in Scotland
• 11% of the Dundee City population live within these areas• 65% of the Dundee City population who live within the 5% most
deprived areas are of working age
20% Most Deprived Data Zones In the 2016 SIMD publication the Scottish Government has reported on data zones contained in the 20% most deprived in Scotland. In previous publications they have generally looked at the 15% most deprived data zones.
Chart 45 shows the local share proportion of data zones in each Local Authority Area which are contained within the 20% most deprived. The local share is calculated by dividing the number of data zones contained in the 20% most deprived in each area by the total number of data zones in each area.
Chart 45: Local Authority Local Share of Data Zones Contained in the 20% Most Deprived
Source: Scottish Government, Scottish Index of Multiple Deprivation 2016
Dundee City has 69 data zones contained in the 20% most deprived. This equates to a local share of 37%. This is the 5th highest in Scotland, with Glasgow City, Inverclyde, West Dunbartonshire and North Ayrshire having a larger local share of data zones in the 20% most deprived.
Scottish Index of Multiple Deprivation

About Dundee 2016 l dundeecity.gov.uk 69
Chart 46: Local Authority Share of Data Zones Contained in the 20% Least Deprived
Source: Scottish Government, Scottish Index of Multiple Deprivation 2016
Whilst Dundee City had a local share of 37% in the 20% most deprived data zones, Chart 46 shows that it also had a local share of 15% in the 20% least deprived in Scotland.
Scottish Index of Multiple Deprivation – Income Domain
Table 54: Dundee City Local Share of 15% Most Income Deprived Data Zones SIMD 2004 to 2016
SIMD 2016 SIMD 2012 SIMD 2009 SIMD 2006 SIMD 2004
52 (27.7%) 55 (30.7%) 60 (33.5%) 60 (33.5%) 53 (29.6%)
Source: Scottish Government, Scottish Index of Multiple Deprivation 2016
The Scottish Index of Multiple Deprivation 2016, found that Dundee City has 52 data zones ranked in the 15% most income deprived data zones.
Scottish Index of Multiple Deprivation

About Dundee 2016 l dundeecity.gov.ukAbout Dundee 2016 l dundeecity.gov.uk 70
Table 55: Dundee City Local Share of 5% Most Income Deprived Data Zones SIMD 2004 to 2016
SIMD 2016 SIMD 2012 SIMD 2009 SIMD 2006 SIMD 2004
23 (12.2%) 23 (12.8%) 23 (12.8%) 14 (7.8%) 12 (6.7%)
Source: Scottish Government, Scottish Index of Multiple Deprivation 2016
The Scottish Index of Multiple Deprivation 2016 found that Dundee City had 23 data zones ranked within the 5% most income deprived.
Scottish Index of Multiple Deprivation - Employment Domain
Table 56: Dundee City Local Share of 15% Most Employment Deprived Data Zones SIMD 2004 to 2016
SIMD 2016 SIMD 2012 SIMD 2009 SIMD 2006 SIMD 2004
57 (30.3%) 56 (31.3%) 61 (34.1%) 53 (29.6%) 47 (26.3%)
Source: Scottish Government, Scottish Index of Multiple Deprivation 2016
The Scottish Index of Multiple Deprivation 2016 found that Dundee City had 57 data zones ranked within the 15% most employment deprived.
Table 57: Dundee City Local Share of 5% Most Employment Deprived Data Zones SIMD 2004 to 2016
SIMD 2016 SIMD 2012 SIMD 2009 SIMD 2006 SIMD 2004
18 (9.6%) 21 (11.7%) 23 (12.8%) 11 (6.1%) 7(3.9%)
Source: Scottish Government, Scottish Index of Multiple Deprivation 2016
The Scottish Index of Multiple Deprivation 2016 found that Dundee City had 18 data zones ranked within the 5% most employment deprived.
Scottish Index of Multiple Deprivation

About Dundee 2016 l dundeecity.gov.uk 71
POLITICAL REPRESENTATION 10Map 2: Dundee City Electoral Wards
Source: Dundee City Council Information and Research Team
Map 2 shows the Dundee City boundary and the eight electoral wards.
Table 58: Local Government electors on the Electoral Register by Council Area and Electoral Ward 2015
Area Total Electorate Attainers
Coldside 14,188 80
East End 12,147 78
Lochee 14,204 93
Maryfield 11,693 52
North East 11,293 108
Strathmartine 14,958 124
The Ferry 16,179 112
West End 12,458 58
Dundee City 107,120 705
Source: NRS Electoral Statistics – Scotland 1st December 2015
Please note: - As a result of the “Scottish Elections (Reduction of Voting Age) Bill” which was passed in 2015, 16 and 17 year olds are now eligible to vote in both Scottish Parliament and local government elections.
- Attainers are those who will become 16 years old during the currency of the Register.
.

About Dundee 2016 l dundeecity.gov.ukAbout Dundee 2016 l dundeecity.gov.uk 72
Table 59: Breakdown of Dundee City Councillors by Ward
Ward Councillor Political Party
Coldside Mohammed Asif Scottish Labour
Jimmy Black Scottish National Party (SNP)
David Bowes Scottish National Party (SNP)
Helen Wright* Scottish Labour
East End Will Dawson Scottish National Party (SNP)
Lesley Brennan Scottish Labour
Christina Roberts Scottish National Party (SNP)
Lochee Bob Duncan Scottish National Party (SNP)
Tom Ferguson Scottish Labour
Norma McGovern Scottish Labour
Alan Ross Scottish National Party (SNP)
Maryfield Georgia Cruickshank Scottish Labour
Ken Lynn Scottish National Party (SNP)
Lynne Short Scottish National Party (SNP)
North East Gregor Murray Scottish National Party (SNP)
Brian Gordon Scottish Labour
Willie Sawers* Scottish National Party (SNP)
Political Representation
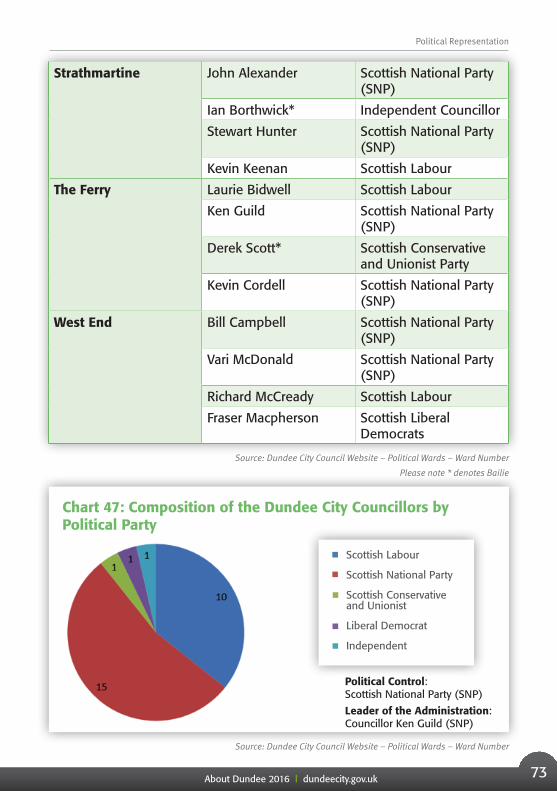
About Dundee 2016 l dundeecity.gov.uk 73
Political Representation
Strathmartine John Alexander Scottish National Party (SNP)
Ian Borthwick* Independent Councillor
Stewart Hunter Scottish National Party (SNP)
Kevin Keenan Scottish Labour
The Ferry Laurie Bidwell Scottish Labour
Ken Guild Scottish National Party (SNP)
Derek Scott* Scottish Conservative and Unionist Party
Kevin Cordell Scottish National Party (SNP)
West End Bill Campbell Scottish National Party (SNP)
Vari McDonald Scottish National Party (SNP)
Richard McCready Scottish Labour
Fraser Macpherson Scottish Liberal Democrats
Source: Dundee City Council Website – Political Wards – Ward Number
Please note * denotes Bailie
Chart 47: Composition of the Dundee City Councillors by Political Party
Source: Dundee City Council Website – Political Wards – Ward Number
Scottish Labour
Scottish National Party
Scottish Conservative and Unionist
Liberal Democrat
Independent
Political Control: Scottish National Party (SNP)
Leader of the Administration: Councillor Ken Guild (SNP)

About Dundee 2016 l dundeecity.gov.ukAbout Dundee 2016 l dundeecity.gov.uk 74
Table 60: Scottish Parliament Electors on the Electoral Register by Scottish Parliamentary Constituency December 2015
Constituency/Region Total Electorate Attainers
Dundee City East 54,599 356
Dundee City West 52,521 349
Source: NRS, Electoral Statistics – Scotland December 2015
Please note:- 16 and 17 year olds are now eligible to vote in Scottish Parliamentary and local government elections. Attainers are
those who will become 16 year olds during the currency of the Register
Table 61: Scottish Parliament, Dundee Representation
Constituency/Region MSP Political Party
Dundee East Shona Robison Scottish National Party (SNP)
Dundee West Joe FitzPatrick Scottish National Party (SNP)
North East Scotland Peter Chapman Scottish Conservative and Unionist Party
Alex Johnstone Scottish Conservative and Unionist Party
Liam Kerr Scottish Conservative and Unionist Party
Lewis Macdonald Scottish Labour
Jenny Marra Scottish Labour
Mike Rumbles Scottish Liberal Democrats
Ross Thomson Scottish Conservative and Unionist Party
Source: Scottish Parliament Website – MSPs
Political Representation

About Dundee 2016 l dundeecity.gov.uk 75
11TOURISM
Table 62: GB Tourists by Country of Residence, (Trips and Tourist Spend) 2014
Angus & Dundee Scotland
Trips (000's) Tourist Spend (£m)
Trips (000's) Tourist Spend (£m)
England 169 30 5,569 1,608
Scotland 228 44 6,516 1,170
Wales 11 3 435 93
Total GB 408 76 12,519 2,871
Source: Visit Scotland- Tourism in Scotland’s Region 2014
Table 63: Overseas Tourists by Trips and Tourist Spend 2014
Country of Residence
Angus & Dundee Scotland
Trips (000's)
Tourist Spend (£m)
Trips (000's)
Tourist Spend (£m)
USA 12 4 418 436
Germany 6 <1 343 174
France 7 1 190 110
Australia 2 1 158 130
Netherlands 7 1 149 80
Poland 4 <1 138 45
Norway 1 <1 125 68
Canada 8 5 122 88
Irish Republic 1 <1 113 28
Spain - - 101 97
Rest of World 28 14 843 584
Total Overseas 77 29 2,700 1,840
Source: Visit Scotland – Tourism in Scotland’s Region 2014

About Dundee 2016 l dundeecity.gov.ukAbout Dundee 2016 l dundeecity.gov.uk 76
Table 64: Accommodation Occupancy – Net Occupancy Rates (%)
Angus & Dundee
Hotel Room % Guesthouse / B&B %
Self Catering Unit %
Jan 52% 26% 33%
Feb 58% - 44%
Mar 59% - 40%
Apr - - 60%
May 75% - 72%
Jun - - 60%
Jul 78% - 72%
Aug 76% - 77%
Sep 79% - 52%
Oct - - 61%
Nov - - 39%
Dec 45% - 35%
Annual Average 66% 39% 55%
Source: Visit Scotland – Tourism in Scotland’s Region 2014 Please note – indicates that the sample size available is insufficient for data collection
Table 65: Accommodation Used: GB Tourist Nights (000s)
Angus & Dundee
GB Tourist Nights (000s)
Hotel / Motel 233
Friends / Relatives 431
B&B / Guest House 131
Self-Catering 120
Camping / Touring Caravan 100
Other 48
Total 1,063
Source: Visit Scotland – Tourism in Scotland’s Region 2014
• Self-catering includes self-catering apartments and static caravans (owned and rented)• Camping/ touring caravan include holiday camp, camping and touring caravan
Tourism

About Dundee 2016 l dundeecity.gov.uk 77
Tourism
Table 66: Accommodation Used: Overseas Tourist Nights (000’s)
Angus & Dundee
Overseas Tourist Nights (000’s)
Hotel / Guest House 104
Free guest with relatives or friends 133
B&B 9
Rented House 13
Hostel / University / School 44
Camping / Mobile Home 8
Own Home 35
Holiday Village / Centre 7
Paying guest family or friends house -
Other 5
Total 356
Source: Visit Scotland – Tourism in Scotland’s Region 2014

About Dundee 2016 l dundeecity.gov.ukAbout Dundee 2016 l dundeecity.gov.uk 78
12CLIMATE
2012
2013
2014
2015
2012
2013
2014
2015
Dundee is home to a changeable temperate climate. Influenced by its coastal location, the weather in Dundee is surprisingly mild for a Scottish City. The autumn and winter months are amongst the wettest of the year, with a higher rainfall than the spring and summer seasons. Winter weather in Dundee can be mild at times, although strong breezes often make the climate feel cooler.
The nearest Met Office recording station is at Leuchars, some seven miles to the south. Leuchar’s proximity to Dundee means that the two locations experience essentially the same weather. The following charts all show data for Leuchars for 2012, 2013 and 2014 and 2015.
Chart 48: Monthly rainfall (Leuchars Met Office Station)
Source: Met Office Please note data for June 2015 – December 2015 is provisional data only
Chart 49: Monthly hours of sunshine (Leuchars Met Office Station)
Source: Met Office Please note data for June 2015 – December 2015 is provisional data only

About Dundee 2016 l dundeecity.gov.uk 79
Chart 50: Dundee City Energy Consumption (Gwh)
Source: Statistics.Gov.Scot (Beta Site)
Table 67: Co2 Emissions per capita (Tonnes)
Dundee City
CO2 Emissions per capita (Tonnes)
2008 2009 2010 2011 2012 2013 2014
Tonnes 7.1 6.4 6.6 5.9 6.2 5.9 5.1
Source: Department of Energy & Climate Change – UK Local authority and regional estimates of carbon dioxide emissions – 2005 to 2014 UK Local and Regional CO2 emissions: Statistical release (published June 2016)
Chart 51: Emissions Estimates 2005-2014 (kt C02)
Source: Department of Energy & Climate Change – UK Local authority and regional estimates of carbon dioxide emissions – 2005 to 2014 UK Local and Regional CO2 emissions: Statistical release (published June 2016)
ENVIRONMENT 13Electricity Domestic Customer
Electricity Commercial Customer
Gas Domestic Customer
Gas Commercial Customer
Domestic
Industrial & Commercial
Transport

About Dundee 2016 l dundeecity.gov.ukAbout Dundee 2016 l dundeecity.gov.uk 80
Table 68: Municipal waste recycling and composting rates 2011/12
Local Authority Municipal Waste Arisings (Tonnes)
Waste composted or recycled (%)
Aberdeen City 114,619 31.5%
Dundee City 98,268 45.9%
Edinburgh, City of 223,222 33.4%
Glasgow City 304,254 26.5%
Scotland 3,060,750 41.2%
Source: Scottish Neighbourhood Statistics
Chart 52: Refuse Collection – Council spend on refuse collection net (£ per premise) 2014-15
Source: Improvement Service – Local Government Benchmarking Framework
Environment
Local Authority
Scotland
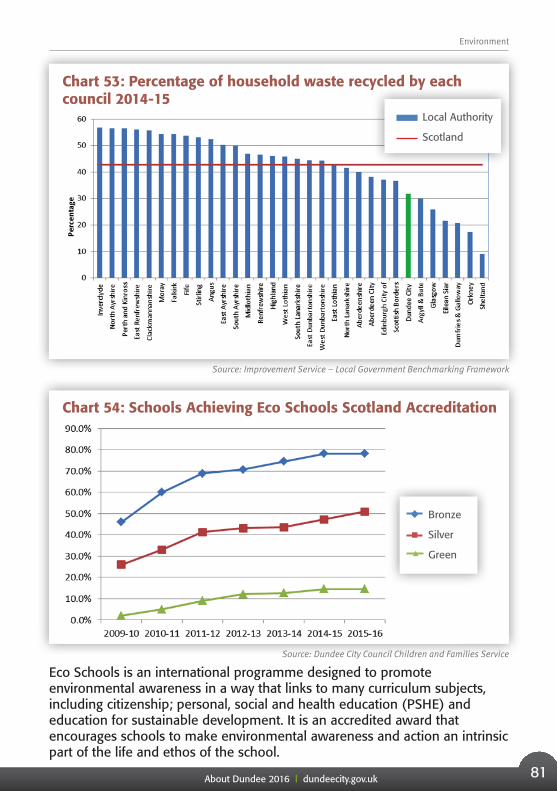
About Dundee 2016 l dundeecity.gov.uk 81
Environment
Chart 53: Percentage of household waste recycled by each council 2014-15
Source: Improvement Service – Local Government Benchmarking Framework
Chart 54: Schools Achieving Eco Schools Scotland Accreditation
Source: Dundee City Council Children and Families Service
Eco Schools is an international programme designed to promote environmental awareness in a way that links to many curriculum subjects, including citizenship; personal, social and health education (PSHE) and education for sustainable development. It is an accredited award that encourages schools to make environmental awareness and action an intrinsic part of the life and ethos of the school.
Bronze
Silver
Green
Local Authority
Scotland
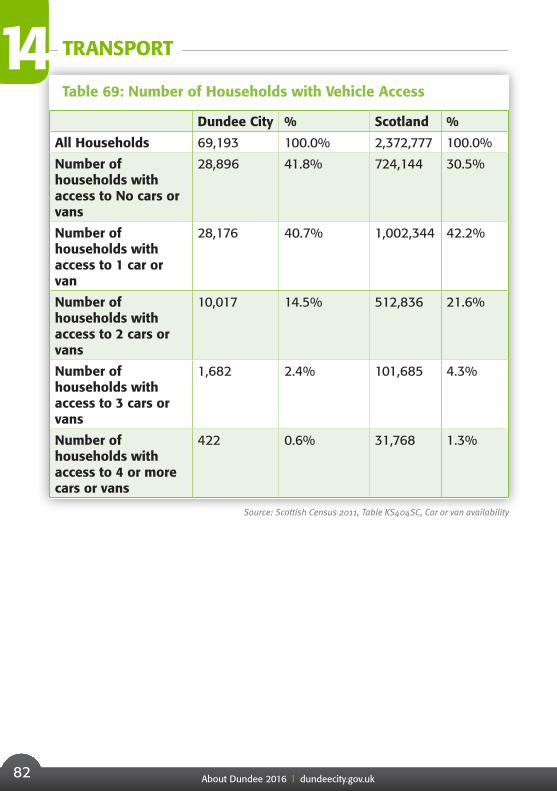
About Dundee 2016 l dundeecity.gov.ukAbout Dundee 2016 l dundeecity.gov.uk 82
Table 69: Number of Households with Vehicle Access
Dundee City % Scotland %
All Households 69,193 100.0% 2,372,777 100.0%
Number of households with access to No cars or vans
28,896 41.8% 724,144 30.5%
Number of households with access to 1 car or van
28,176 40.7% 1,002,344 42.2%
Number of households with access to 2 cars or vans
10,017 14.5% 512,836 21.6%
Number of households with access to 3 cars or vans
1,682 2.4% 101,685 4.3%
Number of households with access to 4 or more cars or vans
422 0.6% 31,768 1.3%
Source: Scottish Census 2011, Table KS404SC, Car or van availability
14 TRANSPORT

About Dundee 2016 l dundeecity.gov.uk 83
Transport
Table 70: Mode of Transport to Work
Dundee City % Scotland %
Total persons aged 16-74 in employment
57,971 100.0% 2,400,925 100.0%
Works mainly at or from home
5,070 8.7% 259,561 10.8%
Underground, metro, light rail or tram
17 0.0% 6,547 0.3%
Train 523 0.9% 89,293 3.7%
Bus, minibus or coach
8,361 14.4% 240,804 10.0%
Taxi or minicab 314 0.5% 14,008 0.6%
Driving a car or van 30,208 52.1% 1,344,272 56.0%
Passenger in a car or van
4,451 7.7% 139,114 5.8%
Motorcycle, scooter or moped
127 0.2% 6,882 0.3%
Bicycle 733 1.3% 33,821 1.4%
On foot 7,709 13.3% 238,263 9.9%
Other 458 0.8% 28,360 1.2%
Source: Scottish Census 2011, Table QS701SC, Usual method of travel to work
*Please note this table is based on all residents aged 16-74 in employment in the week before the Census was undertaken

About Dundee 2016 l dundeecity.gov.ukAbout Dundee 2016 l dundeecity.gov.uk 84
Table 71: Mode of Transport to Study
Dundee City % Scotland %
Total persons aged 4 and over who are studying but were not in employment in the week before the Census
34,490 100.0% 996,282 100.0%
Studies mainly at home
4,683 13.6% 123,929 12.4%
Underground, metro, light rail or tram
1 0.0% 3,283 0.3%
Train 116 0.3% 28,948 2.9%
Bus, minibus or coach
4,941 14.3% 214,177 21.5%
Taxi or minicab 263 0.8% 9,670 1.0%
Driving a car or van 1,748 5.1% 45,942 4.6%
Passenger in a car or van
5,065 14.7% 166,835 16.7%
Motorcycle, scooter or moped
39 0.1% 662 0.1%
Bicycle 304 0.9% 10,372 1.0%
On foot 17,262 50.0% 389,592 39.1%
Other 68 0.2% 2,872 0.3%
Source: Scottish Census 2011, Table QS702SC minus Table QS701SC, Usual method of travel to study
* Please note this table is based on all people aged 4 and over who are studying but were not in employment in the week before the Census.
Transport

About Dundee 2016 l dundeecity.gov.uk 85
Transport
Table 72: Total Number of Vehicles on Scottish Roads, Dundee City
Dundee City Scotland
2006 56,313 2,564,000
2007 57,189 2,627,000
2008 58,059 2,665,000
2009 57,985 2,684,000
2010 57,756 2,685,000
2011 57,863 2,689,451
2012 58,207 2,715,793
2013 58,929 2,758,021
Source: Scottish Neighbourhood Statistics
Table 73: Number of Individuals who reside within a 30 minute and 60 minute drive time of Dundee City Centre broken down by Gender
Male % Female % Total
30 Minute 156,996 48.2 168,770 51.8 325,766
60 Minute 416,684 48.4 444,167 51.6 860,851
Source: Scottish Census 2011
Dundee is a regional employment, education and retail centre. 325,766 persons reside within a 30 minute drive time of Dundee City Centre and 860,851 reside within a 1 hour drive time.

About Dundee 2016 l dundeecity.gov.ukAbout Dundee 2016 l dundeecity.gov.uk 86
Table 74: Number of Individuals who reside within a 30 minute and 60 minute drive time of Dundee City Centre broken down by Age
30 Minute Drive 60 Minute Drive
Aged 0-15 52,607 149,902
Aged 16-24 47,706 103,073
Aged 25-44 79,452 212,813
Aged 45-59 65,364 181,390
Aged 60-64 21,206 58,533
Aged 65 plus 59,431 155,140
Total 325,766 860,851
Source: Scottish Census 2011
213,728 working age persons (aged 16-64) reside within 30 minutes of Dundee City Centre and 555,809 reside within a 1 hour drive time.
Transport

About Dundee 2016 l dundeecity.gov.uk 87

About Dundee 2016 l dundeecity.gov.ukAbout Dundee 2016 l dundeecity.gov.uk 88

About Dundee 2016 l dundeecity.gov.uk 89

About Dundee 2016 l dundeecity.gov.ukAbout Dundee 2016 l dundeecity.gov.uk 90
Dundee City CouncilInformation and Research Team
8 City SquareDundee DD1 3BGt: 01382 433614
Design by C
omm
unities, DCC
KL/11/16