abhijit guha, abhijit biswas, dhruv grewal, swati … · 2019-01-08 · advertisement (hereafter,...
TRANSCRIPT
ABHIJIT GUHA, ABHIJIT BISWAS, DHRUV GREWAL, SWATI VERMA, SOMAKBANERJEE, and JENS NORDFALT*
Sales induced through price promotions depend heavily on discountdepth, so firms createmechanisms to influence perceptions of discount depth.Typically, consumers compute discount depth as the difference between thesale price and the original price, with this difference compared against theoriginal price. But thus far, no research has examined the effect of reframingthis difference by comparing the discount depth against the sale price. Multiplestudies, including a field study across four grocery stores, show that framingthediscount depth by comparing it against the sale price increases consumers’discount depth perceptions and thus increases purchase intentions. Asevidence of the underlying process, the authors identify boundary conditionsrelated to both individual differences (numeracy) and managerially relevantfactors (discount depth size). In addition to contributing to research on pricepromotions, behavioral pricing, and numeric processing, the article offersimplications for both practitioners and policy makers focused on consumerwelfare.
Keywords: pricing, discount depth, price promotions, price discounts, retailing
Online Supplement: http://dx.doi.org/10.1509/jmr.16.0599
Reframing the Discount as a ComparisonAgainst the Sale Price: Does It Make theDiscount More Attractive?
Price promotions drive sales. They improve consumers’ utilityby reducing the economic sacrifice associated with purchases(Aydinli, Bertini, and Lambrecht 2014), and so perceptions ofgreater discount depth are associated with more sales (Urbany,
Bearden, and Weilbaker 1988). Firms adopt various tactics intheir attempts to increase consumers’ perceptions of discountdepth, such as inflating reference prices (Tuttle 2016) orstacking discounts (The Economist 2012; also see Chen andRao 2007). Typically, consumers perceive the discount depthas the difference between the original price and the (reduced)sale price, compared against the original price. If the originalprice is $10 and the sale price is $8, the price promotionadvertisement (hereafter, promotional ad) highlighting thisdiscount likely reads “20% off” or emphasizes that the saleprice is “20% lower” (discount = $10 – $8 = $2; discountdepth = $2/$10 = 20%).
However, discount depth might also be presented as acomparison against the sale price. In the example in theprevious paragraph, reframing the discount depth by com-paring it against the sale price would involve the use of anumerically higher number. That is, because this version ofdiscount depth divides the discount by the (lower) sale price,the reframed promotional ad then would indicate that theoriginal price was 25% higher ($2/$8 = 25%) than the saleprice. Even though the absolute dollar value of savings is
*Abhijit Guha is Assistant Professor of Marketing, Darla Moore School ofBusiness, University of South Carolina (email: [email protected]).Abhijit Biswas is Kmart Endowed Chair and Professor of Marketing, WayneState University (email: [email protected]). Dhruv Grewal (correspond-ing author) is Toyota Chair in E-Commerce and Electronic Business andProfessor ofMarketing, BabsonCollege (email: [email protected]). SwatiVerma is Assistant Professor of Marketing, Lawrence Technological Uni-versity (email: [email protected]). Somak Banerjee is a doctoral candidate,Department of Marketing and Supply Chain Management, Wayne StateUniversity (email: [email protected]). Jens Nordfalt is Assistant Professorof Marketing and Strategy, Stockholm School of Economics (email: [email protected]). Guha, Biswas, Verma, Banerjee, andNordfalt collected thedata, and Guha, Verma, and Biswas analyzed the data. All authors contributedtoward the writing of the manuscript. The authors thank the JMR review teamfor their guidance, which greatly improved the article. They also express theirappreciation to the Hakon Swenson Research Foundation for its support.Stephen Nowlis served as associate editor for this article.
© 2018, American Marketing Association Journal of Marketing ResearchISSN: 0022-2437 (print) Vol. LV (June 2018), 339–351
1547-7193 (electronic) DOI: 10.1509/jmr.16.0599339
unchanged ($2), we propose that because of the use of a highernumber (in this case, 25%vs. 20%), reframing of the promotionalad may increase consumers’ discount depth perceptions.
Prior work on numeric cognition suggests that individualsmay be influenced more by the absolute value of the numbersthey view than by the economic value implied by thosenumbers. For example, when promised a monetary reward fordrawing a red bean from an opaque jar, individuals prefer todraw from a jar that contains 100 beans, of which 9 are red(success odds = 9/100), than from a jar that contains 10 beans,of which 1 is red (success odds = 1/10, objectively greater than9/100) (Denes-Raj and Epstein 1994). Participants in thesestudies appear drawnmore to the numerically higher number inthe numerator (9 vs. 1) and less drawn to actual, objectivelybetter success odds. Similarly, behavioral pricing researchindicates that for an item initially priced at Mex$480, con-sumers prefer a Mex$120 discount over an economicallyequivalent 25% discount (Gonzalez et al. 2016), likely becausethe number 120 is greater than the number 25. Similar findingsemerge when examining between-product comparisons (inattribute domains like warranty length, processing speed,memory, screen size, and price comparisons; Kruger andVargas 2008) and inwork that compares price promotionswithbonus packs (Chen et al. 2012; Mohan, Chandon, and Riis2015). These findings originate in different literatures, yet theeffects described are consistent and convergent.
Nevertheless, we anticipate more nuance in the effects thatwe study due to both individual differences in consumers’numeracy (i.e., ability to process basic probability and nu-merical concepts; Peters et al. 2006) and variations in discountdepth. First, we distinguish betweenmore versus less numerateconsumers. Even though most people spend substantial timelearning the mechanics of math in school, they may not fullyunderstand how to apply those mechanics, even as adults(Dehaene 1997). Work in numeric cognition suggests that thelikelihood of such application increases with numeracy, suchthat when they must make judgments, more numerate in-dividuals are less influenced by alternative frames of the samenumber. Thus, the effects we predict may be mitigated amongmore numerate consumers. Second, at low discount depths (e.g.,discount depths ~ 10%), regardless of whether the promotionalad is framed as “now 10% lower” or (equivalently) “was 11%higher,”both ad frames employ similar-value numbers, so they areunlikely to have a differential impact on purchase intentions. Thisline of reasoning suggests that low discount depth promotionsconstitute a boundary condition for the effects we propose.
In establishing these effects and their boundary conditions, wecontribute to research on price promotions, behavioral pricing, andnumeric processing. First, we detail a new type of price framing,applicable to promotional advertising, that may lead to a sales lift.Price promotions are a key driver of sales, so our research ad-vances an important, substantivedomain. Second,wecontribute toresearch into how consumers process price promotions, by pro-viding insights into how consumers form perceptions of discountdepth. Third, this article advances understanding of numericprocessing, by revealing a systematic bias in processing per-centage information, as well as by outlining some limitations tothis bias. Furthermore, this study has direct applications to pricingpractice. Using the promotional ad framing “was X% higher” (vs.“now Y% lower”) may lead to a sales lift, but policy makersfocused on consumer welfare may call for caution with regard tothe implementation of such promotional frames.
CONCEPTUAL DEVELOPMENT
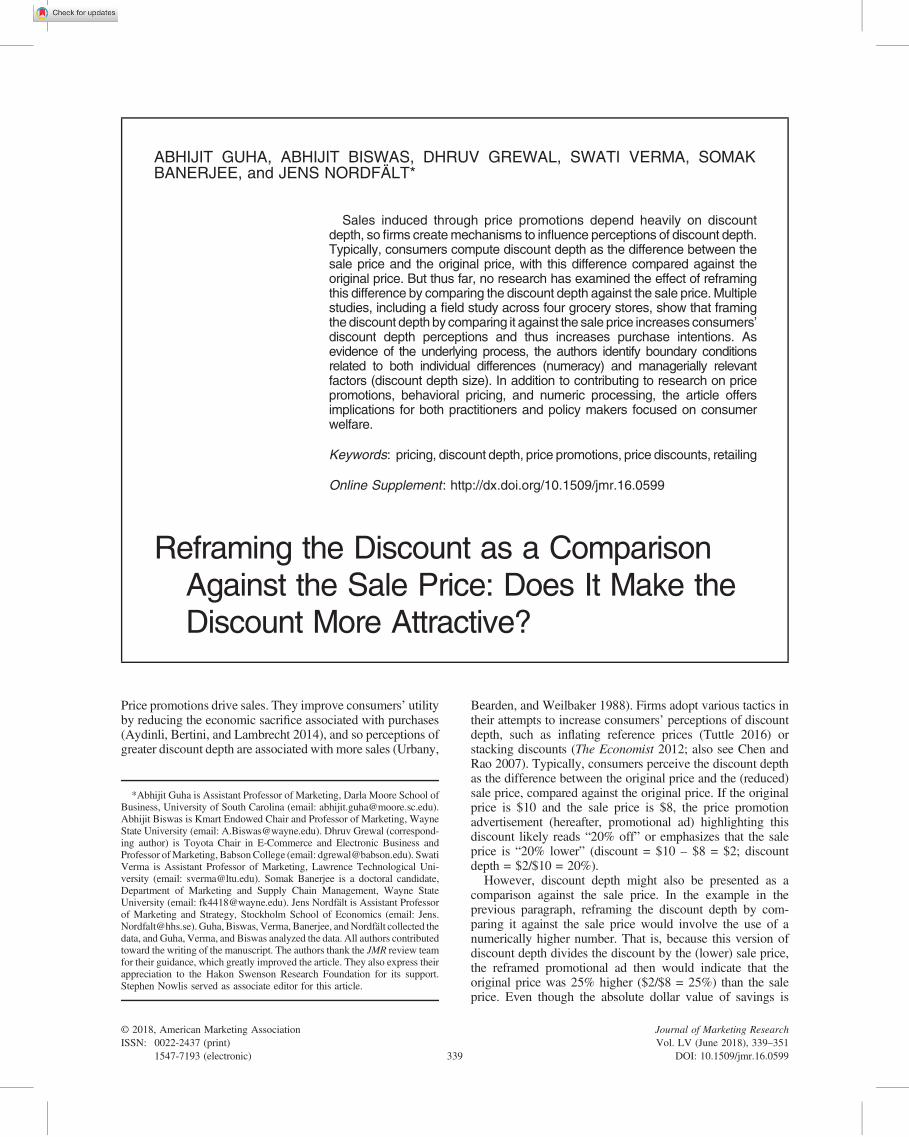
Consumers usually purchase products that yield the highestutility per dollar spent. Given this, price promotions improveconsumers’ utility by reducing the economic sacrifice theymake for a purchase (Aydinli, Bertini, and Lambrecht 2014).The depth of the discount associated with the price promotionis thus a key driver of sales (Urbany, Bearden, and Weilbaker1988), so substantial research focuses on how best to present aprice promotion to maximize people’s perceptions of thediscount depth (Grewal, Marmorstein, and Sharma 1996). Forexample, the presence of a semantic cue, and that cue’splausibility, concreteness, novelty, and location all may in-crease discount depth perceptions. Explicitly cuing a high butplausible comparison price (i.e., original price) increasesperceived discount depth (Urbany, Bearden, and Weilbaker1988), as do using a concrete cue (e.g., “Regular price $499,Sale price $299”) rather than an abstract cue (e.g., “A $499value, Sale price $299”; Krishnan, Biswas, and Netemeyer2006) and offering a novel cue (Kim and Kramer 2006). Inaddition, putting the original price to the left (vs. right) of thesale price can increase consumers’ propensity to calculatediscount depth, and thereby increase perceptions of discountdepth (Biswas et al. 2013). Finally, using multiple, stackedprice discounts (vs. a single financially equivalent discount)may increase perceived discount depth (Chen and Rao 2007),and the order of the stacked discounts may increase or mitigatesuch effects (Bagchi andDavis 2015). An overview of relevantprice promotion research is presented in Table 1.
In price promotions, the consensus thus far is that discountdepth evaluation involves the difference between the originalprice and the sale price, and then the comparison of thisdifference against the original price. With this definition ofdiscount depth, prior research (Table 1) has focused on how toincrease perceptions of discount depth, but without ever ex-amining the implications of reframing discount depth bycomparing the discount difference against the sale price. Withthis reframing, a promotional ad would note that the originalprice “was X% higher” than the sale price, whereas a moreconventional but financially equivalent framing might indicatethat the sale price is “now Y% lower” than the original price.To predict how consumers may interpret a “was X% higher”promotional framing, we turn to research related to numericcognition and to behavioral pricing.
How Consumers May Interpret the ReframedPromotional Ad
Cognitive experiential self-theory (CEST) (Pacini andEpstein 1999) provides guidance on how consumers mayinterpret these reframed promotional ads. According to CEST,individuals process stimuli via either a cognitive system(which is analytical and effortful) or an experiential system(which is more “associationalistic” and intuitive). The expe-riential system can more easily process and attend to concretebits of information, like absolute numbers, than abstract in-formation, such as ratios, percentages, and other relationsbetween numbers. Furthermore, when people process absolutenumbers, the experiential system gives processing primacy tofactors like numerosity (Reyna andBrainerd 2008),which thenprevails over other considerations linked to these absolutenumbers, like ratios and percentages. In essence, to the extentthat individuals use the experiential system, they are (1) more
340 JOURNAL OF MARKETING RESEARCH, JUNE 2018
likely to be swayed by a stimulus that indicates a “morenumerous,” or higher, number and (2) less likely to be swayedby a stimulus involving a lower but (after adjusting for ratio orpercentage transformations) more beneficial number.
CEST helps provide the conceptual underpinnings for whyconsumers are influenced (or biased) by absolute numbers, as hasbeen demonstrated in a variety of domains, such as price dis-counts, evaluation of foreign currencies, evaluation of fractions,and work on ratio biases. In the domain of price discounts,behavioral pricing research has demonstrated that for an itempriced at Mex$480, a discount of Mex$120 was perceived asmore valuable than a discount of 25%, but for an item priced atMex$48, discounts of 25% andMex$12were perceived similarly(Gonzalez et al. 2016). These results suggest that consumers usean absolute number heuristic, preferring price promotionsinvolving a higher-value (vs. lower-value) number, irrespective ofthe economic value implied by these numbers.
We now pivot to the research domain involving how consumersevaluate foreign currencies. When evaluating prices labeled in for-eign currency, individuals exhibit face value bias and focus onnominal values (Raghubir and Srivastava 2002; Wertenbroch,Soman, andChattopadhyay2007).More specifically,Wertenbroch,Soman, and Chattopadhyay (2007) find that consumers were morelikely to buy more expensive items when priced in a less numerouscurrency (e.g., dollars, euros)versusamorenumerouscurrency (e.g.,pesetas, lira). In effect, consumers perceive the price to be signifi-cantly larger when described using a more numerous currency thatresults in numeric responses involving higher absolute values.
When examining information involving fractions, in-dividuals generally paymore attention to the information in the
numerator and underweight the denominator. Expanding onthis point, Burson, Larrick, and Lynch (2009) indicate that thatthere is a bias toward using foreground information (numer-ator) because it is more salient than background information(denominator). This idea is termed “denominator neglect.”Consistent with the theme of denominator neglect, consumersmay not adjust for the fact that the “was X% higher” framinginvolves a higher-value number only because it is linked to thesale price, a lower-value starting point.
These results extend into the realm of consequential choices.For example, research in numeric cognition and ratio biasshows that when incented to draw a winning item, individualspreferred to draw from a bag with 9 winning items out of 100items than to draw from a bag with 1 winning item out of 10items (Denes-Raj and Epstein 1994). The post facto rationalesoffered included statements such as, “I picked the bag with themore red jelly beans because it looked like there were moreways to get a winner, even though I knew the ‘percents’ wereagainst me” (p. 823). In effect, individuals appear to beinfluenced more by the numbers with higher absolute valueand less by the ratios/percentages implied by these numbers.
Work in diverse literatures, such as behavioral pricing andnumeric cognition, shows that when evaluating numeric in-formation presented as ratios or percentages, consumers exhibitan absolute number heuristic. Building from this point, we positthat consumers may perceive that a “was X% higher” pro-motional framing (vs. financially equivalent “now Y% lower”framing) implies higher levels of discount depth because thenumber represented by X is greater in absolute value than thenumber represented by Y. Furthermore, upon perceiving greater
Table 1OVERVIEW OF RELEVANT PRICE PROMOTION LITERATURE
Source Key Finding Independent Variable Dependent Variable
Urbany, Bearden, and Weilbaker (1988);see also Grewal, Marmorstein,and Sharma (1996)
Perceptions of greater discount depth areassociated with increased sales.
Perceived offer value,discount depth
Patronage likelihood,perceptions of value
Krishnan, Biswas, and Netemeyer (2006) Using a concrete cue (“Regular price $499,Sale price $299”) rather than an abstract cue(“A $499 value, Sale price $299”) increasesperceived discount depth.
Regular vs. abstract cue Perceived discount depth
Kim and Kramer (2006) Using a novel cue (“Pay 80%” vs. “20% off”)increases perceived discount depth.
Novel vs. other cue Perceived discount depth
Biswas et al. (2013) Putting sale price to right of (vs. left of)original price increases perceived discountdepth.
Sale price right vs. left Perceived discount depth(mediator)
Chen and Rao (2007) Stacked discounts (“25% off, then 20% off”)rather than single discounts (“40% off”)increase perceived discount depth.
Stacked (vs. single) discounts Perceived discount depth
Gonzalez et al. (2016) For an item priced at 480 pesos, a 120-pesodiscount is preferred to a 25% discount.
Price promotion presented inmoney amount vs. percentage
Purchase intentions
Chen et al. (2012) Price discounts increase sales more whenpresented as a bonus pack equivalent (100%more) than as a price discount (50% off).
Price promotion presented asbonus pack vs. discount
Attitude toward the offer
This study Framing the price promotion (“was X%higher” vs. “now Y% lower) increasesperceptions of discount depth, which in turnincreases consumers’ purchase intentions.
Promotional ad “was X%higher” vs. “now Y% lower”
Perceived discount depth,purchase intentions
Reframing the Discount as a Comparison Against the Sale Price 341
discount depth, these consumers might perceive increased pur-chase intentions. Therefore, we propose:
H1: Versus the “now Y% lower” discount frames, financiallyequivalent “was X% higher” discount frames increase both(a) purchase intentions and (b) perceptions of discount depth,with (c) the latter effect mediating the former.
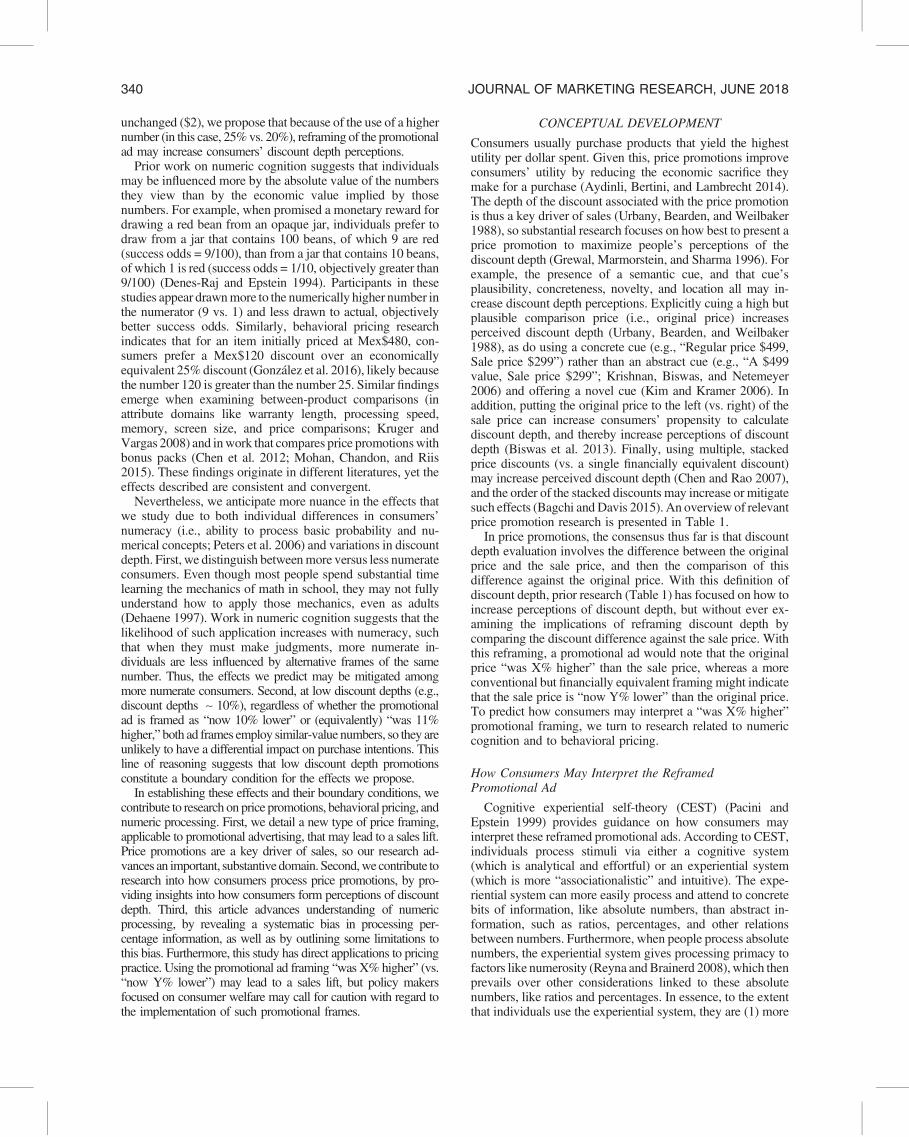
Figure 1 presents these points pictorially.
Moderating Influence of Numeracy
Numeracy is the “ability to understand and use numbers”(Dieckman, Slovic, and Peters 2009, p. 1474) “to process basicprobability and numerical concepts” (Peters et al. 2006,p. 407). Individuals differ substantially in their numericalability (Paulos 1988), and data from a National LiteracySurvey suggest that about half of the U.S. population finds itdifficult to understand and use numbers embedded in printmaterial (Kirsch et al. 2002). Although we note that prior re-search has found that need for cognition is a key antecedent tonumeracy (DeBruin et al. 2015), numeracy is distinct from needfor cognition. To be highly numerate, individuals not only musthave a high need for cognition but also must possess thecognitive competence to manipulate numbers (Reyna andBrainerd 2008). In this article, we focus on numeracy instead ofneed for cognition because numeracy reflects an information-processing skill specific to numerical information, rather just themotivation to process information in general. As such, weexpect numeracy to be more relevant to understanding howconsumers process discount percentages.
When evaluating numerical information, many adultscannot apply the mechanics of math suitably (Dehaene 1997),but the likelihood of suitable application increases as numeracy
increases. To investigate this, Peters et al. (2006) rerun theexperimental design used by Denes-Raj and Epstein (1994),wherein individuals are incented to draw a winning item andchoose between drawing from a bag with 9 winning items outof 100 items versus a bag with 1 winning item out of 10 items.Peters et al. (2006) find that more numerate individuals wereless likely to make a suboptimal decision, that is, were lesslikely to draw from the bag with 9 winning items.
It appears that when more numerate individuals make judg-ments, they (vs. less numerate individuals) are less impacted byalternative frames surrounding objectively similar numbers. Forexample, when encountering numeric information, more nu-merate individuals are more likely to retrieve and apply theappropriate numerical principle and then use this principle totransform numbers suitably. Accordingly, we propose (as shownpictorially in Figure 1):
H2: Numeracy levels moderate the relationship between promotionalad frames and purchase intentions, such that more numeratepeople exhibit smaller differences in purchase intentions whenthe promotional ad is framed as “was X% higher” versus thefinancially equivalent “now Y% lower.”
Moderating Influence of Discount Depth Size
Building on work on price promotion thresholds (Grewal,Marmorstein, and Sharma 1996; Gupta and Cooper 1992),recent behavioral pricing research (Biswas et al. 2013) in-dicates that, relative to a case without promotions, promotionalads signaling discount depth at about 30% or greater increasepurchase intentions because this discount depth is large enoughfor consumers to perceive differences vis-a-vis the originalprice. However, promotional ads signaling low discounts (about10% discount depth) may not increase purchase intentions
Figure 1OVERALL PROCESS MODEL AND ASSOCIATED STUDIES
Independent Variable
0 = “Now Y% Lower”1 = “Was X% Higher”
Dependent Variable
Sales (Study 1)Purchase intentions (Studies 2–4)
MediatorPerceived Discount Depth/
Value of Discount
H1c Study 2
H1a
Studies 1–2
H1b
Study 2
Moderator (Measured)Numeracy
+ +
+
Moderator (Manipulated)0 = 37% discount depth1 = 10% discount depth
––
H3
Study 4
H2
Study 3
342 JOURNAL OF MARKETING RESEARCH, JUNE 2018

because the discounts are not large enough for consumers toperceive significant differences. Accordingly, we consider twodiscount depth levels. At the discount depth levels of 30% orbetter, for example, the promotional ad would display either“now 37% lower” or the objectively equivalent “was 59%higher.” The numerical difference between these numbers isrelatively large, so use of different promotional frames shouldinduce significantly different purchase intentions. However, atlow discount depths, for example, the promotional ad mightindicate either “now 10% lower” or “was 11% higher.” Thenumerical difference between “10%” and “11%” is relativelysmall, so use of different promotional ad frames should lead toless difference in purchase intentions. In effect, we anticipate thatdiscount depth levels moderate our predicted effects. Formally,we propose (shown pictorially in Figure 1):
H3: Discount depth levels moderate the relationship betweenpromotional framing and purchase intentions, such thatwhen the discount depth is low (vs. high), consumersexhibit smaller differences in purchase intentions when thepromotion is framed as “wasX%higher” versus the financiallyequivalent “now Y% lower.”
OVERVIEW OF STUDIES
We present four studies (Figure 1). In Study 1, we investigateH1a in a field setting, across four grocery stores in Sweden. InStudy 2, usingmediation analyses, we examine H1a–c in the laband test some alternative explanations for our effects. Mod-eration analyses then help reveal boundary conditions for theseeffects, and we use moderators that are both conceptuallygrounded in theory (numeracy) and managerially relevant (dis-count depth levels). Specifically, in Study 3, we test H2 by ex-amining whether the proposed effects might be mitigated amongmore numerate consumers. Then, in Study 4, we test H3 byexamining whether the proposed effects diminish when pro-motions involve low discount depths. Appendix A showsstimuli exemplars, Appendix B shows scale details, andAppendix C shows data across all studies. For all stimuli, seethe Web Appendix.
STUDY 1: INITIAL FIELD EXAMINATION
Method
As an initial examination, we conducted a field study in fourstores of a leading grocery chain in Sweden, using fourhousehold products (shampoo, napkins, coffee, and freshcream). In week 1, all products were sold at their originalprices; we noted some slight price differences across stores(e.g., for shampoo, prices ranged between SEK 24.90 and SEK26.90). For each product, the stores provided informationabout daily unit sales. Then, in week 2, the four products wenton sale. One of the authors worked with the four storemanagers to ensure that the sale prices were the same acrossstores for each product (e.g., shampoo was SEK 18 in eachstore, for a discount depth of about 30%). With this consistentsale price, wemanipulated two types of promotional frames. Inall cases, the promotional ad signage showed both the originalprice and the sale price, but half of them were phrased (forexample) as “now 31% lower,” while the other half werephrased as “was 44% higher” (for Swedish-language signageexemplars, as used by the retailer, see Appendix A).
Designating the four products as A–D and the four stores as1–4, the experimental design during week 2 was as follows: In
stores 1 and 2, signage for productsA andB used the “nowY%lower” format, while the signage for products C andD used the“was X% higher” format. Conversely, in stores 3 and 4,signage for products C and D used the “now Y% lower”format, while the signage for products A and B used the “wasX% higher” format. By gathering information about daily unitsales for each of the four products across the four stores, acrossseven day’s unit sales in week 2, we had 112 data points.
Results
We analyze daily unit sales. The key independent variable ispromotional ad framing (where 0 = “now Y% lower” and 1 =“was X% higher”). While presenting the findings, we presentan unadjusted mean comparison first and then a more formalregression analysis. In the first analysis, the dependent variableis daily (unit) sales in week 2, so we test whether the differentpromotional ad frames increase sales, while controlling forweek 1 sales. At the aggregate level, daily unit sales werehigher when the ad framing read “was X% higher” (Mwas =42.73 vs. Mnow = 20.77; t(110) = 2.56, p < .05). Moving to aformal regression analysis, we regressed daily unit salesagainst promotional ad framing, controlling for week 1 dailyunit sales as also using other control variables, namely, dis-count depth and store dummies. The beta coefficient forpromotional ad framing was positive and significant (b =10.95, SE = 3.78; t = 2.89, p < .05), consistent with theaggregate-level results and with H1. These regression resultsheld even after we included further control variables, such as(1) square term, relating to week 1 daily unit sales, and (2)dummy variables for the products and dummy variables for theday of the week.
We also analyzed sales lift, that is, the difference in daily(unit) sales (week 2 Monday unit sales − week 1 Monday unitsales). At the aggregate level, the difference in sales lift washigher when the promotional ad framing read “was X%higher” (Mwas = 30.68 vs. Mnow = 14.05; t(110) = 2.75, p <.05). This result persisted in a subsequent regression analysis(not reported here, for brevity), which mirrored the regressionanalysis presented earlier.
These results are consistent with H1a; using the “was X%higher” frame increased daily unit sales. This field studyprovides an initial test of theory in a domain in which con-sumers made actual choices and purchases.
STUDY 2: UNDERLYING MEDIATION PROCESS
We present two lab studies that test the mediation sequenceoutlined in H1a–c in different product domains. Further, weaddress some alternative explanations, such as whether ourresults (1) might reflect novelty effects or (2) might relatemerely to the “was X% higher” framing, independent of theactual numerical information used.
Study 2a: Examining H1a–c
Method. Participants (N = 82 undergraduates, 48.8%women)were randomly assigned to a two-cell design wherein theyconsidered purchasing an upscale living room chair. The chairhad been originally priced at $1,199.00 but was offered at the(reduced) sale price of $755.37. The promotional ad framed thediscount depth as either “was 59% higher” or (equivalently)“now 37% lower” (for stimuli exemplars, see Appendix A).Participants responded to two measures (three-item, seven-point scales), related to their purchase intentions (PI; from
Reframing the Discount as a Comparison Against the Sale Price 343
Dodds, Monroe, and Grewal 1991) and perceptions of thediscount depth (DD; adapted from Grewal, Marmorstein, andSharma 1996). As we noted, the “was 59% higher” pro-motional frame is a cue that consumers are unlikely to haveencountered before, so we also asked the participants whetherthey perceived the framing as novel, using a single-item scale(Cox and Cox 1988). Finally, we elicited participants’ per-ceptions of perceived complexity (two-item, seven-pointscale; Cox and Cox 2002). All scale details are shown inAppendix B. In a manipulation check, we asked whether theadvertisement had featured the “was 59% higher” or the “now37% lower” frame. Finally, we elicited demographics.
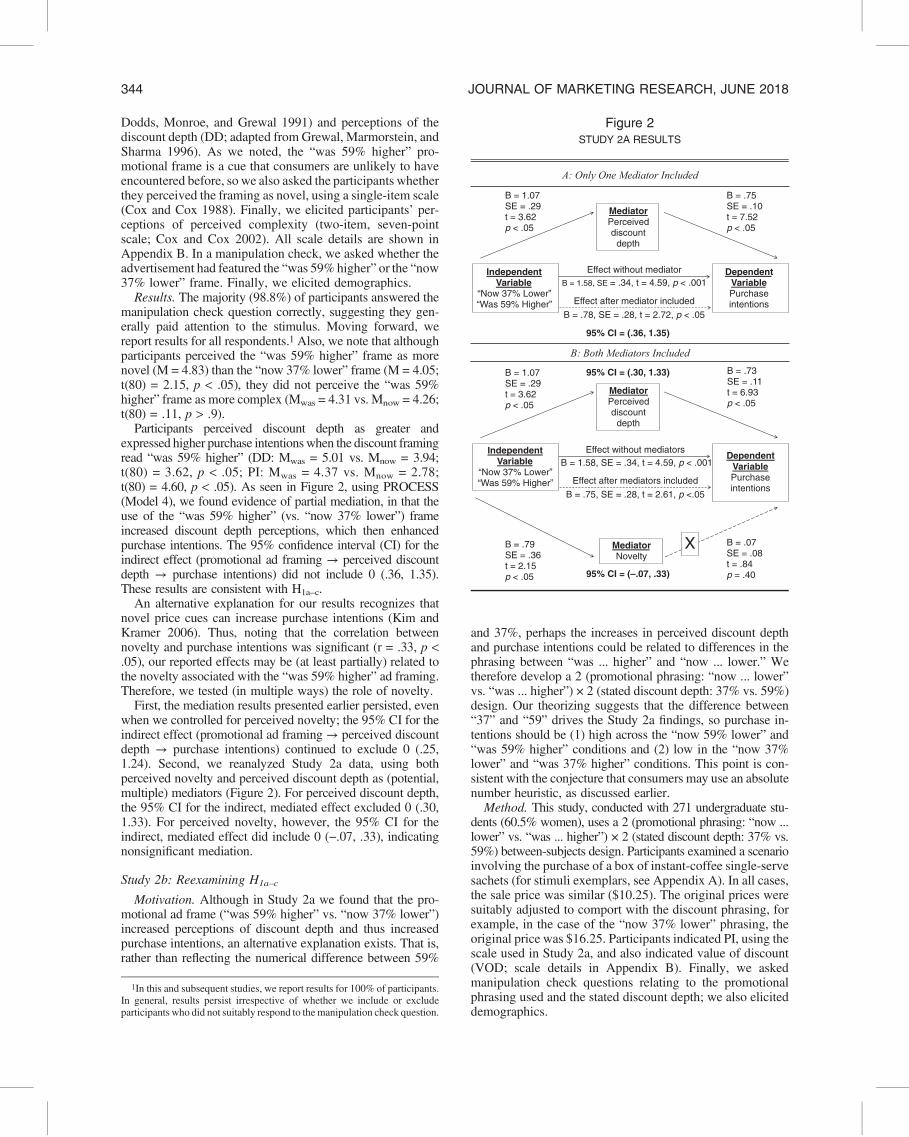
Results. The majority (98.8%) of participants answered themanipulation check question correctly, suggesting they gen-erally paid attention to the stimulus. Moving forward, wereport results for all respondents.1 Also, we note that althoughparticipants perceived the “was 59% higher” frame as morenovel (M = 4.83) than the “now 37% lower” frame (M = 4.05;t(80) = 2.15, p < .05), they did not perceive the “was 59%higher” frame as more complex (Mwas = 4.31 vs. Mnow = 4.26;t(80) = .11, p > .9).
Participants perceived discount depth as greater andexpressed higher purchase intentionswhen the discount framingread “was 59% higher” (DD: Mwas = 5.01 vs. Mnow = 3.94;t(80) = 3.62, p < .05; PI: Mwas = 4.37 vs. Mnow = 2.78;t(80) = 4.60, p < .05). As seen in Figure 2, using PROCESS(Model 4), we found evidence of partial mediation, in that theuse of the “was 59% higher” (vs. “now 37% lower”) frameincreased discount depth perceptions, which then enhancedpurchase intentions. The 95% confidence interval (CI) for theindirect effect (promotional ad framing → perceived discountdepth → purchase intentions) did not include 0 (.36, 1.35).These results are consistent with H1a–c.
An alternative explanation for our results recognizes thatnovel price cues can increase purchase intentions (Kim andKramer 2006). Thus, noting that the correlation betweennovelty and purchase intentions was significant (r = .33, p <.05), our reported effects may be (at least partially) related tothe novelty associated with the “was 59% higher” ad framing.Therefore, we tested (in multiple ways) the role of novelty.
First, the mediation results presented earlier persisted, evenwhen we controlled for perceived novelty; the 95% CI for theindirect effect (promotional ad framing → perceived discountdepth → purchase intentions) continued to exclude 0 (.25,1.24). Second, we reanalyzed Study 2a data, using bothperceived novelty and perceived discount depth as (potential,multiple) mediators (Figure 2). For perceived discount depth,the 95% CI for the indirect, mediated effect excluded 0 (.30,1.33). For perceived novelty, however, the 95% CI for theindirect, mediated effect did include 0 (−.07, .33), indicatingnonsignificant mediation.
Study 2b: Reexamining H1a–c
Motivation. Although in Study 2a we found that the pro-motional ad frame (“was 59% higher” vs. “now 37% lower”)increased perceptions of discount depth and thus increasedpurchase intentions, an alternative explanation exists. That is,rather than reflecting the numerical difference between 59%
and 37%, perhaps the increases in perceived discount depthand purchase intentions could be related to differences in thephrasing between “was ... higher” and “now ... lower.” Wetherefore develop a 2 (promotional phrasing: “now ... lower”vs. “was ... higher”) × 2 (stated discount depth: 37% vs. 59%)design. Our theorizing suggests that the difference between“37” and “59” drives the Study 2a findings, so purchase in-tentions should be (1) high across the “now 59% lower” and“was 59% higher” conditions and (2) low in the “now 37%lower” and “was 37% higher” conditions. This point is con-sistent with the conjecture that consumers may use an absolutenumber heuristic, as discussed earlier.
Method. This study, conducted with 271 undergraduate stu-dents (60.5% women), uses a 2 (promotional phrasing: “now ...lower” vs. “was ... higher”) × 2 (stated discount depth: 37% vs.59%) between-subjects design. Participants examined a scenarioinvolving the purchase of a box of instant-coffee single-servesachets (for stimuli exemplars, see Appendix A). In all cases,the sale price was similar ($10.25). The original prices weresuitably adjusted to comport with the discount phrasing, forexample, in the case of the “now 37% lower” phrasing, theoriginal price was $16.25. Participants indicated PI, using thescale used in Study 2a, and also indicated value of discount(VOD; scale details in Appendix B). Finally, we askedmanipulation check questions relating to the promotionalphrasing used and the stated discount depth; we also eliciteddemographics.
Figure 2STUDY 2A RESULTS
IndependentVariable
“Now 37% Lower” “Was 59% Higher”
Dependent VariablePurchase intentions
MediatorPerceived discount
depth
Effect without mediator
Effect after mediator included
B = .75SE = .10t = 7.52p < .05
B = 1.58, SE = .34, t = 4.59, p < .001
B = .78, SE = .28, t = 2.72, p < .05
95% CI = (.36, 1.35)
SE = .29t = 3.62p < .05
B = 1.07
IndependentVariable
“Now 37% Lower”“Was 59% Higher”
DependentVariablePurchaseintentions
MediatorPerceived discount
depth
Effect without mediators
Effect after mediators included
B = 1.07SE = .29t = 3.62p < .05
B = .73SE = .11t = 6.93p < .05
B = 1.58, SE = .34, t = 4.59, p < .001
B = .75, SE = .28, t = 2.61, p <.05
95% CI = (.30, 1.33)
MediatorNovelty
95% CI = (–.07, .33)
XB = .79SE = .36t = 2.15p < .05
B = .07SE = .08t = .84p = .40
A: Only One Mediator Included
B: Both Mediators Included
1In this and subsequent studies, we report results for 100% of participants.In general, results persist irrespective of whether we include or excludeparticipants who did not suitably respond to themanipulation check question.
344 JOURNAL OF MARKETING RESEARCH, JUNE 2018
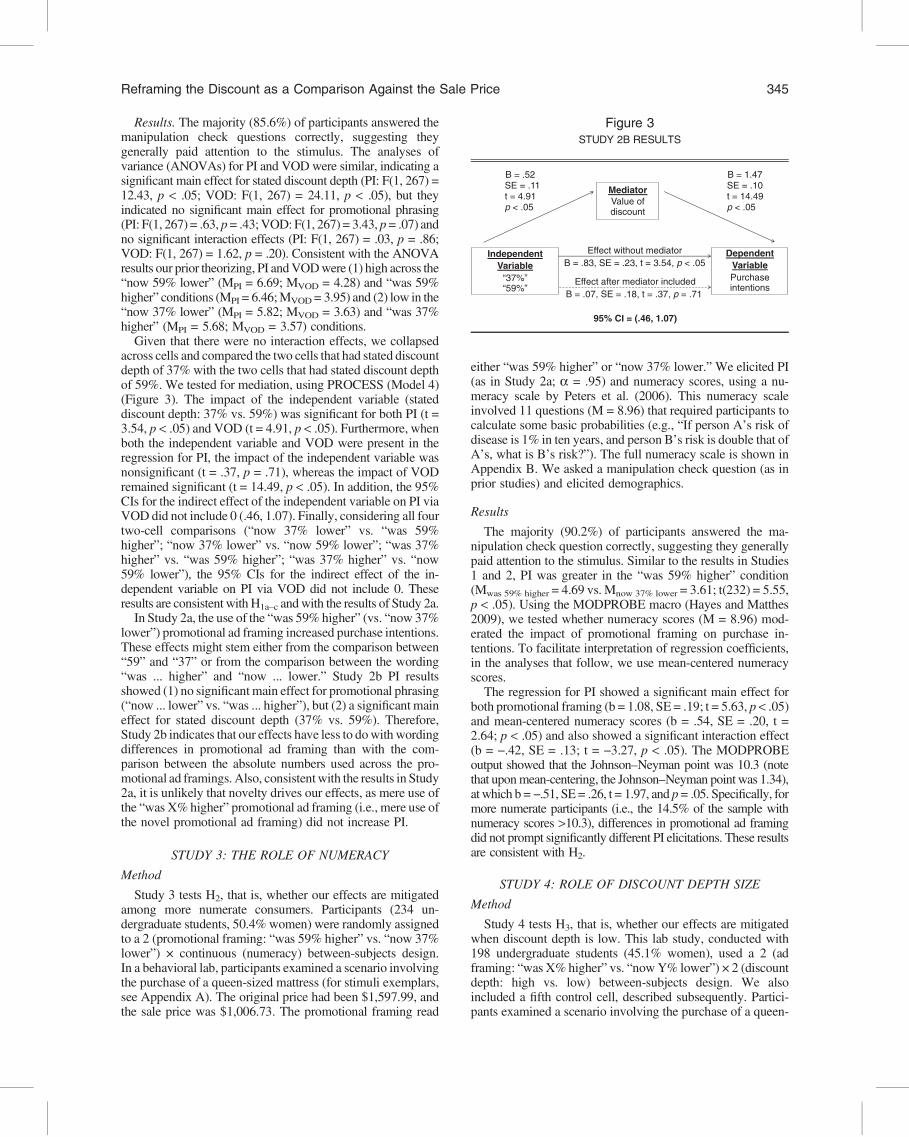
Results. The majority (85.6%) of participants answered themanipulation check questions correctly, suggesting theygenerally paid attention to the stimulus. The analyses ofvariance (ANOVAs) for PI and VODwere similar, indicating asignificant main effect for stated discount depth (PI: F(1, 267) =12.43, p < .05; VOD: F(1, 267) = 24.11, p < .05), but theyindicated no significant main effect for promotional phrasing(PI: F(1, 267) = .63, p= .43;VOD: F(1, 267) = 3.43, p= .07) andno significant interaction effects (PI: F(1, 267) = .03, p = .86;VOD: F(1, 267) = 1.62, p = .20). Consistent with the ANOVAresults our prior theorizing, PI andVODwere (1) high across the“now 59% lower” (MPI = 6.69; MVOD = 4.28) and “was 59%higher” conditions (MPI = 6.46;MVOD= 3.95) and (2) low in the“now 37% lower” (MPI = 5.82; MVOD = 3.63) and “was 37%higher” (MPI = 5.68; MVOD = 3.57) conditions.
Given that there were no interaction effects, we collapsedacross cells and compared the two cells that had stated discountdepth of 37% with the two cells that had stated discount depthof 59%. We tested for mediation, using PROCESS (Model 4)(Figure 3). The impact of the independent variable (stateddiscount depth: 37% vs. 59%) was significant for both PI (t =3.54, p < .05) and VOD (t = 4.91, p < .05). Furthermore, whenboth the independent variable and VOD were present in theregression for PI, the impact of the independent variable wasnonsignificant (t = .37, p = .71), whereas the impact of VODremained significant (t = 14.49, p < .05). In addition, the 95%CIs for the indirect effect of the independent variable on PI viaVOD did not include 0 (.46, 1.07). Finally, considering all fourtwo-cell comparisons (“now 37% lower” vs. “was 59%higher”; “now 37% lower” vs. “now 59% lower”; “was 37%higher” vs. “was 59% higher”; “was 37% higher” vs. “now59% lower”), the 95% CIs for the indirect effect of the in-dependent variable on PI via VOD did not include 0. Theseresults are consistent with H1a–c andwith the results of Study 2a.
In Study 2a, the use of the “was 59% higher” (vs. “now 37%lower”) promotional ad framing increased purchase intentions.These effects might stem either from the comparison between“59” and “37” or from the comparison between the wording“was ... higher” and “now ... lower.” Study 2b PI resultsshowed (1) no significant main effect for promotional phrasing(“now ... lower” vs. “was ... higher”), but (2) a significant maineffect for stated discount depth (37% vs. 59%). Therefore,Study 2b indicates that our effects have less to dowith wordingdifferences in promotional ad framing than with the com-parison between the absolute numbers used across the pro-motional ad framings. Also, consistentwith the results in Study2a, it is unlikely that novelty drives our effects, as mere use ofthe “was X%higher” promotional ad framing (i.e., mere use ofthe novel promotional ad framing) did not increase PI.
STUDY 3: THE ROLE OF NUMERACY
Method
Study 3 tests H2, that is, whether our effects are mitigatedamong more numerate consumers. Participants (234 un-dergraduate students, 50.4% women) were randomly assignedto a 2 (promotional framing: “was 59% higher” vs. “now 37%lower”) × continuous (numeracy) between-subjects design.In a behavioral lab, participants examined a scenario involvingthe purchase of a queen-sized mattress (for stimuli exemplars,see Appendix A). The original price had been $1,597.99, andthe sale price was $1,006.73. The promotional framing read
either “was 59% higher” or “now 37% lower.”We elicited PI(as in Study 2a; a = .95) and numeracy scores, using a nu-meracy scale by Peters et al. (2006). This numeracy scaleinvolved 11 questions (M = 8.96) that required participants tocalculate some basic probabilities (e.g., “If person A’s risk ofdisease is 1% in ten years, and person B’s risk is double that ofA’s, what is B’s risk?”). The full numeracy scale is shown inAppendix B. We asked a manipulation check question (as inprior studies) and elicited demographics.
Results
The majority (90.2%) of participants answered the ma-nipulation check question correctly, suggesting they generallypaid attention to the stimulus. Similar to the results in Studies1 and 2, PI was greater in the “was 59% higher” condition(Mwas 59% higher = 4.69 vs. Mnow 37% lower = 3.61; t(232) = 5.55,p < .05). Using the MODPROBE macro (Hayes and Matthes2009), we tested whether numeracy scores (M = 8.96) mod-erated the impact of promotional framing on purchase in-tentions. To facilitate interpretation of regression coefficients,in the analyses that follow, we use mean-centered numeracyscores.
The regression for PI showed a significant main effect forboth promotional framing (b = 1.08, SE = .19; t = 5.63, p < .05)and mean-centered numeracy scores (b = .54, SE = .20, t =2.64; p < .05) and also showed a significant interaction effect(b = −.42, SE = .13; t = −3.27, p < .05). The MODPROBEoutput showed that the Johnson–Neyman point was 10.3 (notethat uponmean-centering, the Johnson–Neyman point was 1.34),at which b = −.51, SE= .26, t = 1.97, and p= .05. Specifically, formore numerate participants (i.e., the 14.5% of the sample withnumeracy scores >10.3), differences in promotional ad framingdid not prompt significantly different PI elicitations. These resultsare consistent with H2.
STUDY 4: ROLE OF DISCOUNT DEPTH SIZE
Method
Study 4 tests H3, that is, whether our effects are mitigatedwhen discount depth is low. This lab study, conducted with198 undergraduate students (45.1% women), used a 2 (adframing: “was X%higher” vs. “nowY% lower”) × 2 (discountdepth: high vs. low) between-subjects design. We alsoincluded a fifth control cell, described subsequently. Partici-pants examined a scenario involving the purchase of a queen-
Figure 3STUDY 2B RESULTS
IndependentVariable
“37%”“59%”
DependentVariablePurchaseintentions
MediatorValue ofdiscount
Effect without mediator
Effect after mediator included
SE = .11t = 4.91p < .05
B = 1.47SE = .10t = 14.49p < .05
B = .83, SE = .23, t = 3.54, p < .05
95% CI = (.46, 1.07)
B = .07, SE = .18, t = .37, p = .71
B = .52
Reframing the Discount as a Comparison Against the Sale Price 345

sized mattress, originally priced at $1,597.99. In the highdiscount depth condition (consistent with Study 2a), the saleprice was $1,006.73, so the promotional ad read either “was59% higher” or, in a financially equivalent version, “now 37%lower” (for stimuli exemplars, see Appendix A). In the lowdiscount depth condition, the sale price was $1,438.19, so thepromotional ad read either “was 11% higher” or the finan-cially equivalent “now 10% lower.” In the control cell, weused the same sale price as in the high discount depthcondition ($1,006.73) but used a lower original price($1,379.22), so that the promotional ad read “was 37%higher.” We elicited purchase intentions, then asked ma-nipulation check and demographic questions (similar toStudy 2a).
Results
The majority (95.5%) of participants answered manipula-tion check questions correctly, suggesting they generally paidattention to the stimulus. Excluding (for now) the controlcondition, the ANOVA for purchase intentions revealed maineffects for both promotional ad framing and discount depth(F(1, 154) > 17.03, p < .05), as well as a significant in-teraction effect (F(1, 154) = 10.44, p < .05). Simplecontrasts (Figure 4) showed that in the high discount depthcondition, purchase intentions were significantly higherfor the “was 59% higher” frame (M = 4.84) versus the “now37% lower” frame (M = 3.54; F (1, 154) = 27.06, p < .05),in line with prior results. However, in the low discountdepth condition, purchase intentions were not significantlydifferent across the promotional ad frames (Mwas 11% higher
= 3.19; Mnow 10% lower = 3.03; F (1, 154) = .40, p = .53),consistent with H3.
In a separate, supplementary analysis, we conducted a one-way ANOVA for purchase intentions, across the controlcell (“was 37% higher”) and the two discount depth cells(“now 37% lower” and “was 59% higher”) wherein the saleprice was the same. The ANOVA for PI was significant(F(2, 116) = 29.12, p < .05). In key contrasts, PI wassignificantly higher for the condition with the discountframe “was 59% higher” (M = 4.84) than in either the “was37% higher” condition (M = 3.38; t(116) = 6.98, p < .05) orthe “now 37% lower” condition (as specified previously).We also found no significant difference in PI across the“was 37% higher” and “now 37% lower” conditions(t(116) = .79, p = .43). This supplementary analysis but-tresses the results of Study 2b, in that use of the “was ...higher” ad framing alone does not appear to drive oureffects. Rather, it appears that our effects stem from the useof the numerically higher number 59 (vs. 37).
DISCUSSION
Summary
We refer back to our process model (Figure 1). In Study 1, weran a field study that showed that when promotional adver-tising for price discounts was framed as “was X% higher” (vs.the financially equivalent framing of “now Y% lower”), salesincreased. In Study 2, across two lab studies using differentproduct types, we find that when promotional advertising wasframed as “was X% higher” (vs. the financially equivalentframing of “now Y% lower”), discount depth perceptionsincreased, which subsequently increased purchase intentions.
In Study 3, we examined the moderating role of numeracy,showing that the effects were relatively lower among morenumerate consumers. Finally, in Study 4, we examined themoderating role of discount depth size, showing that the effectswere relatively lower when discount depth was low. Thesestudies spanned a variety of product domains (e.g., groceryitems, mattresses, coffee sachets, furniture), involved bothreal and hypothetical situations, and employed a broadrange of variables (actual sales, purchase intentions, per-ceived discount depth, and perceived value of discount). Inaggregate, these results confirmed a robust effect, testedacross field and lab studies, and tested using both mediationand moderation analyses.
A supplementary study is presented in the Web Ap-pendix, wherein we examine what happens when the pricepromotion is withdrawn. This is an important question becauseprice promotions are typically withdrawn after some pe-riod (Kahn and Louie 1990). The supplementary studyshowed that there was no follow-on negative effect whenthe “was X% higher” (vs. “now Y% lower”) promotionalad was withdrawn.
Contributions to Theory
This article contributes to multiple streams of research,notably, those on price promotions, behavioral pricing, andnumeric processing. First, prior investigations of price pro-motions assume that discount depth evaluations refer to thedifference between the original and sale prices, comparedagainst the original price. We examine a different type ofpromotional ad frame that highlights the discount depth bycomparing the discount difference against the sale price. As akey finding, across a field study and multiple lab studies, weshow that using the promotional ad frame “was X% higher”increases perceptions of discount depth and thus increasespurchase intentions, subject to some boundary conditions.
Second, behavioral pricing research has considered variousways semantic cues (and their concreteness, novelty, or
Figure 4STUDY 4 RESULTS
4.84
3.193.54
3.03
1
2
3
4
5
6
7
37% Discount Depth 10% Discount Depth
Was X% higher Now Y% lower
Notes: The dependent variable is purchase intentions. Bars indicate 95%CIs.
346 JOURNAL OF MARKETING RESEARCH, JUNE 2018
location) can increase perceptions of discount depth and pur-chase intentions (see Table 1). This article offers the first evi-dence of how (re)framing the discount depth, by comparingagainst the sale price, can increase discount depth perceptionsand thus enhance purchase intentions. Our effects are consistentwith the idea that when consumers evaluate advertisement in-formation involving percentages, they tend to use an absolutenumber heuristic. As the absolute value of the number in thepromotional ad increases, consumers are more swayed by thisabsolute value and less swayed by the economic value of thenumeric information in the promotional advertising.
Third, this article contributes to research on numeric pro-cessing. It shows a systematic bias wherein consumers makeerrors when processing percentage information. Specifically,consumers appear to be influenced more by the face value ofthe number that appears in the percentage information andinfluenced less by the economic value that is represented bythat percentage information.
Contributions to Practice
This research has direct applicability to the practices thatmarketers and retailers use to present their price pro-motions. First, retailers can make selective use of the “wasX% higher” promotional ad frame to increase consumers’purchase intentions. This practice is relatively simple toimplement, requiring a change only in the signs displayingpromotional ads, and not requiring changes in, for example,actual prices.
Second, Study 3 shows that the “was X% higher” pro-motional ad frame is less impactful among substantiallynumerate consumers (see Study 3). Put another way, whilethis ad frame may be generally impactful, it is likely to beespecially impactful for retailers who primarily serveconsumer segments that are less numerate (e.g., those whoare older, those less educated, those with lower income; seeCiampa et al. 2010; De Bruin et al. 2015). From a publicpolicy perspective, this point appears especially relevant asthese (less numerate) segments are precisely the segmentsthat public policy researchers may perceive as worthy ofincreased protection via policy prescriptions.
Third, the “was X% higher” promotional ad frame is likely tobe less impactfulwhen discount depth is low (see Study 4).Giventhat prior research has shown that low discount depths aregenerally less impactful (Grewal, Marmorstein, and Sharma1996; Gupta and Cooper 1992), retailers tend not to use lowdiscount depth levels. For example, Bogomolova et al. (2015)examine discount depths in the United States, across two retailchains and16product categories. The average discount depthwas25%, and in 12 (of the 16) categories, the average discount depthexceeded 25% (28%–32%; see Table 5 of Bogomolova et al.[2015]). This suggests that, in general, there are several productcategories wherein discount depth levels are “not low,” so thereare opportunities for retailers to implement the suggested pro-motional ad frame (“wasX%higher”) and thereby increase sales.
Finally, the Federal Trade Commission has provided reg-ulation, “Guides Against Deceptive Pricing,” to prevent de-ceptive pricing practices (16 Code of Federal Regulations 233;reproduced in Grewal and Compeau 1992, p. 53). Notably,Section 233.1 of the rule pertains to former price comparisonsand states that the practice of comparing an advertised saleprice with a former price is acceptable if the former price is theactual price at which the good regularly sold for a reasonable
amount of time. The promotional ad frame (“was X% higher”)that we examine would not conflict with these guidelines.
Nevertheless, even though the promotional ad frame (“wasX% higher”) we examine is objectively correct, it mayrepresent a method for taking advantage of consumers’ biases,suggesting the need for more research into these types ofpromotional frames. Some research has focused on protectingconsumers from marketing practices that, although legal, takeadvantage of consumers’ unconscious biases (e.g., Grewal andGoodstein 1993). For example, when seeking to increase theirmargins, manufacturers may reduce package sizes (whichconsumers are less likely to notice) rather than increaseprices (Adams, Di Benedetto, and Chandran 1991). Toguard against this, Brazilian regulatory authorities havemandated that any quantity reductions must be displayedon the front of packaging (Neves and Itacarambi 2008).Consumer welfare researchers might similarly examine thepromotional ad framing that we delineate herein to eval-uate whether specific guidelines addressing such pro-motional ad frames are necessary for consumers’protection.
Limitations and Future Research
We have not examined whether the effects persist at veryhigh discount depth levels (e.g., “now 67% lower” vs. “was200% higher”). As an initial prediction, building fromGupta and Cooper (1992), we anticipate that consumersmay be skeptical upon encountering a number that isvalued at more than 100%. More generally, it may beuseful to examine a wide range of discount depth levels,ranging from very low to very high, to better understandthe discount depth range in which the effects proposed inH1 are most likely to occur.
The question of whether these effects will persist in the longrun is an empirical one. If many or all retailers adopt this typeof ad framing, the sales lift from using “was X% higher”promotions might diminish as consumers get better at cal-culating discount depth. Finally, drawing from work onprospect theory, we note that individuals tend to process lossesmore carefully than gains (Chatterjee et al. 2000). Thus,while our effects may persist in price promotion (gain)domains, they may be mitigated in price increase (loss)domains. This point is consistent with other work (e.g.,Grewal, Gottlieb, and Marmorstein 1994) that also drawsfrom prospect theory, which has shown that price cues areprocessed differently when advertising messages are framednegatively (vs. positively).
Finally, the implications of this work may extend beyondsale prices. The work in this article indicates that when firmsadvertise any attribute or outcome in which “less is better,”they may be better off using the presentation discussed here.For example, if a laptop manufacturer advertises that its newmodel is 30% lighter, then perhaps the promotional ad shouldstate that the prior year’s model was 42% heavier. The framingdiscussed in this article may also be used to promote healthierfood choices. For example, some manufacturers make thefront-of-package claim that canola oil–based shortening has“25% less sodium than butter”; such claims might have astronger impact if manufacturers reframed the message as“butter has 33% more sodium.” Future research may extendthe scope of this work beyond pricing to other elements of themarketing mix.
Reframing the Discount as a Comparison Against the Sale Price 347
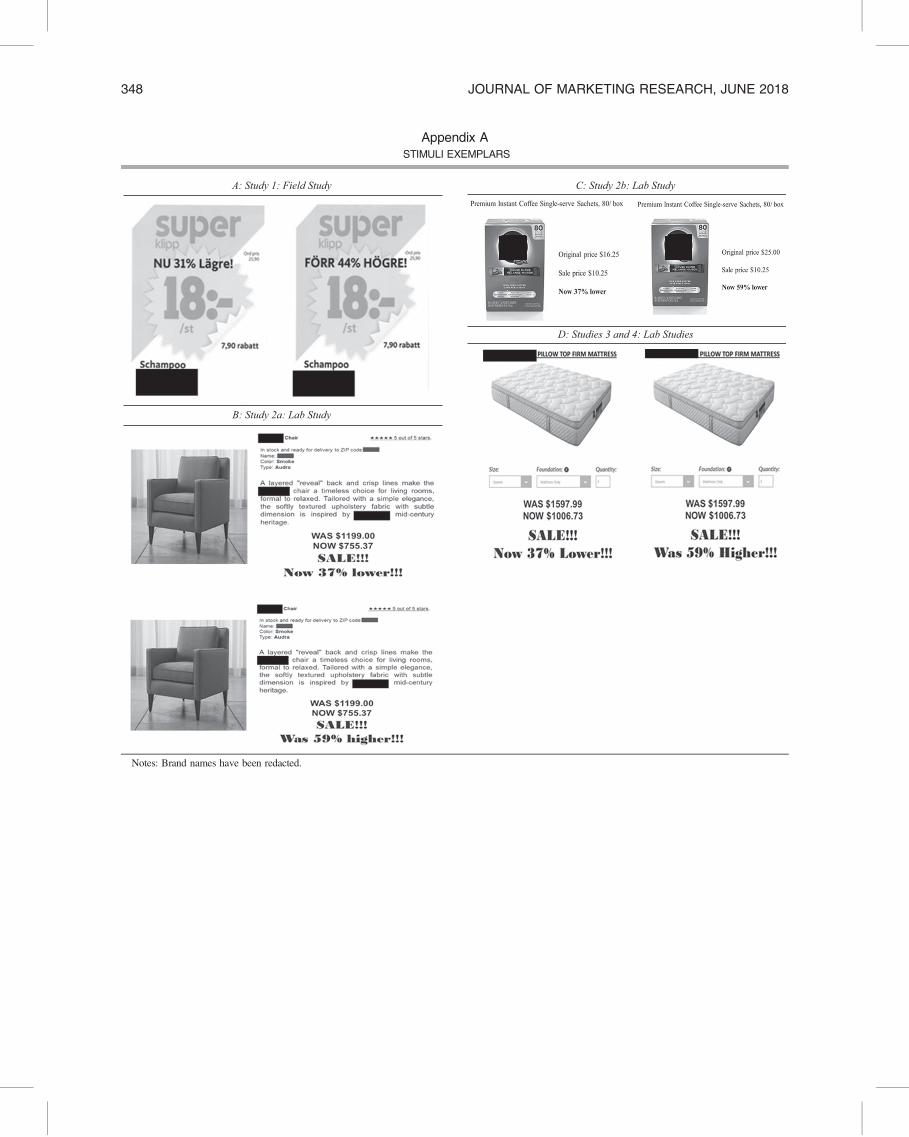
Appendix ASTIMULI EXEMPLARS
A: Study 1: Field Study
B: Study 2a: Lab Study
D: Studies 3 and 4: Lab Studies
C: Study 2b: Lab Study
Notes: Brand names have been redacted.
348 JOURNAL OF MARKETING RESEARCH, JUNE 2018

Appendix BSCALE ITEMS
Scale Items Endpoints Reliability (by Study)
Purchase intentions (PI) (itemsfrom Dodds, Monroe, andGrewal 1991)
• The likelihood that I would buy the[product] at the sale price is _____.
• The probability that I would considerbuying the [product] is _____.
• My willingness to buy the [product] at thesale price is _____.
1 = “very low,” and 7 = “veryhigh”
Study 2a: a = .95; Study 2b: a = .92;Study 3: a = .95; Study 4: a = .85
Discount depth perceptions (DD)(items adapted from Grewal,Marmorstein, and Sharma1996)
• The discount offered by the retailer for the[product] is very fair.
• The discount at which the [product] isoffered by the retailer provides very goodvalue.
• The discount offered by the retailer for the[product] is very attractive.
1 = “strongly disagree,” and7 = “strongly agree”
Study 2a: a = .88
Perceptions of novelty (from Coxand Cox 1988)
• The discount presentation format “Was X%higher”/“Now Y% lower” was _____.
1 = “old,” and 7 = “new” N.A.
Perceived complexity (Cox andCox 2002)
• The discount presentation format “WasX%higher”/“Now Y% lower” was _____.
1 = “complicated,” and 7 =“simple”; 1 = “complex,” and7 = “not complex”
Study 2a: r = .93, p < .05
Value of discount (VOD) (itemsadapted from DelVecchio,Lakshmanan, and Krishnan2009)
• The total discount offered is very valuable/The total discount makes the offer a gooddeal
1 = “strongly disagree,” and5 = “strongly agree”
Study 2b: r = .64, p < .05
Numeracy (from Peters et al.2006)
• Which of the following numbers representsthe biggest risk of getting a disease? [1 in100, 1 in 1,000, 1 in 10]
• Which of the following represents thebiggest risk of getting a disease? [1%, 10%,5%]
• If the chance of getting a disease is 10%,how many people would be expected to getthe disease out of 100?
• If the chance of getting a disease is 10%,how many people would be expected to getthe disease out of 1000?
• If the chance of getting a disease is 20 outof 100, this would be the same as havinga __% chance of getting the disease.
• If person A’s risk of disease is 1% in tenyears, and person B’s risk is double that ofA’s, what is B’s risk?
• If person A’s risk of disease is 1 in 100 inten years, and person B’s risk is double thatof A’s, what is B’s risk?
• In the BIG BUCKS lottery, the chances ofwinning a $10 prize is 1%. What is yourbest guess about how many people wouldwin a $10 if 1000 people each buy a singleticket from BIG BUCKS?
• Imagine that we roll a fair, six-sided die1000 times. Out of 1000 rolls, how manytimes do you think the die would come upeven (2, 4, or 6)?
• The chance of getting a viral infection is.0005. Out of 10,000 people, about howmany of them are expected to get infected?
• In the ACME PUBLISHEDSWEEPSTAKES, the chance of winninga car is 1 in 1000. What percent of tickets ofACME PUBLISHING win a car?
N.A. (scores: M = 8.96; SD = 1.48)
Reframing the Discount as a Comparison Against the Sale Price 349

REFERENCES
Adams, Anthony, C. Anthony Di Benedetto, and Rajan Chandran(1991), “Can You Reduce Your Package SizeWithout DamagingSales?” Long Range Planning, 24 (4), 86–96.
Aydinli, Aylin, Marco Bertini, and Anja Lambrecht (2014), “Price Pro-motion for Emotional Impact,” Journal of Marketing, 78 (4), 80–96.
Bagchi, Rajesh, and Derick Davis (2015), ‘“18% Off the OriginalPrice Then Another 12% Off’ or ‘12% Off Then 18% Off’: HowMultiple Discounts Influence Consumer Evaluations,” in Ad-vances in Consumer Research, Vol. 43, K. Diehl and C. Yoon,eds. Duluth, MN: Association for Consumer Research, 284–85.
Biswas, Abhijit, Sandeep Bhowmick, Abhijit Guha, and DhruvGrewal (2013), “Consumer Evaluations of Sale Prices: Role of theSubtraction Principle,” Journal of Marketing, 77 (4), 49–66.
Bogomolova, Svetlana, Steven Dunn, Giang Trinh, Jennifer Taylor,and Richard J. Volpe (2015), “Price Promotion Landscape in theUS and UK: Depicting Retail Practice to Inform Future ResearchAgenda,” Journal of Retailing and Consumer Services, 25, 1–11.
Burson, Katherine A., Richard P. Larrick, and John G. Lynch Jr.(2009), “Six of One, Half Dozen of the Other: Expanding andContracting Numerical Dimensions Produces Preference Re-versals,” Psychological Science, 20 (9), 1074–78.
Chatterjee, Subimal, Timothy B. Heath, Sandra J. Milberg, andKaren R. France (2000), “The Differential Processing of Price inGains and Losses: The Effects of Frame and Need for Cognition,”Journal of Behavioral Decision Making, 13 (1), 61–75.
Chen, Haipeng Allan, Howard Marmorstein, Michael Tsiros, andAkshay R. Rao (2012), “When More Is Less: The Impact of BaseValue Neglect on Consumer Preferences for Bonus Packs overPrice Discounts,” Journal of Marketing, 76 (4), 64–77.
Chen, Haipeng Allan, and Akshay R. Rao (2007), “When Two PlusTwo Is Not Equal to Four: Errors in Processing Multiple PercentageChanges,” Journal of Consumer Research, 34 (3), 327–40.
Ciampa, Philip J., Chandra Y. Osborn, Neeraja B. Peterson, andRussell L. Rothman (2010), “Patient Numeracy, Perceptions ofProvider Communication, and Colorectal Cancer ScreeningUtilization,” Journal of Health Communication, 15 (3), 157–68.
Cox, Dena S., and Anthony D. Cox (1988), “What Does FamiliarityBreed? Complexity as a Moderator of Repetition Effects in Adver-tisement Evaluation,” Journal of Consumer Research, 15 (1), 111–16.
Cox, Dena S., and Anthony D. Cox (2002), “Beyond First Im-pressions: The Effects of Repeated Exposure on Consumer Likingof Visually Complex and Simple Product Designs,” Journal of theAcademy of Marketing Science, 30 (2), 119–30.
Appendix CRESULTS ACROSS ALL STUDIES
A: Study 1 (Field Study; Domain = Grocery Products)
I. “Now Y% Lower” (n = 56) II. “Was X% Higher” (n = 56)
Daily unit sales 20.77 (23.18) 42.73 (59.68)Contrast between cells I and II t-test: t(110) = 2.56, p < .05; regression: b = +10.95, SE = 3.78, t = 2.89, p < .05
B: Study 2a (Lab Study; Domain = Furniture)
I. “Now 37% Lower” (n = 40) II. “Was 59% Higher” (n = 42)
PI 2.78 (1.70) 4.37 (1.40)DD 3.94 (1.50) 5.01 (1.15)Contrast between cells I and II PI: t(80) = 4.60, p < .05; DD: t(80) = 3.62, p < .05
C: Study 2b (Lab Study; Domain = Coffee Sachets)
I. “Now 37%Lower” (n = 67)
II. “Now 59%Lower” (n = 69)
III. “Was 37%Higher” (n = 68)
IV. “Was 59%Higher” (n = 67)
PI 5.82 (2.04) 6.69 (1.83) 5.68 (1.99) 6.46 (1.85)VOD 3.63 (1.06) 4.28 (.69) 3.57 (.92) 3.95 (.75)Contrast between cells I and II PI: t(267) = 2.62, p < .05; VOD: t(267) = 4.38, p < .05Contrast between cells I and IV PI: t(267) = 1.92, p < .06; VOD: t(267) = 2.15, p < .05Contrast between cells II and III PI: t(267) = 3.07, p < .05; VOD: t(267) = 4.81, p < .05Contrast between cells III and IV PI: t(267) = 2.36, p < .05; VOD: t(267) = 2.57, p < .05
D: Study 3 (Lab Study; Domain = Mattresses)
I. “Now 37% Lower” (n = 115) II. “Was 59% Higher” (n = 119)
PI 3.61 (1.56) 4.69 (1.43)Contrast between cells I and II t(232) = 5.55, p < .05Interaction with (mean-centered) numeracy scores b = −.42, SE = .13, t = −3.27, p < .05.
E: Study 4 (Lab Study; Domain = Mattresses)
I. “Now 37%Lower” (n = 38)
II. “Was 59%Higher” (n = 41)
III. “Now 10%Lower” (n = 39)
IV. “Was 11%Higher” (n = 40)
V. “Was 37%Higher” (n = 40)
PI 3.54 (1.02) 4.84 (.85) 3.03 (1.46) 3.19 (1.00) 3.38 (.95)Contrast between cells I and II F(1, 154) = 27.06, p < .05Contrast between cells III and IV F(1, 154) = .4, p = .53Contrast between cells I and V t(116) = .79, p = .43Contrast between cells II and V t(116) = 6.98, p < .05.
Notes: Standard deviations are shown in parentheses.
350 JOURNAL OF MARKETING RESEARCH, JUNE 2018
De Bruin, Wandi, Simon J. McNair, Andrea L. Taylor, BarbaraSummers, and JoNell Strough (2015), “Thinking About Numbers IsNotMy Idea of Fun: Need for CognitionMediates Age Differences inNumeracy Performance,” Medical Decision Making, 35 (1), 22–26.
Dehaene, Stanislas (1997), The Number Sense: How the MindCreates Mathematics. New York: Oxford University Press.
DelVecchio, Devon, Arun Lakshmanan, and H. Shanker Krishnan(2009), “The Effects of Discount Location and Frame on Con-sumers’ Price Estimates,” Journal of Retailing, 85 (3), 336–46.
Denes-Raj, Veronika, and Seymour Epstein (1994), “Conflict Be-tween Intuitive and Rational Processing: When People BehaveAgainst Their Better Judgment,” Journal of Personality andSocial Psychology, 66 (5), 819–29.
Dieckman, Nathan F., Paul Slovic, and Ellen M. Peters (2009), “TheUse of Narrative Evidence and Explicit Likelihood by Decision-makers Varying in Numeracy,” Risk Analysis, 29 (10), 1473–88.
Dodds, William B., Kent B. Monroe, and Dhruv Grewal(1991), “Effects of Price, Brand, and Store Information onBuyers’ Product Evaluations,” Journal of Marketing Research,28 (November), 307–19.
Economist, The (2012), “Something Doesn’t Add Up,” (June 30),http://www.economist.com/node/21557801.
Gonzalez, Eva M., Eduardo Esteva, Anne L. Roggeveen, and DhruvGrewal (2016), “Amount off Versus Percentage off—When DoesIt Matter?” Journal of Business Research, 69 (3), 1022–27.
Grewal, Dhruv, and Larry D. Compeau (1992), “Comparative PriceAdvertising: Informative or Deceptive?” Journal of Public Policy& Marketing, 11 (Spring), 52–62.
Grewal, Dhruv, and Ronald C. Goodstein (1993), “Societal andPublic Policy Issues with Retail Pricing,” in Advances in Con-sumer Research, Vol. 20, Leigh McAlister and Michael L.Rothschild, eds. Provo, UT: Association of Consumer Research,477.
Grewal, Dhruv, Jerry Gottlieb, and Howard Marmorstein (1994),“The Moderating Effects of Message Framing and SourceCredibility on the Price–Perceived Risk Relationship,” Journal ofConsumer Research, 21 (1), 145–53.
Grewal, Dhruv, Howard Marmorstein, and Arun Sharma (1996),“Communicating Price Information Through Semantic Cues: TheModerating Effects of Situation and Discount Size,” Journal ofConsumer Research, 23 (2), 148–55.
Gupta, Sunil, and Lee G. Cooper (1992), “The Discounting ofDiscounts and Promotion Thresholds,” Journal of ConsumerResearch, 19 (3), 401–11.
Hayes, Andrew F., and Jorg Matthes (2009), “ComputationalProcedures for Probing Interactions in OLS and Logistic Re-gression: SPSS and SAS Implementations,” Behavior ResearchMethods, 41 (3), 924–36.
Kahn, Barbara E., and Therese A. Louie (1990), “Effects of Re-traction of Price Promotions on Brand Choice Behavior for
Variety-Seeking and Last-Purchase-Loyal Consumers,” Journalof Marketing Research, 27 (August), 279–89.
Kim, Hyeong Min, and Thomas Kramer (2006), “‘Pay 80%’
Versus ‘Get 20% Off’: The Effect of Novel Discount Pre-sentation on Consumers’ Deal Perceptions,” Marketing Let-ters, 17 (4), 311–21.
Kirsch, Irwin S., Ann Jungeblut, Lynn Jenkins, and Andrew Kolstad(2002), “Adult Literacy inAmerica: A First Look at the Findings of theNational Adult Literacy Survey,” 3rd ed,National Center for EducationStatistics, http://nces.ed.gov/pubsearch/pubsinfo.asp?pubid=93275.
Krishnan, Balaji C., Abhijit Biswas, and Richard G. Netemeyer(2006), “Semantic Cues in Reference Price Advertisements:The Moderating Role of Cue Concreteness,” Journal of Re-tailing, 82 (2), 95–104.
Kruger, Justin, and Patrick Vargas (2008), “Consumer Confusion ofPercentDifferences,” Journal ofConsumerPsychology, 18 (1), 49–61.
Mohan, Bhavya, Pierre Chandon, and Jason Riis (2015), “PercentageCost Discounts Always Beat Percentage Benefit Bonuses: HelpingConsumers Evaluate Nominally Equivalent Percentage Changes,”Journal of Marketing Behavior, 1 (1), 75–107.
Neves, Felipe, and Francisco Itacarambi (2008), “N~ao Vale oQuanto Pesa,” Revista Procon, 9 (March–April), 16–21.
Pacini, R., and S. Epstein (1999), “The Relation of Rational andExperiential Information Processing Styles to Personality, BasicBeliefs, and the Ratio-Bias Phenomenon,” Journal of Personalityand Social Psychology, 76 (6), 972–87.
Paulos, JohnA. (1988), Innumeracy:Mathematical Illiteracy and ItsConsequences. New York: Hill and Wang.
Peters, Ellen, Daniel Vastfjall, Paul Slovic, C.K. Mertz, KettiMazzocco, and Stephan Dickert (2006), “Numeracy and DecisionMaking,” Psychological Science, 17 (5), 407–13.
Raghubir, Priya, and Joydeep Srivastava (2002), “Effect of FaceValue on Product Valuation in Foreign Currencies,” Journal ofConsumer Research, 29 (3), 335–47.
Reyna, Valerie F., and Charles J. Brainerd (2008), “Numeracy,Ratio Bias, and Denominator Neglect in Judgments of Risk andProbability,” Learning and Individual Differences, 18 (1),89–107.
Tuttle, Brad (2016), “More Retailers Accused of MisleadingCustomers with Fake Price Schemes,” Time (January 7), http://time.com/money/4171081/macys-jc-penney-lawsuit-original-prices/.
Urbany, Joel E., William O. Bearden, and Dan C.Weilbaker (1988),“The Effect of Plausible and Exaggerated Reference Prices onConsumer Perceptions and Price Search,” Journal of ConsumerResearch, 15 (1), 95–110.
Wertenbroch, Klaus, Dilip Soman, and Amitava Chattopadhyay(2007), “On the Perceived Value of Money: The ReferenceDependence of Currency Numerosity Effects,” Journal of Con-sumer Research, 34 (1), 1–10.
Reframing the Discount as a Comparison Against the Sale Price 351