abc (activity based costing) project -...
TRANSCRIPT
ABC (Activity Based Costing) Project
2 |
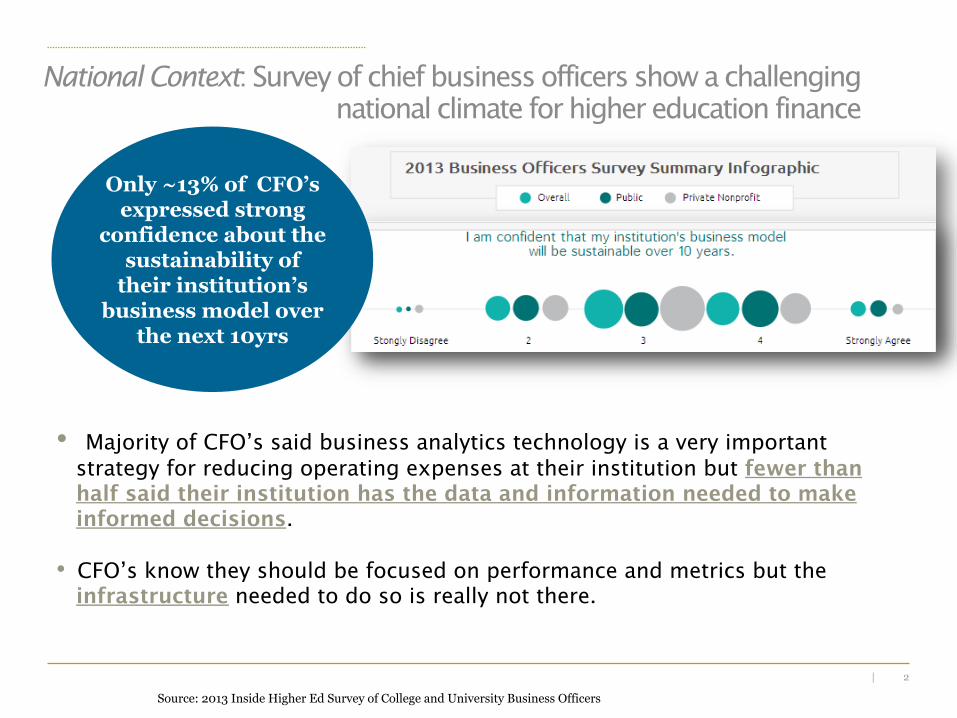
National Context: Survey of chief business officers show a challenging national climate for higher education finance
Source: 2013 Inside Higher Ed Survey of College and University Business Officers
Only ~13% of CFO’s expressed strong
confidence about the sustainability of
their institution’s business model over
the next 10yrs
• Majority of CFO’s said business analytics technology is a very important strategy for reducing operating expenses at their institution but fewer than half said their institution has the data and information needed to make informed decisions.
• CFO’s know they should be focused on performance and metrics but the infrastructure needed to do so is really not there.
3 |
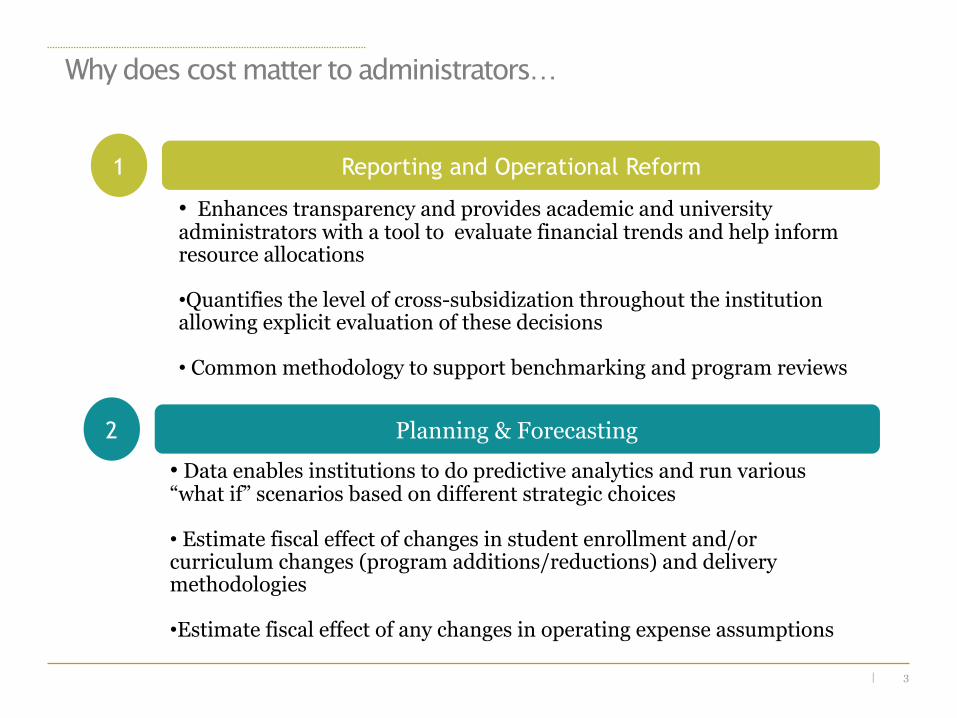
Why does cost matter to administrators…
• Enhances transparency and provides academic and university administrators with a tool to evaluate financial trends and help inform resource allocations • Quantifies the level of cross-subsidization throughout the institution allowing explicit evaluation of these decisions
• Common methodology to support benchmarking and program reviews
1
2
Reporting and Operational Reform
Planning & Forecasting • Data enables institutions to do predictive analytics and run various “what if” scenarios based on different strategic choices
• Estimate fiscal effect of changes in student enrollment and/or curriculum changes (program additions/reductions) and delivery methodologies
• Estimate fiscal effect of any changes in operating expense assumptions
4 |
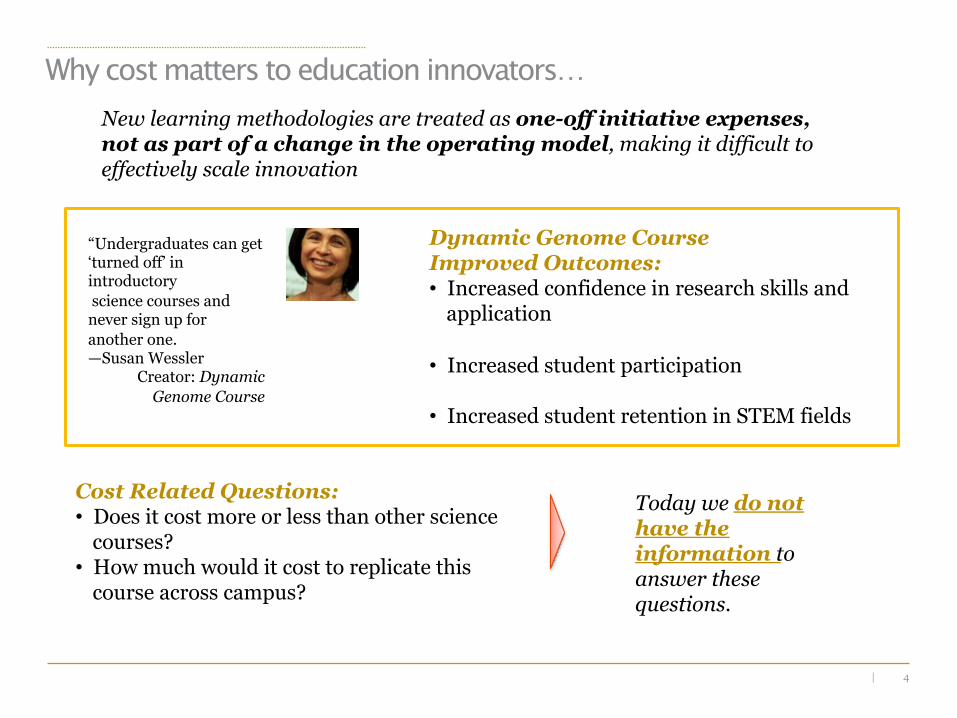
Why cost matters to education innovators…
“Undergraduates can get ‘turned off’ in introductory science courses and never sign up for another one. —Susan Wessler
Creator: Dynamic Genome Course
Dynamic Genome Course Improved Outcomes: • Increased confidence in research skills and
application
• Increased student participation
• Increased student retention in STEM fields
Cost Related Questions: • Does it cost more or less than other science
courses? • How much would it cost to replicate this
course across campus?
Today we do not have the information to answer these questions.
New learning methodologies are treated as one-off initiative expenses, not as part of a change in the operating model, making it difficult to effectively scale innovation
5 |
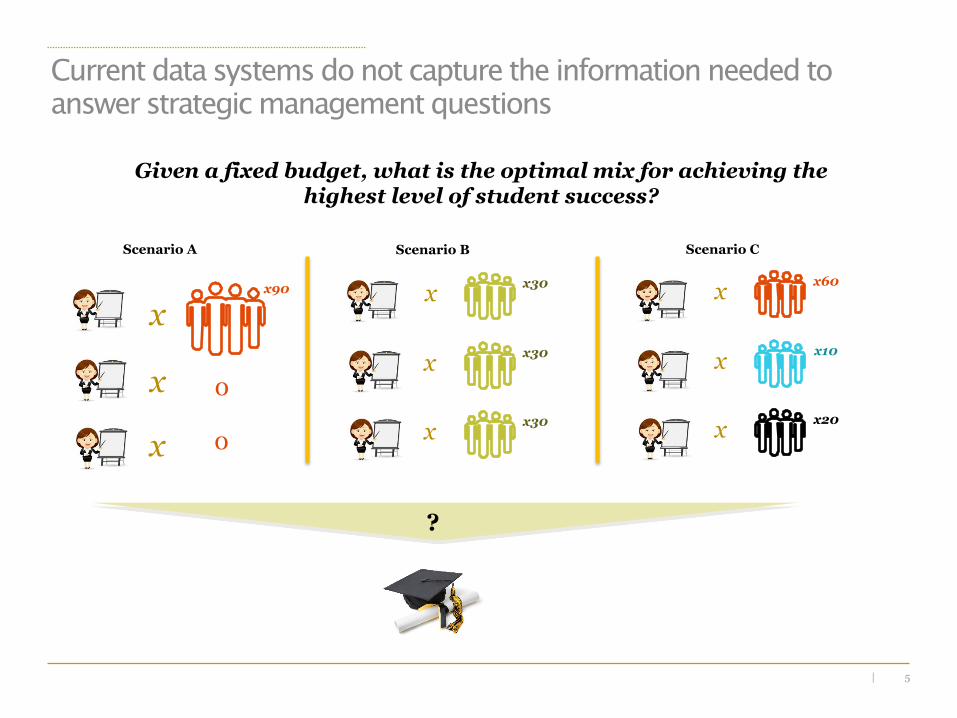
Scenario A
x90
Scenario B Scenario C
Given a fixed budget, what is the optimal mix for achieving the highest level of student success?
x
x60 x
x10 x
x20 x
x30 x
x30 x
x30 x
Current data systems do not capture the information needed to answer strategic management questions
x
x
0
0
?
6 |
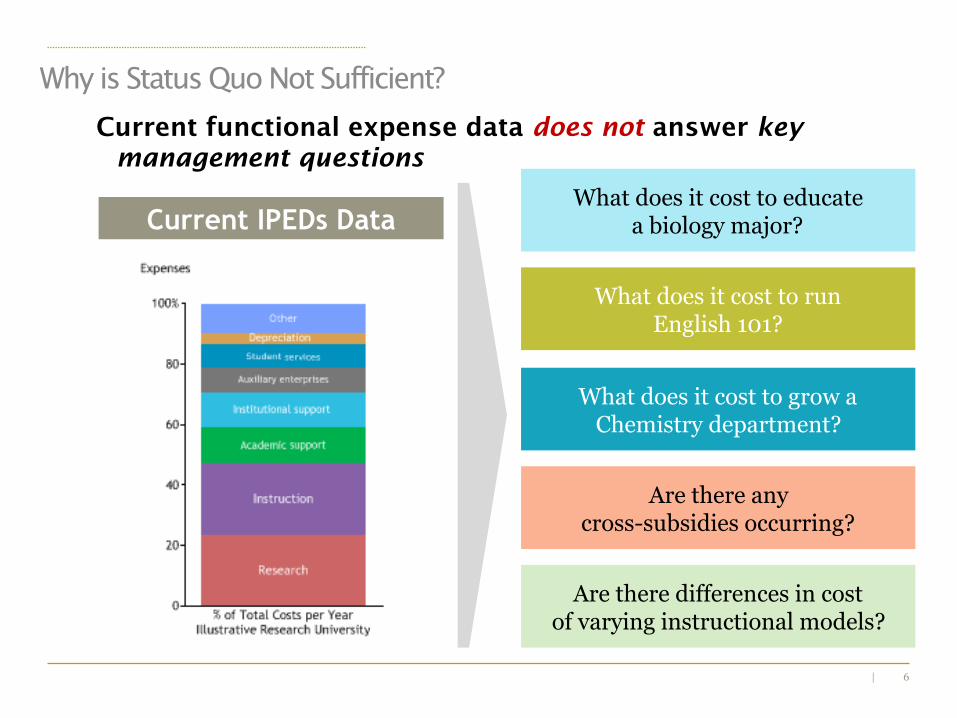
Why is Status Quo Not Sufficient?
Current IPEDs Data What does it cost to educate
a biology major?
What does it cost to run English 101?
What does it cost to grow a Chemistry department?
Are there any cross-subsidies occurring?
Are there differences in cost of varying instructional models?
Salaries & Wages 43%
Benefits 22%
Scholarships / Fellowships 2%
Supplies 9%
DOE Labs 4%
Other 20%
Current functional expense data does not answer key management questions
7 |
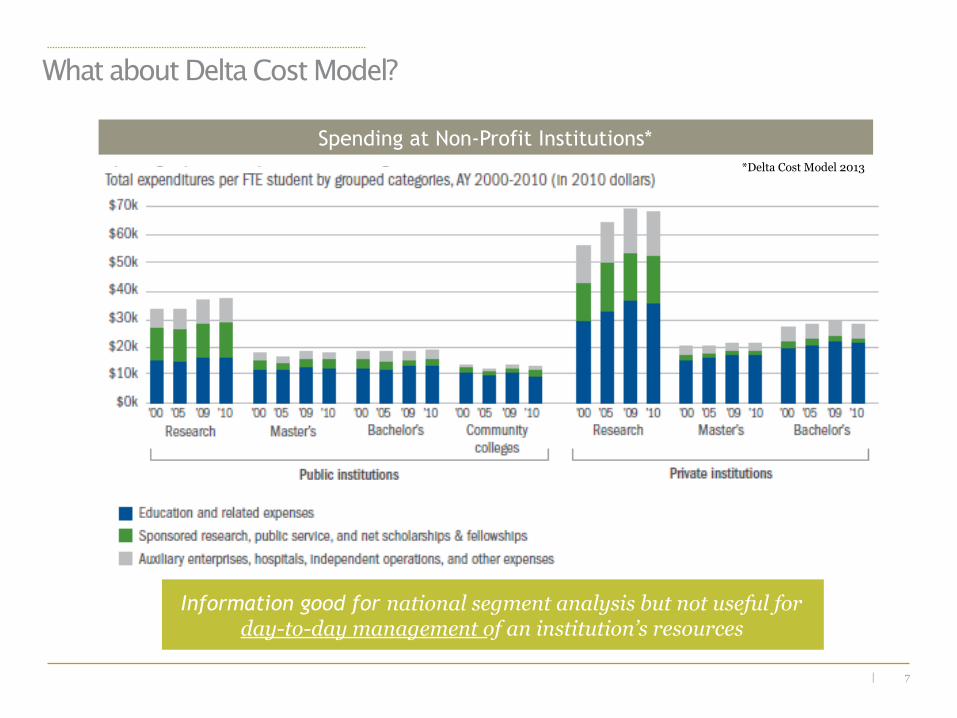
What about Delta Cost Model?
Spending at Non-Profit Institutions*
Information good for national segment analysis but not useful for day-to-day management of an institution’s resources
*Delta Cost Model 2013
8 |
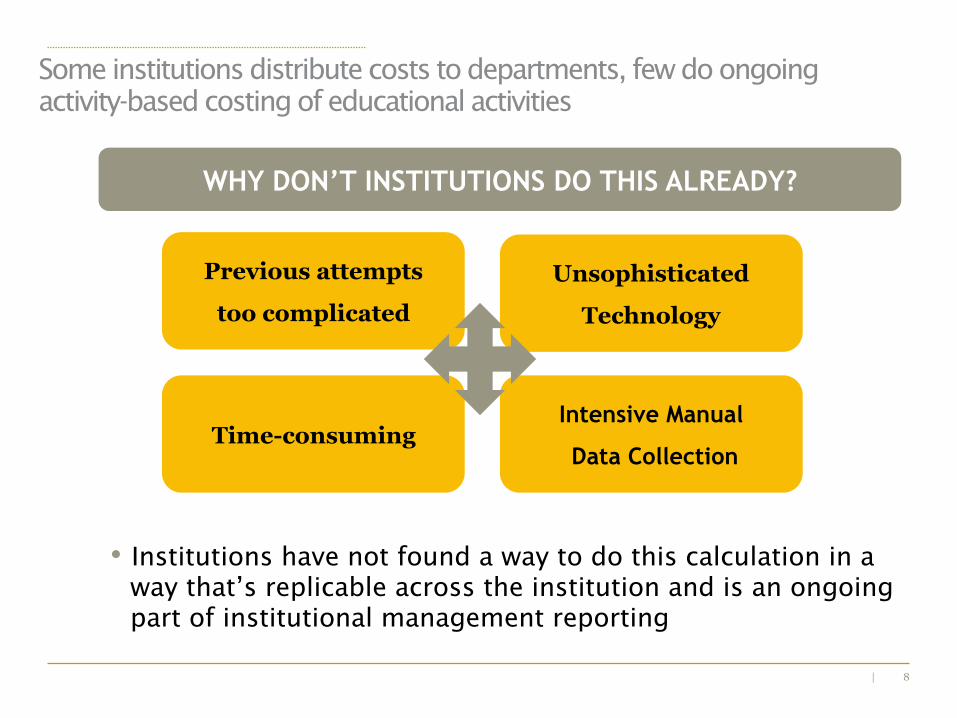
Previous attempts
too complicated
Some institutions distribute costs to departments, few do ongoing activity-based costing of educational activities
• Institutions have not found a way to do this calculation in a way that’s replicable across the institution and is an ongoing part of institutional management reporting
WHY DON’T INSTITUTIONS DO THIS ALREADY?
Time-consuming Intensive Manual
Data Collection
Unsophisticated
Technology

9 |
Management tool to enable deans and/or department chairs to better use their
resources
Purpose of Project
10 |
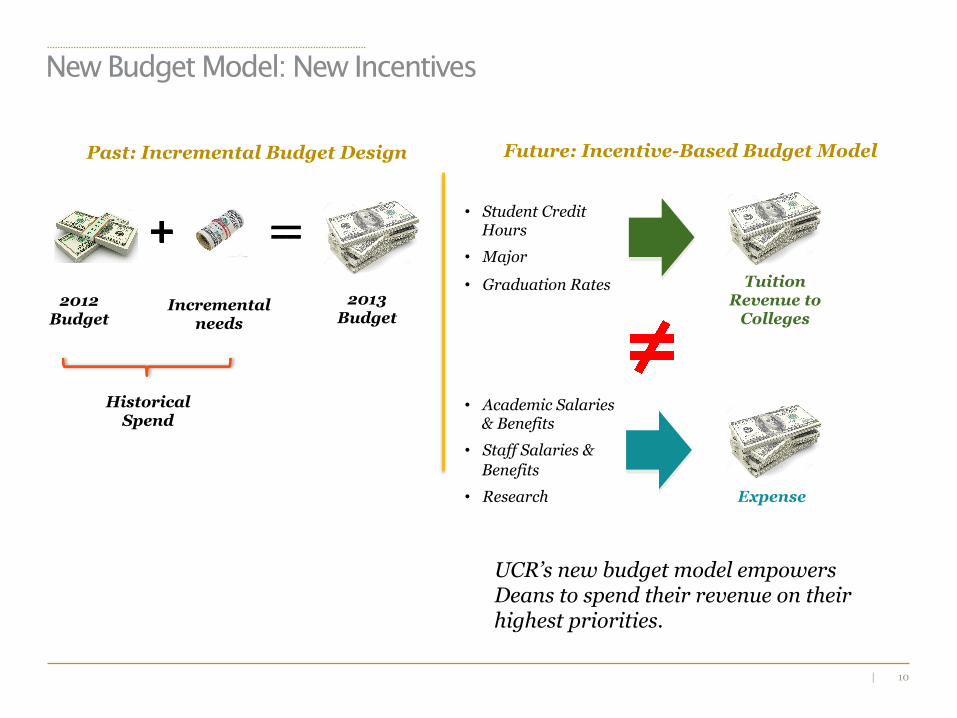
New Budget Model: New Incentives
Past: Incremental Budget Design
2013 Budget
2012 Budget
Incremental needs
Future: Incentive-Based Budget Model
Tuition Revenue to
Colleges
• Student Credit Hours
• Major
• Graduation Rates
Expense
• Academic Salaries & Benefits
• Staff Salaries & Benefits
• Research
UCR’s new budget model empowers Deans to spend their revenue on their highest priorities.
Historical Spend
11 |
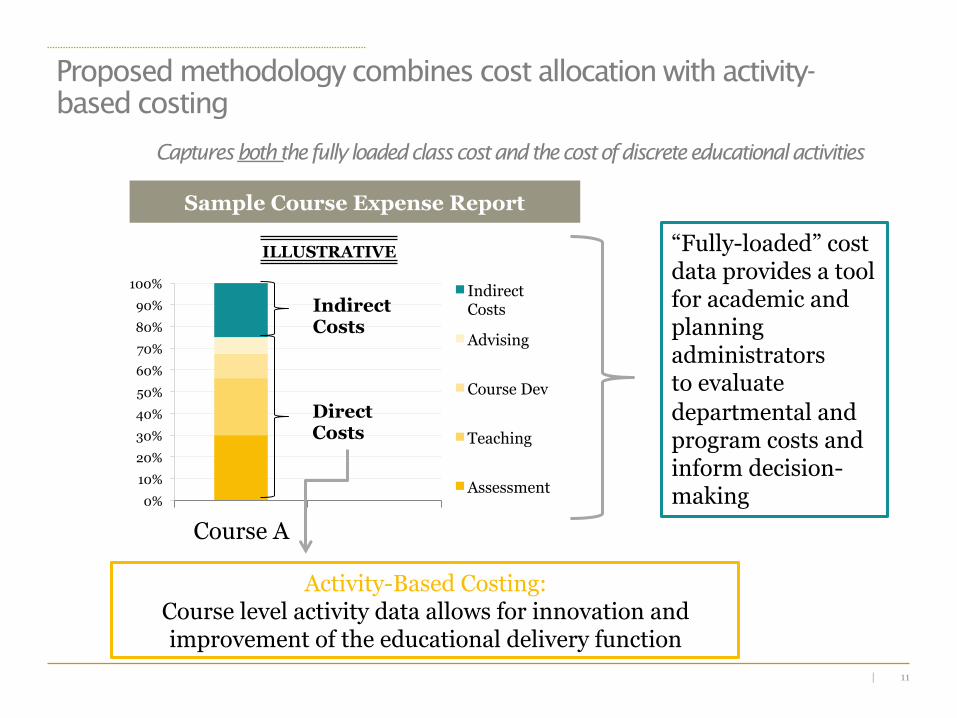
Captures both the fully loaded class cost and the cost of discrete educational activities
0% 10% 20% 30% 40% 50% 60% 70% 80% 90%
100%
Course A
Indirect Costs
Advising
Course Dev
Teaching
Assessment
Sample Course Expense Report
Indirect Costs
Direct Costs
“Fully-loaded” cost data provides a tool for academic and planning administrators to evaluate departmental and program costs and inform decision-making
Activity-Based Costing: Course level activity data allows for innovation and improvement of the educational delivery function
ILLUSTRATIVE
Proposed methodology combines cost allocation with activity-based costing
12 |
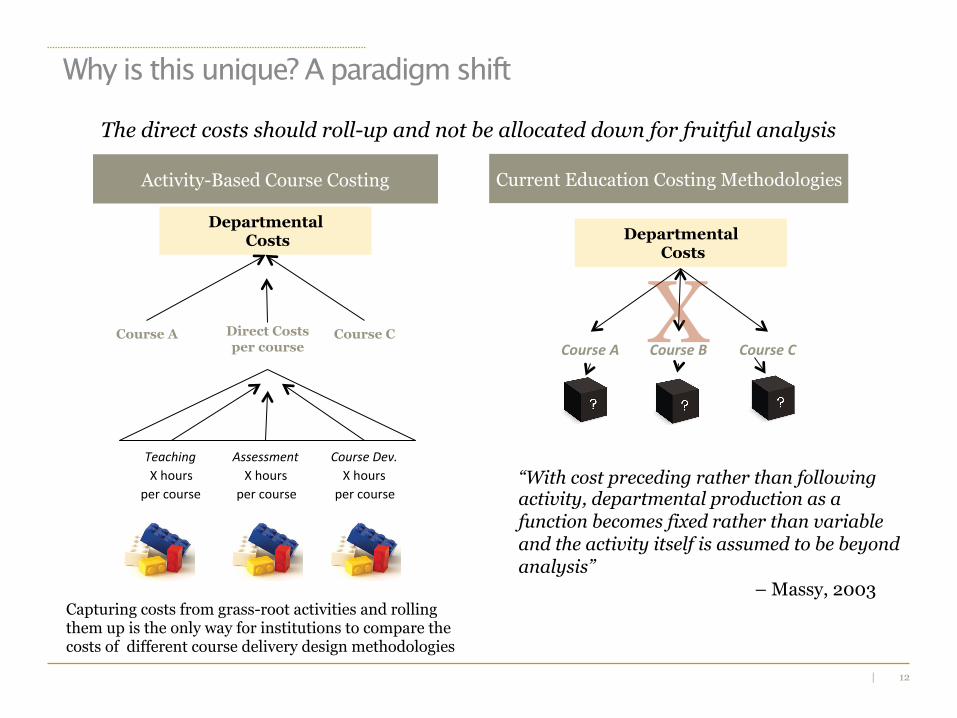
Capturing costs from grass-root activities and rolling them up is the only way for institutions to compare the costs of different course delivery design methodologies
Teaching X hours
per course
Assessment X hours
per course
Course Dev. X hours
per course
Direct Costs per course Course A Course B Course C
Current Education Costing Methodologies Activity-Based Course Costing
Departmental Costs
Course C Course A
“With cost preceding rather than following activity, departmental production as a function becomes fixed rather than variable and the activity itself is assumed to be beyond analysis” – Massy, 2003
X Departmental
Costs
The direct costs should roll-up and not be allocated down for fruitful analysis
Why is this unique? A paradigm shift
13 |
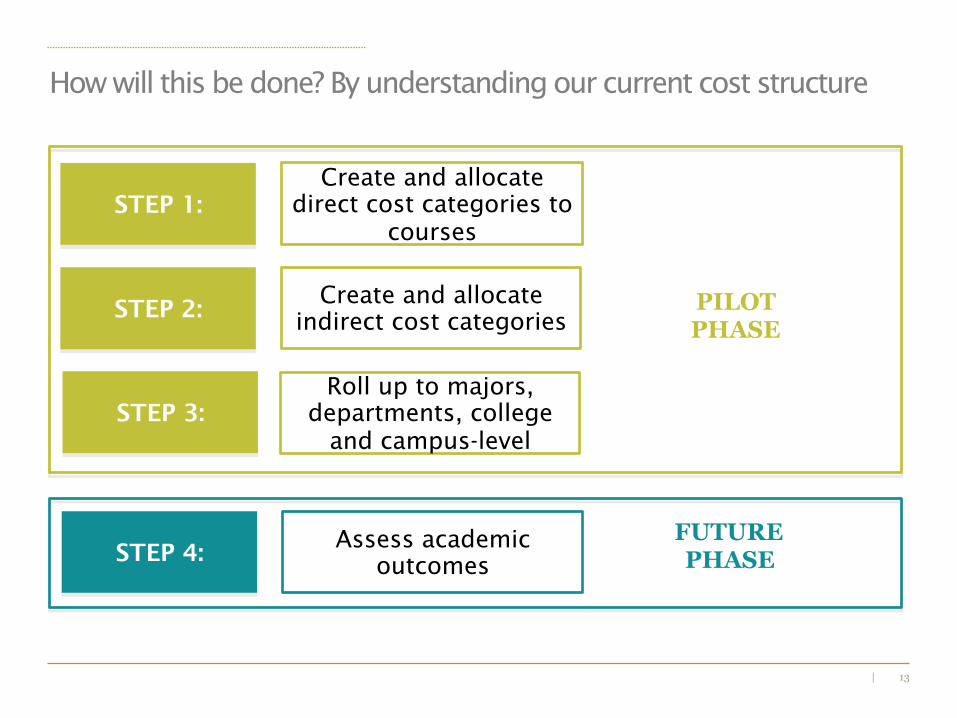
How will this be done? By understanding our current cost structure
STEP 1: Create and allocate
direct cost categories to courses
Create and allocate indirect cost categories
STEP 4: Assess academic
outcomes
PILOT PHASE
FUTURE PHASE
STEP 2:
STEP 3: Roll up to majors,
departments, college and campus-level
14 |
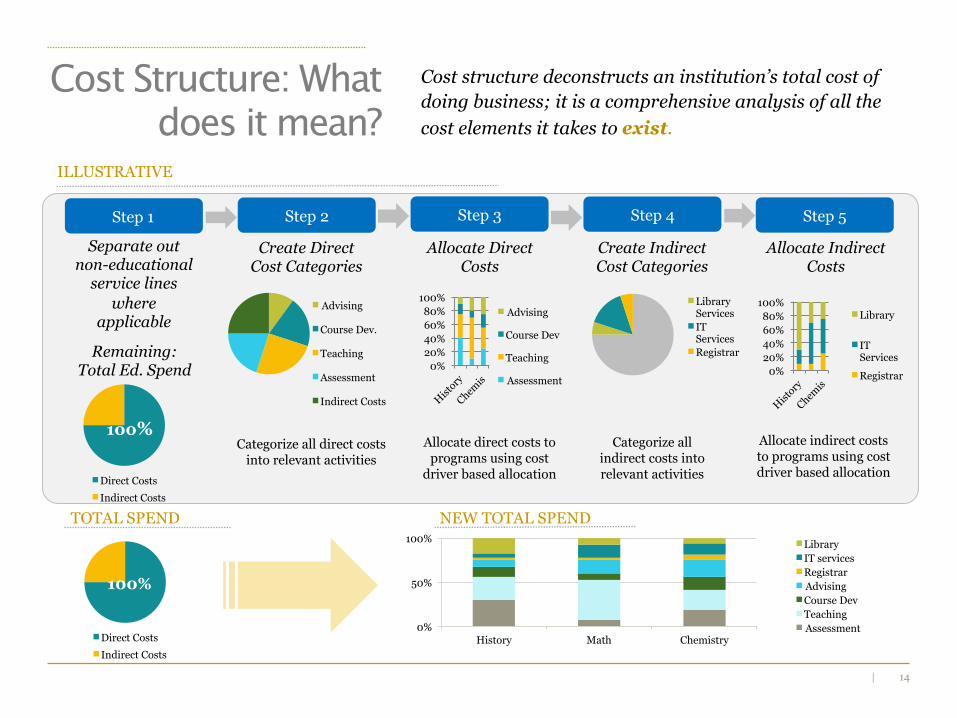
Cost structure deconstructs an institution’s total cost of doing business; it is a comprehensive analysis of all the cost elements it takes to exist.
Step 2 Step 3 Step 4 Step 5
Advising
Course Dev.
Teaching
Assessment
Indirect Costs
Create Direct Cost Categories
Start
Direct Costs Indirect Costs
100%
Remaining: Total Ed. Spend
Categorize all direct costs into relevant activities
Allocate direct costs to programs using cost
driver based allocation
Categorize all indirect costs into relevant activities
Allocate indirect costs to programs using cost driver based allocation
0% 20% 40% 60% 80%
100% Advising
Course Dev
Teaching
Assessment
Library Services IT Services Registrar
Allocate Direct Costs
Create Indirect Cost Categories
Allocate Indirect Costs
0% 20% 40% 60% 80%
100% Library
IT Services
Registrar
Step 1
Separate out non-educational
service lines where
applicable
Direct Costs Indirect Costs
100%
TOTAL SPEND
0%
50%
100%
History Math Chemistry
Library IT services Registrar Advising Course Dev Teaching Assessment
NEW TOTAL SPEND
Cost Structure: What does it mean?
ILLUSTRATIVE

15 |
§ Many types of higher education institutions can be considered multi-product firms because they produce a variety of things, not just education
§ Educational enterprise must be separated from the business-like, self-supporting set of service lines, where costs should be covered by revenues and thus should be irrelevant to the cost per course
§ Examples include: auxiliaries, clinics, technology transfer, and externally funded research
Cost Structure: Step 1
Step 1
Separate out non-educational service
lines where applicable
Remaining Total Educational Spend
Direct Costs
Indirect Costs
100%
16 |
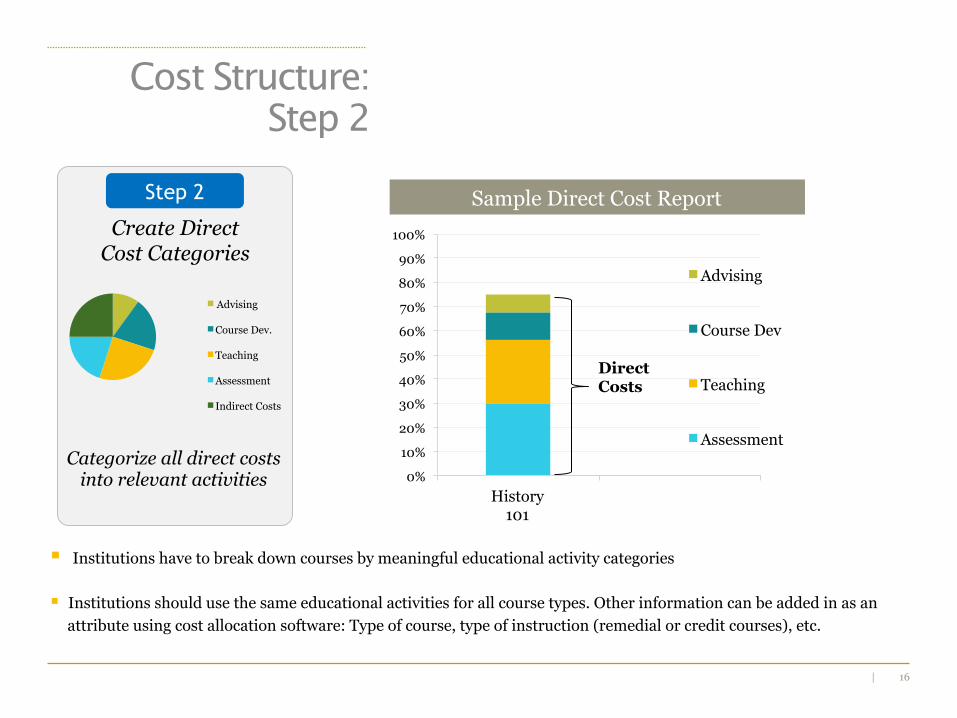
§ Institutions have to break down courses by meaningful educational activity categories
§ Institutions should use the same educational activities for all course types. Other information can be added in as an attribute using cost allocation software: Type of course, type of instruction (remedial or credit courses), etc.
0%
10%
20%
30%
40%
50%
60%
70%
80%
90%
100%
History 101
Advising
Course Dev
Teaching
Assessment
Direct Costs
Step 2
Categorize all direct costs into relevant activities
Create Direct Cost Categories
Cost Structure: Step 2
Advising
Course Dev.
Teaching
Assessment
Indirect Costs
Sample Direct Cost Report

17 |
Direct Activities* Description*
1 Course Development
Creating and planning curriculum, pedagogy, instruction, and delivery methods to guide student learning.
2 Course Management
Planning learning activities, selecting and creating course content and materials, engaging in course organization.
3 Teaching Delivering course content, managing and monitoring student assignments and classroom (physical or virtual) activities.
4 Tutoring Formally providing supplemental academic assistance in support of regular coursework.
5 Advising Assisting students with activities related to their educational experience including scheduling, academic support, planning and selecting curricular pathways and career development.
6 Assessment and Grading
Assessing prior and current learning; developing and selecting assessment methodologies; evaluating student assignments and performance to award course credit, and contributing to broader assessment of student learning outcomes.
*Direct course activities and their descriptions from National Higher Education Benchmarking Institute (NHEBI)
Institutions should use the same educational activities for all course types. Other information can be added in as an attribute using the cost allocation software (type of course, type of instruction (remedial or credit courses) or even student type).
Direct Cost Activities: In order to create more standardization across the sector, recommendation is for institutions to use buckets created by NHEBI

18 |
First Step in Direct Cost Allocation: Course Profiles
Course Development Hours
Course Management Hours
Teaching Hours
Tutoring Hours
Advising Hours Assessment & Grading Hours
Class Type Lecture/Lab/etc
Credit Hours
Delivery Mode On-campus Online/ Hybrid
Semester Fall/Summer # of Students
Educ
atio
nal A
ctiv
ities
Co
urse
Att
ribu
tes
Sample Course Profile
• In order to allocate costs to the educational activities, course profiles will be created to allocate activity hours and attributes to its courses
• Attributes can be added to course profiles to give more information • Note that in Excel these would create unmanageable data sets, but DS software can handle this complexity
• Effort on course activities can be captured in “course profiles” – minimizes interviews & effort
• Can be set to differ by school/department, by level/type of course or individual
• Can refine as appropriate over time
19 |
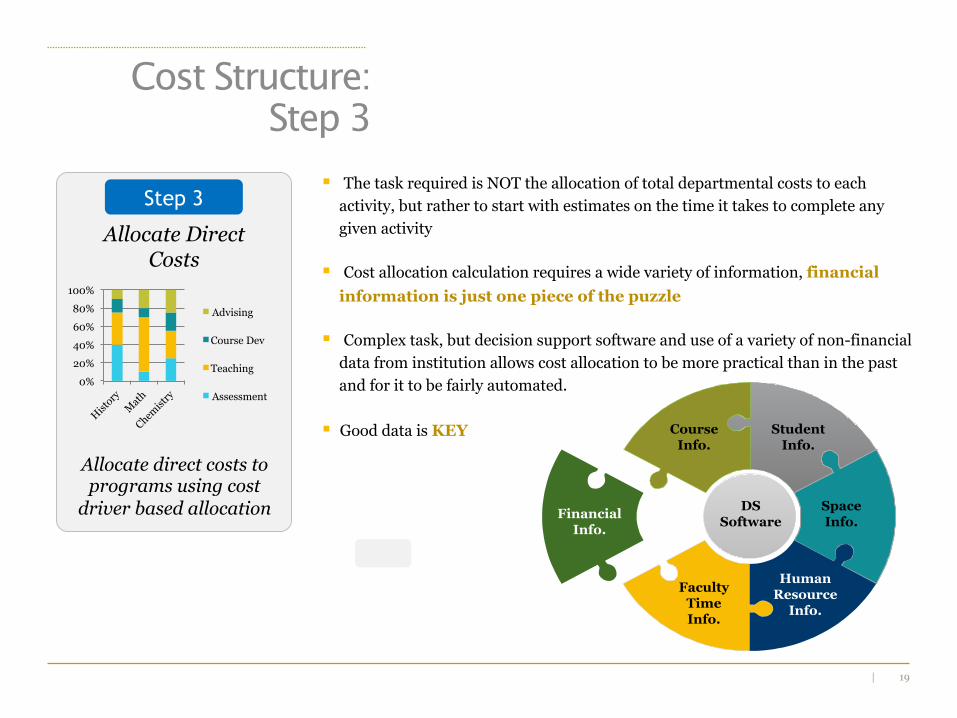
§ The task required is NOT the allocation of total departmental costs to each activity, but rather to start with estimates on the time it takes to complete any given activity
§ Cost allocation calculation requires a wide variety of information, financial information is just one piece of the puzzle
§ Complex task, but decision support software and use of a variety of non-financial data from institution allows cost allocation to be more practical than in the past and for it to be fairly automated.
§ Good data is KEY
Step 3
Allocate direct costs to programs using cost
driver based allocation
Allocate Direct Costs
0% 20% 40% 60% 80%
100%
Advising
Course Dev
Teaching
Assessment
Cost Structure: Step 3
DS Software
Course Info.
Student Info.
Space Info.
Human Resource
Info.
Faculty Time Info.
Financial Info.
20 |
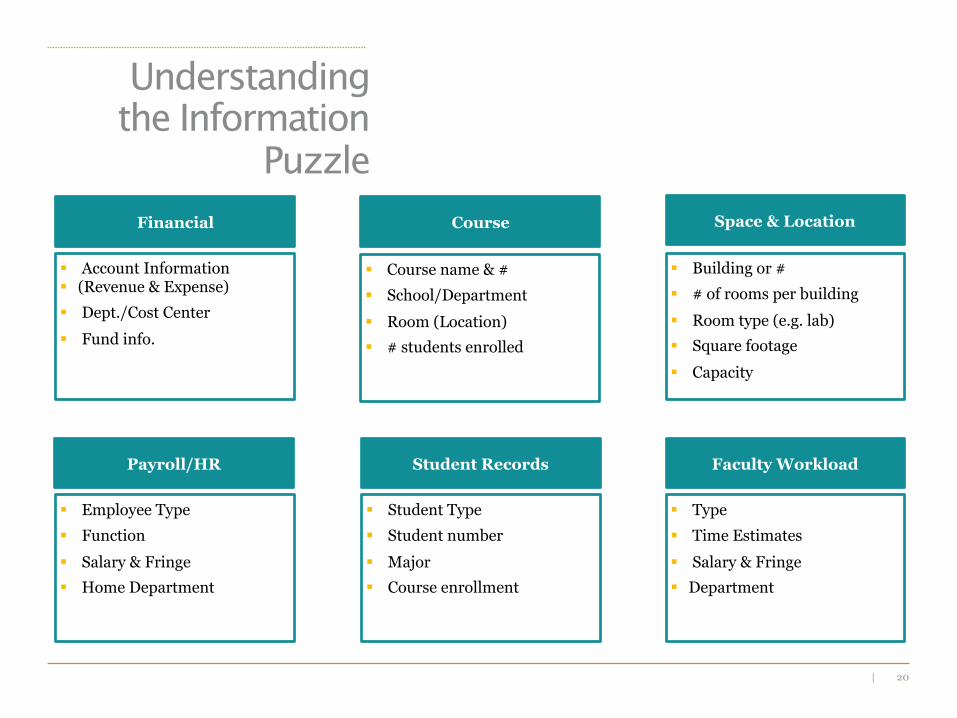
Course
§ Course name & # § School/Department § Room (Location) § # students enrolled
Space & Location
§ Building or # § # of rooms per building § Room type (e.g. lab) § Square footage § Capacity
Payroll/HR
§ Employee Type § Function § Salary & Fringe § Home Department
Student Records
§ Student Type § Student number § Major § Course enrollment
Faculty Workload
§ Type § Time Estimates § Salary & Fringe § Department
Financial
§ Account Information § (Revenue & Expense) § Dept./Cost Center § Fund info.
Understanding the Information
Puzzle
21 |
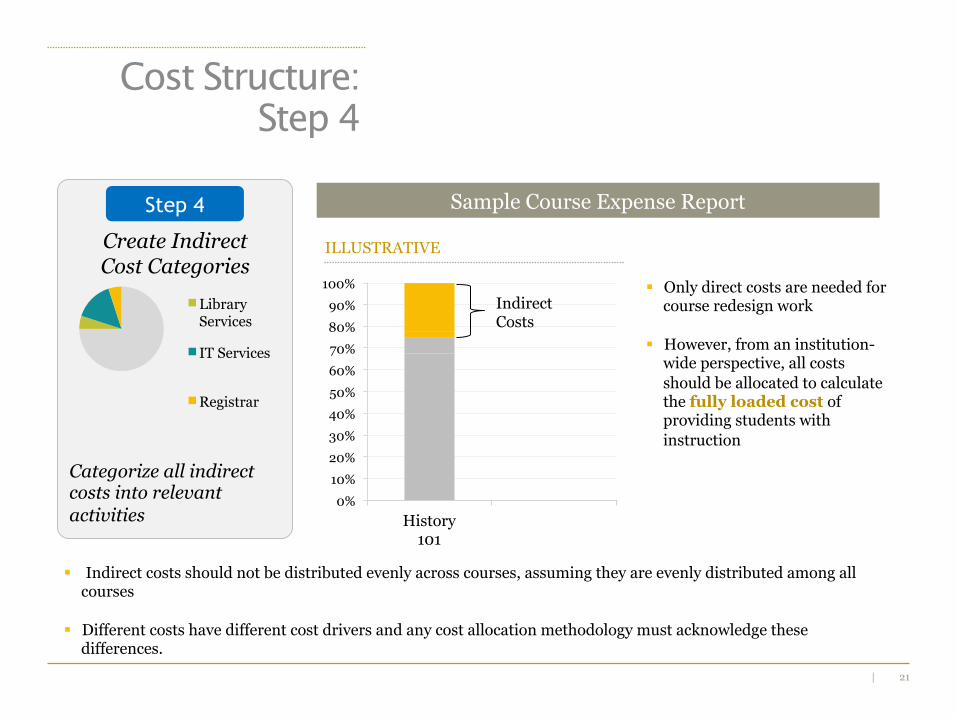
§ Indirect costs should not be distributed evenly across courses, assuming they are evenly distributed among all courses
§ Different costs have different cost drivers and any cost allocation methodology must acknowledge these differences.
Step 4
Categorize all indirect costs into relevant activities
Create Indirect Cost Categories
Library Services
IT Services
Registrar
Cost Structure: Step 4
0% 10% 20% 30% 40% 50% 60% 70% 80% 90%
100%
History 101
Indirect Costs
§ Only direct costs are needed for course redesign work
§ However, from an institution-wide perspective, all costs should be allocated to calculate the fully loaded cost of providing students with instruction
Sample Course Expense Report
ILLUSTRATIVE
22 |
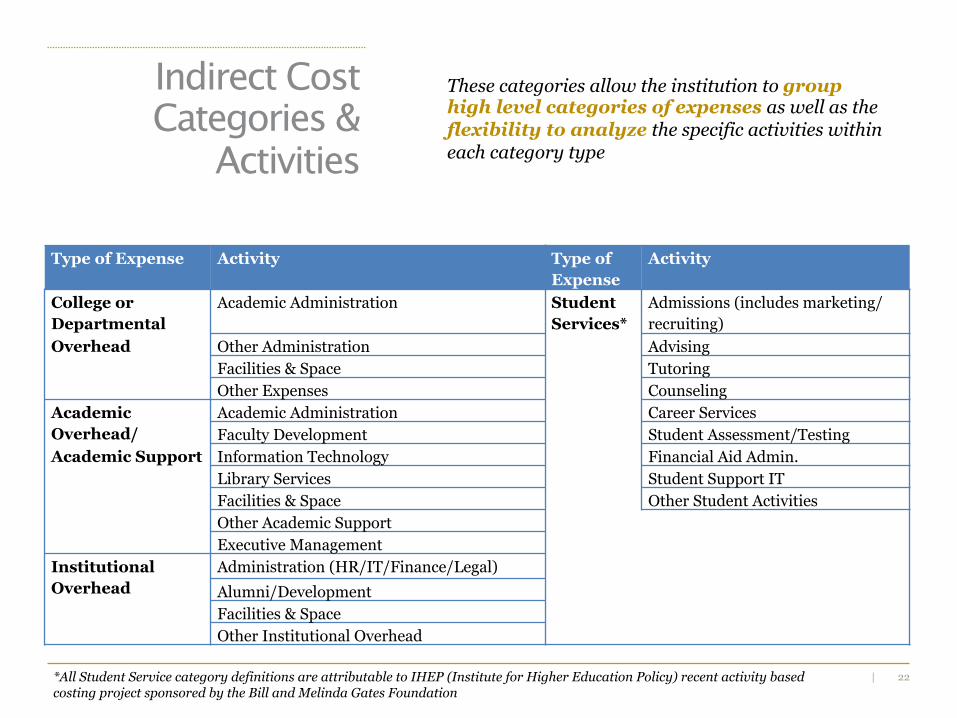
Type of Expense Activity Type of Expense
Activity
College or Departmental Overhead
Academic Administration Student Services*
Admissions (includes marketing/recruiting)
Other Administration Advising Facilities & Space Tutoring Other Expenses Counseling
Academic Overhead/ Academic Support
Academic Administration Career Services Faculty Development Student Assessment/Testing Information Technology Financial Aid Admin. Library Services Student Support IT Facilities & Space Other Student Activities Other Academic Support Executive Management
Institutional Overhead
Administration (HR/IT/Finance/Legal) Alumni/Development Facilities & Space Other Institutional Overhead
*All Student Service category definitions are attributable to IHEP (Institute for Higher Education Policy) recent activity based costing project sponsored by the Bill and Melinda Gates Foundation
These categories allow the institution to group high level categories of expenses as well as the flexibility to analyze the specific activities within each category type
Indirect Cost Categories &
Activities
23 |
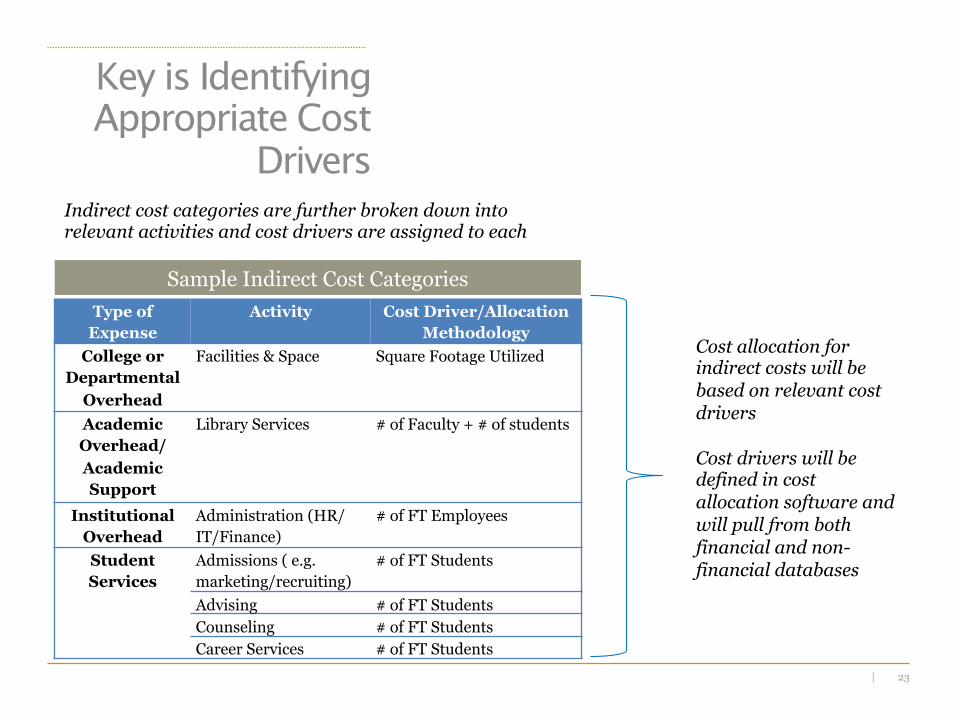
Key is Identifying Appropriate Cost
Drivers
Type of Expense
Activity Cost Driver/Allocation Methodology
College or Departmental
Overhead
Facilities & Space Square Footage Utilized
Academic Overhead/ Academic Support
Library Services # of Faculty + # of students
Institutional Overhead
Administration (HR/IT/Finance)
# of FT Employees
Student Services
Admissions ( e.g. marketing/recruiting)
# of FT Students
Advising # of FT Students Counseling # of FT Students Career Services # of FT Students
Sample Indirect Cost Categories
Cost allocation for indirect costs will be based on relevant cost drivers
Cost drivers will be defined in cost allocation software and will pull from both financial and non-financial databases
Indirect cost categories are further broken down into relevant activities and cost drivers are assigned to each

24 |
Step 5
Allocate indirect costs to programs using cost driver based allocation
Allocate Indirect Costs
0%
20%
40%
60%
80%
100% Library
IT Services
Registrar
§ Indirect cost allocation calculation also requires a wide variety of non-financial information
§ Each category and activity should be analyzed separately and assigned appropriate cost drivers
§ Like direct costs, cost allocation can be a complex task, but decision support software and use of a variety of non financial data from institution allows cost allocation to be done fairly easily and automatically
DS Software
Course Info.
Student Info.
Space Info.
Human Resource
Info.
Faculty Time Info.
Financial Info.
Cost Structure: Step 5
25 |
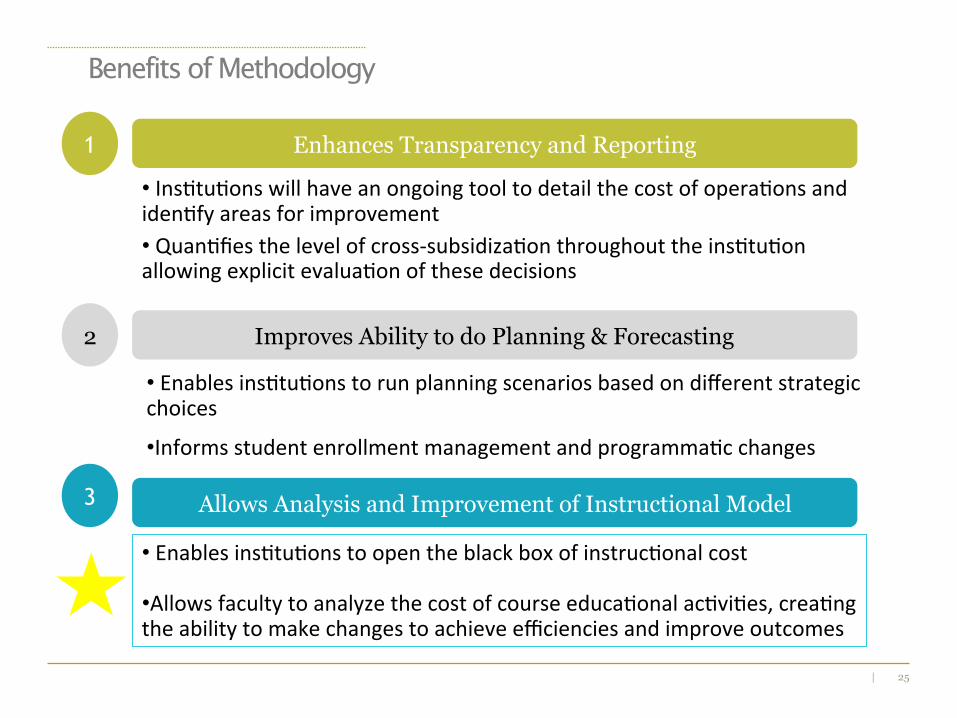
Benefits of Methodology
• Ins-tu-ons will have an ongoing tool to detail the cost of opera-ons and iden-fy areas for improvement • Quan-fies the level of cross-‐subsidiza-on throughout the ins-tu-on allowing explicit evalua-on of these decisions
1
2 Improves Ability to do Planning & Forecasting
Enhances Transparency and Reporting
3 Allows Analysis and Improvement of Instructional Model
• Enables ins-tu-ons to run planning scenarios based on different strategic choices
• Informs student enrollment management and programma-c changes
• Enables ins-tu-ons to open the black box of instruc-onal cost • Allows faculty to analyze the cost of course educa-onal ac-vi-es, crea-ng the ability to make changes to achieve efficiencies and improve outcomes
26 |
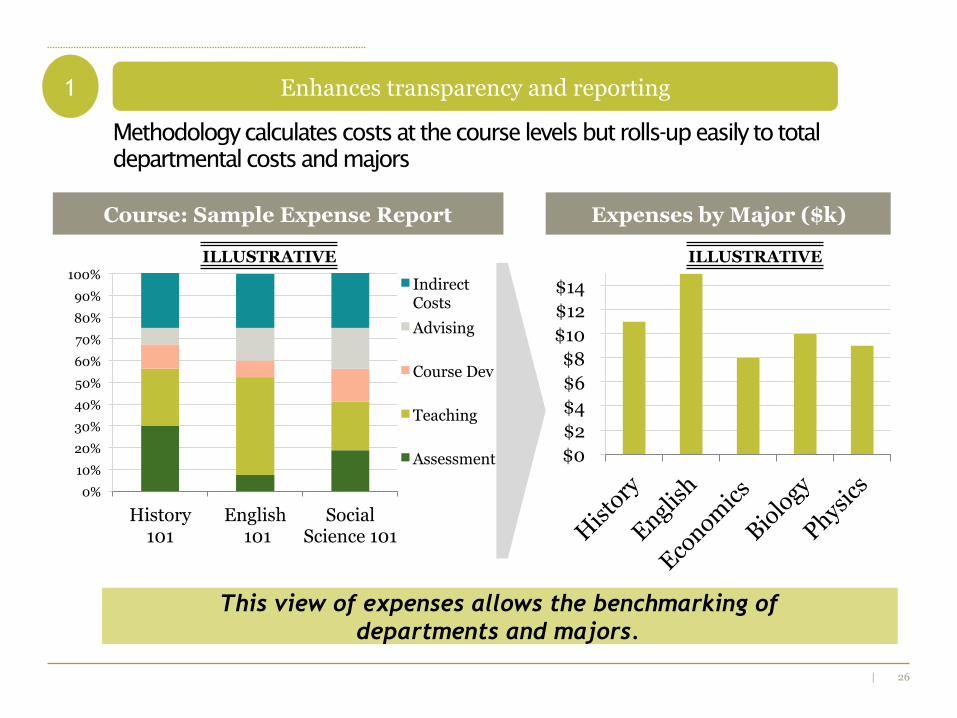
Methodology calculates costs at the course levels but rolls-up easily to total departmental costs and majors
0% 10% 20% 30% 40% 50% 60% 70% 80% 90%
100%
History 101
English 101
Social Science 101
Indirect Costs Advising
Course Dev
Teaching
Assessment
This view of expenses allows the benchmarking of departments and majors.
Course: Sample Expense Report Expenses by Major ($k)
$0 $2 $4 $6 $8
$10 $12 $14
ILLUSTRATIVE ILLUSTRATIVE
1 Enhances transparency and reporting
27 |
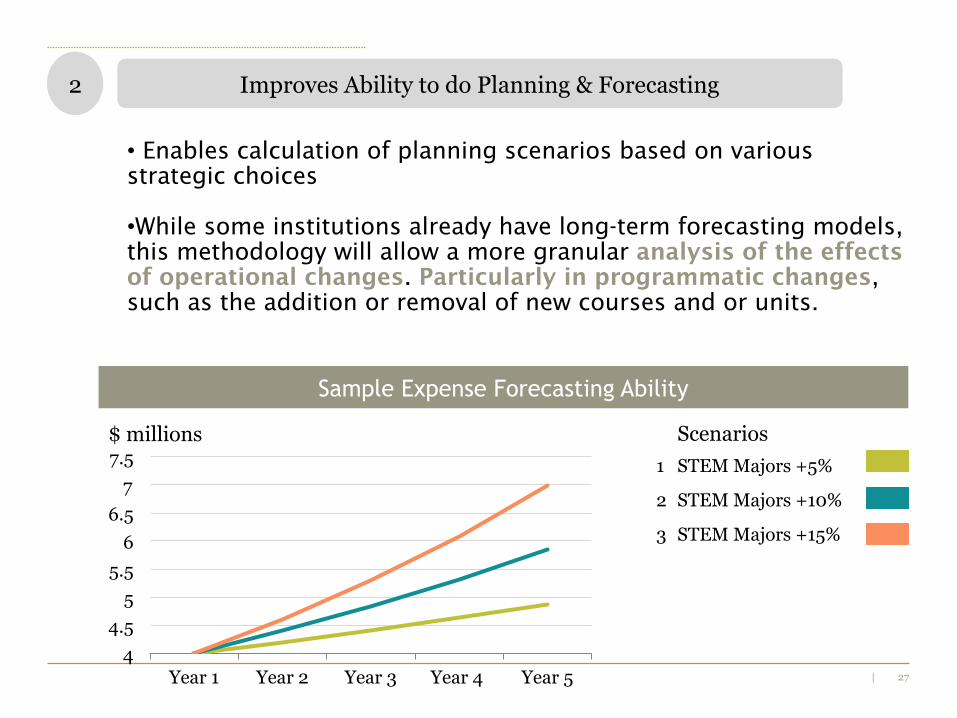
2 Improves Ability to do Planning & Forecasting
• Enables calculation of planning scenarios based on various strategic choices
• While some institutions already have long-term forecasting models, this methodology will allow a more granular analysis of the effects of operational changes. Particularly in programmatic changes, such as the addition or removal of new courses and or units.
Sample Expense Forecasting Ability
4 4.5
5 5.5
6 6.5
7 7.5
Year 1 Year 2 Year 3 Year 4 Year 5
Scenarios 1 STEM Majors +5%
2 STEM Majors +10%
3 STEM Majors +15%
$ millions
28 |
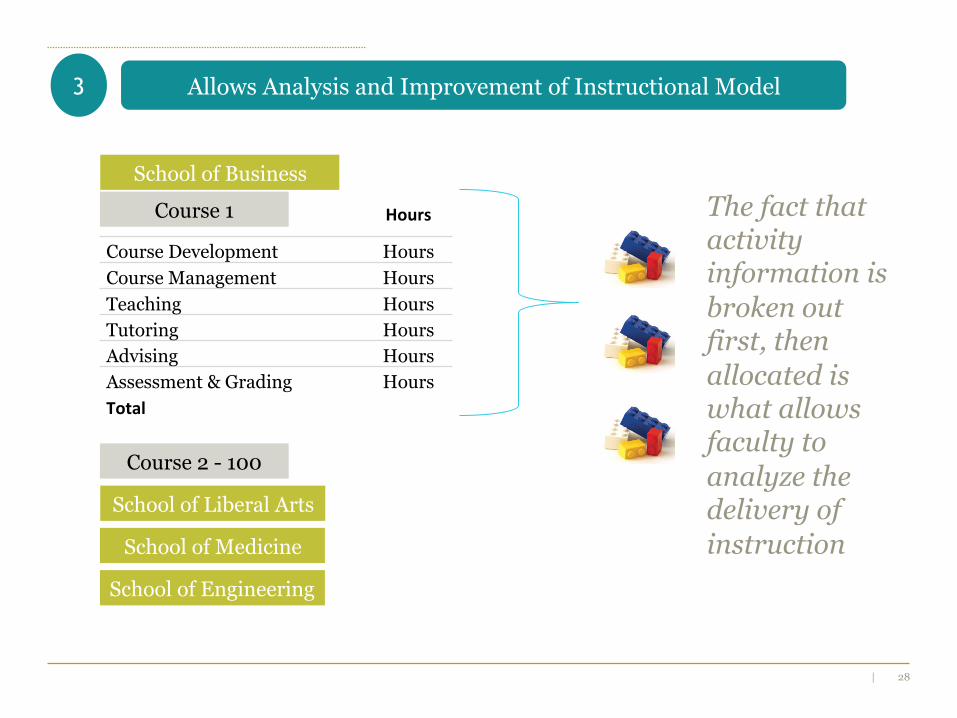
Hours
Course Development Hours Course Management Hours Teaching Hours Tutoring Hours Advising Hours Assessment & Grading Hours Total
Course 1
School of Business
School of Liberal Arts
Course 2 - 100
School of Medicine
School of Engineering
The fact that activity information is broken out first, then allocated is what allows faculty to analyze the delivery of instruction
3 Allows Analysis and Improvement of Instructional Model
29 |
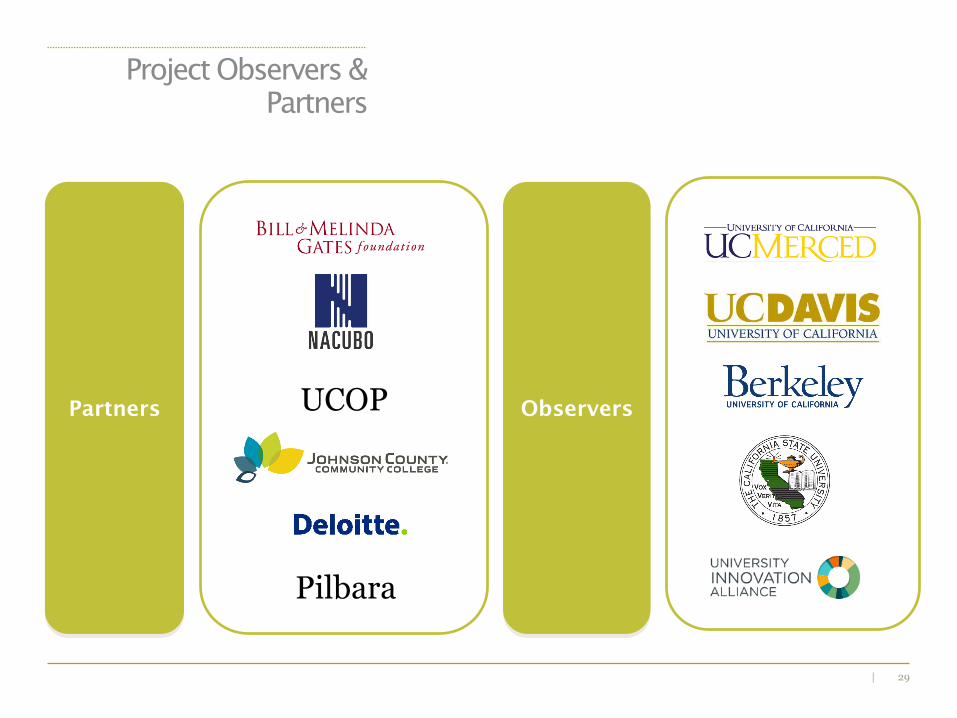
Project Observers & Partners
Partners Observers Partners UCOP Partners
Pilbara