abbot point growth gateway project - dsdmip.qld.gov.au · abbot point growth gateway project...
TRANSCRIPT
Abbot Point Growth Gateway Project Environmental Impact Statement Page
Volume 4 – Supplement Report
Abbot Point Growth Gateway Project Environmental Impact Statement
Volume 4 – Supplement Report
26 October 2015
Disclaimer This report has been prepared on behalf of and for the exclusive use of the Queensland Department of State Development, and is subject to and issued in accordance with the agreement between the Queensland Department of State Development and Advisian. Advisian accepts no liability or responsibility whatsoever for it in respect of any use of or reliance upon this report by any third party.
Copying this report without the permission of the Queensland Department of State Development, or Advisian is not permitted.
Abbot Point Growth Gateway Project Environmental Impact Statement Page i
Volume 4 – Supplement Report
Table of Contents
1 Introduction 1
2 Consultation on the Draft Environmental Impact Statement 3
2.1 Consultation approach 3
2.2 Methods of communication 3
2.3 Consultation and engagement 5
2.4 Avenues for feedback 8
2.5 Publicity 9
3 Analysis of Submissions 12
3.1 Common submission themes 12
4 Responses to Submissions 17
4.1 Responses to common comments 17
4.1.1 Project features 17
4.1.2 Environmental impact assessment 24
4.1.3 Good governance 63
4.2 Responses to campaign submissions 64
5 Project Refinement 76
5.1 Changes to the Project 76
5.2 Offsets strategy 76
5.3 Additional assessment and information 78
5.4 Editorial corrections 78
6 Conclusion 80
7 References 81
Abbot Point Growth Gateway Project Environmental Impact Statement Page ii
Volume 4 – Supplement Report
List of Figures Figure 2-1 Consultation statistics 5
Figure 2-2 Bowen information session advertisement 7
Figure 2-3 Public exhibition newspaper announcement 10
Figure 4-1 TSS 95th percentile – 2007 dry season 30
Figure 4-2 TSS 80th percentile – 2007 dry season 31
Figure 4-3 TSS 50th percentile – 2007 dry season 32
Figure 4-4 Location of plume modelling time series extraction points 33
Figure 4-5 Sampling locations of interest 37
Figure 4-6 Locations of plume modelling time series extraction points 41
Figure 4-7 Time series data for TSS, sedimentation and net bed thickness at time series site in the apron area (D01) 42
Figure 4-8 Proposed buffer area 55
List of Tables Table 1-1 Structure of the Supplement Report 2
Table 3-1 Overview of key issues raised in submissions 14
Table 4-1 Sediment characterisation locations and sediment characteristics - T0 apron footprint 38
Table 4-2 Summary of groundwater levels 49
Table 4-3 Summary of campaign letters and generic submissions 66
Appendices
Detailed Submission Responses Appendix A
Campaign Submissions Appendix B
Technical Responses to Selected Submissions Appendix C
Technical Memorandum – ASS Testing of Historical Offshore Samples Appendix D
Dredged Material Containment Ponds Engineering Risk Analysis Appendix E
Offset/Net Benefit Strategy Appendix F
Greenhouse Gas Advice Reports Appendix G
Abbot Point Growth Gateway Project Environmental Impact Statement Page iii
Volume 4 – Supplement Report
Executive Summary The Queensland Department of State Development is proposing the Abbot Point Growth Gateway Project (the Project) to develop infrastructure to expand the export capacity of the Port of Abbot Point. This will involve capital dredging of approximately 1.1Mm3 in situ volume of previously undisturbed seabed for new berth pockets and ship apron areas required to support the development of Terminal 0. Onshore Dredged Material Containment Ponds (DMCPs) will be constructed within an area previously allocated for the development of Terminal 2 and adjoining industrial land. Dredged material is proposed to be relocated to the DMCP via temporary pipelines.
This report is a Supplement to the draft Environmental Impact Statement (EIS) prepared for the Project, which addressed the Guidelines for an Environmental Impact Statement to Undertake Capital Dredging, Onshore Placement and Reuse of Dredged Material at Abbot Point provided by the Australian Department of Environment. In so doing, the EIS assesses the environmental impacts of the Project and particularly the potential for the Project to impact on the controlling provisions around Matters of National Environmental Significance.
This report has been prepared in response to comments on the draft EIS received from the public and Advice Agencies to the Australian Department of Environment. This Supplement now forms Volume 4 of the overall EIS, and should be read in conjunction with the draft EIS Volumes 1 to 3 to be collectively regarded as the final EIS.
The draft EIS (comprising three volumes) for the Project was lodged with the Australian Department of Environment on 6 August 2015, and was made available for public comment between 21 August and 18 September 2015. Stakeholders were provided with various opportunities to engage on the draft EIS, and promotions for the consultation period exceeded those prescribed in the Environment Protection and Biodiversity Conservation Act 1999. Copies of draft EIS documentation were made available for public review on the web, as well as in hardcopy at various public locations. Key stakeholders were also afforded the opportunity to attend tailored briefing sessions and ask questions relevant to their area of interest. This process aimed to optimise feedback on the Project and ensure the draft EIS documentation was easily accessible by local, State and national stakeholders as well as community members.
During the consultation period, a total of 55,127 submissions were received by the Queensland Department of State Development. This included 52,497 submissions received prior to the closing date of submissions (18 September). DSD allowed further submissions to be lodged until midnight on 20 September 2015, which were considered in this report. Many of the submissions received on the draft EIS were ‘campaign’ style submissions.
Analysis of the submissions received revealed a number of common issues and ‘themes’, including:
Questions around the viability and need for the Project, i.e. that the Project is being developed to support a perceived unnecessary increase in port capacity given current latent capacity and the economic uncertainty of coal mining projects in the Galilee Basin
A perception that alternatives to the Project have not been adequately considered Questions around the overall sustainability of the Project, in that it supports further
development of non-renewable coal resources which result in greenhouse gas emissions due to coal combustion leading to climate change impacts to the Great Barrier Reef
Abbot Point Growth Gateway Project Environmental Impact Statement Page iv
Volume 4 – Supplement Report
Concern regarding the unlined bases of the proposed DMCPs and the risk of potential leakage to the adjacent Caley Valley Wetlands
The timing of construction and dredging activities, and how these align with seasonal ecological functions – e.g. coral spawning and bird migration
The potential impacts on the Great Barrier Reef of longer-term increases in shipping associated with related projects
Potential impacts on the existing fishing and tourism industries The consideration of the total cumulative and consequential impacts of the Project The spatial extent of dredging sediment plumes and associated impacts The assessment of nearby coral reefs and impacts associated with the sediment plume The basis of fauna assessments and the nature and duration of surveys undertaken for
birds and marine species Potential impacts on the adjacent Caley Valley Wetlands The potential for disturbance of and contamination by Acid Sulfate Soils Management of stormwater and potential for overflow from the DMCPs, particularly
during severe weather events Questions around groundwater, including around flow rates, salinity and mounding The period of time allowed for comments on the draft EIS The perceived conflict of interest associated with the Queensland Government being both
the Proponent and assessor for the Project The level of detail of management plans submitted as part of the draft EIS.
In response to many of the above common topics, the Proponent refers the reader back to relevant sections of the existing EIS which directly address issues. In other cases, this Supplement Report provides more detailed articulation or clarification around some of the technical issues discussed. Further detail has been provided in relation to, for example, the recovery of seagrasses post-dredging and the offset / net benefit strategy proposed for the Project. Clarification has also been provided in relation to methodologies applied for the assessment of groundwater impacts, cumulative and consequential impacts, and the survey methods applied for assessment for fauna species, both marine and terrestrial. Information around the protection of the Caley Valley Wetlands and migratory bird species has also been further articulated.
This Supplement Report also provides direct responses to substantive submissions received in table format to facilitate ease of use by readers. A number of broader issues, beyond the scope of the Project and the EIS have been raised in submissions. The Proponent is unable to provide definitive discussion on these subjective matters.
The information contained in the Abbot Point Growth Gateway Project’s final EIS will now be considered by the Australian Government’s Minister for the Environment in making its decision on whether to ‘approve’, ‘approve with conditions’ or ‘not approve’ the Project.
Abbot Point Growth Gateway Project Environmental Impact Statement Page v
Volume 4 – Supplement Report
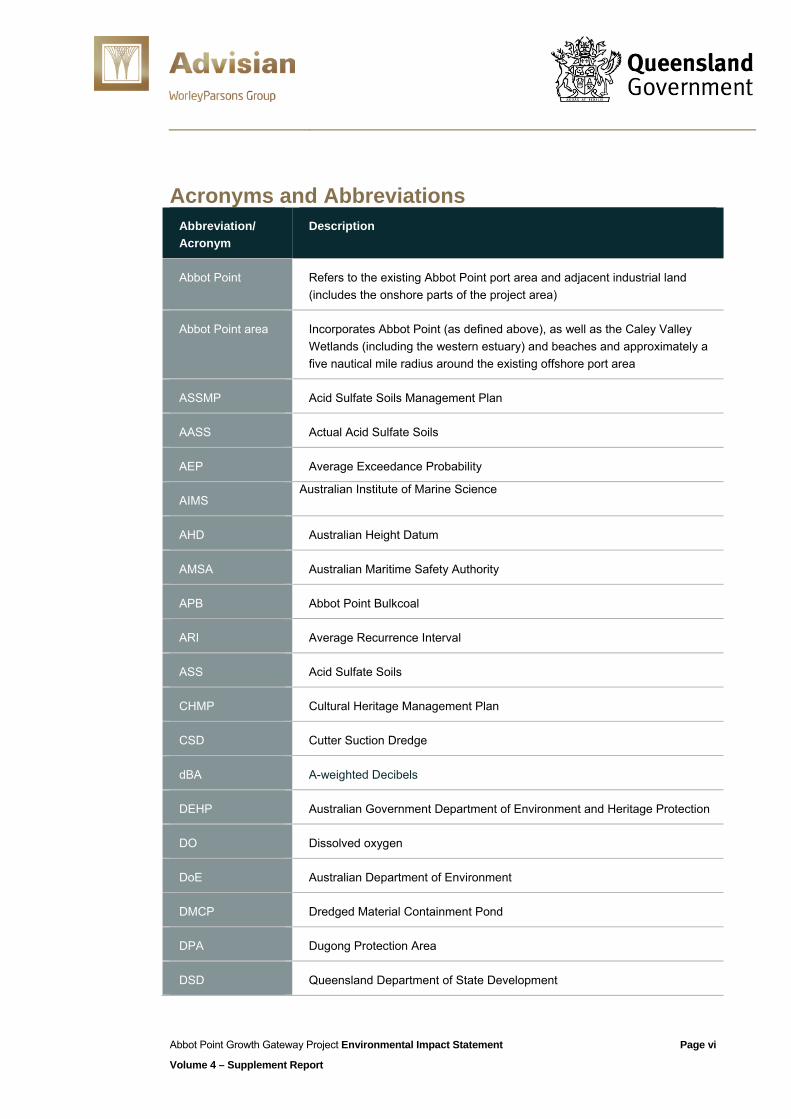
Acronyms and Abbreviations Abbreviation/ Acronym
Description
Abbot Point Refers to the existing Abbot Point port area and adjacent industrial land (includes the onshore parts of the project area)
Abbot Point area Incorporates Abbot Point (as defined above), as well as the Caley Valley Wetlands (including the western estuary) and beaches and approximately a five nautical mile radius around the existing offshore port area
ASSMP Acid Sulfate Soils Management Plan
AASS Actual Acid Sulfate Soils
AEP Average Exceedance Probability
AIMS Australian Institute of Marine Science
AHD Australian Height Datum
AMSA Australian Maritime Safety Authority
APB Abbot Point Bulkcoal
ARI Average Recurrence Interval
ASS Acid Sulfate Soils
CHMP Cultural Heritage Management Plan
CSD Cutter Suction Dredge
dBA A-weighted Decibels
DEHP Australian Government Department of Environment and Heritage Protection
DO Dissolved oxygen
DoE Australian Department of Environment
DMCP Dredged Material Containment Pond
DPA Dugong Protection Area
DSD Queensland Department of State Development
Abbot Point Growth Gateway Project Environmental Impact Statement Page vi
Volume 4 – Supplement Report

Abbreviation/ Acronym
Description
EIS Environmental Impact Statement
ELA EcoLogical Australia
EMP Environmental Management Plan
EPBC Act Environment Protection and Biodiversity Conservation Act 1999
GBR Great Barrier Reef
GBRMP Great Barrier Reef Marine Park
GBRMPA Great Barrier Reef Marine Park Authority
GBRWHA Great Barrier Reef World Heritage Area
GHG Greenhouse gases
HCIPL Hancock Coal Infrastructure Pty Ltd.
ILUA Indigenous Land Use Agreement
JEL Juru Enterprises Limited
ha Hectares
LAmax A-weighted, Maximum Sound Level
LAT Lowest Astronomical Tide
mbTOC Meters below top of casing
mg/L Milligrams per litre
Mm3 Million cubic metres
MOF Materials Offload Facility
MSQ Marine Safety Queensland
Mtpa Million tonnes per annum
NGBR North Galilee Basin Rail
Abbot Point Growth Gateway Project Environmental Impact Statement Page vii
Volume 4 – Supplement Report
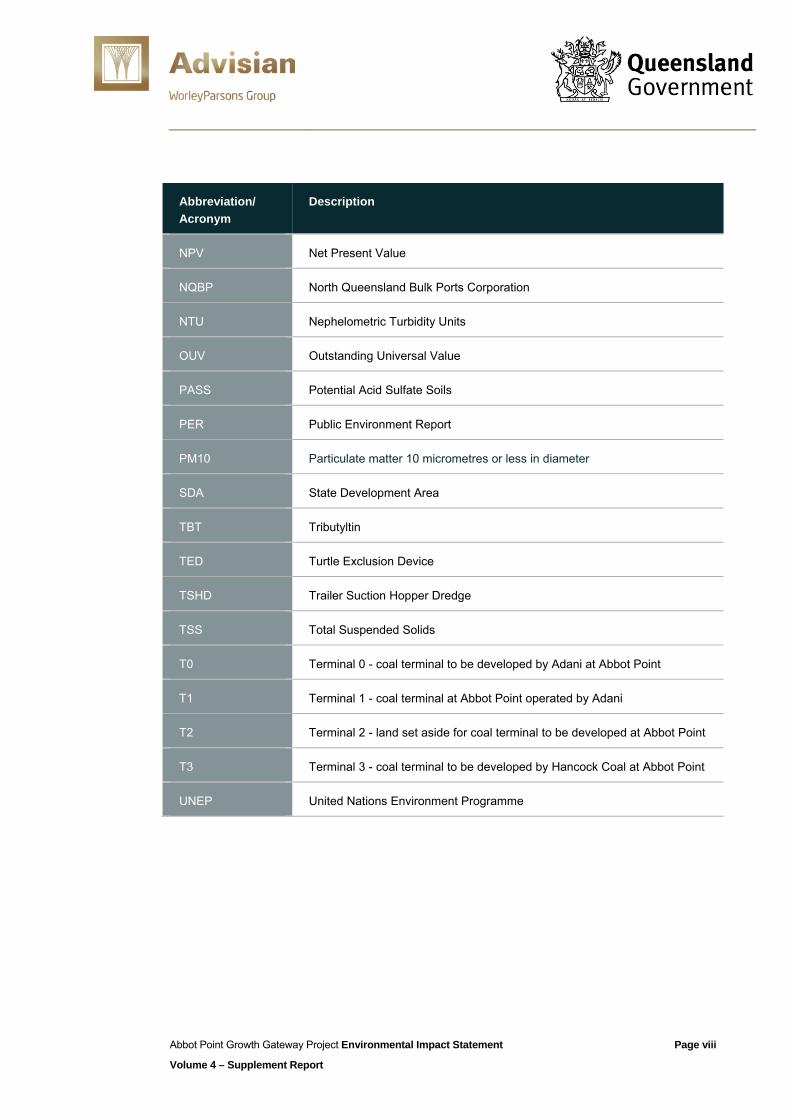
Abbreviation/ Acronym
Description
NPV Net Present Value
NQBP North Queensland Bulk Ports Corporation
NTU Nephelometric Turbidity Units
OUV Outstanding Universal Value
PASS Potential Acid Sulfate Soils
PER Public Environment Report
PM10 Particulate matter 10 micrometres or less in diameter
SDA State Development Area
TBT Tributyltin
TED Turtle Exclusion Device
TSHD Trailer Suction Hopper Dredge
TSS Total Suspended Solids
T0 Terminal 0 - coal terminal to be developed by Adani at Abbot Point
T1 Terminal 1 - coal terminal at Abbot Point operated by Adani
T2 Terminal 2 - land set aside for coal terminal to be developed at Abbot Point
T3 Terminal 3 - coal terminal to be developed by Hancock Coal at Abbot Point
UNEP United Nations Environment Programme
Abbot Point Growth Gateway Project Environmental Impact Statement Page viii
Volume 4 – Supplement Report
Section 1 Introduction
1 Introduction
The Abbot Point Growth Gateway Project (the Project) will develop infrastructure to support development to expand the export capacity of the Port of Abbot Point.
The Project involves:
Construction of an onshore Dredged Material Containment Pond (DMCP) within the area previously allocated for the development of Terminal 2 (T2) and adjoining industrial land
Capital dredging of approximately 1.1 million m3 (Mm3) in situ volume of previously undisturbed seabed for new berth pockets and ship apron areas required to support the development of Terminal 0 (T0)
Relocation of the dredged material to the DMCP and offshore discharge of return water via temporary pipelines
Ongoing management of the dredged material including its removal, treatment, and beneficial reuse within the port area and the State Development Area (SDA), where appropriate.
This report is a Supplement to the Environmental Impact Statement (EIS) for the Project, which was prepared to address the Guidelines for an Environmental Impact Statement to Undertake Capital Dredging, Onshore Placement and Reuse of Dredged Material at Abbot Point (EIS Guidelines) provided by the Australian Department of Environment (DoE) for the Project, and in doing so assess the environmental impacts of the Project and particularly the potential for the Project to impact on the controlling provisions around Matters of National Environmental Significance (MNES).
The draft EIS (comprising Volumes 1, 2 and 3) for the Project was lodged with the DoE on 6 August 2015 and was made available for public comment between 21 August and 18 September 2015.
In total, 55,127 submissions were received by the Queensland Department of State Development (DSD) during the public comment period. This includes 52,497 submissions received prior to the closing date of submissions (18 September). DSD allowed further submissions to be lodged until midnight on 20 September 2015.
This report has been prepared in response to public submissions and comments made by Advice Agencies to DoE. This Supplement now forms Volume 4 of the overall EIS, and should be read in conjunction with the draft EIS Volumes 1 to 3 to be collectively regarded as the final EIS.
Information in this Supplement supersedes any overlapping information provided in the initial release of the draft EIS (i.e. contained in Volumes 1 to 3) as it outlines changes, clarifications and updated information on the Project.
This Supplement is to provide the Australian Minister for the Environment (the Minister) with details of the issues raised in public comments, responses to these by the Proponent (i.e. DSD), and updated information on the Project on offsets and Acid Sulfate Soils (ASS).
Abbot Point Growth Gateway Project Environmental Impact Statement Page 1 Volume 4 – Supplement Report
Section 1 Introduction
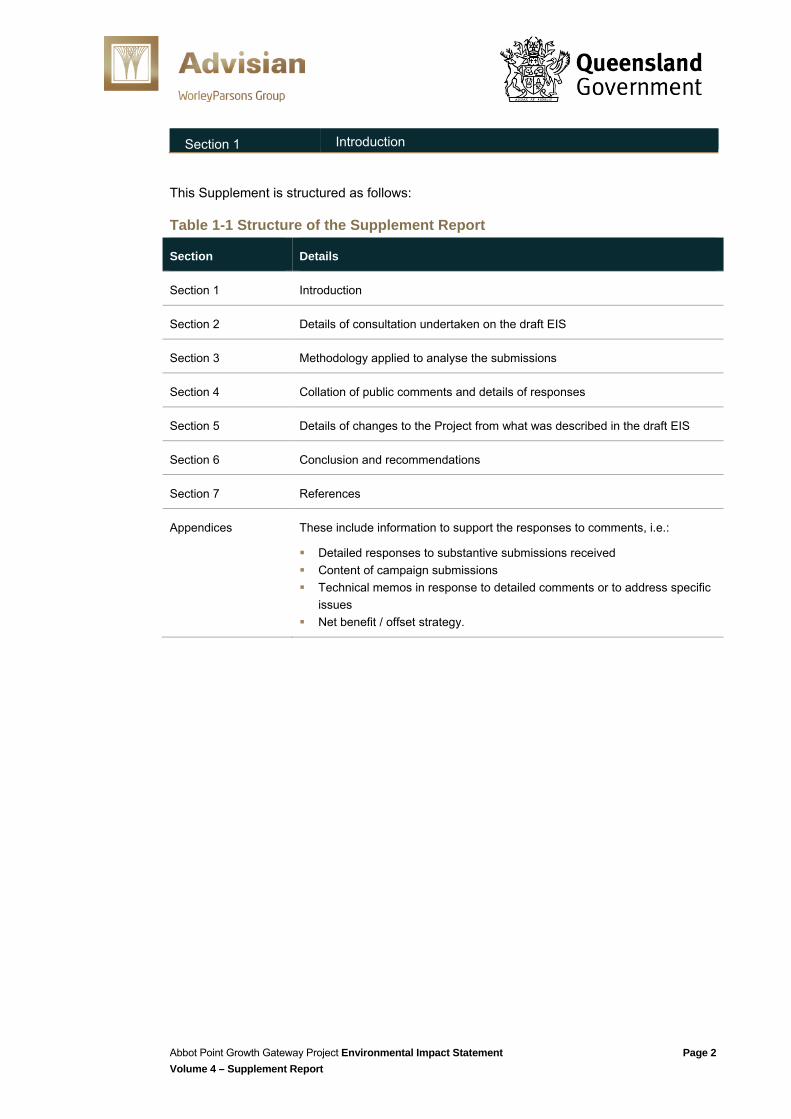
This Supplement is structured as follows:
Table 1-1 Structure of the Supplement Report
Section Details
Section 1 Introduction
Section 2 Details of consultation undertaken on the draft EIS
Section 3 Methodology applied to analyse the submissions
Section 4 Collation of public comments and details of responses
Section 5 Details of changes to the Project from what was described in the draft EIS
Section 6 Conclusion and recommendations
Section 7 References
Appendices These include information to support the responses to comments, i.e.:
Detailed responses to substantive submissions received Content of campaign submissions Technical memos in response to detailed comments or to address specific
issues Net benefit / offset strategy.
Abbot Point Growth Gateway Project Environmental Impact Statement Page 2 Volume 4 – Supplement Report
Section 2 Consultation on the Draft Environmental Impact Statement
2 Consultation on the Draft Environmental Impact Statement
The following section outlines the consultation process undertaken by DSD. This includes the approach taken, methods of consultation, opportunities for feedback, and means by which the Project was publicised.
2.1 Consultation approach In accordance with the Environment Protection and Biodiversity Conservation Act 1999 (EPBC Act) public consultation for the Abbot Point Growth Gateway Project commenced on Thursday 20 August 2015, with the consultation period beginning on Friday 21 August and closing on 18 September 2015. Further to the official consultation period, all submissions received by the project team up until midnight on Sunday 20 September 2015 were accepted as part of the consultation process.
As detailed below, promotions for the consultation period exceeded the requirements prescribed in the EPBC Act. Access to the project team and the draft EIS documentation also went beyond EPBC Act requirements. In particular, briefings for key groups were undertaken where possible to provide tailored and detailed information on the Project. This aimed to optimise feedback on the Project and ensure the draft EIS documentation was easily accessible by local, State and national stakeholders as well as community members.
Consistent with the requirements of the EPBC Act, DSD provided clear advice on the Department’s website and in public notices that comments on the draft EIS could only be considered if provided in writing.
2.2 Methods of communication A range of consultation methods were used to achieve extensive public consultation on what can be considered very complex studies and documentation. The approach applied is consistent with the process prescribed in the EPBC Act. Tools and methods used to facilitate consultation include those outlined below.
Viewing locations for the draft Environmental Impact Statement As per the requirements under the EPBC Act, hard copies of the draft EIS were on display at:
Mackay City Library, Gordon Street, Mackay State Library of Queensland, Cultural Precinct, Stanley Place, South Bank.
In addition, the documents were also provided at the following locations to make it easier for communities to view project information and provide feedback:
Whitsunday Regional Council Library, Herbert Street, Bowen Townsville City Council Library, Flinders Street, Townsville.
A number of copies of the draft EIS were posted to key stakeholders on request.
Abbot Point Growth Gateway Project Environmental Impact Statement Page 3 Volume 4 – Supplement Report
Section 2 Consultation on the Draft Environmental Impact Statement
Department of State Development website
During and in the lead-up to consultation, DSD’s website featured an area dedicated to the Project: www.dsd.qld.gov.au/abbotpoint. This website was a key source of information and provided several feedback options for the Project. Details of the website were consistently advertised in all public notices and project promotions.
From 20 August to 18 September 2015, the webpage hosting the draft EIS documentation received over 3,700 visitors. Over the same period DSD’s homepage, which prominently featured an invitation to comment on the Project, received approximately 7,200 visitors.
The website included the following functions:
Draft EIS: All volumes and appendices of the EIS were available for download from a single webpage. A phone number was also provided for people with special communication needs.
Information regarding State-regulated matters: In addition to the draft EIS, key technical studies and impact assessment reports addressing State-regulated matters relevant to development at the Abbot Point SDA were available for review from 24 August 2015.
Supporting information: The website contained general information regarding the expansion of the port and the Project. This included information about the Great Barrier Reef (GBR) and the port’s development, frequently asked questions and an option to subscribe to project updates. In total, these supporting pages received approximately 4,700 visitors (or approximately 8,400 including visitor numbers for the page hosting the draft EIS documentation).
Online feedback form: An online form was made available via the website. This form was able to be filled out online and submitted instantly. It also included the option to upload supporting documents.
Feedback form: A feedback form was provided in MS Word format for those that preferred this format.
Email address: The dedicated project email address was also promoted on the site as a channel for providing feedback.
Alternative access options: The website listed the library locations where the draft EIS was on display and available to members of the public.
Direct email to the project subscriber database
A direct email was sent to all interested persons who had subscribed to project updates (188 people) via the project website. This email advised that the draft EIS was available, where information could be accessed and how submissions could be provided.
Social media A dedicated Twitter account (@abbotpoint) was launched on 14 May 2015 to drive awareness of the Project and establish an online community in the lead up to the consultation period.
The twitter account was used to reach new audiences and enhance communications with community members. The twitter channel was used to promote the consultation period, encourage feedback, direct stakeholders to the draft EIS documentation and provide access to project information.
Abbot Point Growth Gateway Project Environmental Impact Statement Page 4 Volume 4 – Supplement Report

Section 2 Consultation on the Draft Environmental Impact Statement
As of 9 October 2015, the Abbot Point twitter account has:
Provided 111 tweets @abbotpoint to a potential audience of 89,239 people/organisations. Received 1,271 interactions from people and organisations that retweeted, or ‘favorited’
the abbot point account and messaging Received over 239 retweets, including from international media, Queensland Resources
Council, Minerals Council Australia and various industry and economic groups Directed over 255 people to the project website for further information.
Figure 2-1 demonstrates that DSD provided information on almost a daily basis through the twitter account, and the retweets and engagement from the online community.
Figure 2-1 Consultation statistics
2.3 Consultation and engagement As part of the DSD’s commitment to consultation, a number of briefings were offered to key stakeholders. The intent of these briefings was to provide opportunities for stakeholder groups to access the project team and ask questions regarding the draft EIS to inform their submissions.
At these events (with the exception of the launch) the Project Director and technical experts typically presented information about the Project for approximately 30 minutes, and then responded to questions for approximately 40 minutes. At most information sessions, representatives from DoE and North Queensland Bulk Ports Corporation (NQBP) were also in attendance to answer questions. The Project Director encouraged attendees to provide feedback on the Project, highlighted the available avenues for providing submissions and provided hard copies of the MS Word feedback forms.
Abbot Point Growth Gateway Project Environmental Impact Statement Page 5 Volume 4 – Supplement Report
Section 2 Consultation on the Draft Environmental Impact Statement
Consultation launch Thursday 20 August 2015
The Minister for State Development, Dr Anthony Lynham, launched the EIS consultation period with a tour of the port and a business function with community and business stakeholders. Representatives of the media attended this event, resulting in significant coverage for the launch of the draft EIS.
Key stakeholders involved in this event included:
Bowen Collinsville Enterprise Inc. Bowen Tourism Local business representatives North Queensland Bulk Ports Representatives of the Juru People Whitsunday Marketing and Development Whitsunday Regional Council.
Conservation group information session Friday 28 August 2015
This briefing was held in Brisbane with teleconference facilities available. The following conservation groups were invited to attend:
Alliance to Save Hinchinbrook Australian Conservation Foundation Australian Marine Conservation Society Birdlife Capricornia Gladstone Conservation Council Greenpeace Mackay Conservation Group North Queensland Conservation Council Protect the Bush Alliance Queensland Conservation Council WetlandCare Wildlife Queensland WWF.
The information session was attended by representatives of:
Mackay Conservation Group Protect the Bush Alliance WWF.
Representatives from DoE and NQBP also attended.
Bowen community information session Friday 4 September 2015
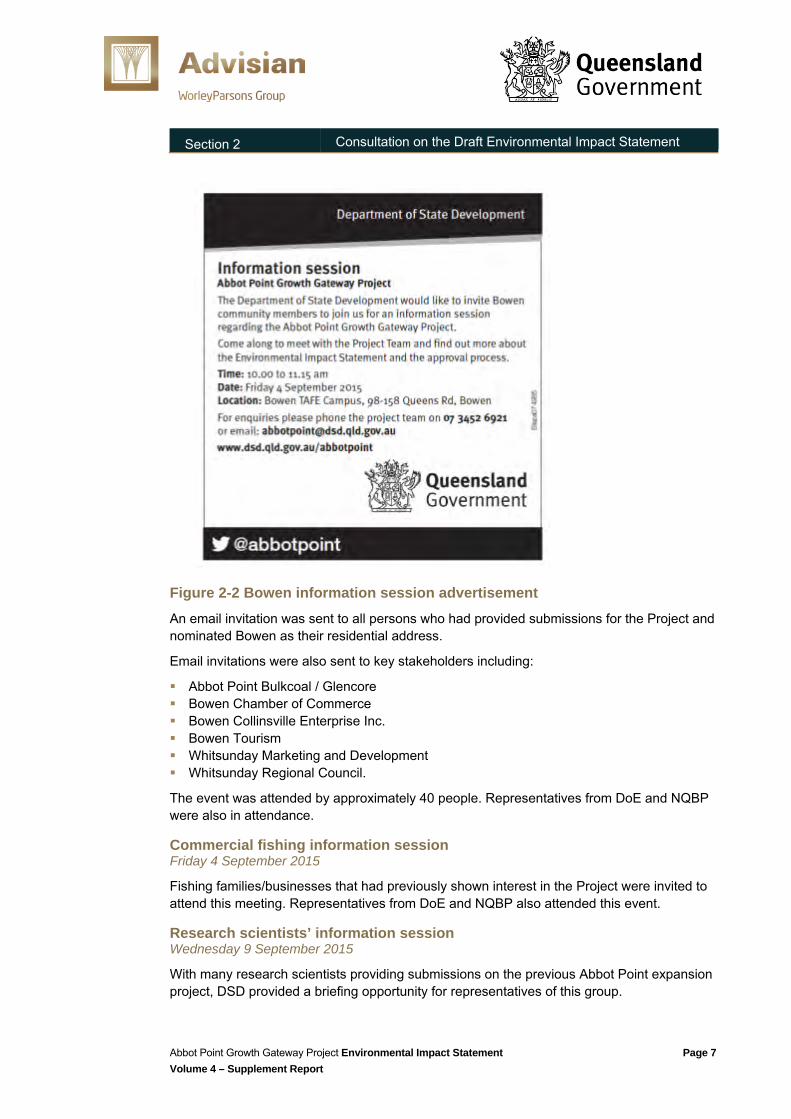
A public notice was placed in the Bowen Independent newspaper on Wednesday 2 September 2015 inviting members of the community to attend the information session in Bowen (Figure 2-2).
Abbot Point Growth Gateway Project Environmental Impact Statement Page 6 Volume 4 – Supplement Report
Section 2 Consultation on the Draft Environmental Impact Statement
Figure 2-2 Bowen information session advertisement
An email invitation was sent to all persons who had provided submissions for the Project and nominated Bowen as their residential address.
Email invitations were also sent to key stakeholders including:
Abbot Point Bulkcoal / Glencore Bowen Chamber of Commerce Bowen Collinsville Enterprise Inc. Bowen Tourism Whitsunday Marketing and Development Whitsunday Regional Council.
The event was attended by approximately 40 people. Representatives from DoE and NQBP were also in attendance.
Commercial fishing information session Friday 4 September 2015
Fishing families/businesses that had previously shown interest in the Project were invited to attend this meeting. Representatives from DoE and NQBP also attended this event.
Research scientists’ information session Wednesday 9 September 2015
With many research scientists providing submissions on the previous Abbot Point expansion project, DSD provided a briefing opportunity for representatives of this group.
Abbot Point Growth Gateway Project Environmental Impact Statement Page 7 Volume 4 – Supplement Report
Section 2 Consultation on the Draft Environmental Impact Statement
An information session was organised in Townsville, with teleconferencing and videoconferencing facilities made available.
Representatives from the following institutions were invited:
The Australia Institute The Australian National University Birdlife Australia James Cook University The University of New South Wales University of Queensland
Of these invitees, one representative confirmed their interest in attending the briefing session. As such, the session was cancelled, with the responder invited to a later session.
Townsville economic and business information session Wednesday 9 September 2015
This information session provided an opportunity for local councils and industry peak bodies to access further information on the Project, including economic impacts and potential supply chain opportunities. The following organisations were in attendance:
Burdekin Shire Council Townsville Chamber of Commerce AusIndustry.
Information presented in the meeting was subsequently provided to the Townsville City Council. Representatives from NQBP and the Great Barrier Reef Marine Park Authority (GBRMPA) also attended this event.
Information sessions with the Juru People Wednesday 16 September 2015
Representatives of the Juru People were invited to attend tailored information sessions. Meetings with the Juru People were held in Bowen and Townsville. A representative from NQBP also attended these sessions.
2.4 Avenues for feedback Get involved Queensland Get Involved is the Queensland Government’s online consultation hub: www.getinvolved.qld.gov.au.
The Project was advertised on this site from 21 August to 18 September 2015. An overview of the Project and request for feedback was provided, with a link to the project information and feedback avenues contained on DSD’s website.
Have your say consultation hub ‘Have your say’ is DSD’s central consultation hub. The online feedback form was hosted on this site for the consultation period. Detailed information on the Project was provided, as well as details on how to comment. Over 110 submissions were received via this forum.
Abbot Point Growth Gateway Project Environmental Impact Statement Page 8 Volume 4 – Supplement Report
Section 2 Consultation on the Draft Environmental Impact Statement
Dedicated email address
A dedicated email address was established in the lead up to consultation and frequently used during the consultation period to receive submissions and contact key stakeholder groups. The majority of submissions on the draft EIS were received via this email address.
Postal address A postal address was made available for stakeholders preferring this method of providing feedback.
2.5 Publicity The Queensland Government publicised the consultation period through public notices, media releases, social media and via departmental websites. These promotions are detailed below.
Print advertising
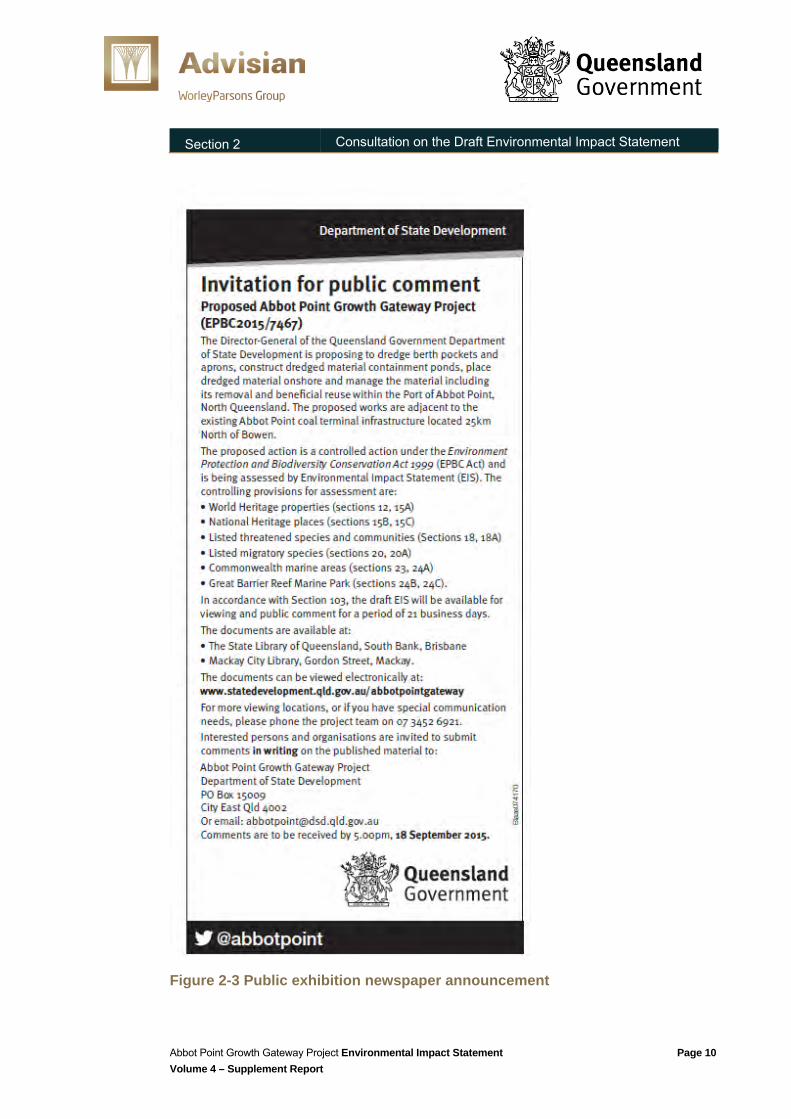
In accordance with the EPBC Act, a public notice (Figure 2-3) was placed in the following publications on Friday 21 August 2015:
The Australian The Courier Mail The Daily Mercury (Mackay) The Bowen Independent.
Abbot Point Growth Gateway Project Environmental Impact Statement Page 9 Volume 4 – Supplement Report
Section 2 Consultation on the Draft Environmental Impact Statement
Figure 2-3 Public exhibition newspaper announcement
Abbot Point Growth Gateway Project Environmental Impact Statement Page 10 Volume 4 – Supplement Report
Section 2 Consultation on the Draft Environmental Impact Statement
Media release and unpaid publicity
A media release announcing the consultation opportunity was sent out to media outlets across the State on 20 August 2015 and is currently available via the Queensland Government’s media statements webpage:
Abbot Point coal port project takes a step forward http://statements.qld.gov.au/Statement/2015/8/20/abbot-point-coal-port-project-takes-a-step-forward.
This announcement received coverage in national, State and local media outlets. This release and subsequent media articles were shared extensively across social media channels, further promoting the consultation period.
Departmental websites The consultation phase was promoted prominently on DSD’s website homepage. The invitation for comment was also published on the DoE’s website.
Abbot Point Growth Gateway Project Environmental Impact Statement Page 11 Volume 4 – Supplement Report
Section 3 Analysis of Submissions
3 Analysis of Submissions
The number of submissions received by DSD amounted to a total of 55,127. This number includes submissions received during the public consultation period, which extended from 21 August to 18 September 2015. Further submissions were received after the closing date for public comment on the EIS by midnight on 20 September 2015. These additional submissions and matters raised by these submitters have been considered and included in this report.
Of the submissions received, over 99% were classified as ‘campaign letters’, which were largely pre-written letters hosted on websites. Submissions that were identifiable as campaign letters were grouped to be addressed together, while other submissions were classified as either having ‘generic’ feedback (negative or positive) or warranting specific response(s) to the matters raised.
After grouping the submissions, those requiring individual responses were uniquely identified and logged in a register. Unique submissions and campaign letters were reviewed in detail and the over-riding issues in each were summarised. This allowed relevant technical specialists to review and address issues relevant to their discipline and associated component of the draft EIS.
A summary of these submissions and the organised campaigns, and responses to them, are included in Section 4.
3.1 Common submission themes A number of common issues and ‘themes’ emerged during the analysis process:
A perception that alternatives to the Project have not been adequately considered Questions around the viability and need for the Project, i.e. that the Project is being
developed to support a perceived unnecessary increase in port capacity given current latent capacity and the economic uncertainty of coal mining projects in the Galilee Basin
Questions around the overall sustainability of the Project, in that it could potentially support further development of non-renewable coal resources which could result in greenhouse gas (GHG) emissions due to coal combustion leading to potential climate change impacts to the GBR
The potential impacts on the GBR of longer-term increases in shipping associated with related projects
Concern regarding the unlined bases of the proposed DMCP and the risk of potential leakage to the adjacent Caley Valley Wetlands
The timing of construction and dredging activities, and how these align with seasonal ecological functions – e.g. coral spawning and bird migration
Potential impacts on the existing fishing and tourism industries The consideration of the total cumulative impacts The spatial extent of dredging sediment plumes and associated impacts The assessment of nearby coral reefs and potential impacts associated with the sediment
plume The basis of fauna assessments and the nature and duration of surveys undertaken for
birds and marine species
Abbot Point Growth Gateway Project Environmental Impact Statement Page 12 Volume 4 – Supplement Report
Section 3 Analysis of Submissions
Potential impacts on the adjacent Caley Valley Wetlands The potential for disturbance of and contamination by ASS Management of stormwater and potential for overflow from the DMCP, particularly during
severe weather events Questions around groundwater including around flow rates, salinity and mounding The period of time allowed for comments on the draft EIS A perceived conflict of interest associated with the Queensland Government being both
the Proponent and assessor for the Project The level of detail of management plans submitted as part of the draft EIS.
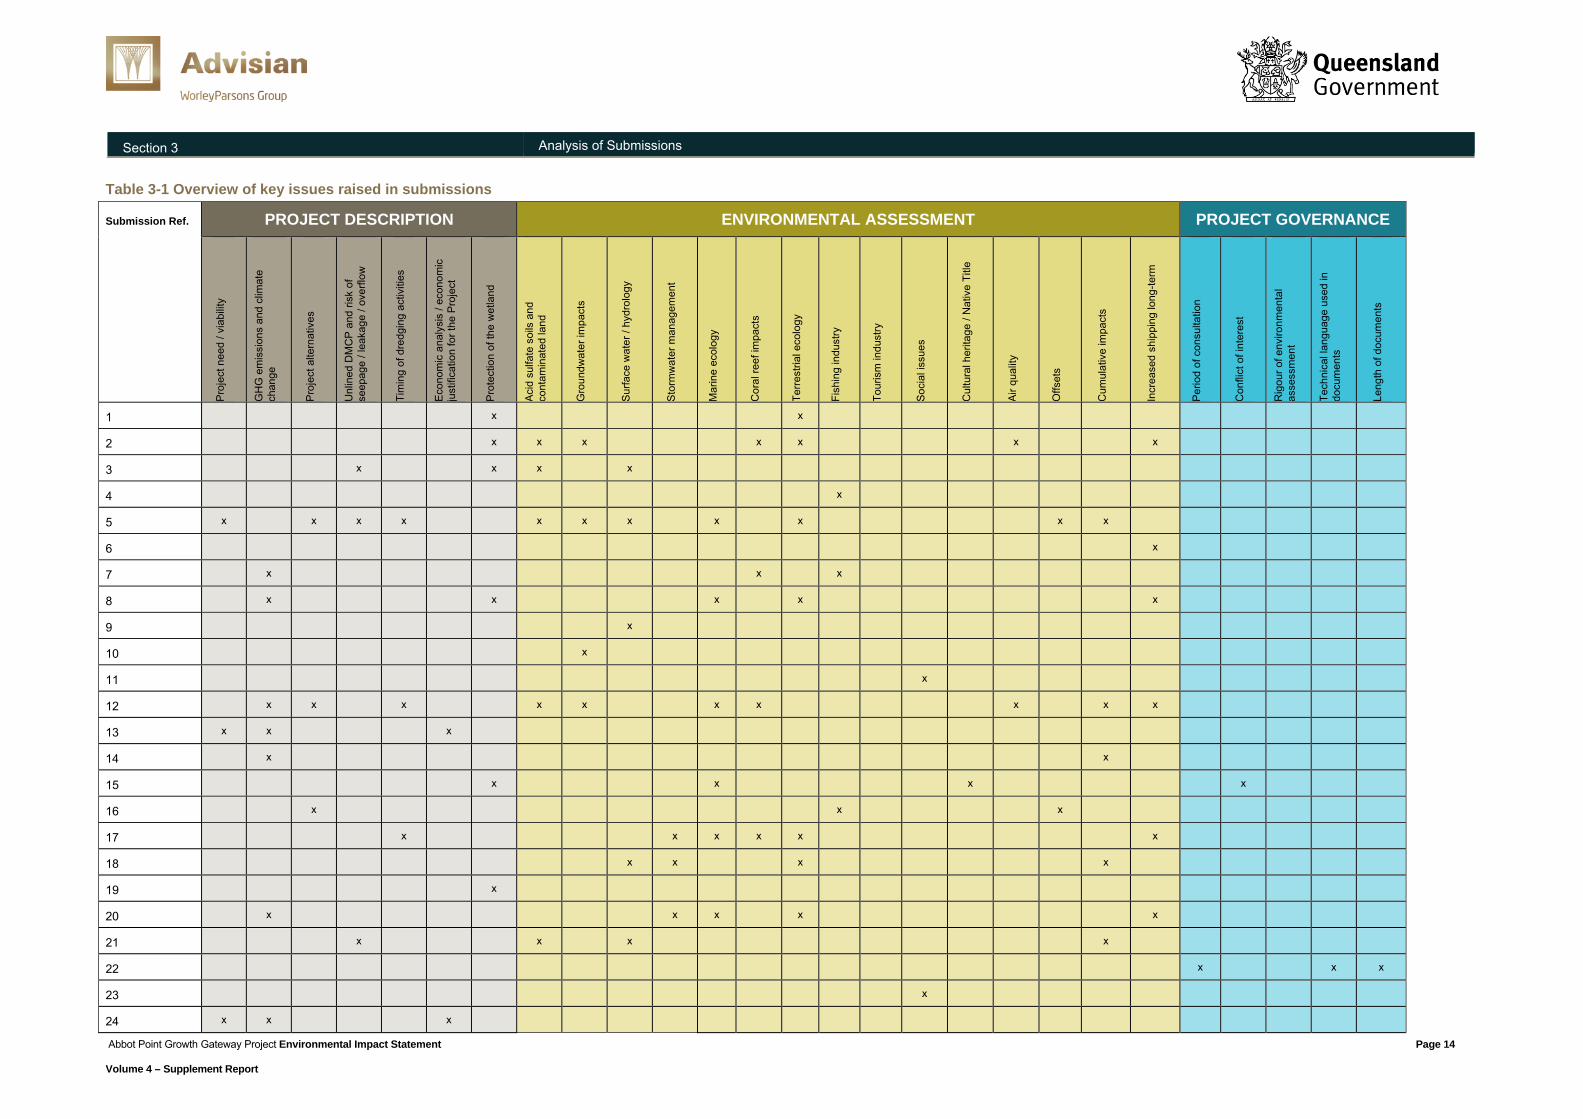
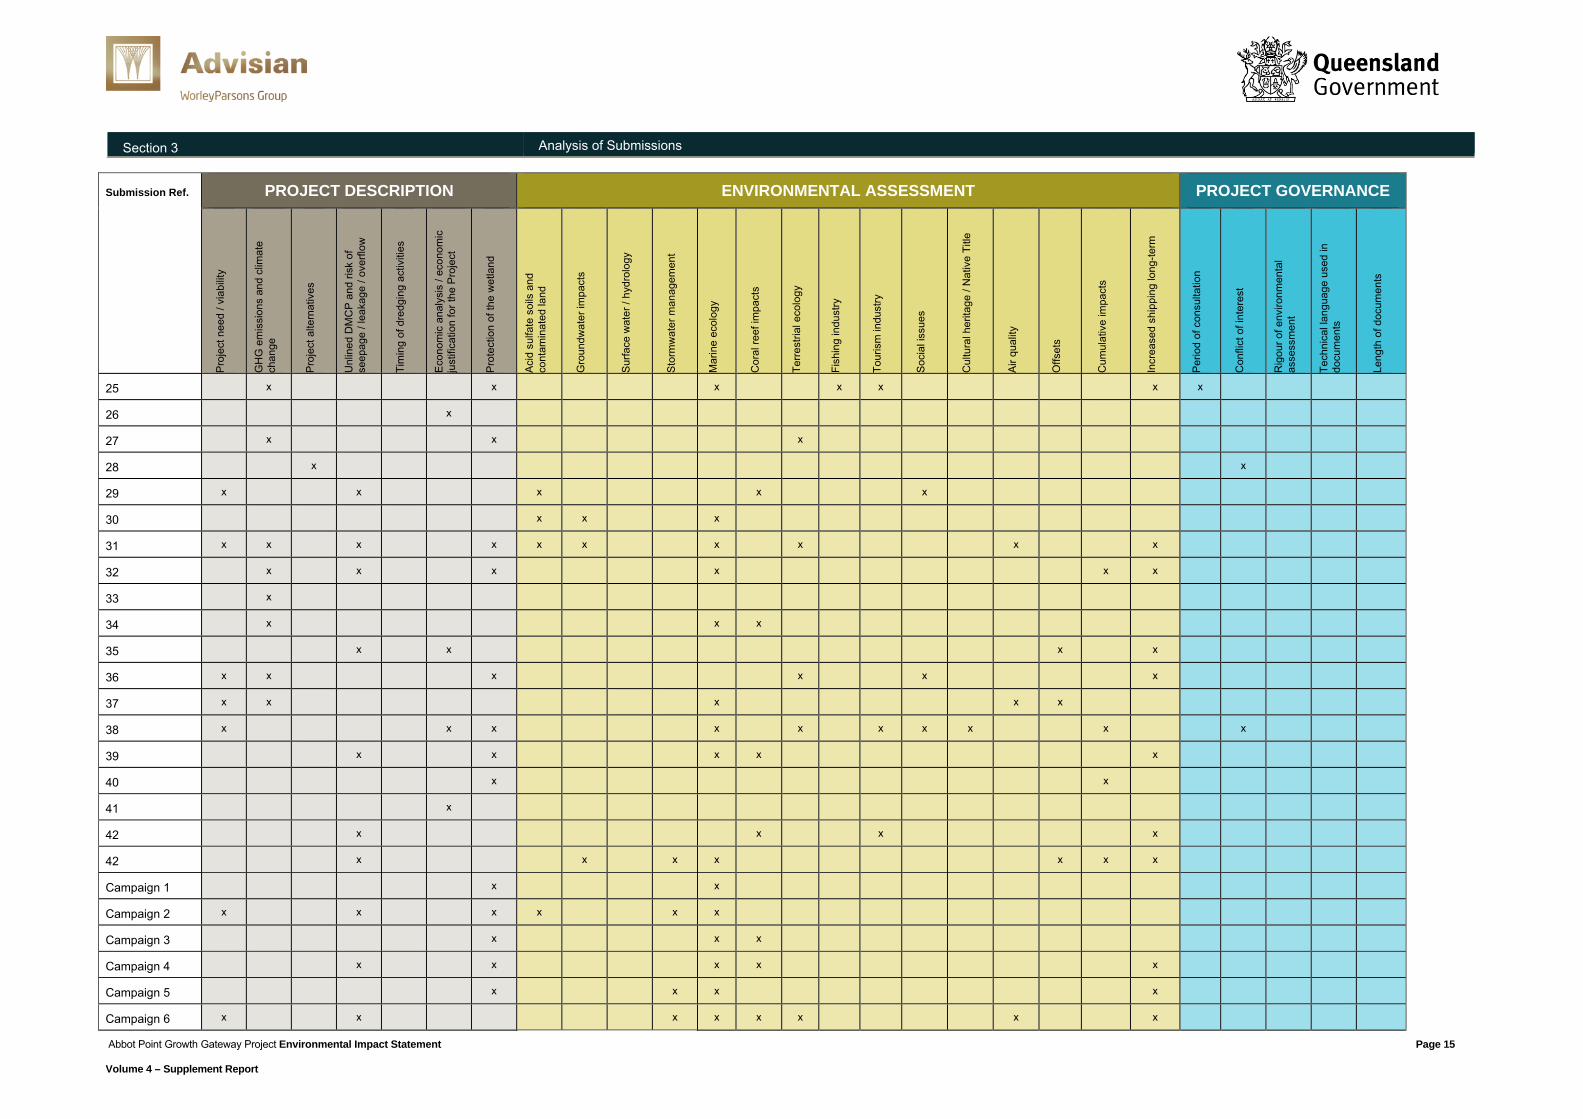
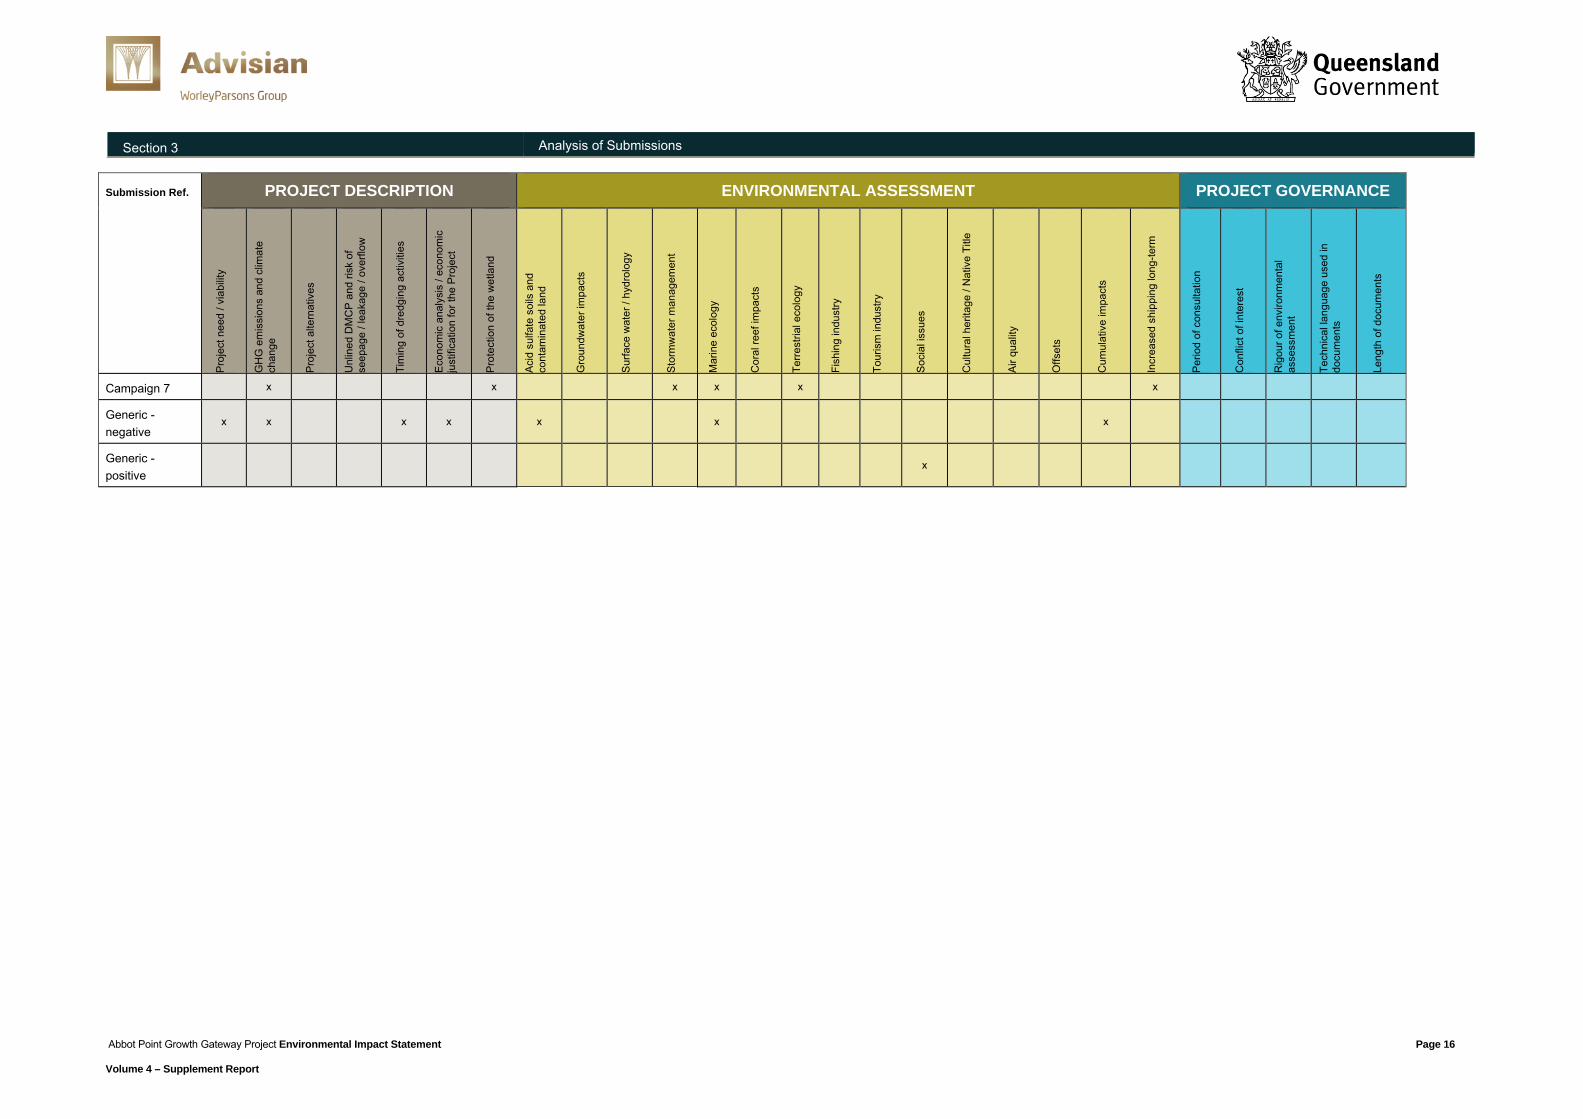
These issues are discussed in more detail in the sections which follow, and a broader overview of submissions’ key topics is provided in Table 3-1.
Abbot Point Growth Gateway Project Environmental Impact Statement Page 13 Volume 4 – Supplement Report
Section 3 Analysis of Submissions
Table 3-1 Overview of key issues raised in submissions
Submission Ref. PROJECT DESCRIPTION ENVIRONMENTAL ASSESSMENT PROJECT GOVERNANCE P
roje
ct n
eed
/ via
bilit
y
GH
G e
mis
sion
s an
d cl
imat
e ch
ange
Pro
ject
alte
rnat
ives
Unl
ined
DM
CP
and
risk
of
seep
age
/ lea
kage
/ ov
erflo
w
Tim
ing
of d
redg
ing
activ
ities
Eco
nom
ic a
naly
sis
/ eco
nom
ic
just
ifica
tion
for t
he P
roje
ct
Pro
tect
ion
of th
e w
etla
nd
Aci
d su
lfate
soi
ls a
nd
cont
amin
ated
land
Gro
undw
ater
impa
cts
Sur
face
wat
er /
hydr
olog
y
Sto
rmw
ater
man
agem
ent
Mar
ine
ecol
ogy
Cor
al re
ef im
pact
s
Terr
estri
al e
colo
gy
Fish
ing
indu
stry
Tour
ism
indu
stry
Soc
ial i
ssue
s
Cul
tura
l her
itage
/ N
ativ
e Ti
tle
Air
qual
ity
Offs
ets
Cum
ulat
ive
impa
cts
Incr
ease
d sh
ippi
ng lo
ng-te
rm
Per
iod
of c
onsu
ltatio
n
Con
flict
of i
nter
est
Rig
our o
f env
ironm
enta
l as
sess
men
t
Tech
nica
l lan
guag
e us
ed in
do
cum
ents
Leng
th o
f doc
umen
ts
1 x x
2 x x x x x x x
3 x x x x
4 x
5 x x x x x x x x x x x
6 x
7 x x x
8 x x x x x
9 x
10 x
11 x
12 x x x x x x x x x x
13 x x x
14 x x
15 x x x x
16 x x x
17 x x x x x x
18 x x x x
19 x
20 x x x x x
21 x x x x
22 x x x
23 x
24 x x x
Page 14 Abbot Point Growth Gateway Project Environmental Impact Statement
Volume 4 – Supplement Report
Section 3 Analysis of Submissions
Submission Ref. PROJECT DESCRIPTION ENVIRONMENTAL ASSESSMENT PROJECT GOVERNANCE P
roje
ct n
eed
/ via
bilit
y
GH
G e
mis
sion
s an
d cl
imat
e ch
ange
Pro
ject
alte
rnat
ives
Unl
ined
DM
CP
and
risk
of
seep
age
/ lea
kage
/ ov
erflo
w
Tim
ing
of d
redg
ing
activ
ities
Eco
nom
ic a
naly
sis
/ eco
nom
ic
just
ifica
tion
for t
he P
roje
ct
Pro
tect
ion
of th
e w
etla
nd
Aci
d su
lfate
soi
ls a
nd
cont
amin
ated
land
Gro
undw
ater
impa
cts
Sur
face
wat
er /
hydr
olog
y
Sto
rmw
ater
man
agem
ent
Mar
ine
ecol
ogy
Cor
al re
ef im
pact
s
Terr
estri
al e
colo
gy
Fish
ing
indu
stry
Tour
ism
indu
stry
Soc
ial i
ssue
s
Cul
tura
l her
itage
/ N
ativ
e Ti
tle
Air
qual
ity
Offs
ets
Cum
ulat
ive
impa
cts
Incr
ease
d sh
ippi
ng lo
ng-te
rm
Per
iod
of c
onsu
ltatio
n
Con
flict
of i
nter
est
Rig
our o
f env
ironm
enta
l as
sess
men
t
Tech
nica
l lan
guag
e us
ed in
do
cum
ents
Leng
th o
f doc
umen
ts
25 x x x x x x x
26 x
27 x x x
28 x x
29 x x x x x
30 x x x
31 x x x x x x x x x x
32 x x x x x x
33 x
34 x x x
35 x x x x
36 x x x x x x
37 x x x x x
38 x x x x x x x x x x
39 x x x x x
40 x x
41 x
42 x x x x
42 x x x x x x x
Campaign 1 x x
Campaign 2 x x x x x x
Campaign 3 x x x
Campaign 4 x x x x x
Campaign 5 x x x x
Campaign 6 x x x x x x x x
Page 15 Abbot Point Growth Gateway Project Environmental Impact Statement
Volume 4 – Supplement Report
Section 3 Analysis of Submissions
Submission Ref. PROJECT DESCRIPTION ENVIRONMENTAL ASSESSMENT PROJECT GOVERNANCE P
roje
ct n
eed
/ via
bilit
y
GH
G e
mis
sion
s an
d cl
imat
e ch
ange
Pro
ject
alte
rnat
ives
Unl
ined
DM
CP
and
risk
of
seep
age
/ lea
kage
/ ov
erflo
w
Tim
ing
of d
redg
ing
activ
ities
Eco
nom
ic a
naly
sis
/ eco
nom
ic
just
ifica
tion
for t
he P
roje
ct
Pro
tect
ion
of th
e w
etla
nd
Aci
d su
lfate
soi
ls a
nd
cont
amin
ated
land
Gro
undw
ater
impa
cts
Sur
face
wat
er /
hydr
olog
y
Sto
rmw
ater
man
agem
ent
Mar
ine
ecol
ogy
Cor
al re
ef im
pact
s
Terr
estri
al e
colo
gy
Fish
ing
indu
stry
Tour
ism
indu
stry
Soc
ial i
ssue
s
Cul
tura
l her
itage
/ N
ativ
e Ti
tle
Air
qual
ity
Offs
ets
Cum
ulat
ive
impa
cts
Incr
ease
d sh
ippi
ng lo
ng-te
rm
Per
iod
of c
onsu
ltatio
n
Con
flict
of i
nter
est
Rig
our o
f env
ironm
enta
l as
sess
men
t
Tech
nica
l lan
guag
e us
ed in
do
cum
ents
Leng
th o
f doc
umen
ts
Campaign 7 x x x x x x
Generic - negative
x x x x x x x
Generic - positive
x
Page 16 Abbot Point Growth Gateway Project Environmental Impact Statement
Volume 4 – Supplement Report
Section 4 Responses to Submissions
4 Responses to Submissions
The following sub-sections provide responses to common submission topics.
4.1 Responses to common comments As previously discussed, a number of common issues or ‘themes’ emerged from the review of comments contained in submissions. The sections which follow provide detailed responses to these common issues, which have been grouped into three broad topics:
1. Project features
2. The environmental impact assessment undertaken for the Project
3. Project governance.
4.1.1 Project features
4.1.1.1 Need for and viability of the Project A number of public comments questioned the need for the Project, given perceived globally declining coal markets and the level of uncertainty associated with coal projects in the Galilee Basin. Existing latent capacity at Abbot Point is perceived by some submitters to be sufficient to support demand.
As outlined in the draft EIS (Volume 2, Section 2.4.1), in considering the need for the Project, it must be recognised that capacity at the Port of Abbot Point is currently fully contracted. Adani’s Carmichael Coal Mine at full capacity will produce up to 60 Million tonnes per annum (Mtpa) of product coal, and certainty in regard to port capacity is required. Latent capacity at various ports across Queensland does not provide a viable export scenario for projects of this size.
Dredging at the Port of Abbot Point, proposed as part of the Project, is required to allow for the development of T0 which will provide an additional 70Mtpa throughput (refer to Volume 2, Section 2.4.1 of the draft EIS).
T0 is largely intended to be utilised for the export of coal produced from the Carmichael Coal Mine. The Carmichael Coal Mine and Rail Project has received EPBC approval and is expected to receive State approvals by the end of 2015 or early 2016.
Development of the Abbot Point Port is of strategic importance to both the Commonwealth and Queensland Governments, presenting a critical link between new projects in the Bowen and Galilee Basins and the ability to effectively export materials overseas.
The Proponent recognises that the developers of greenfield mine, railway and port projects for the Galilee Basin must invest in highly complex project development processes, typically over many years, before making a final investment decision on whether to proceed.
The Proponent will need to be satisfied about the Galilee Basin developers’ commitments to proceed with their respective mine, rail and port developments before making decisions in respect to commencing dredging at the Port of Abbot Point.
Abbot Point Growth Gateway Project Environmental Impact Statement Page 17 Volume 4 – Supplement Report
Section 4 Responses to Submissions
4.1.1.2 Consideration of alternatives A number of submissions raised that a more thorough consideration of project alternatives should have been undertaken to ensure protection of the GBR.
Project alternatives are discussed in detail in Section 2.4 of the draft EIS (Volume 2). In particular, five options to avoid or reduce dredging are outlined, as are alternatives for the placement of dredged material. The Project is considered to have lesser adverse impacts on MNES than the other alternatives assessed.
One submission specifically queried why the transport of the dredged material back to the mines or placement at the Bowen Salt Works had not been considered. Use of the Bowen Salt Works as storage area for the dredged material is not a viable alternative when using a Cutter Section Dredge (CSD) due to the distance separating the salt works from the dredging area. Pumping over this long distance is not feasible. A trailing suction hopper dredge (TSHD) would therefore be required to transport the material, which would require additional dredging near the Salt Works to allow for access by the TSHD, and therefore further seabed, flora and fauna disturbance, including mangrove flats.
Transporting the dredged material to the coal mines would require temporary stockpiling infrastructure and the area of land affected at the port would be the same if not larger than what is proposed under the current Project. In addition, the aim of the Project is to maintain the dredged material at the port for future beneficial reuse.
4.1.1.3 Dredged Material Containment Pond design
Some groups and members of the public expressed concern around the design of the DMCP including in relation to:
Design life and containment risk, i.e. that the DMCP was not a secure, long-term structure
Seepage through the walls and unlined base Stormwater holding capacity and overflow Erosion impacts from overflow and seepage.
The DCMP design has been undertaken in accordance with appropriate engineering practice.
While the DCMP does not trigger the requirement, the design process included an assessment of the ponds in accordance with the Queensland Department of Environment and Heritage Protection (DEHP) Manual for Assessing Consequence Categories and Hydraulic Performance of Structures. The consequence category assessment for the DMCP was provided as Appendix D to the draft EIS. Further information (Engineering Risk analysis of Dredged Material Containment) is included as Appendix E of this report.
The engineering design of the DMCP has provided measures to minimise seepage through the DMCP embankments, including:
Constructing the embankment with specified compaction of suitable earthfill (not dredged material as suggested within the public submissions)
Incorporation of an internal wall geosynthetic liner to minimise seepage Concurrent measures to extend the flow path length of seepage that does occur.
Abbot Point Growth Gateway Project Environmental Impact Statement Page 18 Volume 4 – Supplement Report
Section 4 Responses to Submissions
Due to the small volumes, seepage through the DMCP walls is unlikely. Surface water expression of seepage through the pond bases is also considered very unlikely to report directly to the wetland.
The DMCP design does not incorporate a lined base. Impacts of seepage through the DMCP floor were assessed in the draft EIS. It was concluded that under both high and low rainfall conditions, salinity above background is small when compared to the range of natural (seasonal) variations of salinity experienced by the wetland and that surface water expression of DMCP seepage was not predicted to occur. Consequently, it was concluded that persistent detrimental impact on aquatic flora and fauna within the ‘wetted’ sections was not expected to occur due to operation of the DMCP (Volume 2, Section 4.3.6.3; Volume 3, Appendix L).
The likelihood of seepage through DMCP walls reporting to the wetland was considered to be extremely unlikely. And as noted above surface water expression of seepage through the base is not predicted to occur. However, given the potential sensitivity of the wetland, the hydrology assessment considered a hypothetical ‘worst-case’ scenario, where surface expression occurred and saline waters entered the wetland (Volume 2, Section 4.3.6.3; Volume 3, Appendix O). The assessment concluded that the saline waters at the discharge location may result in highly localised changes to fringing wetland vegetation in affected areas, with the possibility for salt-tolerant samphire communities to be temporarily replaced by salt sensitive saltcouch in affected areas. This impact was predicted to be temporary, highly localised and therefore unlikely to affect the functionality of aquatic habitats within the wetland.
The engineering design of the DMCP has provided freeboard for extreme storm and wind/wave action above the maximum operating water level in the DMCP. These aspects were outlined within the draft EIS and the preliminary Stormwater Management Plan (Volume 3, Appendix Y).
A number of submitters raised concerns regarding the management of extreme weather events and stormwater at the project site. Comments stated that the DMCP should be designed to account for wet season rainfall and potential cyclone events, particularly in terms of minimising overflow and potential release of contaminants into sensitive receiving environments, for example the adjacent wetland. Some perceived that the information provided in the preliminary Stormwater Management Plan does not sufficiently outline mitigation measures, and that comprehensive emergency management plans should be in place to manage these events.
The engineering design of the DMCP has provided freeboard for extreme storm and wind/wave action above the maximum operating water and dredged material level in the DMCP. Cyclonic rainfall and wind events have been incorporated into the design parameters for both short duration and wet season events. The impacts of overflow in extreme weather events (i.e. beyond the DMCP retention capacity) were assessed within the draft EIS (refer to Volume 2, Section 4.3.6.3; Volume 3, Appendix O). The assessment considered that in the event of spills from the DMCP, the impact on the wetland would be highly localised (within tens to hundreds of metres of the proposed spillway location) and minor due to:
The capacity of the DMCP to store water from rainfall events up to 20 years Average Recurrence Interval (ARI)
The DMCP design accounting for a higher frequency of 50 or 100 years ARI events
Abbot Point Growth Gateway Project Environmental Impact Statement Page 19 Volume 4 – Supplement Report
Section 4 Responses to Submissions
Only a portion of the supernatant water being discharged into the wetland and the capacity of the wetland basin to receive saline water in times of flood.
With regards to stormwater flows and erosion at DMCP stormwater outlets, the preliminary Stormwater Management Plan notes that permanent outlet structures will be installed for erosion and sediment control during construction and operation stages. The structures act to disperse flow and minimise potential for erosion at the base of the discharge points as well as to remove sediment during construction works.
The design incorporates two areas of controlled sheet flow from the DMCP walls (discharge points B and G). Woven sediment fences located downslope will be installed to capture sediment, until vegetation cover on the embankments is established.
Following the completion of dredging, the dredged material will be landformed and revegetated where necessary to minimise erosion from rainfall and storm runoff within the ponds. The embankments may be removed or notched as will be detailed in the final Stormwater Management Plan, such that the internal landforming will generate flows to the receiving environment that generally mimic the underlying natural preconstruction drainage pathways. Sediment control pond areas will be incorporated into the landform design to provide rainfall detention for sediment control purposes. Armoured sill and chutes will be incorporated into the sediment pond outlets to assist in erosion stability. Further detail on stormwater management is provided in the draft EIS Volume 3, Appendix Y – Section 2.
The Proponent considers that the level of information within the preliminary Stormwater Management Plan is sufficient for the purpose of the current assessment. A more detailed final Stormwater Management Plan will be developed prior to commencement of construction.
4.1.1.4 Properties of dredged material and Dredged Material Containment Pond site
Some submissions raised issues associated with the disturbance of ASS or other potential contaminants during dredging, and the impacts of this on the nearby wetland. In particular, the ability of ASS to be self-neutralising was questioned and sampling regimes were said to be too short-term to enable adequate prediction of impacts, leading them to be underestimated. Based on this, submitters expressed concern that ASS and Potential Acid Sulfate Soils (PASS) would not be appropriately managed and stated that management measures for the potentially higher alkalinity of groundwater had not been outlined to mitigate impacts on local ecological systems.
A preliminary Acid Sulfate Soil Management Plan (ASSMP). A final ASSMP will be developed prior to construction. Subsequent to the draft EIS publication, additional testing of representative historical samples has confirmed the remaining presence of neutralising capacity in the material to be dredged. The technical memorandum summarising these findings is attached at Appendix D. The preliminary ASSMP commits to mitigation strategies and identifies contingency options in the event of observed acidic or alkaline conditions. These actions are consistent with the expected level of risk. The preliminary ASSMP identifies how ASS risk will be managed and monitored.
The risks associated with PASS dredged materials are considered to be relatively low. Soil profiles across the areas to be dredged are generally comprised of about 2m of marine
Abbot Point Growth Gateway Project Environmental Impact Statement Page 20 Volume 4 – Supplement Report

Section 4 Responses to Submissions
sediments (loose/soft sands, clayey sands and sandy clays) overlying alluvial deposits of firm to very stiff sandy clays. The softer marine sediments have consistently been identified as self-neutralising PASS and the underlying alluvial deposits have consistently been identified as non-ASS. The available information is considered suitable to provide an informed understanding of the conditions within the dredging area. Verification testing on placed dredged material will allow identification of materials that may require additional lime treatment before they can significantly oxidise, this is aimed at not allowing acidic conditions to develop. Monitoring of return water during placement of the dredged material and treatment of acidic waters (if present) is addressed in the ASSMP. All return water treatment (including flocking of iron) is proposed to be conducted within the DMCP to prevent impact to the marine environment.
Dredged material can be safely managed and monitored within the DMCP. Verification testing will be conducted on the placed dredged material to confirm if additional treatment is required. This will be incorporated into the dredged material management plan.
The DMCP bund walls have been designed considering both stability and scour issues that could result in ‘wall failure’ and a subsequent loss of sediment to the surrounding environment. The design is based on industry standard factors of safety and the risk of wall failure is considered to be very low. Additionally, verification testing on placed dredged material will allow identification of materials that may require additional lime treatment before they can significantly oxidise. This is aimed at not allowing acidic conditions to develop. Verification testing and monitoring of dredged material will effectively eliminate the potential for future acidity mobilisation from these materials, regardless of rainfall events or wave actions within the DMCP.
Both the geology and morphology of the DMCP site indicated a low risk of ASS being present. The conditions encountered and the sampling and testing conducted clearly confirmed that ASS is not present within the depth of disturbance at this site. The bund walls are not located on PASS. This was confirmed through investigations.
When left undisturbed and submerged in an anoxic environment, pyrite (in ASS) is chemically inert. Pyrite oxidises in the presence of oxygen and hydrogen to form sulfuric acid. There are a number of variables affecting the oxidation of pyrite, and the reactions are complex although the rate at which pyrite is oxidised tends to be closely linked with pH, with oxidation increasing as pH decreases, and is usually only limited by the rate of supply of oxygen:
When ASS is excavated and allowed to dry, an almost infinite supply of atmospheric oxygen at relatively high concentrations (21%) is available. The oxygen is delivered to the soil via advection and diffusion. Under such a scenario there is a high potential to generate acid.
When ASS is saturated, the available supply of oxygen is significantly lower (typically 9ppm). In still water, the oxygen is delivered to the soil surface via diffusion at a very slow rate and the risk of acid generation is low. In dynamic, open water bodies, the oxygen is principally delivered via advection to suspended soil particles and oxygen delivery via diffusion to bottom sediments is negligible. The risk of acid generation is variable and dependent upon the rate and duration of suspension.
In open marine environments, the alkaline and relatively stable pH of seawater results in a slow rate of pyrite oxidation and the greatest risk of acid generation is associated with
Abbot Point Growth Gateway Project Environmental Impact Statement Page 21 Volume 4 – Supplement Report
Section 4 Responses to Submissions
suspended or resuspended sediments. The majority of the dredged material will settle to the ocean floor and return to an anoxic, reducing state.
Seawater contains the major buffering constituents - bicarbonate and carbonate in solution. When acid is generated, the neutralising reaction occurs instantaneously. In an open marine environment, the available buffering capacity is immense and surrounds the suspended soil particles. Therefore any acid generated is immediately neutralised and does not pose a risk to the surrounding environment.
One potential contaminant of concern in the sediments to be dredged that was detected in a number of sediment characterisation programs is tributyltin (TBT), which is associated with antifouling paint used on ships. Individual isolated samples from different sediment characterisation programs at Abbot Point have recorded TBT at levels greater than guideline values; however, analysis across all samples for each study identifies a mean concentration less than the former National Ocean Disposal Guidelines for Dredged Material (Commonwealth of Australia, 2002) and the National Assessment Guidelines for Dredging screening levels.
The elevated TBT found in isolated sediment samples are likely to be from individual paint flakes from ship hulls. The use of TBT in antifouling paints is now banned to limit the amount of TBT entering the marine environment. Higher concentrations of TBT are more likely to occur in the existing berth pockets rather than in undisturbed seabed sediments. Further, a sediment characterisation study was carried for the T0, T2 and Terminal 3 (T3) Capital Dredging Project, including of the sediments to be dredged in the T0 dredging area (berth pockets and apron areas). The study found no samples of sediment contained concentrations of TBT above the Laboratory Level of Reporting (non-detect) and therefore no TBT concentrations above the applicable guidelines.
4.1.1.5 Timing of construction and dredging activities It was emphasised in several comments that the Project should outline in more detail the timing of dredging activities to be undertaken. In particular, the timing should be cognisant of turtle nesting seasons, presence of migratory birds, and the functioning of various marine ecosystems, e.g. coral spawning.
It is acknowledged that the draft EIS does not specify timing for the construction of the DMCP. However, it should be noted that construction may not occur during migratory bird season, and/or the wetland may not hold sufficient water for migratory bird feeding at the time of construction. Nevertheless, the impact assessment has been undertaken for the worst case scenario, that being construction occurring during migratory bird season when the wetland holds sufficient water for resting and feeding birds.
The dredging window outlined in the NQBP Abbot Point Terminals 0, 2, and 3 Capital Dredging Project Public Environment Report (PER) conditions of approval were designed to mitigate the impact to turtle nesting, coral spawning and seagrass growth from the dredging via TSHD and the placement of dredged material offshore based on the project description outlined in the Abbot Point PER. The impacts due to the Project are greatly reduced and cannot be compared to the scale of potential impacts from the previous project.
Abbot Point Growth Gateway Project Environmental Impact Statement Page 22 Volume 4 – Supplement Report
Section 4 Responses to Submissions
A comparison between the spatial distribution of the dredging plume for each project is outlined in the Marine Ecology Technical Report (Volume 3, Appendix Q1 - Section 6.2.8) and presented below in brief.
The hydrodynamic modelling results of the 95th percentile Total Suspended Solids (TSS) concentrations outlined in the Abbot Point, T0, T2 and T3 Capital Dredging PER (GHD, 2102) and the Project are both provided for comparison in Figure 6-56 and Figure 6-57 of Appendix Q1. The 95th percentile plots represent conditions that would be expected for 5% of the dredging campaign. The use of 95th percentile outputs may be considered as a worst-case scenario. While the duration of the proposed dredging campaigns for both projects are similar (up to 12 or 13 weeks), the volumes of material differ between the projects by some 1.9Mm3.
The T0, T2 and T3 Capital Dredging Project proposed using a TSHD operating in overflow mode and offshore placement of dredged material, which would result all dredged material entering the marine environment.
The hydrodynamic modelling results for the T0, T2 and T3 Capital Dredging project indicate (Figure 6-56) the TSS concentrations were expected to decrease to between 10mg/L and 25mg/L above background, approximately 13km to the west of the dredging activities. The TSS concentrations were expected to decrease to between 5mg/L and 10mg/L above background, approximately 19km to the west of dredging activities.
The hydrodynamic modelling results for the Project (Figure 6-57) indicate the 5mg/L seabed TSS concentrations during the dry season (worst-case) may extend up to 4km to the north-west and 2km to the south-east of the T0 dredging area. The 5mg/L to 10mg/L contour does not extend more than 1km beyond the T0 dredge footprint.
The capital dredging of T0, T2 and T3 and offshore disposal would have released more fine sediments into the marine environment in one day than the amount of fine sediment estimated to be released into the marine environment during the entire Project dredging activities (refer to the Hydrodynamic Modelling report, Volume 3, Appendix N).
4.1.1.6 Management plans A number of submissions raised concerns that the various management plans attached to the draft EIS should be more detailed, and for instance include detailed monitoring measures.
At the EIS stage, management plans cannot be exhaustive due to uncertainties around detailed construction methods, construction activity sequencing, responsibilities for the Project and onsite during construction and operation, and the nature and extent of conditions from regulators. As such, the management plans have been drafted as outline documents that will serve as basis for more detailed plans to be developed closer to the commencement of construction. The further development of such plans allows for the management measures to be evolved with a view to thoroughly meeting all Project approval conditions.
It is noted that the Project’s EIS Guidelines only sought frameworks for future management plans and not completed plans. Specifically, the DoE requested the following in terms of management plans (Volume 3, Appendix A):
“An outline of the Environmental Management Plan (EMP) must be presented in this section of the EIS. It must as a minimum detail:
Abbot Point Growth Gateway Project Environmental Impact Statement Page 23 Volume 4 – Supplement Report
Section 4 Responses to Submissions
Monitoring arrangements Reporting arrangements Feedback of monitoring results into project management.
Details of requirements for the preparation of EMPs under other relevant legislation must also be provided”
Volume 3, Appendices V and W provide the Outline EMP and Outline Dredging Management Plan and contain relevant details of the management, monitoring and reporting processes applicable to the Project. It is expected that the Project will be conditioned on the basis that detailed and relevant management plans will be developed prior to the commencement of construction, dredging and operational phases of the Project. Further work will be progressed with existing and, where appropriate, future port users to ensure that the Abbot Point Growth Gateway Project’s environmental management plans and their associated monitoring programs are designed to be delivered in a sustainable manner. New environmental monitoring associated with the Project will consider impacts to existing APB monitoring programs and how these impacts could be mitigated (for example through relocation of bores prior to commencement of works). In addition, where possible, environmental monitoring will be designed to allow impacts from respective developments to be understood so that adaptive measures can be implemented.
As outlined in Volume 2, Section 5.1 of the EIS, management and ongoing monitoring of the potential impacts and effectiveness of the proposed mitigation measures will be undertaken throughout all phases of the Project, as part of the overall environmental risk process. The environmental risk assessment undertaken during the EIS systematically identified and classified potential environmental impacts by linking them to project phases, project activities, technical assessment areas and controlling provisions (MNES); and collated them in an environmental risk register. The impacts were identified and detailed in the project Environmental Risk Register (Volume 3, Appendix U). Mitigation measures were identified to reduce the potential for consequences to occur and/or to reduce their severity if they do occur. Both the risk assessment and nomination of mitigation measures was based on the detailed technical assessments.
4.1.2 Environmental impact assessment
4.1.2.1 Sediment plume impacts
A number of submissions raised concerns that the nature and scale of the sediment plume produced by dredging activities was uncertain and unpredictable. Specifically, groups and individuals emphasised that the plume might persist over longer distances than predicted, potentially affecting the Reef, Great Barrier Reef Marine Park (GBRMP) and World Heritage Area.
The design incorporated two areas of controlled sheet flow from the DMCP walls (discharge points B and G). Woven sediment fences located downslope will be installed to capture sediment, until vegetation cover on the embankments is established.
As outlined in Appendix N of Volume 3, a 3D hydrodynamic and sediment transport numerical model with five vertical layers was adopted for the assessment. A stochastic approach was applied for the modelling of sediment plumes which is considered to be leading practise. The approach takes into account the inter-annual and seasonal variability in
Abbot Point Growth Gateway Project Environmental Impact Statement Page 24 Volume 4 – Supplement Report
Section 4 Responses to Submissions
metocean conditions for modelling the dispersion of material during the dredging and onshore placement activities; significantly increasing confidence in the modelling and reducing the risk of any sediment suspended as part of the operation behaving in an unpredicted manner. In addition, the model verification process undertaken as part of this assessment has successfully demonstrated that the model can accurately represent the regional scale GBR Lagoon circulation processes. The stochastic modelling approach and the approach to represent the regional scale GBR Lagoon circulation processes were collaboratively developed with the GBRMPA and the Australian Institute of Marine Science (AIMS) as part of the offshore placement assessments for the Disposal Site Analysis Plan. The modelling has also been undertaken in accordance with the GBRMPA modelling guidelines.
Furthermore, the modelling has been undertaken using three separate years selected from the last 20 years. To encompass the range of climatic and oceanographic variability, the three years were selected to represent a strong El Nino event, a strong La Nina event and a neutral year. Based on the Southern Oscillation Index over this period, 1997 was selected as the El Nino, 2011 as the La Nina and 2007 as the neutral year. This stochastic modelling approach resulted in 13 scenarios in 1997 and 2007, and 12 scenarios in 2011 (due to the occurrence of Tropical Cyclones Anthony and Yasi in January and early February, the first simulation was delayed and started after Yasi), resulting in a total of 38 scenarios.
The modelling used water level, current, wave, wind and sediment particle size data specifically from Abbot Point. The modelling applies the sediment concentrations predicted for the bottom layer, which are the highest of all layers, to predict impacts to seagrasses and other benthic flora and fauna.
Issues were raised about the fugitive sediments from dredging travelling hundreds of kilometres up the coastline and out to the Reef. These issues are a misunderstanding based on a Sinclair Knight Merz/Asia-Pacific Applied Science Associates’ hydrodynamic modelling study commissioned by the GBRMPA in 2013. This hydrodynamic modelling exercise was never designed to be used for impact assessment but was rather developed to help determine whether there were comparative benefits in placing dredged material onshore or offshore within the GBR Lagoon. An interpretive statement issued by the GBRMPA which puts this report into context can be found on the Authority’s website (GBRMPA, 2013). Of particular interest are the ‘report limitations’ (provided in full below) in regards to ‘Section 3. Sensitive receptor risk assessment of alternative and current dredge material placement sites’:
“Report limitations
The inclusion of the large scale currents is complex and only limited field validation in the Great Barrier Reef Region is available.
Due to budget and timeframe constraints, and the technical challenges posed by the large spatial coverage and the extended period for simulation, it was necessary to make a number of simplifying assumptions. Some of these assumptions (for example, no consolidation of material, all placed material is resuspended, and no resuspension of sediments in shallow water) do not reflect real conditions, leading to a lack of alignment with existing field measurements.
Abbot Point Growth Gateway Project Environmental Impact Statement Page 25 Volume 4 – Supplement Report
Section 4 Responses to Submissions
These assumptions resulted in the model overestimating the dispersion of dredged material from placement sites in both the amount and distances travelled.
Consequently, the sediment plume and transport maps provided in this report do not represent actual sedimentation rates or the specific extent of dredge material dispersion and migration. In some cases, the amount of sediment deposition mapped is so small that it could not be measured. The approach adopted in the modelling study was purely to emphasise the comparison between sites and does not provide guidance on the actual impacts likely in the regions shown on the maps. As such, the maps cannot be used to determine the ecological relevance of impacts.
The model focused only on dredge material placement sites and did not investigate the combined impacts of the dredging process and the dredge material placement which could, in combination, create bigger plumes.
Based on these limitations and given the purpose of the hydrodynamic modelling was for comparison purposes, the model cannot be used in project specific impact assessment or risk assessment. The study constitutes a screening-level ‘sensitivity analysis’ of the relative merits, if any, of potential alternative placement areas.
The risk assessments included in this study were carried out for comparative purposes only and represent comparative risk between one placement site and another placement site and do not indicate absolute risk.”
Sinclair Knight Merz/Asia-Pacific Applied Science Associates’ report does not provide any real context specifically to the Project, as the type of dredge, the onshore disposal and the volumes specific to this Project are all different to those modelled in the report for Abbot Point.
In contrast, the data used within the draft EIS assessment to predict the dispersion of sediments from the dredging of T0 for the Abbot Point Gateway Project utilises site-specific tidal, current, wind, wave and sediment from Abbot Point.
Impacts of sediments in the dredging tail water return were also raised. The changes in water quality near the return water discharge point are localised and of minor extent and temporary duration. However, potential for impacts due to elevated TSS (including changes in the light environment) are recognised and were assessed in detail as outlined in Volume 2 Section 4.3.5 of the EIS.
4.1.2.2 Coral reef assessment There were several claims in submissions that the draft EIS mapping and assessment of coral reefs was inaccurate and failed to account for reefs that represented less than 10% coral cover. It was contended that important coral reefs existed in close proximity to the dredging area and had been excluded from the assessment because of this criterion. Potential impacts on these reefs from increased turbidity and sediment exposure were also said to be inadequately assessed.
One submission included the GPS positions of local reef systems.
The seafloor surveys undertaken in the Abbot Point marine environment by GHD and BMT WBM, and more regularly by TropWATER (James Cook University), are considered to be very comprehensive and the methodology and results of each assessment are detailed in:
Abbot Point Growth Gateway Project Environmental Impact Statement Page 26 Volume 4 – Supplement Report
Section 4 Responses to Submissions
BMT WBM (2012). Port of Abbot Point Offshore Dredged Material Relocation Area Site Selection Report. Prepared for NQBP, July 2012
GHD (2008). Benthic Baseline Assessment Report: Baseline Environmental Monitoring for Port of Abbot Point. Prepared for Abbot Point Multi Cargo Facility EIS, June 2008
GHD (2009a). Marine Ecology Benthic Survey Report: Proposed Abbot Point Multi Cargo Facility EIS. Prepared for NQBP, September 2009
GHD (2012). Abbot Point, Terminal 0, Terminal 2 and Terminal 3 Capital Dredging, Public Environment Report, (EPBC 2011/6213/GBRMPA G34897.1). Prepared for NQBP, December 2012
McKenna, S.A., Rasheed, M.A., Unsworth, R.K.F. and Chartrand, K.M. (2008). Port of Abbot Point seagrass baseline surveys - wet & dry season 2008. Department of Primary Industries and Fishing Publication PR08-4140', pp.51.
It is important to note that these surveys did locate the majority of coral locations presented by the submission, but the survey results found that whilst the areas supported hard and soft corals, these were sparsely distributed and do not represent reef complexes.
In contrast, Camp Island, located 20km to the west of the T0 dredging area, has an extensive fringing coral growing on underwater rocky outcrops, embayments, an island, a lagoon and mangrove areas. It is believed that this island is more appropriately described as an important coral community, and was deemed the nearest coral community to be assessed.
However, the closer coral locations referred to in the public submission are acknowledged as likely being important to some local residents for fishing and spear fishing or diving, and it is on this basis that the following further information has been supplied to provide a level of confidence in the draft EIS assessment. It is noted that one of the ‘reefs’ identified included the artificial structure of the existing port pylons, which can support coral assemblages.
This further information includes clarification of the extent of the predicted plume on these closer coral locations and further discussion of how to actually interpret the percentile plots that have been copied from Volume 3, Appendix Q1 and inserted into submissions.
The submission authors have copied and renamed Figure 6-10 from the Marine Technical Report (Appendix Q1) from ‘TSS 95th percentile – 2007 dry season’ to ‘Adani’s T0 sediment plume – Modelled data 2015 EIS for dredge plume’. This falsely implies that the reefs identified by the local resident would be impacted and smothered by the plume.
However, the following text excerpted from page 23 of Appendix Q1 to the draft EIS provides specific detail on the matters represented by the percentile plots.
“Percentile plots do not show an actual dredging plume at any point in time, they are duration-based plots which show statistical summaries of the dredging plume dispersion over the entire dredging period.”
Elevations of TSS in the water column due to dredging activities will occur in different and much smaller areas (depending on the wind/current and tide) within this 95th percentile spatial area 95% of the time. Examples of the expected surface plume (plume snap shots) from the dredging and return waters after one week, three weeks, and five weeks of dredging, and one week after dredging is complete are provided in Section 6.2.1 of Volume 3, Appendix Q1.
Abbot Point Growth Gateway Project Environmental Impact Statement Page 27 Volume 4 – Supplement Report
Section 4 Responses to Submissions
The most appropriate approximation of the plume location at the seafloor are the median (50th percentile plots) TSS plots, or the 80th percentile plots. These plots are also presented in Volume 3 (Appendix Q1, Appendix N) and Volume 2 of the draft EIS.
Coral locations have been superimposed onto all percentile plots and provided in this document for discussion. The 95th percentile plots (Figure 4-1), 80th percentile plots (on Figure 4-2) and 50th percentile plots (Figure 4-3) are provided. The locations of time series extraction points with the reefs superimposed are also provided in Figure 4-4.
The TSS time series is designed to assist in visualising what the concentrations of suspended sediments are in the water column at that point during dredging activities. Information on sediment rates and the amount of sediment that will collect on the seafloor (and bed thickness) is also provided (refer to the time series results from OF3 in Section 6.2.5 of Volume 3, Appendix Q1 - Table 6-1, Figure 6-22, Table 6-2 and Figure 6-32). The TSS at OS3, located 5km to the south of T0, range from 0mg/L to 1.55mg/L and the median value is 0.30mg/L. These values are below the mean and median background values measured during three years of water quality monitoring.
The extent of the plume therefore does not intersect with any of the coral locations and the statement that these coral locations will be covered is incorrect.
Based on this assessment, the named coral locations will not be adversely impacted by sediment smothering the coral or a reduction in the light reaching the coral due to suspended sediments in the water column.
The submission from the Australian Marine Conservation Society / World Wildlife Fund states that the draft EIS dismisses many reefs closer than Camp Island based on <10% coral cover, and considers the methodology used to be inappropriate as average coral cover for the Central Section of the GBR based on AIMS surveys is currently only ~14%.
In fact, the Marine Ecology report states:
“The seafloor is open and provides little habitat structure for benthic macroinvertebrates resulting in patchy distributions (GHD, 2012a). Cnidarians have been recorded throughout the Abbot Point area in very low densities (<10% coverage when recorded) (GHD, 2009a).”
The <10% represents the cover of all cnidarians which include soft and hard corals, plus anemones and hydrozoans. The actual percentage cover of hard corals is considerably less and the report goes on to say:
“Ecological surveys in 2012 identified soft corals, hydroids, hard corals, anemones and one sea pen. Hard corals recorded within the PER project area consisted of individual fungid corals (BMT WBM, 2012). A similar species composition was recorded at sandy inshore locations that are consistent with the PER project area habitat (GHD, 2008, 2009a). These areas supported soft corals, sea pens, sub-massive corals, massive corals and mushroom corals. All corals observed were very small in size (<1cm to 30cm), often occurred as single coral and were very sparsely distributed across the PER project area (less than one coral per ha). Sea pens were the most frequently occurring taxa, and are considered common within soft-sediment tropical benthic systems. Mushroom corals were the second most common coral taxa and are also commonly found along the inshore coastal systems of Queensland (GHD 2008, 2009a).
Abbot Point Growth Gateway Project Environmental Impact Statement Page 28 Volume 4 – Supplement Report
Section 4 Responses to Submissions
The majority of the Abbot Point area can be classified as open substrate with a low density (1 to 10%) cover of benthic macroinvertebrates. No areas of high density and very few areas of medium density coverage were found occurring in Abbot Point. The distribution of benthic macroinvertebrates across the PER project area was patchy and varied both spatially and temporally (GHD 2008, 2009a).”
It is worth noting that the benthic surveys undertaken were comprehensive (over 500 individual sites) and details can be found in the following reports which are listed in the draft EIS and Appendix Q1 of Volume 3, with the main results summarised herein. The reports listed below are publically available:
GHD (2008). Benthic Baseline Assessment Report: Baseline Environmental Monitoring for Port of Abbot Point. Prepared for Abbot Point Multi Cargo Facility Environmental Impact Statement, June 2008
GHD (2009d). Marine Ecology Benthic Survey Report: Proposed Abbot Point Multi Cargo Facility EIS. Prepared for NQBP, September 2009
GHD (2012d). Abbot Point, Terminal 0, Terminal 2 and Terminal 3 Capital Dredging, Public Environment Report, (EPBC 2011/6213/GBRMPA G34897.1). Prepared for NQBP, December 2012
BMT WBM (2012). Port of Abbot Point Offshore Dredged Material Relocation Area Site Selection Report. Prepared for NQBP, July 2012.
There is no reference to the AIMS data provided in the submissions, and so it is assumed that this value represents the cover of hard coral at a number of manta tow and benthic habitat survey reefs in the mid-shelf and outer shelf reefs of the central GBR. Comparisons between these coral communities with the coral communities found at Abbot Point can be considered somewhat speculative.
Abbot Point Growth Gateway Project Environmental Impact Statement Page 29 Volume 4 – Supplement Report
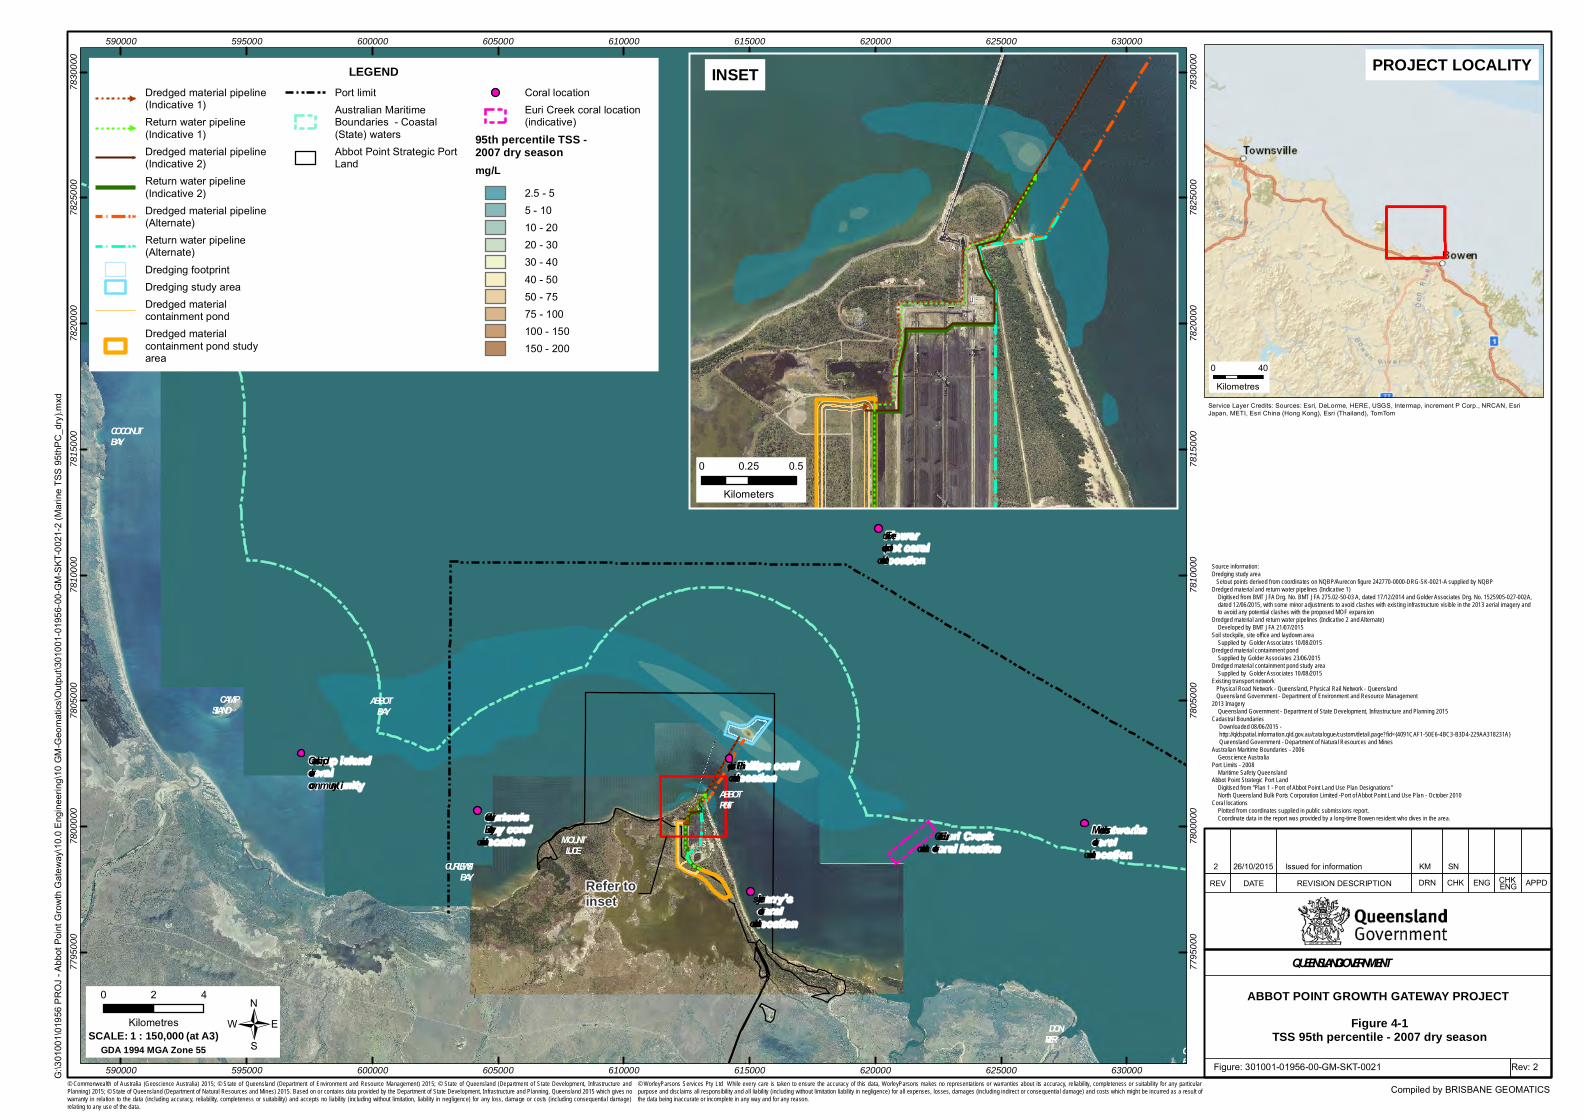
REV APPDENGCHKDRNREVISION DESCRIPTIONDATE CHK ENG
ABBOTBAY
CURLEWISBAY
CAMPISLAND
DONRIVER
MOUNTLUCE
COCONUTBAY
ABBOTPOINT
CAPEEDGECUMBE
Euri Creekcoral location
Philips corallocation
Larry’scorallocation
Flowerpot corallocation
Meatworkscorallocation
CurlewisBay corallocation
Camp islan dcoralcommun ity
590000
590000
595000
595000
600000
600000
605000
605000
610000
610000
615000
615000
620000
620000
625000
625000
630000
630000
7795
000
7795
000
7800
000
7800
000
7805
000
7805
000
7810
000
7810
000
7815
000
7815
000
7820
000
7820
000
7825
000
7825
000
7830
000
7830
000
LEGENDDredged material pipeline(Indicative 1)Return water pipeline(Indicative 1)Dredged material pipeline(Indicative 2)Return water pipeline(Indicative 2)Dredged material pipeline(Alternate)Return water pipeline(Alternate)
Dredging footprintDredging study areaDredged materialcontainment pondDredged materialcontainment pond studyarea
Port limitAustralian MaritimeBoundaries - Coastal(State) watersAbbot Point Strategic PortLand
Coral locationEuri Creek coral location(indicative)
95th percentile TSS -2007 dry seasonmg/L
2.5 - 55 - 1010 - 2020 - 3030 - 40
40 - 5050 - 7575 - 100100 - 150150 - 200
QUEENSLAND GOVERNMENT
Compiled by BRISBANE GEOMATICS
G:\3
0100
1\01
956
PR
OJ
- Abb
ot P
oint
Gro
wth
Gat
eway
\10.
0 E
ngin
eerin
g\10
GM
-Geo
mat
ics\
Out
put\3
0100
1-01
956-
00-G
M-S
KT-0
021-
2 (M
arin
e TS
S 95
thP
C_d
ry).m
xd
Figure 4-1TSS 95th percentile - 2007 dry season
Service Layer Credits: Sources: Esri, DeLorme, HERE, USGS, Intermap, increment P Corp., NRCAN, EsriJapan, METI, Esri China (Hong Kong), Esri (Thailand), TomTom
Issued for information
INSET
Refer toinset
© Commonwealth of Australia (Geoscience Australia) 2015; © State of Queensland (Department of Environment and Resource Management) 2015; © State of Queensland (Department of State Development, Infrastructure andPlanning) 2015; © State of Queensland (Department of Natural Resources and Mines) 2015. Based on or contains data provided by the Department of State Development, Infrastructure and Planning, Queensland 2015 which gives nowarranty in relation to the data (including accuracy, reliability, completeness or suitability) and accepts no liability (including without limitation, liability in negligence) for any loss, damage or costs (including consequential damage)relating to any use of the data.
© WorleyParsons Services Pty Ltd While every care is taken to ensure the accuracy of this data, WorleyParsons makes no representations or warranties about its accuracy, reliability, completeness or suitability for any particularpurpose and disclaims all responsibility and all liability (including without limitation liability in negligence) for all expenses, losses, damages (including indirect or consequential damage) and costs which might be incurred as a result ofthe data being inaccurate or incomplete in any way and for any reason.
Figure: 301001-01956-00-GM-SKT-0021
/GDA 1994 MGA Zone 55
0 2 4
Kilometres(at A3)1 : 150,000SCALE:
KM SN
ABBOT POINT GROWTH GATEWAY PROJECT
0 0.25 0.5
Kilometers
0 40
Kilometres
Source information:Dredging study area Setout points derived from coordinates on NQBP/Aurecon figure 242770-0000-DRG-SK-0021-A supplied by NQBPDredged material and return water pipelines (Indicative 1) Digitised from BMT JFA Drg. No. BMT JFA 275.02-50-03 A, dated 17/12/2014 and Golder Associates Drg. No. 1525905-027-002A, dated 12/06/2015, with some minor adjustments to avoid clashes with existing infrastructure visible in the 2013 aerial imagery and to avoid any potential clashes with the proposed MOF expansionDredged material and return water pipelines (Indicative 2 and Alternate) Developed by BMT JFA 21/07/2015Soil stockpile, site office and laydown area Supplied by Golder Associates 10/08/2015Dredged material containment pond Supplied by Golder Associates 23/06/2015Dredged material containment pond study area Supplied by Golder Associates 10/08/2015Existing transport network Physical Road Network - Queensland, Physical Rail Network - Queensland Queensland Government - Department of Environment and Resource Management2013 Imagery Queensland Government - Department of State Development, Infrastructure and Planning 2015Cadastral Boundaries Downloaded 08/06/2015 - http://qldspatial.information.qld.gov.au/catalogue/custom/detail.page?fid={4091CAF1-50E6-4BC3-B3D4-229AA318231A} Queensland Government - Department of Natural Resources and MinesAustralian Maritime Boundaries - 2006 Geoscience AustraliaPort Limits - 2008 Maritime Safety QueenslandAbbot Point Strategic Port Land Digitised from "Plan 1 - Port of Abbot Point Land Use Plan Designations" North Queensland Bulk Ports Corporation Limited -Port of Abbot Point Land Use Plan - October 2010Coral locations Plotted from coordinates supplied in public submissions report. Coordinate data in the report was provided by a long-time Bowen resident who dives in the area.
PROJECT LOCALITY
26/10/20152
Rev: 2
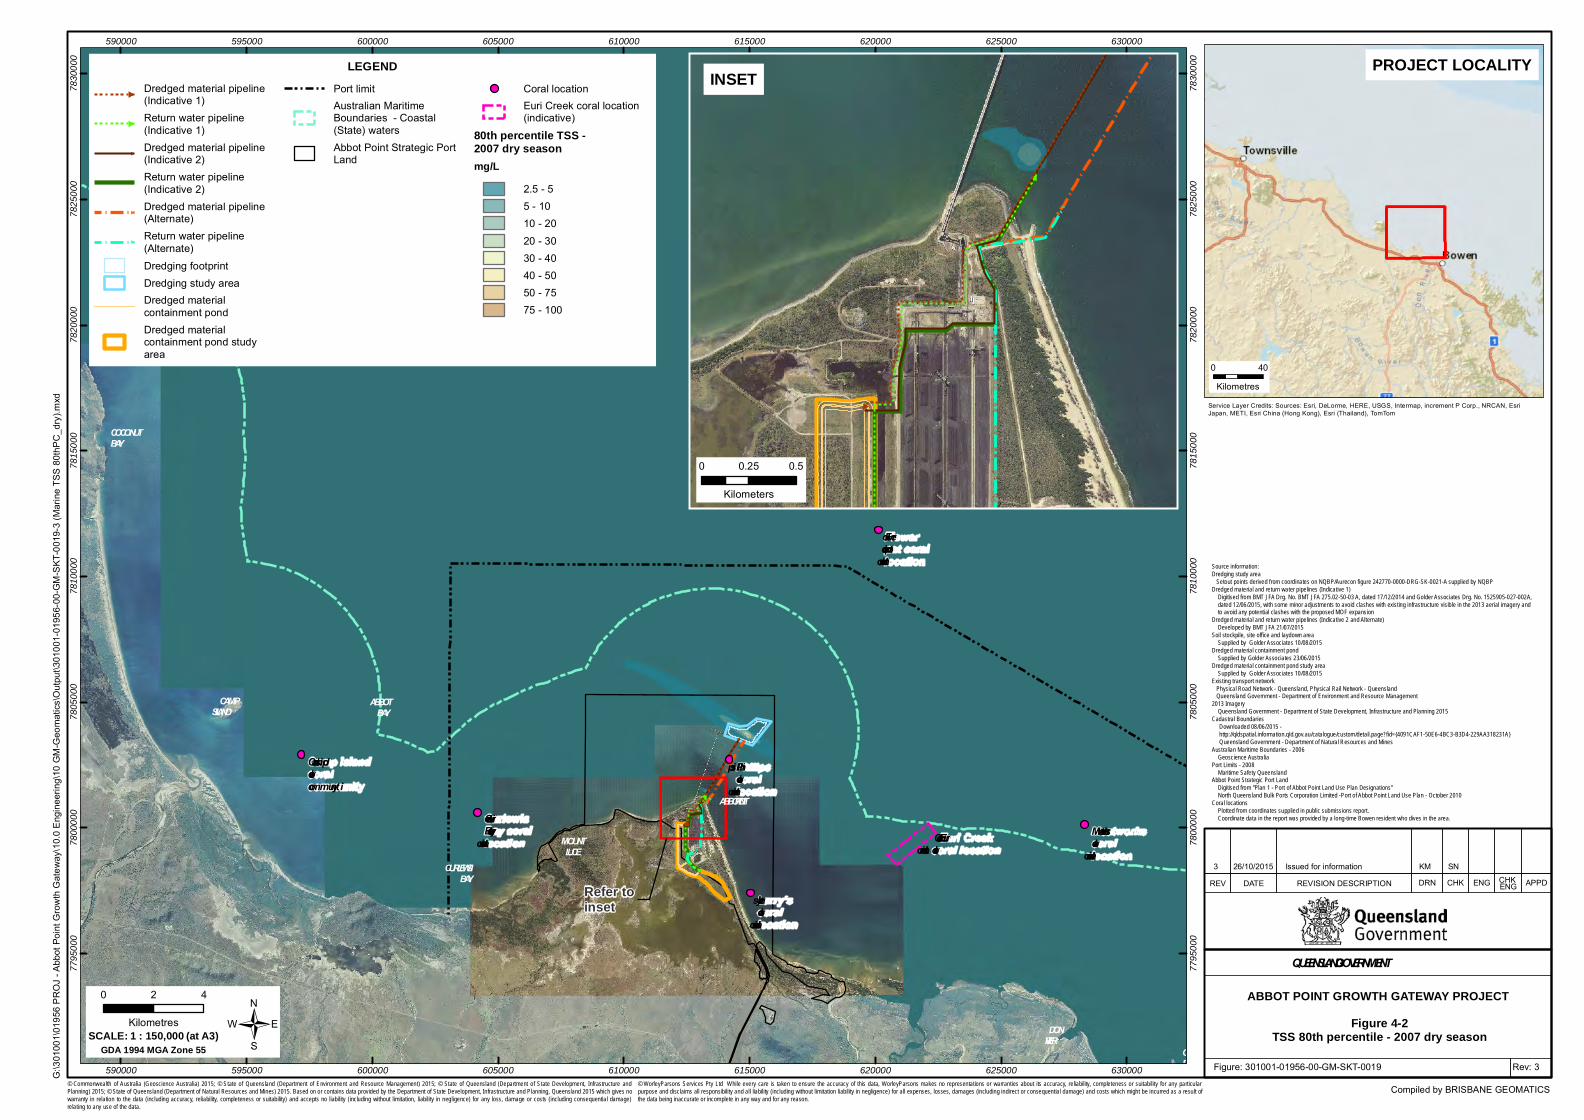
REV APPDENGCHKDRNREVISION DESCRIPTIONDATE CHK ENG
ABBOTBAY
CURLEWISBAY
CAMPISLAND
DONRIVER
MOUNTLUCE
COCONUTBAY
ABBOT POINT
CAPEEDGECUMBE
Euri Creekcoral location
Philipscorallocation
Larry’scorallocation
Flowerpot corallocation
Meatworkscorallocation
CurlewisBay corallocation
Camp islan dcoralcommun ity
590000
590000
595000
595000
600000
600000
605000
605000
610000
610000
615000
615000
620000
620000
625000
625000
630000
630000
7795
000
7795
000
7800
000
7800
000
7805
000
7805
000
7810
000
7810
000
7815
000
7815
000
7820
000
7820
000
7825
000
7825
000
7830
000
7830
000LEGEND
Dredged material pipeline(Indicative 1)Return water pipeline(Indicative 1)Dredged material pipeline(Indicative 2)Return water pipeline(Indicative 2)Dredged material pipeline(Alternate)Return water pipeline(Alternate)
Dredging footprintDredging study areaDredged materialcontainment pondDredged materialcontainment pond studyarea
Port limitAustralian MaritimeBoundaries - Coastal(State) watersAbbot Point Strategic PortLand
Coral locationEuri Creek coral location(indicative)
80th percentile TSS -2007 dry seasonmg/L
2.5 - 55 - 1010 - 20
20 - 3030 - 4040 - 5050 - 7575 - 100
QUEENSLAND GOVERNMENT
Compiled by BRISBANE GEOMATICS
Figure: 301001-01956-00-GM-SKT-0019
G:\3
0100
1\01
956
PR
OJ
- Abb
ot P
oint
Gro
wth
Gat
eway
\10.
0 E
ngin
eerin
g\10
GM
-Geo
mat
ics\
Out
put\3
0100
1-01
956-
00-G
M-S
KT-0
019-
3 (M
arin
e TS
S 80
thP
C_d
ry).m
xd
Figure 4-2TSS 80th percentile - 2007 dry season
Service Layer Credits: Sources: Esri, DeLorme, HERE, USGS, Intermap, increment P Corp., NRCAN, EsriJapan, METI, Esri China (Hong Kong), Esri (Thailand), TomTom
INSET
Refer toinset
© Commonwealth of Australia (Geoscience Australia) 2015; © State of Queensland (Department of Environment and Resource Management) 2015; © State of Queensland (Department of State Development, Infrastructure andPlanning) 2015; © State of Queensland (Department of Natural Resources and Mines) 2015. Based on or contains data provided by the Department of State Development, Infrastructure and Planning, Queensland 2015 which gives nowarranty in relation to the data (including accuracy, reliability, completeness or suitability) and accepts no liability (including without limitation, liability in negligence) for any loss, damage or costs (including consequential damage)relating to any use of the data.
© WorleyParsons Services Pty Ltd While every care is taken to ensure the accuracy of this data, WorleyParsons makes no representations or warranties about its accuracy, reliability, completeness or suitability for any particularpurpose and disclaims all responsibility and all liability (including without limitation liability in negligence) for all expenses, losses, damages (including indirect or consequential damage) and costs which might be incurred as a result ofthe data being inaccurate or incomplete in any way and for any reason.
Issued for information KM SN
ABBOT POINT GROWTH GATEWAY PROJECT
/GDA 1994 MGA Zone 55
0 2 4
Kilometres(at A3)1 : 150,000SCALE:
0 40
Kilometres
0 0.25 0.5
Kilometers
Source information:Dredging study area Setout points derived from coordinates on NQBP/Aurecon figure 242770-0000-DRG-SK-0021-A supplied by NQBPDredged material and return water pipelines (Indicative 1) Digitised from BMT JFA Drg. No. BMT JFA 275.02-50-03 A, dated 17/12/2014 and Golder Associates Drg. No. 1525905-027-002A, dated 12/06/2015, with some minor adjustments to avoid clashes with existing infrastructure visible in the 2013 aerial imagery and to avoid any potential clashes with the proposed MOF expansionDredged material and return water pipelines (Indicative 2 and Alternate) Developed by BMT JFA 21/07/2015Soil stockpile, site office and laydown area Supplied by Golder Associates 10/08/2015Dredged material containment pond Supplied by Golder Associates 23/06/2015Dredged material containment pond study area Supplied by Golder Associates 10/08/2015Existing transport network Physical Road Network - Queensland, Physical Rail Network - Queensland Queensland Government - Department of Environment and Resource Management2013 Imagery Queensland Government - Department of State Development, Infrastructure and Planning 2015Cadastral Boundaries Downloaded 08/06/2015 - http://qldspatial.information.qld.gov.au/catalogue/custom/detail.page?fid={4091CAF1-50E6-4BC3-B3D4-229AA318231A} Queensland Government - Department of Natural Resources and MinesAustralian Maritime Boundaries - 2006 Geoscience AustraliaPort Limits - 2008 Maritime Safety QueenslandAbbot Point Strategic Port Land Digitised from "Plan 1 - Port of Abbot Point Land Use Plan Designations" North Queensland Bulk Ports Corporation Limited -Port of Abbot Point Land Use Plan - October 2010Coral locations Plotted from coordinates supplied in public submissions report. Coordinate data in the report was provided by a long-time Bowen resident who dives in the area.
PROJECT LOCALITY
26/10/20153
Rev: 3
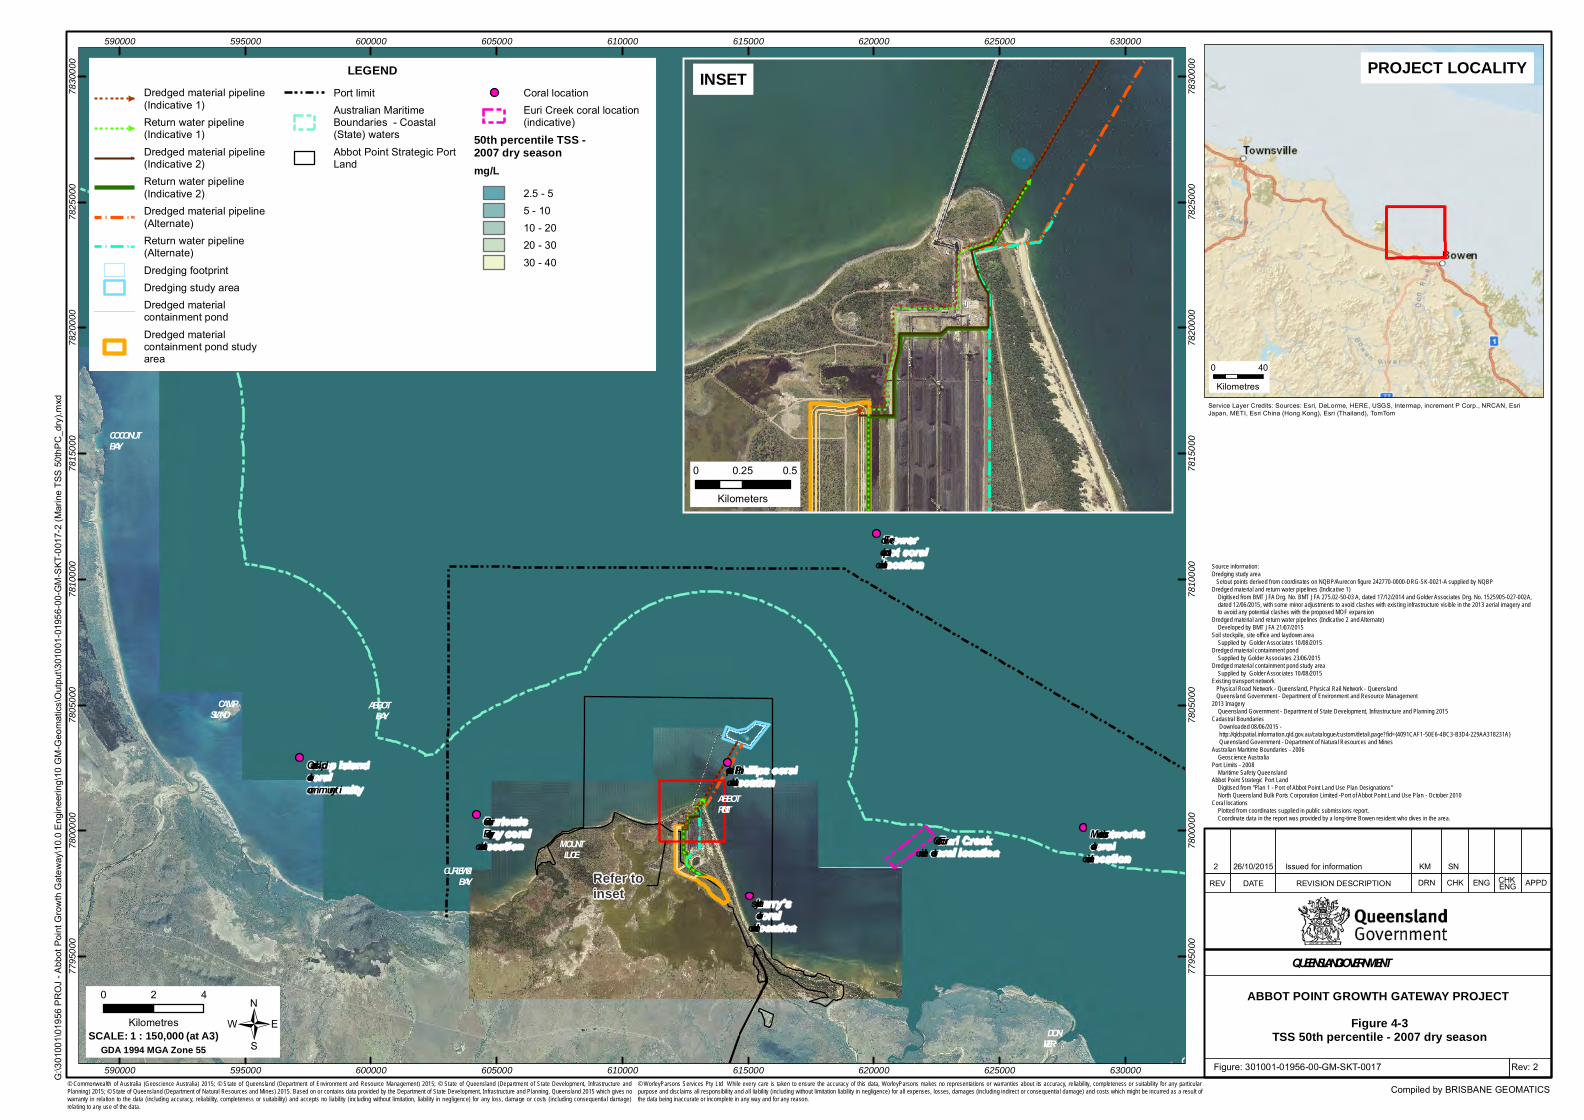
REV APPDENGCHKDRNREVISION DESCRIPTIONDATE CHK ENG
ABBOTBAY
CURLEWISBAY
CAMPISLAND
DONRIVER
MOUNTLUCE
COCONUTBAY
ABBOTPOINT
CAPE EDGECUMBE
Euri Creekcoral location
Philips corallocation
Larry’scorallocation
Flowerpot corallocation
Meatworkscorallocation
CurlewisBay corallocation
Camp islan dcoralcommun ity
590000
590000
595000
595000
600000
600000
605000
605000
610000
610000
615000
615000
620000
620000
625000
625000
630000
630000
7795
000
7795
000
7800
000
7800
000
7805
000
7805
000
7810
000
7810
000
7815
000
7815
000
7820
000
7820
000
7825
000
7825
000
7830
000
7830
000LEGEND
Dredged material pipeline(Indicative 1)Return water pipeline(Indicative 1)
Dredged material pipeline(Indicative 2)Return water pipeline(Indicative 2)Dredged material pipeline(Alternate)Return water pipeline(Alternate)
Dredging footprintDredging study areaDredged materialcontainment pond
Dredged materialcontainment pond studyarea
Port limitAustralian MaritimeBoundaries - Coastal(State) waters
Abbot Point Strategic PortLand
Coral locationEuri Creek coral location(indicative)
50th percentile TSS -2007 dry seasonmg/L
2.5 - 55 - 1010 - 2020 - 30
30 - 40
QUEENSLAND GOVERNMENT
Compiled by BRISBANE GEOMATICS
Figure: 301001-01956-00-GM-SKT-0017
G:\3
0100
1\01
956
PR
OJ
- Abb
ot P
oint
Gro
wth
Gat
eway
\10.
0 E
ngin
eerin
g\10
GM
-Geo
mat
ics\
Out
put\3
0100
1-01
956-
00-G
M-S
KT-0
017-
2 (M
arin
e TS
S 50
thP
C_d
ry).m
xd
Figure 4-3TSS 50th percentile - 2007 dry season
Service Layer Credits: Sources: Esri, DeLorme, HERE, USGS, Intermap, increment P Corp., NRCAN, EsriJapan, METI, Esri China (Hong Kong), Esri (Thailand), TomTom
26/10/20152 Issued for information KM SN
Rev: 2
INSET
Refer toinset
© Commonwealth of Australia (Geoscience Australia) 2015; © State of Queensland (Department of Environment and Resource Management) 2015; © State of Queensland (Department of State Development, Infrastructure andPlanning) 2015; © State of Queensland (Department of Natural Resources and Mines) 2015. Based on or contains data provided by the Department of State Development, Infrastructure and Planning, Queensland 2015 which gives nowarranty in relation to the data (including accuracy, reliability, completeness or suitability) and accepts no liability (including without limitation, liability in negligence) for any loss, damage or costs (including consequential damage)relating to any use of the data.
© WorleyParsons Services Pty Ltd While every care is taken to ensure the accuracy of this data, WorleyParsons makes no representations or warranties about its accuracy, reliability, completeness or suitability for any particularpurpose and disclaims all responsibility and all liability (including without limitation liability in negligence) for all expenses, losses, damages (including indirect or consequential damage) and costs which might be incurred as a result ofthe data being inaccurate or incomplete in any way and for any reason.
ABBOT POINT GROWTH GATEWAY PROJECT
/GDA 1994 MGA Zone 55
0 2 4
Kilometres(at A3)1 : 150,000SCALE:
0 40
Kilometres
0 0.25 0.5
Kilometers
PROJECT LOCALITY
Source information:Dredging study area Setout points derived from coordinates on NQBP/Aurecon figure 242770-0000-DRG-SK-0021-A supplied by NQBPDredged material and return water pipelines (Indicative 1) Digitised from BMT JFA Drg. No. BMT JFA 275.02-50-03 A, dated 17/12/2014 and Golder Associates Drg. No. 1525905-027-002A, dated 12/06/2015, with some minor adjustments to avoid clashes with existing infrastructure visible in the 2013 aerial imagery and to avoid any potential clashes with the proposed MOF expansionDredged material and return water pipelines (Indicative 2 and Alternate) Developed by BMT JFA 21/07/2015Soil stockpile, site office and laydown area Supplied by Golder Associates 10/08/2015Dredged material containment pond Supplied by Golder Associates 23/06/2015Dredged material containment pond study area Supplied by Golder Associates 10/08/2015Existing transport network Physical Road Network - Queensland, Physical Rail Network - Queensland Queensland Government - Department of Environment and Resource Management2013 Imagery Queensland Government - Department of State Development, Infrastructure and Planning 2015Cadastral Boundaries Downloaded 08/06/2015 - http://qldspatial.information.qld.gov.au/catalogue/custom/detail.page?fid={4091CAF1-50E6-4BC3-B3D4-229AA318231A} Queensland Government - Department of Natural Resources and MinesAustralian Maritime Boundaries - 2006 Geoscience AustraliaPort Limits - 2008 Maritime Safety QueenslandAbbot Point Strategic Port Land Digitised from "Plan 1 - Port of Abbot Point Land Use Plan Designations" North Queensland Bulk Ports Corporation Limited -Port of Abbot Point Land Use Plan - October 2010Coral locations Plotted from coordinates supplied in public submissions report. Coordinate data in the report was provided by a long-time Bowen resident who dives in the area.
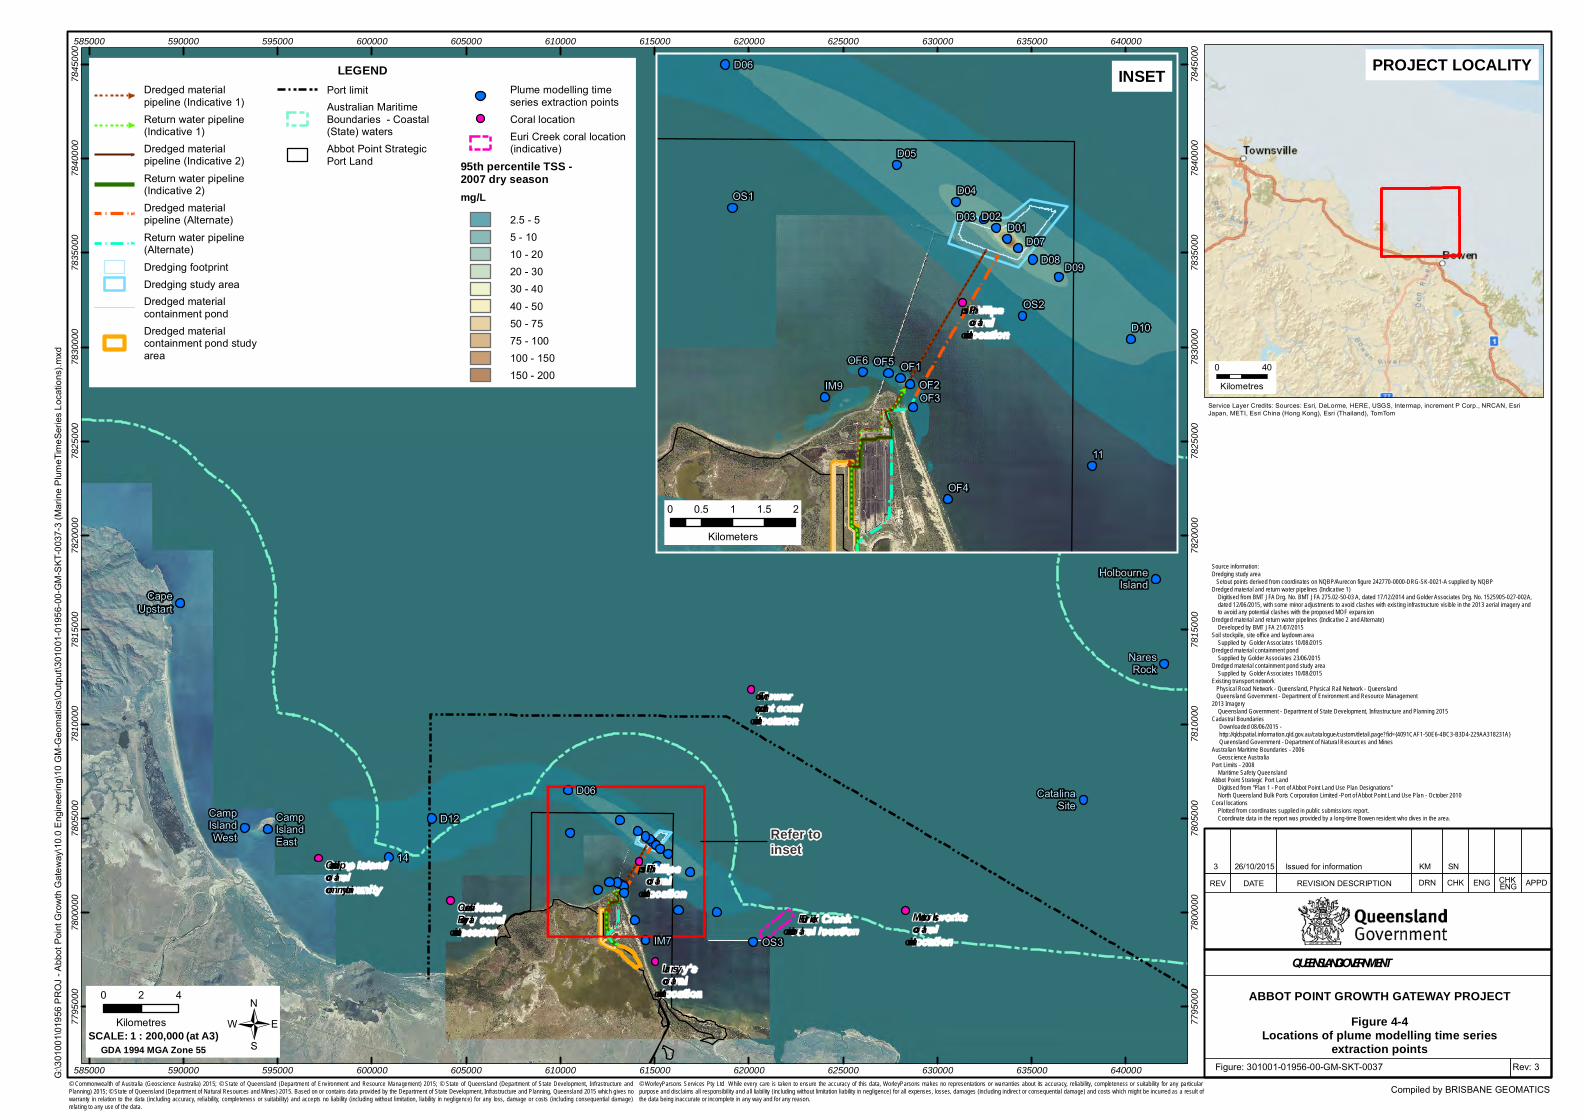
REV APPDENGCHKDRNREVISION DESCRIPTIONDATE CHK ENG
14
OS3IM7
D06
D12
CapeUpstart
CampIslandEast
CampIslandWest
HolbourneIsland
NaresRock
CatalinaSite
Euri Creekcoral location
Philipscorallocation
Larry’scorallocation
Flowerpot corallocation
Meatworkscorallocation
CurlewisBay corallocation
Camp islandcoralcommunity
585000
585000
590000
590000
595000
595000
600000
600000
605000
605000
610000
610000
615000
615000
620000
620000
625000
625000
630000
630000
635000
635000
640000
640000
7795
000
7795
000
7800
000
7800
000
7805
000
7805
000
7810
000
7810
000
7815
000
7815
000
7820
000
7820
000
7825
000
7825
000
7830
000
7830
000
7835
000
7835
000
7840
000
7840
000
7845
000
7845
000
LEGENDDredged materialpipeline (Indicative 1)Return water pipeline(Indicative 1)Dredged materialpipeline (Indicative 2)
Return water pipeline(Indicative 2)Dredged materialpipeline (Alternate)
Return water pipeline(Alternate)
Dredging footprintDredging study areaDredged materialcontainment pondDredged materialcontainment pond studyarea
Port limitAustralian MaritimeBoundaries - Coastal(State) watersAbbot Point StrategicPort Land
Plume modelling timeseries extraction pointsCoral locationEuri Creek coral location(indicative)
95th percentile TSS -2007 dry seasonmg/L
2.5 - 55 - 1010 - 2020 - 3030 - 40
40 - 5050 - 7575 - 100100 - 150150 - 200
QUEENSLAND GOVERNMENT
Compiled by BRISBANE GEOMATICS
G:\3
0100
1\01
956
PR
OJ
- Abb
ot P
oint
Gro
wth
Gat
eway
\10.
0 E
ngin
eerin
g\10
GM
-Geo
mat
ics\
Out
put\3
0100
1-01
956-
00-G
M-S
KT-0
037-
3 (M
arin
e P
lum
eTim
eSer
ies
Loca
tions
).mxd
Figure 4-4Locations of plume modelling time series
extraction points
Service Layer Credits: Sources: Esri, DeLorme, HERE, USGS, Intermap, increment P Corp., NRCAN, EsriJapan, METI, Esri China (Hong Kong), Esri (Thailand), TomTom
3 Issued for information
11
IM9
OS1
OF1
OF2OF3
OF4
OF5OF6
D01D02D03
D04
D05
D06
D07
D08D09
D10
OS2Philipscorallocation
INSET
Refer toinset
© Commonwealth of Australia (Geoscience Australia) 2015; © State of Queensland (Department of Environment and Resource Management) 2015; © State of Queensland (Department of State Development, Infrastructure andPlanning) 2015; © State of Queensland (Department of Natural Resources and Mines) 2015. Based on or contains data provided by the Department of State Development, Infrastructure and Planning, Queensland 2015 which gives nowarranty in relation to the data (including accuracy, reliability, completeness or suitability) and accepts no liability (including without limitation, liability in negligence) for any loss, damage or costs (including consequential damage)relating to any use of the data.
© WorleyParsons Services Pty Ltd While every care is taken to ensure the accuracy of this data, WorleyParsons makes no representations or warranties about its accuracy, reliability, completeness or suitability for any particularpurpose and disclaims all responsibility and all liability (including without limitation liability in negligence) for all expenses, losses, damages (including indirect or consequential damage) and costs which might be incurred as a result ofthe data being inaccurate or incomplete in any way and for any reason.
Figure: 301001-01956-00-GM-SKT-0037
26/10/2015
ABBOT POINT GROWTH GATEWAY PROJECT
/GDA 1994 MGA Zone 55
0 2 4
Kilometres(at A3)1 : 200,000SCALE:
0 0.5 1 1.5 2
Kilometers
Rev: 3
Source information:Dredging study area Setout points derived from coordinates on NQBP/Aurecon figure 242770-0000-DRG-SK-0021-A supplied by NQBPDredged material and return water pipelines (Indicative 1) Digitised from BMT JFA Drg. No. BMT JFA 275.02-50-03 A, dated 17/12/2014 and Golder Associates Drg. No. 1525905-027-002A, dated 12/06/2015, with some minor adjustments to avoid clashes with existing infrastructure visible in the 2013 aerial imagery and to avoid any potential clashes with the proposed MOF expansionDredged material and return water pipelines (Indicative 2 and Alternate) Developed by BMT JFA 21/07/2015Soil stockpile, site office and laydown area Supplied by Golder Associates 10/08/2015Dredged material containment pond Supplied by Golder Associates 23/06/2015Dredged material containment pond study area Supplied by Golder Associates 10/08/2015Existing transport network Physical Road Network - Queensland, Physical Rail Network - Queensland Queensland Government - Department of Environment and Resource Management2013 Imagery Queensland Government - Department of State Development, Infrastructure and Planning 2015Cadastral Boundaries Downloaded 08/06/2015 - http://qldspatial.information.qld.gov.au/catalogue/custom/detail.page?fid={4091CAF1-50E6-4BC3-B3D4-229AA318231A} Queensland Government - Department of Natural Resources and MinesAustralian Maritime Boundaries - 2006 Geoscience AustraliaPort Limits - 2008 Maritime Safety QueenslandAbbot Point Strategic Port Land Digitised from "Plan 1 - Port of Abbot Point Land Use Plan Designations" North Queensland Bulk Ports Corporation Limited -Port of Abbot Point Land Use Plan - October 2010Coral locations Plotted from coordinates supplied in public submissions report. Coordinate data in the report was provided by a long-time Bowen resident who dives in the area.
PROJECT LOCALITY
KM SN
0 40
Kilometres
Section 4 Responses to Submissions
4.1.2.3 Seagrasses Submitters raised concerns about seagrass loss associated with dredging, including the effects of this on local habitat and therefore fisheries resources and important ecosystem services. In particular, comments expressed that marine megafauna (dolphins, turtles, whales, Dugongs) may be negatively affected, and that local seagrasses may be critical foraging areas for these species. Some submissions also requested that the methodology for seagrass offsets be outlined in more detail and that it be clarified whether seagrass would be returned to pre-disturbance levels upon completion of dredging.
Extent of seagrass loss The use of the term ‘seagrass meadow’ in some submissions is misused. The seagrass growing in the apron area and surrounds is very sparse, and in some years (growing season and non-growing season surveys) cannot be found. Recent surveys in and around (38 individual survey sites) in the December 2014 (growing season) used two methods to collect information on the seagrass in the area (refer to seagrass section of Volume 3, Appendix Q1).
The first method involves dragging a small sled along the seafloor for a certain time and distance (attached to a boat via a tether) which ‘collects’ samples of seagrass that can then be examined. The second method utilises boat-towed video footage of the seafloor which can be examined later to account for the percentage cover of the seagrass, or how much is there.
These surveys found small specimens of seagrass at one site in the apron area in the sled tows, while no seagrass was observed in the towed video footage at any survey sites in the berth pockets or apron areas. The area of seagrass found in the proposed dredging footprint consisted of <1% cover of the deepwater seagrass Halophila decipiens.
The area of deepwater seagrass habitat that will definitely be impacted (i.e. removed) is 10.5ha, which represents <0.04% of the available seagrass habitat mapped at Abbot Point. This assumes that the seagrass cover in this area is 100%, although the actual maximum seagrass cover found was recorded to be between 1% and 5%. There is an additional 27,000ha of mapped seagrass available outside the berth pockets and apron area. It is therefore considered highly unlikely that Dugongs traversing between regions will be impacted by the loss of 0.04% of sparsely covered seagrass that in a given year may not actually grow. Instead it is likely that Dugongs would not rely on these ephemeral deepwater seagrass patches that are occasionally found in the berth pocket or apron areas. Details on the reasons why it is unlikely that the project area supports locally important dugong habitat or an ecologically significant proportion of the Dugong population in Australia are provided in Section 4.1.4 of the Marine Ecology Technical Report (Volume 3, Appendix Q1).
The impact assessment uses the largest extent of seagrass habitat recorded in all surveys (i.e. data from the 2008 survey), which assumes that when the dredging occurs there will be sparse seagrass growing in these areas. The outer boundary of the seagrass habitat is the area which will be primarily impacted by the loss of light from dredging plumes. At this boundary, the seagrass from growing season to growing season fluctuates based on the natural conditions that the seagrass experiences leading up to the growing season.
Abbot Point Growth Gateway Project Environmental Impact Statement Page 34 Volume 4 – Supplement Report
Section 4 Responses to Submissions
In the event that the dredging plume does enter an area where seagrass is present for a duration and at a concentration which reduces light levels below those required to maintain seagrass, then a temporary impact may occur to this seagrass. Seagrass will, however, re-establish at this outer boundary in the following growing season based on the available seed banks. In the event that natural events in the following season also impact on this same seagrass community, then the length of recovery may be extended to the following season.
Seagrass regrowth in the apron area
The resilience of deepwater seagrasses at Abbot Point
All seagrass areas at Abbot Point were negatively impacted by Tropical Cyclone Yasi in 2011 and successive years of La Niña climate patterns which caused large flooding events (Rasheed et al. 2014). The impacts of these climatic events on the nearshore seagrass communities included physical disturbance of seabed sediments, damage to the above ground structure of the seagrass, and reduced benthic light as the result of floods and elevated suspended solids. The deepwater seagrass biomass in the Abbot Point study area was reduced to near zero. Since these impacts the recolonisation and recovery (as exhibited by the increase in biomass) has occurred in these deep water offshore seagrass meadows (Rasheed et al. 2014). The deepwater seagrass community is predominantly comprised of the seagrass species, Halophila spp.
Halophila species are small bodied seagrasses that exhibit fast growth habits, are considered well adapted for recovery after disturbance events and are able to exploit resources under high light conditions (Longstaff et al. 1999; McMillan 1991; Hammerstrom et al. 2006; Ralph et al. 2007). Disturbance experiments at Abbot Point demonstrated that Halophila spp. can recover quickly (approximately three months) through a combination of sexual and asexual reproduction and were capable of complete meadow turnover of biomass within 10 days, based on productivity measurements (Unsworth et al., 2010; Rasheed et al., 2014). Halophila species typically produce large seed banks; 134m2 to 13,500m2 (McMillan, 1988; Hammerstrom et al., 2006) and seeds from this species remain viable in the upper layers of sediment for several years.
Halophila species seeds tend to be negatively buoyant and spread across the seabed via wave and tidal induced bottom currents (Ruiz-Montoya et al., 2012). These seeds tend to travel small distances in vegetated areas but much further in un-vegetated areas (Koch et al., 2010); the distance travelled varies depending upon the hydrodynamic setting of the area. Secondary movement of seeds once settled is possible in higher bed stress situations (Koch et al., 2010).
The seafloor in the apron area of the T0 dredging footprints is flat and featureless, and surface sediments are easily disturbed during elevated wind and wave events. Extensive resuspension of the natural bed sediments has occurred at deeper areas at Abbot Point during baseline water quality studies undertaken between February 2012 and July 2014. Total suspended solid concentrations measured at deep water monitoring sites at Abbot Point (10m to 15m) during cyclone Dylan in 2014 peaked above 100mg/L and remained above 20mg/L for up to 8 days before, during and after the cyclone passed (Volume 3, Appendix N – Hydrodynamic Modelling). The highest TSS concentration of 948mg/L was recorded at a 10m baseline water quality station (WQ6; Refer to Appendix Q1 of Volume 3) during the next cyclone to pass through the area (Tropical Cyclone Ita).
Abbot Point Growth Gateway Project Environmental Impact Statement Page 35 Volume 4 – Supplement Report
Section 4 Responses to Submissions
T0 apron seafloor sediment characteristics after dredging
The sediment characteristics of the seabed in the T0 apron area were characterised as part of the Abbot Point T0, T2 and T3 Capital Dredging PER (GHD, 2012b). Specific details of the actual sediments in the T0, T2 and T3 berth and apron area are discussed in Abbot Point, Terminals 0, 2 and 3 Capital Dredging Sediment Sampling and Analysis Plan Implementation Report (GHD, 2012b). The samples of interest, when assessing the suitability of the sediments for seagrass re-establishment, were collected in the T0 apron area in 2012 (GHD, 2012b; Table 4-1and Figure 4-5).
Sampling sites SC55, 56 and 57 as shown in Figure 4-5 are located outside the proposed T0 dredging area.
All sediment cores collected in the apron area achieved depths greater than -18.5m LAT, below the required dredging depth of the T0 apron area. (Table 4-1). Descriptions of the sediments in the top 0.1m to 1.5m of the cores from the apron area provide information on the potential sediment characteristics of the resulting seabed once dredging of the apron areas is complete. Sediment descriptions in CAPITALS refer to the dominant sediment type in each core layer. Descriptions in bold represent the potential seabed characteristics after dredging is complete based on the core description. At most sites sampled the required dredging level of -18.5m LAT is already achieved or requires the removal of only the top 0.1m to 0.5 m of sediment.
The sediment of the existing seabed contains various mixtures of sand, silt, clay, shell grit, and whole shells, and the consistency is generally wet and loose. Once dredging of the apron is complete, the seabed will not be unlike the current seabed except for slightly higher levels of clay in some areas; the consistency will remain wet and loose (Table 4-1). In all cases, the stiff clay layer encountered at corer refusal is well below the level of the proposed dredge depth.
The resultant sediment characteristics of the seafloor after dredging will also be influenced by the fugitive sediment released during the dredging process.
Abbot Point Growth Gateway Project Environmental Impact Statement Page 36 Volume 4 – Supplement Report

Section 4 Responses to Submissions
Source: GHD (2012b)
Figure 4-5 Sampling locations of interest
Abbot Point Growth Gateway Project Environmental Impact Statement Page 37 Volume 4 – Supplement Report
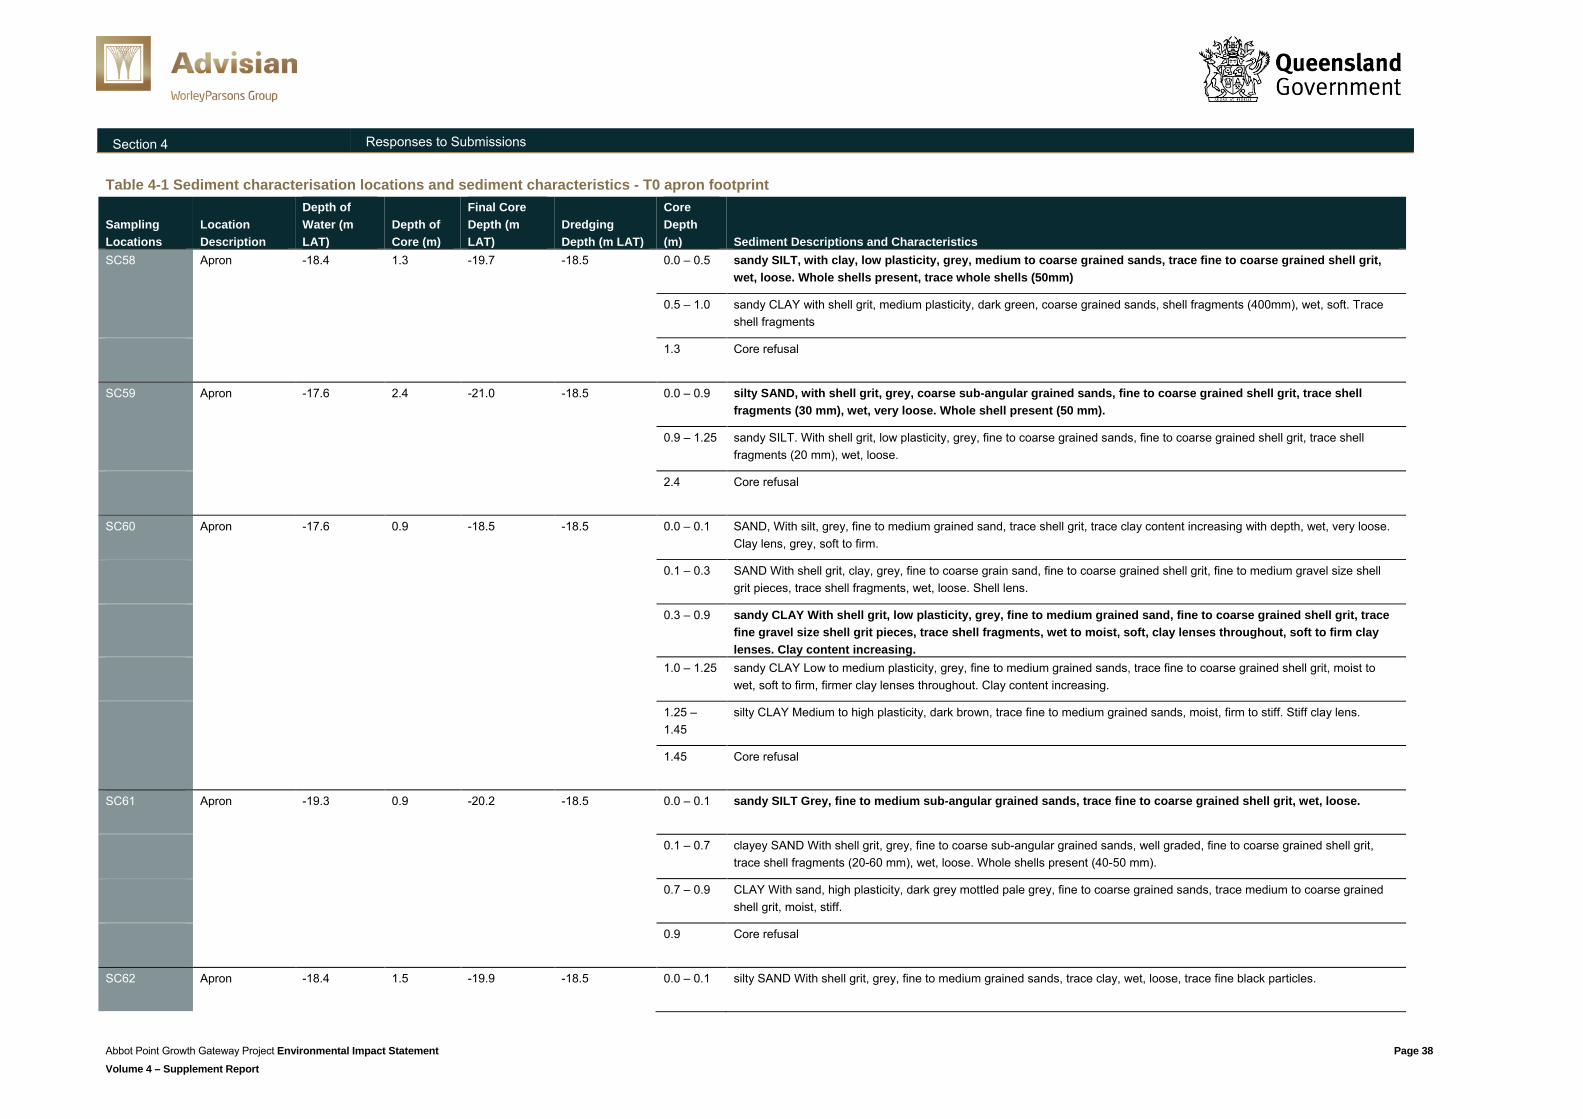
Section 4 Responses to Submissions
Table 4-1 Sediment characterisation locations and sediment characteristics - T0 apron footprint
Sampling Locations
Location Description
Depth of Water (m LAT)
Depth of Core (m)
Final Core Depth (m LAT)
Dredging Depth (m LAT)
Core Depth (m) Sediment Descriptions and Characteristics
SC58 Apron -18.4 1.3 -19.7 -18.5 0.0 – 0.5 sandy SILT, with clay, low plasticity, grey, medium to coarse grained sands, trace fine to coarse grained shell grit, wet, loose. Whole shells present, trace whole shells (50mm)
0.5 – 1.0 sandy CLAY with shell grit, medium plasticity, dark green, coarse grained sands, shell fragments (400mm), wet, soft. Trace shell fragments
1.3 Core refusal
SC59 Apron -17.6 2.4 -21.0 -18.5 0.0 – 0.9 silty SAND, with shell grit, grey, coarse sub-angular grained sands, fine to coarse grained shell grit, trace shell fragments (30 mm), wet, very loose. Whole shell present (50 mm).
0.9 – 1.25 sandy SILT. With shell grit, low plasticity, grey, fine to coarse grained sands, fine to coarse grained shell grit, trace shell fragments (20 mm), wet, loose.
2.4 Core refusal
SC60 Apron -17.6 0.9 -18.5 -18.5 0.0 – 0.1 SAND, With silt, grey, fine to medium grained sand, trace shell grit, trace clay content increasing with depth, wet, very loose. Clay lens, grey, soft to firm.
0.1 – 0.3 SAND With shell grit, clay, grey, fine to coarse grain sand, fine to coarse grained shell grit, fine to medium gravel size shell grit pieces, trace shell fragments, wet, loose. Shell lens.
0.3 – 0.9 sandy CLAY With shell grit, low plasticity, grey, fine to medium grained sand, fine to coarse grained shell grit, trace fine gravel size shell grit pieces, trace shell fragments, wet to moist, soft, clay lenses throughout, soft to firm clay lenses. Clay content increasing.
1.0 – 1.25 sandy CLAY Low to medium plasticity, grey, fine to medium grained sands, trace fine to coarse grained shell grit, moist to wet, soft to firm, firmer clay lenses throughout. Clay content increasing.
1.25 – 1.45
silty CLAY Medium to high plasticity, dark brown, trace fine to medium grained sands, moist, firm to stiff. Stiff clay lens.
1.45 Core refusal
SC61 Apron -19.3 0.9 -20.2 -18.5 0.0 – 0.1 sandy SILT Grey, fine to medium sub-angular grained sands, trace fine to coarse grained shell grit, wet, loose.
0.1 – 0.7 clayey SAND With shell grit, grey, fine to coarse sub-angular grained sands, well graded, fine to coarse grained shell grit, trace shell fragments (20-60 mm), wet, loose. Whole shells present (40-50 mm).
0.7 – 0.9 CLAY With sand, high plasticity, dark grey mottled pale grey, fine to coarse grained sands, trace medium to coarse grained shell grit, moist, stiff.
0.9 Core refusal
SC62 Apron -18.4 1.5 -19.9 -18.5 0.0 – 0.1 silty SAND With shell grit, grey, fine to medium grained sands, trace clay, wet, loose, trace fine black particles.
Abbot Point Growth Gateway Project Environmental Impact Statement Page 38
Volume 4 – Supplement Report
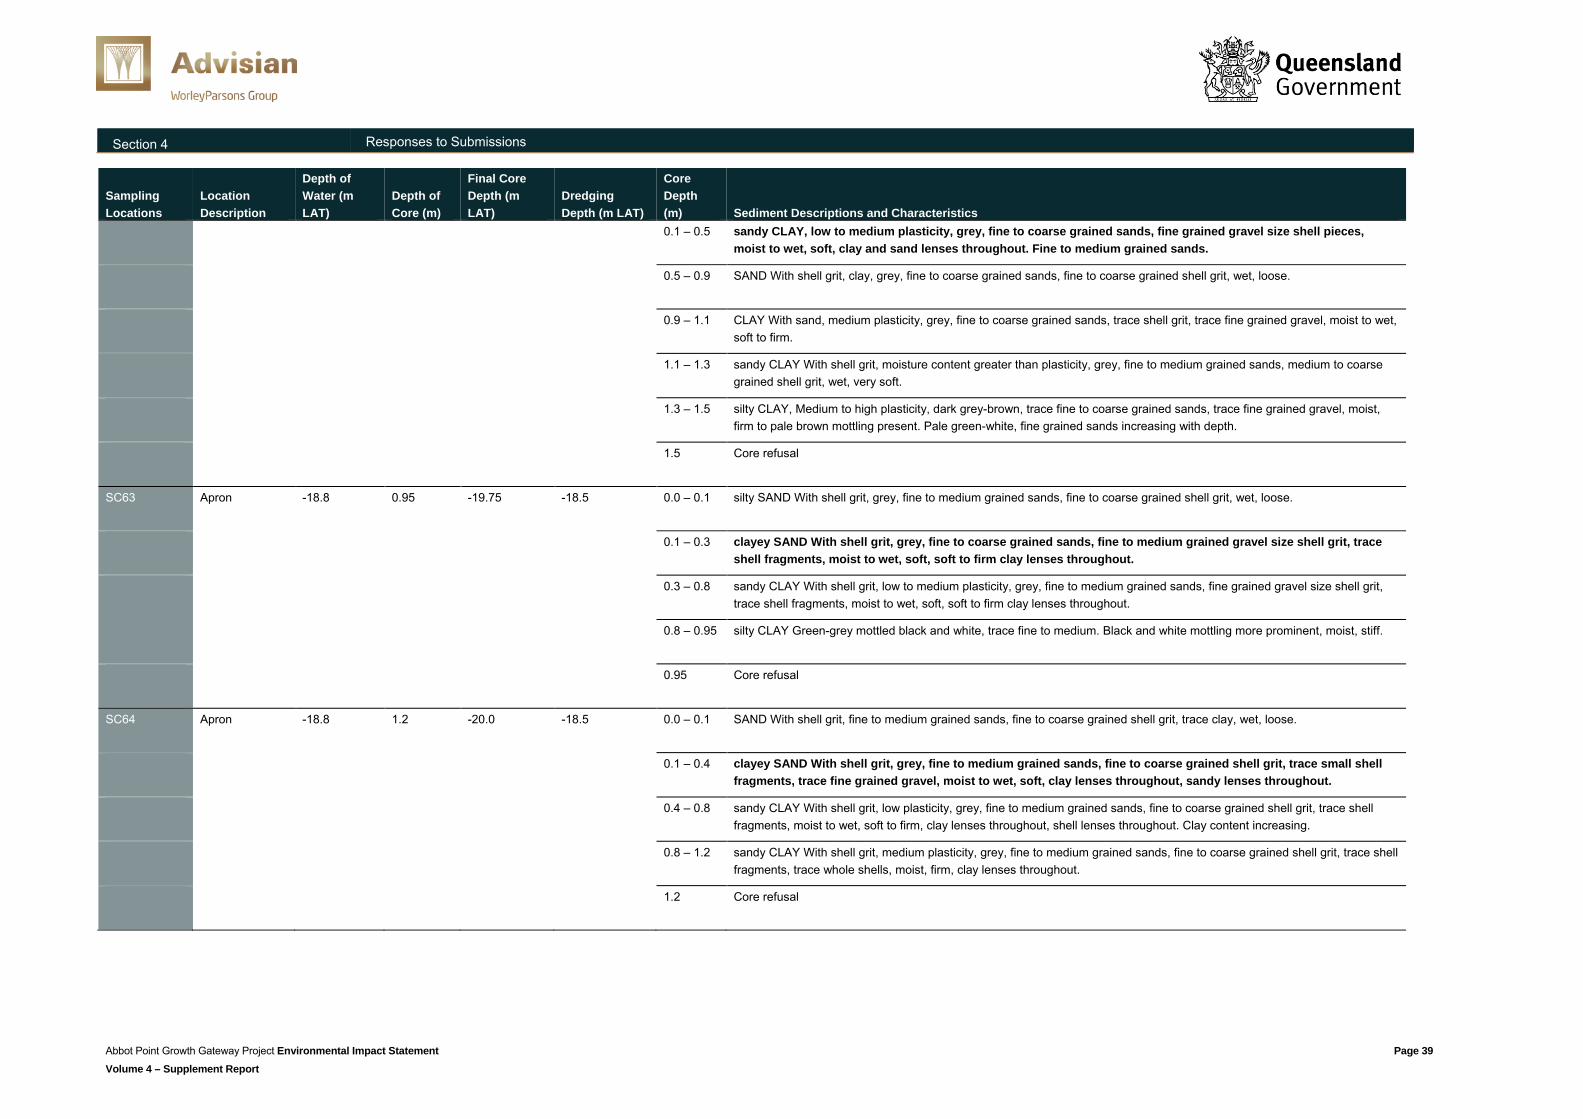
Section 4 Responses to Submissions
Sampling Locations
Location Description
Depth of Water (m LAT)
Depth of Core (m)
Final Core Depth (m LAT)
Dredging Depth (m LAT)
Core Depth (m) Sediment Descriptions and Characteristics
0.1 – 0.5 sandy CLAY, low to medium plasticity, grey, fine to coarse grained sands, fine grained gravel size shell pieces, moist to wet, soft, clay and sand lenses throughout. Fine to medium grained sands.
0.5 – 0.9 SAND With shell grit, clay, grey, fine to coarse grained sands, fine to coarse grained shell grit, wet, loose.
0.9 – 1.1 CLAY With sand, medium plasticity, grey, fine to coarse grained sands, trace shell grit, trace fine grained gravel, moist to wet, soft to firm.
1.1 – 1.3 sandy CLAY With shell grit, moisture content greater than plasticity, grey, fine to medium grained sands, medium to coarse grained shell grit, wet, very soft.
1.3 – 1.5 silty CLAY, Medium to high plasticity, dark grey-brown, trace fine to coarse grained sands, trace fine grained gravel, moist, firm to pale brown mottling present. Pale green-white, fine grained sands increasing with depth.
1.5 Core refusal
SC63 Apron -18.8 0.95 -19.75 -18.5 0.0 – 0.1 silty SAND With shell grit, grey, fine to medium grained sands, fine to coarse grained shell grit, wet, loose.
0.1 – 0.3 clayey SAND With shell grit, grey, fine to coarse grained sands, fine to medium grained gravel size shell grit, trace shell fragments, moist to wet, soft, soft to firm clay lenses throughout.
0.3 – 0.8 sandy CLAY With shell grit, low to medium plasticity, grey, fine to medium grained sands, fine grained gravel size shell grit, trace shell fragments, moist to wet, soft, soft to firm clay lenses throughout.
0.8 – 0.95 silty CLAY Green-grey mottled black and white, trace fine to medium. Black and white mottling more prominent, moist, stiff.
0.95 Core refusal
SC64 Apron -18.8 1.2 -20.0 -18.5 0.0 – 0.1 SAND With shell grit, fine to medium grained sands, fine to coarse grained shell grit, trace clay, wet, loose.
0.1 – 0.4 clayey SAND With shell grit, grey, fine to medium grained sands, fine to coarse grained shell grit, trace small shell fragments, trace fine grained gravel, moist to wet, soft, clay lenses throughout, sandy lenses throughout.
0.4 – 0.8 sandy CLAY With shell grit, low plasticity, grey, fine to medium grained sands, fine to coarse grained shell grit, trace shell fragments, moist to wet, soft to firm, clay lenses throughout, shell lenses throughout. Clay content increasing.
0.8 – 1.2 sandy CLAY With shell grit, medium plasticity, grey, fine to medium grained sands, fine to coarse grained shell grit, trace shell fragments, trace whole shells, moist, firm, clay lenses throughout.
1.2 Core refusal
Abbot Point Growth Gateway Project Environmental Impact Statement Page 39
Volume 4 – Supplement Report
Section 4 Responses to Submissions
Fugitive sediment from dredging
The TSS, bed thickness and sedimentation parameters due to the dredging of the apron area were estimated at the end of every hour during the hydrodynamic modelling exercise of the dredging operation (Volume 3, Appendix N and Appendix Q1). At location D01 (Figure 4-6), the time series data for all parameters were extracted and is presented graphically in Figure 4-7. The data indicates that within the apron dredging area there is a net deposition (represented as bed thickness) of fugitive fines (coarse sands to fine silts) onto the exposed new substrate up to 45mm deep in some areas (see Figure 4-7, bottom graph). The sediment fraction that settles with 500m of the dredge area is the coarser fractions such as sand and coarse silt. The finer sediment fractions, such as fine silt and clays make up the majority of the suspended sediments in the plume which is shown to travel further afield before settlement of these sediments occurs.
Over the course of dredging, a layer of fugitive coarse sediments would form an upper layer on top of the post dredging seabed. These coarser sediments will be incorporated into the bed sediments over a short time period. It is also likely that a small proportion of the fugitive sediment released during dredging will contain viable Halophila spp. seeds. These seeds are likely to aid in the seagrass recolonisation of the apron area.
Additional deposition and resuspension of layers of sands and silts onto the exposed seabed will occur during daily cycles and during more extreme events after dredging. It is likely that seagrass will eventually re-establish on the resultant seabed over successive growing seasons.
An example of deepwater seagrass recovery onto large highly disturbed areas is presented below.
Seagrass recovery at Hay Point after the capital dredging in 2006
York et al. (2015) examined the impacts of a very large capital dredging campaign at Hay Point in 2006 on nearby seagrass communities. The dredging campaign lasted 8 months and resulted in the removal of up to 9Mm3 of seabed material and the disposal of this material to a nearby spoil ground.
Despite mortality of the existing seagrass at the spoil location, the newly formed seabed, recolonised within a short period of time.
The disturbance created by the capital dredging program at Hay Point caused greatly reduced benthic light levels, and prolonged elevated sedimentation exposure. The study (also see Chartrand et al., 2008) found that initial deepwater seagrass recovery occurred several months after dredging at two monitoring sites in the following growing season (2007). Seagrass recovery began at all other monitoring sites within eight months of the completion of dredging, including sites where dredged spoil material was deposited.
The seabed at the spoil ground site was covered with >50 cm of dredged sediment. This amount of sediment is more than sufficient to cause the mortality of all seagrass via smothering (Erftemeijer and Lewis, 2006) and would likely restrict or completely preclude the regrowth of seagrass at this site via seeds. In addition, the sediment characteristics of new spoil material were likely to be drastically different from the pre-dumping seafloor sediments on which the seagrass was growing.
Abbot Point Growth Gateway Project Environmental Impact Statement Page 40 Volume 4 – Supplement Report

REV APPDENGCHKDRNREVISION DESCRIPTIONDATE CHK ENG
14
OS3IM7
D06
D12
CapeUpstart
CampIslandEast
CampIslandWest
HolbourneIsland
NaresRock
CatalinaSite
Euri Creekcoral location
Philipscorallocation
Larry’scorallocation
Flowerpot corallocation
Meatworkscorallocation
CurlewisBay corallocation
Camp islandcoralcommunity
585000
585000
590000
590000
595000
595000
600000
600000
605000
605000
610000
610000
615000
615000
620000
620000
625000
625000
630000
630000
635000
635000
640000
640000
7795
000
7795
000
7800
000
7800
000
7805
000
7805
000
7810
000
7810
000
7815
000
7815
000
7820
000
7820
000
7825
000
7825
000
7830
000
7830
000
7835
000
7835
000
7840
000
7840
000
7845
000
7845
000
LEGENDDredged materialpipeline (Indicative 1)Return water pipeline(Indicative 1)Dredged materialpipeline (Indicative 2)Return water pipeline(Indicative 2)Dredged materialpipeline (Alternate)Return water pipeline(Alternate)Dredging footprintDredging study areaDredged materialcontainment pondDredged materialcontainment pond studyarea
Port limitAustralian MaritimeBoundaries - Coastal(State) watersAbbot Point StrategicPort Land
Plume modelling timeseries extraction pointsCoral locationEuri Creek coral location(indicative)
95th percentile TSS -2007 dry seasonmg/L
2.5 - 55 - 1010 - 2020 - 3030 - 4040 - 5050 - 7575 - 100100 - 150150 - 200
QUEENSLAND GOVERNMENT
Compiled by BRISBANE GEOMATICS
G:\30
1001
\0195
6 PRO
J - Ab
bot P
oint G
rowth
Gatew
ay\10
.0 En
ginee
ring\1
0 GM-
Geom
atics
\Outp
ut\30
1001
-0195
6-00-G
M-SK
T-003
7-3 (M
arine
Plum
eTim
eSeri
es Lo
catio
ns).m
xd
Figure 4-6Locations of plume modelling time series
extraction points
Service Layer Credits: Sources: Esri, DeLorme, HERE, USGS, Intermap, increment P Corp., NRCAN, EsriJapan, METI, Esri China (Hong Kong), Esri (Thailand), TomTom
3 Issued for information
11
IM9
OS1
OF1OF2OF3
OF4
OF5OF6
D01D02D03
D04
D05
D06
D07D08 D09
D10OS2Philips
corallocation
INSET
Refer toinset
© Commonwealth of Australia (Geoscience Australia) 2015; © State of Queensland (Department of Environment and Resource Management) 2015; © State of Queensland (Department of State Development, Infrastructure andPlanning) 2015; © State of Queensland (Department of Natural Resources and Mines) 2015. Based on or contains data provided by the Department of State Development, Infrastructure and Planning, Queensland 2015 which gives nowarranty in relation to the data (including accuracy, reliability, completeness or suitability) and accepts no liability (including without limitation, liability in negligence) for any loss, damage or costs (including consequential damage)relating to any use of the data.
© WorleyParsons Services Pty Ltd While every care is taken to ensure the accuracy of this data, WorleyParsons makes no representations or warranties about its accuracy, reliability, completeness or suitability for any particularpurpose and disclaims all responsibility and all liability (including without limitation liability in negligence) for all expenses, losses, damages (including indirect or consequential damage) and costs which might be incurred as a result ofthe data being inaccurate or incomplete in any way and for any reason.
Figure: 301001-01956-00-GM-SKT-0037
26/10/2015
ABBOT POINT GROWTH GATEWAY PROJECT
/GDA 1994 MGA Zone 55
0 2 4
Kilometres(at A3)1 : 200,000SCALE:
0 0.5 1 1.5 2
Kilometers
Rev: 3
Source information:Dredging study area Setout points derived from coordinates on NQBP/Aurecon figure 242770-0000-DRG-SK-0021-A supplied by NQBPDredged material and return water pipelines (Indicative 1) Digitised from BMT JFA Drg. No. BMT JFA 275.02-50-03 A, dated 17/12/2014 and Golder Associates Drg. No. 1525905-027-002A, dated 12/06/2015, with some minor adjustments to avoid clashes with existing infrastructure visible in the 2013 aerial imagery and to avoid any potential clashes with the proposed MOF expansionDredged material and return water pipelines (Indicative 2 and Alternate) Developed by BMT JFA 21/07/2015Soil stockpile, site office and laydown area Supplied by Golder Associates 10/08/2015Dredged material containment pond Supplied by Golder Associates 23/06/2015Dredged material containment pond study area Supplied by Golder Associates 10/08/2015Existing transport network Physical Road Network - Queensland, Physical Rail Network - Queensland Queensland Government - Department of Environment and Resource Management2013 Imagery Queensland Government - Department of State Development, Infrastructure and Planning 2015Cadastral Boundaries Downloaded 08/06/2015 - http://qldspatial.information.qld.gov.au/catalogue/custom/detail.page?fid={4091CAF1-50E6-4BC3-B3D4-229AA318231A} Queensland Government - Department of Natural Resources and MinesAustralian Maritime Boundaries - 2006 Geoscience AustraliaPort Limits - 2008 Maritime Safety QueenslandAbbot Point Strategic Port Land Digitised from "Plan 1 - Port of Abbot Point Land Use Plan Designations" North Queensland Bulk Ports Corporation Limited -Port of Abbot Point Land Use Plan - October 2010Coral locations Plotted from coordinates supplied in public submissions report. Coordinate data in the report was provided by a long-time Bowen resident who dives in the area.
PROJECT LOCALITY
KM SN
0 40Kilometres
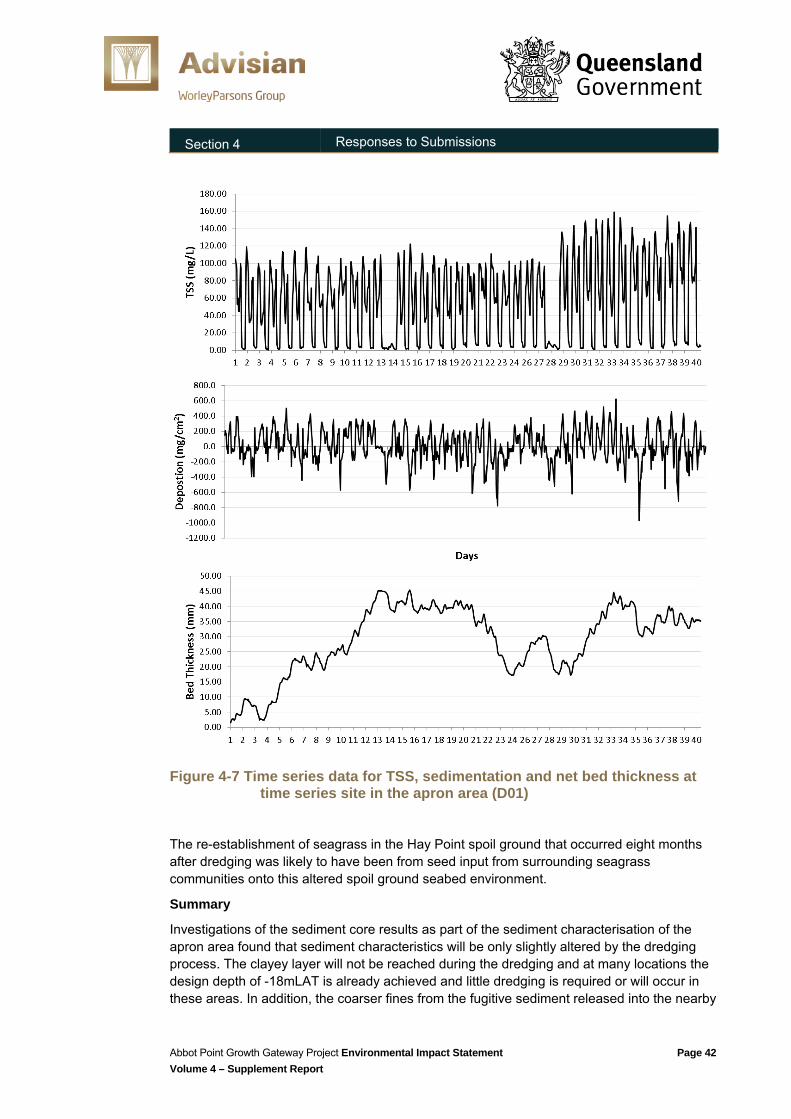
Section 4 Responses to Submissions
Figure 4-7 Time series data for TSS, sedimentation and net bed thickness at time series site in the apron area (D01)
The re-establishment of seagrass in the Hay Point spoil ground that occurred eight months after dredging was likely to have been from seed input from surrounding seagrass communities onto this altered spoil ground seabed environment.
Summary
Investigations of the sediment core results as part of the sediment characterisation of the apron area found that sediment characteristics will be only slightly altered by the dredging process. The clayey layer will not be reached during the dredging and at many locations the design depth of -18mLAT is already achieved and little dredging is required or will occur in these areas. In addition, the coarser fines from the fugitive sediment released into the nearby
Abbot Point Growth Gateway Project Environmental Impact Statement Page 42 Volume 4 – Supplement Report
Section 4 Responses to Submissions
marine environment will settle out near the dredging activities. Bioturbation and migration of coarser sediments via natural events into the dredged area will occur within months of the cessation of dredging.
The sediment characteristics of the upper layer of sediment in the apron areas will be very similar to the pre-dredged characteristics and offer no barrier to the re-establishment of the highly resilient, Halophila species of seagrass over successive years.
4.1.2.4 Adequacy of fauna survey data Some submissions raised concern regarding the assessment of project impacts on various fauna species. In particular, it was stated that more rigorous data collection is required for various species in order for sound decisions around mitigation and management to be made. Inadequate surveys were said to be undertaken for migratory bird species and marine species. It was also contended that habitat utilisation was not well-covered and that insufficient management measures were outlined for protection of the Australian Painted Snipe and the Squatter Pigeon.
Marine ecology The marine species survey design considered the behaviours of inshore cetaceans, Dugongs and turtles; species that require frequent surfacing intervals, and was adapted to examine a relatively small spatial scale (Lukoscheck and Chilvers, 2008, Chilvers et al. 2004, Groom et al. 2004; Parra, 2006). The surveys aimed to capture temporal and spatial trends by consistently sampling the same sites in the same way monthly over a 12 month period.
The methods used to survey marine fauna and the results are detailed in Section 3.2 of the Abbot Point, T0, T2 and T3 Capital Dredging Project PER and in GHD (2009b) - Megafauna Assessment Report: Proposed Abbot Point Multi Cargo Facility EIS, December 2009.
An extract on methodology from GHD 2009e is outlined below:
‘A stratified boat-based survey across a variety of depths was designed taking into consideration habitat information resulting from epi-benthic habitat mapping (GHD 2008, Rasheed et al. 2005) and personal communication with Ian Bell (QPWS 2008). The proposed method was developed in consultation with the Great Barrier Reef Marine Park Authority (GBRMPA). A monthly sampling effort of 50 timed transects and 42 spot sampling sites over 12 months was determined as the most appropriate approach to capture the diversity of species in the area. This design covered the heterogeneous and patchy habitat in the port environment in the context of available marine fauna aerial survey data for this region. This approach provided for a theoretical increase in detectability within the survey area. As a multi-species survey, this was necessary as most species will exhibit a degree of seasonality in their movements over time….
…The boat-based spot sampling sites enable a sighting radius of approximately 200m from the boat for surfacing megafauna with the exception of whales, which are clearly observed from distances over 500m. Sighting distance is dependent upon sea state and weather conditions. Accordingly 200m is the minimum distance of detection at any given survey time and conditions. This distance increases greatly with good weather conditions. Figure 2-1 depicts the survey sites undertaken each month where dugong icons represent spot sampling sites and turtle icons represent timed transects.
Abbot Point Growth Gateway Project Environmental Impact Statement Page 43 Volume 4 – Supplement Report
Section 4 Responses to Submissions
During the 10 minute spot sampling, two trained observers were positioned facing the bow and stern of the vessel with each observer scanning 1800, this provides a combined search area of approximately 0.125 km2 (x 42 sites).
Fifty line transects were timed at five minutes each whilst maintaining a constant speed of 10 km/hr, enabling a survey distance of approximately three kilometres (equating to approximately 0.6 km2 area of detectability). Sites and transects were surveyed over two to three days each month (depending on number of sightings and turtle nesting) with a total of nine surveys undertaken from June/July 2008 to June 2009. The nine surveys account for 2,475 minutes of timed transects and 3,780 minutes of spot sampling within the Abbot Point survey area.
The sampling of sites was dependent upon tidal state, where shallower sites (<5m LAT) were sampled at a high tide to account for animals that may be accessing food resources that would otherwise be tidally restricted. The surveys used a 6m rigid boat with a high canopy (above sea elevation approximately 2.5m). Two experienced observers visually surveyed the surrounding waters and the presence of marine fauna was recorded..”
The survey methods are considered robust to detect spatial and temporal trends in the distribution of marine megafauna at Abbot Point.
Baseline and targeted turtle surveys previously undertaken within the Abbot Point area (Bell, 2003; GHD 2009a; CDM Smith, 2013a; Hof & Bell, 2014) and referenced in the draft EIS are adequate to characterise the Abbot Point area as ‘low-density’ when compared with other known turtle rookeries in Queensland. Turtle Exclusion Devices are not suitable or beneficial for use on CSDs considering the very slow velocity of the dredging arm and the immobility of the dredge during operation.
Terrestrial ecology
The assessment of potential impacts of the Project on shorebirds in the draft EIS was informed by the results of surveys completed by BAAM in 2012 and BMT WBM in 2010. The BAAM surveys were completed during the months of February, March, June, November and December 2012, at times when water levels at the Caley Valley Wetlands varied from full to partially dry. The BMT WBM surveys were completed in October and November 2010 at the start of the wet season, and found extensive use of the wetland basin by various types of birds.
The results of the above-mentioned surveys are considered to be suitable and adequate for the purpose of the required impact assessment (DEWHA, 2009), as they are:
Relatively recent (less than 5 years old) and therefore representative of current conditions Representative of the varying conditions that occur within the ephemeral Caley Valley
Wetlands, including periods when the wetland is full of water.
A review of data from the above-mentioned studies in the draft EIS identified that areas of the wetland fringe located adjacent to the project area have been utilised at times by several species of shorebirds relevant to an impact assessment in accordance with the EPBC Act. Examples of such species include the Australian Painted Snipe, Latham’s Snipe, Common Greenshank, Marsh Sandpiper and the Sharp-tailed Sandpiper. The value of these wetland habitats to migratory shorebirds was central to the assessment of potential impacts of the Project in the draft EIS.
Abbot Point Growth Gateway Project Environmental Impact Statement Page 44 Volume 4 – Supplement Report
Section 4 Responses to Submissions
Further surveys of the wetland are not considered necessary, as the results would be highly likely to simply confirm the findings of the draft EIS that the wetland fringe is of value to shorebirds (some in internationally-significant numbers) and that this is to be managed accordingly. The draft EIS has highlighted that areas of the wetland fringe adjacent to the project area are known habitat for the endangered Australian Painted Snipe and has treated them as sensitive habitats in conducting the impact assessment. This is based on recent and reliable information with temporal variation in the value of this habitat to shorebirds well recognised.
Detailed assessments of the potential impacts of the Project on the Squatter Pigeon and Australian Painted Snipe were completed in the draft EIS. No significant impacts were predicted for either species as a result of project activities. The Proponent has committed to a range of mitigation measures to reduce any potential impacts of the Project on these species that are appropriate for the level of risk. The final EMP for the Project will be developed incorporating appropriate measures to mitigate and monitor potential impacts on fauna due to facility construction, operations post construction and dredging phases.
4.1.2.5 Impacts on marine megafauna Some submissions raised issues around the protection of rare, migratory and/or threatened marine fauna in the Abbot Point area. In particular, submitters commented that dolphins, turtles, Dugong and whales may be impacted by dredging activities, removal of seagrasses or the presence of a sediment plume which could degrade local habitats. The migration of whales and their calves through the area, as well as the movement of Dugongs between the two nearby Dugong Protection Areas (DPAs) was also raised in conjunction with habitat impacts due to seagrass losses (addressed in Section 4.1.2.3). Submissions requested that more discussion on management measures to protect these species be provided by the Proponent.
These matters are addressed below and in the preceding discussions of potential sediment impacts (Section 4.1.2.1) and potential seagrass impacts (Section 4.1.2.3).
The marine environment at Abbot Point is characterised as predominantly soft sediment. Low densities of sparsely distributed soft coral, sea pens, mushroom corals and isolated sub-massive and massive coral colonies, seagrass and algae are known to occur within the project area and in the vicinity of Abbot Point.
Seagrasses at Abbot Point are low density and highly dynamic, with changes in density and distribution being influenced by seasonality and major weather events. Abbot Point is known to provide habitat that supports populations of four dolphin species (namely the Info-Pacific Humpback, Bottlenose, Australian Snubfin and Common dolphins), five species of turtle (Green, Flatback, Loggerhead, Olive Ridley and Hawksbill turtles), Dugongs and Humpback Whales.
The direct value of seagrass habitat for fisheries production in the Abbot Point region is reported to be significantly less than other areas in central and northern Queensland (Volume 3, Appendix T – Section 4.3 of the Fisheries Assessment).
A number of the marine fauna species identified in the Abbot Point area are listed as threatened and/or marine and migratory under the EPBC Act. The populations are typically not considered to constitute important populations (under the EPBC Act) endemic to Abbot
Abbot Point Growth Gateway Project Environmental Impact Statement Page 45 Volume 4 – Supplement Report
Section 4 Responses to Submissions
Point; however, there is uncertainty regarding the population characteristics of inshore dolphins and, in particular site fidelity of Australian Snubfin Dolphins in the port area, so attention is required to ensure that potential impacts from the dredging and associated operations are minimised. For this reason, a conservative approach to impact assessment was taken, and local inshore dolphin species were treated as ‘important populations’ in the EIS assessment.
Only a very small proportion of benthic habitat will be directly removed during dredging. This area of loss in the berth pocket (10.5ha or <0.04% of the available seagrass habitat) is not expected to result in the removal of significant habitat utilised by megafauna, inshore dolphin species and Dugongs in the Abbot Point area, nor is it predicted to result in any displacement of megafauna species. There is a general lack of information on the specific impacts of coastal developments on inshore dolphins in particular; however, there is also no evidence available to indicate that inshore dolphins will be negatively impacted by dredging activities. Changes in habitat usage by megafauna, including inshore dolphins, as a result of dredging will likely be temporary and from a very small, localised area.
Potential impacts
Direct:
The risk of vessel strike occurring to dolphin or sea turtle species is considered to be low given:
The dredge is stationary and will only be underway when first deployed to the dredging areas. When the dredge is underway at site, the CSD operates at slow speeds which would provide any Australian Snubfin, Indo-Pacific Humpback Dolphins, Dugongs and sea turtles in the area with sufficient opportunity to avoid the path of the dredge.
The dredge mostly operates in a highly localised area (which is most of the time devoid of seagrass) which allows for groups or individuals in the area to move easily into surrounding open water.
Vessel strikes on marine fauna are more typically caused by high speed recreational and commercial vessels including launches, powerboats, jet skis and ferries.
Australian Snubfin and Indo-Pacific Humpback Dolphins are relatively agile species and any in the immediate area at the time of dredging are likely to avoid dredging activities, and should be able to avoid the stationary dredging, support vessel or steaming dredge.
Indirect:
Minor indirect impacts to dolphins and sea turtles may occur as a result of changes to marine water quality, underwater noise and shipping related impacts and can be summarised as follows:
Impacts to marine water quality, and consequently inshore marine habitats as a result of dredging (increased turbidity and sedimentation), are likely to be minor and temporary in nature.
Increased levels of underwater noise will potentially cause displacement of inshore dolphins and sea turtles from a relatively small area of inshore habitat.
The risk of significant fragmentation of habitat areas is considered to be low. The deepwater seagrass occasionally growing in the berth pocket is ephemeral and very sparse, and unlikely to be utilised frequently as a food source (or supporting a food source). Similar deepwater seagrass habitat is also available from growing season to
Abbot Point Growth Gateway Project Environmental Impact Statement Page 46 Volume 4 – Supplement Report
Section 4 Responses to Submissions
growing season outside this area in shallower water (refer to seagrass discussion in Volume 3, Appendix Q1).
Avoidance, mitigation, management and control measures are described in the Outline Dredging Management Plan (refer to Section 9.2.3 of Volume 2 and Appendix W of Volume 3) and include:
Restricting dredging to locations specified on approved drawings Undertaking visual monitoring for marine fauna in the immediate vicinity of the dredge Conducting visual observations for marine fauna during pipeline establishment Communicating the locations of observed aggregations of marine fauna to all vessels in
the project area Avoiding aggregations of marine fauna where practicable Vessels will be required to proceed with caution in areas where aggregations of marine
fauna are observed Ensuring that planing hull work vessels are speed limited to within the operational port
area of the Port of Abbot Point, i.e. the area outside of the GBRMP Implementing a Vessel Traffic Management Plan.
In addition, the Outline Dredging Management Plan Framework (Section 9.2.1 of Volume 2; Volume 3, Appendix W) outlines control measures to minimise the impact on water quality in the project area which may also impact the habitat utilised by inshore dolphins, Dugongs and sea turtles. These include:
Assembling the pipeline with appropriate seals between sections Maintaining pipeline and fittings Undertaking all dredging with a CSD which limits the extent of turbidity generation Undertaking all dredging within approved areas and applying adaptive management to
the dredging operation as described in the draft Marine Water Quality and Seagrass Monitoring Plan Outline (refer to Section 12 of the Outline Dredging Management Plan – Volume 3, Appendix W)
The water entering the marine environment will be tested for a range of parameters prior to discharge to ensure compliance.
Turtle nesting
For more detail on the potential impacts of port operations on Green and Flatback turtles that nest along the beaches in close proximity to Abbot Point, please refer to Section 6.7.2 of Appendix Q1 (Volume 3) as well as the Alternate Pipeline Marine Corridor Impact Assessment Technical Memo contained in Appendix Q2.
Green and Flatback turtles nest annually on Abbot Point beach to the east of the existing terminal. The turtle nesting period is from early November to March. Peak hatching is triggered by temperature conditions and generally occurs in December and January. Dredging of T0 will occur over 3km to the north-west of Abbot Point beach where turtles are found to nest; as such any plume will not impact on the nesting beach area or surrounds. The use of a CSD will limit impacts as turtles are less likely to be caught (sucked) into the dredge head when compared to the traditional TSHD. The CSD will be stationary for the majority of the dredging campaign, and the risk of boat strike to marine turtles is considered low.
Abbot Point Growth Gateway Project Environmental Impact Statement Page 47 Volume 4 – Supplement Report
Section 4 Responses to Submissions
Impacts due to lighting during the hatching season will be managed to ensure turtle hatchlings that emerge during December and January are not adversely impacted by additional land-based activities (night work). The return pipeline infrastructure for the dredging of T0 will be placed in an already disturbed area and extend up the beach adjacent to the existing Materials Offload Facility (MOF), remaining in place for up to 13 weeks. This temporary pipeline will not impede turtles from travelling up the beach to access nesting areas above high tide on these beaches. The area where the pipeline traverses is considered to have less than optimal nesting habitat due to the presence of physical barriers (e.g. cliffs and rocky outcrops) to effective nesting.
Megafauna survey methodology
The methods used to survey these communities and the results are detailed in Section 3.2 of the Abbot Point, Terminal 0, Terminal 2 and Terminal 3 Capital Dredging Project PER and in GHD 2009b, Megafauna Assessment Report: Proposed Abbot Point Multi Cargo Facility EIS, December 2009. A brief summary of the methods is provided in Section 4.1.2.4 (Adequacy of fauna survey data) of this report.
4.1.2.6 Groundwater assessment Some submissions questioned the accuracy and reliability of the groundwater assessment undertaken for the Project. In particular, comments queried rates of groundwater flow and the potential displacement of saline groundwater into the adjacent wetland area. Submitters also questioned whether the assessment adequately accounted for seasonal changes in groundwater levels, and stated that the draft EIS should demonstrate in more detail the ability to manage acidic groundwater, and undertake appropriate monitoring over time.
Public submissions include a detailed critical review of the groundwater modelling assessment which has been directly addressed in Appendix C. It is considered that all comments raised on this issue have been previously addressed in Volume 3, Appendix L.
Regarding the potential displacement of additional existing saline groundwater into the Caley Valley Wetlands aggregation area, the groundwater flow directions shown in Figure 4.2 of the Groundwater Assessment Report (Volume 3, Appendix L) represent overall inferred flow directions based on the observed groundwater levels measured in each bore at the time of the 2015 field studies (as stated in Section 4.5 and Table 4.4). These water levels were not corrected relative to the salinity densities measured in each bore due to the complexity of the salinity stratification complicating this process. Instead the data was reported as observed. In light of the comments in this regard, the purged salinity data does provide an opportunity to identify the magnitude of any water level variation when nominalised to a fresh water level. Table 4-2 which follows (and is a revision of Table 4.4 in the draft EIS groundwater chapter) shows there is minimal change in these water levels. On this basis it can be summarised that there is no material change in the inferred groundwater flow directions shown in Figure 4.2.
Abbot Point Growth Gateway Project Environmental Impact Statement Page 48 Volume 4 – Supplement Report
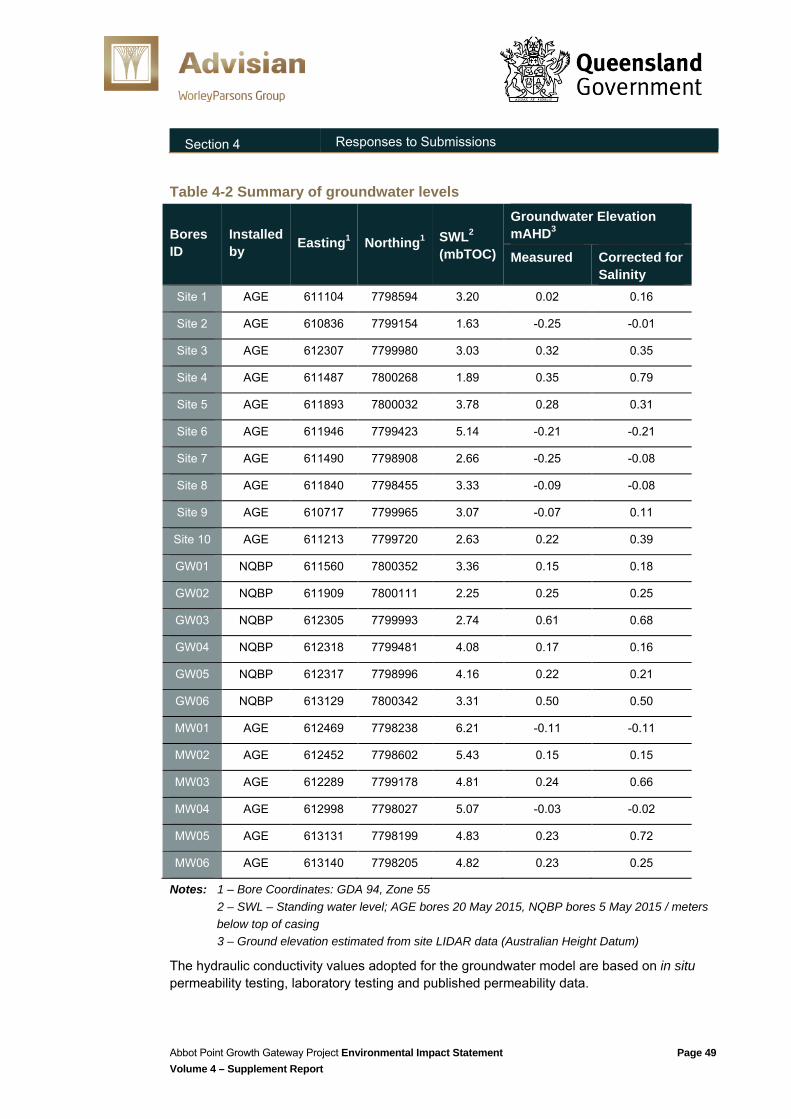
Section 4 Responses to Submissions
Table 4-2 Summary of groundwater levels
Bores ID
Installed by Easting1 Northing1 SWL2
(mbTOC)
Groundwater Elevation mAHD3
Measured Corrected for Salinity
Site 1 AGE 611104 7798594 3.20 0.02 0.16
Site 2 AGE 610836 7799154 1.63 -0.25 -0.01
Site 3 AGE 612307 7799980 3.03 0.32 0.35
Site 4 AGE 611487 7800268 1.89 0.35 0.79
Site 5 AGE 611893 7800032 3.78 0.28 0.31
Site 6 AGE 611946 7799423 5.14 -0.21 -0.21
Site 7 AGE 611490 7798908 2.66 -0.25 -0.08
Site 8 AGE 611840 7798455 3.33 -0.09 -0.08
Site 9 AGE 610717 7799965 3.07 -0.07 0.11
Site 10 AGE 611213 7799720 2.63 0.22 0.39
GW01 NQBP 611560 7800352 3.36 0.15 0.18
GW02 NQBP 611909 7800111 2.25 0.25 0.25
GW03 NQBP 612305 7799993 2.74 0.61 0.68
GW04 NQBP 612318 7799481 4.08 0.17 0.16
GW05 NQBP 612317 7798996 4.16 0.22 0.21
GW06 NQBP 613129 7800342 3.31 0.50 0.50
MW01 AGE 612469 7798238 6.21 -0.11 -0.11
MW02 AGE 612452 7798602 5.43 0.15 0.15
MW03 AGE 612289 7799178 4.81 0.24 0.66
MW04 AGE 612998 7798027 5.07 -0.03 -0.02
MW05 AGE 613131 7798199 4.83 0.23 0.72
MW06 AGE 613140 7798205 4.82 0.23 0.25
Notes: 1 – Bore Coordinates: GDA 94, Zone 55 2 – SWL – Standing water level; AGE bores 20 May 2015, NQBP bores 5 May 2015 / meters
below top of casing 3 – Ground elevation estimated from site LIDAR data (Australian Height Datum)
The hydraulic conductivity values adopted for the groundwater model are based on in situ permeability testing, laboratory testing and published permeability data.
Abbot Point Growth Gateway Project Environmental Impact Statement Page 49 Volume 4 – Supplement Report
Section 4 Responses to Submissions
The model does not account for clogging of pore spaces, which will reduce the permeability of the underlying strata, thereby reducing the volume of seepage from the DMCP. This approach provides for a more conservative assessment of impact from seepage into the aquifer.
The impact from groundwater mounding resulting from the DCMP operation is described in the draft EIS (Volume 2, Section 4.3.4.3).
The salinity modelling provides an assessment of extent (magnitude) of additional salinity loading on the brackish groundwater and wetlands resulting from seawater/ hypersaline seepage from the DMCP operation.
The model used existing climate data applied across the entire model domain to represent seasonal changes in groundwater levels. In addition, three climate conditions were used to assess responses to varying climate extremes, i.e. periods of low, average and high rainfall conditions.
Sensitivity analysis was undertaken and is documented in Section 6.10 of the Groundwater Assessment Report (Volume 3, Appendix L).
4.1.2.7 Caley Valley Wetlands Although the project design has been altered from previous port expansion projects to exclude any infrastructure or sediment placement within the Caley Valley Wetlands, a number of submissions raised concern regarding impacts on and protection of the wetland. In particular, the wetland was stated by some to be of international significance for bird populations, and comments expressed concern about the potential for overflow or seepage from the DMCP potentially contaminating the wetland. It was also stated that the proposal contravenes the obligations of the Ramsar agreement.
Section 4.3.6.3 of the draft EIS provides the results of the assessment that takes into account the groundwater modelling results for the Project. The modelling showed that under worst-case conditions, the greatest change to salinity would be experienced immediately adjacent to the DMCP where salinity may increase by up to 3ppt above background conditions. This increase is small when compared to the natural (seasonal) variations of salinity experienced in the wetland. The assessment concludes that the results of the realistic and worst-case wetland hydrology scenarios indicate that persistent detrimental impact on aquatic flora and fauna within the ’wetted’ sections is not expected to occur due to operation of the DCMP, and that any impacts to aquatic communities are expected to be short-term, with rapid recovery occurring in the next wet season following the completion of works. Any such localised, minor and short-term impact on the aquatic environment would not have a discernible impact on birds utilising the extensive wetland habitats.
While considered unlikely due to the implementation of management measures to prevent such occurrences, an event that resulted in overflow from the DMCP may cause very localised scouring. Any scouring would be remediated immediately as part of the environmental management regime.
The Caley Valley Wetlands is not a ‘Declared Ramsar Wetland’ as defined in the EPBC Act. The Notification of Referral Decision from DoE, dated 14 May 2015, did not list ‘Declared Ramsar Wetland’ as a controlling provision for the Project. There was no requirement for the draft EIS to explicitly address the potential impacts of the Project on Ramsar wetlands.
Abbot Point Growth Gateway Project Environmental Impact Statement Page 50 Volume 4 – Supplement Report
Section 4 Responses to Submissions
It is recognised that the Caley Valley Wetlands is of high importance to birdlife and indeed may meet some of the criteria for listing as a Ramsar wetland. Under the Ramsar Convention, the primary consideration when assessing the potential impacts of human activities on wetlands is ‘wise use’. The definition of wise use of wetlands is the maintenance of their ecological character, achieved through the implementation of ecosystem approaches, within the context of sustainable development. The Ramsar Convention guidelines emphasise that human use on a sustainable basis is entirely compatible with Ramsar principles and wetland conservation in general (DEWHA, 2012).
The draft EIS discussed several management measures that have been developed to protect the integrity and ecological values of the Caley Valley Wetlands, consistent with the wise use principle. These include:
Locating the project area where physical disturbance will occur outside of the wetland, with a minimum buffer of 50m to the wetland fringe
Minimising the potential for disturbance adjacent to the wetland during construction works and operations, by restricting access
Active management of dust, noise and stormwater to avoid degradation of the ecological values of the wetland.
The Project is consistent with the principle of wise use of wetlands under the Ramsar Convention, as it:
Will not have adverse impacts on ecosystem components, processes and services that characterise the wetland (ecological character)
Is an example of port development that meets human needs while preserving the environment.
4.1.2.8 Disturbance to listed bird species
A number of submissions raised concerns about disturbance from project activities on listed bird species using the wetland as habitat, in particularly from noise, light, dust and groundwater. Submissions also sought assurance that the mitigation and monitoring measures proposed will be adequate to the predicted impacts and suggested construction timing be considerate of migratory shorebird breeding and nesting periods.
Section 4.4.7.4 of the draft EIS (Volume 2) provides a discussion of potential impacts from all project sources on each migratory shorebird species and threatened species, or group of these species. The assessment is informed by an understanding of the habitat distribution for these species within the wetland based on the results of previous surveys, the modelling of noise and dust during a range of site activities and conditions (Volume 4, Appendices J and H respectively of the draft EIS), and available literature regarding the sensitivity of the subject species to such disturbances.
Construction may not occur during migratory bird season, and/or the wetland may not hold sufficient water for migratory bird feeding at the time of construction. However, the impact assessment has been undertaken for the worst-case scenario, that being construction occurring during migratory bird season when the wetland holds sufficient water for resting and feeding birds. The impact assessment determined that project activities would not significantly impact on migratory and other shorebirds within the wetland. An area of 4% of the wetland would be affected by some components of the construction noise under worst-
Abbot Point Growth Gateway Project Environmental Impact Statement Page 51 Volume 4 – Supplement Report
Section 4 Responses to Submissions
case conditions. No habitats for migratory species within the wetland are restricted to the locations predicted to be affected by construction noise and while there is already a level of background, industrial noise from port activities, noise-sensitive species may move away from these locations during the construction period. Section 4.4.7.4 of the Terrestrial Ecology Technical Report (Volume 3, Appendix P) provides a species-by-species assessment of the potential impacts of construction noise. The short duration and limited area of impact of construction noise within the wetland has resulted in a predicted low impact on migratory species if present in the wetland at the time of construction.
Mitigation and monitoring measures
Dust
The dust modelling (Katestone, 2015) incorporated key dust control measures including haul road watering (75% reduction of dust emissions) and stockpile watering (50% reduction of dust emissions). The model results were assessed by EcoLogical Australia (ELA; 2015) to establish potential impacts of dust generated by the Project on the wetland habitats and bird species potentially present. Refer to Section 5.1.3 of the draft EIS (Volume 2).
ELA (2015) concluded that the modelled dust levels would not affect habitat quality, and that while dust exceeded human health standards for PM10 in 2.2% of the Caley Valley Wetlands, this would not represent a significant impact for bird species present. However, ELA (2015) recommended that further dust management strategies be implemented to reduce dust generation. The Outline EMP indicates that dust management strategies exceeding those assumed in the air quality model will be implemented, reducing actual dust concentrations below those of the modelled results. As listed in the Outline EMP, these measures are proposed to include the following:
Ensure significant dust generation from earthworks are minimised, where practicable, during unfavourable meteorological conditions (e.g. watering haul routes during high winds).
Water roads (including haul roads), exposed stockpiles and other exposed areas. Designate appropriate maximum speed limits during construction. Clean up spillages of potential dust-generating materials from any component of
construction as soon as practicable. Consider erection of physical barriers such as bunds or wind breaks around stockpiles
and areas where earth moving is required, if other management methods are ineffective. Limit the extent of vegetation and soil clearing so as to minimise the area of exposed soil
that may generate dust. Compact construction site and stabilise vegetation to minimise dust lift-off due to wind
erosion. Following construction of the embankments, top sides and external batters will be either
topsoiled and seeded, or hydro-mulched. Water embankments, where practical, to minimise dust lift-off. Undertake observations during construction to identify any impacts to flora and fauna. Visually monitoring dust emissions and potential dust generating activities during
construction. Implement additional mitigation measures when wind conditions become adverse and
there is the potential for greater impacts. Control measures could include watering, reducing activity rates or covering equipment.
Abbot Point Growth Gateway Project Environmental Impact Statement Page 52 Volume 4 – Supplement Report
Section 4 Responses to Submissions
Refer also to Section 5.1.3 of the draft EIS (Volume 2) which addresses the effectiveness of these proposed mitigation measures.
The final EMP for the Project will be developed incorporating appropriate measures to mitigate and monitor potential dust impacts on the Australian Painted Snipe, Latham’s Snipe and migratory shorebirds due to facility construction, and operations post construction and dredging phases.
Noise
SLR (2015) Compared the seven modelled project scenarios against the existing Terminal 1 (T1) operational noise emissions, and found that noise from the Project will have either no overall effect or only marginally increase the extent of the wetland predicted to exceed the disturbance thresholds. The noise contour maps show that the largest area of the wetland calculated to exceed the disturbance thresholds is attributable to existing rail operations.
From a cumulative perspective, variable noise emission levels equal to or above 60dBA LAmax, having potential to result in alarm or flight responses from terrestrial fauna are predicted to occur over a maximum area of 4% of the wetland under inversion conditions.
In their assessment of the predicted noise impacts on birds within the Caley Valley Wetlands ELA (2015) consider that the impacts are unlikely to be significant for a number of reasons specified in the report, concluding that the Project will not raise noise levels significantly above existing noise levels, to which birds present would be habituated.
Measures to minimise noise generation that were not taken into account in the modelling, and will therefore decrease the predicted noise impacts, are set out in the Outline EMP. These are:
Offsite fabrication and construction, where practicable to minimise construction noise Construction site buildings and access roads will be located as far from the wetland edge
as possible Noise reduction devices such as mufflers will be fitted to vehicles, plant and equipment Selection (where feasible and practicable) of less noisy equipment (i.e. electric instead of
internal combustion, and newer, quieter equipment) Noise emissions of hired equipment (e.g. light generators) will be taken into account in
the equipment selection process Briefing of the construction contractor’s work team in order to create awareness of and to
emphasise the importance of minimising noise emissions.
The final EMP for the Project will be developed incorporating appropriate measures to mitigate and monitor potential noise impacts on the Australian Painted Snipe, Latham’s Snipe and migratory shorebirds due to facility construction, and operations post the construction and dredging phases.
Light
The project area is located within a port industrial precinct and immediately adjacent to the existing T1 operating coal terminal. In this context, lighting from the Project will add to that which is already present in the existing landscape. Night-time construction activities will be supported by mobile and directional light towers which have an illumination footprint of approximately 60m from the source (when facing directly down towards the ground). Lights will only be used to produce sufficient light required for safety and operational purposes, and
Abbot Point Growth Gateway Project Environmental Impact Statement Page 53 Volume 4 – Supplement Report
Section 4 Responses to Submissions
will be directed away from the wetland, towards the work area. In this context, direct light spill from the Project is anticipated to be contained within the area of terrestrial land between the wetland and the project area. Impacts from light on birds in the wetland during the construction period are predicted to be low.
The following mitigation measures will be applied to ensure that potential impacts of lighting on birds is minimised:
Use directional lighting and shrouds to protect the Caley Valley Wetlands from direct light Use mobile light towers which can be moved and adjusted to provide lighting for
construction purposed, while minimising lighting of unused areas Maintain a buffer between construction lighting and the Caley Valley Wetlands.
The final EMP for the Project will be developed using the Outline EMP as its basis. As such, it will incorporate measures as committed within the outline EMP to mitigate potential light impacts on the Australian Painted Snipe, Latham’s Snipe and migratory shorebirds due to facility construction, operations post construction and dredging phases.
4.1.2.9 Adequacy of buffer
Questions were raised by the DoE around the location and adequacy of the buffer between the Caley Valley Wetlands and the DMCP footprint. This included reference to recommendations in the draft migratory bird guidelines and other sources, for example Borgmann et al. (2012).
Figure 4-8 shows the proposed buffer area to protect habitat for listed threatened and migratory bird species.
Abbot Point Growth Gateway Project Environmental Impact Statement Page 54 Volume 4 – Supplement Report
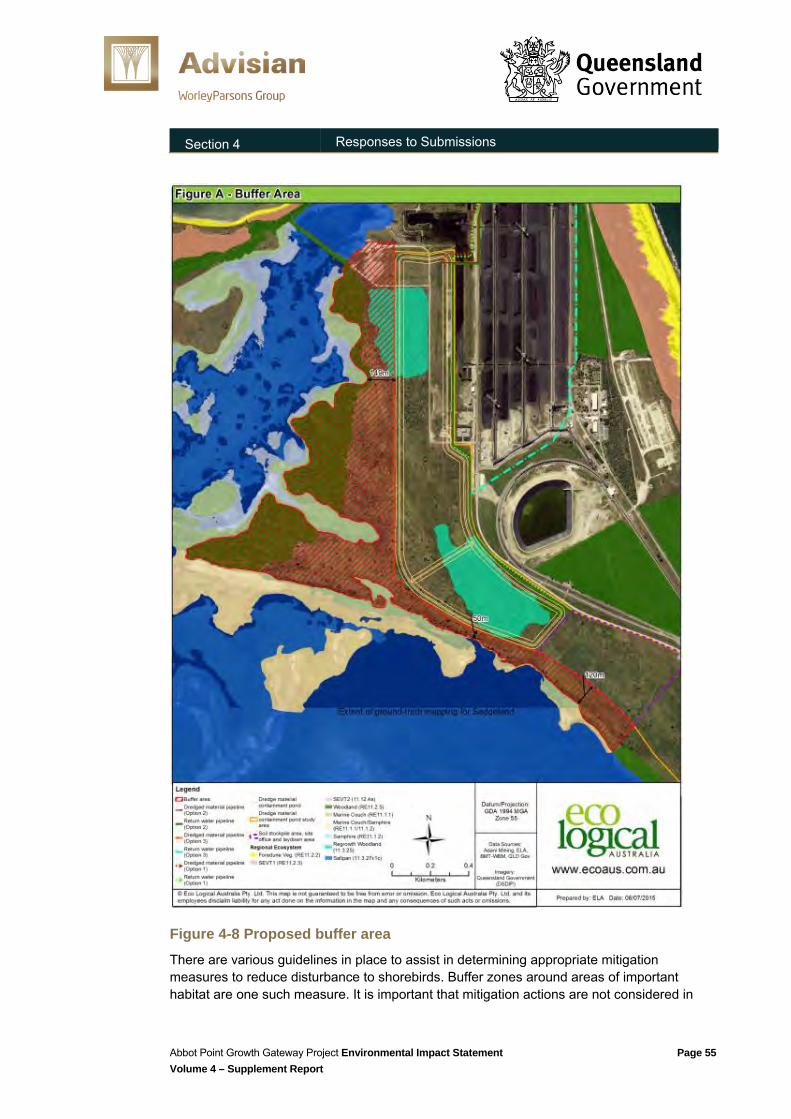
Section 4 Responses to Submissions
Figure 4-8 Proposed buffer area
There are various guidelines in place to assist in determining appropriate mitigation measures to reduce disturbance to shorebirds. Buffer zones around areas of important habitat are one such measure. It is important that mitigation actions are not considered in
Abbot Point Growth Gateway Project Environmental Impact Statement Page 55 Volume 4 – Supplement Report
Section 4 Responses to Submissions
isolation, as the implementation of multiple mitigation measures (e.g. buffer zones combined with visual barriers) are likely to have additional benefits over the adoption of single measures alone.
In relation to the implementation of buffer zones, the draft Migratory Shorebird Guidelines (DEWHA, 2009) state that the size of an appropriate buffer will depend on the nature of the individual circumstances, including species present, type of habitat (ephemeral vs permanent), habitat use (roosting or foraging) and scale of disturbance. It is noted “as a guide” that previous studies have recommended buffer zones ranging from 165m to 255m (DEWHA, 2009).
The buffer zone between the wetland fringe and the project area is highly variable. A minimum distance of 50m is described in the draft EIS, but it does substantially exceed this distance in many locations. A more detailed GIS analysis of the buffer zone has been completed along the wetland fringe, to assist in providing a more detailed evaluation of its adequacy at reducing disturbance to shorebirds.
The distance from the project area boundary to the wetland fringe (salt couch) was measured at 21 equidistant locations along the western and southern boundaries of the project area, with the following results:
Minimum buffer distance - 50.7m Maximum buffer distance – 337.9m Mean buffer distance – 145.0m
The buffer distance outlined in the draft EIS (minimum 50m; average 145m) was determined by considering a range of site-related constraints. In addition to minimising disturbance to the Caley Valley Wetlands through maximisation of the buffer distance, the proposed layout of the DMCP was influenced by engineering design factors, the location of tenure boundaries and the positioning of existing and approved but yet to be constructed infrastructure.
From an environmental perspective, the project area, DMCP configuration and associated buffer distances as described in the draft EIS are considered appropriate for the following reasons:
The Caley Valley Wetlands is an ephemeral system and areas of the wetland fringe comprising salt couch, samphire, salt pan and sedgeland are generally only utilised by shorebirds when the wetland is full. At other times, including when the wetland is nearly full, the effective buffer distance to shorebird habitat will be greater than that outlined above.
At times when the wetland is full, extensive shorebird habitat is located beyond the most conservative of buffer zone distances within only 100m to 200m of the wetland fringe, where the buffer zone is approximately 50m.
The minimum buffer distance of 50m is more than double the published flushing distance (~20m; Glover et al., 2011) of shorebird species known to utilise wetland habitats adjacent to the project area (i.e. Red-necked Stint, Sharp-tailed Sandpiper and Latham’s Snipe).
Project access to the buffer zone will be restricted, minimising the potential for disturbance from cumulative human activities.
The embankment of the DMCP will extend to a height of 4m to 7m above the surrounding ground level, effectively providing a visual barrier or screen to many aspects of the
Abbot Point Growth Gateway Project Environmental Impact Statement Page 56 Volume 4 – Supplement Report
Section 4 Responses to Submissions
Project’s construction and operational activities once the south-western embankment has been constructed.
Construction of the south-western embankment (approximately 1km in length) is the primary activity having the potential to disturb shorebirds. However, this represents a small part of the Project’s overall construction period.
Borgmann (2012) conducted a literature review of the impact of human disturbance on waterbirds. The focus of the assessment was recreational activities such as walking, driving, boating, jet skiing and fishing. Key findings or management recommendations relevant to the Project include:
Flush distances are often used to set buffer zones, but more conservative buffer zones will assist in reducing disturbance
Prevent access to sensitive breeding or roosting sites Establish buffer zones of 250m (based on a review of recreational disturbance) Design features to reduce disturbance (e.g. screens)
When the site-specific factors associated with the project area are considered (e.g. ephemeral wetland, reduced access to the buffer zone, visual screening from embankment), the 250m buffer zone suggested by Borgmann (2012) is considered to be overly conservative. The studies reviewed by Borgmann (2012) were generally of a recreational nature, where the behaviour of people (speed and direction of travel) is unpredictable. Similarities between such activities and those proposed for the Project are limited.
However, there are several examples of migratory shorebirds utilising artificial habitats located within port precincts, despite the more predictable industrial activities that occur around them. Examples include a purpose-built shorebird roost at the Port of Brisbane, and a stormwater pond at the Port of Darwin’s East Arm Wharf, which has been adopted as a high tide roost site for migratory shorebirds (refer EPBC Act approval 2010/5304).
Project construction activities will be relatively consistent and predictable, involving the use of earth moving equipment for topsoil striping and stockpiling, embankment construction and liner installation. The vast majority of earth moving activities will take place at distances of several hundreds of metres from the wetland fringe.
It is only those works at the south-western corner of the project area, which will be located within 165m of the wetland fringe. However, as discussed above, the adoption of a minimum buffer of 50m is considered to be appropriate for these locations, given the nature of the project activities and range of mitigation measures being implemented.
4.1.2.10 Greenhouse gases and climate change Some submissions contended that climate change is currently one of the greatest threats to the GBR, and that the Project would result in a significant increase in GHG emissions, both directly and indirectly by facilitating coal export projects in the region. The Project is therefore perceived to be supporting further reliance on fossil fuels rather than investing in renewable energy sources that would minimise climate change and thereby protect the Reef.
The Project’s facilitation of coal projects, in particular the Carmichael Coal Mine, and emissions resulting from the burning of coal from the mine causing global warming in excess of the Australian Government’s commitment to hold the increase in global temperature below 2ºC was raised.
Abbot Point Growth Gateway Project Environmental Impact Statement Page 57 Volume 4 – Supplement Report
Section 4 Responses to Submissions
The draft EIS has addressed GHG emissions associated with the Project in line with the requirements of DoE, as well as emissions beyond the scope of DoE’s requirements. Specifically, reference can be made to Volume 2 Section 7, and Volume 3 – Appendix I.
In particular, related to the broader related Adani projects, it is stated in Appendix I:
“In addition to the Project’s emissions and emissions from associated Adani projects, the GHG emissions which will result from the combustion of coal which will pass through the proposed Abbot Point Coal Terminal 0, i.e. 70Mtpa have been estimated and provide global context. These combustion emissions are estimated to be around 167Mt CO2 per annum or 10,002Mt CO2 over a 60 year timeframe. These annual emissions from the combustion of coal expected to pass through T0 are approximately 0.5% of the global GHG (based on 2012 figure).”
GHG emissions from the combustion of coal from the Carmichael Coal Mine are also presented in the following expert reports prepared for the purposes of the Land Court proceedings relating to the Carmichael Coal Mine State approvals, which are provided at Appendix G of this Supplement:
Dr C Taylor – Expert Report to the Land Court of Queensland (2015; produced by URS) Expert report of Associate Professor Malte Meinshausen – Climate change emission Professor Ove Hoegh-Guldberg ‘The current and future impacts of climate change and
ocean acidification on the Great Barrier Reef’ (2015) Joint Expert Report to the Land Court – Dr C Taylor and Associate Professor M
Meinshausen Lay witness statement to the Land Court of Queensland – Anthony Wayne Fontes
4.1.2.11 Consideration of cumulative and consequential impacts Submissions included both specific and non-specific concerns about the inadequate nature of the cumulative impact assessment. Specific concerns noted that the scope of the cumulative impact assessment was too narrow in that it did not consider:
Impacts of Galilee Basin coal and rail developments Past pressures of the area Existing T1 operations Information on the migratory network of the key shorebird species that inhabit the wetland
(in particular the critically endangered Eastern Curlew and Curlew Sandpiper), including giving consideration to other coastal developments along the east coast of Australia.
The cumulative impact assessment included in the draft EIS has been scoped relevant to the Project’s impacts and to meet the requirements of the EIS Guidelines. Impacts of related (and other) projects and activities are only appropriate for consideration in the cumulative impact assessment where they act additively with the Project. The cumulative impact assessment clearly outlines and justifies the basis, for example temporal and spatial boundaries, by which activities external to the Project are appropriate to be considered. The draft EIS assesses the cumulative impacts of the other planned projects in the Abbot Point region, including T0, T1 and T3 development and dredging, and the port-end of the NGBR Project and Alpha Coal and Rail Project, and takes into account the cumulative effects of those projects to the region’s ecological values.
Abbot Point Growth Gateway Project Environmental Impact Statement Page 58 Volume 4 – Supplement Report
Section 4 Responses to Submissions
The Galilee Basin is approximately 430km inland from the port. Coal and rail developments in this Basin, by the nature of their location, do not act ‘cumulatively’ on matters impacted by the Project. The exception to this are the ’port end’ activities of rail developments which have been considered in the Project’s cumulative impact assessment.
While not explicitly considered in the cumulative impact assessment, and as noted in the draft EIS, T1 operations (and other current and previous activities posing pressures on the Project’s receiving environment) are implicitly considered in the assessment. This is because these activities are intrinsic to the receiving environment’s existing/baseline environmental condition. When determining the acceptability of potential ‘cumulative’ impacts, the assessment takes account of the baseline condition of the receiving environment and its ability to accommodate the proposed development activities.
Wider coastal development impacts on wetland bird species including Eastern Curlew and Curlew Sandpiper are not a relevant consideration to the cumulative impact assessment, This is because the Project has no direct impacts and no predicted significant residual impact on these matters, i.e. the Project does not act ‘additively’ or ‘cumulatively’ on these matters/species.
The view that separate (EPBC Act) approval of a series of related projects has not allowed for an over-arching cumulative impact assessment was raised within the public comments. While the scope of the draft EIS does not extend to consideration of the merits of State approval processes, it is noted that impacts of related projects have been outlined for the consideration of the Minister within the draft EIS (Volume 2, Section 6.2).
In relation to the draft EIS’ assessment of consequential impacts, a view was expressed that the list of consequential impacts is truncated and should extend to opening the Galilee Basin to coal mining, thereby including the China Stone mine, Alpha Coal mine and Kevin’s Corner mine. The consequential impact assessment included within the draft EIS has been scoped relevant to the Project’s impacts and to meet the requirements of the EIS Guidelines.
The Project is being developed to support the T0 project which will have the capacity to export 70mtpa. It is expected that the T0 project will largely be utilised for the export of coal from the Carmichael Coal Mine. Additional capacity will be available for other coal mines primarily from the Galilee or Bowen Basins. The Kevin’s Corner environmental impact statement identifies that coal from the Alpha Coal Project and Kevin’s Corner Project will be transported from the approved T3 coal export terminal (EPBC 2008/4468).
The China Stone Project is located in close proximity to the Carmichael Coal Mine.
The environmental impact statements for these projects have assessed their impacts as follows:
Chine Stone Project: http://www.statedevelopment.qld.gov.au/assessments-and-approvals/china-stone-coal-project.html
Alpha Coal Project: http://www.statedevelopment.qld.gov.au/assessments-and-approvals/alpha-coal-project.html
Kevin’s Corner Project: http://www.statedevelopment.qld.gov.au/assessments-and-approvals/kevin-s-corner-project.html.
The NGBR project has been considered in its entirety for the purposes of the consequential (or ‘indirect’) impacts assessment in the draft EIS. The draft EIS considers the impacts of
Abbot Point Growth Gateway Project Environmental Impact Statement Page 59 Volume 4 – Supplement Report
Section 4 Responses to Submissions
secondary projects that are facilitated to a major extent by the project, in accordance with the requirements of the EPBC Act.
4.1.2.12 Impacts of increased shipping Some submissions expressed concern that the impacts of increased shipping movements has not been adequately considered in the draft EIS. In particular, it was recommended that impacts around the potential for damage to the Reef and increased accidents, spills or fauna strikes be outlined in more detail with appropriate management measures being installed to address these. No direct commercial shipping activity (with the exception of the arrival and departure of the dredge or associated support vessels) will occur as part of the proposed actions. Shipping activity has been assessed as a consequential impact resulting from the development of port terminal that are linked and enabled by the dredging of berths (i.e. T0 by Adani Abbot Point Terminal Pty Ltd). The assessment considered shipping associated with this proposed terminal. As outlined in the draft EIS (Volume 2, Section 6.3.3.6) the potential impacts of increased shipping has been assessed in:
Abbot Point Coal Terminal 0 (EPBC 2011/6194). Proposed by Adani Abbot Point Terminal Pty Ltd, approved on10 December 2013 with conditions.
Abbot Point Terminal 3 (EPBC 2008/4468). Proposed by Hancock Coal Infrastructure Pty Ltd (in association with GVK), approved on 4 October 2012 with conditions.
EcoLogical Australia (ELA) and Open Lines (2013). Abbot Point Cumulative Impact Assessment. Report prepared for the Abbot Point Working Group.
PGM Environment (2012). Great Barrier Reef Shipping. Review of environmental implications. Report prepared for the Abbot Point Working Group.
Australian Maritime Safety Authority (2014) North-East Shipping Management Plan. October 2014.
Each one of these publications has concluded that the impacts associated with increased shipping in the GBR and specifically shipping associated with Abbot Point is manageable and acceptable. These assessments have included consideration of the cumulative impacts of light, noise and benthic habitat disturbance at anchorage sites as well as impacts to World Heritage values. The assessment undertaken in the draft EIS for the Project identified that many of the measures that can be employed to reduce impacts from shipping are multi-jurisdictional and that many of the necessary measures to address risk in line with greater shipping in the GBR can only be developed, implemented and enforced at a GBR and industry-wide level by relevant agencies such as Maritime Safety Queensland, the Australian Maritime Safety Authority (AMSA) and the GBRMPA. The assessment of facilitated shipping impacts noted that to better coordinate and implement GBR-wide shipping management AMSA has produced and is implementing a North East Shipping Management Plan. The plan deals with shipping management in the GBR, Torres Strait and Coral Sea region and reflects many of the recommendations provided in the GBR shipping study. The plan sets out current and future management arrangements for shipping including:
Pilotage Shipping channels Vessel tracking system
Abbot Point Growth Gateway Project Environmental Impact Statement Page 60 Volume 4 – Supplement Report
Section 4 Responses to Submissions
Oil spill response Port State Control to detain vessels of an unacceptable standard Anchorage management Pollution discharges and waste.
The assessment noted that vessels entering the port will be subject to the requirements of the North East Shipping Management Plan. Through this comprehensive management of shipping, significant impacts to MNES (and associated value to fisheries) will be avoided or minimal.
Furthermore, the Australian Government has already determined that the impacts from shipping are more properly associated with the new terminal at Abbot Point and should be managed by the terminal developers/operators. The facilitated TO project (EPBC2011/6184) has a requirement to establish and implement EMPs for construction and operation that address marine and shipping matters.
Some submissions raised concerns over the extra generation of fine sediments into the water column due to the increases in shipping (and anchoring), which will in turn impact the environment.
Increased shipping directly associated with the Project is expected to be minimal, particularly as the number of vessels involved are few and the drafts are shallow relative to the depth of water within which operations will be undertaken. The focus of the one comment relates principally to the shipping related to the facilitated Adani Abbot Point Coal Terminal 0 project EPBC 2011/6194), which was approved in December 2013. The EPBC approval for the T0 project includes a requirement for the development of a Marine and Shipping Management Plan, for the construction and operational phases of the Project. The approval also includes offset requirements in relation to offsetting residual impacts to the marine environment, including shipping-related impacts.
The extent of plume generation and hence subsequent dispersion is related to the amount of fine sediment in the upper layer of sediment. The sediments at Abbot Point are more coarse sediment than fine sediment. It is possible that localised plumes can be generated from tug and vessel operations for berthing and releasing; however, the availability of fine sediments are reduced over time. Abbot Point is a natural deep water port, and there is no long entrance or departure channel prior to reaching deeper waters for vessel steaming. Such entrance channels are susceptible to filling with fine sediments which can then be available for resuspension. Abbot Point is fortunate not to be subject to this due to the absence of long entrance or departure channel. The vessels will draft about 20m when loaded, hence the requirement to dredge the berth pocket to -21m at Lowest Astronomical Tide. The shipping channel north and out via Palm passage is typically deep, between about 35m and 60m in depth.
Regarding anchorage, the T0 approval has conditions attached including preparation of a Marine and Shipping management Plan, and offset requirements for residual impacts to the marine environment. It should be noted that the Regional Harbour Master controls where ships anchor, not the terminal operators.
The GBR Outlook Report 2014 (p138) describes the disturbance from ship anchorages as having a localised chronic impact, and that for many areas the biodiversity values are likely to be low. This is expected to be a result of anchorages being located in open habitats and
Abbot Point Growth Gateway Project Environmental Impact Statement Page 61 Volume 4 – Supplement Report
Section 4 Responses to Submissions
ongoing disturbance from anchors and chains. Anchorages for ships are not located in areas of high biodiversity value such as coral reefs.
4.1.2.13 Fishing and tourism industries
Some groups and individuals perceived that the draft EIS did not adequately address the fishing and tourism industries, and the impacts that the Project may have on the viability of local businesses. Concerns related specifically to loss of seagrass (and therefore fish habitat) and the effects of increased sediment, noise, light and ship movements through the Reef. It was recommended that more industry engagement be undertaken to adequately assess effects. It was also contended that jobs created by the Project are likely to be outweighed by those that would be lost in Bowen in the tourism and fishing industries if the Project were to proceed.
The analysis of submissions received revealed, in fact, that many local residents are supportive of the job and business opportunities that will be supported by the Project, and expressed an eagerness for the Project to proceed as soon as possible. Several submissions also stated that they believed the appropriate management measures were in place to protect the environment and therefore the associated tourism and fisheries industries.
The draft EIS addresses the controlling provisions for assessment as required for assessment by the Minister. Commercial and recreational fisheries were not identified as a controlling provision, nor are they protected matters under the (EPBC Act).
The draft EIS (Volume 2, Sections 4.7.4 and 8.2.4.4 and Volume 3, Appendix T) addresses fisheries as a user of the GBRMP. As described in that assessment, the removal of 10.5ha of seafloor containing potential seagrass habitat (outside the Park) is unlikely to have an adverse impact on marine ecosystem health, functioning or integrity, and is therefore unlikely to have adverse impacts on recreational or commercial fisheries. Whilst indirect impacts to benthic communities associated with the dredging plume may extend into the GBRMP, the influences on light attenuation are considered comparable to those observed as part of inter-seasonal variability. As such, the effects of the plume on light availability are not predicted to result in detectable losses of seagrass or have detectable impacts on potential seagrass habitat. Elevated sedimentation is not predicted to occur outside the dredging footprint.
The assessment concluded that project activities are not expected to have any substantive impact on other users of the GBRMP, including fisheries. The assessment identified that concerns were raised during the development of the PER for the Terminals 0, 2, and 3 Capital Dredging Project proposed by NQBP. These concerns related specifically to the loss of fishing access both from the Project directly, as well as due to changes in habitat that may alter species distribution and abundances.
The assessment provided in the draft EIS highlights key differences between NQBP’s project and this Project, in particular:
All project activities will be contained within the port limits of Abbot Point, including no requirement for a new offshore relocation ground.
The dredging methodology proposed requires minimal vessel movements outside of the area of works and port limits.
Abbot Point Growth Gateway Project Environmental Impact Statement Page 62 Volume 4 – Supplement Report
Section 4 Responses to Submissions
The minimal sediment release and dredging plume associated with the proposed methodology will cause a very small area of impact, primarily within port limits (refer to Volume 3 Appendix Q1, Section 6.2.8 - Figure 6-56 and Figure 6-57 - which compares the worst-case scenario for the previous project compared to the current Project.
The dredging works will occur over a period of 5 to 13 weeks, depending on the size of the dredge vessel. The dredging area is similarly limited in its spatial scale. The Fisheries Technical report (draft EIS Appendix T) concluded that impacts to commercial fishing activities are unlikely and considered to be minor. Any potential access restrictions will only occur for a short period of time and over a limited area.
The scope of the previously approved NQBP capital dredging project, including the dredging quantities, was very different and included disposal in the GBRMP. The impacts to commercial fishing activities from this Project are considered highly unlikely to occur
The Proponent carried out a proactive consultation program with a range of stakeholders, including commercial fishers and tourism groups, as described in Volume 2, Section 1.6 of the draft EIS and in Section 2 above.
Volume 3, Appendix T of the draft EIS assessed in detail potential impacts to commercial and charter fishing operations, and recreational fishing activities. This assessment was based on available logbook data and took into account logbook reporting grid arrangements in and around the Port of Abbot Point. This assessment found that the impacts from the proposed dredging activity and related temporary underwater pipeline infrastructure on fisheries to be negligible and would not impact fisheries production and catch in any significant way. The Fisheries Technical report concluded that port activities and commercial and recreational fishing at Abbot Point have co-existed and would continue to co-exist.
In addition to the short-term temporary impacts of the proposed dredging activity and related temporary underwater pipeline infrastructure on fisheries, the draft EIS considered the impacts of increased shipping movements and anchorages. These particular impacts which are related to the broader port expansion are being addressed separately via the North East Water Space Management Working Group.
Volume 3, Appendix R of the draft EIS assessed the potential social impacts of the Project, including impacts on commercial and recreational fishing activities. This assessment found that due to the limited footprint of the Project both spatially and temporally, and location in close proximity to the existing wharf and jetty infrastructure, potential impacts will be minimal. Combined with project-specific design features, such as use of a CSD to maximise sediment recovery, reduction of dredging volumes, avoidance of development in the Caley Valley Wetlands, potential impacts on fishing effort and on the local seafood processing and retail businesses are unlikely.
4.1.3 Good governance
4.1.3.1 Period for submissions
The period of submission was raised as a cause of concern in some submissions, stating that the time period allowed was too short to allow adequate review of the draft EIS and provision of a considered submission.
The minimum consultation period and the consultation process for the draft EIS are mandated in the EPBC Act, which is administered by the DoE.
Abbot Point Growth Gateway Project Environmental Impact Statement Page 63 Volume 4 – Supplement Report
Section 4 Responses to Submissions
The public comment period was 21 business days or 28 calendar days. The launch also provided an additional day for those viewing the draft EIS online. Given the considerable volume of existing environmental assessments conducted at the Port of Abbot Point and the recent public comment period for the previous project (December 2014), 21 business days / 28 calendar days was considered to be an appropriate comment period.
The Proponent’s consultation program was designed to reach the broadest possible stakeholder group using a range of consultation and engagement methods. A proactive consultation program was employed and is described in Volume 2, Section 1.6 of the draft EIS and in Section 2 above.
4.1.3.2 Proponent conflict of interest
Several submissions raised that the Queensland Government has a conflict of interest in the Project, given that it is both the Proponent and the assessor. The credibility of the process was therefore questioned.
The Project will require a range of regulatory approvals to be obtained at both the Australian and Queensland Government levels. The approvals anticipated to be required for the Project are set out in Volume 2, Section 1.5.12 of the draft EIS.
Assessment of the potential impacts of the Project will be undertaken by the relevant regulatory agencies in accordance with applicable legislation, planning instruments, policies and guidelines. As the Project’s Proponent, DSD has no role in the assessment of the impacts by regulatory agencies.
The Queensland DSD has engaged Advisian, part of WorleyParsons, to prepare the draft EIS. Advisian was commissioned to lead the preparation of the EIS and State approvals applications for the Abbot Point Growth Gateway Project. Advisian assembled a team of in-house and external consultants, including ELA, Biodiversity Assessment and Management, BMT WBM, Royal Haskoning DHV, Centre for Tropical Water & Aquatic Ecosystem Research (TropWATER) – James Cook University, Australasian Groundwater and Environmental Consultants, Katestone Environmental, SLR Consulting Australia, Economic Associates and Bond University; who are each suitably qualified and experienced practitioners in undertaking environmental studies, assessing impacts of project activities on environmental and social values, and assisting in the development of management plans.
4.2 Responses to campaign submissions Submission comments were deemed to be distinct or unique if they raised specific issues or referred to particular sections of the draft EIS. The responses to these distinct submissions is included in Appendix A. The table in this appendix breaks up and summarises the main issues contained within the submissions and attempts to convey the overall sentiment of submissions, but has not necessarily used the submitter’s exact wording in each case. In some instances, responses have involved detailed written explanations, while in others there is a cross-reference to the common themes discussed above, or a reference back to an original section of the draft EIS.
‘Generic’ feedback submissions were those received from individuals or groups not belonging to campaigns and providing personal opinions without specific questions or comments related to the draft EIS. Both positive and negative generic comments are
Abbot Point Growth Gateway Project Environmental Impact Statement Page 64 Volume 4 – Supplement Report
Section 4 Responses to Submissions
included in this category, and summary of these generic submissions and campaign letters is included in Table 4-3, along with the Proponent’s response. Standard text for campaigns is included in Appendix B.
Abbot Point Growth Gateway Project Environmental Impact Statement Page 65 Volume 4 – Supplement Report

Section 4 Responses to Submissions
Table 4-3 Summary of campaign letters and generic submissions
Ref. Campaign Name Summary of Submission Response
44 Campaign 1
Sum of Us
Key messages:
1. The Project will ruin the Great Barrier Reef.
The draft EIS for the Project assessed all potential environmental values at Abbot Point and whether they are present in a manner that contributes to the Outstanding Universal Value (OUV) of the World Heritage Property. The assessment has been conducted by qualified experts in their respective fields and the Queensland Government has considered how best to accommodate port development now and into the future, while also achieving a net benefit for the Great Barrier Reef World Heritage Area (GBRWHA). This is reflected in the offset strategy outlined in Section 5.2 above.
The dredged material is proposed to be contained in the DMCP, which will be appropriately managed to ensure minimal impacts on the GBR as well as the adjacent Caley Valley Wetlands (refer to Section 4.1.1.3 of this Report).
This is now a matter for consideration by the Minister.
2. Reef seabed in World Heritage waters will be “ripped up”.
3. The dredged spoil will be dumped adjacent to the sensitive Caley Valley Wetlands, ruining the habitat of up to 40,000 birds, including many rare and threatened species
Refer to Section 4.1.2.8 0
4. Dredging will occur around Abbot Point, near waters that are home to rare and endangered sea turtles, Dugongs and Snubfin Dolphins. The Project is also planned to occur in the path of migrating humpback whales
Refer to Section 4.1.2.5 and 4.1.2.8
Abbot Point Growth Gateway Project Environmental Impact Statement Page 66 Volume 4 – Supplement Report
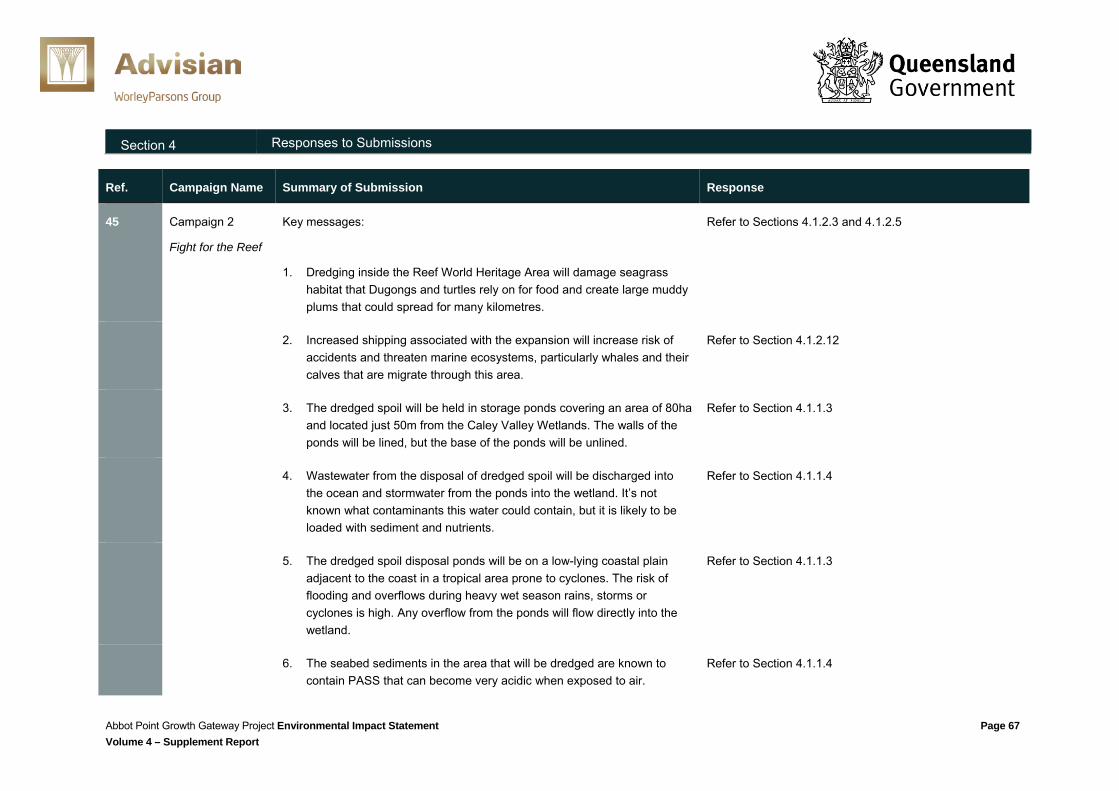
Section 4 Responses to Submissions
Ref. Campaign Name Summary of Submission Response
45 Campaign 2
Fight for the Reef
Key messages:
1. Dredging inside the Reef World Heritage Area will damage seagrass habitat that Dugongs and turtles rely on for food and create large muddy plums that could spread for many kilometres.
Refer to Sections 4.1.2.3 and 4.1.2.5
2. Increased shipping associated with the expansion will increase risk of accidents and threaten marine ecosystems, particularly whales and their calves that are migrate through this area.
Refer to Section 4.1.2.12
3. The dredged spoil will be held in storage ponds covering an area of 80ha and located just 50m from the Caley Valley Wetlands. The walls of the ponds will be lined, but the base of the ponds will be unlined.
Refer to Section 4.1.1.3
4. Wastewater from the disposal of dredged spoil will be discharged into the ocean and stormwater from the ponds into the wetland. It’s not known what contaminants this water could contain, but it is likely to be loaded with sediment and nutrients.
Refer to Section 4.1.1.4
5. The dredged spoil disposal ponds will be on a low-lying coastal plain adjacent to the coast in a tropical area prone to cyclones. The risk of flooding and overflows during heavy wet season rains, storms or cyclones is high. Any overflow from the ponds will flow directly into the wetland.
Refer to Section 4.1.1.3
6. The seabed sediments in the area that will be dredged are known to contain PASS that can become very acidic when exposed to air.
Refer to Section 4.1.1.4
Abbot Point Growth Gateway Project Environmental Impact Statement Page 67 Volume 4 – Supplement Report
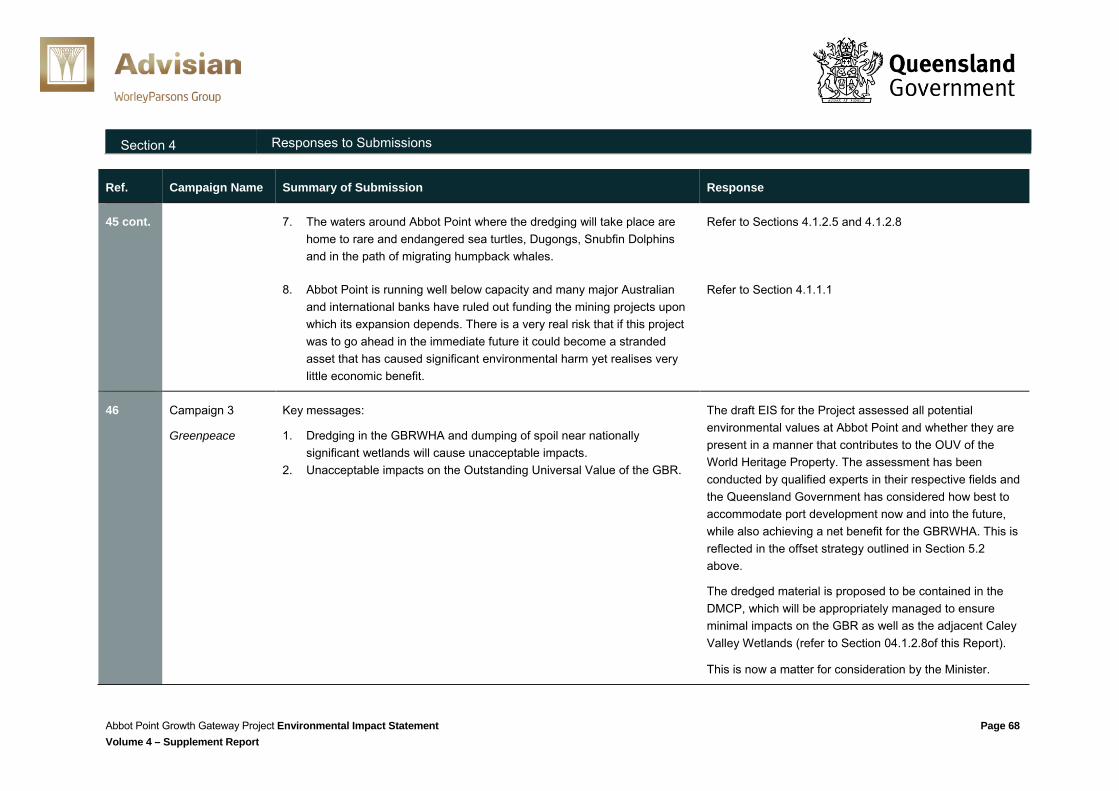
Section 4 Responses to Submissions
Ref. Campaign Name Summary of Submission Response
45 cont. 7. The waters around Abbot Point where the dredging will take place are home to rare and endangered sea turtles, Dugongs, Snubfin Dolphins and in the path of migrating humpback whales.
Refer to Sections 4.1.2.5 and 4.1.2.8
8. Abbot Point is running well below capacity and many major Australian and international banks have ruled out funding the mining projects upon which its expansion depends. There is a very real risk that if this project was to go ahead in the immediate future it could become a stranded asset that has caused significant environmental harm yet realises very little economic benefit.
Refer to Section 4.1.1.1
46 Campaign 3
Greenpeace
Key messages:
1. Dredging in the GBRWHA and dumping of spoil near nationally significant wetlands will cause unacceptable impacts.
2. Unacceptable impacts on the Outstanding Universal Value of the GBR.
The draft EIS for the Project assessed all potential environmental values at Abbot Point and whether they are present in a manner that contributes to the OUV of the World Heritage Property. The assessment has been conducted by qualified experts in their respective fields and the Queensland Government has considered how best to accommodate port development now and into the future, while also achieving a net benefit for the GBRWHA. This is reflected in the offset strategy outlined in Section 5.2 above.
The dredged material is proposed to be contained in the DMCP, which will be appropriately managed to ensure minimal impacts on the GBR as well as the adjacent Caley Valley Wetlands (refer to Section 0 4.1.2.8of this Report).
This is now a matter for consideration by the Minister.
Abbot Point Growth Gateway Project Environmental Impact Statement Page 68 Volume 4 – Supplement Report
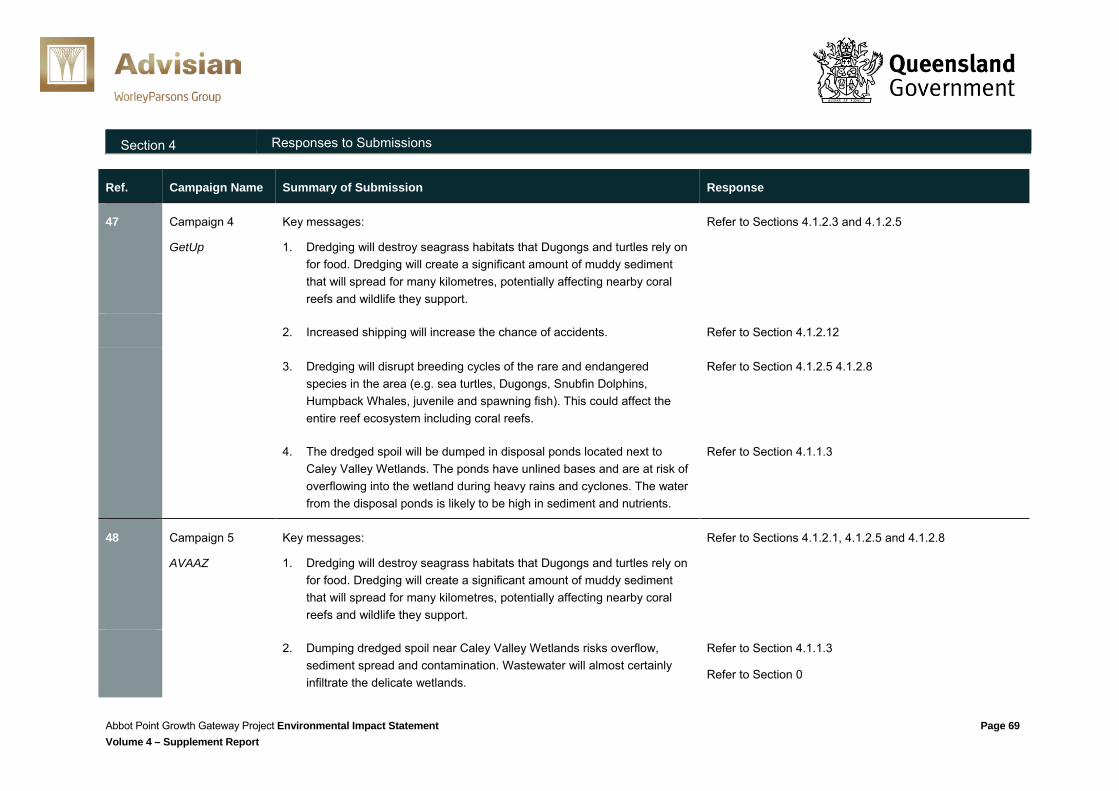
Section 4 Responses to Submissions
Ref. Campaign Name Summary of Submission Response
47 Campaign 4
GetUp
Key messages:
1. Dredging will destroy seagrass habitats that Dugongs and turtles rely on for food. Dredging will create a significant amount of muddy sediment that will spread for many kilometres, potentially affecting nearby coral reefs and wildlife they support.
Refer to Sections 4.1.2.3 and 4.1.2.5
2. Increased shipping will increase the chance of accidents. Refer to Section 4.1.2.12
3. Dredging will disrupt breeding cycles of the rare and endangered species in the area (e.g. sea turtles, Dugongs, Snubfin Dolphins, Humpback Whales, juvenile and spawning fish). This could affect the entire reef ecosystem including coral reefs.
Refer to Section 4.1.2.5 4.1.2.8
4. The dredged spoil will be dumped in disposal ponds located next to Caley Valley Wetlands. The ponds have unlined bases and are at risk of overflowing into the wetland during heavy rains and cyclones. The water from the disposal ponds is likely to be high in sediment and nutrients.
Refer to Section 4.1.1.3
48 Campaign 5
AVAAZ
Key messages:
1. Dredging will destroy seagrass habitats that Dugongs and turtles rely on for food. Dredging will create a significant amount of muddy sediment that will spread for many kilometres, potentially affecting nearby coral reefs and wildlife they support.
Refer to Sections 4.1.2.1, 4.1.2.5 and 4.1.2.8
2. Dumping dredged spoil near Caley Valley Wetlands risks overflow, sediment spread and contamination. Wastewater will almost certainly infiltrate the delicate wetlands.
Refer to Section 4.1.1.3
Refer to Section 0
Abbot Point Growth Gateway Project Environmental Impact Statement Page 69 Volume 4 – Supplement Report

Section 4 Responses to Submissions
Ref. Campaign Name Summary of Submission Response
48 cont. 3. The dredged spoil disposal ponds will be on a low-lying coastal plain adjacent to the coast in a tropical area prone to cyclones. The risk of flooding and overflows during heavy wet season rains, storms or cyclones is high.
Refer to Section 4.1.1.3
4. Increased shipping will vastly increase risk of reef damage from ship wreck and pollution.
Refer to Section 4.1.2.12
49 Campaign 6
Mackay Conservation Group
Key messages:
1. The dredging operation: a. The dredging operation will destroy important seagrass habitat
which support many marine animals including rare and endangered dugongs and sea turtles. Seagrass meadows also provide shelter for many important fish species.
Refer to Sections 4.1.2.3 and 4.1.2.5 4.1.2.8
b. The dredging operation will also create a muddy plume that could spread for many kilometres, potentially affecting the nearby coral reefs and seagrass meadows.
Refer to Section 4.1.2.1
2. The dredge spoil a. The unlined ponds will allow up to 70ML of contaminated water to
seep into groundwater, the wetland and the ocean each week. This is likely to affect salinity levels in the wetland which will in turn affect the quality of the wetland ecosystems.
Refer to Section 4.1.1.3
b. It is not known what contaminants the wastewater or stormwater from the storage pond contains. It will likely include fine sediments that do not settle out fully from the DMCP and contaminants from
Refer to Section 4.1.1.3
Abbot Point Growth Gateway Project Environmental Impact Statement Page 70 Volume 4 – Supplement Report
Section 4 Responses to Submissions
Ref. Campaign Name Summary of Submission Response
49 cont. shipping and other port operations.
c. The DMCP will be on a low-lying coastal plain adjacent to the coast in a tropical area prone to cyclones. The risk of flooding and overflows during heavy wet season rains, storms or cyclones is high. Any overflow will flow directly into the wetland.
Refer to Section 4.1.1.3
d. The endangered Australian Painted Snipe has essential habitat within 50m of the proposed DMCP which puts it at risk from wastewater pond failure, changes to groundwater hydrology and the noise and activity of the dumping project.
Refer to Section 4.1.2.8
e. Changes in the salinity of Lake Caley from this proposal will probably also affect the numbers of freshwater bird species that can use the wetland.
Refer to Section 4.1.2.8
f. This Project will facilitate more coal and coal handling which will increase the coal dust pollution in the wetland.
Refer to Section 4.1.2.8
The air quality modelling results for the Project were assessed to establish potential impacts of dust generated by the Project on the wetland habitats and bird species potentially present. ELA (2015) concluded that the modelled dust levels would not affect habitat quality, and that while dust exceeded human health standards for PM10 in 2.2% of the Caley Valley Wetlands, this would not represent a significant impact for bird species present. However, ELA (2015) recommended that further dust management strategies be implemented to reduce dust generation. The Outline EMP indicates that dust management strategies exceeding those assumed in the
Abbot Point Growth Gateway Project Environmental Impact Statement Page 71 Volume 4 – Supplement Report
Section 4 Responses to Submissions
Ref. Campaign Name Summary of Submission Response
49 cont. air quality model will be implemented, reducing actual dust concentrations below those of the modelled results.
3. Shipping impacts on water quality a. The increase in shipping activity will have a significant impact on the
local marine environment. b. The berthing activities of large ships cause massive plumes of silt.
The suspended silt then spreads kilometres up and down the coast with the tides.
c. A ship underway will also cause silt pollution as the propeller re-suspends the silt from the shallow, coastal sea floor which is then carried north and south by the tides.
d. The anchoring of large ships with large anchors and large chains completely destroys any and all life on the seafloor. As well, the anchor and chain re-suspend the silt, creating significant silt plumes that will travel up and down the coast, harming nearby seagrass meadows and coral reefs. Such damage at Gladstone was up to 16km offshore.
e. An increase in shipping will bring an increase in the risk of groundings, oil spills and the introduction of alien species through bilge water. These large coal ships also burn heavy bunker diesel oil which is a source of carcinogenic diesel particulates, so some pollution from this source will also rise.
f. These are downstream impacts from this dredge disposal project. These must be addressed, along with the cumulative impacts.
Refer to Section 4.1.2.12
Refer to Section 4.1.2.1
4. Justification - Abbot Point is running well below capacity. The need to expand Abbot Point is based on the assumption that the Galilee Basin coal mines will soon be in production and shipping out through Abbot
Refer to Section 4.1.1.1
Abbot Point Growth Gateway Project Environmental Impact Statement Page 72 Volume 4 – Supplement Report

Section 4 Responses to Submissions
Ref. Campaign Name Summary of Submission Response
49 cont. Point. Given the current structural decline of the coal industry and the global movement away from coal for energy, the Galilee Basin is not an economical proposition and will not be opening any time soon.
50 Campaign 7
North Queensland Conservation Council
Key messages:
1. The Project would permanently damage the Reef and its inhabitants, put further pressure on threatened species and thousands of migrating birds that use the nationally listed Caley Valley Wetland, and exacerbate the greatest threat to the Reef and the planet – climate change.
Refer to Sections 4.1.2.3, 4.1.2.5, 4.1.2.8 and 4.1.2.10
2. Dredging of the seabed would destroy seagrass meadows that provide food for many marine animals, including rare and endangered Dugongs and sea turtles, and provide shelter for many fish species. The act of dredging creates mobile plumes of sediment. Around Abbot Point this would see significant reefs being smothered.
Refer to Section 4.1.2.3
Refer to Section 4.1.2.5
3. The dumping of the spoil from the dredging project in a spot squeezed between the GBRWHA and the nationally recognised Caley Valley Wetlands, on an exposed lowland, is asking for trouble, especially with the expected increase in intense weather events in the area.
Refer to Section 4.1.1.3
4. The endangered Australian Painted Snipe has essential habitat within 50m of the proposed dredge spoil dumping site which puts it at risk from wastewater pond failure, changes to groundwater hydrology and the noise and activity of the dumping project. These risks would also apply to the 40,000 birds that frequent this area - one of the few coastal wetlands left in eastern Australia.
Refer to Section 4.1.2.8
The ecological impact assessment undertaken for the EIS determined that project activities would not significantly impact on the Australian Painted Snipe and other migratory/shorebird species in the wetland. An area of 4% of the wetland would be affected by some construction noise under worst-case conditions.
Abbot Point Growth Gateway Project Environmental Impact Statement Page 73 Volume 4 – Supplement Report
Section 4 Responses to Submissions
Ref. Campaign Name Summary of Submission Response
50 cont. No habitats for migratory species within the wetland are restricted to the locations predicted to be affected by construction noise and while there is already a level of background, industrial noise from port activities, noise-sensitive species may move away from these locations during the construction period.
Section 4.4.7.4 of the Terrestrial Ecology Technical Report (Volume 3, Appendix P) provides a species-by-species assessment of the potential impacts of construction noise. The short duration and limited area of impact of construction noise within the wetland has resulted in a predicted low impact on migratory species if present in the wetland at the time of construction.
5. The expanded port would lead to vastly more ships in this fragile reef area, with the inevitable increase in ship-related incidents. In addition to the increase in damage due to normal practices such as berthing and anchoring, more ships means more risk of accidents. Within the last two months in the area, we have seen a whale calf killed by a ship's propeller and an oil spill involving oil contamination from Cape Upstart to north of Hinchinbrook Island.
Refer to Section 4.1.2.12
6. The burning of coal is the greatest contributor to climate change, which is the greatest threat to the Reef. As the world recognises the economic, social and environmental superiority of renewable energy, the market for coal is diminishing rapidly. To damage the Reef for a dying industry would be illogical.
Refer to Section 4.1.2.10
Abbot Point Growth Gateway Project Environmental Impact Statement Page 74 Volume 4 – Supplement Report
Section 4 Responses to Submissions
Ref. Campaign Name Summary of Submission Response
51 Generic
Negative
These submissions included personal messages which expressed a generally negative sentiment towards the Project. These were received from individuals and organisations.
All generic negative comments that were received have been adequately covered and responded to in the ‘substantive’ submissions section of this report.
Refer to comments and responses in Appendix A.
52 Generic
Positive
These submissions included personal messages which expressed support for the Project. These were received from individuals and organisations. Positive submissions generally included points around:
1. The comprehensive nature of the EIS and proposed control measures, preventing the environment from being compromised by the Project.
2. The benefits of the Project in terms of creating jobs and business opportunities.
3. The fact that the port has previously been dredged and is still one of the best fishing spots in the local area – confidence that further dredging will not affect the marine environment.
No response required.
Abbot Point Growth Gateway Project Environmental Impact Statement Page 75 Volume 4 – Supplement Report
Section 5 Project Refinement
5 Project Refinement
This section details changes, clarifications and updates on the Project from that described in Volumes 1 to 3 of the draft EIS. Also included are editorial corrections to the draft EIS document.
5.1 Changes to the Project There are no changes to the Project Description as provided in Volume 2, Section 2 of the draft EIS.
5.2 Offsets strategy The offsets strategy has been further refined since publication of the draft EIS. The full Offset/Net Benefit Strategy for the Abbot Point Growth Gateway is attached as Appendix F to this report.
Background
The environmental impact assessment process for the Project has determined that there are no significant residual impacts of the project on MNES, and therefore no requirement to offset impacts in accordance with the EPBC Act Environmental Offsets Policy (2012). However, independent of this policy, there is a requirement to achieve a net benefit through offsetting impacts that cannot be avoided or mitigated within the GBRWHA. Specifically, the EIS guidelines state that the EIS must demonstrate how the proposed action will provide a net benefit for water quality in the GBRWHA consistent with the Reef 2050 Long-Term Sustainability Plan (2015).
Residual impacts of the Project on GBRWHA values that cannot be avoided or fully mitigated are:
1. The exposure of 9,938t of fine sediment available for resuspension through the dredging activities
2. Permanent loss of 10.5ha of potential seagrass habitat within the proposed berth pockets.
The preferred strategy to offset the residual impacts of the Project is to provide a net benefit for water quality and seagrass in the GBRWHA by contributing offset/net benefit funds to actions being delivered under the existing framework that implements the strategies set out in the Reef 2050 Plan via the Reef Trust. It must, however, be ensured that those actions are delivered in the catchments that influence marine water quality and nearshore ecosystems in the region (i.e. the Burdekin and/or Don River catchments).
Proposed Reef Trust contribution for sediment reduction
A contribution to catchment management actions via the Reef Trust that will prevent 150% of the fine sediment predicted to be generated by the Project, a total of 14,907t, from entering the marine environment is proposed. This strategy is consistent with the Reef 2050 Plan target to achieve up to a 50% reduction in anthropogenic end-of-catchment loads of sediment in priority areas by 2025.
Abbot Point Growth Gateway Project Environmental Impact Statement Page 76 Volume 4 – Supplement Report
Section 5 Project Refinement
In the absence of an available metric for calculating an appropriate financial contribution to Reef Trust to achieve water quality net benefits/offsets, it is proposed to make an assessment of the costs to institute a hypothetical (yet feasible) gully erosion management project developed in accordance with the findings of Wilkinson et al. (2015) and which would fit within the Reef Trust Phase II Investment for ‘gully erosion control in priority grazing landscapes’. The costing would be based on implementing cost effective, gully remediation techniques to reduce erosion from active gullies in priority grazing landscapes (Lower Burdekin and Don River catchments).
The costed offset/net benefit program would be designed to achieve the Project’s sediment reduction requirements within the first five years. However, it is expected that gully management infrastructure would have a 15 year design life before requiring refurbishment. The project would be maintained and monitored via the Reef Trust ‘gully erosion control in priority grazing landscapes’ project.
The capital costs for the project would be costed by a qualified estimator. The overall sediment control project NPV (incorporating capital expenditure, maintenance, monitoring and Reef Trust Administration) would be determined. Taking into account the total fine sediment reduction over the entire life of the infrastructure (15 years), a $/t for value for fine sediment reduction would be determined. This $/t for value for fine sediment reduction over the infrastructure useful life would be applied to calculate the required payment to the Reef Trust for the 14,907t fine sediment reduction required for the Project.
Proposed Reef Trust contribution for seagrass
The EPBC Act Offsets Policy recognises the difficulty in achieving meaningful direct offsets for some ecological communities. Current literature finds that improving water quality within GBR catchments, and specifically a reduction in fine sediments entering the GBR Lagoon, will contribute to enhancing the resilience of seagrass ecosystems. The Reef Trust Phase II Investment for ‘gully erosion control in priority grazing landscapes’ is specifically designed to achieve improved water quality through reducing sediment entering the GBR from priority management areas.
In the absence of an accepted metric for calculating an appropriate financial contribution to Reef Trust to offset Project impacts on seagrass, a financial contribution equivalent to a relevant portion of a costed seagrass enhancement recovery and restoration program for 6.3ha of high productivity seagrass case study is proposed.
To determine the relevant project contribution to the restoration case study project presented in this offset/net benefit strategy, calculations consider the area and quality of the potential seagrass habitat impacted by the Project (i.e. 10.5ha of maximum 5% cover seagrass that would be lost through dredging of the berth pockets). This is considered a conservative basis as the most current data (December 2014) shows no seagrass currently present in this area.
As the restoration project case study provides for the re-establishment of high productivity nearshore seagrass while the impact location supports a potential maximum 5% cover of low productivity deepwater seagrass , comparability has been achieved by consolidating required offset in the impact area to a 0.5ha area (5% of 10.5 ha). A multiplier of x4 will be applied to account for uncertainty (x2) and the provision of an overall net benefit (x2) of the seagrass affected, requiring a 2ha area offset. A 30% administration cost will be included in the costing.
Abbot Point Growth Gateway Project Environmental Impact Statement Page 77 Volume 4 – Supplement Report
Section 5 Project Refinement
The proposed net benefit/offset contribution to the Reef Trust for seagrass impacts would be equivalent to a 2ha proportion (31.7%) of the cost of the overall (6.3ha)restoration project.
A $/ha for the cost of the restoration project case study would be determined and applied to calculate the required payment to the Reef Trust for the 2ha area offset required for the Project.
Offset/net benefit suitability and effectiveness
The proposed offsets comply with the overarching EPBC Act offset principles and are consistent with the recommendations of Bos et al. (2014) for improving the effectiveness of marine offsets for the GBRWHA.
There are no significant residual impacts on GBRWHA values predicted for this Project. However, the Proponent is committed to achieving a net benefit for the GBRWHA, and through impact avoidance and mitigation has ensured that the environmental outcomes are consistent with the strategies and objectives of the Reef 2050 Long Term Sustainability Plan. The proposed net benefit component of the Project has been developed to appropriately support the Reef Trust initiative to provide innovative, targeted investment focused on improving water quality, restoring coastal ecosystem health and enhancing species protection within the GBRWHA.
5.3 Additional assessment and information No changes to the conclusions of the draft EIS assessment or substantive additional assessment has been required as a result of project changes or to address submissions.
Section 4.1.2.1 includes clarification of the sediment plume assessment and details results relevant to local reef formations identified in submissions and likely to be important to local members of the public (e.g. spear fishing).
Subsequent to the draft EIS publication, additional testing of representative historical samples of the material to be dredged has confirmed the remaining presence of neutralising capacity in the material. The technical memorandum detailing the testing and results is attached at Appendix D.
In response to comments received in relation to assessment of the DMCP containment risk, information on the engineering risk analysis of dredged material containment has been provided as Appendix E. This information supplements the previous Consequence Category Assessment provided as Appendix D (Volume 3) to the draft EIS.
5.4 Editorial corrections Volume 1 - Executive Summary: Section 3 ‘Native Title and Cultural Heritage’
“The Juru People hold non-exclusive native title rights and interests in land and waters within the Port of Abbot Point and the Abbot Point State Development Area.
In accordance with the Aboriginal Cultural Heritage Act 2003, as registered native title holder, the Juru People have special legal status as the primary party in charge of Aboriginal cultural heritage within the boundaries of the registered native title determination. Therefore, the proponent intends to develop a cultural heritage management agreement with Kyburra
Abbot Point Growth Gateway Project Environmental Impact Statement Page 78 Volume 4 – Supplement Report
Section 5 Project Refinement
Munda Yalga Aboriginal Corporation to identify and manage any project impact on Aboriginal cultural heritage values in both onshore and offshore areas. The engagement process has already been initiated and is ongoing.
The Native Title determination is subject to a suite of tenures and Indigenous Land Use Agreements (ILUAs) that deal with development at Abbot Point and in the APSDA. This includes the Port of Abbot Point and APSDA ILUA (QI2011/063). The parties to this ILUA are the Juru People, the State of Queensland, NQBP, the Coordinator-General and Juru Enterprises Limited. It also includes the Juru People and Adani Abbot Point Terminal ILUA (QI2013/036)”
The cultural heritage management procedures in the Port of Abbot Point and APSDA ILUA will be utilised to address any potential impacts of the project activities on Aboriginal cultural heritage values in both onshore and offshore areas of the Project.
Volume 2 - Section 4.6.4.4: Impacts on MNES – World and National Heritage
Offshore activities
“….With all reasonable mitigation measures in place, the dredging process and return water from the DMCP will contribute approximately 16,680t 9,938t of fine sediment to the marine environment at Abbot Point. To place the predicted sediment from the Project into a larger local context, the Burdekin and Don River catchments are currently estimated to contribute a combined 4,203,000t per year of TSS to the GBRWHA in this region (Kroon et al., 2010)”.
Section 4.6.5 – Impacts on MNES – Summary
“…The proposed short-term (5 to13 weeks) dredging program has been designed to minimise the potential for increases in sediment loads to the GBRWHA in line with the goals of the Reef 2050 Plan
With all reasonable mitigation measures in place, the dredging process and return water from the DMCP will contribute 16,680t 9,938t of fine sediment to the marine environment at Abbot Point
The current assessment has determined that the impacts of the Project on the marine environment at Abbot Point do not exceed established criteria for significant residual impact at this location, and subsequently there are no requirements for the provision of offsets under the EPBC Act…”
Abbot Point Growth Gateway Project Environmental Impact Statement Page 79 Volume 4 – Supplement Report
Section 6 Conclusion
6 Conclusion
This Supplement Report has been developed for the Abbot Point Growth Gateway Project and considers and responds to comments raised by stakeholders during the public exhibition of the draft EIS. As appropriate, reference has been made to information previously provided and/or additional information and clarification provided.
With the submission of this supplement report, the EIS for the Abbot Point Growth Gateway Project is now considered to be finalised, and comprises the following:
Volume 1 – Executive Summary Volume 2 – Draft Environmental Impact Statement Volume 3 – Appendices Volume 4 – Supplement Report
The proponent considers that sufficient information has now been provided to allow the Minster to make an informed decision on whether or not to approve the undertake an informed decision on whether to ‘approve’, ‘approve with conditions’ or ‘not approve’ the Project.
Abbot Point Growth Gateway Project Environmental Impact Statement Page 80 Volume 4 – Supplement Report

Section 7 References
7 References
Bell, I. (2003). Turtles population dynamics in the Hay Point, Abbot Point and Lucinda Port areas. Brisbane: Ports Corporation of Queensland Ltd
Borgmann, K.L. (2012). A review of human disturbance impacts on waterbirds. California
Bos, M., Pressey, R.L., Stoekl, N. (2014). Effective marine offsets for the Great Barrier Reef World Heritage Area. Environmental Science and Policy, 1-15
BMT WBM. (2012). Kaili (Caley) Valley Wetlands Baseline Report. Brisbane: Office of the Queensland Coordinator-General, Department of Employment, Economic Development and Innovation
CDM Smith. (2013a). Abbot Point Coal Terminal 0 Project: Final Environmental Impact Statement. Brisbane: Adani Abbot Point Terminal Pty Ltd
CDM Smith. (2013b). Public Environment Report Supplementary - Abbot Point Terminals 0, 2 and 3 Capital Dredging. Retrieved 2015, from North Queensland Bulk Ports: http://www.nqbp.com.au/environment
Chartrand, K.M., Rasheed, M. A., Sankey, T.L. (2008). Deepwater seagrass dynamics in Hay Point – Measuring variability and monitoring impacts of capital dredging. Final Report to the Ports Corporation of Queensland, 43 pp
Chilvers, B.L., Delean, S.G., Nicholas, J., Holley, D.K., Lawler, I.R., Marsh, H., and Preen, A.R. (2004). Diving behaviour of dugongs, Dugong dugon. Journal of Experimental Marine Biology and Ecology, 304 (2). pp. 203-224
Department of the Environment. (2013). Matters of National Environmental Significance. Significant Impact Guidelines 1.1. Environment Protection and Biodiversity Conservation Act 1999. Brisbane: Department of the Environment
Department of the Environment, Water, Heritage and the Arts. (2009). EPBC Act policy Statement 3.21: Significant impact guidelines for 36 Migratory shorebird species. Canberra
Department of the Environment, Water, Heritage and the Arts. (2012). National Framework and Guidance for Describing the Ecological Character of Australian Ramsar Wetlands. Module 2 of the National Guidelines for Ramsar Wetlands – Implementing the Ramsar Convention in Australia
EcoLogical Australia, 2015. Abbot Point Growth Gateway Project Terrestrial Ecology Report: Matters of National Environmental Significance. Prepared for Advisian
Environment Australia, 2002. National Ocean Disposal Guidelines for Dredged Material. Commonwealth of Australia, May 2002
Erftemeijer, P.L.A. and Lewis R.R.R III. (2006). Environmental impacts of dredging on seagrass: A review. Marine Pollution Bulletin 52 (2006) 1553–1572
Glover, H., Weston, M., Maguire, G., Miller, K., & Christie, B. (2011). Towards ecologically meaningful and socially acceptable buffers: Response distances of shorebirds in Victoria, Australia to human disturbance. Landscape and Urban Planning, 103 (3-4), 326-334
Abbot Point Growth Gateway Project Environmental Impact Statement Page 81 Volume 4 – Supplement Report
Section 7 References
GHD. (2008). Benthic Baseline Assessment Report: Baseline Environmental Monitoring for Port of Abbot Point. Abbot Point Multi Cargo Facility Environmental Impact Statement
GHD. (2009a). Baseline Marine Fauna Report, Port of Abbot Point Baseline Monitoring. Brisbane: North Queensland Bulk Ports Corporation
GHD. (2009b). Megafauna Assessment Report: Proposed Abbot Point Multi Cargo Facility Environmental Impact Statement. Mackay: North Queensland Bulk Ports Corporation
GHD. (2012a). Abbot Point Cumulative Impact Assessment. Technical Report Groundwater Assessment. Brisbane: Abbot Point Working Group
GHD. (2012b). Abbot Point, Terminals 0, 2 and 3 Capital Dredging Sediment Sampling and Analysis Plan Implementation Report’. Report produced on behalf of NQBP
Groom, R.A., Lawler, I.R., and Marsh, H. (2004). The Risk to Dugongs of Vessel Strike in the Southern Bay Islands Area of Moreton Bay. James Cook University – School of Tropical Environmental Studies and Geography
Great Barrier Reef Marine Park Authority (2013). Improved dredge material management for the Great Barrier Reef Region: Interpretive statement of findings and management implications of the technical reports for the Great Barrier Reef Strategic Assessment. http://www.gbrmpa.gov.au/__data/assets/pdf_file/0004/97159/Interpretive-Statement-draft-20131028web.pdf
Hammerstrom, K.K., Kenworthy, W.J., Fonseca, M.S. & Whitfield, P.E. (2006). Seed bank, biomass and productivity of Halophila decipiens a deep water seagrass on the west Florida continental shelf. Aquatic Botany, vol. 84, pp. 110-120
Hof, C., & Bell, I. (2014). Determining the spatial distribution and densities of marine turtle nesting and predator activity in the northern Great Barrier Reef, Queensland. Final Report to WWF-Australia and Threatened Species Unit, Department of Environment and Heritage Protection
Koch, E. W., Ailstock, M. S., Booth, D. M., Shafer, D. J. and Magoun, A. D. (2010). The Role of Currents and Waves in the Dispersal of Submersed Angiosperm Seeds and Seedlings. Restoration Ecology, 18: 584–595. doi: 10.1111/j.1526-100X.2010.00698
Longstaff, B.J. and Dennison, W.C. (1999). Seagrass survival during pulsed turbidity events: the effects of light deprivation on the seagrasses Halodule pinifolia and Halophila ovalis. Aquatic Botany vol. 65, pp. 105-121
Lukoschek, V., Chilvers, B.L. (2008). A robust baseline for bottlenose dolphin abundance in coastal Moreton Bay: a large carnivore living in a region of escalating anthropogenic impacts. Wildl Res 35: 593–605
Parra, G. (2006). Resource partitioning in sympatric delphinids: space use and habitat preferences of Australian snubfin and Indo-Pacific humpback dolphins. Journal of Animal Ecology, 75, 862-874
Sinclair Knight Merz and Asia-Pacific Applied Sciences Associates (2013). Improved Dredge Material Management for the Great Barrier Reef. http://www.environment.gov.au/resource/improved-dredge-material-management-great-barrier-reef-region
Abbot Point Growth Gateway Project Environmental Impact Statement Page 82 Volume 4 – Supplement Report
Section 7 References
McKenna, S.A. and Rasheed, M.A. (2014). Port of Abbot Point Long-Term Seagrass Monitoring: Annual Report 2012-2013. James Cook University Publication, Centre for Tropical Water & Aquatic Ecosystem Research, Cairns, 45 pp
McKenna, S.A., Chartrand, K.M., Jarvis, J.C., Carter A.B. and Rasheed, M.A. (2015). Port of Abbot Point - Initial light thresholds for modelling impacts to seagrass from the Abbot Point Growth Gateway Project. James Cook University Publication, Centre for Tropical Water & Aquatic Ecosystem Research, Cairns, 18 pp
McMillan, C. (1988). The seed reserve of Halophila decipiens Ostenfeld (Hydrocharitaceae) in Panama. Aquatic Botany, vol. 31, pp 177-182
Ralph, P.J., Durako, M.J., Enriquez, S., Collier, C.J. and Doblin, M.A. (2007). Impact of light limitation on seagrasses. Journal of Experimental Marine Biology Ecology, vol. 350, pp. 176-193.
Rasheed, M.A., McKenna, S.A., Carter, A.B., Coles, R.G. (2014). Contrasting recovery of shallow and deep water seagrass communities following climate associated losses in tropical north Queensland, Australia. Marine Pollution Bulletin, vol. 83, pp. 491-499.
Ruiz-Montoya L., Lowe R.J., Van Niel K.P., Kendrick G.A. (2012). The role of hydrodynamics on seed dispersal in seagrasses. Limnology and Oceanography. 57, doi: 10.4319/lo.2012.57.5.1257.
Unsworth, R.K.F., McKenna, S.A. and Rasheed, M.A. (2010). Seasonal dynamics, productivity and resilience of seagrass at the Port of Abbot Point: 2008-2010. DEEDI Publication, Fisheries Queensland, Cairns, pp. 68
Wilkinson, S.N., Bartley, R., Hairsine, P.B., Bui, E.N., Gregory, L. and Henderson, A.E. (2015). Managing gully erosion as an efficient approach to improving water quality in the Great Barrier Reef Lagoon. CSIRO report to the Australian Government
York, P.H., Carter A.B., Chartrand K., Sankey T., Wells L. and Rasheed M.A. (2015). Dynamics of a deep-water seagrass population on the Great Barrier Reef: annual occurrence and response to a major dredging program. Sci. Rep. 5, 13167; doi: 10.1038/srep13167 (2015)
Abbot Point Growth Gateway Project Environmental Impact Statement Page 83 Volume 4 – Supplement Report