a thermal initiation correction to shepp's rotating sector theory
TRANSCRIPT
INTERNATIONAL JOURNAL OF CHEMICAL KINETICS, VOL. v, 487-493 (1973)
A Thermal Initiation Correction to Shepp’s Rotating Sector Theory
N. L. ARTHUR, K. F. DONCHI, AND C. DE MARTINIS Department of Physical Chemistry, L a Trobe Uniuersily, Bundoora, Victoria, 3083, Australia
Abstract
Shepp’s rotating sector theory for determining radical recombination rate constants, kb, has been modified to take account of radical production by a concurrent thermal re- action. A theoretical sector curve expression has been derived which gives the average radical concentration under intermittent illumination as a function of a, the ratio of first- to second-order radical removal rates, n, the ratio of thermal initiation to photoinitiation, and p, the ratio of the flash time to the half time ofsecond-order radical removal. Analysis of the sector curves generated by the modified theory shows that n has a greater effect on kb than a and that the rotating sector method should be applied only to those photo- chemical systems in which termination by first-order processes is less than 34% fa = 0.52) and thermal initiation is less than 2% (n = 0.02).
1. Introduction
The rotating sector technique has been used extensively to determine absolute rates of recombination of radicals. Contributions to the original theory of the method and corrections applied to it have been collated by Burnett and Melville [ 11. More recently, a general sector theory, applicable to simple photochemical decompositions involving both first- and second-order removal of radicals, has been developed by Shepp [2]. None of the corrections applied to the earlier theory has been worked out for Shepp’s theory, and it is the purpose of this paper to present a modification that allows for a concurrent thermal reaction.
2. Theory
Consider the general mechanism
K - m M + X
2M 3 Pt,,
M + At - Pji
M + B, + P,, + M
where K is the photolyzed molecule, X is a molecule formed in the initiation reaction, m is an integer, M is a radical formed both photochemically and ther-
487
@ 1973 by John Wiley & Sons, Inc.
488 ARTHUR, DONCHI, AND DE MARTINIS
mally, and P b t , Pfi, and P, , are products formed in second-order, first-order, and chain steps, respectively. If the ratio of thermal initiation to photoinitiation is n and the rate of initiation is constant, the rate of formation of M is
( 1 ) dM/dt = 2(1 + n)@ - 2kbM2 - k,M
where
( 2 ) kb = xkbt, k, = Zk,,A, and Q, = $rn+f,
Under the steady-state condition of constant illumination, denoted by the subscript c, eq. (1) becomes
(3)
The dimensionless parameter a, is defined as
*c = (kbMc2 + $k,Mc)/(l f n)
Z (first-order disappearance rates of M ) Z (second-order disappearance rates of M )
a , = (4)
= kj/2kbMc
k, can be eliminated from eqs. (3) and (4) to give
(5)
a , is assumed to be zero in simple sector theory. Suppose intermittent illumination is produced by a rotating sector of flash
time tl and dark-to-light ratio p . In Shepp’s notation, subscripts 1 and d refer to behavior in light and dark periods, respectively. Thus, ML is the hypothetical value M would have reached had the run not been sectored; because of light in- tensity fluctuations from run to run, it is assumed that M Z is not equal to M,. With M 2 in place of M,, and writing a for a 1 , eqs. (4) and (5) become
@, = kbMc2 ( 1 + f fc) / ( l f n)
(6) 01 = k,/2k bM 1
(7) * i = kbML2 (1 + a)/(1 + n> The dimensionless parameter p, defined as the ratio of t l to the half-time of second- order removal of radicals, is given by
(8 ) p = 2kgMzti
which, with eq. (7), gives
(9) p = 2[kb ( 1 f n ) / ( l + a)]1” t ~ * l ’ / ~
In a sectored photolysis, the variation of M(t), the radical concentration at time t , assumes a constant pattern after a few rotations of the sector, the maximum value of M ( t ) being represented by MI and the minimum value by Mo. M l ( t ) , the value of M ( t ) in the light period from eqs. ( l ) , (6), and (7), is given by
(10) dMl(t)/[2kb?d12(t) + 2 a k b M & ’ f l ( t ) - 2kaM12(1 + a ) ] = -dt
SHEPP’S ROTATING SECTOR THEORY
which integrates [3] to
489
where Cz is the constant of integration.
and (‘7), is given by
(12) dMd(t)/[2kbMd2(t)
Similarly, Md(t), the value of M(t) in the dark period, from eqs. (I), (6),
2akbMzMd(t) - 2nk&lz2(1 + a)/(l + n)] = -dt
which integrates [3] to
where Cd is the constant of integration and s is given by
(14) s = [a2 + 4n(l + a)/(1 + n ) ] ” z
Cz is eliminated by evaluating eq. (11) at the beginning (t = it1 ( p + l), Ml(t) = M z ) and end (t = tl [i(p + 1) + 11, Ml(t) = Mi) of the (z’ + 1)th light period:
Similarly, Cd is eliminated by evaluating eq. (13) at the beginning (t = tl[z + p ( i - l)]? Md(t) = Mi) and end ( t = &(p + l ) , Md(t) = Mz) of the zth dark period:
Equations (15) and (16) can be solved for M1/Mz and Mz/Mz:
(17) Mi/MZ = [--B + (B2 - 4AC)”’]/2A
where
A = 2(a - 1) (v - bu) + 4c[a(l,+ a) + 11
B = 2(1 + u + a) (bu - V ) + 2[a(l + a) + 11 (bv - U) - C(U - 1) [4(1 + a) + uvl
c = 2(1 + (.)(a - l)(u - bv) + cuv(1 + a + a)
a = expP(2 + a) b = exp (PP5)
(19)
c = b - l
u = a - - S
v = a + s
490 ARTHUR, DONCHI, AND DE MARTINIS
Rz, the average concentration of M during the light period, is given by
(20) M I = l / t l / z l Ml(t)dt
which, with eq. (lo), becomes
The solution of this equation is [3]
Similarly, g d , the average concentration of M during the dark period, is given by
(23) = l/ptl/M~* M&dt
which, with eq. (12), becomes
The solution of this equation is [ 3 ]
(25) Rd/Mz =
(M1/MJ2 + aMl/Mz - n(1 + &)/(I + n)
The average concentration of M during a sectored photolysis is given by
(26) R = (RZ + p m w p + 1)
Substitution from eqs. (22) and (25) yields
1 M J 2 + aMi/Mz - 4 1 + a)/(l + n)ll n)
The theoretical sector curve giving m/MI as a function of @ is therefore de- fined by eqs. (14), (17), (18), (19), and (27). A particular sector curve is charac- terized by values of p , a, and n.
M/Mz approaches limiting values as p --f a, corresponding to the limit of slow sector speed (tl -+ a), and as /3 + 0, corresponding to the limit of fast sector speed(tl-+O). Asp-+ m,mz/Mz--+M&fz--t l ,Md/Mi+Mz/Mz--+(s - a)/ 2, and therefore from eq. (26), B/Mz-+ [2 - p(a - s ) ] / 2 ( p + l), where s is defined by eq. (14).
( M ~ / M z ) ~ + aMdM2 - 4 1 + a)/(l + - (1/2P) In [(M,
SHEPP’S ROTATING SECTOR THEORY 49 1
As /3 3 0, a --+ 1 + p(2 + a), b -+ 1 + pps, and c +p/3s, and from eqs. (17) and (19),
M ~ / M ~ - - a / z + (a2/4 + ~ ( 1 + a) - p(a2 - s2)1/4 (p + 1 ) y
This expression is also equal to the limiting value of M/Ml since at the limit of fast sector speed, MI/Mz = M2/Mz = M/Mz.
3. Results and Discussion
Assuming constant intensity of illumination from run to run, m/Ml for a = 0, of this (and Shepp’s) theory can be equated with Ro/R, of the theory described by Burnett and Melville. And for a simple mechanism involving a single second-order termination step, /3 of this theory is equivalent to m of the earlier theory. The validity of the theoretical sector curve expression presented here can therefore be established by comparing the curves generated by it with those calculated from simple sector theory (a = 0, n = 0), simple sector-theory with a constant dark rate correction (a = 0, n = any value), and Shepp’s sector theory (a = any value, n = 0). In every case, the sector curve given by this theory was found to be identical with that of the earlier theory.
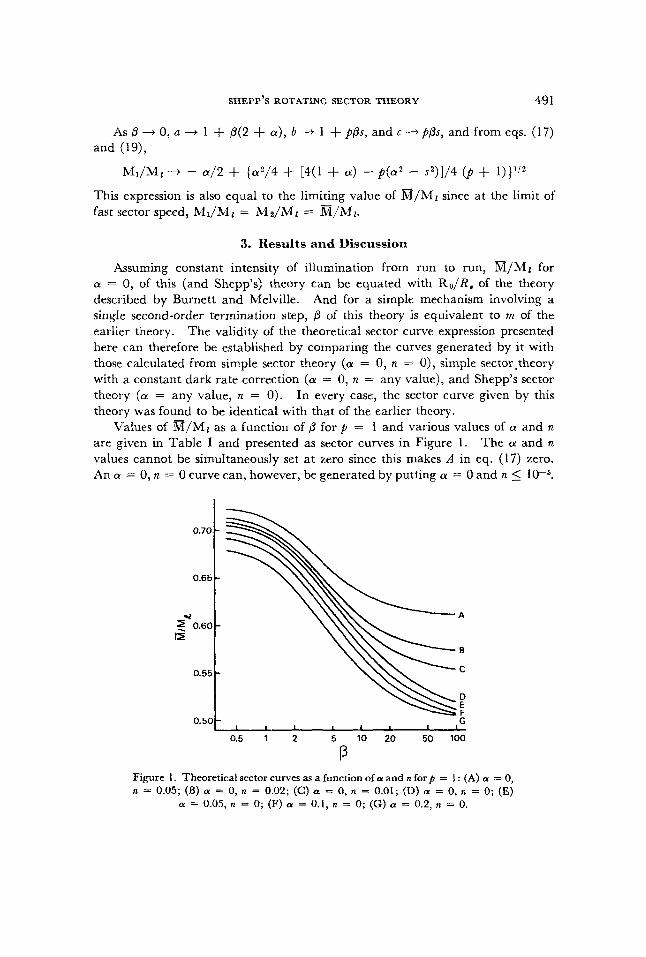
Values of M/Mz as a function of p for p = 1 and various values of a and n are given in Table I and presented as sector curves in Figure 1. The a and n values cannot be simultaneously set at zero since this makes A in eq. (17) zero. An a = 0, n = 0 curve can, however, be generated by putting a = 0 and n 5
0.70 I -2 0.60
I I 0.551
0.50 G I I I I 1 I
0.5 1 2 5 10 20 50 100
P Figure 1 . Theoretical sector curves as a function of a and R forp = 1 : (A) a = 0, R = 0.05; (B) a = 0, n = 0.02; (C) a = 0, R = 0.01; (D) a = 0, R = 0; (E)
a = 0.05, R = 0; (F) a = 0.1, R = 0; (G) a = 0.2, R = 0.
492 ARTHUR, DONCHI, AND DE MARTINIS
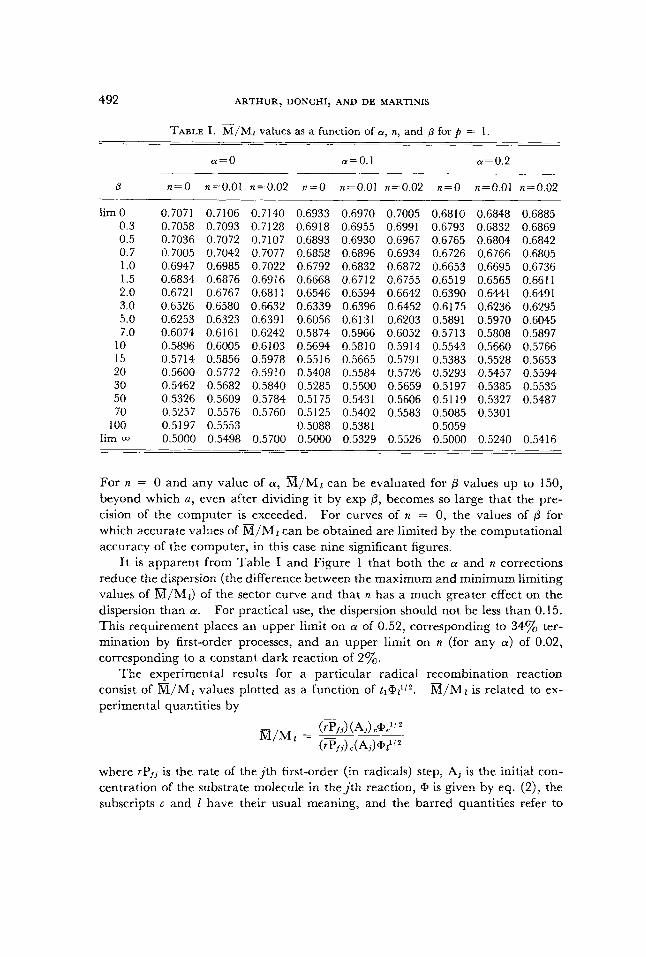
TABLE I. M/Mi values as a function of a, n, and 6 for p = 1.
a = O a=0.1 a = 0.2
B n=O n=0.01 n=0.02 n=O n=0.01 n=0.02 n=O n=0.01 n=0.02
lim 0 0.7071 0.7106 0.7140 0.6933 0.6970 0.7005 0.6810 0.6848 0.6885 0.3 0.7058 0.7093 0.7128 0.6918 0.6955 0.6991 0.6793 0.6832 0.6869 0.5 0.7036 0.7072 0.7107 0.6893 0.6930 0.6967 0.6765 0.6804 0.6842 0.7 0.7005 0.7042 0.7077 0.6858 0.6896 0.6934 0.6726 0.6766 0.6805 1.0 0.6947 0.6985 0.7022 0.6792 0.6832 0.6872 0.6653 0.6695 0.6736 1.5 0.6834 0.6876 0.6916 0.6668 0.6712 0.6755 0.6519 0.6565 0.6611 2.0 0.6721 0.6767 0.6811 0.6546 0.6594 0.6642 0.6390 0.6441 0.6491 3.0 0.6526 0.6580 0.6632 0.6339 0.6396 0.6452 0.6175 0.6236 0.6295 5.0 0.6253 0.6323 0.6391 0.6056 0.6131 0.6203 0.5891 0.5970 0.6045 7.0 0.6074 0.6161 0.6242 0.5874 0.5966 0.6052 0.5713 0.5808 0.5897
10 0.5896 0.6005 0.6103 0.5694 0.5810 0.5914 0.5543 0.5660 0.5766 15 0.5714 0.5856 0.5978 0.5516 0.5665 0.5791 0.5383 0.5528 0.5653 20 0.5600 0.5772 0.5910 0.5408 0.5584 0.5726 0.5293 0.5457 0.5594 30 0.5462 0.5682 0.5840 0.5285 0.5500 0.5659 0.5197 0.5385 0.5535 50 0.5326 0.5609 0.5784 0.5175 0.5431 0.5606 0.5119 0.5327 0.5487 70 0.5257 0.5576 0.5760 0.5125 0.5402 0.5583 0.5085 0.5301
100 0.5197 0.5553 0.5088 0.5381 0.5059 lim 0.5000 0.5498 0.5700 0.5000 0.5329 0.5526 0.5000 0.5240 0.5416
For n = 0 and any value of a, m/Ml can be evaluated for p values up to 150, beyond which a, even after dividing it by exp 8, becomes so large that the pre- cision of the computer is exceeded. For curves of n = 0, the values of p for which accurate values of ~ / M Z can be obtained are limited by the computational accuracy of the computer, in this case nine significant figures.
I t is apparent from Table I and Figure 1 that both the a and n corrections reduce the dispersion (the difference between the maximum and minimum limiting values of M/Mz) of the sector curve and that n has a much greater effect on the dispersion than a. For practical use, the dispersion should not be less than 0.15. This requirement places an upper limit on a of 0.52, corresponding to 34% ter- mination by first-order processes, and an upper limit on n (for any a) of 0.02, corresponding to a constant dark reaction of 2%.
The experimental results for a particular radical recombination reaction consist of m/Ml values plotted as a function of t l@i’z . R/Mz is related to ex- perimental quantities by
where rP,, is the rate of thejth first-order (in radicals) step, A, is the initial con- centration of the substrate molecule in the j t h reaction, @ is given by eq. (2), the subscripts c and 1 have their usual meaning, and the barred quantities refer to
SHEPP’S ROTATING SECTOR THEORY 493
average values during a sectored photolysis. rate of the initiation step in a sectored run, by
@ l is related to (Ia), the average
The experimental sector curve is fitted to a theoretical curve defined by ap- propriate values of a and n (obtained from unsectored experiments), giving a value of fl corresponding to a value of t ~ @ t / ~ . The recombination rate constant k b is then evaluated from eq. (9)
Since a and n (and therefore the theoretical sector curve) may vary over the period in which data are being collected, a better procedure is to evaluate the rate constant for each experimental point by computing a value of p from the appropriate theoretical curve. Which- ever procedure is used to evaluate rotating sector results, meaningful k b values can only be obtained from experimental a / M z points which correspond to the central portion of the sigmoid theoretical curve.
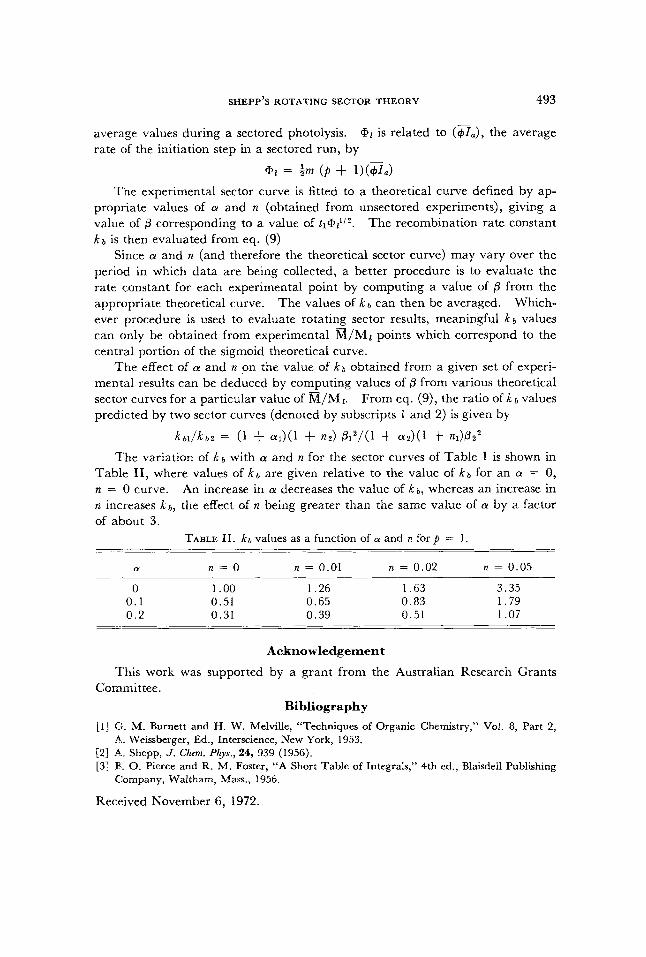
The effect of LY and n on the value of k b obtained from a given set of experi- mental results can be deduced by computing values of fl from various theoretical sector curves for a particular value of M/ML. From eq. (g), the ratio of k b values predicted by two sector curves (denoted by subscripts 1 and 2) is given by
The values of k b can then be averaged.
The variation of kg with a and n for the sector curves of Table I is shown in Table 11, where values of k b are given relative to the value of k b for an a = 0, n = 0 curve. An increase in a decreases the value of k b , whereas an increase in n increases k b , the effect of n being greater than the same value of a by a factor of about 3.
TABLE 11. k g values as a function of a and n for p = 1.
a n = O n = 0.01 n = 0.02 n = 0.05
0 1 .oo 1.26 1.63 3.35 0.1 0.51 0.65 0.83 I .79 0.2 0.31 0.39 0.51 1.07
Acknowledgement
This work was supported by a grant from the Australian Research Grants Committee.
Bibliography [ I ] C;. M. Burnett and H. W. Melville, “Techniques of Organic Chemistry,” Vol. 8, Part 2,
121 A. Shepp, J. Chem. Phys., 24, 939 (1956). [3] 8. 0. Pierce and R. M. Foster, “A Short Table of Integrals,” 4th ed., Blaisdell Publishing
A. Weissberger, Ed., Interscience, New York, 1953.
Company, Waltham, Mass., 1956.
Received November 6 , 1972.