a survey of driving research simulators around the...
TRANSCRIPT
This is a repository copy of A Survey of Driving Research Simulators Around the World..
White Rose Research Online URL for this paper:http://eprints.whiterose.ac.uk/2110/
Monograph:Blana, E. (1996) A Survey of Driving Research Simulators Around the World. Working Paper. Institute of Transport Studies, University of Leeds , Leeds, UK.
Working Paper 481
[email protected]://eprints.whiterose.ac.uk/
Reuse Unless indicated otherwise, fulltext items are protected by copyright with all rights reserved. The copyright exception in section 29 of the Copyright, Designs and Patents Act 1988 allows the making of a single copy solely for the purpose of non-commercial research or private study within the limits of fair dealing. The publisher or other rights-holder may allow further reproduction and re-use of this version - refer to the White Rose Research Online record for this item. Where records identify the publisher as the copyright holder, users can verify any specific terms of use on the publisher’s website.
Takedown If you consider content in White Rose Research Online to be in breach of UK law, please notify us by emailing [email protected] including the URL of the record and the reason for the withdrawal request.
White Rose Research Online
http://eprints.whiterose.ac.uk/
Institute of Transport StudiesUniversity of Leeds
This is an ITS Working Paper produced and published by the University of Leeds. ITS Working Papers are intended to provide information and encourage discussion on a topic in advance of formal publication. They represent only the views of the authors, and do not necessarily reflect the views or approval of the sponsors. White Rose Repository URL for this paper: http://eprints.whiterose.ac.uk/2110
Published paper Blana, E. (1996) A Survey of Driving Research Simulators Around the World. Institute of Transport Studies, University of Leeds, Working Paper 481
White Rose Consortium ePrints Repository [email protected]

UNIVERSITY OF LEEDS Institute for Transport Studies
ITS Working Paper 481
December 1996
ISSN 0142-8942
A SURVEY OF DRIVING RESEARCH SIMULATORS AROUND THE WORLD
E. BLANA
ITS Working Papers are intended to provide infonnation and encourage discussion on a topic in advance of fonnal publication. They represent only the views of the authors, and do not necessarily reflect the views or approval of the sponsors.
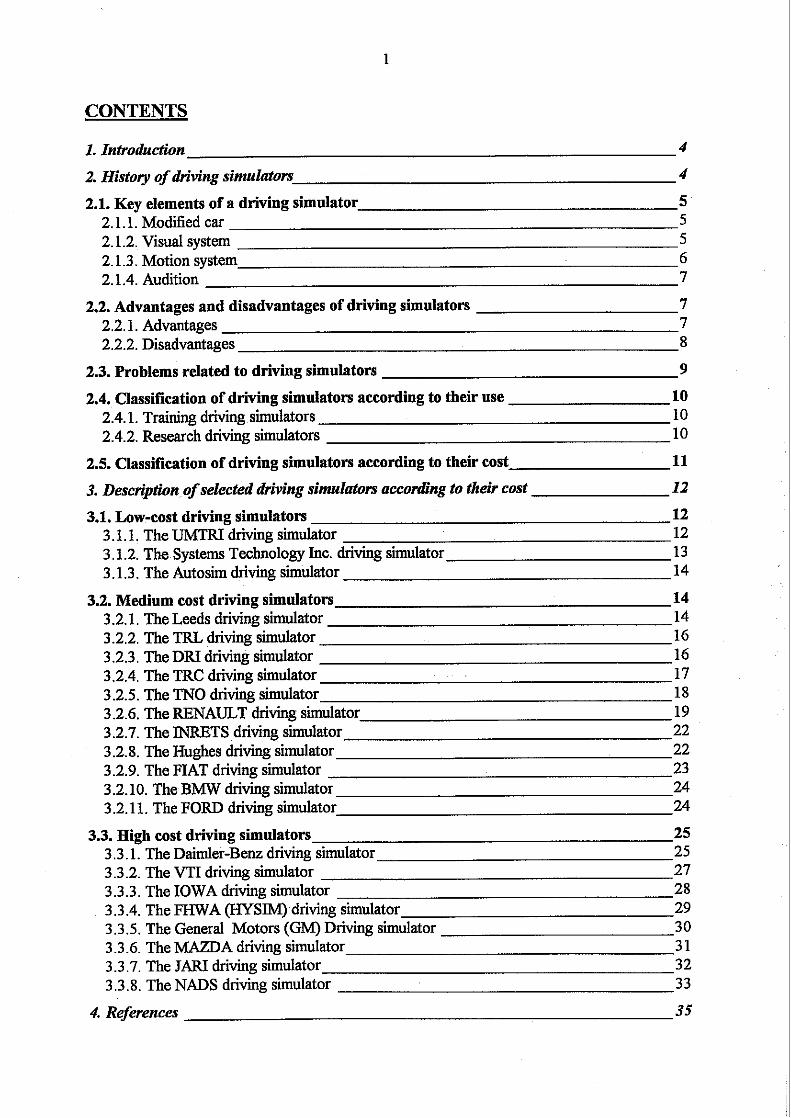
CONTENTS
1. Introduction 4
2. History of driving simulators 4
2.1. Key elements of a driving simulator 5 2.1.1. Modified car 5 2.1.2 Visual system 5 2.1.3. Motion system 6 2.1.4. Audition 7
2.2. Advantages and disadvantages of driving simulators 7 2.2.1. Advantages 7 2.2.2. Disadvantages 8
2.3. Problems related to driving simulators 9
2.4. Classification of driving simulators according to their use 10 2.4.1. Training driving simulators 10 2.4.2. Research driving simulators 10
2.5. Classification of driving simulators according to their cost 11
3. Description of selected driving simrclatom according to their cost 12
3.1. Low-cost driving simulators 12 3.1.1. The UMTRT driving simulator 12 3.1 2. The Systems Technology Inc. driving simulator 13 3.1.3. The Autosim driving simulator 14
3.2. Medium cost driving simulators 14 3.2.1. The Leeds driving s ida to r 14 3.2.2 The TRL driving simulator 16 3.2.3. The DRI driving s i i a t o r 16 3.2.4. The TRC driving simulator 17 3.2.5. The TNO driving simulator 18 3.2.6. The RENAULT driving simulator 19 3.2.7. The INRETS driving simulator 22 3.2.8. The Hughes driving simulator 22 3.2.9. The FIAT driving simulator 23 3.2.10. The BMW driving simulator 24 3.2.11. The FORD driving s ida to r 24
3.3. High cost driving simulators 25 3.3.1. The Daimler-Benz driving simulator 25 3.3.2. The VTI driving simulator 27 3.3.3 The IOWA driving simulator 28 3.3.4. The FHWA (HYSIM) driving simulator 29 3 3.5. The General Motors (GM) Driving simulator 30 3.3.6. The MAZDA driving simulator 3 1 3.3 7. The JAR1 driving simulator 32 3.3.8. The NADS driving simulator 33
4. References 35

5. Appendices 44
5.1. APPENDIX A: Comparative Table of the described simulators 45
5.2. APPENDIX B: Useful addresses 62
5.3. APPENDIX C: Photos 64
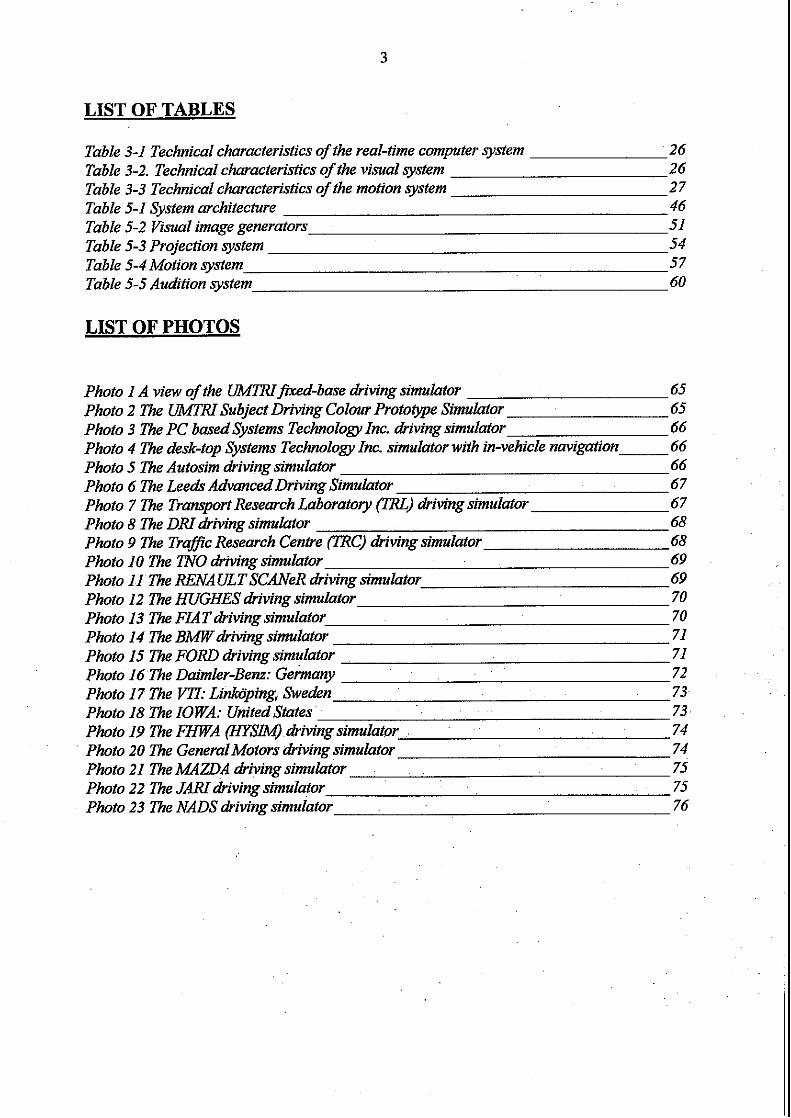
LIST OF TABLES
Table 3-1 Technical characteristics of the real-time computer system 26 Table 3-2. Technical characteristics of the visual system 26 Table 3-3 Technical characteristics of the motion system 27 Table 5-1 System architecture 46 Table 5-2 Visual image generators 51 Table 5-3 Projection system 54 Table 5-4 Motion system 57 Table 5-5 Audition system 60
LIST OF PHOTOS
Photo I A view of the MIJ i xed -base driving simulator 65 Photo 2 The W T R I Subject Driving Colour Prototype Simulator 65 Photo 3 The PC bmed Systems Technology Inc. driving simulator 66 Photo 4 The desk-top Systems Technology Znc. simulator with in-vehicle navigation 66 Photo 5 The Autosim driving simulator 66 Photo 6 The Lee& Advanced Driving Simulator 67 Photo 7 The Transport Research Laboratory (TRL) driving szmulator 67 Photo 8 The DRI driving simulator 68 Photo 9 fie Traffic Research Centre (1IRC) driving simulator 68 Photo 10 The TNO driving simulator 69 Photo 11 The RENAULT S W R driving simulator 69 Photo I2 The HUGHES driving simulator 70 Photo 13 The FIAT driving simulator 70 Photo 14 The BMWdriving simulator 71 Photo 15 The FORD driving simulator 71 Photo 16 The Daimler-Benz: Germany 72 Photo 17 The W: Linkiiping, Sweden 73 Photo 18 The I 0 WA: United States 73 Photo 19 The FHWA (HYSIM) driving simulator 74 Photo 20 The General Motors driving simulator 74 Photo 21 The MAZDA driving simulator 75 Photo 22 The JAR1 driving simulator 75 Photo 23 The NADS driving simulator 76
1. Introduction
The literature review is part of the EPSRC knded project '?)river performance in the EPSRC driving simulator: a validation study". The aim of the project is to validate this simulator, located at the Department of Psychology, University of Leeds, and thereby to indicate the strengths and weaknesses of the existing configuration. It will provide guidance on how the simulator can be modified and overcome any deficiencies that are detected and also provide "benchmarks" against which other simulators can be compared. The literature review will describe the technical characteristics of the most well-known driving simulators around the world, their special features and their application areas until today. The simulators will be described and compared according to their cost (low, medium and high) and also contact addresses and photographs of the simulators will be provided by the end of the paper.
In the process of gathering this information, it became apparent that there are mainly two types of papers published - either in journals or in proceedings from conferences: those describing only the technical characteristics of a specific simulator and those referring only to the applications of a specific simulator. For the first type of papers, the level of detail, format and content varies significantly where for the second one it has been proven extremely difficult to find any information about the technical characteristics of the simulator where the study had been carried out. A number of details provided in this paper are part of personal communication, or personal visits to those particular driving simulator centres or from the World Wide Web. It should also be noted here that most of the researchers contacted here offered very detail technical characteristics and application areas of their driving simulators and the author is grateful to them.
2. History of driving simulators
The history of simulators starts before the Second World War. The first simulators appeared were flight simulators and were used for training purposes. The primary thought was that they will reduce operational costs over the use of the actual equipment. Two main approaches were used in the design of flight train simulators: a design of a s ida to r with high fidelity (i.e. the more a training device is like the criterion device the better will be) or a design of a simulator that is "as phony as it can be" without compromisiing training effectiveness (Roscoe, 1980). From early years (Thorndike, 1903) until recently (Logan, 1988) a number of theories were developed about the transferability of the skills learned in the simulator to the actual life but none of them has been proved to be the best.
Highway research simulators were developed in the late 1950's and the first actual highway simulator was operated in the early 1960's (Roberts, 1980). There was a decline in the highway simulator activity in the mid 60's due to insufficient state of the art in visual displays and computer technology but was overcomed in the late 60's. Much of the technology was developed by the National Aeronautics and Space Administration (NASA) to support its space program. These improvements renewed interest in highway simulation techniques; by 1975 several "driving" simulators were operating through the United States (at least 16 using different techniques for the generation of the visual field). By that time only two driving
simulators were operated in Europe (one from SAAB and one form V W using electronically generated imagery) (Roberts, 1980). The last decade there has been a strong increase in the use of driving simulators for both training and research purposes in the field of driving behaviour in a traffic situation. The main reason was the development of very powerfid computer systems at a reduced cost. It was also the need to improve our understanding of driver behaviour and therefore improve traflic safety but under controlled experimental conditions specified by the researcher. In the past, such controlled environments have often been unrealistic and their relationship to real-world driving conditions rather tenuous. The driving simulators combine the advantage of 111 control for the experimenter with a high degree of realism as regard to the driving environment. This means that result obtained are much more likely to be relevant to and transferable to the real world.
2.1. Key elements of a driving simulator
2.1.1. Modified car
An actual vehicle has been modified most of the times and the motor, drivetrain and running gear have been removed. Part of the car (e.g. rear or front) can be removed too (e.g. TNO, VTI, MAZDA driving simulators). The brake, accelerator pedal, gear selector and other controls need to have feel characteristics consistent with task requirements. Secondary vehicle controls such as radio, climate control, turn signal etc. are only instrumented if the studies requires them. The interior compartment and driver workspace should be relatively complete, with details depending on the task. The steering wheel should have a feel system (or control loader) to simulate the kinaesthetic and force displacement properties of the subject vehicle (a torque motor can be connected in-time with the steering wheel). At the minimum the speedometer should be driven by the vehicle dynamics model.
2.1.2. Visual system
The visual system advanced from cathode-ray tubes, to point-light source and film techniques to computer graphics imagery (CGI) systems. The first visual field generation for driving simulators was used by Southern California Research Institute (Allen et al, 1979).Wierwille and Fung (1975) compared different types of "simulated motion picture display systems" W D S ) with computer-generated image display. Typically, such systems lack lateral translation information. For MF'DS recording film taken on a roadway is projected for the simulator driver. They found that for some simple applications a properly instrumented and pre-programmed MPDS will yield similar results. Obviously, complex manoeuvring and interaction with other traffic cannot be taken into account when using MF'DS systems.
At present the visual system (CGI) consists mainly of the graphicstanimation model and the projection system. The requirements for image generation for driving simulators should be high, since driving strategy is nearly based on visual information. Most of the information used by automobile driver is coming from a close field of view and concerns sharp details (signs, lights and for objects) (Olson, 1993).
According to Kemeny and Reymond (1994) the most critical issues for the computer generated image system is the time rendering, the anti-aliasing and the delay in the displaying system. They suggested that a resolution of about 1000x1000 pixels per channel, allows to
render correctly traffic and road network details. Image anti-aliasing can be used to avoid flickering of far objects when their apparent size approaches pixel definition. Texture mapped polygons can be used as depth reference to describe object details, but their intensive use may result in false visual cues and simulation sickness.
Delay (or dead time) in the displaying system can be caused by the computation of the vehicle dynamics model and the time needed by the CGI system to calculate the image corresponding to a given location. The effect of the total delay to the driver is, that a certain action, e.g. turning the steering wheel, is not followed by the corresponding change in the presented image in the same manner as in a real car. This may lead to simulator sickness. Hogema (1992) studied the effectiveness of a compensation technique as a measure to counterbalance delay. The results showed that the technique reduced the effect of delay to an insignificant level. Allen and Jex (1980) proposed 40-50 ms as the upper limit to avoid noticeable delays in a driving simulator, Drosdol and Panik (1985) claimed that a 80 ms delay is not disturbing as far as the simulation is concerned, Ashkenas (1986) suggested 50-100 ms as typical values for simulator systems, where Haug et al(1990) stated that 50 ms or more will reduce the driver- vehicle performance.
Problems related to the projection system is the soft-blending (or not) of the different projection screens and the illumination of the screen One of the principal shortcomings of projection based visual systems is that they are dim. Although state of the art projectors may specify light output as 1000 lumens, whole scene illumination for a typical computer generated image may yield closer to 300 lumens (Greenberg and Park, 1994). This limited light output must them be spread over the entire image-area defined by the focal plane. Since illumination falls off with the square of distance from the eyepoint, placement of the focal plane becomes a compromise between providing for natural eye accommodation, and providing a "brighter" image. Eye accommodation requirements force the focal plane to be between 12"-14" from the eyepoint, while image brightness requirements force the focal plane closer to the eyepoint. Absolute light levels in the simulator are low, optical resolution is well below the human detection threshold, and the image focal plane is at a fixed distance. These limitations are signscant in constraining the experimental design. The signs must be simplied or adjusted in size for readability and recognition distance. Depth perception are also affected. Special lighting may be required to meet in-vehicle legibility requirements.
2.1.3. Motion system
The effects of motion cues on driver performance are not exactly know yet. Most early research on effects of motion cues has been performed with flight simulators. Generally in flight simulation favourable results were found with moving bases, which encouraged driving simulator users to investigate whether their systems would benefit from the presence of a moving base (Stapleford, 1968). Brown (1975) also showed that the simulator became much more realistic with the addition of a physical vibration that was absolutely uncorrelated with vibrations observable in the visual display. On the other hand, there have been questions concerning the efficacy of motion cues in military simulators (Semple, 1981), and high fidelity simulators seem to induce simulator sickness (Casali & Frank, 1986; Casali & Wienville, 1986).
The motion system is usually ruled in or out depending on a cost-benefit point of view for the research topics of primary interest and can be classified either as high cost or low cost. High
cost motion systems consist of a dome (where the car cab is situated, either the whole car or part of it) which is mounted on hydraulic actuators and have six to three degrees of freedom (e.g. Daimler-Benz and Iowa driving simulators, respectively). Low cost motion systems consist of a platform (hydraulic rams or pneumatic are fitted into the four wheels of the car cab) and usually simulate roll, pitch and heave (e.g. TRL, Autosim driving simulators). The response time in each direction should not exceed 20-40 ms to avoid overall transport delay. According to Kemeny and Reymond (1994), low cost motion rendering should take into account real truck motion measures, human perception of movements and performance/cost constraints . Roll motion should not be over 3 degrees per second in the case that only the cabin is tilting to avoid interference between human perception of lateral acceleration and roll (Nordmark, 1 992).
McLane and Wierwille (1975) compared the effects on driving performance of different combinations of visual and motion cues in a moving-base CGI driving simulator. Results showed that performance improved with the number of motion cues: subjects were better able to control the virtual vehicle with an increasing number of motion cues. S i a r results obtained ffom Alm (1995) when he compared the behavioural validity of the VTI driving simulator with the motion system on and off. e showed that when the moving system was on, drivers behaved more realistically (especially driving on curves) and helped them to keep a steady course on the road. On the other hand, there is some indication that active steering control torque cueing can partially compensate for the lack of motion cues in a fixed-base driving simulator (Men & Rosenthai, 1994).
Casali and Wierwille (1980) compared dierent types of moving bases. They assessed effects of modes to simulate lateral acceleration, delay in the visual and motion systems and an open versus closed simulator platform on moving-base driving simulator discomfort. Their results indicated that simulator designs should not rotate the platform to simulate lateral translation, whereas delay of any kind as well as complete enclosure of subjects should be avoided.
2.1.4. Audition
McLane and Wierwille (1975) investigated the effects of the presence of speed-related sound. No statistically significant effects of the presence of audio cues were found, but they suggested that an advantage of sound information might be that irrelevant noises generated by the simulator system are masked. In a more recent experimental evaluation of sound in simulated driving (Davis and Green, 1995) it was found that the provision of sound may lead to small ("marginally significant") improvement in driving performance. There were no differences in ratings of realism of the simulation between sound conditions and there were several situations where driver performance was worse when all sounds were present as opposed to when only speed-related sound were provided.
2.2. Advantages and disadvantages of driving simuIators
2.2.1. Advantages
Versatility and New Developments at reduced cost
The main advantage of research simulators is their versatility. They can be easily and economically configured to simulate a variety of human factors research problems. They allow evaluation and optimisation of human performance withiin system constraints and indicate problem areas in system design and functioning. They are particularly useful in selecting a viable system approach from numerous alternatives and evaluating system performance before field testing. Different simulation scenarios can be created to match the requirements of the particular experiment. Environmental effects such as foggy roads, snowy or slippery roads or night-time driving conditions can be created. Vehicle characteristics can be altered quickly - steering ratios, spring rates, damping factors, driven wheels. New roadways, IVHS infrastructure can be created in the simulator where the test situation is difficult to create on the road. They can often represent the most cost-effective approach in a given application. Complete instrumentation and recording systems for in-vehicle tests can be expensive to set up and maintain. Contriving typical traffic situations, including interactive vehicles and signal controls, on special driving courses can also be costly. On the other hand, it is often less expensive to set up and operate simulations in a controlled laboratory environment than it is to conduct field tests that are designed to achieve given experimental objectives. In particular, stimuli and events external to the driver's vehicle are substantially cheaper to implement, control and vary in a simulator that they are on a test track.
Experimental control andMeasurement Simulators make it possible to control experimental conditions over a wider range that field tests and can be easily changed from one condition to another. This capability can be important in terms of experimental design characteristics, such as allowing back-to-back comparisons of disparate experimental conditions. Every driver can drive the exactly same testing situation where systematic variation in road, vehicle or traffic situations conditions is difficult to achieve in the real world. Criterion variables can easily be made available in a driving simulator. Performance measures can be easily mechanised. Digital computer systems can further provide on-line data processing, formatting and storage and the reduction and compact arrangement of data.
Safty Simulators provide an inherently safe environment for driving research. There is no endangerment to the driver or other road users under critical driving conditions or when testing innovative in-vehicle devices. They can be used where approval for an on-road experiment is unlikely to be forthcoming from the relevant authorities without some prior evidence on behaviowal and safety issues.
2.2.2. Disadvantages
Validity The major disadvantage of research simulators is the real world will never be replicated in all its complexity. There will always be the issue of validity, i.e. of to what extent behaviour in a simulator corresponds to that in the real life.
Cost Driving simulators have a high initial acquisition cost. In addition, operating and maintenance costs are slightly higher than for training simulators because research simulators are more complex.
Simularor sickness Simulator sickness can vary widely among individuals who experience it and among simulators that induce it. Effects may range from mild disorientation and queasiness to severe ataxia and 11I emesis. The most critical variables are the visual horizontal field-of-view and the level of moving scene detail. The potential simulator design etiological factors summarised by Casali and Wierwille (1986) can be: (a) Control loop lags and delays. Inappropriate control-feedback lags are known to degrade controllability and stability of vehicular systems, as demonstrated by Casali and Wierwille (1980) and may introduce symptoms of sickness (Casali and Wierwille, 1980; Puig, 1984); (b) Dynamic characteristics like proper modelling of the full- scale vehicle in the simulator's computational systems and accurate correspondence between the simulator's dynamics and those of the actual vehicle (both for low-speed manoeuvres and more complex high-speed kinematics); (c) Control load factors like damping; (d) Motion system factors. Barrett and Thornton (1968) suggested that fixed-base simulators are likely to induce sickness because a cue conflict arises when the operator visually senses the appearance of incident vehicular motion but never receives corresponding physical acceleration or positional cues. On the other hand, Sinacori, (1967) stated that the addition (and proper tuning) of motion cueing systems to some simulators has greatly reduced the sickness problem; (e) Visual system factors such as the display type, the field-of-view and scene detail, the display rate and the display distortions and (0 Cockpit environment factors such as temperature regulation and humidity control when the simulator cab is enclosed.
2.3. Problems related to driving simulators
Although very powerful computer and graphics systems have been developed lately, the simulation of the real world conditions continues to be problematic. Although problems can be related both to vehicle dynamics and operation simulation, only the last category will be referred here.
Longitudinal and lateral control of the driving simulator
It has been generally observed that driving speed is higher in the driving simulator than on the real road. Riemersma (1990) and Harms (1993) using moving base driving simulators observed higher speeds on both straight and curved sections of urban and rural roads on the simulator compared to real road where Tenkink (1989(a),(b); 1990) and van der Horst (1990) observed unrealistic speeds on sharp bends on the TNO fixed-base driving simulator. In some experiments (Blaauw, 1982; Harms, 1993; Kaptein et al, 1995(a)) it has been observed that the distance to the centre l i e was generally much smaller in the simulator than during driving on the real road and there was a larger variability in lateral position. The same results observed for both iixed-base and moving-base simulators, although this problem, according to Harms (1993), was attributed to the lack of opposing traffic for the moving-base simulators case.
Simulation of the road environment and realism
The simulation of the road environment is very complicated because the more details are provided the more slower the simulator will run. However, <ice a certain driving pattern may not be replicated perfectly within a driving condition, the consistency in the driving pattern between different trials within each of the driving conditions (simulator vs. real road) has to be
estimated first. In several of the studies conducted on the VTI driving simulator (Nilsson, 1993), the question "How realistic do you think the driving in the simulator was?" has been asked. Comparing results Erom all the different studies (mean, SD, 1-7 scale and number of subjects) she found that the lowest realism and also some "not at all realistic" ratings appear in the studies of anti-collision and vision enhancement systems. These systems are not in common use yet and may themselves add unrealism to the situation. Also, the fact that 5% of the elderly estimated the driving to be "not at all realistic" in a study concerning the effects of mobile telephone use on elderly drivers may very well reflect that using a mobile phone is an unrealistic task for this section of the population.
Behaviour and motivation
The penalty and reward structure that motivates driver behaviour is substantially altered in the simulator (Greenberg and Park, 1994). Lives are not at risk. The social and economic pressures that may lead to unsafe driving are also absent. Although monetary penaltylreward schemes can been used to create a motivational basis for behaviour in the simulator, it is not clear that this will result in correlation with behaviour in the target environment. Allen et al (1991) also noted the issue of "operator motivation" and that subjects driving the simulator should be motivated by "real world incentives involving time (speed) and safety (accuracy)".
2.4. Classification of driving simulators according to their use
2.4.1. Training driving simulators
Training simulators first appeared before the Second World War (Morrison, 1991). They were used for military training, e.g. to teach soldiers how to operate a tunk, an aeroplane, a ship. Their main advantages are that they can train less expensively and they are safer and faster than usimg the actual equipment. The issue of safety is the most important in the training simulators and especially for military purposes because any mistake happened is reversible when if the actual equipment was used the mistake could be catastrophic, even lethal. Training simulators can have a number of applications such as in driver education and training and driver licensing. Decision-making situations that involve such factors as interactive traffic, route guidance and signalised intersections could be contrived to exercise students' perceptual and cognitive driving skills and to encourage defensive driving techniques. However, a significant research program, including studies of the transfer of training to real world conditions will be required to validate the effectiveness of simulator training for driver education.
2.4.2. Research driving simulators
A number of research-oriented driving simulators are in operation in Europe and the United States today. They are either fixed-base or moving-base and they use digital computer generated imagery. This means that vehicle dynamics, road database, scene generation and performance measures are all implemented by means of software in a general-purpose digital computer.
Research simulators can be used to investigate the potential role of simpler, more limited part task simulators. This task role will be usefid in establishing the essential part-task requirements for simulator applications that require simplicity and low-cost e.g. driver education and training ( W i e d e and Fung, 1975). Main research application areas include:
the investigation of the effects of non-existing road elements and the judging on the aesthetically "fitting" of the design in an existing environment by means of a scale model, photos and videos. In road traffic the simulation is becoming more and more important to judge complex situations on the road and traffic control techniques in the designing stage. The aim is to look at the consequences of a certain design on aspects of civil-technical importance, aesthetically fitting in the landscape and the inhabitants' point of view and also to describe the drivers' behaviour in the best possible way and look at certain alternatives. In order to find an optimum design of a road for both its horizontal and vertical alignment, there is a wide-scale use of mathematical optimisiig procedures which use as criteria the cost of earthworks;
bJ the trial of high innovative research projects where the discrepancy between the chances of successll realisation and the costs is large. The simulator should open the way for cost and time-saving since preliminary selection and optimisation of the most usehl ideas can be made without turning them into hardware; the increase of knowledge about the laws governing the interaction of driver and vehicle and from this derive assessment criteria;
dJ the improvement of the range of computer-assisted development systems. "Computer- Aided-Driving" (CAD) can use the simulator is an efficient extension of CAD, CAT and CAE (Computer Aided Design, Computer Aided Testing and Computer Aided Engineering respectively), i.e. CAD drafts relating to driving dynamics can be "test-driven" immediately. The simulator fulfils a CAT function in that new components such as electronic transmission or brake control systems and information systems can be integrated as complete sub-systems in the real-time simulations process and tested under any operating conditions. CAE - for control strategies, optimisation processes, systems analyses - can be implemented on line under simulated notion in the closed control loop driver-vehicle- environment (Drosdol and Panik, 1985).
2.5. Classification of driving simulators according to their cost i
Driving simulators can also be classified into three main categories according to the initial cost spent for their development. These categories are low-cost, medium-cost and high-cost driving simulators. A similar classification is low-level, mid-level and high-level driving simulators (Weir and Clark, 1995).
1. Low-cost driving simulators
Low-cost simulation has become a reality with the arrival of current state-of-the-art PC technology that can provide reasonable fidelity in the visual, auditory and control feel cueing. They called low-cost due to the relatively inexpensive graphics displays. They have the ability to move back and forth the simulator soRware from the desktop to the laboratory environment and they are particularly cost effective for students and dissertation related projects and vehicle manufactures and parts suppliers who are looking to support research on limited budgets. The main applications of a part-task driving simulator can be e.g. measurement and

screening of driver psychomotor and cognitive behaviow (Stein et al, 1992; Allen et al, 1994) and the provision of a driving-like task for evaluating seating, control display layout and subsidiary task distraction of an in-vehicle Intelligent Transportation System (ITS) technology (Mollenhauer et al, 1994).
2. Medium-cost driving simulators
The medium-cost driving simulators employ advanced imaging techniques (using real-time animation to create a scene that is projected in front of the driver), a large projection screen, a hll-sized and complete vehicle with all the normal controls. Low and medium cost driving simulators can be either fixed-base (no kinaesthetic feedback) or can provide trivial motion feeling by using systems which simulate the normal vibrations experienced while driving and provide minimal car cab pitch for each comer of the car cab.
3. High-cost driving simulators
They provide an almost 360 degrees field of view and an extensive moving base (e.g. the Daimler-Benz and the VTI driving simulators in Ewope and the National Advanced Driving Simulator that NHTSA plans to built in Iowa, United States). The motion system may include more than six degrees of freedom hexapod and it is built using the aircraft flight simulators technology. The translational motion capability can be greater than 2m (Weir and Clark, 1995).
3. Description of selected driving simulators according to their cost
This section will describe in detail the equipment and applications of existing driving simulators in the transport research field. They will be presented in three categories: first the low-cost simulators, second the medium-cost including the one in Leeds, and third the high- cost simulators. The special features of the simulators will be highlighted as well as their application areas. A table summarising all the diierent technical characteristics of the described driving simulators can be found in the end of the paper (Appendix A). This paper will not describe any truck driving simulators.
3.1. Low-cost driving simulators I 3.1.1. The UMTRI driving simulator
The UMTRI (University of Michigan Transportation Research Institute) first developed two driving simulators. The first one was a colour prototype simulator consisting of a Macintosh Quadra 950 workstation, a colour projection system (utilisiig the resident ROM toolbox routines and Mac Quickdraw graphics features for scene displays and user interface presentations) and a laboratory buck with a passenger car seat, steering wheel, brake and accelerator control. The second one was a desktop prototype simulator which consists of a Macintosh Quadra 700 workstation, a sixteen inch colow monitor for scene display, a steering wheel and a torque motor for generating steering torque feedback at the steering wheel. They
both used a flexible and extensible software written in C language (MicAdam et al, 1993). The new fured-base driving simulator is a integration of the two prototype simulators and is able to simulate curvy, hilly roads and intersections (Reed and Green, 1995). Its technical characteristics can be found in Appendix A.
Applications
The desk-top versions of the UMTRI driving simulators have been used to study: the interactive and synergetic effects of ageing and low levels of alcohol consumption (MacAdam et al. 1993):
?.
the influence of innovative in-vehicle designs on driver performance and the accompanying uotential for driver information overload &lacAdam et al, 1993): , . seat design and comfort issues during prolonged driving (MacAdam et al, 1993).
The fixed-base driving simulators have been used to study: the validity of the simulator using a telephone dialling task(Reed and Green, 1995); the benefits of sound in simulated driving (Davis and Green, 1995).
3.1.2. The Systems Technology Inc. driving simulator
The Systems Technology Inc. driving simulator is an MS-DOS (using Intel processor) compatible part task simulator (Stein et al, 1995). The simulation can easily use different types of cabs and controls. The vehicle dynamics model provide lateraVdiirectiona1 (steering) control and longitudinal (speed) control.
Applications of the Systems Technology Inc. driving simulator include a number of projects such as:
assessment of truck driver fatigue where the driver's task was to control speed at a steady 55 mph and to maintain proper lane position along a straight road for twenty minutes, with no events occurring other that the appearance of ''mow" and "horn" symbols in the "side mirror" subsidiary task. One group was reporting for their driving shift, while the other group had returned from an 8 to 10 hour driving shift. The results showed significant differences in group performance (before versus after work shift) were found for measures of steering control, speed control and subsidiary task discrete response (Stein, et al 1992(a)). Subsequent applications have measured the deterioration of truck driver performance over a period of 20 hours (Stein et al, 1992(b)) and screened drivers for impairment on the open road (Stein et al, 1992(a));
driver alertness monitoring (Allen et al, 1994). Drivers were instrumented with an ear lobe plethysmograph and eyeteye lid movement monitoring device and asked to drive the simulation until they were too drowsy to continue (about one to two hours of a boring, straight road driving scenario in the evening after dinner). Performance measures were obtained on steering and throttle activity, and regression analysis was used to determine the relationship between control performance (lane deviations) and driver measures of psychophysiological and control activity. For a majority of subjects it was found that the SD of lateral lane deviations could be predicted by a combined measure of driver psychophysiological and control activity;
and more recently the study of an In-vehicle signing and Information System (ISIS). Measures of steering control and speed control performance were used to determine the interference of ISIS use with the driving tasks (Mollenhauer et al, 1994).
3.1.3. The Autosim driving simulator
The Autosim driving simulator was developed primarily for driver training applications, with particular interest in driving safety aspects. It is a low-cost driving simulator which includes a two degrees of freedom motion system (roll and pitch). This system provides responsiveness and clear motion cues to the driver but not necessarily every complex movements due to driving characteristics of a particular vehicle (Reymond, 1995). The motion platform prototype has been developed according to initial specification which were prepared in w- operation with VTI and Renault -Direction de la Recherche. The front suspension of the car has been removed and replaced by a frame supported in its middle by a ball joint. Rear suspensions springs (actually torsion bars for the Renault 19) remain, but shock absorbers have been removed. Engine power output is defined to provide accelerations corresponding to 10 & with 5 mm amplitude. This particular motion system has been tested using 40 test drivers and the main conclusions were that driver's acceptance of the system was significantly improved (the psychological realism actually comes first in the driver's impressions and the operational realism can be lower). It is possible to extend this system to a 3 degrees of freedom platform. The fiont ball joint can be coupled to a simulator actuator and mounted on a vertical rail to provide heavy movement, or on an horizontal rail for yaw movements.
3.2. Medium cost driving simulators
3.2.1. The Leeds driving simulator
The Leeds driving simulator at the University of Leeds is a medium cost simulator and its development has been funded by the Science and Engineering Research Council (now EPSRC) (Carsten and Gallimore, 1993). It has been fully operational since mid-1993 for rural-road scenes but nowadays can simulate urban environment too (Gallimore, 1993). Its technical characteristics can be found in Appendix A. The current configuration of the system and details about the application areas of the simulator are described by Blana (1996). The simulator is under validation process at the moment and by the beginning of 1997 it will be upgraded again (it will now have three projector screens for a wide front view and a rear projector for the central and side mirrors views).
Applications
The simulator (LADS) has been used on numerous research projects. A detail description of the projects undertaken in LADS is given by Blana (1996). A summary of those projects is given below.
investigation of the effects of a range of visual and non-visual variables on performance in the standard time-to-collision task;
iden~cation of practical and cost-effective remedial treatments in order to reduce the frequency and severity of accidents on single carriageway rural roads (Pyne et al, 1995). There were three different scenarios: along straight road sections, along sharp bends and approaching and leaving residential areas (villages), each time with dierent road markings. The results showed substantial reduction in speed and speed variance for all three scenarios and the most effective treatment (or combination of treatments) was identified for each scenario;
in the same project, a validation study took place to determine the external validity of the simulator, i.e. if the results obtained on the simulator are transferable to the real world. The overall conclusion was that "speeds adopted on the driving simulator are significantly faster than those adopted on a real road at points where speeds are not constrained by horizontal alignment of the road";
the ''Urban simulation on an advanced driving simulator" project enabled the development of LADS relative to the road network compilation, realistic behaviour to be added to the drone cars and make their movements more intelligent; improvement to the visual scene to allow urban environments to be simulated by the introduction of photo-realistic "texture maps"; implementation of realistic, digital sound; and fkther improvement to the vehicle dynamics model to add a sensation of "directness" to the feedback to steering response (Gallimore, 1993; 1996);
evaluation of a route guidance system. The aim of the project was to study to study the effect of different types of route guidance systems on driver interactions and conflicts. Subjects had to drive with route guidance that either did or did not present lane information. The indicators used were workload measures, driver comfort measures and driver interaction and conflict measures. The results showed that the provision of lane information increased both speeds and the likelihood of conflicts;
testing novel sound patterns for emergency vehicle siirens and other devices. The aim of the study was to generate such a tone that the pedestrians or other vehicles will be able to identify the direction of the approaching emergency vehicle. The results showed an improvement in fronthack localisation of the new sound pattern compared to existing sirens. The new siren was composed of a sound pattern which is both localisable and alerting.
investigation of drivers' behaviour to automatic speed control in urban areas. General speed control and additional speed control on the approach to a junction with three levels of system penetration (no vehicles equipped, 50% equipped and all vehicles equipped) were recorded. In addition to conflicts, measurements were made of speed on links, speed at junctions, following distances, braking and gap acceptance behaviour and mental workload;
evaluation of driver response to road user charging systems enabling to decide whether real-time charges can be included in the field experiments using ADEPT-equipped vehicles.
3.2.2. The TRL driving simulator
The Transportation Research Laboratory (UK) developed for first time a simplistic driving simulator specifically for use in driver perception studies (Watts, Quimby, 1979). The main premise for using a simulation technique in this instance was to provide a safe, risk free, controlled traffic environment with which to test road safety issues. The main characteristics of that simulator were a modified car body (a British Leyland Mini) and a colour back projection system for presenting a driver's eye view film and rear mirror views via a system of mirrors and lenses. Auditory and vibratory inputs were also provided to increase the subjects' impression of being in a real moving car (but very simplistic due to cost limitations). Subjects were provided with a filmed journey in colour and reactions to the views (such as skin conductance levels and reaction to grasp a hand level mounted in the door panel by the driver's side- an indication that driver considers that a risk was apparent) were recorded by subjective assessment. Since the simulator was non-interactive and the subjects had no real control over the speed or position of their vehicle as viewed travelling, it was reasoned that such an experiment was more suited towards investigating perceptual and cognitive aspects of driving, rather than any motor skill components.
The new TRL driving simulator is a latest addition to the old one and it cost £0.5 million (1995 prices). It is considered as one of the more advanced medium cost research driving simulators in Europe with a 210 degrees forward and side vision and hydraulic actuators in place of the suspension units which cause the car to dip under braking and roll when the car is driven around corners (Duncan, 1995; Duncan and Eves, 1995). Its technical characteristics can be found in Appendix A. It should be noted here that most of this information has been taken directly from the TRI, Simulator Manager when the author visited the TRL Simulator Centre.
Applications
to evaluate the effect of traffic calming measures (signingharking) on approaching speed to villages entrances, both on the road and the simulator.
3.2.3. The DRI driving simulator
The DRI driving simulator was designed and developed by the Dynamic Research Inc. in Torrance, California, USA and became klly operational in 1993. It is a mid-level, moving- base driving simulator (Weir and Bourne, 1995). Special features include its motorcycle cab (besides the automobile cab) and the specifically built room to house the simulator. This room has a recessed floor which bares a large reaction mass and there is a hydraulic power supply in an adjacent room for sound proofing purposes. All rooms are air conditioned. The technical characteristics of this driving simulator are described in Appendix A.
There is another fixed-base driving simulator ("Simulator Development Module" or "SDW) in an adjacent area which is used for planning and preparing the experiments and also for accomplishing experiments that do not require the moving-base simulator. It has only one projection channel and it connected to the same roadway database and animated graphics as the moving-base simulator. The fonvard field of view is 55 degrees. This simulator can operate interactively with the moving-base simulator.
Applications
to study drivers' preferences and behaviour for various steering and pedal controls both for urban and suburban roadway scenarios using the fixed-base simulator (SDM); to study brake in turn at high speeds using the motorcycle cab in the moving-base simulator; driver workload related to the use of an in-vehicle navigation and route guidance system using both the SDM and the moving-base simulator.
3.2.4. The TRC driving simulator
The Traffic Research Centre (TRC) is an interdisciplinary research institute of the University of Groningen in the Netherlands. Its research effort focuses on the behavioural and social aspects of traffic and transportation. The main topics of current research programme are: driver performance and cognitive modelling; decision making and individual differences in risk judgement; social factors in road user behaviour; telematics and behavioural aspects of mobility. The TRC driving simulator was first operated in 1991 for the experimental research of the behaviour in a simulated traffic situations. This simulator was developed in house for two reasons: a) to satisfy specific demands of research and b) to be able to satisfy future expansion demands (van Wolffelaar and van Winsum, 1992(a), (b); 1996)
The simulator has the ability to compose a randomly chosen network of roads in which part of roads, intersections, roundabouts, traffic signs, traffic lights and buildings; to simulate the cars in a very realistic way by using mathematical models which describe the behaviour of drivers in traffic manoeuvres; to define traffic situations at certain times and places of the simulations (the so called "scenarios"). These situations are not entirely defined, because they are influenced by the reactions of the driver and also by the reactions of the simulated traffic to the reactions ofthe driver.
Every s i i a t e d car in the traffic environment has the ability to "notice" the environment by means of "individual" sensors. For example there are sensors for the detection of presence and movements of the traffic in front of the car, behind it, on intersections, in side-streets etc. Other sensors "look" at the roads, traffic signs and traffic lights.
The model which describes the behaviour of drivers in manoeuvring was composed, using data of drivers' behaviour from research literature and by means of theoretical and mathematical analysis. This model consists of a collection of actions in traffic. Every simulated car evaluates the actions that are to be done. Like in real traffic, the simulated car often perform more than one tasks at a time. These tasks use a great number of decisions and behaviour rules. Every simulated car changes its own behaviour in continuous reaction with other simulated cars and the simulator-car. Because of this a very complex and dynamic pattern of traffic behaviour arises. The tasks that can be carried out now are only for roads with two lanes or less (write about their latest experiment) and consists of follow the road with the speed regulations for straight and bed roads and for turn on cross roads"; following of other cars; being overtaken by other cars; avoiding collision with other cars; giving way on cross-roads, taking into account the driving direction of oncoming cars, the presence of traffic signs; changing lanes and evaluating whether this is necessary or not and if it can be done in a safe way; overtaking; driving on roundabouts; adjusting the position in a lane.

The rules can be switched on or off for each car. Apart from this every car has its own behaviour characteristics, like a specific reaction time, a certain speed and its own brake characteristics. In this way it is possible to define cautious, aggressive etc. drivers. For every driver, the choices of behaviour are calculated and change 20 times per second. Because of this, it is easy to get a good interaction between the car drivers including the driver of the simulated car.
Another hnction allows the user to define different scenarios. The "scenarios" are diierent programmed traffic situations that begin at a certain time and place an end at another point during the simulation. The driver of the simulator car meets with the situation that was defined. The end of the scenario is not predefined but it is influenced by the reactions of the driver and of the other simulated cars which foUow the set of rules.
Applications
assessment of individual driving performance in specific and exact defined traffic conditions of people with functional disorders, elderly drivers, or drivers using drugs; evaluation of in-vehicle navigation and information systems (e.g. Road Traffic Informatics @TI) that require electronic signalling infrastructure and are not yet available on the real road can be functionally simulated and evaluated under the European DRIVE programmes, the GIDS system (the system "looks" at the different data coming &om either inside or outside of the car and gives the most relevant data to the driver or advises him what to do) and DETER (Kuiken and Miltenburg, 1994; Rothengatter and Heino, 1994; de Waard et al, 1994; van Winsum and van WoEelaar 1993); evaluation of road design; driver training and selection (Wierda, 1993) as well as other European projects as such ARIADNE, DREAM, GEM, HOPES.
3.2.5. The TNO driving simulator
TNO Human Factors Research Institute (TNO-HFRI) is a scientific research institute that works for government and public institutions as weU as for trade and industry. It is specialised in knowledge of human factors and its applications in the design of human work and of adequate technical aids. It aims to contribute to better performance, safety, comfort and job satisfaction.
The old version of the TNO driving simulator was consisted of a 3 TV projection system (in black and white) on screens surrounding the mock-up of a vehicle. Horizontal and vertical field of view were 120 and 30 degrees respectively and the recordings were made in-line from a 1:87.5 scale model (dimensions 23x17 m max.) by a mirror block with 3 endoscopes and 3 cameras. The movements of this recording system were computer controlled and consisted of 3 translations and one rotation (yaw around the vertical axis). Due to the implementation of a moving-belt system, driving time was unlimited (Kaptein et al, 1995(a)).
The new version has an advanced image generation system (see Appendix A) which includes a variety of visual conditions and atmospheric effects. Plans are afoot to provide an improved road "feeling" using a simple moving-base system that responds to high-frequency vibrations. Maximum lateral accelerations: 0.3g i.e. at a driving speed of 100 kdh, curves with an arc
radius of at least 250m are reliably simulated. It is able to present rear views on separate compute screens, which can be placed behind the mirrors in the mock-up so that drivers may have normal use of their rear view mirrors (van der Horst et al, 1991).
Applications
the investigation of the effects on driving behaviour of various road and driver circumstances (joint projects of TNO with the Dutch Ministry of Transport, Public Works and Water Management) (van der Horst, 1990); the testing of future applications of modem electronics to aid motorists in carrying out their driving task (DRIVE project)(Van der Horst and Wilrnik 1986; van der Horst et al, 1991); the behavioural consequences of Intelligent Cruise control in the vehicle and its possible link-up to roadside systems (PROMETHEUS project) (Hogema et al, 1994; Janssen et al, 1991, 1992a, 1992b); the behavioural evaluation of tunnel design characteristics (Kaptein et al, 1995@)). Drivers will have the possibility to use either the main two-lane tunnel tube or a relatively narrow single-lane tube. The study investigated to what extent drivers are willing to drive in the single-lane tunnel tube and whether drivers adjust their behaviour to the design of this tube; the time-to-collision and driver decision-making in braking (van der Horst and Brown, 1989; Kaptein et al, 1994); the perception of chevrons in fog both on real road and on the simulator (van der Horst and Hoekstra, 1993; Hogema et al, 1993) the investigation of the effects of road width and obstacles on speed and course behaviour (Tenkink, 1989(a)); the effect of lead vehicles on speed choice under restricted sight distances (Tenkink, 1989@)).
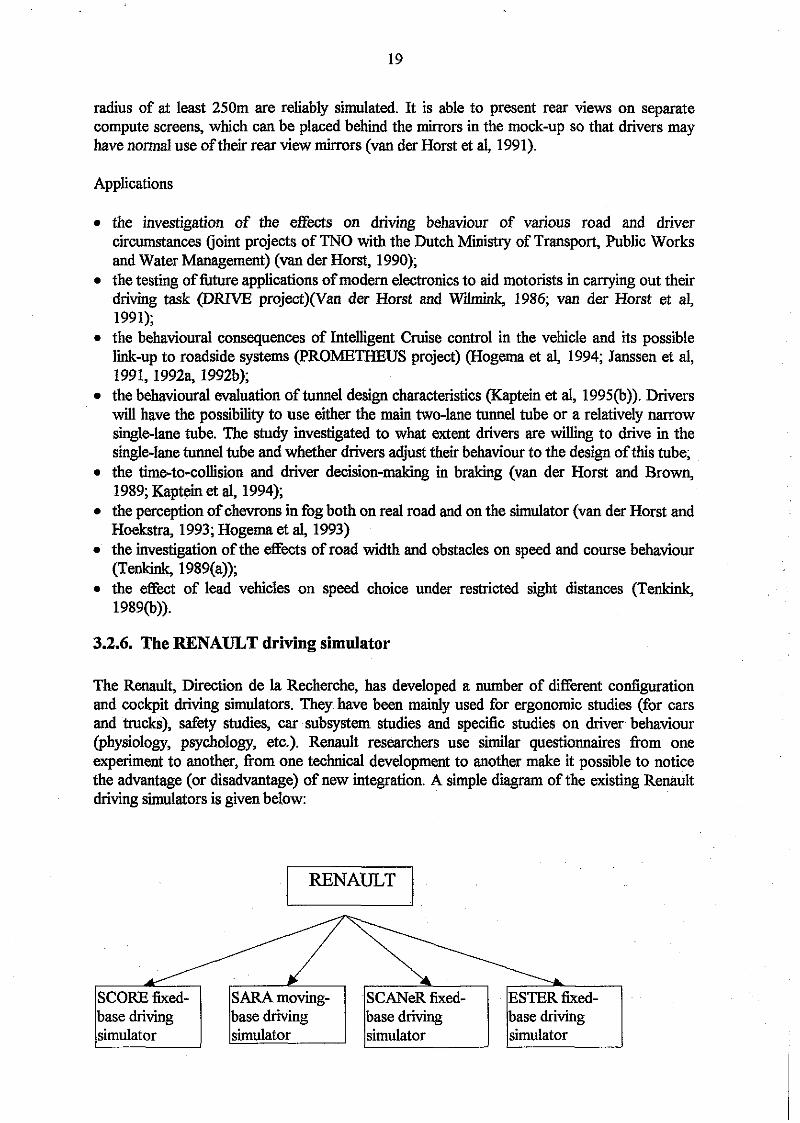
3.2.6. The RENAULT driving simulator
The Renault, Direction de la Recherche, has developed a number of different configuration and cockpit driving simulators. They have been mainly used for ergonomic studies (for cars and trucks), safety studies, car subsystem studies and specific studies on driver behaviour (physiology, psychology, etc.). Renault researchers use similar questionnaires from one experiment to another, from one technical development to another make it possible to notice the advantage (or disadvantage) of new integration. A simple diagram of the existing Renault driving simulators is given below:
SCORE fixed- base driving simulator
SARA moving- base driving simulator
SCANeR fixed- base driving simulator
ESTER fixed- base driving simulator
The ESTER driving simulator has been developed to integrate the experience of Renault in driving simulation technology and it focuses on the modularity, real-time control and user- friendliness of a driving simulator (Morel-Guiiemaz, 1995). It consists a Silicon Graphic ONYX Re2 bi-pro (the main multi-processor workstation) which controls the visual subsystem, the animations (weather, traffic), the vehicle dynamics behaviour, the data storage and the S A S ~ kernel. It sends to and receives information from the other subsystems: a mono-processor Silicon Graphics 4Dl3 10 VGXT workstation is used to control other visual subsystems (e.g. rear-view), a PC Compaq 486133 for vehicle UO controls and sound effects both ethernet linked and a S A S ~ Graphical user Interface (a dedicated ethernet) which takes into account multiprocessors and distributed environments.
The S A S ~ ~ kernel ( a real time supervisor) helps to: adjust real-time simulation in order to improve the simulation cycle (latency reduction, process overflowing management); . define quickly dierent kind of simulation environment best suited to the applications according to the available hardware resources (computers, processors) and hnctional modules (traffic management); . ensure the control of the real-time simulation experiment.
The SCORF, fixed-base driving s i da to r was mainly developed to conduct human engineering studies on the interior of the car. It is an in-house simulator with the ability to create a road scene easily and quickly using Simsis (a road database modelling system developed in the Renault Research Department). It can carry out real-time experiments according to predefined scenarios (for the animation of the traffic and the weather conditions) and can store data in real time. It is mainly used for assessiing the visual attention of drivers in connection with instrument scanning and for measuring any collateral driving disturbance (Guyard and Boulanger, 1992).
The SARA driving simulator is a moving-base driving simulator and has been developed by Renault, Peugeot SA and INRETS. Its configuration has been based on the VTI or Daimler- Benz driving simulators (Gauriat, 1993). It has not been in operation yet and it is programmed to start by 1997 (Detalle et all, 1994).
The SCAN (Simulator for Co-operative Automotive Network) simulator is mainly used for the validation of inter-vehicle communication concepts as well as the driver assessment of the new product in a variety of traffic conditions. For instance, in the DOMINIC (Driving on Motonvay IN Co-operation) DRIVE project V1048, the advanced control strategies and methods for motonvay RTI systems of the future were studied. In particular, cooperative driving, intelligent cruise control (driving in file and autonomous cruise control), intelligent manoeuvring and control, medium range pre-information and emergency warning systems have been tested. Large scale motonvay traffic flow simulation was achieved by interfacing SCAN with SPEACS (Simulation Package for the Evaluation of Advanced Control Strategies), developed by CSST and Mizar in Italy (Kemeny and Pioid, 1991). It was an earlier version of the SCANeR driving simulator (which is described further later and its technical characteristics can be found in Appendix A).
The display performance was 10 to 15 images per sec on Silicon Graphics 40251Turbo and 20 to 30 images per sec on a Silicon Graphics 210 VGX. The SCAN simulator Man Machine Interface (MMI) included three independent layers: a) the Man Simulator Interface (MSI), b)

the Driver Vehicle Interface @VI) and c) the Vehicle Driver Interface (VDI) to display driver information computed by the on-board vehicle software (HUD). The vehicle dynamics model included the Kinematics Model (my = TeIRw * K*n + Fb + Fr, where y: vehicle acceleration, M: vehicle weight, Te: engine torque, Rw: wheel radius, K: gearbox reduction, n: gearbox efficiency, Fb: braking force and Fr: resistance force), the cruise control (dvldt = f(v,u) where u: system input (for the 2D vector the components are the throttle and the braking pedal angle), v: system state parameter (speed)).
The SCANeR (Simulateur de Conduite Automobile Normalis6 en Reseau or Simulator for Cooperative Automotive NetwoRk) was mainly developed to meet the needs of the PROMETHEUS European Project and also for ergonomics analysis testing, car sub-systems and driver psychological and physiological behavioural studies. It is the latest version of the SCAN. The simulator consists of cockpit or mouse keyboard, a vehicle dynamics model, a vehicle positioning model, a decision making engine, a communication system enabling communication with other vehicles as well as the infrastructure (Kemeny and Piroid, 1991; Kemeny, 1993) and a three-dimensional and two-dimensional graphics computing and display unit with an appropriate man-machine interface. It allows to drive interactively vehicles, the number of which is limited by the number of the LAN (Local Area Network) users. Vehicle emission and reception frequency rates depend on their road distance to the user-driven vehicle to reduce network load. Other vehicles can be generated by individual vehicle trajectory or by deterministic or random generation.
The visual system includes a filtering unit to allow a better tracking of moving vehicles and avoid jittering. Up to 50 autonomous vehicles can be simulated on a R4000 based Silicon Graphics machine in real time. It can generate event driven traffic allowing both unpredictable and user defined vehicle behaviour. It has the abiity to simulate night, rain and fog conditions and can detect collisions, getting off the road. The SCANeR simulator uses an in-house developed semi-automatic graphics generation system, called GENIE, with interactive control (Kemeny and Reymond, 1994). Several SCANeR simulators can be connected to each other constituting a network of driving simulators, sharing the same road network (Kelada and Kemeny, 1995).
Applications (Kelada and Piroid, 1995)
a the evaluation of the PROMETHEUS Extended Intelligent Cruise Control applications by Dialexis in 1992;
a the evaluation of Renault's Autonomous Intelligent Cruise Control by Renault, Direction de la Recherche in 1993; the evaluation of the PROMETHEUS Intelligent Cruise Control application (on simulator and test track) by INRETS, Arcueil in 1994; the evaluation of Renault's vision enhancement system by Renault, Direction de la Recherche in 1993;
a the evaluation of the PROMETHEUS Medium Range Pre Information system (on simulator and test track) by INRETS, Bron in 199415;
a the evaluation of an automatic toll payment system on the French A14 motorway by INRETS, Arcueil and INRETS, Bron in 1995.
3.2.7. The INRETS driving simulator
The Insititut National de Recherche sur les Transports et leur Securitk (INRETS) in France has been developed two driving simulators. The first one is called ISIS and is located in Arcueil, near Paris and the second one is called SECRET and is located in Lyon. They are about the same, except the cabin. SECRET has a small truck cabin and ISIS a car cabin. There are always under development. A readout in lanlh is superimposed onto the bottom of the projected image. The technical characteristics of ISIS are provided in Appendix A (Malaterre, 1996).
Applications
to test an extended intelligent cruise control (EICC) both on the simulator and on a test track. There were two scenarios: the EICC could be either active or passive. Heart rate, time headway and steering reversal rate were measured (Malaterre, 1995); to evaluate a medium range pre-information (MRF'I) driving aid system both on the simulator and on a test track. Messages were transmitted to the driver via infrared beacon fed by batter ad positioned on tripods for the road tests and for the simulator test, messages were sent to the display unit via a PC installed alongside. For both cases, the information display programme was defined by the longitudinal position (Se~gna t et al, 1995).
3.2.8. The Hughes driving simulator
The Hughes Transportation Simulation Centre (HTSC) has developed a driving simulator which was initially used to support the design and evaluation of head-up displays (HUDs) for vehicles and to back up General Motor's introduction of HUDs in cars. The centre is part of the Hughes Aircraft Company, Los Angeles, California which was acquired by General Motors in 1986 (Hein, 1993). It has the ability to test HUD, virtual image display (VID), flat panel and conventional displays designed in HTSC. The traffic scenarios can be as simple as car following, and as complicated as navigation and crash scenarios.
Applications
The Hughes driving simulator has been used to numerous research and industrial applications since it has become i l l y operational in 1987. These include:
specification of HUD image distance, vertical disparity, alphanumeric font and daylnight luminance requirements; HUD consumer preferences; HUD washout and ghost image mitigation assessment of HUD image location, density and distraction; assessment of crash warning modality; night vision enhancement system; assessment of model used of virtual image; studies about virtual image misregistration; the virtual image visual display terminal; the virtual image perimeter marker studies about adaptive cruise control; variable focus and fatigue; studies about the California Advanced Driver Information System (CADIS); the Advanced Traveller Information Systems and Communication Vehicle Operations;
studies about the primary HUD simulation and advanced signalling and advanced driver- vehicle interface systems simulation.
3.2.9. The FIAT driving simulator
The Fiat Research Driving Simulator (CRF) is a joint effort of FIAT Research Centre and SEPq a FIAT company belonging to the Magneti Marelli group, leader in military, industrial and automotive electronics. It was initially developed to test and evaluate environments for human-machine interactions studies in the field of driver information and support systems (innovative driver support and convenience system; instrument panel and dashboard layout and complexity; and secondary controls (Guiso et al, 1995). It is a fixed-base driving simulator with a wide field of view and includes realistic traffic generation. The applications tested to date include driver information systems, collision warning, medium range pre-information, route guidance, instrument panel location and complexity, steering wheel secondary controls, radio and others. .
The special feature of this simulator is the on-line integration between the traffic simulator (SPEACS) and the vehicle simulator ( S i t o ) which gives the possibility to drive a simulated car into a simulated traffic flow where interaction between vehicles takes into account all the relevant feedbacks. SPEACS (Simulation Package for Evaluation of Advanced Control Strategies) is a microscopic simulator (discrete time/siingle vehicle) that includes the possibility of simulating microscopic effects of traffic on a stretch of a motorway, allowing thus for analysis of the consequences of abnormal demand situations, roadworks, as well as of control actions like speed control. Besides, facilities are included for the evaluation of advanced "cooperative driving" schemes as well as the co-operation between vehicles and infrastructures. SPEACS has been jointly developed by CSST and MIZAR within PROMETHEUS and DRIVE programs.
SPEACS is a "three level simulation environment": 1. a first level wherein the vehicle movements are simulated using suitable principles for the
car-following behaviour and rules for the basic manoeuvres (lane changing, overtaking, etc.)
2. a second level where the data flow, and communication rules between vehicles and data acquisition from sensors are simulated
3. a third level where the control laws and decisions based on the information from the previous level can be simulated. At this level it is possible to define and implement rules modelling driver acceptance of warnings, suggestions and controls.
The scenario used with the integrated SPEACS-SimAuto environment is an annual highway corridor of about 30 kin length, built with the EaSIEST modelling tool, enhanced with a series of procedures to extract the highway and landscape polygon and texture databases from the engineering drawings in the typical highway construction format. The environment is adaptive with respect to the participant strategy. The number of the external actually visible cars is eight.. It has been recognised that the addition of rear-view visual channels would significantly improve the realism of the task imposed to the participant.

3.2.10. The BMW driving simulator
The BMW driving simulator was mainly developed for man-machine interaction systems (Bernasch and Hael, 1995). The steering wheel is controlled by means of an electric servo- drive which created torque depending on speed, steering angle and steering angle velocity, delivered by the dynamic model. The steering feeling is parametrically adjustable, the range for control is nominally 0-5 Nm, maximum 35 Nm. The graphical database is the "Munich graphical database" which covers an area 40 x 20 km around Munich and includes the texture of trees, buildings , signs and cars. It includes a 15 km two-lane highway, a 4 km two-lane urban road and a 21 km country road. Complex roads and crossings are described by using a tool specifically developed by BMW. The road tool allows the reproduction of roads exactly as specified in construction plans (clothoids, curvature, etc.). Another database partly reproduces the BMW test track for special driving purposes and for evaluation studies.
The sudden appearance and behaviour of vehicles can be controlled individually either according to a simple driver model or exactly as predefined. Realistic behaviour is achieved by usiig brake lights, indicators and hazard lights. Also, certain behaviour of other cars can be induced by the simulator car, e.g. starting, entering the highway or braking. the behaviour of other cars can also be (loosely) coupled with the simulator car, e.g. having a 2-second distance ahead and driving at least 50 m in front.. Up to now, about 100 vehicles with twelve different models (seven liiousiies, and convertibles, three trucks and two buses) have been used, so dense traffic is possible(about 300-400 vehicles). Simultaneously, it is possible for 10 to 15 cars be visible in the scene without overlodig the vision simulation.
Applications
The BMW driving simulator has been used to a number of applications such as: parallel experiments with "Heading control" (lateral control system) in the simulator and inn a field experiment. Results are qualitatively comparable; navigation planning with different complexity of dialogues using the board monitor parking lot reservation using board monitor, to compare different input devices adaptive cruise control development; difference of reaction of test persons perceiving brake intensity by means of different shape of lights and different intensity of lights.
3.2.11. The FORD driving simulator
The Ford driving simulator was developed by the Ford Research Laboratory in the late 1988 (Greenberg and Park, 1994) to study driver's performance. The simulator includes a data- logging capability that allows any simulation variable to be recorded at up to 200 Hz. All its technical characteristics are fblly described in appendix A. The main advantage of this simulator is its flexibility in creating traffic scenarios, new roadways, alternative signage and IVHS inf?astructure and altering vehicle characteristics (e.g. steering ratios, spring rates, damping factors, driven wheels). According to Greenberg and Park (1994), the single factor constraining the traffic scenarios in their simulator is simulator sickness.
3.3. High cost driving simulators
3.3.1. The Daimler-Benz driving simulator
The Daimler-Benz driving simulator is a development simulator, i.e. its purpose is to analyse and develop hnctions of the vehicle system itself by a team of experienced personnel. Vehicle development and important environmental information for the driver are simulated in such a way as to give the research and development engineers a basis for the testing of new vehicle design. It has been hUy operational since May 1985 (Drosdol and Panik, 1985; Drosdol, K H i g and Panik, 1985). The driving simulator can set in motion only if the passengers have fastened their seat belts, the entrance bridge has been retracted and all the dynamic safety circuits are in working order. In case of emergency there are hydraulic dampers in the actuators. The technical characteristics of the simulator are described in Appendix A.
By the end of 1990 the simulator was upgraded: the vehicle dynamics computer system was replaced and the software was h t h e r developed; the quality of the mathematical models was improved and the number of model variants was increased. The sound system (Hahn et al, 1989) and the control loading system were completely redesigned. The vehicle models are not parametric, they are physical modelling where only genuine vehicle data are used. They are 3D and have non linear kinematics and elasto-kinematics of axles and steering system. They have all the different drive options which are possible for cars and trucks and the required computing time is 6 MIPS for a passenger car and 10 MIPS for a 3 axle truck (Kadimg, 1995).
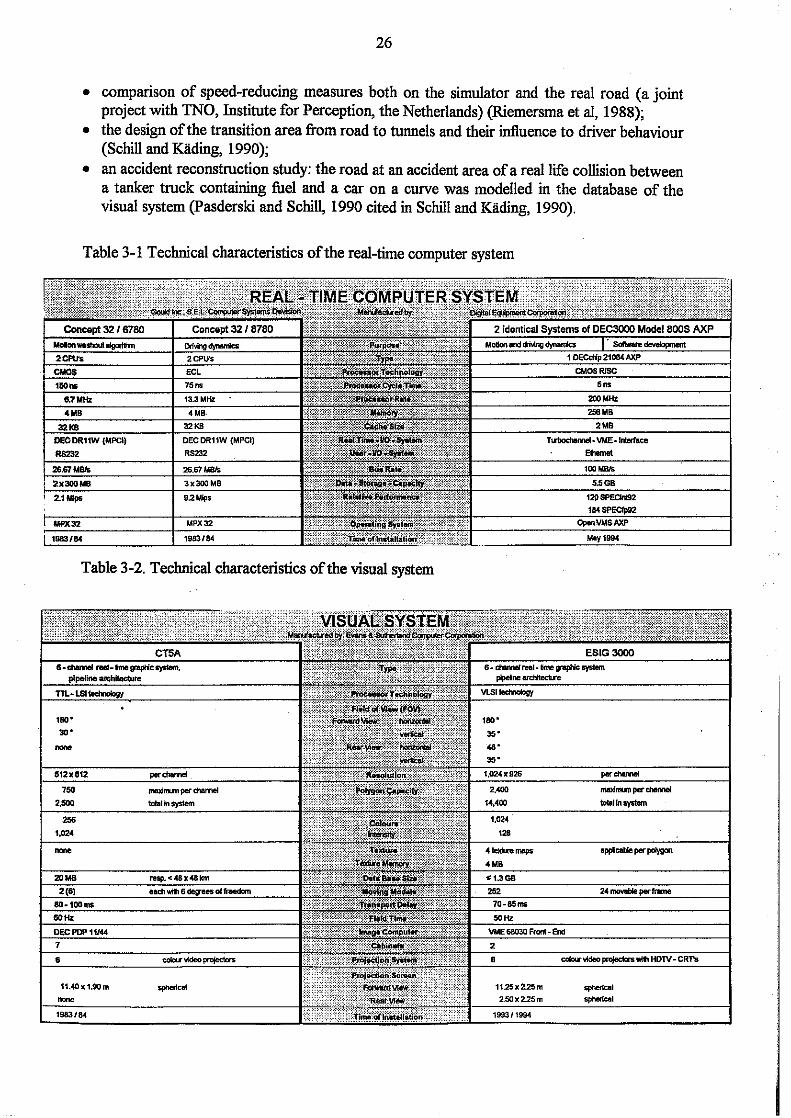
The following tables outline the changes in the real-time computer system, the visual and the motion system aRer the improvement of the simulator from autumn '93 until summer '94 (Kading, 1995).
Applications
testing driver behaviour on icy roads under stress usiig different equipped cars (e.g. with rear-wheel drive, permanent all-wheel drive and 4MATIC (automatically switched four- wheel drive) (Hahn and Kalb, 1987; Hahn and md'ig, 1988); speech input in cars: determination of a suitable command vocabulary; comparison of a push button control and voice input in different accident-prone situations (Hahn and Kalb, 1987; Hahn and K&g, 1988); investigating overtaking behaviour in normal traffic conditions. It was found that drivers who overtook more often did not perform these manoeuvres in a less safe manner (Hahn and Kalb, 1987; Hahn and =ding, 1988); driver control characteristics: a study on control algorithms for four-wheel steering cars. The driving tests consisted of 1.30-norm double lane changes executed over 3 different distances on a divided highway. The route to be taken in the lane was marked with cones (Hahn and Kalb, 1987; Hahn and Kading, 1988); evaluation of electronic safety systems like an all-wheel steering and active suspension system (i.e. the passive suspension is replaced by hydraulic actuators which are controlled by a special algorithm) (Hahn and Kalb, 1987; Hahn and =ding, 1988); testing to what extent the different sensual information contributes to driver performance in lateral control (Hahn and Kalb, 1987; Hahn and Kading, 1988);
comparison of speed-reducing measures both on the simulator and the real road (a joint project with TNO, Institute for Perception, the Netherlands) (Riemersma et al, 1988); the design of the transition area om road to tunnels and their influence to driver behaviour (Schill and Kad'mg, 1990); an accident reconstruction study: the road at an accident area of a real life collision between a tanker truck containing k e l and a car on a curve was modelled in the database of the visual system (Pasderski and SchiII, 1990 cited in Schill and =ding, 1990).
Table 3-1 Technical characteristics of the real-time computer system
Table 3-2. Technical characteristics of the visual system
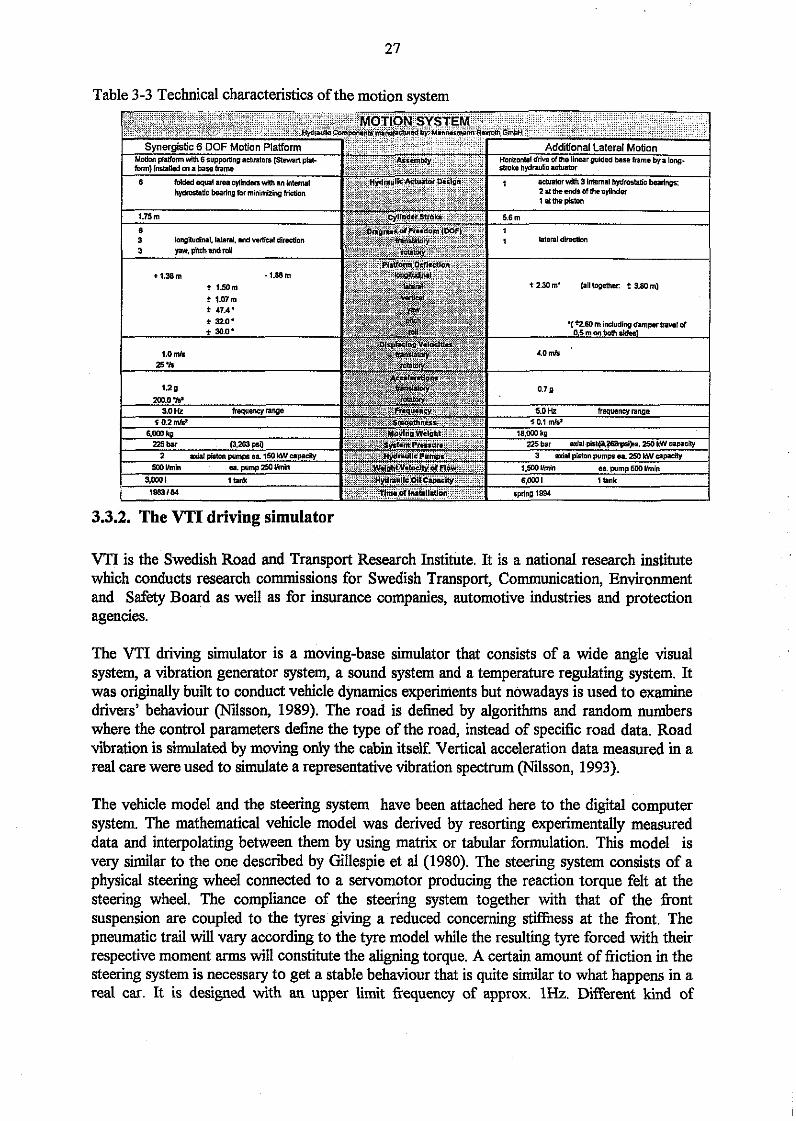
Table 3-3 Technical characteristics of the motion system
3.3.2. The VTI driving simulator
VTI is the Swedish Road and Transport Research Institute. It is a national research institute which conducts research commissions for Swedish Transport, Communication, Environment and Safety Board as well as for insurance companies, automotive industries and protection agencies.
The VTI driving simulator is a moving-base simulator that consists of a wide angle visual system, a vibration generator system, a sound system and a temperature regulating system. It was originally built to conduct vehicle dynamics experiments but nowadays is used to examine drivers' behaviour (Nilsson, 1989). The road is defined by algorithms and random numbers where the control parameters define the type of the road, instead of specific road data. Road vibration is simulated by moving only the cabii itself. Vertical acceleration data measured in a real care were used to simulate a representative vibration spectrum (Nilsson, 1993).
The vehicle model and the steering system have been attached here to the digital computer system. The mathematical vehicle model was derived by resorting experimentally measured data and interpolating between them by using matrix or tabular formulation. This model is very similar to the one described by Gillespie et al (1980). The steering system consists of a physical steering wheel connected to a servomotor producing the reaction torque felt at the steering wheel. The compliance of the steering system together with that of the ~ o n t suspension are coupled to the tyres giving a reduced concerning stiffness at the front. The pneumatic trail will vary according to the tyre model while the resulting tyre forced with their respective moment arms will constitute the aligning torque. A certain amount of friction in the steering system is necessary to get a stable behaviour that is quite similar to what happens in a real car. It is designed with an upper limit frequency of approx. 1Hz. Different kind of
controlled vibrations can therefore be induced in the steering wheel to characterise road texture. Simulation of road line vibrations has been found to be an excellent way to give drivers information about lateral position on the road.
The temperature system consists of a closed system where temperature controlled water is circulated and controls the air temperature in the cabin. The cabii temperature can be set to any value from lS°C to 32OC wit an accuracy of M.5"C. The maximum response time is of the order of magnitude 0.5 h.
Applications
to test handling properties of the driving simulator during lane changing with side winds (Smith and Laurell, 1987, cited in Nilsson, 1989) to test the effect of alcohol and drugs on driver performance Faurell and Tomros, 1986(a),@); Laurel1 and Tomros, 1987; Tornros and Laurell, 1987(a), all cited in Nilsson, 1989). In particular the acute and carry-over effects of different hypnotic drugs, non- narcotic analgesics, antitussive agents and alcohol in different doses have been studied and compared to placebo effects. Two different driving tasks were used for these studies: a monotonous and a demanding. Also hang-over effects of alcohol have been studies using the same driving tasks; to study the effect of the overall tr&c environment to drivers' performance using task demand, driving speed and driver's cognitive load as the control measures (Harm, 1989); to study the effect of driver fatigue on driver performance (Tornros and Laurell, 1987(b), cited in Nilsson, 1989) to study the effect of the "physical environment" within a car on driver performance (Morkn et al, 1988, cited in Nilsson, 1989); to test the effect of hand-free mobile phones on driver behaviour (Alm and Nilsson, 1991); to test the effect of hand-free mobile phones on elderly drivers' behaviour and comparison to young drivers' behaviour (Nilsson and Alm, 1991); to validate the VTI driving simulator. Three studies were conducted. The first one by Harms (1993), the second one by Alm (1995) which was mainly a repetition of the first study with minor changes and the third one by Tomros (1996).
3.3.3. The IOWA driving simulator
The Iowa Driving Simulation Facility includes a range of C i a t o r s such as: (a) a moving-base driving (b) a fixed-base driving simulator with a wide field of view and higher resolution than the moving-base, (c) generic driving cabs with single PC and SGI graphics systems and (d) three dimensional imaging simulators for construction and agricultural equipment development. The simulator which will be described here is the moving-base driving simulator (IDS) which was first operated in 1992. It has a wide field of view and interchangeable cabs, all with high-frequency control feedback and IkU instrumentation. A Ford Taurus Sedan and a Ford Taurus station wagon are used for on-road studies and simulator validation. It can create a vehicle simulation model directly from engineering CAD data. The roadways, signs and pavement geometly is the standard AASHTO (American Association of State Highway and Transportation Officials) Geometric Guidelines. It also includes intelligent vehicles and pedestrians moving interactively. Another feature is that IDS incorporates Distributed

Interactive Simulation @IS) protocols which allow real-time interaction with other DIS simulators (iormation was obtained from the www and also Stoner, 1994).
Applications
The Iowa Driving Simulation Facility has been used for four main research categories: virtual prototyping of vehicles and virtual prototyping of infrastructure and controls systems; human performance studies; driver behaviour and fitness to drive and basic simulator technology development. Specifically, current research projects include:
experimental studies for the design and use of Automated Highway Systems (AHS); studies for collision warning and roadway departure warning systems knded by the Federal Highway Administration (FHWA); studies for the evaluation of the TravTek Advanced Traveller Information Systems (ATIS) (a moving map navigation display and yellow pages interrogation). Variables included driver task intrusion, navigation performance, unsafe driving behaviour, experience and age; also for the development of human factors guidelines for addressing the use of ATIS (Stoner, 1994); a project to evaluate the driver performance in simulated Automated Highway Systems environments, including computer controlled headway maintenance in designated lanes under a variety of traffic flow, speed and average headway conditions.
3.3.4. The FHWA (HYSWI) driving simulator
In the early 1960's the FHWA (Federal Highway Administration) constructed simplistic simulators to investigate one or two variables affecting recognition and interpretation of signed highway information, but the credibility of the simulations was questionable because the visual displays were not realistic. The highway driving simulator (HYSWL) was developed to study driver-roadway interactions and first operated in 1983 (Alicandri, 1994). The second generation of HYSIM appeared by 1990. The graphics generation system was replaced with a polygon-based system and the computer/graphics module was now contained in a s i i e system. The second generation of HYSIM technical characteristics are presented in Appendix A.
The simulator is interfaced with the vehicle dynamics module to permit steering and speed control, the scenario computer to provide monitoring, control and performance factors, the operator's station and the auditory module. The vehicle dynamics module receives input from the car cab controls (steering, throttle and brake) and the scenario computer (wind gusts and roadway disturbances). It computers the vehicle's speed, direction and track error with representative vehicle dynamics that can be selected to simulate different kind of vehicles and tyrelroadway conditions. Its output goes to the scenario computer for further computation of route progress and driver performance and scoring of the driver's performance data; to the roadway generator andlor cinematic module to provide l l l y or partially interactive visual displays; and to the auditory module for sound effects. It uses a 16 mm motion picture projector with speed and yaw control. It is a small-scale motion system which can simulate normal vibrations and minimal car cab pitch for each corner of the car cab.
It also includes a sign system (four Navitar 750W Xenon arc lamps with 35-mm random access slide projectors and 17:l zoom lenses) where the affiliated yaw mirrors can move both laterally and vertically to allow signs to rise over a hill. A Grass Model 12 Neuro-Data Acquisition system has been added to the PsychophysiologicaI module to allow for conditioning and recording of electroencephalogram data (Alicandri, 1994).
Applications
a study to assess the validity of the HYSIM simulator comparing driver performance on the simulator and on real-road. The dependent variables were sign detection and recognition distances, speed, accelerator position changes and steering wheel reversals (Alicandri et al, 1986); a study to determine the effect of supplemental interchange signing on rural freeways on driver's behaviour using different comb'itions of tourist-oriented attraction and service signs ( H w e r , 1989).
3.3.5. The General Motors (GM) Driving simulator
Since the early 1960's general Motors (GM) has developed three driving simulators and in 1985 a fourth in-house driving simulator was developed to explore the benefits of utilising driving simulators in the vehicle design process (Repa and Bertollini, 1990; Bertollini et 4 1994) and in particular to support human factors activities during vehicle design development. It has been hlly operational since 1989.
The steering feel subsystem hardware includes the steering wheel torque motor, closed-loop torque amplifier and steering model computer. The software represents current and hture production steering systems with empirical and analytical models for the steering rack, valve/pump or electrical assist systems. An interactive menu allows modifying system parameters such as assist curves, inertia, damping and functional components. Simulated steering lock-to-lock displacement and reaction forces are limited to f 360 and 24 Nm, respectively. The incidence rate for discomfort incidences equal to or greater than a moderate level is about 5%.
The display simulator subsystem provides the ability to simulate graphic prototypes for instrument cluster gauges, head-up displays, or collision warning information systems. Flat panel LCD, or small CRT video displays are integrated in the driver compartment instrument panels to provide the information to the driver. The road image consists of colour gouraud shaded, polygon models representing the world terrain, road surface and road scene objects. The average scene consists of a 2 or 4 lane highway with sparse signs or vegetation and up to 3 other moving vehicles.
The sound subsystem dynamically produces the different types of automobile sounds and also generates automated operator instructions. It receives solution states generated by the vehicle dynamics model and visual system collision and computes dynamically varying pitches and intensities for the engine, drivetrain, tires and gusts, and collisions with pylons or other road objects.
Applications
GM driving simulator has primarily been used to support the development of new steering system concepts and to investigate usability issues associated with the driver-vehicle interface prior to prototype.
a 412 wheel steer (4WSl2WS) customer perceived benefits prepilot to evaluate perceived customer benefit of 4w versus 2w for highway driving and an expert driver emergency training for autonomous vehicle to give expert drivers of an autonomous lane tracking vehicle the experience of a lane lock (tracking) failure, in the hope that it would better prepare them to recover vehicle control, if such a failure occurred during real vehicle testing.
3.3.6. The MAZDA driving simulator
The Mazda driving simulator was mainly developed to test h r e driver-vehicle systems and simulate vehicle motions in emergencies or under critical situations (Suetomi et al, 1991). The main objective was to be able to apply the Kansei Engineering: "a technology which tries to transfer human perception, feelings and mental images into a tangible product" in order to develop cars focusiing on the sensory aspects of individual people (Yamamoto, 1986 cited in Horiguchi and Suetomi, 1995). Also Kansei Engineering deals with a wide spectrum of disciplines ranging from human factors engineering to psychology.
It consists of a mini-super-computer, a moving-base with a large amplitude motion system (VTI and Daimler-Benz driving simulators have relatively low to moderate -respectively- amplitude motion systems) and a high speed visual system and a movable cab. The motion system is capable of simulating lateral acceleration in critical conditions or yaw rate when spinning. Simulation of 0.64G acceleration can be attained using gravitational components by inclining roll or pitch to a maximum angle of 40 degrees. Adopting non-pipeline architecture, the transport delay is 25 msecs (where for parallel pipeline techniques is 50 msecs).
Special characteristics include the 5 ms as the time interval of 110 and vehicle dynamics. This means a road image generation takes 30-70 msec depending on the complexity of the road image database. The program language used for vehicle dynamics is FORTRAN 77, where the I/0 control and image generation are written in C. The PHIGS+ graphic library is used. The cabin is electromagnetically shielded so that physiological signs, such as electroencephalograms can be measured. The driver can converse with an operator at the operation panel through the interphone. From the waist up, the driver is monitored at the operation panel by the monochromatic video camera at the upper end of the screen.
The structure of the road image database consists of lOOm unit block, into which a road is divided along a course. Each road block has both a detailed geometric model and a rough model. Blocks near the driver's eyepoint are displayed in detail using the detail geometric models. Distance blocks are displayed more roughly using the rough geometric models. A road block contains road surfaces, such as asphalt, centre lines and side limes, in addition to ground, his, trees, etc. Roll and pitch of the car body are also expressed by road image inclination and vertical motion. Results of simulator drivine are urocessed via the data - processing system immediately after a drive is completed. A driver can see the results of driving behaviour, vehicle state and physiological data on the cabin screen.
A full colour textured road and environment image is generated every 20 msecs by a special image generator. Road curvature can be specified both horizontally and vertically. The system can control traffic such as leading vehicles, oncoming traffic and obstacles. It can change the road surface to dry asphalt, wheel tracks, snow and so on. The number of lanes and the pattern and colour of lane marks can be specified freely. As background, sky and distant mountains round according to vehicle direction. As foreground, a bonnet hood and text display are generated statically. A fog effect is also available to change the visible distance.
The car sounds such as from engine, road, wind and tires are recorded during real driving and stored in a digital sampler. It is easy to change an engine sound of a simulation vehicle to that of another car by exchanging sampler data. The image of preceding cars have brake lights so that the driver of the following car can recognise the brake operation of the preceding car.
Applications
to study the human perception mechanism with regard to yaw direction. For this experiment two kinds of visual images were used: a road image (curved (R=140m) and straight road sections with centre line only) and a landscape image (that simply consisted of distant mountains). Three groups were used, young and elder males and young inexperienced females. Response times were measured under three conditions: motion only, motion and visual, visual only. the subject did not handle the steering wheel but was instructed to push a switch in his hand as quickly as possible when s/h perceived a change of yaw rate. The results showed that the response time is longer according to the age of the driver, and also that the perception ability of older drivers tends to be weaker (as their perception thresholds were larger than those of younger subjects).
to study drivers' average braking reaction time with and without collision warning system and to evaluate a crash reduction rate of a collision warning system in a car following situation (rear-end collision). The subject met with two conditions: either a sudden braking of the preceding car or a sudden lane change of a preceding car on the adjacent lane while executing a secondary task (to push a button when one of the five LED lamps was lit). The collision warning system provided a warning sound when the headway distance was shorter that the warning distance Lo (set by the experimenter). The results showed that for the first condition without the warning system, 18.6% of the subjects made crashed and with only 2.3%. Also that the collision warning system significantly increased the min headway distance at braking @<0.01) and that subjects responded about 0.5 secs earlier on the average with warnings than without warnings @<0.01) (Suetomi et al, 19950)).
Comparison of braking headway between simulator and real world. The results showed that although the distances in the simulator were smaller at low speed (30-50 kph) and larger at middle speeds (50-70 kph) compared with read world driving conditions, braking headway distances in the simulator were generally very close to those in real world at higher speeds (70-1 10 kph) (Suetomi et al, 19950)).
3.3.7. The JARI driving simulator
The Japan Automobile Research Institute (JARI) first started to design a driving simulator in 1990. It is an moving-base driving simulator based on the concept of distributing processing

systems (DPS). This means that a task is divided into subtasks and each subtask is processed in each intelligent subsystem respectively. The key issues is the communication and control s o h e that regulated the subsystems cooperatively. The advantages of DPS include cost- benefit regarding the size of computers; fault tolerance regarding the whole system failure; maintainability; flexibility and efficiency of program coding (distributed development environment) (Soma et al, 1996).
JARI driving simulator consists of the following subsystems: the principal subsystem (including the visual, motion and audio subsystem), the host computer subsystem (including the main and terminal computer and the interface unit), the supervisor subsystem and the measuring subsystem. The main's computer cycle time is 10 ms and the image's generator 16.7 ms (60 Hz) the cycle times are different, they developed a program called IG communication program with cycle time 20 ms (50 HZ) which converts the communication data. The communication between processes are asynchronous and they run in parallel.
Applications
The JARI driving simulator reached the application stage by 1996 therefore only limited number of experiments have been canied out.
to investigate the validation of JARI simulator using the lane change test (a double lane change course described by the ISO-TR3888) both on a test track using an instrumented vehicle and on the simulator (Soma et al, 1996). The test was conducted both with and without motion; to test the quality of simulated sound (Wakasugi et al, 1996).
3.3.8. The NADS driving simulator
The National Advanced Driving Simulator (NADS) is not in operation yet. It will be located at the University of Iowa's Oakdale Research Park, in Iowa City, Iowa, United States. The main purpose of this simulator is "to improve highway safety through a better understanding of driver-centred human factors issues during the complex interaction of the driver, vehicle and highway environment" (information obtained from the www and ITS, 1996). The estimated cost is approximately $35 million.
The subsystems of NADS will be: a) motion system: a six degrees of eeedom hexapod will provide 62 ft lateral motion and 62ft
longitudinal motion and * 360 degree yaw turnable. There will be a low frequency motion system with large x-y and yaw excursion and smoothness and a high frequency motion system with road roughness cues up to 50 Hz and discreet object encounters;
b) visual system: 360" forward field of view, left, right and rear mirrors and dense traffic scene simulation with ultra-high resolution insets;
c) it will be reconfigurable, have multiple cabs (cars, trucks and buses) and the change time will be 1 hour.
Capabilities
to study crash avoidance behaviour and cany out related accident reconstruction to study and evaluate advanced vehicle communication, navigation and control technologies (part of the Intelligent Transportation System (ITS)) and therefore develop effective strategies and countermeasures for improved crash avoidance and reduce injuries and fatalities to conduct highway engineering and design research relative to tr&c safety, evaluate alternative designs for intersections, entrances and exits, tunnels and bridge alignments, traffic control devices and highway signing.
4. References
Alicandri, E. (1994). HYSIM: the next best thing to being on the road. Public Roads 57(3) pp. 19-23.
Alicandri, E., Roberts, K. and Walker, J. (1986). A validation study of the DOT/FHWA highway simulator (HYSIM). US Department of Transport, Federal Highway Administration. FHWA/RD-861067.
Allen, R.W., Klein, R.H. and Ziedman, K. (1979). Automobile research simulators: a review and new approaches. Transportation Research Board 706. pp.9-15.
Allen, R.W. and Jex, H.R. (1980). Driving simulation - Requirements, Mechanisation and Application. SAE Paper No 800448.
Allen, R.W., Mitchell, D.G., Stein, A.C. and Hogue, J.R. (1991). Validation of real-time man- in-the-loop simulation. VTI Rapport. No 372A, Part 4. pp.18-31.
Allen, R.W. and Rosenthal, T.J. (1994). Requirements for vehicle dynamics simulation models. SAE Technical Paper Series. No 940175.
Alm, H. (1995). Driving simulators as research tools - a validation study based on the VTI driving simulator. Unpublished.
Alm, H. and Nilsson, L. (1991). Changes in driver behaviour as a knction of handsflee mobile telephones: a simulator study. VTI Report No 175. Linkoping, Sweden.
Ashkenas, I.L. (1986). Collected flight simulation and simulator induced sickness. AGARD. Flight Simulation.
Barrett, G.V. and Thornton, C.L. (1968). Relationship between perceptual style and simulator sickness. Joumal of Applied Psychology. Vol. 52(4). pp.304-308.
Bernasch and Hiinel (1995). The BMW driving simulator used for the development of a driver-biased adaptive cruise control. Driving Simulator Conference '95. Sophia Antipolis, France. September. pp. 123-13.
Bertollini, G.P., Johnston, C.M., Kuiper, J.W., Kukula, J.C., Kulczycka, M.A. and Thomas, W.E. (1994). The General Motors driving simulator. SAE Technical Paper Series. No 940179.
Blaauw, G.J. (1982). Driving experience and task demands in simulator and instrumented car: a validation study. Human Factors 24(4). pp.473-486.
Blana, E. (1996). The Leeds Advanced Driving simulator: three years in operation. Working Paper No 472. Institute for Transport Studies. University of Leeds. England.
Brown, J.L. (1975). Visual elements in flight simulator. Report of working Group 34. Washington DC: Committee on Vision, Assembly of Behavioural and Social Sciences. National Research Council. National Academy of Sciences.
Carsten, 0.M.J and Gallimore, S. (1993). The Leeds driving simulator: a new tool for research in driver behaviour. Fifth International Conference on Vision in Vehicles, Glasgow.
Casali, J.G. and Frank, L.H. (1986). "Perceptual distortion and its consequences in vehicular simulation: Basic theory and incidence of simulator sickness". In TRB (eds.) Vehicular Simulation and User Behavioural Studies. Washington, D.C.: Transportation Research Board, National Research Council. pp. 57-65. TRR 1059.
Casali, J.G. and Wierwille, W.W. (1980). The effects of various design alternatives on moving-base driving simulator discomfort. Human Factors 22(6). pp.741-756.
Casali, J.G. and Wierwille, W. (1986). Potential design etiological factors of simulator sickness and a research simulator specification. Transportation Research Record 1059. pp.66- 74.
Davis, B.T. and Green P. (1995). Benefits of sound for driving simulation: an experimental evaluation. Technical Report UMTRI-95-16.
Detalle, S., Rousset, M. and Voillequin, T. (1994). SARA -Real time vehicle dynamics models and generation tools. In Proceedings of the Driving Simulation Conference (RTS'94). Paris, Jan. 11-14. Neuf AssociBs. pp.78-93.
Drosdol, J., I<iid'ig, W. and Panik, F. (1985). The Daimler-Benz driving simulator, new technologies demand, new instruments. Proceedings of the 9th IAVSD Symposium on Dynamics of Vehicles on Roads and Trucks. Liioping, Sweden
Drosdol, J. and Panik, F. (1985). The Daimler-Benz driving simulator: a tool for vehicle development. SAE, The Engineering Resource For advancing Mobility, No 850334. International Congress & Exposition, Detroit, Michigan
Duncan, B. (1995). Calibration trials of TRL driving simulator. Transport Research Laboratory. Unpublished Project report. PA/3079/95. S221AIRB.
Duncan, B. and Eves, G. (1995). TRL Driving simulator calibration trials. DSC'95, Sophia Antipolis, 12-13 September.
Gallimore, S. (1993). Building road networks for use in the Leeds Driving Simulator. ITS Working paper. No 389
Gallimore, S. (1996). Adding behaviour to graphical elements in the Leeds driving simulator: an object based approach. Proceedings of the Symposium on the Design and Validation of Driving Simulators. Valencia, Spain, 21 May
Gauriat, P. (1993). Le simulateur automobile SARA. Transport Environment Circulation. No 120. Sept.-Oct. 1993. pp. 21-23.
Gillespie, T.D., Mac Adam, C.C. and Hu, G.T. (1980). Truck and tractor-trailer dynamic response simulation. TC DRS:Vl. Users Manual. FHWA-RD-79-125.
Greenberg, J.A and Park, T.J. (1994). The Ford driving simulator. SAE Technical Paper Series. No. 940176.
Guiso, A, Moccagatta, G., Morello, E. and Varalda, G. (1995). Traffic simulation in the FIAT research driving simulator: development and perspectives. DSC'95, Sophia Antipolis, France, 12-13 September. pp.260-270.
Guyard, I. and Boulanger, 0. (1992). The driving simulator as a means to assist human engineering in the design of car interiors. Proceedings of the 1992 FISITA Conference, London 7-1 1 June. C3891294. pp. 87-94.
Hahn, S. and Kalb, E. (1987). The Daimler-Benz driving simulator set-up and results of first experiments. Proc. of the 1987 Summer siimulation Conference, San Diego, CA
Hahn, S. and Kading, W. (1988). The Daimler-Benz Driving Simulator- Presentation of Selected Experiments. SAE, The Engineering Society For Advancing Mobility Land Sea Air and Space. SAE 41 197.20. International Congress and Exposition, Detroit, Michigan.
Hahn, S., Mert, M. and Uding, W. (1989). The Daimler-Benz driving simulator. Using Digital Signal Processor Technology to Generate Realistic Noise. Proceedings of the 2nd Automotive and Allied Industries Symposium. Bursa, Turkey. 23-26 May.
Harms, L. (1989). Subjects' task performance, speed and cognitive load as a function of task demands in driving simulation. Proceedings of the 3rd Conference on Vision in Vehicles, Aachen, 11-15 September.
Harms, L. (1993). Driving Performance on a real road and in a driving simulator: results of a validation study. Proceedings of the 5th International Conference on Vision in Vehicles, Glasgow.
Haug, E.J. et al(1990). Feasibility study and conceptual design o a national advanced driving simulator. Centre for Simulation and Design Optimisation of Mechanical Systems. College of Engineering. The University of Iowa. Iowa city. W-10...W-37.
Hein, C.M. (1993). Driving simulators: six years of hands-on experience at Hughes Aircraft Company. Proceedings of the Human Factors and Ergonomics Society. 37th Annual Meeting.
Hogema, J.H. (1992). Effects of compensation for delay in the visual display of a driving simulator. Report I D 1992 A-40. TNO Institute for Perception. Soesterberg. The Netherlands.
Hogema, J.H., van der Horst, A.R.A. and Bakker P.J. (1993). Chevron markings on the A59 and driving behaviour in fog (in Dutch). Rapport IZF 1993 C-9. TNO Institute for Perception. Soesterberg. The Netherlands.

Hogema, J.H., van der Horst, A.R.A. and Janssen, W.H. (1994). A simulator evaluation of diierent forms of intelligent cruise control. TM 1994 C-30. TNO Institute for Perception. Soesterberg. The Netherlands.
Horiguchi, A. and Suetomi, T. (1995). A Kansei Engineering approach to a driver/vehicle system. International Journal of Industrial Ergonomics 15. pp.25-37.
van der Horst, A.R.A. (1990). A time-based analysis of road user behaviour in normal and critical encounters. TNO Institute for Perception. Soesterberg. The Netherlands.
van der Horst, A.R.A. and Brown, G.R. (1989). Tie-to-collision and driver decision-making in braking. IZF 1989 C-23. TNO Institute for Perception Report. Soesterberg. The Netherlands.
van der Horst, A.R.A and Hoekstra, W. (1993). The perception of chevrons in fog: a simulator study (in Dutch). Report IZF 1993 C-10. TNO Institute for Perception. Soesterberg. The Netherlands. (cited in Kaptein et 4 1995(a)).
van der Horst, R., Janssen, W. and Korteling, J.E. (1991). Measuring effects of variable message signing on route-choice and driving behaviour. VTI Rapport 372A.
Van der Horst, A.R.A. and Wilmink, A. (1986). Drivers' decision-making at signalised intersections: An optimisation of the yellow timing. Traffic Engineering + Control 27(12). pp.615-212.
Hummer, J.E. (1989). Supplemental interchange signing and driver control behaviour. Transportation Research Record, No 1213.
ITS, America (1996). Institute for Education and Training. Driving simulators. July.
Janssen, W.H., van der Horst, A.R.A. and Hoekstra, W. (1991). A simulator study into the effects of variable message signing on route choice and driving behaviour (in Dutch). Report 1991 C-5. TNO Institute for Perception. Soesterberg. The Netherlands. (cited in Kaptein et al, 1995(a)).
Janssen, W.H., van der Horst, A.R.A. and Hoekstra, W. (1992a). Descriptive information presentation on variable message signs (in Dutch). Report IZF 1992 C-7. TNO Institute for Perception. Soesterberg. The Netherlands. (cited in Kaptein et al, 1995(a)).
Janssen, W.H., van der Horst, A.R.A. and Hoekstra, W. (1992b). Effects of variable message signing on route choice and driving behaviour: the influence of time loss and the presence of other traffic (in Dutch). TNO Technische Menskunde. Soesterberg. The Netherlands. (cited in Kaptein et al, 1995(a)).
Kading, W. (1995). The Advanced Daimler-Benz driving simulator. PC-8 Technical Paper No 9530012. Society of Automotive Engineers of Japan, Inc.
Kaptein, N.A., van der Horst A.R A., and Hoekstra, W. (1994). Visual information in a driving simulator: a study on braking behaviour and Time-To-Collision. In preparation. TNO
Human Factors Research Institute. Soesterberg. The Netherlands. (cited in Kaptein et al, 1995).
Kaptein, N.A., Theeuwes, J. and van der Horst R. (1995(a)). Driving simulator validity: some considerations. Unpublished. TNO Human Factors Research Institute.
Kaptein, N.A., Theeuwes, J., van der Horst, R. and ven Velze R. (1995@)). Behavioural evaluation of tunnel design characteristics. DSC'95, Sophia Antipolis, France, 12-13 September. pp.410-420.
Kelada, J. and Kemeny, A. (1995). Event-driven traffic generation -a tool for testing on-board driver assistance systems on driving simulator. Proceedings of the 3rd International Conference: Vehicle comfort and ergonomics, March 29-31, Bologna, Italy. No 95A1040. pp.317-325.
Kemeny, A. (1993). A cooperative driving simulator. In proceedmgs of the 1993 ITEC Conference. London 4-6 May. pp 67-71.
Kemeny, A. and Piroid, J.M. (1991). A simulator for cooperative driving. Proc. of the DRIVE Conference, Vol. 11.
Kemeny, A. and Reymond, G. (1994). Automotive training simulator for driver safety enhancement. Proceedings of the 1994 Image W conference. Tuscon, Arizona, 12-17 June.
Kuiken, M.J. and Miltenburg, P.G.M. (1993). Evaluation of the GIDS prototype in the small world driving simulator. Drive project V1041 (GIDS). Hare: Verkeerslcundig Studiecentmm.
Laueu, H. and Tomros, J. (1986(a)). Carry-over effects on driving performance of benzodiazepines with short elimination half-lives in comparison with nitrazepam and placebo. In Drugs and Driving. (Eds.) O'Hanion and de Gier. Taylor and Francis. London. pp. 11 1-121. (cited in Nilsson, 1989).
Laurell, H. and Tornros, J. (1986(a)). The carry-over effects of triazolam compared with nitrazepam and placebo in acute driving situations and in monotonous driving. Acta Pharmacologica et Toxicologica 58. pp.182-186. (cited in Nilsson, 1989).
Laurell, H. and Tomros, J. (1987). Hypnotic drug-alcohol interaction effects on simulated driving performance. In Alcohol, Drugs and Traffic Safety - T86. Ed. Noordzij & Rosbach. Elsevier Science Publishers B.V., Amsterdam. pp.207-210. (cited in Nilsson, 1989).
Logan, G.D. (1988). Toward an instance theory of automatization. Psychological Review 95. pp.492-527.
Mac Adam, C.C., Green, P.A. and Reed, M.P. (1993). An overview of current UMTRI driving simulators. UMTRI Research Review 24(1). University of Michigan Transportation Research Institute.
Malaterre, G. (1995). Comparison between simulation and actual driving situations: some experiments. DSC'95. TEKNEA, Toulouse. France. pp.60-76.
Malaterre, G. (1996). Personal communication.
McLane, R.C. and Wienville, W.W. (1975). The influence of Motion and Audio Cues on Driver Performance in an Automobile Simulator. Human Factors 17(5). pp.488-501.
Mollenhauer, M.A. et a1 (1994). "The effects of sensory modality and information priority on in-vehicle signing and information systems". In HFES (eds.). Proceeding of the Human Factors and Ergonomics Society 38th Annual Meeting. Santa Monica. CA: HFES.
Morel-Guillemaz, J. (1995). E.S.T.E.R. A driving simulation environment for automotive research and studies. Unpublished. Please contact RENAULT simulation team.
Morkn, B., Landstrom, U., Nilsson, L., Sandberg, U. and Tornros, J. (1988). The influence of noise, infrasound and temperature on driver performance and wakeklness - A driving simulator study). VTI Rapport 340. (cited in Nilsson, 1989).
Morrison, J.E. (Ed), (1991). Training for pedonnance: Principles of Applied Human Learning. Wiiley Series in Human Performance and Cognition. pp. 18 1-240
Nilsson, L. (1989). The VTI driving simulator. VTI Report 150. Lioping, Sweden.
Nilsson L. (1993). Behavioural research in an advanced driving simulator- Experiences of the VTI system. VTI Report 197. Linkiiping, Sweden.
Nilsson L. and Alm, H.(1991). Effects of mobile telephone use on elderly drivers' behaviour - including comparisons to young drivers' behaviour. VTI Report 176. Lioping, Sweden.
Nordmark, S. (1992). The New Trygg hansa Truck driving simulators. AVEC. No 187. Japan.
Olson, P.L. (1993). Vision and perception in automotive ergonomics. Ed. Peacock, B. and Karkowski. W. Taylor & Francis publishers. London. pp. 161-183.
Puig, J.A. (1984). Engineering design aspects of simulator after-effects. Draft Technical Report. Naval Training Equipment Centre. Orlando. Florida.
Pyne, H.C., Dougherty, M.C., Carsten, O.M.J. and Tight, M.R. (1995). A simulator based evaluation of speed reduction measures for rural arterial roads. ITS Working Paper 434. University of Leeds, UK.
Reed and Green (1995). Validation of a low-cost driving simulator using a telephone dialling task. UMTRI-95-19.
Repa, B.S. and Bertollini, G.P. (1990). Driving simulators and automotive engineering. Proceedings of the second seminar in Transportation Ergonomics. October 1990. Canada. pp. 51-63.
Repond, G. (1995). Implementation of a low-cost, two degrees of freedom motion system in a car driving simulator. Proc. Driving Simulator Conference 1995. TEKNEA. Toulouse. France. pp.142-55.
Riemersma, J.B.J., van der Horst, A.R.A. and Hoekstra, W. (1990). The validity of a driving simulator in evaluating speed-reducing measures. Traffic Engineering + Control. pp.416-420.
Roberts, K.M. (1980). The FHWA highway driving simulator. Public Roads 44(3)
Roscoe, S.N. (1980). Aviation Psychology, Ames, IA: The Iowa State University Press.
Rothengatter, J.A. and Heino, A. (1994). Safety evaluation of collision avoidance systems. In ERTICO (ed.), Towards an intelligent transport system. Proceedings of the First World Congress on applications of transport telematics and intelligent vehicle-highway system. Artech House, Boston. pp.2047-2054.
Schill, V. and Kiiding, W. (1990). The Daimler-Benz driving simulator. Research for road safety and traffic environment. Proceedings of the International Conference on Road Safety and Traffic Environment in Europe. Gothenburg, Sweden, 26-28 September.
Semple, C.A. (1981). Simulator Training Requirements and Effectiveness Study (Stress). US Air Force Report AFHRL-TR-80-63.
Servignat, C, Flores, J., Kemeny, A. and Vernet, M. (1995). The role of a driving simulator in an ergonomic procedure: the case of an on-board aid system. Proc. Driving Simulator Conference 1995. TEKNEA. Toulouse. France. pp.79-93.
S icor i , J.B. (1967). V/STOL Ground-based simulation techniques. USAAVLABS Technical Report 67-55. US Army Aviation Material Laboratories. Fort Eustis. Va. Norair Division. Northrop Corporation. Hawthorne. Calif. Nov.
Smith, E. and Laurell, H. (1987). Driver simulator validity as a function of steering dynamics and task demands. Proceedings of the Annual Conference of the Human Factors Association of Canada. pp. 233-236. (cited in Nilsson, 1989).
Soma, H., Hirarnatsu, K., Satoh, K. and Uno, H. (1996). System architecture of the JAR1 driving simulator and its validation. Proceedings of the Symposium on the Design and Validation of Driving Simulators. Valencia, Spain, 21 May.
Stapleford, R.L. (1968). Multi-modality pilot models for visual and motion cues. Proceedings of the fourth annual NASA-University Conference on Manual Control. University of Michigan. Ann Harbor. pp.47-57.
Stein, A., Allen, R.W., and Parseghian, Z. (1992(a)). The use of low-cost driving simulators to detect impaired drivers. In Monroe, E.G. ed. Proceedings of the 1992 Image VI Conference. Phoenix, AZ: Image Society, pp.373-383.
Stein, A,, Allen, R.W., and Parseghian, Z. (1992(b)). The use of low-cost interactive driving simulation to detect impaired drivers. In E. Hoffman & 0 . Evans (eds.). Unlocking Potential for the Future Productivity and Quality of Life. Melbourne, Australia: Ergonomics Society of Australia. pp. 100-107.
Stein, A,, Allen, R.W., Rosenthal, T.J. and Parseghian, Z. (1995). Applications of low cost driving simulators. Proceedings of the 1995 Driving Simulator Conference (DSC'95). Sophia Antipolis, France, 12-13 September. pp. 412-435.
Stoner, J.W. (1994). Ground vehicle simulator fidelity and selection of appropriate applications. Proceedings of the 1994 Driving Simulator Conference (DSC'94). Palais de Congres, Pre-Maillot, Paris, France, 11-14 January. pp. 69-77.
Suetomi T., Horiguchi, A, Okamoto, Y. and Hata, S. (1991). The driving simulator with large amplitude motion system. SAE Technical paper series No. 910113.
Suetomi, T., Kido, K., Yarnamoto, Y. and Hata, S. (1995). A study of collision warning system using a moving-base driving simulator. Proceedings o f t he 2nd World Conference on Intelligent Transport Systems '95. Yokohama. November 9-1 1. pp. 1807-1812.
Tenkink, E. (1989(a)). The effect of road width and obstacles on speed and course behaviour (in Dutch). Report IZF 1989 C-4. TNO Institute for Perception. Soesterberg. The Netherlands. (cited in Kaptein et 4 1995).
Tenkink, E. (19890)). The effect of lead vehicles on speed choice under restricted sight distances. Report IZF 1989 C-25. TNO Institute for Perception. Soesterberg. The Netherlands.
Thorndike, E.L. (1903). Educationalpsychology. NY: Lemcke and Buechner.
Tornros, J.(1996). Driving behaviour in a real and simulated tunnel. A validation study. In preparation (in Swedish). VTI. Linkoping, Sweden.
Tornros, J. and Laurell, H. (1987a). Hang-over effects of alcohol on driver performance in simulated driving. VTI Rapport 3 14. Linkiiping, Sweden.(cited in Nilsson, 1989).
Tornros, J. and Laurell, H. (1987b). Effects from extended heavy exercise combined with sleep deprivation on performance in simulated car-driving and simple reaction time. VTI Meddelande 520. Linkiiping, Sweden.(cited in Nilsson, 1989).
de Waard, D., Brookhuis, K.A., van der Hulst, M., van der Laan, J.D. (1994). Behaviour comparator prototype test in a driving simulator. Drive project V2009 (DETER). Haren. Verkeerskundig Studiecentrum.
Wakasugi, T., Satoh, K. and Hiramatsu, K. (1996). Simulation and sound quality of car interior noise for JAR1 driving simulator. Proceedings of the Japanese SAE Conference. No 961.
Watts, G.R. and Quimby, A.R. (1979). Design and validation of a driving simulator for use in perceptual studies. TRRL Laboratory Report 907.
Weir, D.H. and la&, A.J. (1995). A survey of mid-level driving simulators. SAE No 950172.

Weir, D.H. and Bourne, S.M. (1995). An overview of the DRI driving simulator. SAE No 950173.
Wienville, W.W. and Fung, P.P. (1975). Comparison of computer-generated and simulated motion picture displays in a driving simulator. Human Factors 17(6). pp.577-90.
van Winsum, W. and van WoIfTelaar, P.C. (1993). GIDS Small World Simulation. In Michon, J.A. (Ed.) Generic Intelligent Driver Support System. London: Taylor & Francis LtD.
van Wolffelaar, P.C. and van Winsum W. (1992). A new driving simulator including an interactive intelligent traffic environment. The 3rd International Conference on Vehicles Navigation and Information. pp 499 -506.
van Wolffelaar, P. and van Winsum, W. (1992). VSC-Rijsimulator: nieuw in veelzijdig onderzoeksinstument. Verkeerskunde 11.
van WoEelaar, P. and van Winsum, W. (1996). Driving Simulation and traffic scenario control in the TRC driving simulator. Symposium on the Design and Validation of Driving Simulators. Valencia, Spain. 21 May.
Yarnamoto, K. (1986). A better relationship between people and car. Keynote speech of 21st FISITA Congress.

5. Appendices
APPENDIX A: Comparative table of the described simulators
APPENDIX B: Useful addresses
APPENDIX C: Photographs
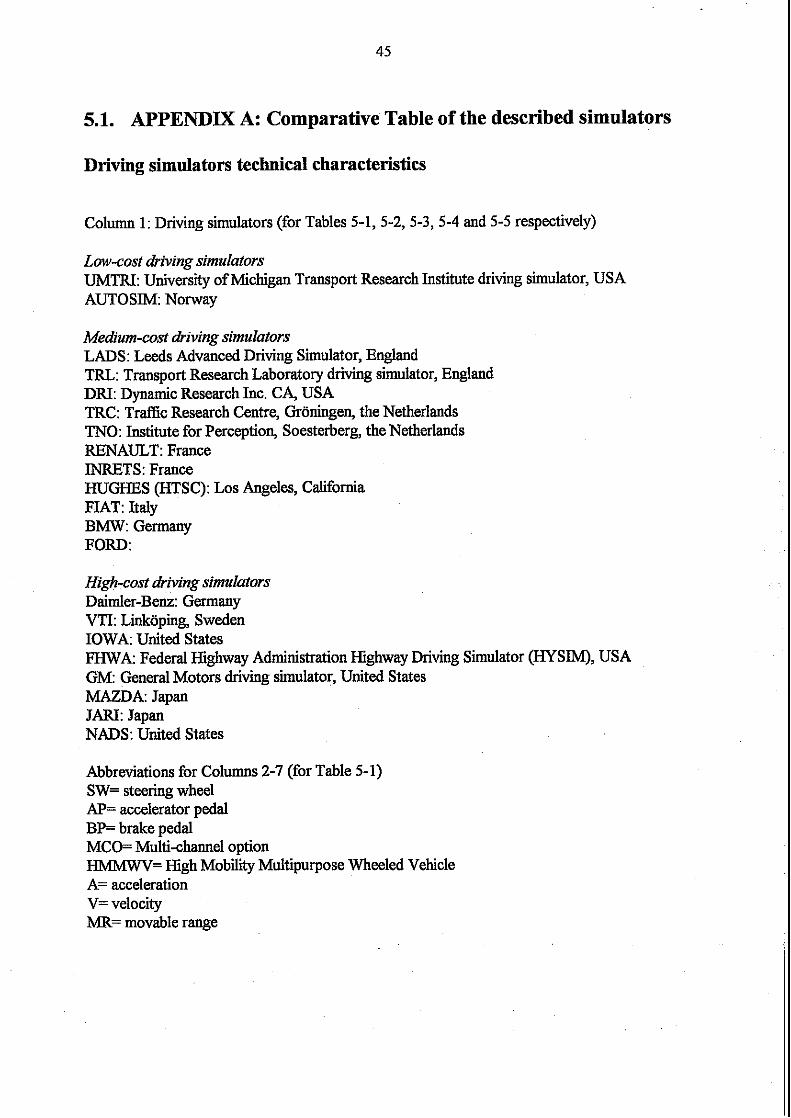
5.1. APPENDIX A: Comparative Table of the described simulators
Driving simulators technical characteristics
Column 1: Driving simulators (for Tables 5-1, 5-2, 5-3, 5-4 and 5-5 respectively)
Low-cost driving simulators UMTRI: University of Michigan Transport Research Institute driving simulator, USA AUTOSIM: Norway
Medium-cost driving simulators LADS: Leeds Advanced Driving Simulator, England T E : Transport Research Laboratory driving simulator, England DRI: Dynamic Research Inc. CA, USA TRC: Traffic Research Centre, Groningen, the Netherlands TNO: Institute for Perception, Soesterberg, the Netherlands RENAULT: France INRETS: France HUGHES @JTSC): Los Angeles, California FIAT: Italy BMW: Germany FORD:
High-cost driving simulators Daimler-Benz: Germany VTI: Linkoping, Sweden IOWA: United States FHWA: Federal Highway Administration Highway Driving Simulator (HYSIM), USA GM: General Motors driving simulator, United States MAZDA: Japan JARI: Japan NADS: United States
Abbreviations for Columns 2-7 (for Table 5-1) SW= steering wheel AP= accelerator pedal BP= brake pedal MCO= Multi-channel option HMMWV= High Mobility Multipurpose Wheeled Vehicle A= acceleration V= velocity MR= movable range
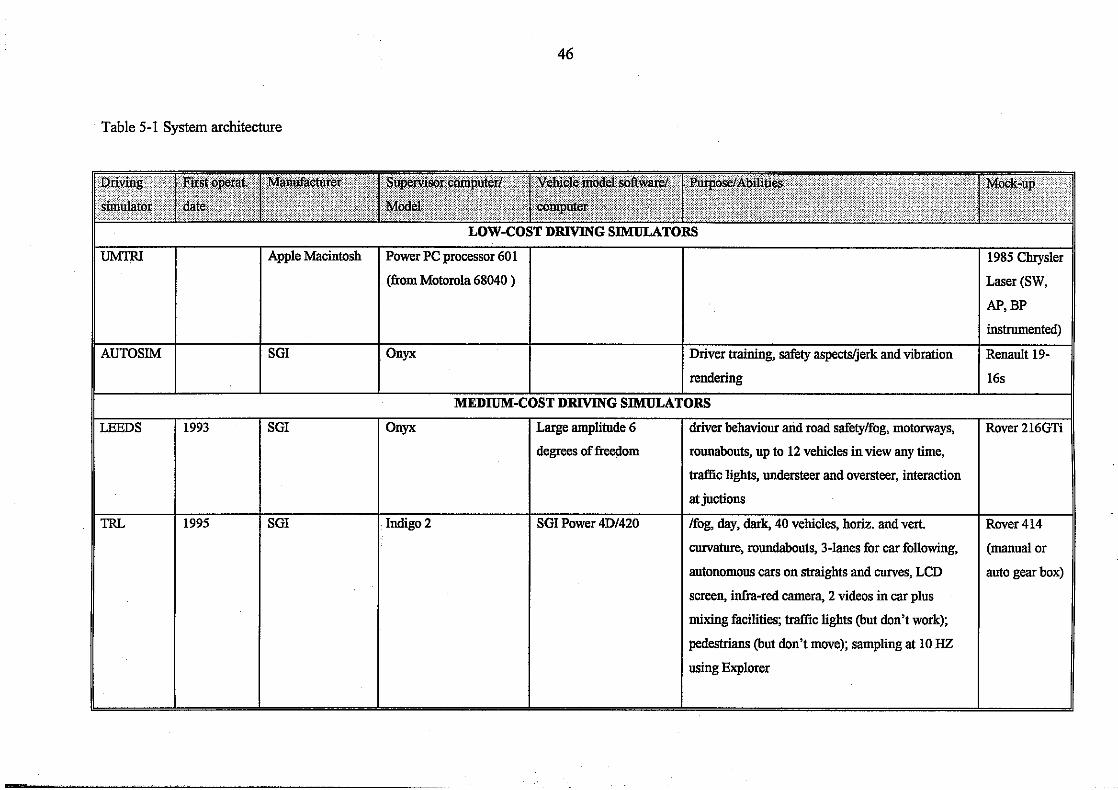
Table 5-1 System architecture
(from Motorola 68040 )
AUTOSIM
LEEDS
TRL
1993
1995
SGI onyx Driver training, safety aspedjerk and vlbrafion
rendering
MEDIUM-COST DRIVING SRWJLATORS
Large amplitude 6
degrees of freedom
SGI Power 4Dl420
instrumented)
Renault 19-
16s
SGI
SGI
onyx
Indigo 2
driver behaviour and road safetylfog, motorways,
rounabouts, up to 12 vehicles in view any time,
trafEic lights, understeer and oversteer, interaction
at juctions
/fog, day, dark, 40 vehicles, horiz. and vert.
curvature, roundabouts, 3-lanes for car following,
autonomous cars on straights and curves, LCD
screen, infra-red camera, 2 videos in car plus
mixing facilities; traflic lights (but don't work);
pedestrians (but don't move); sampling at 10 HZ
using Explorer
Rwer 216GTi
Rover 414
(manual or
auto gear box)
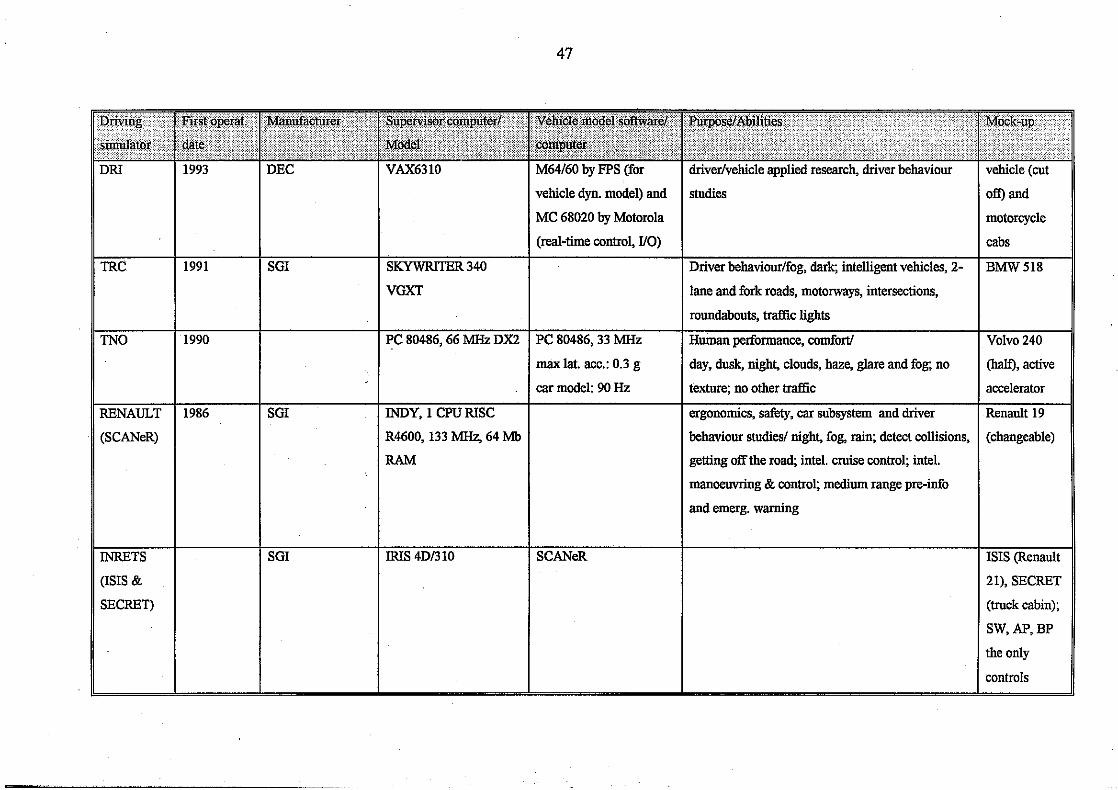
MC 68020 by Motorola
TRC
TNO
RENAULT
(SCANeR)
INRETS
(ISIS &
SECRET)
1991
1990
1986
SGI
SGI
SGI
SK-R 340
VGXT
PC 80486,66 MHz DX2
INDY, 1 CPU RISC
R4600,133 MHz, 64 Mb
RAM
IRIS 4D/3 10
PC 80486,33 MHz
max lat. acc.: 0.3 g
car model: 90 Hz
SCANeR
Driver behaviour/fog, dark; intelligent vehicles, 2-
lane and fork roads, motorways, intersections,
roundabouts, traffic lights
Hnman performance, comfortl
day, dusk, night, clouds, haze, glare and fog; no
texture; no other traffic
ergonomics, safety, car subsystem and driver
behaviour studied night, fog, rain, detect collisions,
getting off the road; intel. cruise control; intel.
manoeuvring & control; medium range pre-info
and emerg. warning
BMW 518
Volvo 240
(half), active
accelerator
Renanlt 19
(changeable)
ISIS (Renault
21), SECRET
(truck cabin);
SW, AP, BP
the only
controls


algorithm, program developmenffstopping and
VTI
IOWA
FHWA (2nd
generation)
1984
1992 (?)
1983
ENCORE
CCAD staff
SGI
Computer Systems
main comp: 2 CPU
RSX
8-processor Power PC
based on Harris
NightHawk NN4404
IRIS 4Dl35 TG
the d'Alemberts princ.
with 18-37' of freedom
22 degrees of freedom
Aliant FX2800
and reversing
Vehicle dynamics studies and driver behaviour
research/ different road surfaces, road horiz. and
vert. signing; sight distance: 3000m; day, fog, dark;
hor. and vert. curvature; other traffic
I intelligent vehicles &pedestrians; 40 semi-
autonomous vehicles; traffc control devices;
control lighting and weather conditions
driver-roadway interactions; image generation, RT
control, data processing1 day and night time; two
separate lanes; intersections; merges, diverges;
traffic signals, signs and obstacles; wind gusts; 3
other moving vehicles; vertical yaw
mirrorsavertical curvature
tmck)
1984 Volvo
240 Sedan
Ford T a w ,
GM Saturn
and a
HHMWW
Ford Fairmont
1980; can be
measured
driver
manipulation
of controls
esignMo dashboard instrumentation, no wing and
internal mirrors
- SARI 1990 (1996
applications'
year)
Corporation
p~ ~
SGI IRIS 4DI32Os main
IRIS Indigo xs24
terminal
including non-linear tire
and suspension charact.
(5 for longit., lat., roll,
pitch and yaw for body; 2
for steering front and
real wheels; 4 for 4-
wheel rotations; 1 for
engine rot.; integration
interval: 5 msec;
integration methods:
Adams-Bashforth
secondary process; Euler
method and transition
matrix process
vehicle model and
motion algorithms built
in house
situations1
based on the concept of distributing processing
\night, clouds, fog; flat and smooth shading; texture
mapping; inflared camera; physiological
measurements;
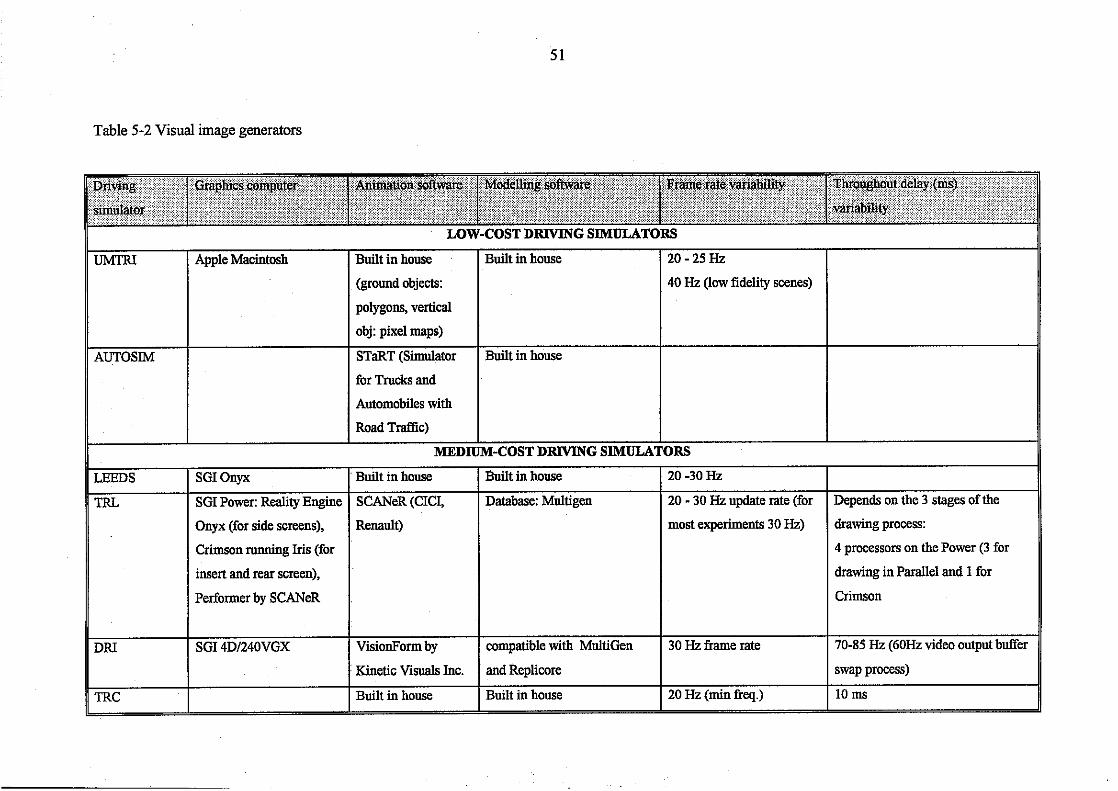
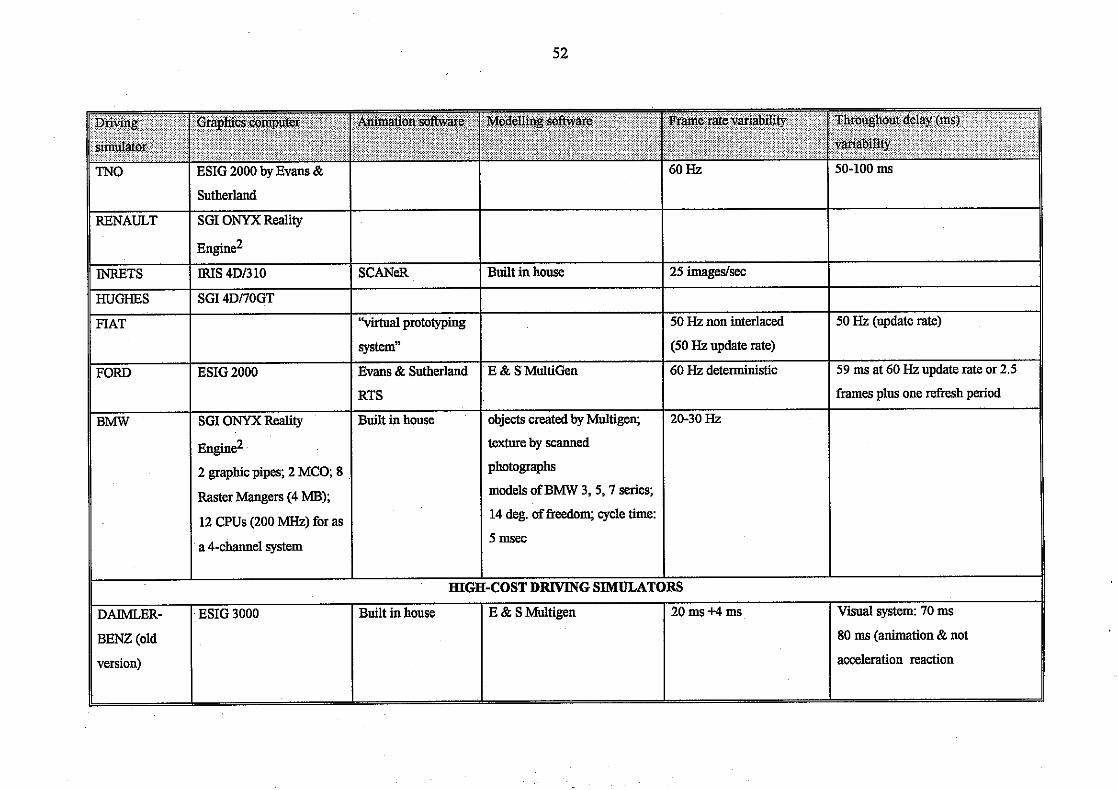
HUGHES
FIAT
FORD
BMW
DAIMLER-
BENZ (old
version)
SGI 4Dl7OGT
ESIG 2000
SGI ONYX Reality
~ n ~ i n e ~
2 graphic pipes; 2 MCO, 8
Raster Mangers (4 MB);
12 CPUs (200 MHz) for as
a 4-channel system
ESIG 3000
'kirtd prototyping
system"
Evans & Sutherland
RTS
Built in house
Built in house
E & S MultiGen
objects created by Multigen;
textnre by scanned
photographs
models of BMW 3, 5,7 series;
14 deg. offreedom; cycle time:
5 msec
HIGH-COST DRIVING SIMULATORS
E & S Multigen
50 Hz non interlaced
(50 Hz update rate)
60 Hz deterministic
20-30 Hz
50 Hz (update rate)
59 ms at 60 Hz update rate or 2.5
frames plus one refresh period
20 ms 4-4 ms Visual system: 70 ms
80 ms (animation & not
acceleration reamon
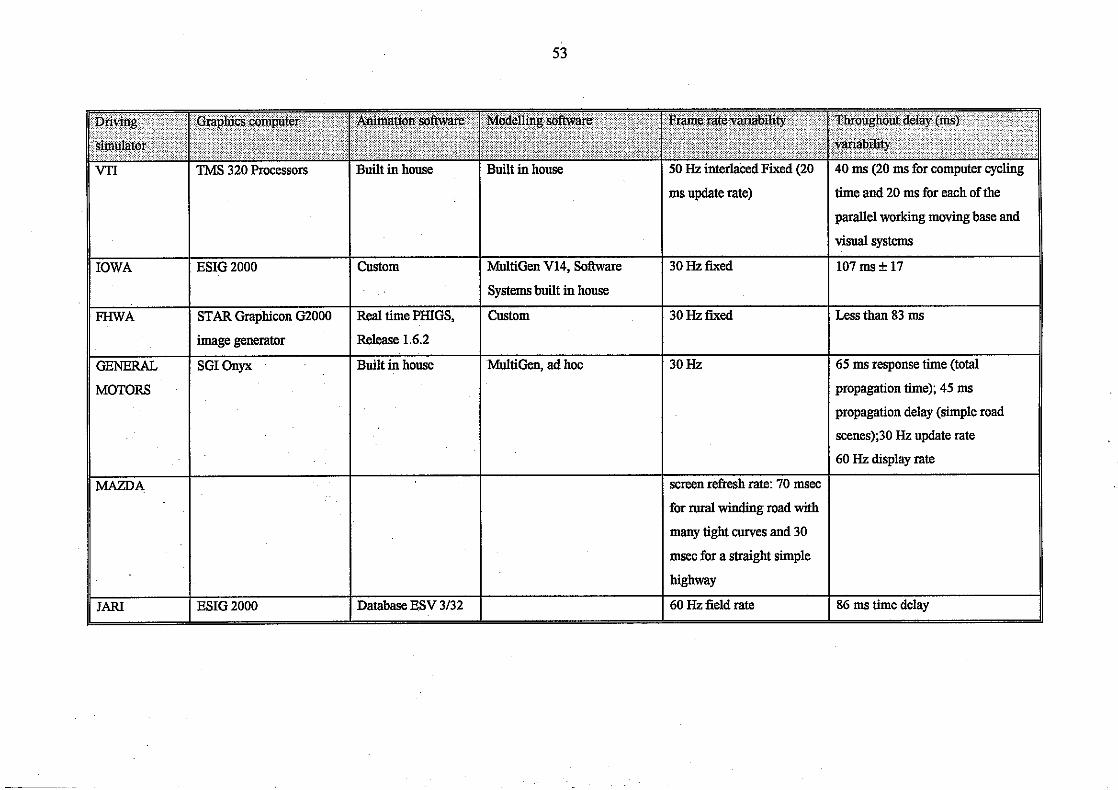
time and 20 ms for each of the
parallel working moving base and
IOWA
FHWA
GENERAL
MOTORS
MAZDA
JAR1
ESIG 2000
STAR Graphicon G2000
image generator
SGI Onyx
ESIG 2000
Custom
Real time PHIGS,
Release 16.2
Built in house
Database ESV 3/32
MultiGen V14, Software
Systems built in house
Custom
MultiGen, ad hoc
30 Hz fixed
30 Hz fuced
30 Hz
screen r&esh rate. 70 msec
for rural winding road with
many tight curves and 30
msec for a straight simple
highway
60 Hz field rate
107 ms f 17
Less than 83 ms
65 ms response time (total
propagahon time), 45 ms
propagation delay (simple road
scenes);30 Hz update rate
60 Hz dlsplay rate
86 ms time delay

Table 5-3 Projection system
960x680 two side and rear; anti-aliasing
(not in use all the time)
central mirrors
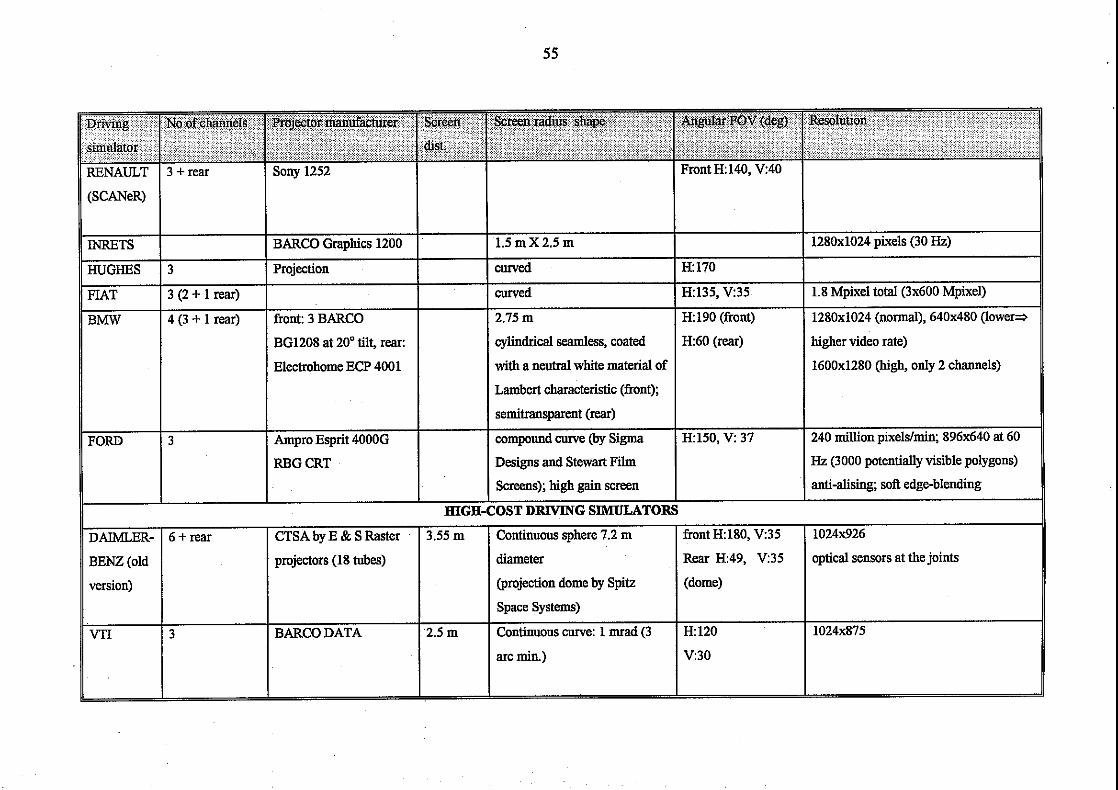
Electrohome ECP 4001 with a neutral white material of 1600x1280 @igh, only 2 channels)
Lambert characteristic (firont);
projectors (18 tubes)
(projection dome by Spitz
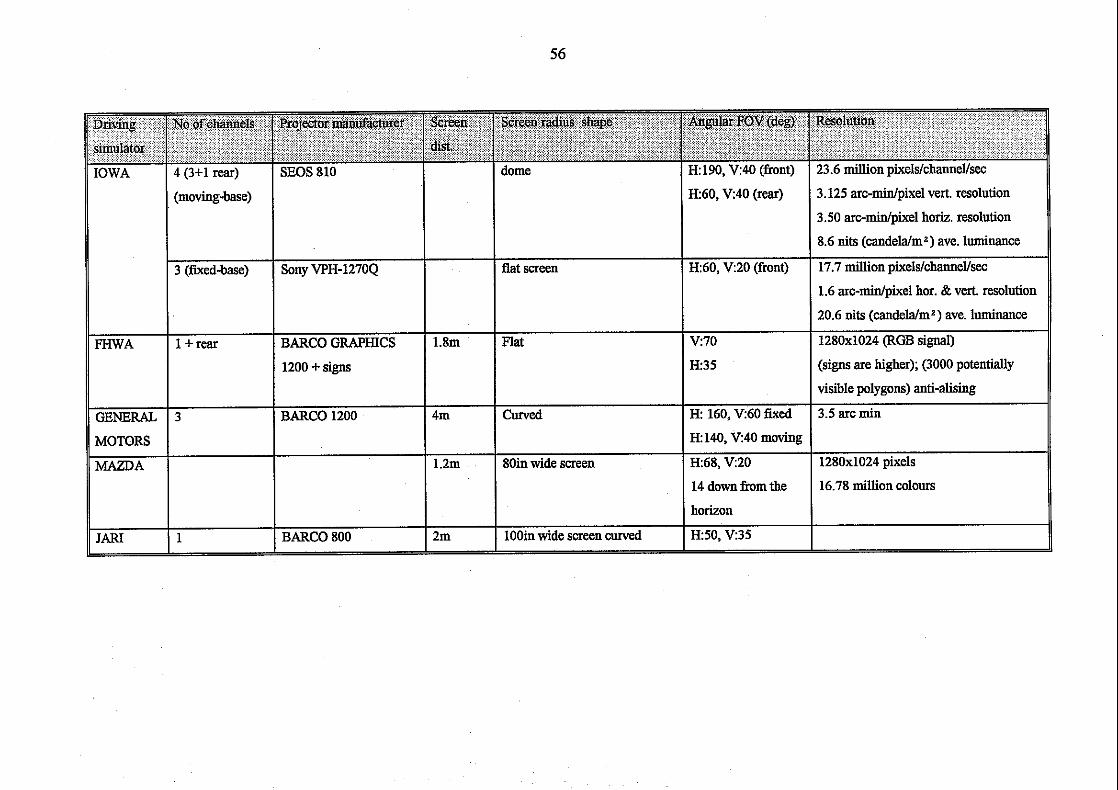
1.6 arc-minlpixel hot. & vert. resolution
(signs are higher); (3000 potentially
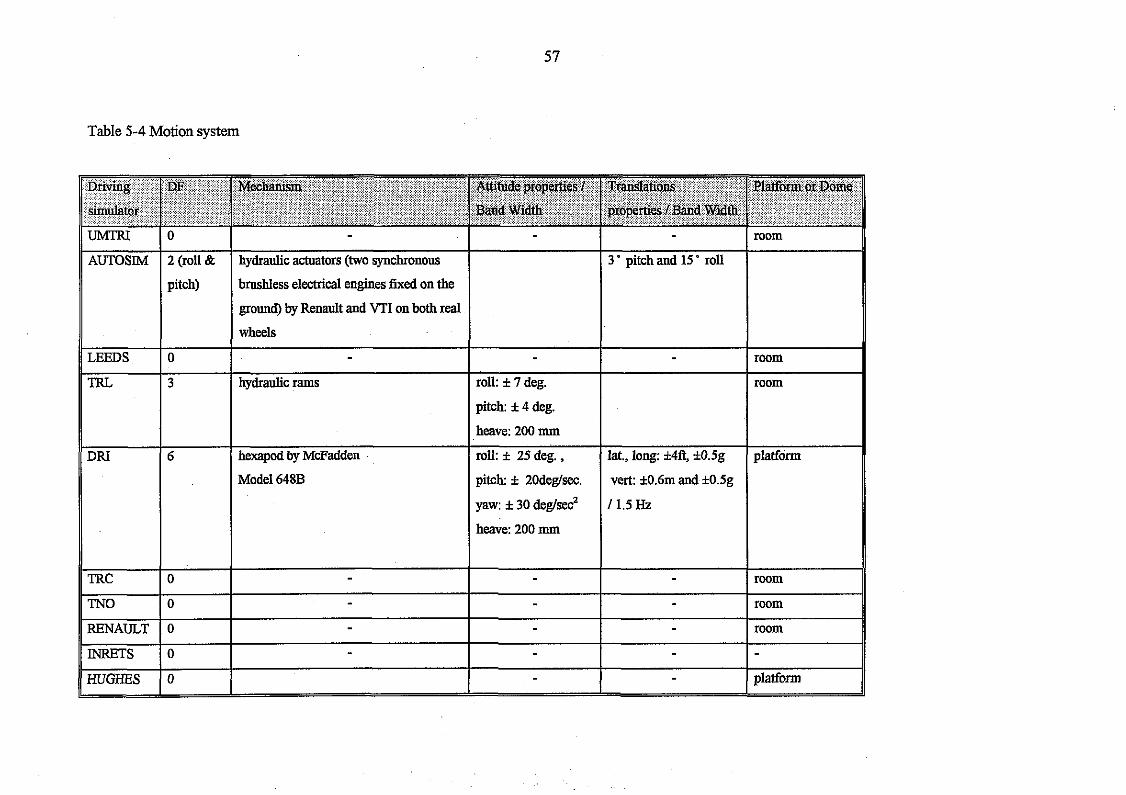
Table 5-4 Motion system
rushless electrical engines fixed on the
ground) by Renault and VTI on both real
LEEDS
TRL
DRI
TRC
TNO
RENAULT
INRETS
HUGHES
0
3
6
0
0
0
0
0
wheels
- hydraulic rams
hexaped by McFadden
Model 648B
- - - -
- roll: f 7 deg.
pitch: f 4 deg.
heave: 200 mm
roll: f 25 deg. ,
pitch: f 20deg!sec.
yaw: f 30 deg/sec2
heave: 200 mm
- - - - -
-
lat., long: &4ft, *0.5g
vett: f 0.6m and *0.5g
1 1.5 J3z
- - -
room
room
platform
room
room
room
- platform
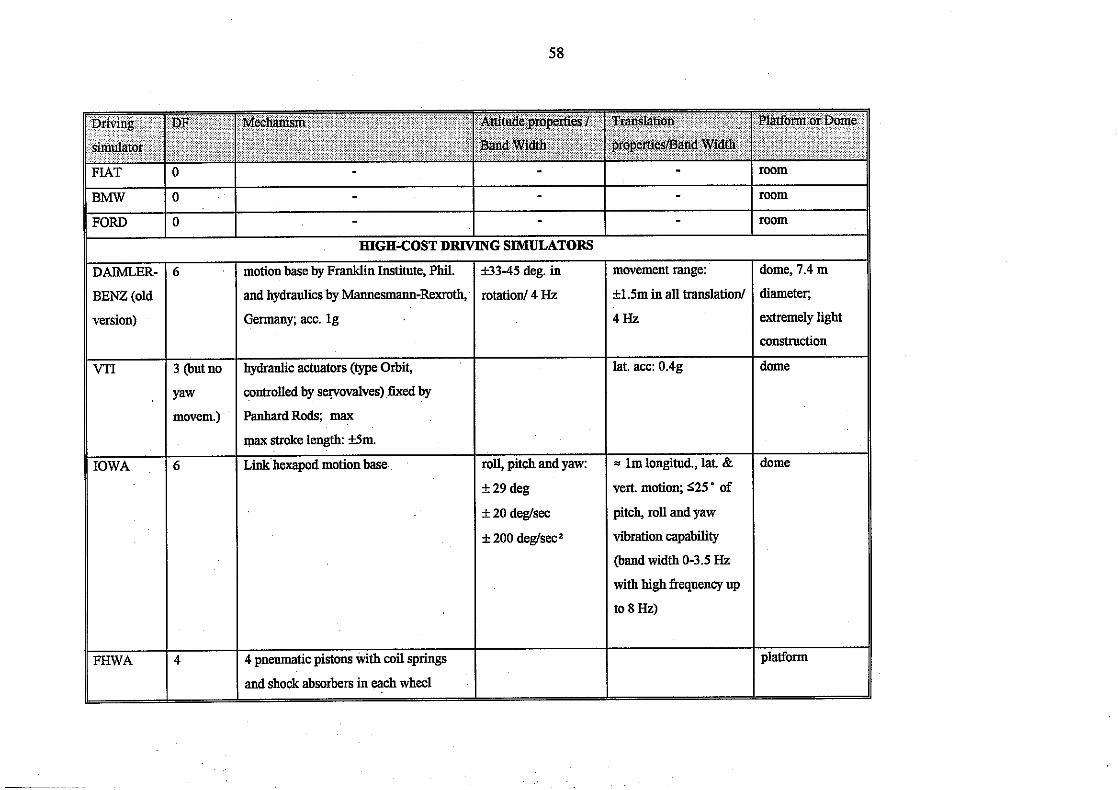
version)
VTI
IOWA
FHWA
3 (but no
Yaw
mwem.)
6
4
Germany; acc. l g
hydraulic actuators (me Orbit,
controlled by servovalves) fixed by
PanhardRods, max
max stroke length: k5m
Link hexapod motion base
4 pneumatic pistons with coil springs
and shock absorbers in each wheel
roll, pitch and yaw:
f 29 deg
f 20 deg/sec
i ZOO deg/secz
4Hz
lat. acc: 0.4g
J lm longitud., lat. &
vert. motion; 525 ' of
pitch, roll and yaw
vibration capability
(band width 0-3.5 HZ
with high frequency up
to 8 HZ)
extremely hght
constrncbon
dome
dome
platform
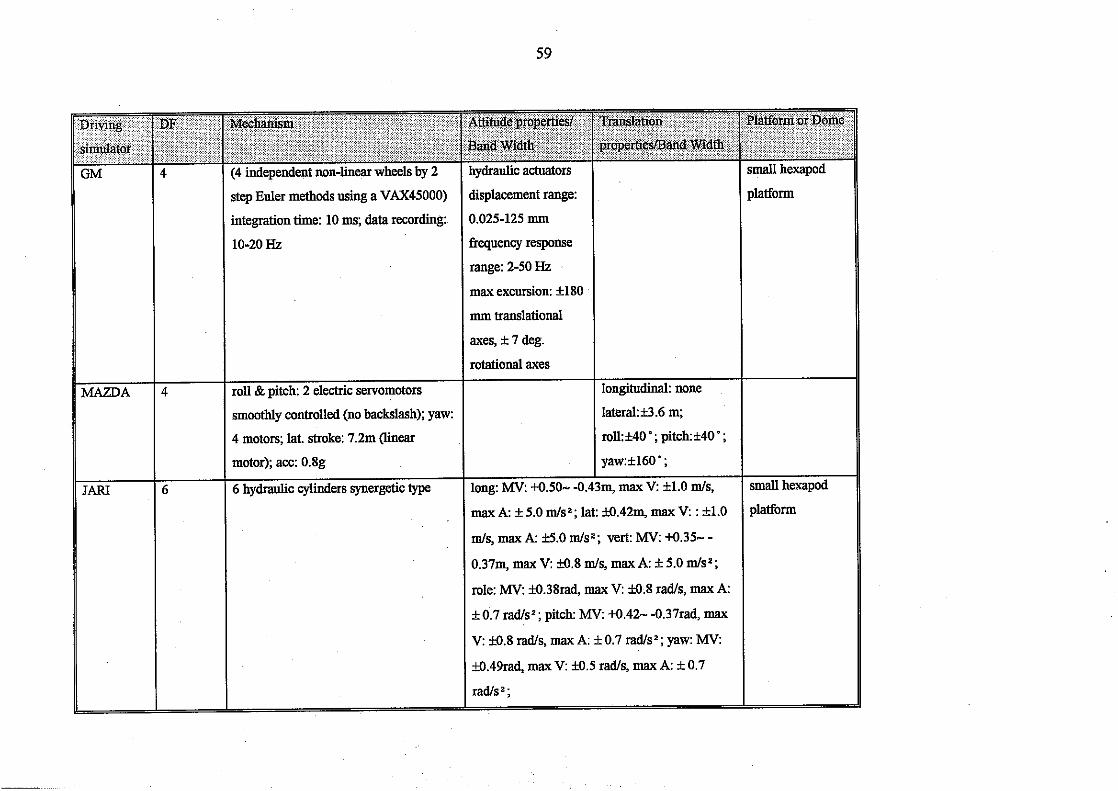
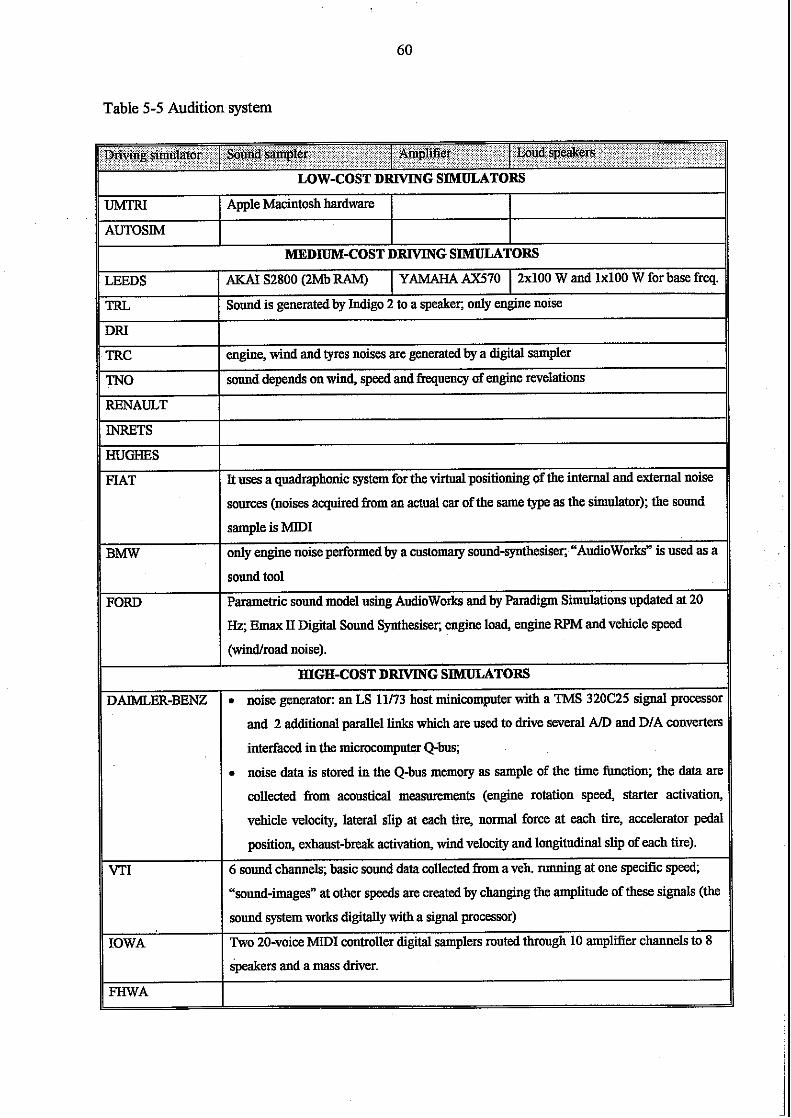
Table 5-5 Audition system
VTI
IOWA
EHWA
and 2 additional parallel links which are used to drive several A/D and DIA converters
interfaced in the microcomputer Q-bus;
noise data is stored in the Q-bus memory as sample of the time function; the data are
collected from acoustical measurements (engine rotation speed, starter activation,
vehicle velocity, lateral slip at each tire, normal force at each tire, accelerator pedal
position, exhaust-break activation, wind velocity and longitudinal slip of each tire).
6 sound channels; basic sound data collected from a veh. running at one specific speed;
"sound-images" at other speeds are created by changing the amplitude of these signals (the
sound system works digitally with a signal processor)
Two 20-voice MIDI controller digital samplers routed through 10 amplifier channels to 8
speakers and a mass driver.

sound pressure spectrum and Iwel change of sound pressure; a cross fade technique that
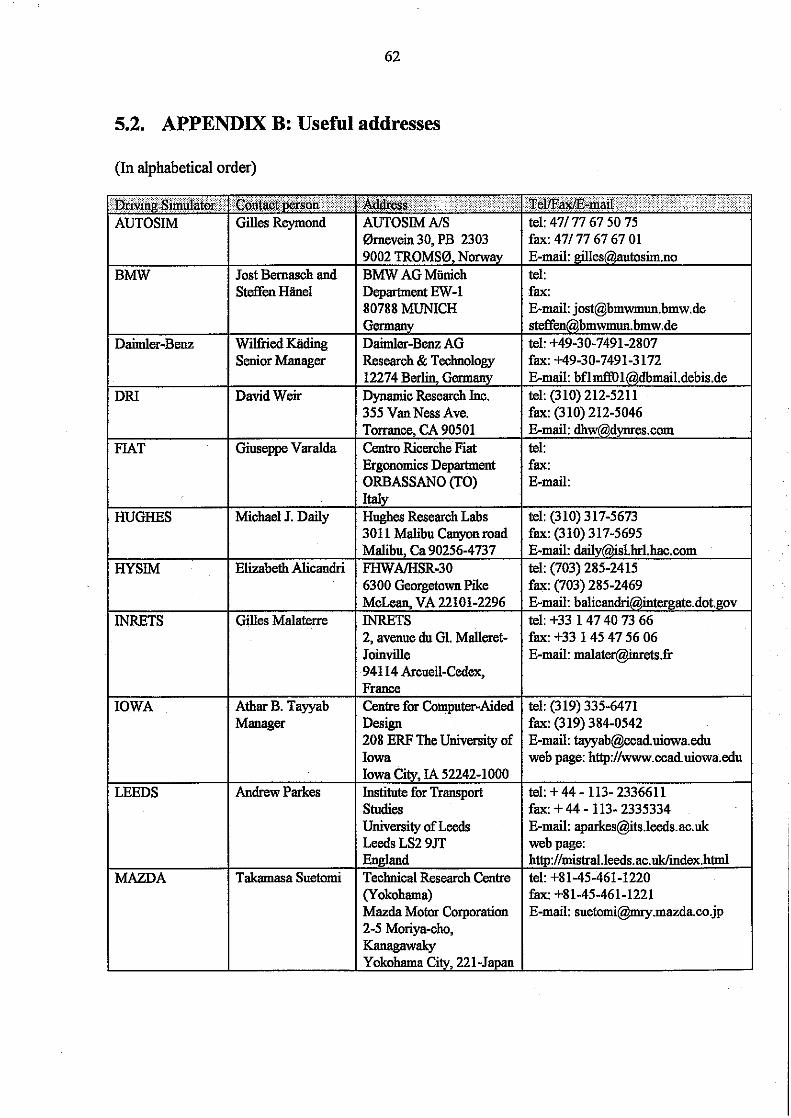
5.2. APPENDIX B: Useful addresses
(In alphabetical order)
FIAT
HUGHES
HYSIM
INRETS
IOWA
LEEDS
MAZDA
Centro Ricerche Fiat Ergonomics Department ORBASSAN0 (TO) Italy Hughes Research Labs 3011 Mahbu Canyonroad Malibu, Ca 90256-4737 FHWANSR-30 6300 Georgetown Pike McLean, VA 22101-2296 INRETS 2, avenue du G1. Malleret- Joinville 941 14 Arcueil-Cedex, France Centre for Computer-Aided Design 208 ERF The University of Iowa Iowa City, JA 52242-1000 Institute for Transport Studies University of Leeds Leeds LS2 9JT England Technical Research Centre (Yokohama) Mazda Motor Corporation 2-5 Moriya-cho, Kanagawaky Yokohama City, 221-Japan
Giuseppe Varalda
Michael J. Daily
Elizabeth Alicandri
Gilles Malaterre
Athar B. Tayyab Manager
Andrew Parkes
Takamasa Suetomi
tel: fax: E-mail:
te1: (310) 317-5673 fax: (310) 317-5695 E-mail: [email protected] tel: (703) 285-2415 fax: (703) 285-2469 E-mail: [email protected] tel. +33 147 40 73 66 fax: +33 1 45 47 56 06 E-mail: [email protected]
tel: (319) 335-6471 fax: (319) 384-0542 E-mail: [email protected] web page: http://www.ccad uiowa.edu
tel: + 44 - 113- 2336611 fax: + 44 - 113- 2335334 E-mail: [email protected] web page: http://mistral leeds.ac.uk/mdex.html tel: +8 1-45-461-1220 fax: +81-45-461-1221 E-mad: [email protected]
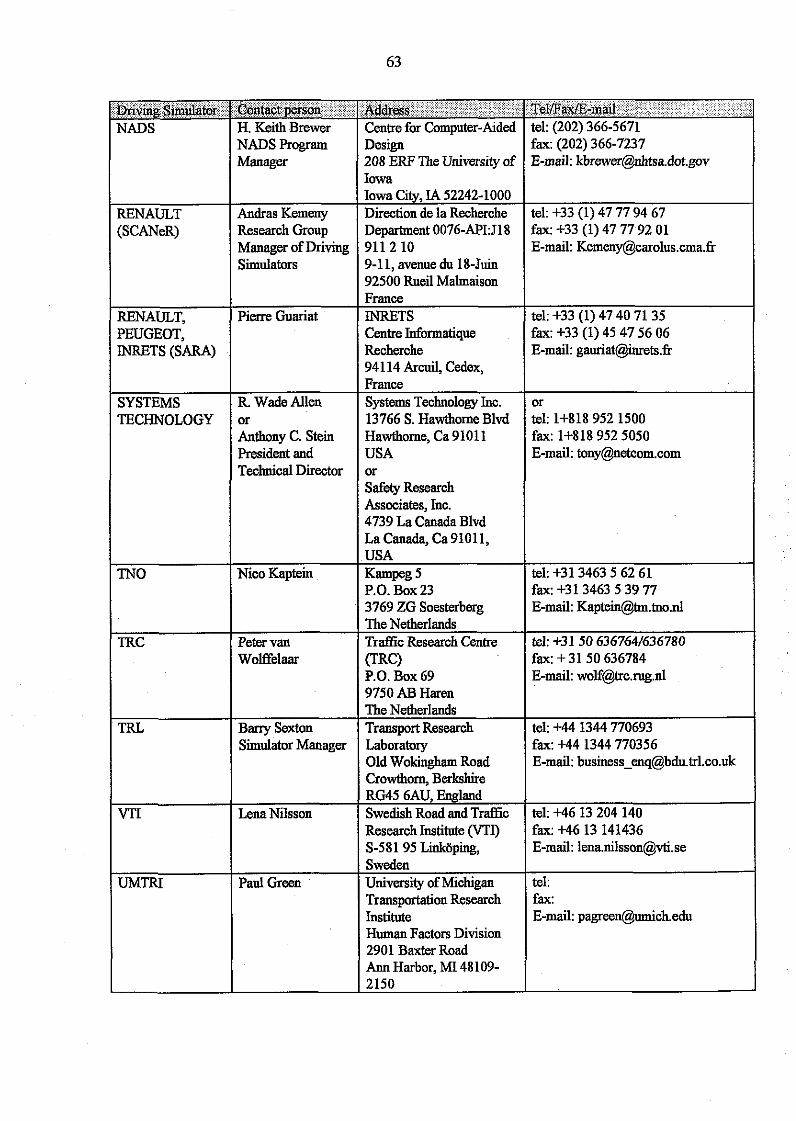
9-1 1, avenue du 18-Juin 92500 Rueil Malmaison
Centre Informatique
tel: 1+818 952 1500 fax: 1+818 952 5050 E-mail: [email protected]
Crowthorn, Berkshire a RG45 6AU, England
tel: +46 13 204 140 fax: +46 13 141436 E-mail: [email protected]
tel: fax: E-mail: [email protected]
Swedish Road and Traffic Research Institute (VTI) S-58195 Linkoping, Sweden University of Michigan Transportation Research Institute Human Factors Division 2901 Baxter Road Ann Harbor, MI 48 109- 2150
VTI
UMTRI
Lena Nilsson
Paul Green
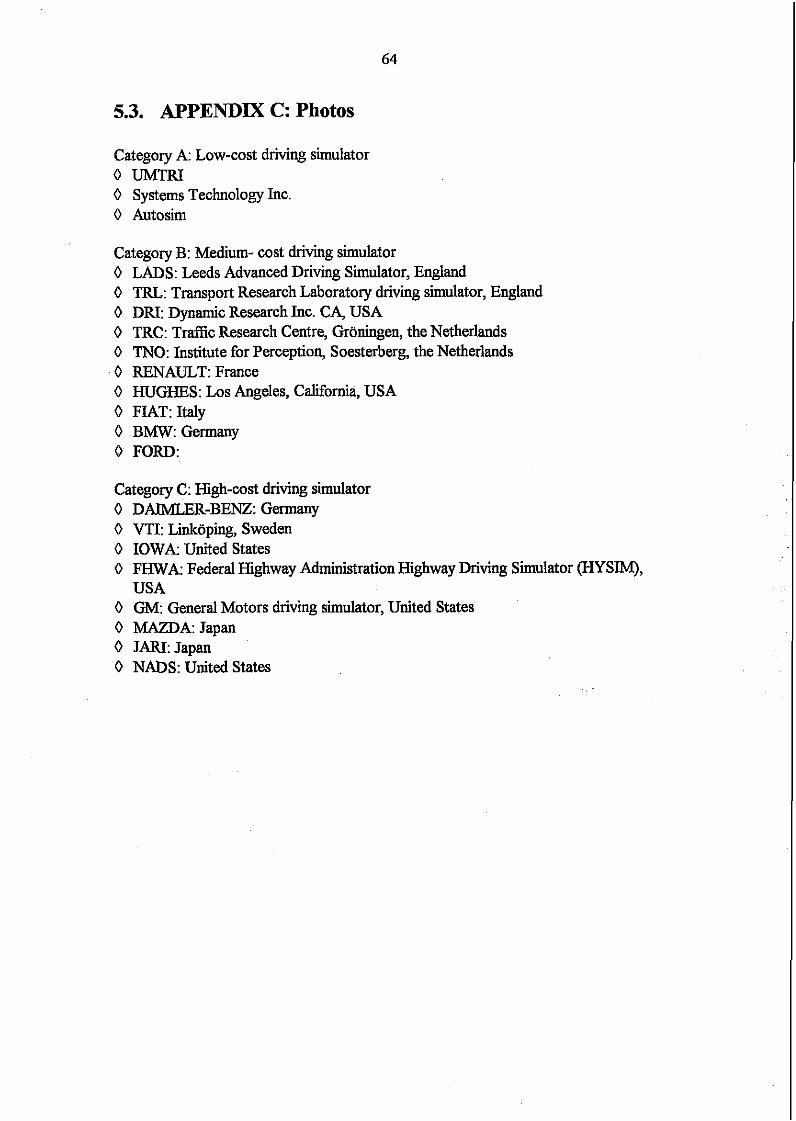
5.3. APPENDIX C: Photos
Category A: Low-cost driving simulator 0 UMTRI 0 Systems Technology Inc. 0 Autosim
Category B: Medium- cost driving simulator 0 LADS: Leeds Advanced Driving Simulator, England 0 TRL: Transport Research Laboratory driving sirnulator, England 0 DRI: Dynamic Research Inc. CA, USA 0 TRC: Traffic Research Centre, Groningen, the Netherlands 0 TNO: Institute for Perception, Soesterberg, the Netherlands 0 RENAULT: France 0 HUGHES: Los Angeles, California, USA 0 FIAT: Italy 0 BMW: Germany 0 FORD:
Category C: High-cost driving simulator 0 DAlMLER-BENZ: Germany 0 VTI: Lioping, Sweden 0 IOWA: United States 0 FHWA: Federal Highway Administration Highway Driving Simulator (HYSIM),
USA 0 GM: General Motors driving simulator, United States 0 MAZDA: Japan 0 JARI. Japan 0 NADS: United States
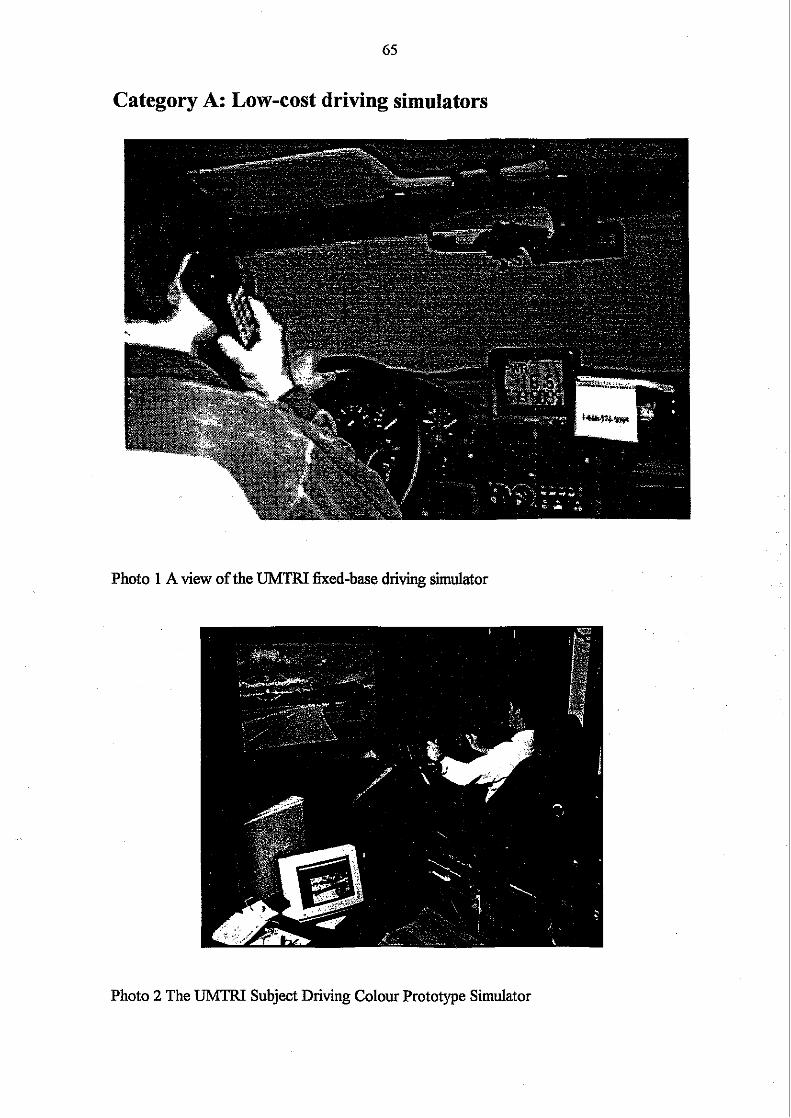
65
Category A: Low-cost driving simulators
Photo 1 A view of the UMTRI fixed-base driving simulator
Photo 2 The UMTRI Subject Driving Colour Prototype Simulator

Photo 3 The PC based Systems Technology Inc. driving sirnulato1
Photo 4 - The desk-top Systems Technology Inc. simulator with in-vehicle navigation
Photo 5 The Autosim driving simulator
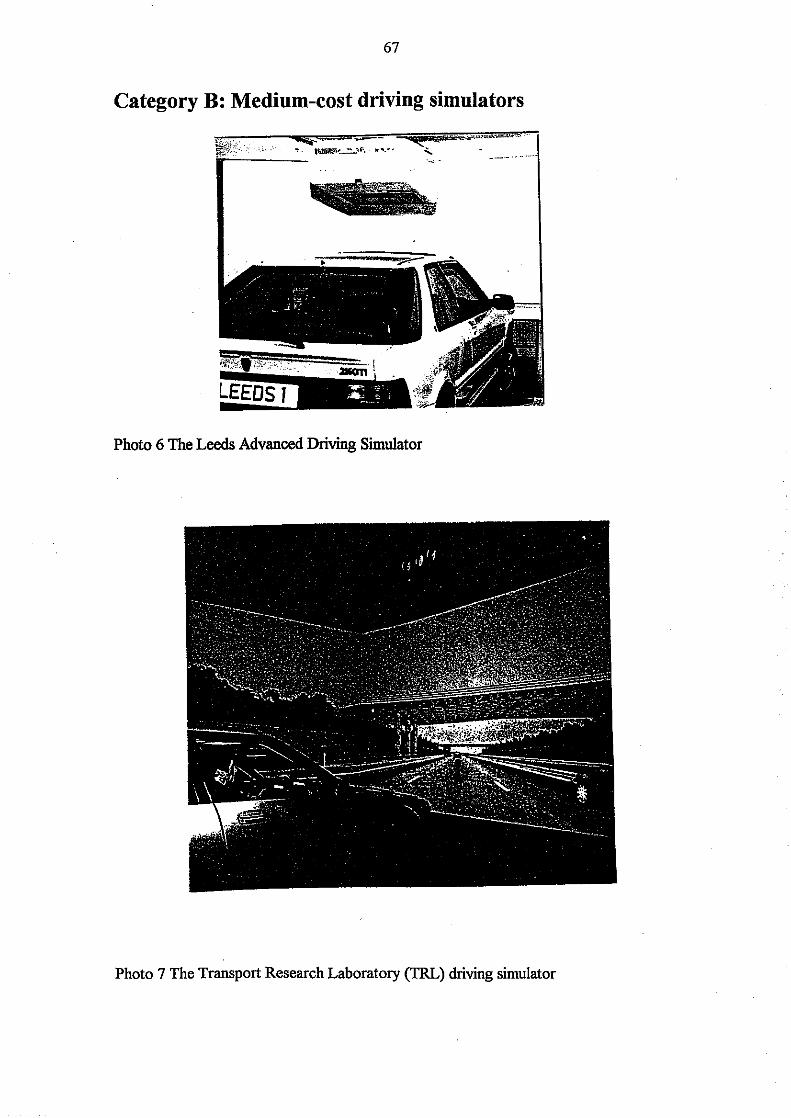
Category B: Medium-cost driving simulators
Photo 6 The Leeds Advanced Driving Simulator
Photo 7 The Transport Research Laboratory (TRL) driving simulator
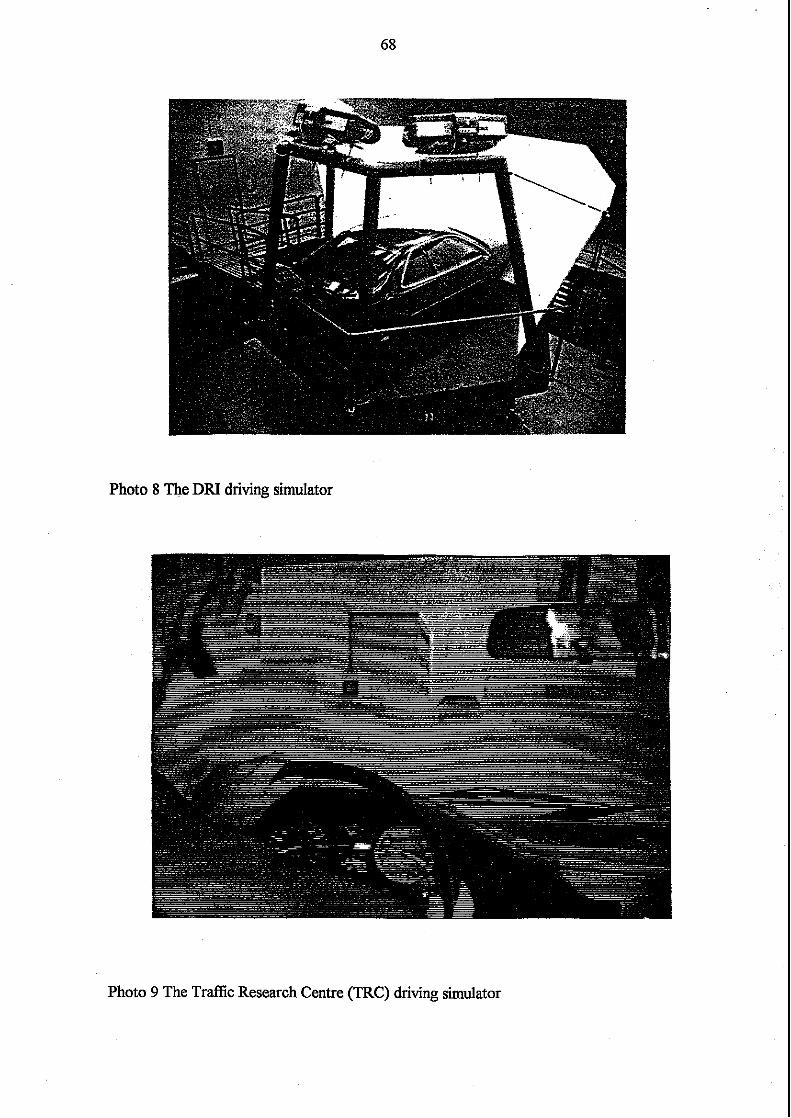
Photo 8 The DRI driving simulator
Photo 9 The Traffic Research Centre (TRC) driving simulator
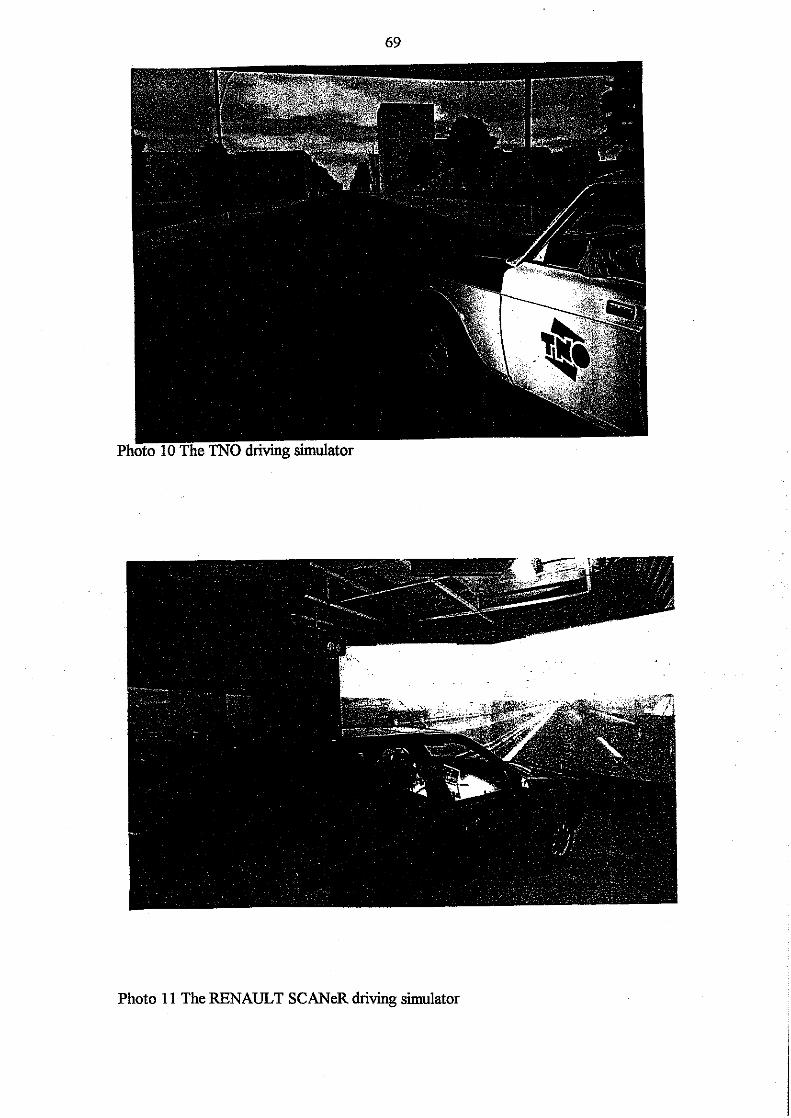
Photo 11 The RENAULT SCANeR driving simulator

Photo 12 The HUGHES driving simulator
Photo 13 The FIAT driving simulator
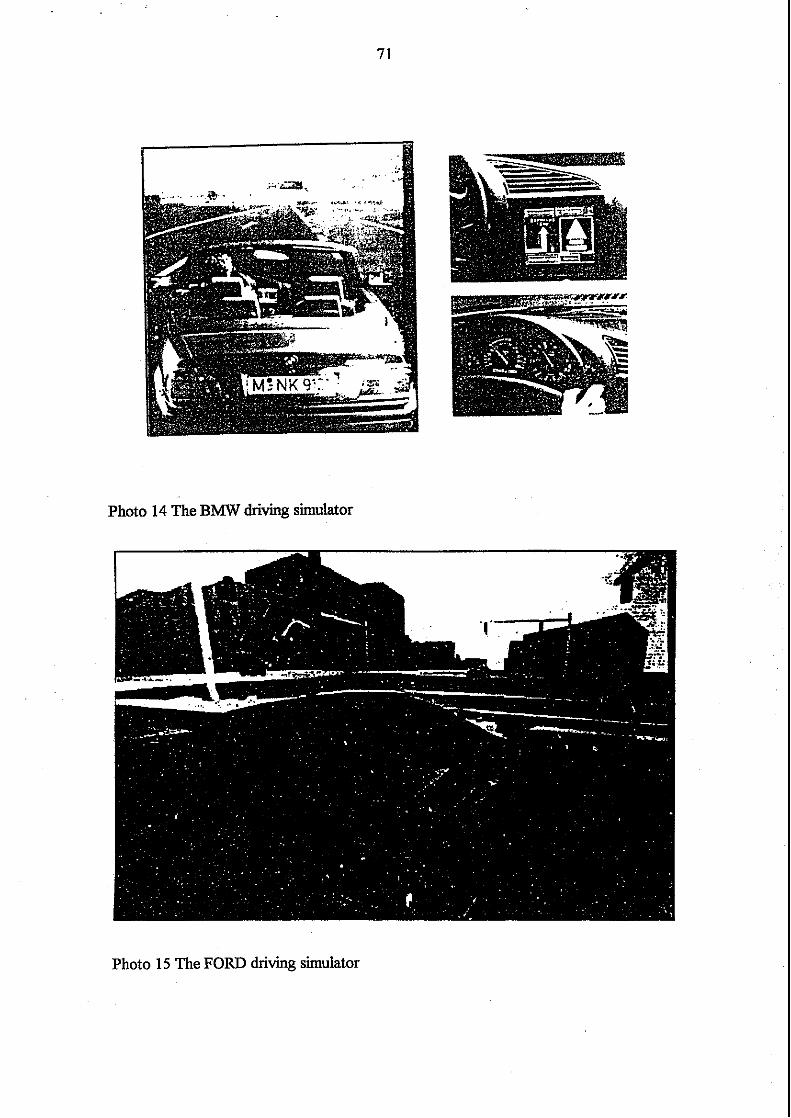
Photo 14 The BMW driving simulator
Photo 15 The FORD driving simulator

72
Category C: High-cost driving simulators
Photo 16 The Daimler-Benz: Germany
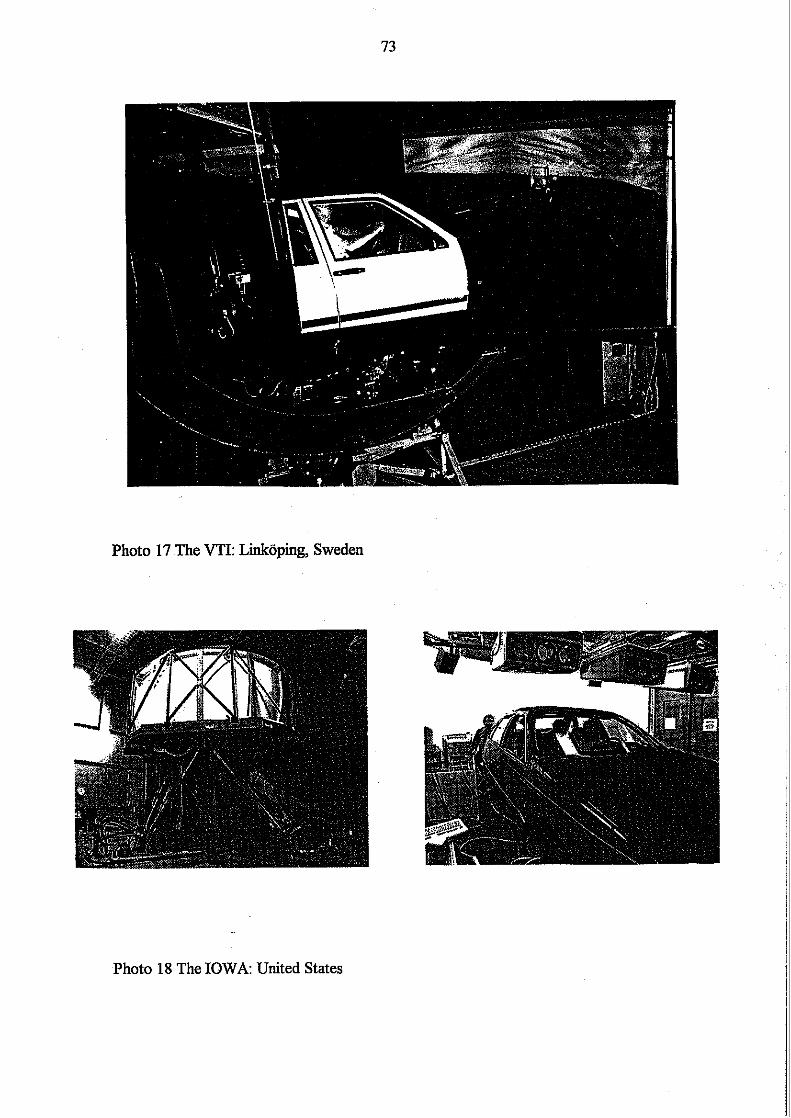
Photo 17 The WI: Linkoping, Sweden
Photo 18 The IOWA: United States
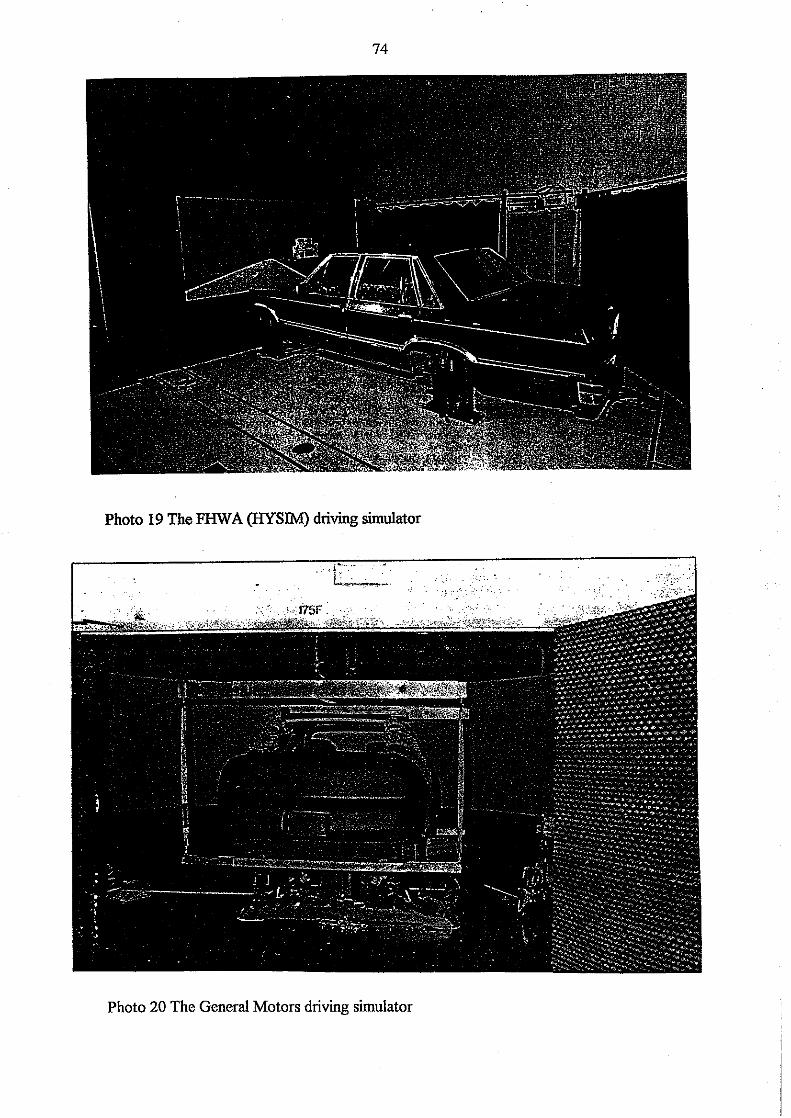
Photo 19 The M A (HYSIM) driving simulator
Photo 20 The General Motors driving simulator

Photo 21 The MAZDA driving simulator
Photo 22 The JAR1 driving simulator

Photo 23 The NADS driving simulator